Article

Recovery of Water Quality and Detection of Algal Blooms in Lake Villarrica through Landsat Satellite Images and Monitoring Data

by
Lien Rodríguez-López
1,*,
Iongel Duran-Llacer
2,
Lisandra Bravo Alvarez
3,
Andrea Lami
4 and
Roberto Urrutia
5
1
Facultad de Ingeniería, Arquitectura y Diseño, Universidad San Sebastián, Lientur 1457, Concepción 4030000, Chile
2
Hémera Centro de Observación de la Tierra, Facultad de Ciencias, Ingeniería y Tecnología, Universidad Mayor, Camino La Pirámide 5750, Santiago 8580745, Chile
3
Department of Electrical Engineering, Universidad de Concepción, Edmundo Larenas 219, Concepción 4030000, Chile
4
Institute of Water Research IRSA, 70132 Sezione di Verbania, Italy
5
Facultad de Ciencias Ambientales, Universidad de Concepción, Concepción 4070386, Chile
*
Author to whom correspondence should be addressed.
Remote Sens. 2023, 15(7), 1929; https://doi.org/10.3390/rs15071929
Submission received: 31 January 2023 / Revised: 30 March 2023 / Accepted: 31 March 2023 / Published: 3 April 2023
(This article belongs to the Special Issue Remote Sensing for Marine Environmental Disaster Response)

Abstract

:
Phytoplankton is considered a strong predictor of the environmental quality of lakes, while Chlorophyll-a is an indicator of primary productivity. In this study, 25 LANDSAT images covering the 2014–2021 period were used to predict Chlorophyll-a in the Villarrica lacustrine system. A Chlorophyll-a recovery algorithm was calculated using two spectral indices (FAI and SABI). The indices that presented the best statistical indicators were the floating algal index (R2 = 0.87) and surface algal bloom index (R2 = 0.59). A multiparametric linear model for Chlorophyll-a estimation was constructed with the indices. Statistical indicators were used to validate the multiple linear regression model used to predict Chlorophyll-a by means of spectral indices, with the following results: a MBE of −0.136 μ, RMSE of 0.055 μ, and NRMSE of 0.019%. All results revealed the strength of the model. It is necessary to raise awareness among the population that carries out activities around the lake in order for them to take policy actions related to water resources in this Chilean lake. Furthermore, it is important to note that this study is the first to address the detection of algal blooms in this Chilean lake through remote sensing.

Graphical Abstract

1. Introduction

Inland freshwater bodies, such as rivers, lakes, wetlands, and streams, are important aquatic ecosystems [1]. The ecosystem services provided by inland water bodies are extensive, but people have not been able to safeguard them [2]. Human factors including nutrient loading, pollution from industry and agriculture, climate change, sewage discharge, invasive species incursion, and urbanization have triggered the rapid degradation of freshwater systems [3] and water quality [4,5]. Lakes are essential for meeting the necessities of life, including socio-cultural development, scientific advances, environmental balance, industrialization, agricultural activities, economic growth, protection of biological diversity, and finally, the well-being and health of organisms [4,6].
Traditional methods of monitoring water quality parameters, such as chemical, physical, and biological characteristics, consist of measurement by collecting samples in the field and then analyzing them using conventional techniques [7,8]. Even though in situ monitoring is very efficient, it is a time-consuming, costly, and technically deficient process that lacks the necessary human resources and provides trophic status on the day of sampling rather than in real-time [9,10]. In addition, traditional field sampling approaches do not easily detect temporal or spatial fluctuations in water quality, and doing so is essential for a proper evaluation and thorough management of water bodies [10,11,12,13].
Eutrophication is a major concern for the lakes around the world [14,15]. It is the biological reaction of lakes to nutrient oversaturation, developing algal productivity at large volumes [16]. The main problem is the increase in nitrogen and phosphorus load, which causes a high biomass of algae, an abundance of microalgae, and the loss of macroalgae [2,17]. Cyanobacteria require temperatures above 20 °C for growth rates to be competitive with eukaryotic phytoplankton taxa and above 25 °C for growth rates to be competitive with diatoms. In addition, they require relatively high irradiances to grow at maximal growth rates [18].
Thus, recently developed remote sensing technologies are increasingly used in the monitoring of various water quality parameters. One problem with detecting the concentration of Chlorophyll-a (Chl-a) in lakes from multispectral satellite data is the influence of atmospheric factors such as aerosols and clouds, which can affect the accuracy of the measurements [19]; another issue is the presence of other substances in the water that can interfere with the signal from Chlorophyll-a, making it difficult to accurately detect and quantify its concentration [20]. There are several approaches that researchers use to address the challenges of detecting Chlorophyll-a concentration from multispectral satellite data. Overall, the solution for detecting Chlorophyll-a concentration from multispectral satellite data depends on the specific challenges faced and the available data and resources, such as with collecting in situ measurements of Chlorophyll-a concentration to validate the accuracy of the satellite data and improve the calibration of the remote sensing algorithms. Remote sensing techniques have recently emerged as successful approaches to monitor algal blooms, allowing for the specific monitoring of phenomena affecting water quality [21]. Different spectral indices have been used to monitor blooms in inland water bodies and are usually based on spectral differences between aquatic vegetation and the bottom in the spectrum of visible radiation and infrared radiation, including near-infrared radiation [22]. Several spectral indices are available, including the normalized difference vegetation index [12], normalized difference turbidity index and green normalized difference vegetation index [23], emergent vegetation spectral index [22], floating algal index [24], and surface algal bloom index [25,26], which have been developed and successfully used in research and the mapping of aquatic plants and monitoring of vegetation or algae growth [12,25]. In this study, we will include most of these indices.
Furthermore, most of the remote sensing research on phenomena such as algal blooms have been conducted in the northern hemisphere, with less work conducted in the southern hemisphere. Investigations of unspecified Chlorophyll-a estimates of algal groups have been conducted with MODIS imagery to analyze the time series in the Great Lakes [27], and Landsat and Sentinel hyperspectral imagery was used in [28,29] to study the spatial variability of harmful algal blooms (cyanobacteria) in the western basin of Lake Erie, while other works such as [30,31] through band combinations detected cyanobacterial blooms in the Baltic Sea.
Lake Villarrica in Chile has attracted considerable attention due to its severe pollution issues from increased nutrients in the lake and algal blooms that have been recorded since 2016 [32]. Lake Villarrica is classified as an oligotrophic lake with a transition to a higher trophic state (mesotrophic). Therefore, the Ministry of Environment of Chile, in compliance with the obligations imposed by the Law on General Bases of the Environment, established a secondary environmental standards quality (hereinafter NSCA) for Lake Villarrica [33] to monitor changes in water quality parameters and the phenomenon of algal blooms. The predominant group of the mentioned blooms is Cyanophyceae, and the most repeated species is Dolichospermum. It should be noted that this microalga is toxic and has formed blooms in other Chilean aquatic systems such as the one reported in Lake Laja in the summer of 2018 [12]. In Lake Villarrica, these events have been taking place for more than a decade. The activities that take place in the basin determine the acceleration of natural processes such as the succession of trophic stages or eutrophication and are perhaps a consequence of urban expansion due to tourism [34,35,36]. The present research aims to: (i) analyze local conditions and water quality through the physical–chemical and biological parameters prevailing in Lake Villarrica during the 2014–2021 period, (ii) use spectral indices to estimate the concentration of Chlorophyll-a and detect algal blooms; and (iii) evaluate the prediction using statistical indicators and estimation maps.

2. Materials and Methods

2.1. Research Area

Villarrica or Mallolafquén (its name in Mapudungun, the native language of Chile’s local native communities) is an Andean Lake located approximately at 39°18′ latitude and 72°05′W longitude in the lake district of the Araucanía Region, in Cautín Province [37]. The origin of the lake, like most of the southern lakes, can be traced to a glacial context, with it resulting from damming by a moraine in the last glaciation [38]. The coastal cities of Villarrica and Pucón are considered the main tourist hubs of the country due to the temperature of the water in the summer, from 19 °C to 22 °C, allowing for multiple sports and tourist activities (sport fishing, sailing, kayaking, water skiing, and swimming) [34,35]. The thermal amplitude increases towards the interior and there is rainfall during all seasons of the year, with an average annual rainfall of 1465 mm. Winter frosts are frequent and these cities host tourist attractions associated with snow-related activities due to their proximity to the volcano, which is a major attraction [34,35].

2.2. Field Data Collection

The study period covers the years 2014–2021. The data were collected from the database of the General Water Directorate (DGA) of Chile, as a system is in place for Lake Villarrica in which monitoring has been carried out twice a year in summer and spring from 1986 to the present [39]. Through the redefinition of the minimum network of lakes, Lake Villarrica has been one of the most studied lakes due to its great economic and touristic importance for the country and was one of the first to be included in it. The monitoring includes physical–chemical and biological parameters in 7 spatially distributed stations covering the surveillance zones defined according to the morphometric characteristics of Lake Villarrica (see Table 1). The monitored parameters were surface temperature (thermometry 2250 B standard methods 22 Ed, method used as a reference for temperature analysis according to the NCh 2313 compendium), surface Chlorophyll-a (fluorometric method), determination of total phosphorus (4500 P B Standard Methods 22 Edit. EAM), determination of total nitrogen (4500-N C Standard Methods 22 Edit-EAM), and transparency (measured using SDD). At each of the lake stations, water samples were collected at 5 depths using a 5 L Niskin sampling bottle. Samples were stored and transported in thermally insulated boxes and properly cooled with ice at a temperature of approximately 5 °C for subsequent analysis. Chemical analyses were performed at the chemistry laboratory of the General Water Directorate of Chile (DGA). This laboratory is accredited by the Instituto Nacional de Normalización (National Standards Institute) for the Chilean Standard NCh ISO 17.025 of 2005.

2.3. Raw Satellite Images

A total of 25 multispectral Landsat 8 Collection 2 Level 1 Operational Land Imager images (L8/OLI) were used (see Table 2). Landsat 8 was developed in collaboration with NASA and the United States Geological Survey (USGS) Earth-Explorer (https://earthexplorer.usgs.gov/, accessed on 15 November 2022). This site was used to download the images used in this study, which have a 30-m spatial representation and were accessed on 8 September 2022. The study area of interest (Roi) was covered by paths 232/233 and row 87 of the images. The chosen images were selected according to the following criteria: availability, a low percentage of cloud cover (less than 12%), and closeness to the sampling date (with an interval of ±9 days between satellite overpasses). To mask clouds, shadows, and cirrus clouds, quality assessment (QA) bands were used and analyzed via visual inspection. Only the data extracted from the areas without cloudiness were used.
Subsequently, atmospheric corrections were performed with ACOLITE program (version 20211124.0) (https://github.com/acolite, accessed on 20 September 2022). ACOLITE brings together the atmospheric correction protocols and processing software developed at RBINS for aquatic remote sensing applications [40]. The default atmospheric correction using the “Dark Spectrum Fitting” DSF algorithm approach [41,42,43] and the older “Exponential extrapolation” or EXP algorithm [44,45,46] were utilized in the ACOLITE [36]. The resulting values represent the surface level reflectance (ρs) for L8 and with the values of the extracted bands at 3 × 3-pixel matrix, the spectral indices were calculated, in accordance with [10,47]. The lake contour was established using geospatial information obtained from the General Water Directorate of Chile (DGA, for its acronym in Spanish), and only the body of water was considered for the analysis [48].

2.4. Spectral Indices

Spectral indices are commonly used in remote sensing to quantify specific properties of vegetation, water, and other land cover types. In the context of the Chlorophyll-a algorithm, in some cases spectral indices are used as an intermediate stage to estimate the concentration of Chlorophyll-a in water bodies [49,50]. Some works have developed indices for the detection of algal blooms and due to the excellent results, they are being widely used by the scientific community [10,24,25,51]. The main motives for using spectral indices in the Chlorophyll-a algorithm can be calibrated and validated using field measurements, which can improve the accuracy of Chlorophyll-a concentration estimates. So, a total of nine spectral indices that have previously been used to detect the presence of aquatic vegetation through remote sensing were included in this study. Table 3 shows the algorithms of each index and the corresponding references.
The FAI was designed to map floating algae in different aquatic environments and, according to the consulted bibliography, it is a very efficient index for the detection of surface vegetation, and it is more suitable than other indices since it is more sensitive to changes in environmental conditions [24,52]. It is defined as a linear spread of reflectivity in the near infrared (NIR, 0.85–0.88 µm), red (R, 0.64–0.67 µm), and shortwave infrared regions (SWR, 1.57–1.65 µm) [24,52]. The GNDVI is an index resistant to atmospheric effects and is very sensitive to Chlorophyll-a concentrations, so its use can be very beneficial in the detection of Chlorophyll-a in oligotrophic systems, hence the justification for its use in different investigations worldwide [12,23,53]. It is calculated according to the equation shown in Table 3, where G is the reflectivity in the green band (G, 0.53–0.59 µm) [12,23,53]. The NDTI is an index developed to estimate turbidity via remote sensing and is an indicator of water quality and can be related to Chlorophyll-a in inland waters, so it could infer the identification of algae [23]. Based on this, some investigations have included it in monitoring studies of algae blooms [58] and aquatic mucilage [59]. On the other hand, the NDVI is widely used for the detection of both terrestrial and aquatic vegetation. The values vary between −1 and 1, where values below 0 reflect the absence or sparse vegetation [12,60]. The EVI is an index like the NDVI, but more sensitive in areas with dense vegetation; however, it has been used in different investigations to detect Chlorophyll-a in lakes [12]. The EVI has an L value (L = 1) to adjust the canopy background, C values (C1 = 6, C2 = 7.5) as atmospheric resistance coefficients, a gain factor G (G = 2.5), and spectral reflectance values of the R, INR, and blue (B, 0.45–0.51 µm) bands [51]. Both the SABI and the EVSI were proposed to delineate the spatial distributions of floating algae or emergent vegetation extraction in aquatic systems. These have been able to detect cyanobacteria and other algae [26]. The GCI is used to estimate the Chlorophyll-a content of the leaves since using the NIR and G wavelengths provides a better measurement of the Chlorophyll-a content [56,57]. Due to these characteristics, it is possible that it reflects the Chlorophyll-a content in the lakes, which is why it was selected in this investigation and also in [12]. Finally, the MNDVI is an index that is calculated with the ranges of wavelengths of G and SWIR, and these lengths have been used in algorithms to detect or monitor Chlorophyll-a and algae [22,23,24,53], so it could detect changes in the quantity of water and present good correlations with Chlorophyll-a values in the lakes.

2.5. Statistical Analysis

Algorithms for Chlorophyll-a Estimation and Mapping

The statistical indicators used for the analysis of the results are described in this section. Nine spectral indices incorporating the most relevant bandwidths of the variable under study were selected (Table 3). Pearson correlations (r) were then performed as measures of linear dependence between the calculated indices and the dependent variable Chlorophyll-a. To estimate the Chl-a variable, empirical expressions were developed and data from the different selected images covering summer and spring in the 2014–2021 period were used. Then, a multiparametric regression analysis of the best-correlated indices was developed to obtain a predictive quantitative relationship of Chl-a. Based on the methodology developed by [61], data were selected for internal validation/training and external validation/prediction. The resulting data matrix was composed of the response variable Chl-a and the prediction indices defined based on each of the 25 Landsat images. The methodology consisted of randomly selecting 70% of the data as the training series for the calibration process and the remaining 30% as the data set for prediction. The statistical analysis was performed using Origin Pro 2022b, version 9.7.0.788 (Academic). The statistical indicators used in the analysis are shown in Table 4. Smaller MBE, RMSE, and NRSME values suggest better model performance. A positive MBE value denotes the average quantity of underestimation in the estimated value and vice versa. The RMSE is usually employed to compare the prediction errors of different models. The NRMSE can be understood as a fraction of the mean error with respect to the mean. In addition, the RMSE measures the dispersion between the simulated and measured data. Finally, the mapping of Chl-a concentrations was performed in ArcGIS 10.8.1.

3. Results

3.1. Water Quality Parameters

Figure 1 shows the limnological parameters analyzed in this study as those that could provide optimal conditions for the generation of an algal bloom in the lake.
The characteristics of the limnological parameters shown in Figure 1 are evidence of the trophic state of Lake Villarrica. It is classified as an oligotrophic lake in transition to a higher trophic state (mesotrophic). The average transparency behavior fluctuates between 6.46 m in spring and 9.69 m in summer, while the nutrients’ total nitrogen and total phosphorus are inversely proportional to Chl-a values, as can be observed in Figure 1. As for temperature, it is known that this physical parameter regulates many processes in aquatic systems and algal productivity [64,65]. Temperature values range from 22 °C in summer to 11 °C in spring. The blooms in the lake manifest themselves when the temperature exceeds 18 °C.

3.2. Estimation Model/Statistics

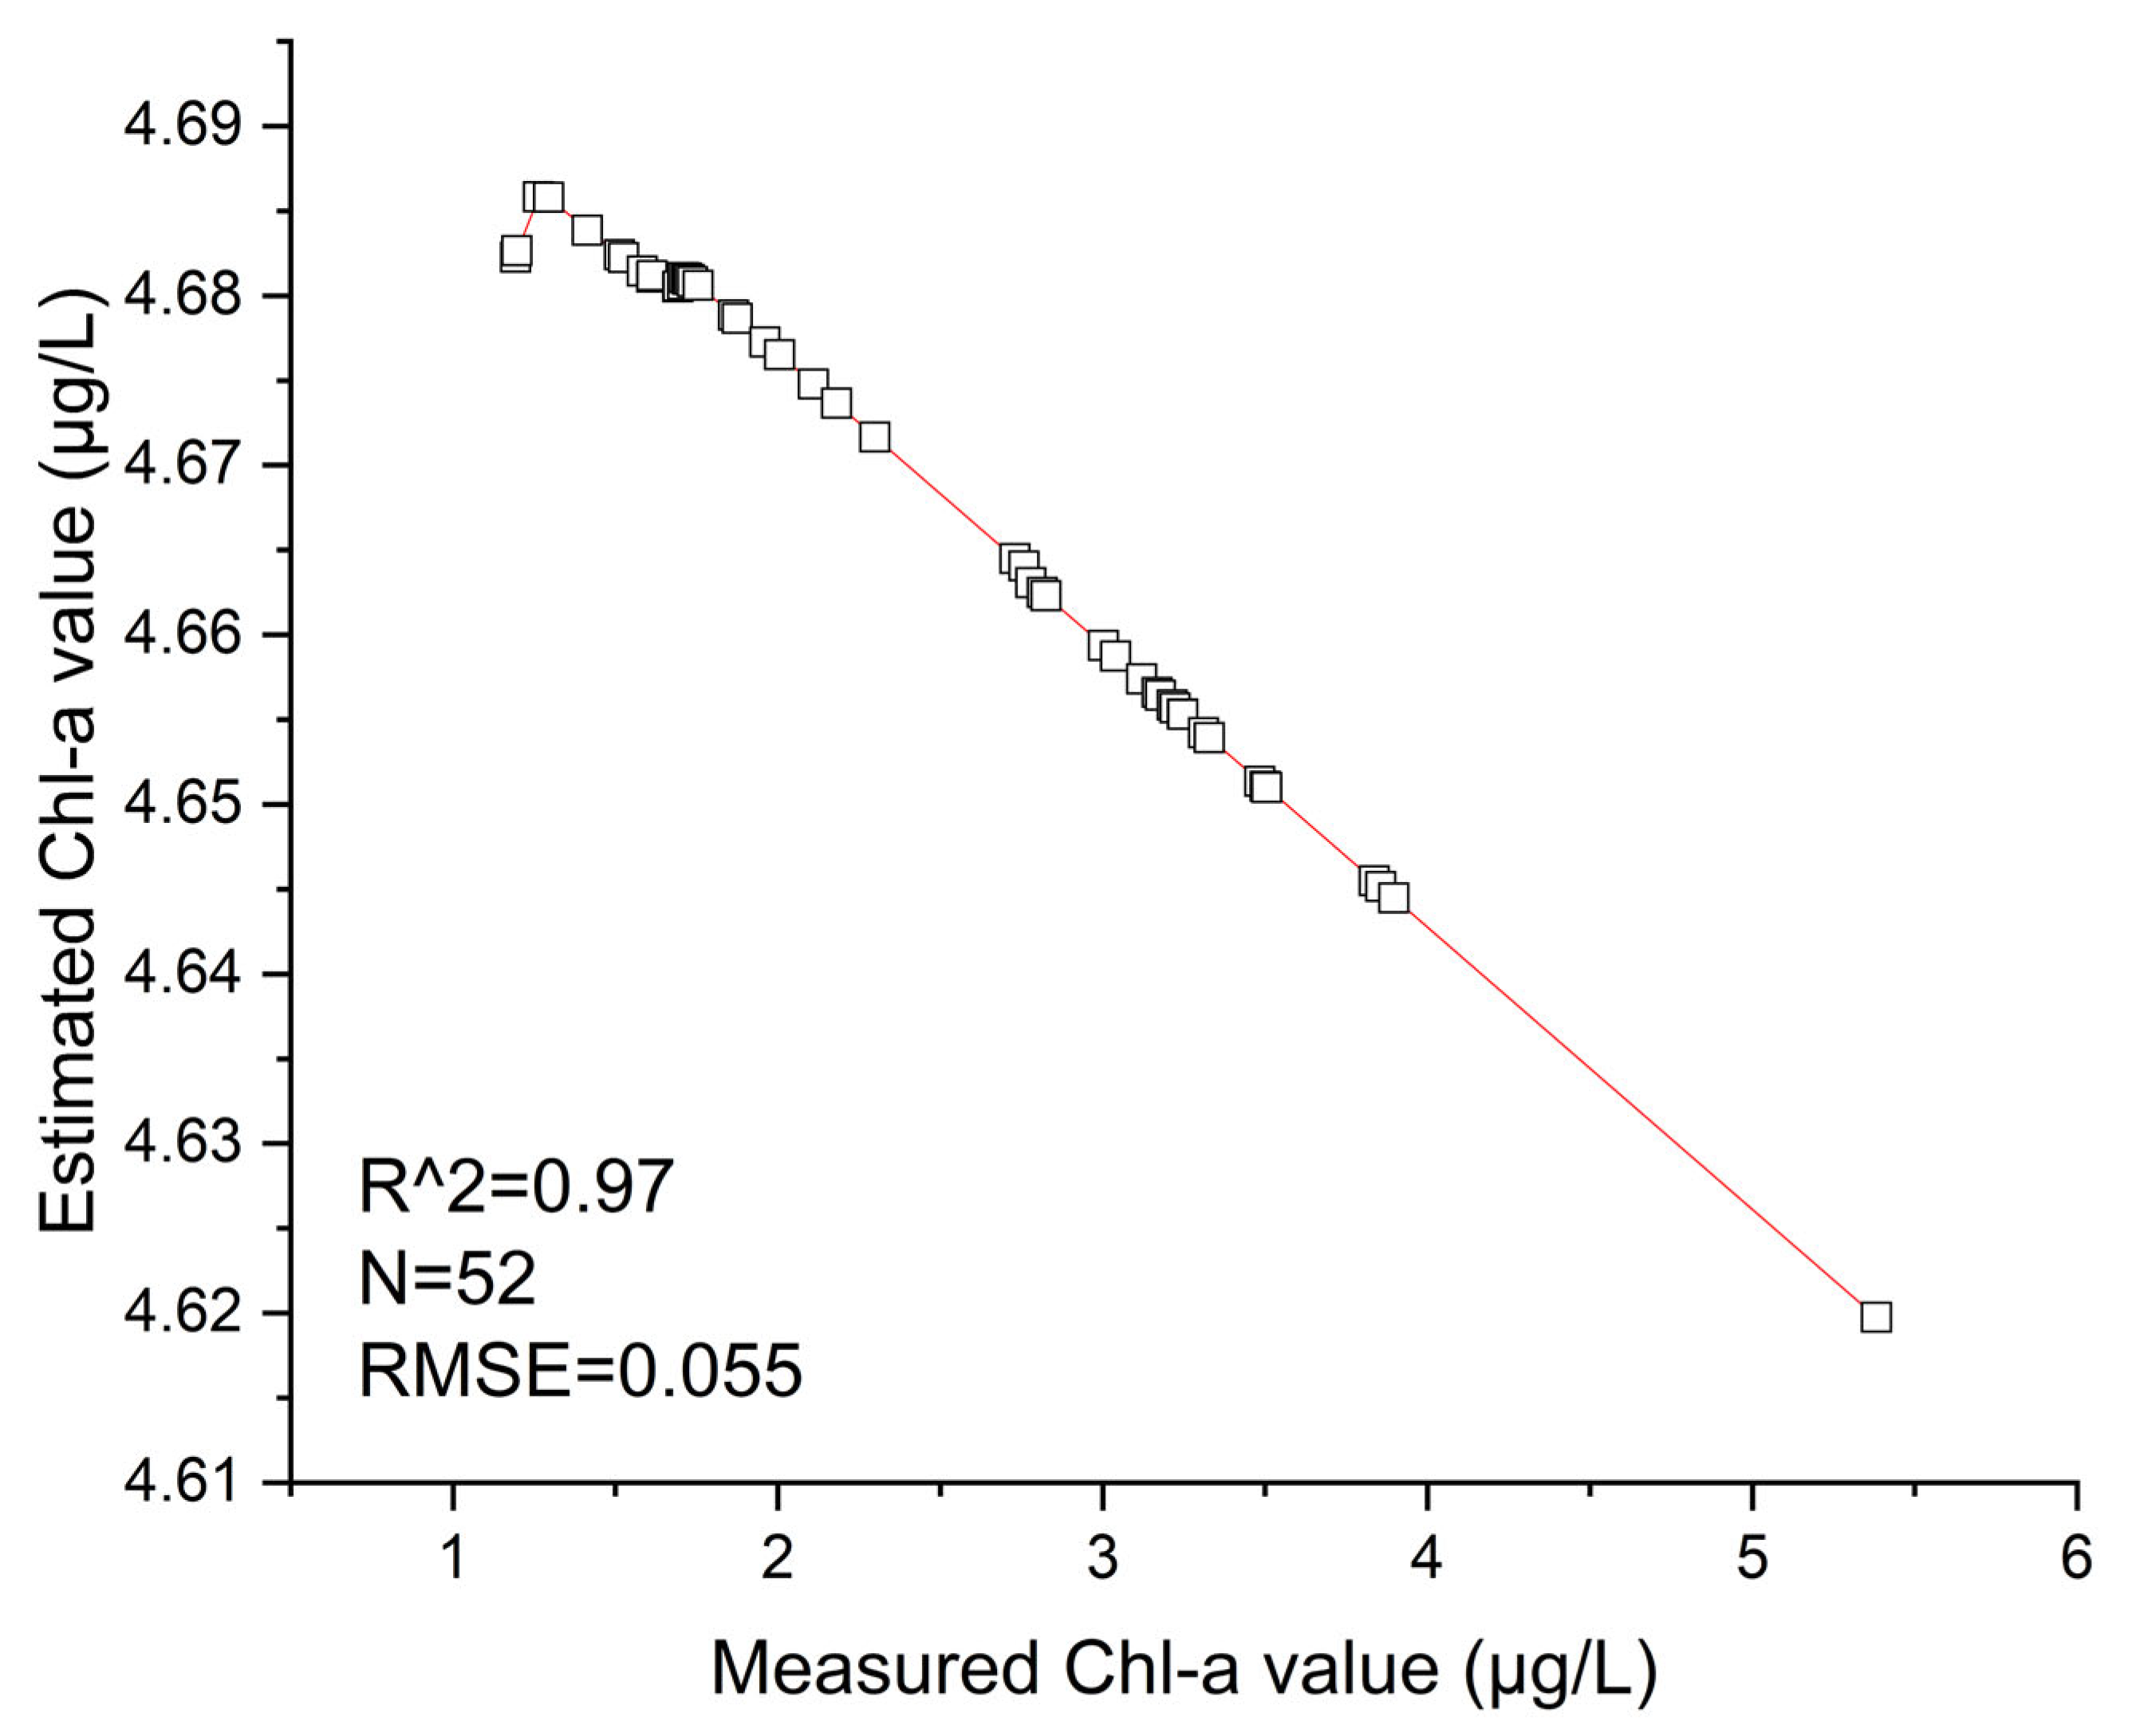
Pearson’s correlation coefficient (r) was used to analyze the correlation between the Chlorophyll-a variable and the nine selected spectral indices. The different values obtained for the selected indices are shown in Table 5, and it can be observed that, of the nine indices calculated, three resulted in a high r (FAI, SABI, and GCI). This shows that the selected algorithms have a high degree of correlation. Meanwhile, indices such as EVSI and NDTI presented low values of Pearson’s correlation coefficient; therefore, these spectral indices do not have a sufficient degree of correlation to estimate Chl-a in the lake. Several multiple linear regressions were performed combining the indices that presented the best correlation. The Chlorophyll-a recovery model between the FAI and SABI indices obtained statistical values of a MBE of −0.136 μ, RMSE of 0.055 μ, and NRMSE of 0.019%. On the other hand, the statistical results obtained from the combinations between the GCI with SABI and GCI with FAI indexes obtained MBE values of −0.56 μ and −0.50 μ, RMSE values of 0.057 μ and 0.055 μ, and NRMSE values of 0.030% and 0.023%, respectively. Therefore, the statistical results obtained demonstrate that the combination between FAI and SABI indices generates a multiparametric linear regression model that estimates Chl-a concentration in this lake more accurately. The resulting multiparametric regression model was obtained using the linear equation Chl-a = −6.26 × SABI − 10.34 × FAI + 4.72 (adjusted R2 = 0.97). As can be seen, the adjusted coefficient of determination of the Chl-a estimation model was high. The model was validated by comparing samples of N = 52 with measured and estimated Chl-a concentrations (μ). For validation of the proposed Chl-a estimation model, 30% of the total data was used. Figure 2 shows the graphical comparison between the estimated and measured values, which present a high fit, represented by the red line. The results of the model show its robustness, but the amount of data used during the model validation stage remains a limitation due to the lack of real data.

3.3. Bloom Estimation Maps

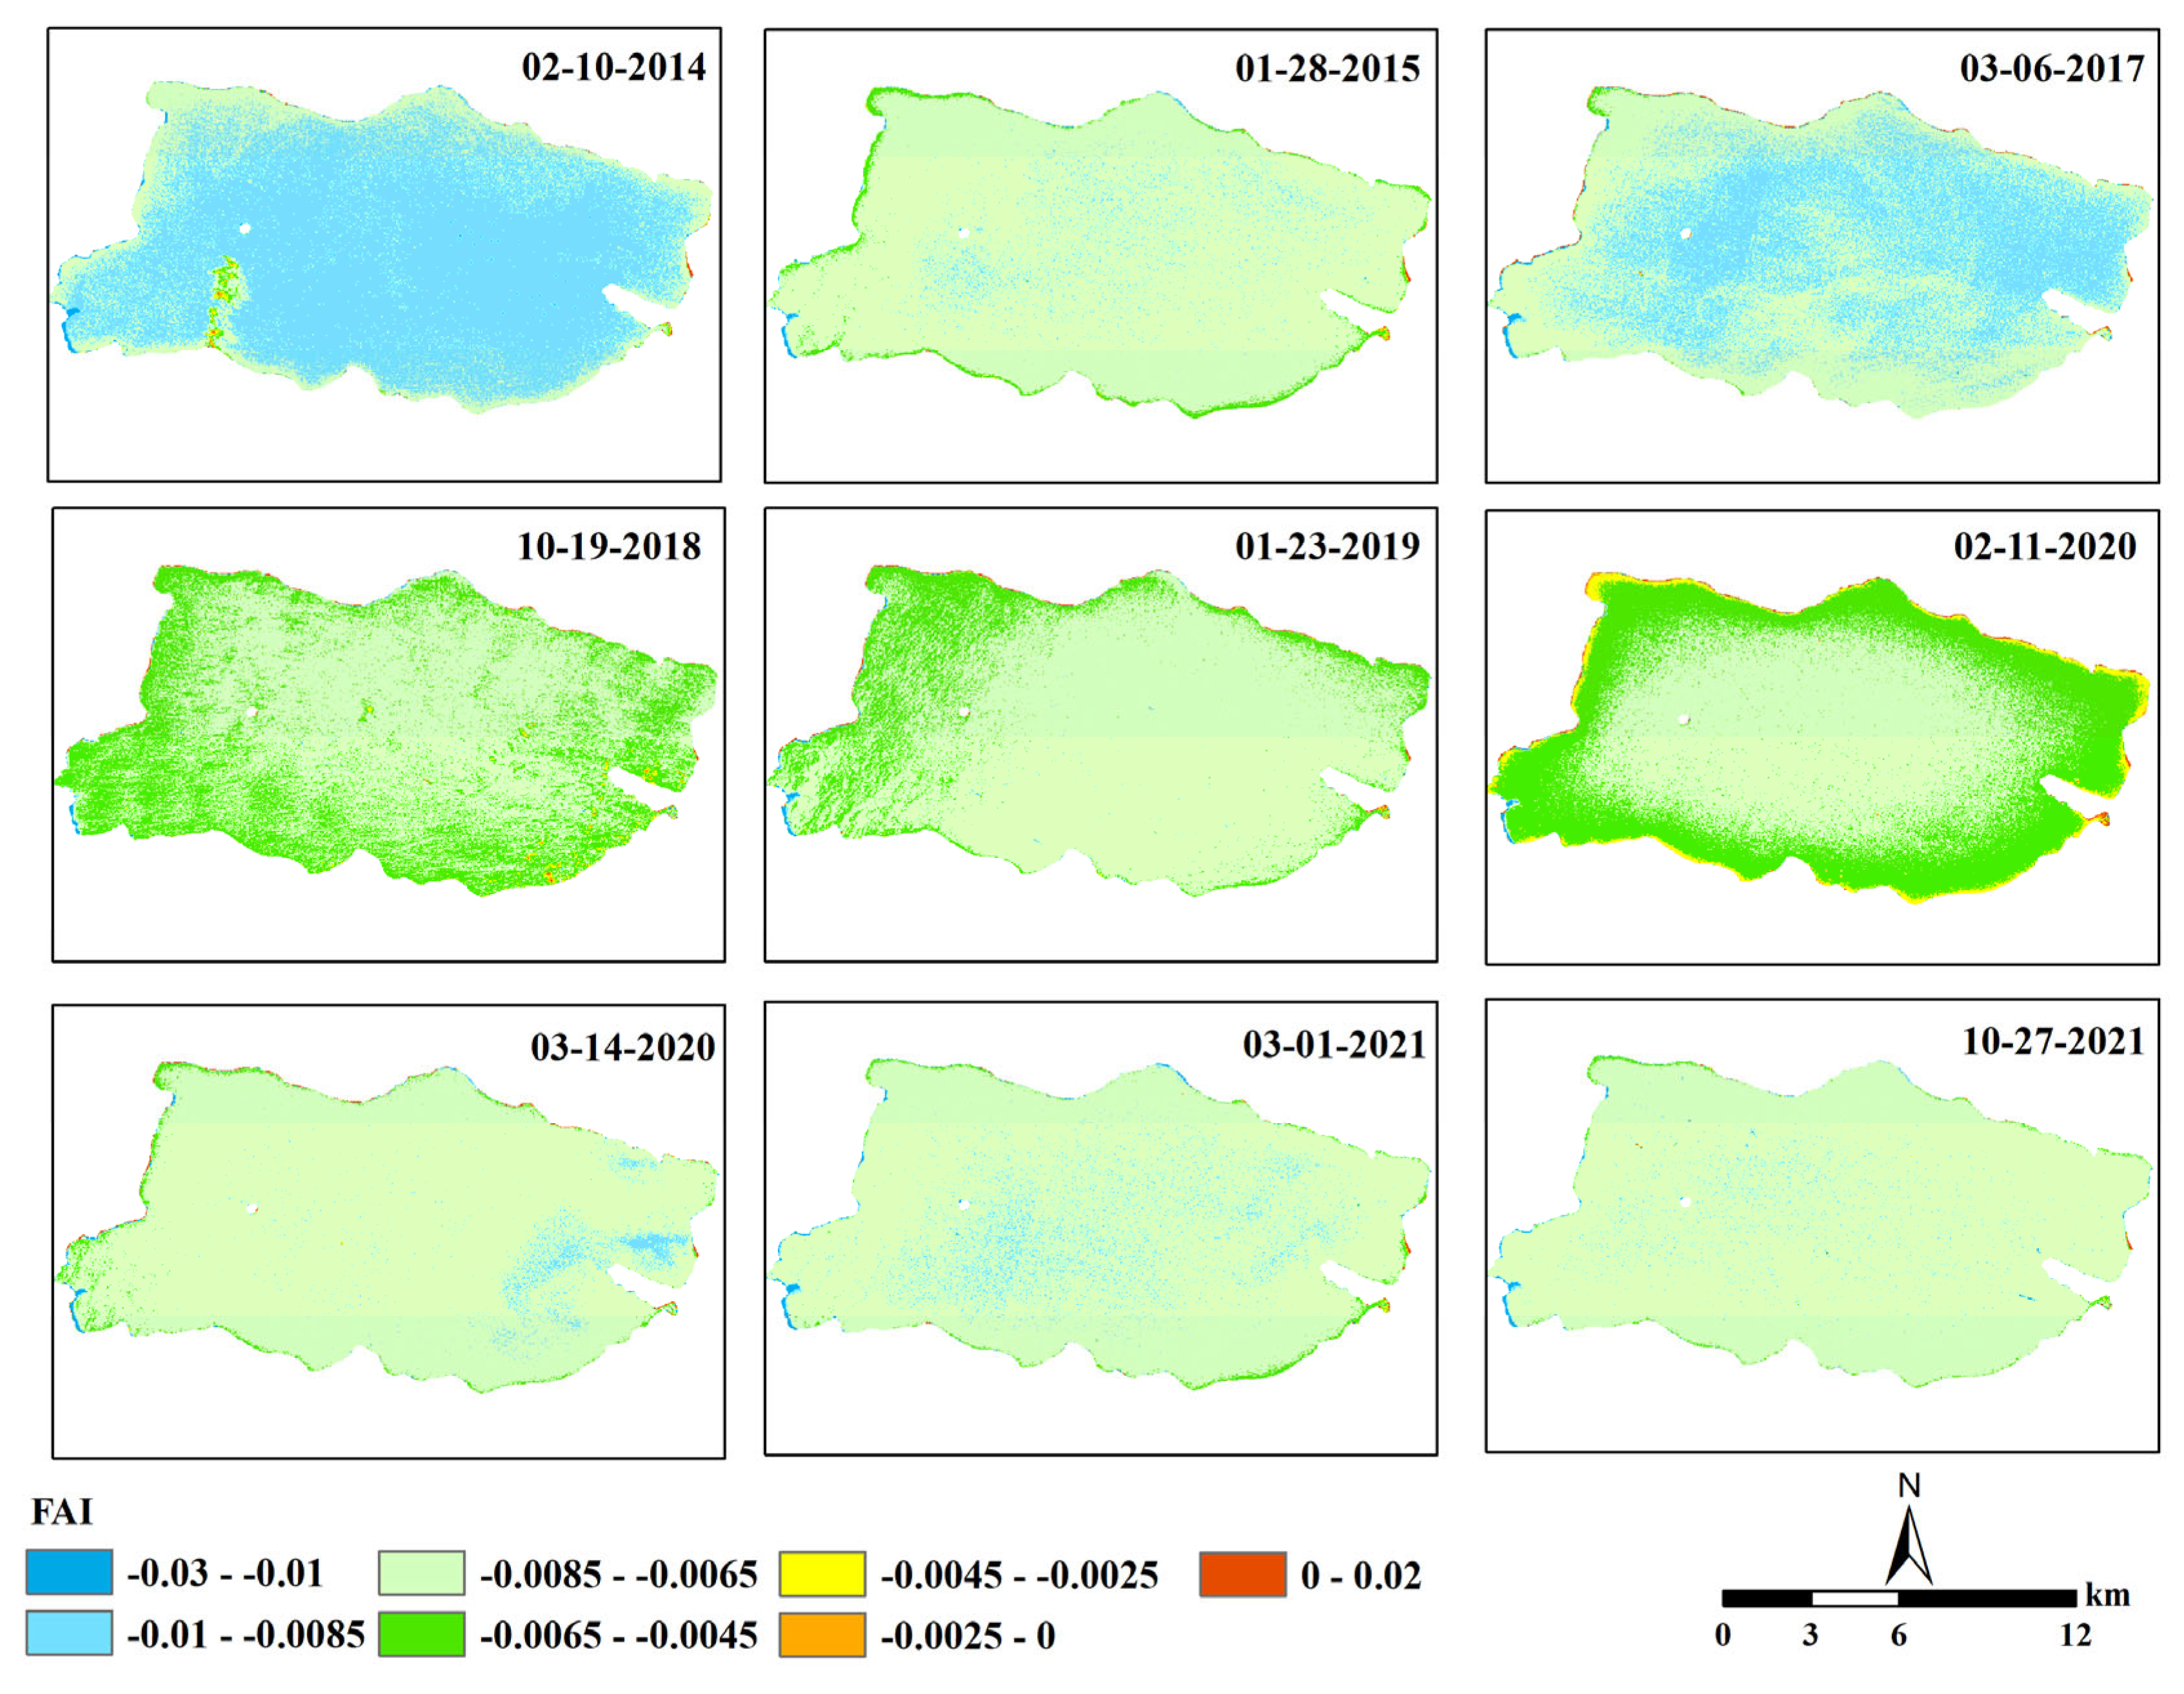
This section presents the spatial distribution maps based on the spectral indices and estimation model with the best results for Lake Villarrica. Figure 3 and Figure 4 represent the indices, and Figure 5 shows the map resulting from the combination of the FAI and SABI indices reflecting the estimated Chlorophyll-a for Lake Villarrica.
Figure 3 shows that the FAI has an excellent representation in the Landsat images, where the areas with the greatest predominance of vegetation can be observed spatially. Therefore, the FAI index can be applied to select surveillance sites with higher production values. The maps derived from the calculation of the FAI show a marked difference in the groups of primary producers in Lake Villarrica, which was confirmed by the results of the statistical correlation analysis. The satellite image of 11 February 2020 showed high values for the FAI index on the shores, suggesting the existence of some types of aquatic vegetation (positives values) or possible algae blooms. In addition, some positive values on the shore near population centers can suggest the existence of algal blooms. However, some negative values close to 0 (−0.0025) may indicate the presence or early initiation of an algal bloom.
Figure 4 shows spatial differences like those observed with the FAI, with high values near the shores being coincident with the image from 11 February 2020. However, in images such as that of 19 October 2018, the FAI more clearly reflects the vegetation at the surface level in Lake Villarrica than the SABI. This is why in the literature it is suggested that several indices be used to generate Chlorophyll-a estimation models for the lake [10,12,24,26,66].
The spatial behavior of Chlorophyll-a predicted using the optimal model for Lake Villarrica in the study seasons is shown in Figure 5. The Chl-a values range between 4.4 and 5.3 μg/L throughout the lake, with very low spatial variation observed, coinciding with the in situ values. This reaffirms that the lake has mesotrophic characteristics. However, as blooms are being reported in different parts of the lake, more frequent monitoring and studies should be carried out. Generally, the highest values are recorded in areas close to the shores, and most frequently for the shore of the city of Villarrica and Pucón.

3.4. Evolution of Algal Blooms in Lake Villarrica

Table 6 shows the blooms reported in Lake Villarrica in the last 28 years, as well as the species reported and the sector of the lake where the bloom developed.
It can be seen from the information provided above that algal blooms in Lake Villarrica are occurring every summer in different parts of the lake (see Supplementary Materials). Finally, in situ measurements and algal reports were used to identify generic algal blooms occurring in summer and spring each year. This allowed us to investigate the spectral features of these blooms with respect to those of cyanobacteria and to verify the robustness of the conclusions reached in this work.

4. Discussion

Twenty-five Landsat multispectral images were selected to cover an 8-year time span (2014–2021) for which nine spectral indices were calculated. The FAI and SABI indices showed the best statistical results. In addition, in situ Chl-a sample data were available, covering the lake spatially across seven monitoring stations. Data for summer and spring were taken from the databases of the DGA. Chl-a ranged between minimum values of 0.21 μ and 0.24 μ in summer and spring and maximum values of 5.05 and 4.85 μ, respectively. Therefore, both seasons present high values of the study variable. Based on this data, we correlated the spectral indexes and Chl-a in the various sample areas. Using the resulting data, a linear Chl-a prediction model based on remote sensing data was constructed to estimate the Chl-a concentration in the lake by means of the spectral indices.
Based on remote sensing processing, the average maximum FAI value was found to be 0.067, and the average maximum SABI value was 0.048. According to Pearson’s r, the FAI (−0.78) and SABI (−0.94) indices correlate well with Chlorophyll-a, presenting an inverse correlation (negative sign). Although in Boucher et.al [21] the relationship between the SABI algorithm and Chlorophyll-a was low, in this investigation it turned out to be quite high. The model constructed with the two indices estimated Chlorophyll-a concentration with high precision. The statistical indicators used to verify the linear multiparametric model of Chlorophyll-a estimation through the spectral indices were a MBE of −0.136 μ, RMSE of 0.055 μ, and NRMSE of 0.019%. Maps of vegetation indices (FAI, SABI) for Lake Villarrica were built, with the spatial distribution obtained from the processing of Landsat images using a range of established colors being shown, with negative values indicating the presence of water and values between 0 and 0.4 the presence of vegetation at the surface level. The FAI and SABI are spectral indices derived from satellite imagery and are used to quantify the amount and quality of light that is absorbed and reflected by water bodies. When you use these two indices in a regression equation to estimate Chl-a, the resulting equation provides a way to predict Chl-a concentrations based on the values of the FAI and SABI. This can be useful for monitoring and managing water quality in large bodies of water, where direct sampling may not be feasible or cost-effective. Chlorophyll-a is a pigment found in photosynthetic organisms such as plants, algae, and some bacteria. It is responsible for absorbing light energy during the process of photosynthesis. The FAI and SABI are two vegetation indices used to estimate the amount of photosynthetically active radiation absorbed by algae and algal leaf area, respectively. An inverse relationship, or negative correlation, between Chlorophyll-a and the FAI and SABI spectral indices means that as the amount of Chlorophyll-a decreases, the values of the FAI and SABI indices increase, and vice versa. Article [50] shows detailed examples of the application of the FAI index. From them, low values of the index correspond to clear water, and high values of the index correspond to the presence of macroalgae. The SABI index has been proposed to delineate the spatial distributions of floating microalgal species, such as cyanobacteria, or exposed intertidal vegetation, such as seagrasses [25]. Band ratio algorithms in the red and near-infrared spectral regions have great potential for remote Chlorophyll-a estimation. However, more research is needed to fully understand the complex relationships between Chlorophyll-a concentration and the FAI and SABI indices and identify the underlying mechanisms driving these relationships. It would be desirable in future research to include inherent optical properties of the lake system studied in order to further elucidate the optical signals used. The highest values of estimated Chlorophyll-a were observed in shore areas close to cities (Villarrica and Pucón), and this coincides with the highest values of the diffuse attenuation coefficient of solar radiation found in [36]. In addition, in some research [58] higher values near the shore have indicated the presence of algal blooms, and NDVI, NDWI, NDTI, and SABI indices were highly correlated with Chlorophyll-a. In the case of Villarrica, the NDTI had a low correlation with Chlorophyll-a, probably due to the variable turbidity of this lake, attributed, as with most of the Araucanian lakes, to mixing in the water column due to wind and frequent precipitation as well as sediment resuspension [47].
The greatest FAI values, as observed in Figure 3, occur in October 2018 and February 2020 (FAI > −0.0025), showing the presence of aquatic vegetation or algae bloom. In [67], the lake areas with positive FAI values (FAI > 0.003) were classified as algae blooms or aquatic vegetation, which is quite close to the results found and shown in this investigation. In the first season (summer) of 2018 and 2020, blooms were reported in Lake Villarrica at different points, and the cyanobacterial species was Dolichorpermum sp. The monitoring campaigns were carried out close to the dates of the satellite images (25 January 2018, and 19 January 2020). Both blooms can be captured through the indices, although another algal species (Microcystis) that has also been found in Lake Villarrica has been reported to form blooms, in other lake systems such as Lake Erie and Lake Taihu or Curonian Lagoon [29,30,31].
Algal blooms of cyanobacteria are becoming more frequent in freshwater systems, increasing due to the additional effects of climate change such as the gradual increase in surface water temperature, which makes it possible for algae to bloom for longer periods depending on how favorable the water temperature. In this study, it was not an objective to evaluate the behavior of temperature; however, temperature determines an increase in the productivity of phytoplankton communities; blooms in Lake Villarrica have manifested themselves when the temperature is higher than 18 °C.
Despite presenting good water quality in general, which is reaffirmed by the Chlorophyll-a estimation carried out in this work, the highest Chlorophyll-a values were recorded in the shore area of the lake, coinciding with the shore of Villarrica and Pucón city (see Figure 5 and Figure 6). This indicates that in the shore waters of cities, algae blooms may occur more frequently, and an alert should be generated since they are very touristy areas. Therefore, it can be inferred that the main determining factor of the high values of Chlorophyll-a and algae blooms, considering only the land use (Figure 6), is the urban area. A deeper study should be carried out in other investigations to analyze the possible influence of agriculture. Of all the algal groups, cyanobacteria present advantages due to their environmental resistance to changing parameters related to either the climate or subaquatic column conditions. In addition, some of the described species present toxins that can cause intoxication problems for animals or skin irritation in humans. If these toxins are ingested at high concentrations, they can cause more serious health problems, including death, as stated by [68].
Phytoplankton is considered a good indicator of the environmental quality of lakes due to its tolerance and sensitivity to the increase in nutrients generated by anthropogenic pollution (associated with nitrates, nitrites, and phosphates, etc.); therefore, the measurement and analysis of the phytoplankton of a lake help determine its trophic state. It is important to mention that some phytoplankton are cyanobacteria which are associated with the algal blooms present in Lake Villarrica. Cyanobacteria can fix atmospheric nitrogen [69]; therefore, phosphorus functions as a limiting nutrient for blooms in most continental aquatic systems. In addition, blooms could be due to certain physicochemical conditions such as high concentrations of nutrients (mainly nitrogen and phosphorus), high temperatures, good light availability, low turbulence, absence of winds, and stratification of the water body, along with eutrophication processes that could also be influencing the blooms. In [70] the blooms are attributed to increases in the nutrients from small urban areas and agriculture. These same factors were the triggers for the appearance of cyanobacteria and other algae blooms in the investigations carried out by [31,68]. This phenomenon can be triggered in a few hours or several days and can disappear quickly or remain for long periods. In addition, wind is an important factor that can influence algal blooms in several ways. If there is mixing in the water column, wind-generated turbulence can mix surface water with deeper water, allowing nutrients such as nitrogen and phosphorus to rise to the surface [71,72,73]. These nutrients are essential for algal growth and reproduction. Wind can also transport algae to new locations, where they can thrive in favorable conditions, such as warmer temperatures, higher light levels, and greater nutrient availability. Sometimes wind can cause stratification of the water column, creating different layers of water with different temperatures and nutrient concentrations. This stratification can favor the growth of certain types of algae that prefer specific water conditions. On the other hand, wind-driven currents can also cause algae to accumulate in certain areas, such as near shorelines or in bays, where they can form dense mats or blooms. Therefore, remote sensing can provide an alternative to the spatial–temporal factors that are faced through research and surveillance programs of the lake ecosystems which are based mainly on costly on-site measurements. Furthermore, it is important to note that this study is the first to address the detection of primary producers in this Chilean lake using remote sensing techniques.

5. Conclusions

Using multispectral imagery is a reliable and efficient method for monitoring water quality in freshwater ecosystems. In Chile, this technique has gained popularity due to the limited research resources available. Although the General Water Directorate of Chile monitors many lakes, their efforts fall short in keeping up with changes in the system. The increasing occurrence of algal blooms poses a threat to the organisms and the scenery of the lake, and decreases income generated from tourism in the southern part of the country. Phytoplankton blooms are an indication of high nutrient concentrations that may result from contamination by organic and inorganic substances from urban and industrial effluents and crop fertilization.
This study employed two spectral indices algorithms to retrieve Chl-a data from Lake Villarrica. The statistical indicators of the model generated revealed that the SABI and FAI indices were the most precise in estimating Chl-a levels in Lake Villarrica. By detecting algae using satellite images, an early warning system can be implemented to anticipate the development of algal bloom events, inform the public, and execute policies that safeguard this valuable water resource.

Supplementary Materials

The following supporting information can be downloaded at: https://www.mdpi.com/article/10.3390/rs15071929/s1. Figure S1. Ninth bloom reported in Villarrica by Vigilantes del Lago (19 January 2015, Dolichospermum sp.) Sector Centro. Figura S2. Tenth bloom reported in Villarrica (2 January 2016, Dolichospermum sp.) Ribera Sur. Figure S3. Eleventh bloom reported in Villarrica (10 February 2017, Spirogyra sp.) South Bank. Figure S4. Twelfth bloom reported in Villarrica (25 January 2018, Dolichospermum sp.) South Sector. Figure S5. Last Bloom reported in Villarrica (19 January 2020, Dolichospermum sp.) Pelagial Villarrica.

Author Contributions

Conceptualization, L.R.-L.; methodology, L.R.-L.; software, I.D.-L.; validation, L.B.A. and L.R.-L.; formal analysis, L.R.-L.; investigation, L.R.-L.; resources, R.U.; data curation, L.R.-L.; writing—original draft preparation, L.R.-L.; writing—review and editing, L.R.-L. and I.D.-L.; visualization, L.B.A. and I.D.-L.; supervision, A.L.; project administration, R.U.; funding acquisition, L.R.-L. and R.U. All authors have read and agreed to the published version of the manuscript.

Funding

This research was funded by CRHIAM (ANID/FONDAP/15130015).

Data Availability Statement

The data presented in this study are available on request from the corresponding author.

Acknowledgments

L.R.-L. is grateful to the VRIDFAI21/10 project of the Universidad San Sebastian. Special thanks to the Centro de Recursos Hídricos para la Agricultura y la Minería (CRHIAM) (Project ANID/FONDAP/15130015).

Conflicts of Interest

The authors declare no conflict of interest.

References

  1. Carpenter, S.R.; Stanley, E.H.; vander Zanden, M.J. State of the World’s Freshwater Ecosystems: Physical, Chemical, and Biological Changes. Annu. Rev. Environ. Resour. 2011, 36, 75–99. [Google Scholar] [CrossRef] [Green Version]
  2. Ho, L.T.; Goethals, P.L.M. Opportunities and Challenges for the Sustainability of Lakes and Reservoirs in Relation to the Sustainable Development Goals (SDGs). Water 2019, 11, 1462. [Google Scholar] [CrossRef] [Green Version]
  3. Gozlan, R.E.; Karimov, B.K.; Zadereev, E.; Kuznetsova, D.; Brucet, S. Status, Trends, and Future Dynamics of Freshwater Ecosystems in Europe and Central Asia. Inland Waters 2019, 9, 78–94. [Google Scholar] [CrossRef]
  4. Kumar, R.; Parvaze, S.; Huda, M.B.; Allaie, S.P. The Changing Water Quality of Lakes—A Case Study of Dal Lake, Kashmir Valley. Environ. Monit. Assess. 2022, 194, 228. [Google Scholar] [CrossRef] [PubMed]
  5. Irannezhad, M.; Ahmadi, B.; Liu, J.; Chen, D.; Matthews, J.H. Global Water Security: A Shining Star in the Dark Sky of Achieving the Sustainable Development Goals. Sustain. Horiz. 2022, 1, 100005. [Google Scholar] [CrossRef]
  6. Prado, R.; García, R.; Rioboo, C.; Herrero, C.; Cid, A. Suitability of Cytotoxicity Endpoints and Test Microalgal Species to Disclose the Toxic Effect of Common Aquatic Pollutants. Ecotoxicol. Environ. Saf. 2015, 114, 117–125. [Google Scholar] [CrossRef] [Green Version]
  7. Park, J.; Kim, K.T.; Lee, W.H. Recent Advances in Information and Communications Technology (ICT) and Sensor Technology for Monitoring Water Quality. Water 2020, 12, 510. [Google Scholar] [CrossRef] [Green Version]
  8. Ostroumov, S.A. Water Quality and Conditioning in Natural Ecosystems: Biomachinery Theory of Self-Purification of Water. Russ. J. Gen. Chem. 2017, 87, 3199–3204. [Google Scholar] [CrossRef]
  9. Demetillo, A.T.; Taboada, E.B. Real-Time Water Quality Monitoring for Small Aquatic Area Using Unmanned Surface Vehicle. Technol. Appl. Sci. Res. 2019, 9, 3959–3964. [Google Scholar] [CrossRef]
  10. Rodríguez-López, L.; González-Rodríguez, L.; Duran-Llacer, I.; Cardenas, R.; Urrutia, R. Spatio-Temporal Analysis of Chlorophyll in Six Araucanian Lakes of Central-South Chile from Landsat Imagery. Ecol. Inform. 2021, 65, 101431. [Google Scholar] [CrossRef]
  11. Peterson, K.T.; Sagan, V.; Sidike, P.; Hasenmueller, E.A.; Sloan, J.J.; Knouft, J.H. Machine Learning-Based Ensemble Prediction of Water-Quality Variables Using Feature-Level and Decision-Level Fusion with Proximal Remote Sensing. Photogramm. Eng. Remote Sens. 2019, 85, 269–280. [Google Scholar] [CrossRef]
  12. Rodríguez-López, L.; Duran-Llacer, I.; González-Rodríguez, L.; Abarca-del-Rio, R.; Cárdenas, R.; Parra, O.; Martínez-Retureta, R.; Urrutia, R. Spectral Analysis Using LANDSAT Images to Monitor the Chlorophyll-a Concentration in Lake Laja in Chile. Ecol. Inform. 2020, 60, 101183. [Google Scholar] [CrossRef]
  13. Aranda, A.C.; Rivera-Ruiz, D.; Rodríguez-López, L.; Pedreros, P.; Arumí-Ribera, J.L.; Morales-Salinas, L.; Fuentes-Jaque, G.; Urrutia, R. Evidence of Climate Change Based on Lake Surface Temperature Trends in South Central Chile. Remote Sens. 2021, 13, 4535. [Google Scholar] [CrossRef]
  14. Bhagowati, B.; Ahamad, K.U. A Review on Lake Eutrophication Dynamics and Recent Developments in Lake Modeling. Ecohydrol. Hydrobiol. 2019, 19, 155–166. [Google Scholar] [CrossRef]
  15. Zou, R.; Wu, Z.; Zhao, L.; Elser, J.J.; Yu, Y.; Chen, Y.; Liu, Y. Seasonal Algal Blooms Support Sediment Release of Phosphorus via Positive Feedback in a Eutrophic Lake: Insights from a Nutrient Flux Tracking Modeling. Ecol. Model. 2020, 416, 108881. [Google Scholar] [CrossRef]
  16. Harrison, J.W.; Smith, R.E.H. Environmental Effects of UV Radiation Effects of Ultraviolet Radiation on the Productivity and Composition of Freshwater Phytoplankton Communities. Photochem. Photobiol. Sci. 2009, 8, 1218–1232. [Google Scholar] [CrossRef]
  17. Nazari-Sharabian, M.; Ahmad, S.; Karakouzian, M. Climate Change and Eutrophication: A Short Review. Eng. Technol. Appl. Sci. Res. 2018, 8, 3668–3672. [Google Scholar] [CrossRef]
  18. Berg, M.; Sutula, M. Factors Affecting Growth of Cyanobacteria with Special Emphasis on the Sacramento-San Joaquin Delta EXECUTIVE SUMMARY. In Southern California Coastal Water Research Project Technical Report; Southern California Coastal Water Research Project: Costa Mesa, CA, USA, 2015; Volume 869, p. 100. [Google Scholar]
  19. Li, S.; Song, K.; Wang, S.; Liu, G.; Wen, Z.; Shang, Y.; Lyu, L.; Chen, F.; Xu, S.; Tao, H.; et al. Quantification of Chlorophyll-a in Typical Lakes across China Using Sentinel-2 MSI Imagery with Machine Learning Algorithm. Sci. Total Environ. 2021, 778, 146271. [Google Scholar] [CrossRef]
  20. Lillesand, T.; Kiefer, R.W.; Chipman, J. Remote Sensing and Image Interpretation; John Wiley & Sons.: Hoboken, NJ, USA, 2015; ISBN 978-1-118-34328-9. [Google Scholar]
  21. Gholizadeh, M.H.; Melesse, A.M.; Reddi, L. A Comprehensive Review on Water Quality Parameters Estimation Using Remote Sensing Techniques. Sensors 2016, 16, 1298. [Google Scholar] [CrossRef] [Green Version]
  22. Qing, S.; Runa, A.; Shun, B.; Zhao, W.; Bao, Y.; Hao, Y. Distinguishing and Mapping of Aquatic Vegetations and Yellow Algae Bloom with Landsat Satellite Data in a Complex Shallow Lake, China during 1986–2018. Ecol. Indic. 2020, 112, 106073. [Google Scholar] [CrossRef]
  23. Elhag, M.; Gitas, I.; Othman, A.; Bahrawi, J.; Gikas, P. Assessment of Water Quality Parameters Using Temporal Remote Sensing Spectral Reflectance in Arid Environments, Saudi Arabia. Water 2019, 11, 556. [Google Scholar] [CrossRef] [Green Version]
  24. Ma, J.; Jin, S.; Li, J.; He, Y.; Shang, W. Spatio-Temporal Variations and Driving Forces of Harmful Algal Blooms in Chaohu Lake: A Multi-Source Remote Sensing Approach. Remote Sens. 2021, 13, 427. [Google Scholar] [CrossRef]
  25. Alawadi, F. Detection of Surface Algal Blooms Using the Newly Developed Algorithm Surface Algal Bloom Index (SABI). In Remote Sensing of the Ocean, Sea Ice, and Large Water Regions 2010; SPIE: St Bellingham, WA, USA, 2010; Volume 7825, p. 782506. [Google Scholar] [CrossRef] [Green Version]
  26. Boucher, J.; Weathers, K.C.; Norouzi, H.; Steele, B. Assessing the Effectiveness of Landsat 8 Chlorophyll a Retrieval Algorithms for Regional Freshwater Monitoring. Ecol. Appl. 2018, 28, 1044–1054. [Google Scholar] [CrossRef] [Green Version]
  27. Xu, J.; Liu, H.; Lin, J.; Lyu, H.; Dong, X.; Li, Y.; Guo, H.; Wang, H. Long-Term Monitoring Particulate Composition Change in the Great Lakes Using MODIS Data. Water Res. 2022, 222, 118932. [Google Scholar] [CrossRef]
  28. Lekki, J.; Deutsch, E.; Sayers, M.; Bosse, K.; Anderson, R.; Tokars, R.; Sawtell, R. Determining Remote Sensing Spatial Resolution Requirements for the Monitoring of Harmful Algal Blooms in the Great Lakes. J. Great Lakes Res. 2019, 45, 434–443. [Google Scholar] [CrossRef]
  29. Sayers, M.J.; Grimm, A.G.; Shuchman, R.A.; Bosse, K.R.; Fahnenstiel, G.L.; Ruberg, S.A.; Leshkevich, G.A. Satellite Monitoring of Harmful Algal Blooms in the Western Basin of Lake Erie: A 20-Year Time-Series. J. Great Lakes Res. 2019, 45, 508–521. [Google Scholar] [CrossRef]
  30. Cazzaniga, I.; Zibordi, G.; Mélin, F. Spectral Features of Ocean Colour Radiometric Products in the Presence of Cyanobacteria Blooms in the Baltic Sea. Remote Sens. Environ. 2023, 287, 113464. [Google Scholar] [CrossRef]
  31. Vaičiūtė, D.; Bučas, M.; Bresciani, M.; Dabulevičienė, T.; Gintauskas, J.; Mėžinė, J.; Tiškus, E.; Umgiesser, G.; Morkūnas, J.; de Santi, F.; et al. Hot Moments and Hotspots of Cyanobacteria Hyperblooms in the Curonian Lagoon (SE Baltic Sea) Revealed via Remote Sensing-Based Retrospective Analysis. Sci. Total Environ. 2021, 769, 145053. [Google Scholar] [CrossRef] [PubMed]
  32. Nimptsch, J.; Woelfl, S.; Osorio, S.; Valenzuela, J.; Moreira, C.; Ramos, V.; Castelo-Branco, R.; Leão, P.N.; Vasconcelos, V. First Record of Toxins Associated with Cyanobacterial Blooms in Oligotrophic North Patagonian Lakes of Chile-a Genomic Approach. Int. Rev. Hydrobiol. 2016, 101, 57–68. [Google Scholar] [CrossRef]
  33. Publicación, F.; Santiago, N. 19-Establece Normas Secundarias de Calidad Ambiental Para la Protección de Las Aguas Continentales Superficiales del lago Villarrica Ministerio del Medio Ambiente Establece Normas Secundarias de Calidad Ambiental Para la Protección de Las Aguas Continentales Superficiales del lago Villarrica; MEDIO: Mar del Plata, Argentina, 2013; Volume 19. [Google Scholar]
  34. Wojtiuk, J.R.; Otero, A.M. Condominiums: Indicators of Post-Tourism Change. The Case of Pucon, Chile. In Realidad, Tendencias y Desafíos en Turismo; Consejo de Decanos y Directores de Unidades Académicas Relacionadas con la Enseñanza del Turismo: Neuquén, Argentina, 2020; Volume 18, pp. 53–73. [Google Scholar]
  35. Vergara, L.; Sánchez, C.; Zunino, H.M. Lifestyle Migration: Creating Diverse and Cohesive Communities? The Case of Los Riscos, Pucón, Chile. Rev. Austral Cienc. Soc. 2019, 36, 47–67. [Google Scholar] [CrossRef]
  36. Rodríguez-López, L.; González-Rodríguez, L.; Duran-Llacer, I.; García, W.; Cardenas, R.; Urrutia, R. Assessment of the Diffuse Attenuation Coefficient of Photosynthetically Active Radiation in a Chilean Lake. Remote Sens. 2022, 14, 4568. [Google Scholar] [CrossRef]
  37. Niemeyer, H. Hoyas Hidrográficas De Chile Novena Región; Dirección General de Aguas: Santiago, Chile, 1980. [Google Scholar]
  38. Campos, H.; Steffen, W.; Roman, C.; Zúñiga, L.; Aguero, G. Limnological Studies in Lake Villarrica Morphometric, Physical, Chemical, Planktonical Factors and Primary Productivity. Arch. Hydrobiologie. Supplementband. Monogr. Beiträge 1983, 65, 371–406. [Google Scholar]
  39. DGA Atlas Del Agua. Atlas del Agua Chile 2016; Ministerio de Obras Públicas: Santiago, Chile, 2016; Volume 1, pp. 1–24. [Google Scholar]
  40. Ilori, C.O.; Pahlevan, N.; Knudby, A. Analyzing Performances of Different Atmospheric Correction Techniques for Landsat 8: Application for Coastal Remote Sensing. Remote Sens. 2019, 11, 469. [Google Scholar] [CrossRef] [Green Version]
  41. Vanhellemont, Q.; Ruddick, K. Atmospheric Correction of Metre-Scale Optical Satellite Data for Inland and Coastal Water Applications. Remote Sens. Environ. 2018, 216, 586–597. [Google Scholar] [CrossRef]
  42. Vanhellemont, Q. Adaptation of the Dark Spectrum Fitting Atmospheric Correction for Aquatic Applications of the Landsat and Sentinel-2 Archives. Remote Sens. Environ. 2019, 225, 175–192. [Google Scholar] [CrossRef]
  43. Vanhellemont, Q. Sensitivity Analysis of the Dark Spectrum Fitting Atmospheric Correction for Metre- and Decametre-Scale Satellite Imagery Using Autonomous Hyperspectral Radiometry. Opt. Express 2020, 28, 29948. [Google Scholar] [CrossRef]
  44. Vanhellemont, Q.; Ruddick, K. Turbid Wakes Associated with Offshore Wind Turbines Observed with Landsat 8. Remote Sens. Environ. 2014, 145, 105–115. [Google Scholar] [CrossRef] [Green Version]
  45. Vanhellemont, Q.; Ruddick, K. Advantages of High Quality SWIR Bands for Ocean Colour Processing: Examples from Landsat-8. Remote Sens. Environ. 2015, 161, 89–106. [Google Scholar] [CrossRef] [Green Version]
  46. Vanhellemont, Q.; Ruddick, K. Acolite for Sentinel-2: Aquatic Applications of MSI Imagery. In Proceedings of the 2016 ESA Living Planet Symposium, Prague, Czech Republic, 9–13 May 2016; Praga: Prague, Czechia, 2016; pp. 9–13. [Google Scholar]
  47. Rodríguez-López, L.; Duran-Llacer, I.; González-Rodríguez, L.; Cardenas, R.; Urrutia, R. Retrieving Water Turbidity in Araucanian Lakes (South-Central Chile) Based on Multispectral Landsat Imagery. Remote Sens. 2021, 13, 3133. [Google Scholar] [CrossRef]
  48. DGA Dirección General de Aguas de Chile. Available online: https://dga.mop.gob.cl/ (accessed on 2 March 2023).
  49. Verstraete, M.M.; Pinty, B. Verstraete1996. IEEE Trans. Geosci. Remote Sens. 1996, 34, 1254–1265. [Google Scholar] [CrossRef]
  50. Shi, K.; Zhang, Y.; Qin, B.; Zhou, B. Remote Sensing of Cyanobacterial Blooms in Inland Waters: Present Knowledge and Future Challenges. Sci. Bull. 2019, 64, 1540–1556. [Google Scholar] [CrossRef] [PubMed] [Green Version]
  51. Huete, A.; Didan, K.; Miura, T.; Rodriguez, E.P.; Gao, X.; Ferreira, L.G. Overview of the Radiometric and Biophysical Performance of the MODIS Vegetation Indices. Remote Sens. Environ. 2002, 83, 195–213. [Google Scholar] [CrossRef]
  52. Hu, C. A Novel Ocean Color Index to Detect Floating Algae in the Global Oceans. Remote Sens. Environ. 2009, 113, 2118–2129. [Google Scholar] [CrossRef]
  53. Gitelson, A.A.; Kaufman, Y.J.; Merzlyak, M.N.; Blaustein, J. Use of a Green Channel in Remote Sensing of Global Vegetation from EOS-MODIS. Remote Sens. Environ. 1996, 58, 289–298. [Google Scholar] [CrossRef]
  54. Duran-Llacer, I.; Arumí, J.L.; Arriagada, L.; Aguayo, M.; Rojas, O.; González-Rodríguez, L.; Rodríguez-López, L.; Martínez-Retureta, R.; Oyarzún, R.; Singh, S.K. A New Method to Map Groundwater-Dependent Ecosystem Zones in Semi-Arid Environments: A Case Study in Chile. Sci. Total Environ. 2022, 816, 151528. [Google Scholar] [CrossRef]
  55. Xu, H. A Study on Information Extraction of Water Body with the Modified Normalized Difference Water Index (MNDWI). J. Remote Sens. 2005, 9, 589–595. [Google Scholar]
  56. Hassan, M.A.; Yang, M.; Rasheed, A.; Jin, X.; Xia, X.; Xiao, Y.; He, Z. Time-Series Multispectral Indices from Unmanned Aerial Vehicle Imagery Reveal Senescence Rate in Bread Wheat. Remote Sens. 2018, 10, 809. [Google Scholar] [CrossRef] [Green Version]
  57. Gitelson, A.A.; Viña, A.; Ciganda, V.; Rundquist, D.C.; Arkebauer, T.J. Remote Estimation of Canopy Chlorophyll Content in Crops. Geophys. Res. Lett. 2005, 32, L08403. [Google Scholar] [CrossRef] [Green Version]
  58. Alharbi, B. Remote Sensing Techniques for Monitoring Algal Blooms in the Area between Jeddah and Rabigh on the Red Sea Coast. Remote Sens. Appl. 2023, 30, 100935. [Google Scholar] [CrossRef]
  59. Kavzoglu, T.; Goral, M. Google Earth Engine for Monitoring Marine Mucilage: Izmit Bay in Spring 2021. Hydrology 2022, 9, 135. [Google Scholar] [CrossRef]
  60. Ma, M.; Wang, X.; Veroustraete, F.; Dong, L. Change in Area of Ebinur Lake during the 1998-2005 Period. Int. J. Remote Sens. 2007, 28, 5523–5533. [Google Scholar] [CrossRef]
  61. Bohn, V.Y.; Carmona, F.; Rivas, R.; Lagomarsino, L.; Diovisalvi, N.; Zagarese, H.E. The Egyptian Journal of Remote Sensing and Space Sciences Development of an Empirical Model for Chlorophyll-a and Secchi Disk Depth Estimation for a Pampean Shallow Lake (Argentina). Egypt. J. Remote Sens. Space Sci. 2018, 21, 183–191. [Google Scholar] [CrossRef]
  62. Despotovic, M.; Nedic, V.; Despotovic, D.; Cvetanovic, S. Review and Statistical Analysis of Different Global Solar Radiation Sunshine Models. Renew. Sustain. Energy Rev. 2015, 52, 1869–1880. [Google Scholar] [CrossRef]
  63. Li, Z.; Ye, L.; Zhao, Y.; Song, X.; Teng, J.; Jin, J. Short-Term Wind Power Prediction Based on Extreme Learning Machine with Error Correction. Prot. Control Mod. Power Syst. 2016, 1, 4–11. [Google Scholar] [CrossRef] [Green Version]
  64. Kuefner, W.; Hofmann, A.M.; Geist, J.; Dubois, N.; Raeder, U. Algal Community Change in Mountain Lakes of the Alps Reveals Effects of Climate Warming and Shifting Treelines 1. J. Phycol. 2021, 57, 1266–1283. [Google Scholar] [CrossRef] [PubMed]
  65. Caldwell, T.J.; Chandra, S.; Feher, K.; Simmons, J.B.; Hogan, Z. Ecosystem Response to Earlier Ice Break-up Date: Climate-Driven Changes to Water Temperature, Lake-Habitat-Specific Production, and Trout Habitat and Resource Use. Glob. Chang. Biol. 2020, 26, 5475–5491. [Google Scholar] [CrossRef]
  66. Yin, Z.; Li, J.; Zhang, B.; Liu, Y.; Yan, K.; Gao, M.; Xie, Y.; Zhang, F.; Wang, S. Increase in Chlorophyll-a Concentration in Lake Taihu from 1984 to 2021 Based on Landsat Observations. Sci. Total Environ. 2023, 873, 162168. [Google Scholar] [CrossRef]
  67. Pu, J.; Song, K.; Lv, Y.; Liu, G.; Fang, C.; Hou, J.; Wen, Z. Distinguishing Algal Blooms from Aquatic Vegetation in Chinese Lakes Using Sentinel 2 Image. Remote Sens. 2022, 14, 1988. [Google Scholar] [CrossRef]
  68. Kislik, C.; Dronova, I.; Grantham, T.E.; Kelly, M. Mapping Algal Bloom Dynamics in Small Reservoirs Using Sentinel-2 Imagery in Google Earth Engine. Ecol. Indic. 2022, 140, 109041. [Google Scholar] [CrossRef]
  69. Molot, L.A.; Higgins, S.N.; Schiff, S.L.; Venkiteswaran, J.J.; Paterson, M.J.; Baulch, H.M. Phosphorus-Only Fertilization Rapidly Initiates Large Nitrogen-Fixing Cyanobacteria Blooms in Two Oligotrophic Lakes. Environ. Res. Lett. 2021, 16, 064078. [Google Scholar] [CrossRef]
  70. Matej-Lukowicz, K.; Wojciechowska, E.; Nawrot, N.; Dzierzbicka-Głowacka, L.A. Seasonal Contributions of Nutrients from Small Urban and Agricultural Watersheds in Northern Poland. PeerJ 2020, 8, e8381. [Google Scholar] [CrossRef] [PubMed]
  71. Arfi, R.; Guiral, D.; Bouvy, M. Wind Induced Resuspension in a Shallow Tropical Lagoon. Estuar. Coast. Shelf Sci. 1993, 36, 587–604. [Google Scholar] [CrossRef] [Green Version]
  72. Meyer, J.; Leonhardt, V.; Blindow, I. Sedimentation in a Shallow Brackish Water Lagoon Influenced by Wind-Induced Waves—A Methodical Study. Estuar. Coast. Shelf Sci. 2019, 218, 359–367. [Google Scholar] [CrossRef]
  73. Zhu, Y.; Mulholland, M.R.; Macías Tapia, A.; Echevarría, M.A.; Pérez Vega, E.; Bernhardt, P. Cyanate Dynamics under Algal Blooms and Sediment Resuspension Events in a Shallow Micro-Tidal Estuary in the Lower Chesapeake Bay. Estuar. Coast. Shelf Sci. 2023, 281, 108188. [Google Scholar] [CrossRef]
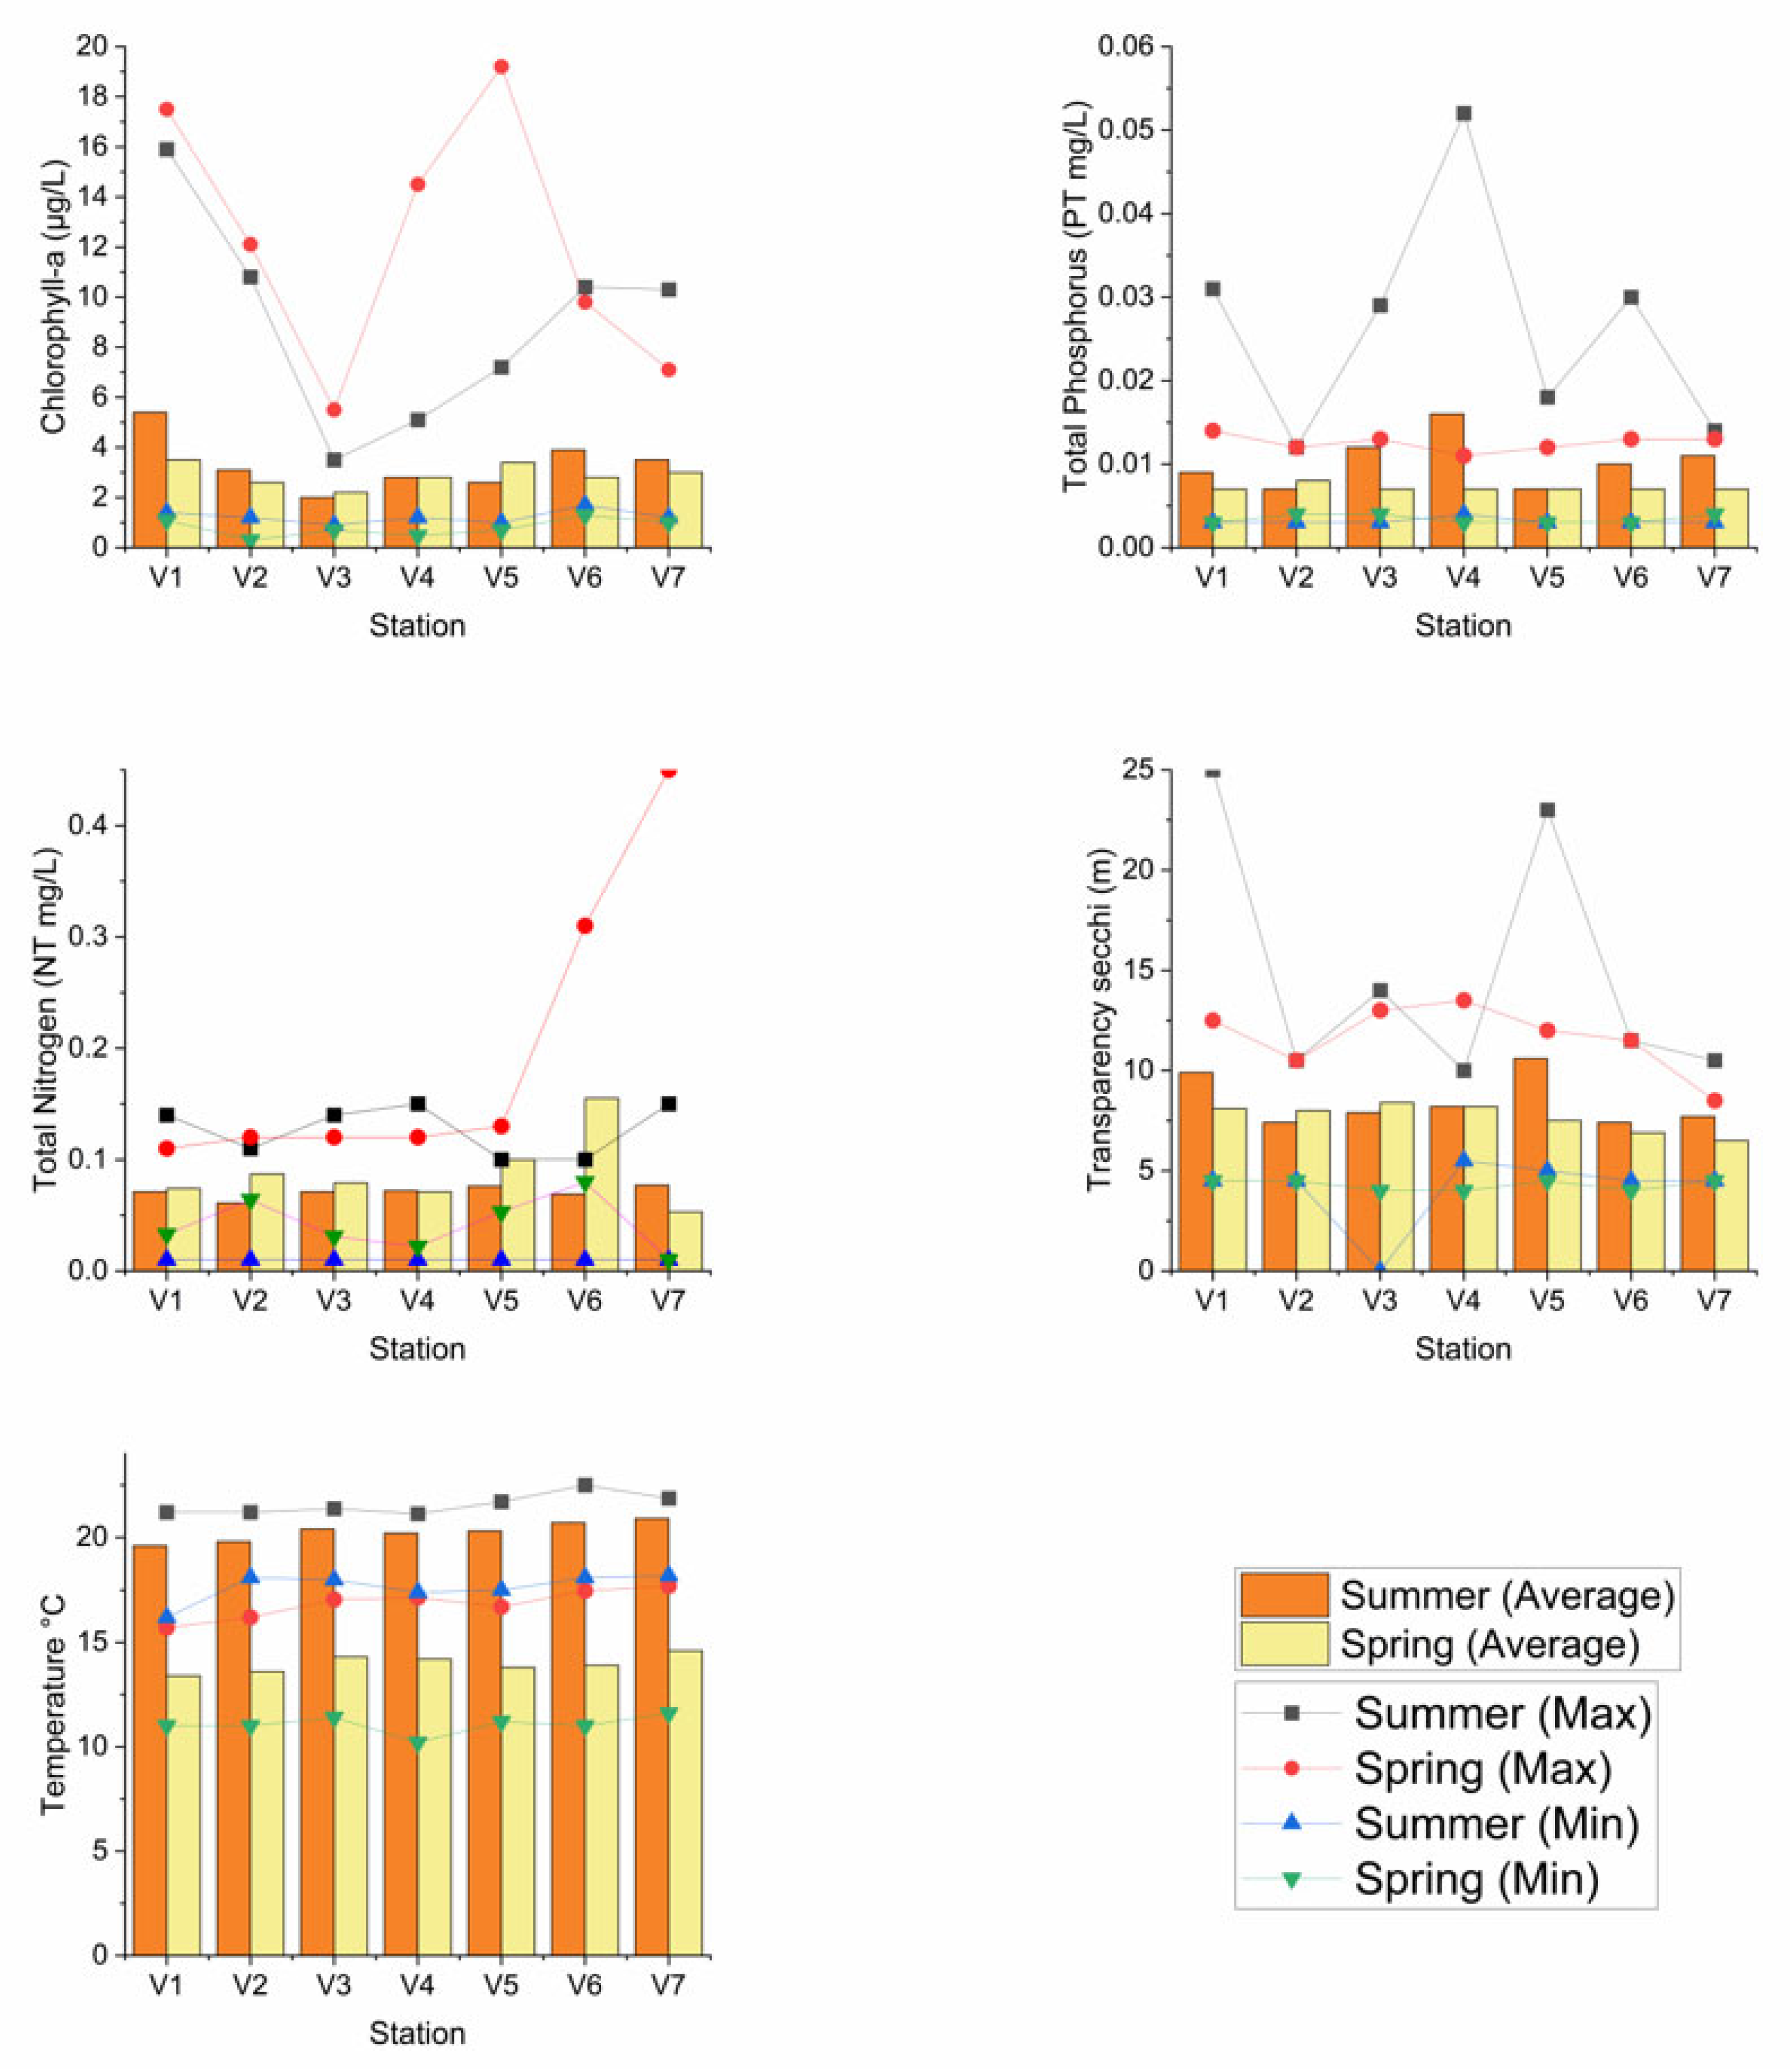
Figure 1. Behavior of limnological parameters in Lake Villarrica during summer and spring seasons. For the summer months (December, January, and February) and for the spring months (September, October, and November) were considered.
Remotesensing 15 01929 g001
Figure 2. Measured Chl-a and Chl-a estimated using the obtained multiple linear regression model.
Remotesensing 15 01929 g002
Figure 3. Spatial distribution of FAI in Lake Villarrica.
Remotesensing 15 01929 g003
Figure 4. Spatial distribution of SABI in Lake Villarrica.
Remotesensing 15 01929 g004
Figure 5. Spatial pattern of Chlorophyll-a arising from multivariate regression resulting from spectral indices through as seen Landsat imagery.
Remotesensing 15 01929 g005
Figure 6. (a) Chile in South America; (b) Araucanía Region with topographic profiles, with the study area, including Lake Villarrica, outlined in black; and (c) the land uses of the Villarrica basin.
Remotesensing 15 01929 g006
Table 1. Morphometric characteristics of Lake Villarrica.
ParameterUnitVillarrica
Latitude°39°11′–39°18′S
Longitude°72°05′–72°15′W
Altitudem.a.s.l.250
Max. lengthkm23
Max. widthkm11
Avg. widthkm7.6
Perimeterkm71
Surface areakm2176
Max. depthm165
Average depthm120
Volumekm320.9
Drainage areakm22884.15
Avg. drainage/surface area 16.4
Renewal timeyears4
Table 2. Landsat image characteristics and dates of in situ measurements.
L8 Image IDPath/
Row
YearIn Situ DateImage DateDays DifferencesN Samples
LC08_L1TP_233087_20140210_20200912_02_T1233/8720143, 4 Feb.10 Feb.6, 714
LC08_L1TP_233087_20141008_20200910_02_T16, 7 Oct.8 Oct.1, 214
LC08_L1TP_233087_20150128_20200909_02_T1201526, 27 Jan.28 Jan.0, 114
LC08_L1TP_233087_20151011_20200908_02_T119, 20 Oct.11 Oct.8, 914
LC08_L1TP_233087_20160303_20200907_02_T120161, 2 Mar.3 Mar.1, 214
LC08_L1TP_233087_20161013_20200905_02_T118, 19 Oct.13 Oct.5, 614
LC08_L1TP_233087_20170306_20200905_02_T120171 Mar.6 Mar.57
LC08_L1TP_232087_20171025_20200902_02_T1232/8717, 19 Oct.25 Oct.7, 814
LC08_L1TP_233087_20180221_20200902_02_T1233/87201827, 28 Feb.21 Feb.6, 714
LC08_L1TP_232087_20180302_20200902_02_T1232/8727, 28 Feb.2 Mar.2, 314
LC08_L1TP_233087_20181019_20200830_02_T1233/8723, 24 Oct.19 Oct.4, 514
LC08_L1TP_233087_20190123_20200830_02_T1201928, 29 Jan.23 Jan.5, 614
LC08_L1TP_233087_20190224_20200829_02_T126, 27 Feb.24 Feb.2, 314
LC08_L1TP_233087_20191123_20200825_02_T119, 20 Nov.23 Nov.3, 414
LC08_L1TP_233087_20191209_20200824_02_T13, 4 Dec.9 Dec.5, 614
LC08_L1TP_233087_20200126_20200823_02_T1202028, 29 Jan.26 Jan.2, 314
LC08_L1TP_233087_20200227_20200822_02_T124–26, 27 Feb.27 Feb.0, 1, 328
LC08_L1TP_233087_20200314_20200822_02_T114 Mar.14 Mar.07
LC08_L1TP_233087_20201109_20210317_02_T110–12 Nov.9 Nov.1, 2, 321
LC08_L1TP_232087_20201118_20210315_02_T1232/8724 Nov.18 Nov.67
LC08_L1TP_232087_20201204_20210313_02_T126 Nov.4 Dec.87
LC08_L1TP_233087_20210301_20210311_02_T1233/8720212, 3 Mar.1 Mar.1, 214
LC08_L1TP_233087_20211027_20211104_02_T118–20 Oct.27 Oct.7, 8, 921
LC08_L1TP_232087_20211105_20211116_02_T1232/878, 9 Nov.5 Nov.3, 414
LC08_L1TP_233087_20211128_20211208_02_T1233/8729, 30 Nov.28 Nov.1, 214
Table 3. The list of indices compared in this study.
IndicesFormulaeReference
Floating algal index (FAI)FAI = NIR − ’NIR
’NIR = R + (SWIR − R) × (λNIR − λR)/(λSWIR − λR)
[24,52]
Green normalized difference vegetation index (GNDVI)(NIR − G)/(NIR + G)[23,53]
Normalized difference turbidity index (NDTI)(R − G)/(R + G)[23]
Normalized difference vegetation index (NDVI)(NIR − R)/(NIR + R)[12]
Enhanced vegetation index (EVI)G × ((NIR − R)/(NIR + C1 × R − C2 × B + L))[51,54]
Surface algal bloom index (SABI)(NIR − R)/(B + G)[25,26]
Emergent vegetation spectral index (EVSI)EVSI = (R − SWR)/(R + SWR)[22]
Modified normalized different water index (MNDWI)MNDWI = (G − SWIR)/(G + SWIR)[55]
Green Chlorophyll index (GCI)GCI = (NIR/G) − 1[56,57]
Table 4. Statistical indicators.
Statistical IndicatorsFormulaeReference
Determination coefficient (R2) R 2 = i = 1 n O i   O ¯ P i   P ¯ i = 1 n ( O i O ¯ ) 2 i = 1 n ( P i P ¯ ) 2 2 [62]
Mean bias error (MBE) MBE = 1 n i = 1 n P i O i [62]
Root-mean square error (RMSE) RMSE = i = 1 n P i O i 2 n 1 2 [63]
Normalized root means square error (NMRSE) NMRSE = RMSE i = 1 n O i n [63]
Where Pi is the estimated value, Oi is the measured value, n is the number of observations.
Table 5. Pearson correlation coefficient between the spectral indices and in situ measured Chlorophyll-a concentration.
Indicesr PearsonAdjusted R2
1NDVI0.760.56
2NDTI0.190.04
3FAI−0.780.59
4SABI−0.940.87
5GNDVI0.820.65
6EVSI−0.330.08
7EVI0.460.18
8MNDWI−0.690.46
9GCI0.810.65
Table 6. Algal blooms during the last 28 years in Lake Villarrica.
YearReported BloomsAlgae SpeciesGroupLake Sector
1993Summer FebruaryMicrocystis aeruginosaCyanophyceaeSouth, South-west
2005Spring September 25-CholophyceaeSouth Ribera
2008Summer 12 January, Spring 6 NovemberFragilaria sp.BacillariophyceaeNorth Ribera
2010Summer 25 January, Autumn 26 AprilDolichospermum sp.CyanophyceaeVillarrica-Pucón shore
2011Summer 10 JanuaryDolichospermum sp.CyanophyceaeLa Poza and Pucón
2012Summer 24 FebruaryDolichospermum sp.CyanophyceaePucón, La Poza
2014Summer 25 JanuaryAnabaena spiroidesCyanophyceaePucón, La Poza
2015Summer 19 JanuaryDolichospermum sp.CyanophyceaeCenter
2016Summer 2 JanuaryDolichospermum sp.CyanophyceaeSouth shore
2017Summer 10 FebruarySpirogyra sp.CharophyceaeSouth shore
2018Summer 25 January, Autumn 25 MayDolichospermum sp.CyanophyceaeSouth
2019None reported---
2020Summer 19 JanuaryDolichospermum sp.CyanophyceaeVillarrica pelagial
2021None reported---
Based on information from reports generated by Vigilantes del Lago.
Disclaimer/Publisher’s Note: The statements, opinions and data contained in all publications are solely those of the individual author(s) and contributor(s) and not of MDPI and/or the editor(s). MDPI and/or the editor(s) disclaim responsibility for any injury to people or property resulting from any ideas, methods, instructions or products referred to in the content.