1. Introduction
Japan’s offshore area has a vast community development of floating macroalgae [
1]. Some of these macroalgae drifted from the East China Sea [
2]. Field observation is conducted regularly to grasp its distribution [
3,
4], but this approach cannot facilitate a broad understanding of the floating macroalgae’s spatial and temporal changes.
The deployment of Earth observation satellites has promoted the growth of remote sensing analysis [
5]. It enables the analysis of short- and long-term changes through consistent coverage of the region of interest, such as those related to agriculture, meteorology, mapping, and media. Moreover, advancements in remote sensing technology allow satellite sensors to capture regions of the electromagnetic spectrum (multiple spectral bands).
The continuous development of remote sensing technology has refined satellite remote sensing, as in the case of the Sentinel-2 satellites. These are managed under the Copernicus program of the European Space Agency and were launched in 2015 and 2017 [
6].
They are multispectral instruments (visible, infrared, and shortwave infrared (SWIR)) aiming for continuous Earth observation with high spatial resolutions (10 m, 20 m, and 60 m). In addition, their high temporal resolution of ten to five days enables the monitoring of short-term temporal changes [
7].
Several recent concepts for detecting floating macroalgae use images consisting of multiple spectral bands. The normalized difference vegetation index (NDVI) is an approach to vegetation mapping [
8]. This index takes advantage of vegetation forms’ high absorption of the red band. The normalized difference water index (NDWI) detects vegetation liquid water [
9]. Compared with the NDVI, this index is less sensitive to atmospheric effects and retains background soil. The floating algae index (FAI) specifically detects floating algae in open water bodies [
10]. This index outperforms the NDVI regardless of environmental and observation conditions.
The thresholding method is used to detect floating macroalgae in satellite images processed using the abovementioned indexes. This approach typically takes into account a grayscale or color image and generates a binary image that represents its segmentation. The binary result represents a categorization of background and foreground values. Originally, a fixed threshold is manually determined to distinguish floating macroalgae’s pixels. However, this practice has a low reproducibility for a large number of images and heavily depends on the expertise of decision makers.
Therefore, researchers have recently applied adaptive thresholding. This method determines certain threshold values by using defined computation. Particularly, a distinct threshold value can be established depending on the collective pixels’ value for the given image. Hence, the drawback of subjectivity in traditional fixed thresholding can be overcome by utilizing an adaptive thresholding method.
Song et al. [
11] examined the use of FAI images of Landsat-8 satellite data to detect marine debris in the Seto Inland Sea area. Otsu’s method [
12] defines appropriate thresholds automatically. Cao et al. [
13] discussed the detection of floating macroalgae in the Dongting Lake area by using the Moderate-Resolution Imaging Spectroradiometer (MODIS) and Landsat-7 satellite data. The results show that the application of adaptive thresholding to FAI images is better than other floating macroalgae detection indexes.
Several studies have reported the relevance of adaptive thresholding for image segmentation in open water bodies. Xu et al. [
14] applied Otsu’s method on NDVI images of MODIS and Landsat-8 satellite data in the Yellow Sea area. Garcia et al. [
15] proposed the exclusion method for the automatic detection of floating macroalgae in the Yellow Sea area. This method overcame the irregular frequency distributions resulting from FAI images of MODIS satellite data. Taniguchi et al. [
16] analyzed the floating macroalgae distribution in the East China Sea and West Japan areas using Global Change Observation Mission C (GCOM-C) satellite data. The coverage of floating macroalgae can be determined through linear unmixing [
15,
17].
High-spatial-resolution data are important for the detection of floating macroalgae. Kislik et al. [
18] evaluated Sentinel-2 satellite data to detect floating macroalgae in the small water bodies of reservoirs in the Northern California area. Mora-Soto et al. [
19], Pu et al. [
20], Liu et al. [
21], and Yan et al. [
22] examined the applicability of various floating macroalgae detection indexes to the detection of floating macroalgae in inland and closed water bodies using Sentinel-2 satellite data.
Researchers have applied adaptive thresholding to high-spatial-resolution data. Cao et al. [
23] used Sentinel-2 satellite data to detect floating macroalgae in the Hulun Lake area. The combination of images from high-spatial-resolution satellite data and Otsu’s method excels in comparison with satellite data with various spatial resolutions. Finally, Zhang et al. [
24] used Otsu’s method to detect floating macroalgae in the South Yellow Sea area using Landsat-8 and Sentinel-2 satellite data. FAI images of Sentinel-2 satellite data contain only a small number of environmental factors, such as thin clouds and sun glint, so this index exhibits high accuracy and stable results.
The abovementioned studies analyzed the detection of floating macroalgae in diverse scenarios. In the same way, related studies have confirmed the importance of adaptive thresholding for FAI images. Moreover, the utilization of satellite data with high spatial resolutions, such as Sentinel-2 satellite data, has been discussed.
However, prior studies have emphasized the specific floating macroalgae detection index and adaptive thresholding method. These were considerably inadequate to demonstrate the significance of the specific adaptive thresholding method toward a floating macroalgae detection index. Similarly, recent studies have not been able to establish the broad applicability of high-spatial-resolution satellite data, namely Sentinel-2 satellite data [
18,
19]. The aforementioned studies have been limited to case studies in inland and closed water bodies. Hence, no study has carried out the detection of floating macroalgae in open water bodies by using high-spatial-resolution satellite data [
18,
19].
Therefore, the objective of this study is to explore the automatic detection method by comparing the practicability of different adaptive thresholding methods for Sentinel-2 satellite data with a 10 m spatial resolution. This study compares conventional floating macroalgae detection indexes, namely, the NDVI [
8], NDWI [
9], and FAI [
10]. By combining these methods with developed adaptive thresholding methods, such as Otsu’s [
11,
12,
25], exclusion [
15,
16,
17], and standard deviation methods, we attempt to objectively identify the floating macroalgae’s pixels and other pixels. Finally, the explored automatic detection is foreseen to aid the fishery activities in the Kagoshima area.
2. Materials and Methods
This study determined the best automatic detection method for floating macroalgae using Sentinel-2 satellite data. In accordance with the temporal range of yellowtail larvae in Kagoshima, Japan [
3,
4], Sentinel-2 satellite data were downloaded from the United States Geological Survey EarthExplorer [
26]. The study procedure is shown in
Figure 1.
Initially, viable Sentinel-2 satellite data were acquired through atmospheric correction. We calculated the ocean color index and applied adaptive thresholding. Finally, the occurrence of floating macroalgae was detected, and their cross-sectional areas were estimated.
2.1. Sentinel-2 Satellite Data Collection and Atmospheric Correction
Worldwide images were generated from Sentinel-2 satellite in the defined 110 × 110 km
2 data tile. These were captured in a five-day cycle; thus, the data focusing on a certain region will have its next entry on a five-day basis. Therefore, the condition of an image depends heavily on the environmental condition on the available dates. Presently, we only extracted the images in the region of interest with less than 50% cloud coverage. This study collected these based on human eyes’ examination toward the Sentinel-2 browser satellite data [
4].
For the case of technical specification, Sentinel-2 satellite data are in the native form of level-1C (L1C) top-of-atmosphere (TOA) products. Thus, atmospheric correction should be applied to make them operational. In this study, the Sentinel-2 TOA L1C data were processed using Sen2Cor [
27,
28]. Sen2Cor generates level-2A (L2A) bottom-of-atmosphere images with 10 m, 20 m, and 60 m spatial resolutions following the technical specifications in
Table 1 [
6].
Lastly, this study focused mainly on the highest resolution possible (10 m). In addition, the digital numbers of Sentinel-2 L2A were divided by 10,000 according to the conversion formula in the L2A product format specification [
6].
2.2. Overview of Floating Macroalgae from Field Observation Data
Field observation data were obtained to gain an overview of the distribution of floating macroalgae in Kagoshima, Japan [
3,
4]. Subsequently, visible floating macroalgae on certain days could be observed in the browser of Sentinel-2 satellite data [
4]. The Sentinel-2 satellite data of the visible floating macroalgae toward the datetime of the yellowtail larva information in the Kagoshima area are shown in
Table 2. As mentioned in
Section 2.1, the Sentinel-2 satellite cycled every five days; thus, the captured data may not fall particularly on the same day with the datetime of field observation data [
3]. In this context, six images from different dates were collected based on the visible occurrence of floating macroalgae despite the environmental factors [
4,
26].
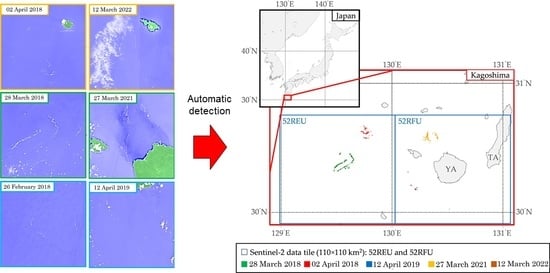
Additionally,
Figure 2 presents visualizations of floating macroalgae from the field observation data from 2017 to 2022. Field observation data from 2017 to 2022 [
3] had ascertained that floating macroalgae were scattered in discrete locations, including, but not limited to, the southern side of Kagoshima, the southern side of Yakushima, and the East China Sea area. A more specific description toward the occurrence of floating macroalgae was illustrated by referring to the Sentinel Hub EO Browser [
4].
2.3. Calculation of Floating Macroalgae Detection Index
Bands were combined as a floating macroalgae detection index to grasp the occurrence of floating macroalgae. We adopted the NDVI, NDWI, and FAI to emphasize the pixels of floating macroalgae and to separate them from the other pixels.
Specifically, with the use of the bands and spectra included in the Sentinel-2 satellite data, the NDVI (
), NDWI (
), and FAI (
) were calculated as follows [
8,
9,
10]:
where
is the atmospheric-corrected reflectance;
is the wavelength (nm);
,
,
, and
are the reflectances of the near-infrared (NIR; bands 8 or 8a), red (band 4), green (band 3), and SWIR (bands 11 and 12) bands, respectively. SWIR reflectance is initially unavailable for 10 m spatial-resolution data, so we defined
using 20 m spatial-resolution data to acquire the nearest-point interpolation (FAI-a).
Alternatively, we assumed the
value to be zero (FAI-b) because its value tends to be lower than those of other bands. The 20 m spatial-resolution
was treated as shown in
Figure 3.
Furthermore,
Figure 4 presents an illustration of the floating macroalgae detection index on a Sentinel-2 data tile (110 × 110 km
2). Herein, images were sampled from three different dates: 27 March 2021, 22 April 2019, and 28 March 2017. We specified a 4 × 4 km
2 sub-area that was expected to contain floating macroalgae as marked in the red rectangle. A dark visualization can be seen from the image of the true-color image (TCI).
After applying the assorted detection index, we can distinguish the existence of floating macroalgae from the sea water background. A similar shape of occurrence of floating macroalgae can be briefly seen from all indexes. Subsequently, the detailed spatial coverage area of floating macroalgae was further estimated by using the thresholding method.
2.4. Adaptive Thresholding Methods
Adaptive thresholding is the core of the automatic detection of floating macroalgae pixels. This study determined detection thresholds for floating macroalgae in images using Otsu’s method [
11,
12,
25], the exclusion method [
15,
16,
17], and the standard deviation method to label images that likely contain floating macroalgae pixels.
2.4.1. Otsu’s Method
This method is broadly adopted for adaptive thresholding. It specifically determines the threshold between two peaks in the frequency distribution of an image [
25]. Therefore, determining the threshold of a homogeneous image, such as one composed mainly of seawater, is challenging, as shown in
Figure 5.
Furthermore, we applied Otsu’s method to small parts of image sub-areas.
Figure 6 visualizes the splitting of an image and handling of sub-areas that likely contain floating macroalgae. Each sub-area was iterated horizontally and vertically and then overlapped with each other at a magnitude of 10% of the size of each sub-area. Any area where Otsu’s threshold fell within the width of one standard deviation (1σ) was disregarded.
In conclusion, Otsu’s method was unsuitable for automatic detection in an entire image in our study. Therefore, we applied Otsu’s method to an independent sub-area of an image to detect the anticipated floating macroalgae pixels. With the observed area in a rectangular form (1:1), we propose two scenarios of sub-area iteration, namely, 25% and 50% of the image length.
2.4.2. Exclusion Method
The details of this method have been reported in previous studies [
15,
16,
17]. In this study, we set 99.99% as the minimum exclusion threshold [
15] in the frequency distribution of a floating macroalgae index. This method omits pixels located within less than 0.01% of the cumulative frequency and then establishes the threshold using the distance reflected between the 0.01% point and the nearest peak in the frequency distribution. The settled threshold is visualized in
Figure 7.
2.4.3. Standard Deviation Method
Unlike the abovementioned methods, this approach particularly provides a straightforward conclusion regarding the frequency distribution of a floating macroalgae index. This method defines the threshold using the three-sigma rule, that is, three standard deviations from the mean, by assuming a normal distribution for the reflectance’s frequency, as shown in
Figure 7.
2.5. Estimation of Floating Macroalgae Area
The coverage of floating macroalgae was calculated through linear unmixing [
15,
16,
17]. After image segmentation (
Section 2.4), the coverage of floating macroalgae was defined to be relative to the value of the defined floating macroalgae index. A pixel containing the maximum value of an index was assumed to have 100% coverage, and a pixel containing the threshold value was assumed to cover 0%. We calculated the relative coverage area (
) of a pixel, which was scaled from the pixel area of Sentinel-2 satellite data, as follows:
where
is the value of the given floating macroalgae index (NDVI, NDWI, and FAI);
is the defined threshold of each detection method (Otsu’s, exclusion, and standard deviation methods);
is the maximum value of
;
is the pixel area of Sentinel-2 satellite data with 10 m and 20 m spatial resolutions (100 m
2 and 400 m
2, respectively); the total of
is the spatial coverage of floating macroalgae.
3. Results and Discussion
3.1. Characteristics of Results from Floating Macroalgae Detection Indexes
We used adaptive thresholding to detect floating macroalgae in Sentinel-2 satellite data with a 10 m spatial resolution. According to
Figure 2, we observed three days anticipated to majorly contain floating macroalgae, namely, 28 March 2018, 2 April 2018, and 12 March 2022 [
3].
The thresholds used to distinguish floating macroalgae in the indexed images (NDVI, NDWI, and FAI) were clarified using the following:
Otsu’s method based on an iteration of a 25% sub-area of an image (OT25);
Otsu’s method based on an iteration of a 50% sub-area of an image (OT50);
Exclusion method based on 100% of the area of an image (EM);
Standard deviation method based on 100% of the area of an image (SD).
The estimated spatial areas of floating macroalgae obtained from the various floating macroalgae detection indexes are shown in
Figure 8a.
In this section, we present the estimated floating macroalgae area using the combination of prevalent approaches despite the absence of a literal comparison between Sentinel-2 satellite data and actual observations. These results were then compared by observing the standard deviation of the estimated area throughout diverse detection indexes and adaptive thresholding methods. This comparison aimed to examine the most stable floating macroalgae detection index for automatic detection purposes.
The images of NDVI and NDWI show high variances in their estimated areas, depending on the thresholding method. On 2 April 2018 and 12 March 2022, NDVI (20-m) and NDVI (10-m) images suggest a moderate distribution with a 41,000–83,000 m2 deviation from the average estimated area. Additionally, the deviation range is broader by 158,000–206,000 m2 on 28 March 2018. In the same manner, NDWI (20-m) and NDWI (10-m) images indicate an extensive dispersion of 168,000–545,000 m2 on all observed dates.
Finally, FAI(20-m) and FAI(10-m) images show stable estimations of the spatial area compared with NDVI and NDWI. Throughout 28 March 2018, the deviation range is 27,000–50,000 m
2; meanwhile, a modest variance with a 11,000–23,000 m
2 deviation can be observed on 2 April 2018 and 12 March 2022. In this context, its fluctuation is insignificant regardless of the thresholding method. Specifically, the deficiency in Otsu’s method (
Section 2.4.1) can be overcome through detection partition into sub-areas, such as OT25 and OT50.
3.2. Significant Method for Automatic Detection of Floating Macroalgae
The FAI is a suitable standardized method for detecting floating macroalgae [
11,
13,
15]. The calculation of the FAI can be natively determined using the available bands in Sentinel-2 satellite data with a 20 m spatial resolution (FAI(20-m)), namely, red (band 4), NIR (band 8A), and SWIR (band 11). Therefore, FAI(20-m) is legitimate. The spatial areas estimated by FAI(10-m) and FAI2(10-m) are similar to that by FAI(20-m). Hence, we confirm the applicability of the defined FAI calculation using Sentinel-2 data with a 10 m spatial resolution.
Adaptive thresholding using OT50 fails for NDVI and NDWI on 12 March 2022. Moreover, on the day containing the largest number of floating macroalgae (28 March 2018), the floating macroalgae areas of the FAI-b images thresholded using Otsu’s method and the standard deviation method show similar patterns, having an absolute error of less than 2000 m
2 (
Figure 8b). Thus, the standard deviation method underestimates the spatial area, similar to Otsu’s method on the other indexes. Otsu’s method is typically adopted for automatic thresholding under diverse environmental conditions [
25]. This method searches for a single threshold to divide an image into two zones. Therefore, an optimized threshold is obtained from a histogram with a bimodal distribution. These confirm its underestimated spatial area; Otsu’s method establishes the threshold immediately after the first valley in the frequency distribution.
The results of the exclusion method show overestimated spatial areas for all indexes. This method requires a pixel count of low FAI values [
15,
16,
17]. The results confirm the dependence of the exclusion method on the reflectance frequency distribution of an image. Furthermore, the standard deviation method results in identical floating macroalgae areas for the indexes because it has a more straightforward measure than the other adaptive thresholding methods. Therefore, OT25 and SD are significant adaptive thresholding methods because of their low absolute errors and consistent patterns across all days.
3.3. Significance of Automatic Detection of Floating Macroalgae versus Field Observation Data
In this section, we compare the estimated floating macroalgae areas and the average numbers of macroalgae patches from field observation, as shown in
Figure 9.
Herein, field observation did not record the actual spatial distributions of the floating macroalgae patches, so we conducted the comparison based on the average numbers of macroalgae patches; that is, the actual spatial distributions were not considered. Finally, a positive correlation can be justified.
Despite the general underestimation (excluding the SD method on 2 April 2018), the estimated floating macroalgae spatial areas increase toward the reported floating macroalgae patches around the observed area. Further, we attempted to portray the distribution of floating macroalgae in the Kagoshima area using OT25, as illustrated in
Figure 10. The spatial coverage of the floating macroalgae varies depending on the period. These present the applicability of OT25 for automatic detection and for grasping the spatial changes in the floating macroalgae in the Kagoshima area.
Similar to a related study [
16], this study does not differentiate between microalgae, macroalgae, and emergent aquatic vegetation. Meanwhile, this study focused on automatic detection of floating macroalgae that continuously flow in open water bodies. Moreover, an emergent aquatic vegetation would likely remain in the same location for an extensive period [
29]; thus, the high-FAI pixels found in this study are assumed to not contain any emergent aquatic vegetation. Hence, we assume that macroalgae account for most of the retrieved quantities of floating algae. Finally, we evaluated the feasibility of the automatic detection method of floating macroalgae.
Besides the aforementioned practicability, the literal comparison between Sentinel-2 satellite data and actual observations in the Kagoshima area is not analyzed, due to the unavailability of the actual observation products. This absence can be overcome with regular monitoring toward a specific region with a controlled environment and later compared with the available Sentilel-2 satellite data. Consequently, the cost of data collection will grow exponentially; however, the proposed automatic detection method can be accurately validated.
Similarly, the movement trajectory of floating macroalgae is not discussed in this study. While the utilized Sentinel-2 satellite data do not contain consecutive images, the movement trajectory of each occurrence is varied. An extensive material and mechanism are required to further yield the movement trajectory and anticipate the course of floating macroalgae.
Despite the interest to investigate the movement and trajectory of floating algae, it is currently impractical to grasp the movement trajectory of rapidly shifted floating macroalgae because of strong ocean current, while Sentinel-2 satellite data are only obtainable on a five-days basis.
4. Conclusions
Extensive floating macroalgae have been reported in the Kagoshima area. Accessible Earth observation satellite data have enabled remote sensing analysis to overcome the limited scope of field observation. Several indexes, such as the NDVI, NDWI, and FAI, have been developed to process these data and distinguish floating macroalgae from other objects. Moreover, satellite data with a high spatial resolution, such as Sentinel-2 satellite data, are needed to detect floating macroalgae. This study proposes the automatic detection of floating macroalgae through adaptive thresholding using Sentinel-2 satellite data with a 10 m spatial resolution.
Otsu’s method, the exclusion method, and the standard deviation method were applied to NDVI, NDWI, and FAI images. The results from FAI were stable regardless of the adaptive thresholding method. Moreover, a comparison of the FAI images of Sentinel-2 satellite data with 20 m (native SWIR reflectance) and 10 m (assumed SWIR reflectance) spatial resolutions resulted in an appropriate correlation in images with large quantities of floating macroalgae but an underestimated correlation in images with small quantities of floating macroalgae.
The findings demonstrated the stability of FAI throughout various thresholding methods. Using the Sentinel-2 satellite data with 10 m and 20 m spatial resolutions, the estimated floating macroalgae area based on FAI were dispersed less than half compared to NDVI and NDWI. Moreover, the defined FAI-b yielded the lowest absolute error value to FAI(20-m) in comparison with FAI-a. We can also justify the advantages of the newly defined standard deviation method, although the FAI image treated with this method uniformly underestimated the floating macroalgae coverage, as shown by a comparison between said FAI images and field observation data.
Adaptive thresholding using OT50 fails for NDVI and NDWI on 12 March 2022. More-over, on the day containing the largest amount of floating macroalgae (28 March 2018), the floating macroalgae areas of the FAI-b images thresholded using Otsu’s method and the standard deviation method show similar patterns, having an absolute error of less than 2000 m2.
Finally, this study has explored the advantageous automatic detection method of floating macroalgae in the Kagoshima area. However, further development is considered necessary to overcome limitations found in this study. The application in this study is restricted to Sentinel-2 imagery with limited environmental factors. Detecting floating macroalgae and excluding unusable data by removing environmental obstructions, such as intense cloud masking and sun glint correction [
30], are future tasks. Subsequently, a self-regulating mechanism to select proper images is essential for wider data collection and vast application of the proposed method. Finally, with further development, the explored automatic detection method is foreseen to strengthen technology-aided fishery activities in Kagoshima area.


 ,
, 


