Article

Reconstructing Digital Terrain Models from ArcticDEM and WorldView-2 Imagery in Livengood, Alaska

1
Department of Geography, The Ohio State University, Columbus, OH 43210, USA
2
Environmental Sciences Graduate Program, The Ohio State University, Columbus, OH 43210, USA
*
Author to whom correspondence should be addressed.
Remote Sens. 2023, 15(8), 2061; https://doi.org/10.3390/rs15082061
Submission received: 14 March 2023 / Revised: 4 April 2023 / Accepted: 11 April 2023 / Published: 13 April 2023

Abstract

:
ArcticDEM provides the public with an unprecedented opportunity to access very high-spatial resolution digital elevation models (DEMs) covering the pan-Arctic surfaces. As it is generated from stereo-pairs of optical satellite imagery, ArcticDEM represents a mixture of a digital surface model (DSM) over a non-ground areas and digital terrain model (DTM) at bare grounds. Reconstructing DTM from ArcticDEM is thus needed in studies requiring bare ground elevation, such as modeling hydrological processes, tracking surface change dynamics, and estimating vegetation canopy height and associated forest attributes. Here we proposed an automated approach for estimating DTM from ArcticDEM in two steps: (1) identifying ground pixels from WorldView-2 imagery using a Gaussian mixture model (GMM) with local refinement by morphological operation, and (2) generating a continuous DTM surface using ArcticDEMs at ground locations and spatial interpolation methods (ordinary kriging (OK) and natural neighbor (NN)). We evaluated our method at three forested study sites characterized by different canopy cover and topographic conditions in Livengood, Alaska, where airborne lidar data is available for validation. Our results demonstrate that (1) the proposed ground identification method can effectively identify ground pixels with much lower root mean square errors (RMSEs) (<0.35 m) to the reference data than the comparative state-of-the-art approaches; (2) NN performs more robustly in DTM interpolation than OK; (3) the DTMs generated from NN interpolation with GMM-based ground masks decrease the RMSEs of ArcticDEM to 0.648 m, 1.677 m, and 0.521 m for Site-1, Site-2, and Site-3, respectively. This study provides a viable means of deriving high-resolution DTM from ArcticDEM that will be of great value to studies focusing on the Arctic ecosystems, forest change dynamics, and earth surface processes.

1. Introduction

Digital elevation models (DEMs) are 3D representations of the Earth’s surface that are fundamental to many scientific studies, including topographic analysis [1,2], tracking surface deformation [3,4], and detecting soil volume changes triggered by geohazards [5,6]. DEM can be further divided into digital terrain model (DTM) and digital surface model (DSM), with the former excluding any above-ground objects and reflecting only bare ground elevation information [7]. The differences between DSMs and DTMs deliver critical information for monitoring changes in canopy height (canopy height model, CHM) [8,9], glaciers/snow cover depth [10,11] or urban building damages caused by earthquakes or floods [12,13].
ArcticDEM is a time-dependent collection of high-resolution DEMs generated from very-high-resolution (meter-to-submeter) optical stereoscopy acquired from WorldView (WV)-1/2/3 and GeoEye-1 satellites over all land areas north of 60°N, i.e., the pan-Arctic region [14]. ArcticDEM has been used in scientific investigations about surface change dynamics of glaciers [15], deposit thickness of volcanic eruptions [16,17], vegetation biomass [18], and river surface heights [19]. However, as a DEM product generated from optical stereoscopy, ArcticDEM mainly reflects elevation information at the surface top of non-ground objects (i.e., DSMs) rather than bare ground elevation (i.e., DTMs) in vegetated areas. For this reason, its current applications in DTM- or CHM-based studies, such as ecological analysis and hydrological modeling, remain under-explored. Recently, Meddens et al. (2018) developed a 5 m resolution CHM called local ArcticCHM from ArcticDEM using a random forest (RF) regression model calibrated by airborne lidar-derived canopy height for three study sites in Alaska [8]. The estimated canopy height was then subtracted from the ArcticDEM to generate a 5 m resolution DTM called local ArcticDTM. While the local ArcticDTM achieves significant improvement over the ArcticDEM compared to lidar-derived DTM, their supervised modeling scheme is dependent on the availability of airborne lidar-derived canopy height. However, airborne lidar collections are not available in most Arctic regions. Therefore, it is necessary to develop a new approach to estimate DTM from ArcticDEM with no reliance on lidar data.
This study primarily focuses on optical stereoscopy based DTM estimation. In this context, numerous attempts have been made to estimate DTMs or normalized DSMs (i.e., DSM-DTM) directly from DSMs generated from optical stereoscopy. Techniques in this regard generally follow two steps: (1) ground/non-ground separation, and (2) DTM interpolation of non-ground areas based on identified ground observations. Previous studies have investigated several approaches for identifying ground/non-ground points. For instance, Xiao et al. (2019) located terrain points from WV-2/3 stereo images by adopting a cloth simulation filtering (CSF) algorithm [20], which was initially proposed by Zhang et al. (2016) in reconstructing DTMs from lidar point clouds [21]. A recent study [22] shows that CSF achieves higher accuracies in identifying ground areas from unmanned aerial vehicle-based point clouds than several other lidar-based point cloud filtering approaches, e.g., curvature-based multiscale curvature classification (MCC) [23], surface-based filtering (FUSION software, Version 4.40), and progressive triangulated irregular network (TIN)-based (LasTool software, Version 1.4) [24] methods. Perko et al. (2019) extended the multi-directional ground filtering method by Meng et al. (2009) [25] to a slope-dependent version (hereinafter referred to as MSD) for searching ground candidates from tri-stereo Pléiades images [26]. To outline the non-ground objects from WV-2 stereo images, Özcan et al. (2018) employed a morphologically based ground filtering method (hereinafter referred to as MBG) by segmenting small non-ground patches based on ‘seeds’ identified by a Canny edge detector, then progressively expanding these small segments until reaching clear boundaries [27]. MBG is found to outperform several commonly applied morphological filters, including simple morphological filters (SMRF) [28] and the filtering method embedded in gLiDAR software (https://github.com/translunar/glidar) [29], in separating non-ground objects from lidar-based DSMs [27]. Tian et al. (2014) used RF to classify the study region into different ground and non-ground classes based on multi-level texture features extracted from Cartosat-1 stereo images [30]. Noticeably, though indicating good capabilities in separating ground and non-ground observations, these ground filtering methods were mainly applied in urban scenarios. In addition, CSF [21], MSD [26], and MBG [27] were initially designed for lidar-based DTM generation. However, it is worth mentioning that in optical imagery, geometric occlusion [31] or low-contrast surfaces [14] largely prevent effective key-point matching and ground detection, especially under dense canopies. As a result, optical stereoscopy-derived DSMs only reflect elevation information about the top of canopies and fail to capture fine-scale details, in contrast to the lidar-derived counterparts [31]. Whether the above-mentioned lidar-based ground filtering techniques could achieve similar performance in extracting reliable ground points from optical imagery in forested regions remains to be examined. After ground identification, previous studies often adopted one or several spatial interpolation techniques on regional DTM generation based on the identified ground points, such as inverse distance weighting [32,33,34,35], kriging [32,36], spline [36,37,38], TIN-based methods [32,36], and image inpainting [27]. Although the performances of spatial interpolation methods on DTM interpolation have been examined in many studies [34,36,37,39,40], most of the investigations were primarily based on lidar data. How they perform in optical stereoscopy based DTM interpolation remains unclear.
The objectives of this study are twofold. Firstly, we develop an automated ground identification approach by integrating an unsupervised and probabilistic clustering method, namely a Gaussian mixture model, with a locally adjusted morphological operation to pinpoint high-confidence ground pixels from ArcticDEMs at three vegetated study sites characterized by different canopy cover and topographic conditions in Livengood, Alaska. By doing so, we aim to evaluate and compare the capability of the proposed algorithm in correctly identifying ground observations under different scenarios with the three above-mentioned filtering-based methods, i.e., CSF, MSD, and MBG. Secondly, we also fully assess the robustness and consistency of two commonly adopted spatial interpolation techniques on optical stereoscopy based DTM interpolation. The novelty of this study lies in that it is the first time to (1) estimate DTMs from ArcticDEM in forested regions with no reliance on lidar observations, and (2) introduce a ground identification model framework that combines a clustering technique (GMM) with uncertainty information encoded with a locally adjusted morphological operation for improving the quality of the extracted ground masks. Though designed for ArcticDEM, the proposed model framework relies on optical stereoscopy and its generated DSMs and hence could be transferred to any other forested regions besides the Arctic region.

2. Methodology and Materials

2.1. Study Sites and Data

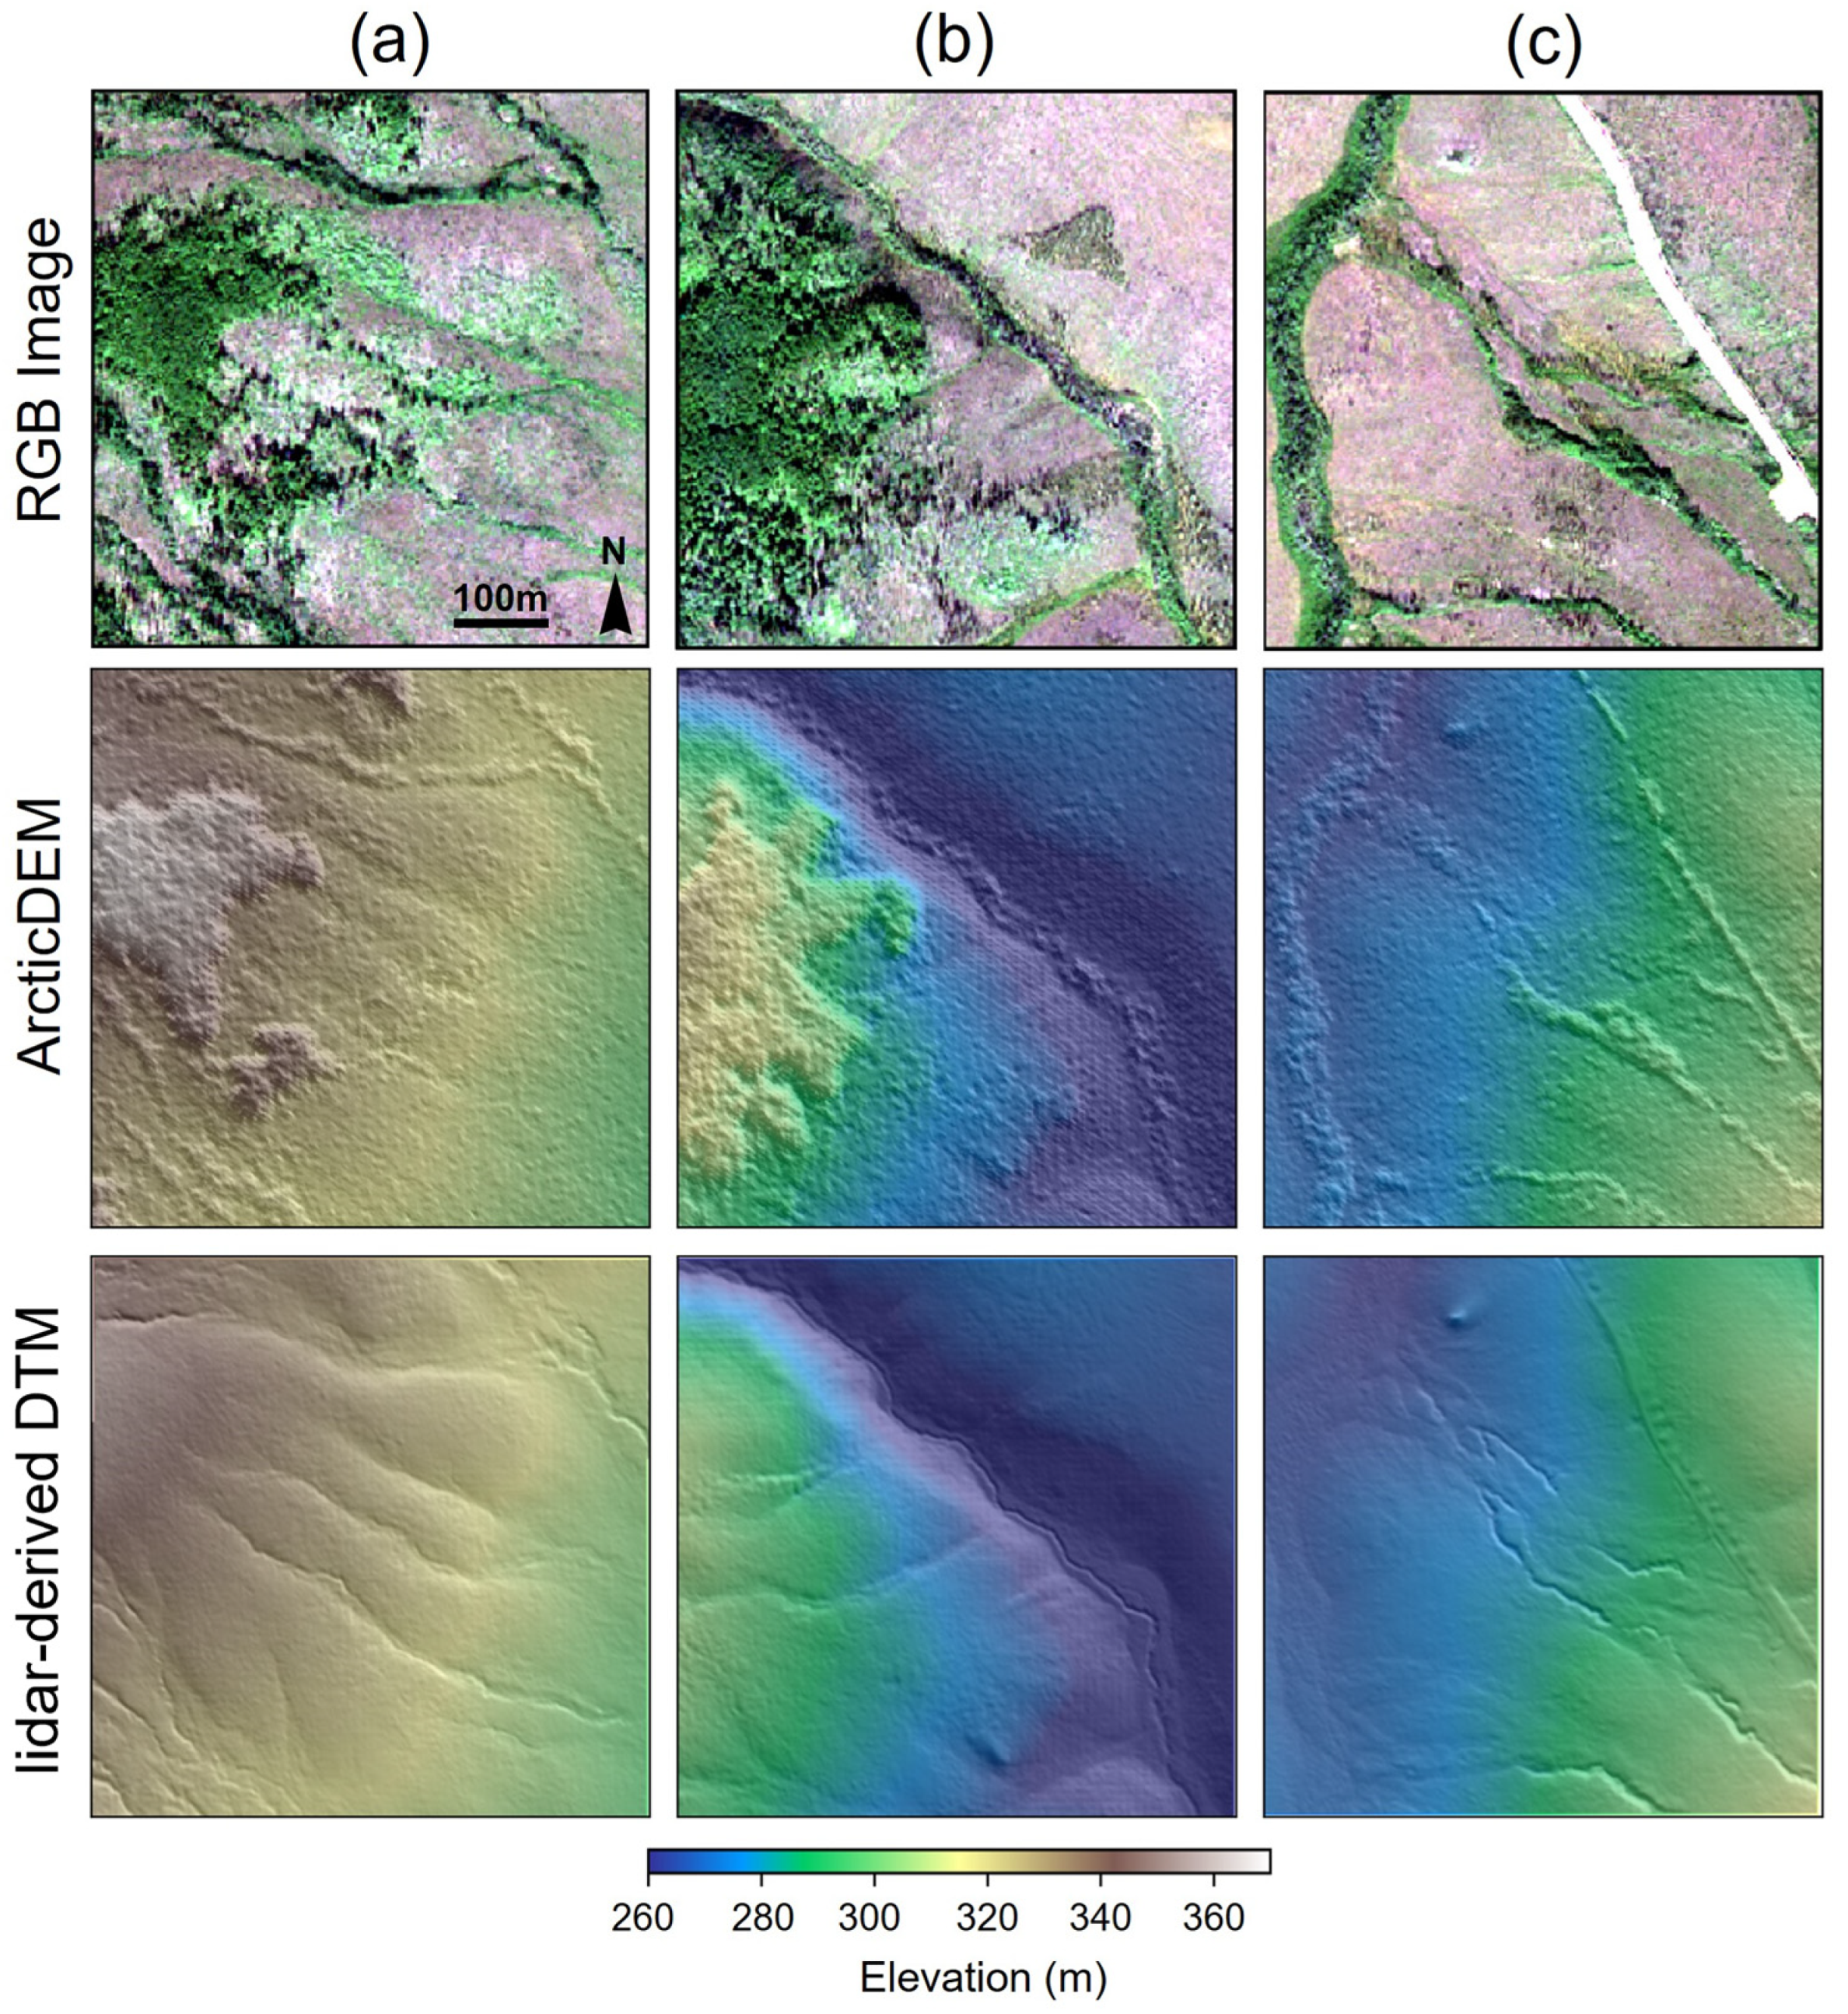
Our study sites (Site-1, Site-2, Site-3) are located in the forested landscapes of Livengood, Alaska (Figure 1), covering an area of 360,000 m2 individually. Vegetation compositions of these sites are characterized by a similar mixture of white (Picea glauca), black spruce (Betula neoalaskana), and deciduous forests such as birch (Betula neoalaskana) and aspen (Populus tremuloides) [41] (Alaska Vegetation and Wetland Composite map, accessed on 1 February 2023). The three study sites have varying levels of canopy cover densities: low at Site-3, medium at Site-1, and high at Site-2 with a large forest patch, with elevations ranging from 296–364 m (Site-1) and 245–327 m (Site-2) to 260–317 m (Site-3) above sea level, respectively. Noticeably, there exists a drastic elevation change in the midst of Site-2 caused by river incision (Figure 1 and Figure 2). These site distinctions provide a good testbed for understanding the performance of DTM prediction algorithms under different topographic and canopy cover conditions.
ArcticDEM products include 2 m resolution ArcticDEM strips and 5 m resolution ArcticDEM tiles mosaicked from the best-quality pixels in ArcticDEM strip files [14,42]. This study used a 2 m ArcticDEM strip generated from a stereo-pair of cloud-free WV-2 satellite imagery acquired in June 2016. In addition to ArcticDEM, we also acquired one WV-2 image from the original stereo-pair to utilize the multispectral information in the following ground identification step. Moreover, given that the comparative method CSF is a point cloud-based filter [21], we requested the mask file encoding the information of points matched between the source optical stereo-images [14] for generating the point clouds for CSF filtering. The reference DTM (1 m) used for model evaluation was obtained from airborne laser scanning (ALS) point clouds collected in 2011 by a commercial lidar data vendor commissioned by the Alaska Division of Geological and Geophysical Surveys (Delivery 6 [43]). The lidar data have an average point density > 8 points per m2 with a vertical accuracy of 0.05 m root mean squared error (RMSE).
To ensure spatial consistency across different data sources, we applied a bilinear resampling approach to upscale lidar-derived DTM (1 m) and WV-2 multispectral bands (~1.92 m) to 2 m matching the ArcticDEM’s resolution and reprojected all data sources (via QGIS) to EPSG: 32606 (WGS84/UTM zone 6N). It could be observed that the topography of the ArcticDEM has been greatly affected by vegetation canopies at all study sites (Figure 2). We also noticed a clearly systematic mismatch (>8 m vertical difference) between ArcticDEMs and the lidar-derived reference DTMs. To offset this mismatch, we used the extracted high-confidence pseudo-ground pixels (pseudo-ground cluster refined by both cluster membership probability > 0.9 and morphological erosion, Section 2.2.1) as a base to co-register ArcticDEMs and lidar-derived DTMs via a point cloud alignment algorithm named iterative closest point [44]. This operation reduces the original RMSEs (8.73, 8.93, 9.04 m) of the pseudo-ground pixels to 0.13, 0.18, and 0.44 m at Site-1, -2, -3, respectively.
To evaluate the ground identification results, we determined the reference ground masks to be lidar-derived CHM ≤ 0.2 m for all study sites, where lidar-derived CHM was calculated as the difference between lidar-derived DSM and lidar-derived DTM. This 0.2 m threshold is very close to our DEM co-registration errors, which would make a negligible difference to our results, particularly given our focus on removing tall vegetation. It should be noted that we used the lidar-derived CHM ≤ 0.2 m to derive ground masks instead of referring to all lidar returns ≤ 0.2 m of the ground surface (i.e., z ≤ 0.2 m) for three reasons. First, CHM ≤ 0.2 m represents ground and low vegetation in the source lidar classification (Delivery 6 [43]) while z ≤ 0.2 m could include ground returns under tall vegetation canopy (as lidar points can penetrate canopies). Second, the reference ground masks were used to validate ground identification algorithms in locating ground points from ArcticDEM that are derived from optical (stereo) imagery but not lidar data. Unlike lidar, points matched between optical stereo images are usually limited to upper canopy surfaces in vegetated areas with no bare ground information revealed at these locations. This means that if there is tall vegetation at the same location, the lower points with z ≤ 0.2 m would not be captured by optical imagery. Third, the official guide of the lidar data (Delivery 6 [43]) states that lidar returns with z ≤ 0.2 m have a higher potential to be artifacts and could be misclassified as non-ground by the lidar filtering method, making them hardly distinguishable from the low vegetation.

2.2. Proposed Method

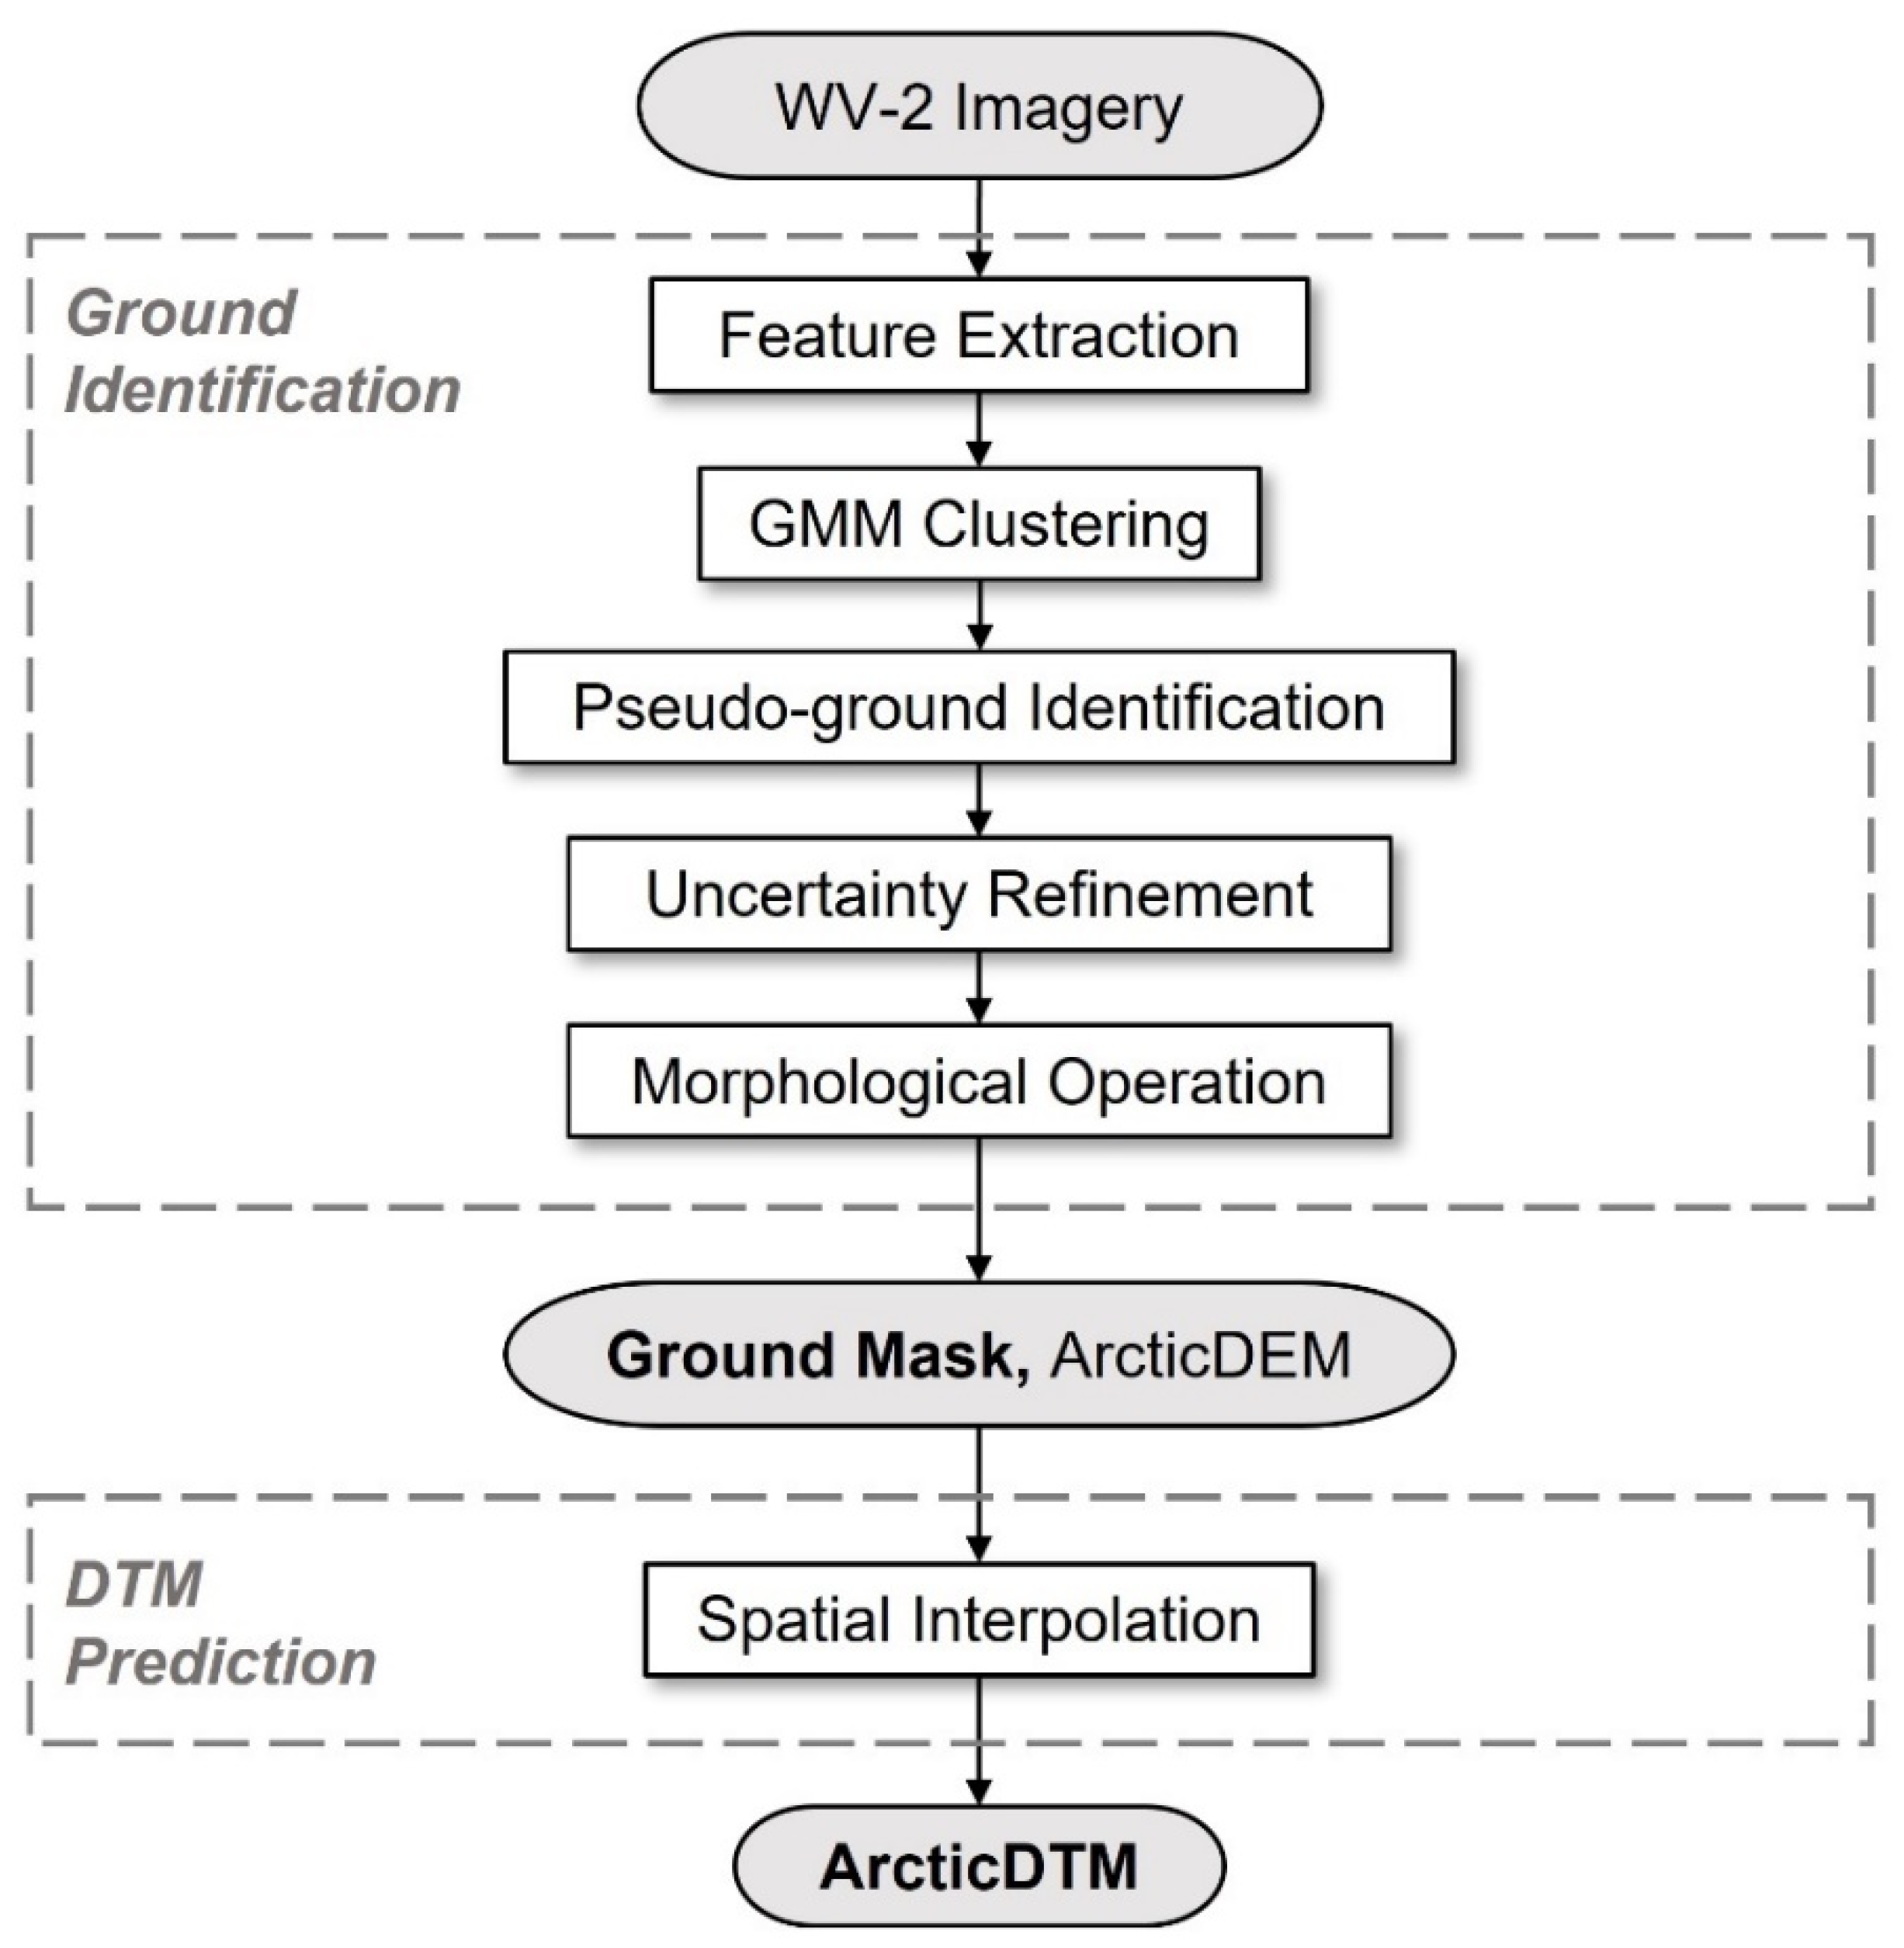
The proposed method consists of two main steps: (1) ground identification and (2) DTM interpolation. A flowchart of the proposed method is illustrated in Figure 3. First, we employed an unsupervised clustering model, i.e., Gaussian mixture model (GMM) [45], to detect the pseudo-ground cluster (ground candidates initially separated by GMM with no refinement) based on WV-2 multispectral imagery. The GMM-derived pseudo-ground pixels were then refined by clustering uncertainties and a locally adjusted morphological erosion operation. Second, we applied two spatial interpolation techniques to generate the regional DTM (i.e., ArcticDTM) based on the ground masks extracted from the ground identification step and the ArcticDEM data. The details of the methodology are elaborated on in the following subsections.

2.2.1. Ground Identification

The entire ground identification process is comprised of two steps: (1) pseudo-ground cluster identification and (2) ground mask refinement.
Step 1: pseudo-ground cluster identification: The pseudo-ground cluster is mainly identified from the clustering result by an unsupervised and probabilistic clustering algorithm, GMM [45], which groups pixels into different clusters characterized by similar within-cluster and distinctive between-cluster statistical patterns (i.e., mean and covariance matrix) in the feature space. GMM clustering can be considered a soft version of K-means with probabilistic meaning encoded [46], thereby enabling uncertainty quantification of the clustering results [47]. Compared to K-means, GMM is more flexible in modeling a full covariance matrix that determines the shape of the feature distribution associated with a specific cluster. Specifically, GMM models the likelihood of the observations as a mixture of Gaussian distributions [45,48], as shown in Equation (1):
p ( x | θ ) = i = 1 n k = 1 m π k N ( x i | μ k , Σ k ) ,
where  p ( x | θ )  denotes the joint conditional probability (likelihood) of all data observations  x  given parameter  θ . Here, n corresponds to the number of pixels in the imagery, m is the number of mixture components,  π k  represents the proportion of the k-th Gaussian component,  x i  is a feature vector of the i-th pixel with dimension  1 × f  where  f  stands for the number of input features, and  N ( x i | μ k , Σ k )  is the k-th Gaussian distribution at  x i  with mean  μ k  and covariance matrix  Σ k .
GMM clustering (using the GaussianMixture function in Python sklearn.mixture package [49]) was initialized by the K-means clustering, and the fitting of the Gaussian mixture or the parameter optimization step was then realized by the expectation-maximization algorithm [50]. Once the parameters ( π k ,   μ k , Σ k , Equation (1)) are determined, the cluster membership probability of the i-th observation ( x i ) corresponding to the k-th Gaussian component can be obtained by  π k N ( x i | μ k , Σ k ) , k = 1 m π k N ( x i | μ k , Σ k ) , which quantifies the clustering uncertainty. The clustering uncertainty encodes critical information for evaluating the confidence of each pixel’s clustering result. This information was then used for refining the initially identified pseudo-ground cluster in Step 2: ground mask refinement.
The entire process of GMM clustering is fully automatic for a given number of mixture components (i.e., # of clusters). The optimal number of clusters generally can be determined empirically by a visual inspection or automatically by employing a Bayesian information criterion that seeks a trade-off between maximizing the log-likelihood and reducing the model complexity [51].
To extract reliable ground points from the ArcticDEM, we needed features for GMM clustering that can differentiate ground from non-ground areas (e.g., vegetation). Given this, we then input the eight original multispectral bands (coastal, blue, green, yellow, red, red edge, and two near-infrared bands) of the WV-2 imagery and additionally calculated three vegetation-related indices based on the spectral bands, including two vegetation indices and one water index. Vegetation indices include the normalized difference vegetation index (NDVI) and modified soil-adjusted vegetation index (MSAVI) [52]. NDVI reflects healthy vegetation conditions and positively correlates with leaf density and plant biomass. MSAVI corrects the soil brightness impacts on the vegetation response. The normalized difference water index (NDWI) [53] captures the water components of the vegetation canopy. Before conducting GMM clustering, we standardized all input features to remove scale differences and applied principal component analysis to reduce feature dimensions to several dominant directions that explain over 95% of the total variation.
Based on the GMM clustering results, we then identified the pseudo-ground cluster with the lowest median NDVI and negative NDWI (i.e., NDWI < −0.1), given that bare soils reflect more strongly in the near-infrared band than visible bands. The adopted NDVI and NDWI criteria were intended to provide an automatic pseudo-ground cluster identification and were evaluated only at vegetated study sites similar to ours. For regions with different characteristics, the pseudo-ground cluster identification step may need some minor adjustments or is simply conducted by visual inspection.
Step 2: ground mask refinement: Due to the inherent spectral confusion between the ground and non-ground pixels (mainly vegetation), commission errors resulting from vegetation pixels can be found in the GMM-based pseudo-ground cluster. To reduce the number of remaining vegetation pixels in the ground masks, we refined the pseudo-ground cluster by removing pixels with low confidence or that were sparsely distributed. Low confidence pixels were discarded if their cluster membership probability was < λ * , where higher  λ *  removes more uncertain pseudo-ground pixels. Here we set  λ *  to be 0.8. Sparsely distributed pixels were removed through a morphological erosion operation with a 3 × 3 square-shaped structure element. On the other hand, considering that eliminating sparse pseudo-ground points may cause large errors in DTM estimation under high topographic variations, we skipped the morphological refinement at locations meeting two criteria: (1) low sampling density: the percentage of the remaining pseudo-ground pixels (after uncertainty refinement) within the local window is < γ * , and (2) high topographic variation: the local standard deviation of ArcticDEM is > σ * . Generally, higher  γ *  or lower  σ *  preserves more sparsely distributed pseudo-ground pixels. In this study, we used a 5 × 5 local window (i.e., 100 m2) and set  γ * σ *  to be 10%, 4 m, respectively, for all study sites.

2.2.2. DTM Interpolation

The ground masks derived from the ground identification methods provide pixel locations where ArcticDEM values can be regarded as DTM. Based on these pseudo-ground points, spatial interpolation techniques were employed to estimate the terrain information for the remaining non-ground areas and reconstruct regional DTMs. In this paper, we implemented and compared two spatial interpolation techniques for DTM generation, including ordinary kriging (OK) [54,55] and triangulation irregular network (TIN)-based natural neighbor (NN) [56]. Specifically, the two spatial interpolation methods are summarized as follows:
OK interpolates the unknowns based on the weighted average of known points. Specifically, the weight determination of OK considers both spatial dependence (variogram) and spatial closeness (location). Under the stationarity assumption of OK, the DEM residuals at ground pixels were generated first by subtracting the best-fit second-order trend surfaces (quadratic surfaces fitted on ArcticDEMs with the least residuals, using the lm function in the R stats package [57]) from the original ArcticDEMs. We then predicted the DEM residuals at non-ground locations based on 16 nearest pseudo-ground neighbors and the estimated semi-variogram (fitted by a spherical model, using the variofit function in the R geoR package [58]). Here we used 16 nearest neighbors to achieve a balance between interpolation accuracy and computational efficiency. The predicted DEM residual maps were then added back to the trend surfaces to produce the final DTMs (using the krige function in the R gstat package [57]).
TIN-based NN, known as “area-stealing”, also starts with building a Delaunay triangulation upon the known points, then separately constructing the first- and second-order Voronoi cells for each unknown location based on the triangle it locates and nearby triangles whose circumcircles enclose it. Here, the first-order and second-order Voronoi structures are formed globally by known points (using their middle lines) and locally by any unknown and its known neighbors, respectively. With the two layers of Voronoi networks, NN then interpolates the unknowns by a weighted average of these nearby triangle vertices whose weights are determined according to the area ratio of the second-order to the first-order Voronoi cells they are located at. A more detailed discussion on NN could be found in Tily and Brace (2006) [56]. NN ensures a first order of continuity (c1, the first derivatives of the interpolated surfaces are also continuous) everywhere except at the known locations. Benefiting from this higher level of continuity, NN usually provides more favorable and smoother predictions than linear (c0) and nearest-neighbor (discontinuous) interpolation. NN was implemented via the griddata function (MATLAB R2020b). Note that NN cannot estimate unknown points outside the TIN network. The predictions of these unknowns were then made by a linear extrapolation.

2.3. Evaluation and Comparison

2.3.1. Ground Identification

To evaluate the performance of the proposed method in extracting reliable ground pixels, we calculated several quantitative metrics between the predicted and reference ground masks (i.e., lidar-derived CHM ≤ 0.2 m) for the entire study region, including overall accuracy (OA), type I error (TI, or commission error), type II error (TII, or omission error), and F1 score [59]. True positive rate (TP) was additionally provided to supplement the explanation of the F1 score. Among all reported metrics, OA calculates the relative percentage of correctly identified ground (TP) and non-ground pixels (true negative rate, TN). TI (or commission errors) and TII (or omission errors) account for non-ground pixels misclassified as ground (false positive, FP) and ground pixels misclassified as non-ground (false negative, FN), respectively. F1 score denotes the harmonic mean of the user’s accuracy (i.e., 1-TI) and producer’s accuracy (i.e., 1-TII), which conveys a balance between TI and TII and weighs more on FN and FP in contrast to OA. Higher F1 scores are usually associated with lower classification errors. Considering that the elevation values of ground pixels are crucial for DTM estimation, we additionally assessed the vertical accuracy of the identified ground pixels by comparing their ArcticDEMs with the reference lidar-derived DTMs using error metrics listed in Section 2.3.2.
As a comparison to our GMM-based method, we also derived ground masks from K-means and three filtering-based ground identification algorithms, including CSF [21], MBG [27], and MSD [26]. It is worth noting that all these filtering-based methods work directly on optical-stereo-imagery-generated DSMs or point clouds. The three filtering-based ground identification algorithms were implemented using the source code available on the GitHub repositories (CSF: https://github.com/jianboqi/CSF (accessed on 1 October 2021); MSD: https://github.com/rolandperko/dsm2dtm (accessed on 1 October 2021); MBG: https://github.com/himmetozcan/Lidar_DTM_Segmentation (accessed on 1 October 2021)) with the parameter settings optimized by using the lidar-derived reference ground masks and visual inspection. More detailed descriptions of these methods and their parameter settings are provided in Appendix A.

2.3.2. DTM Interpolation

The evaluation of DTM interpolation was conducted by calculating accuracy metrics between the predicted ( y ^ ) and reference lidar-derived DTMs ( y ) in the entire study regions, including RMSE (Equation (2)), relative RMSE (rRMSE), mean absolute error (MAE, Equation (3)), and mean error (ME, Equation (4)). RMSE has been frequently adopted in evaluating the average model prediction errors. rRMSE is calculated as the ratio of RMSE to the range (difference between maximum and minimum DTMs) of the reference DTMs, i.e., 53.8, 56, 55.4 m for Site-1, -2, -3, respectively, which provides normalized RMSE to account for the scale difference of data. MAE and ME convey additional information regarding the average absolute errors and bias in the prediction. It is worth mentioning that since ME only sums the prediction errors regardless of its sign (positive or negative), it is generally smaller than MAE, and lower ME may not indicate better prediction. Nonetheless, large positive MEs could imply a highly positive deviation (overestimation) on average.
RMSE = 1 n i = 1 n ( y i ^ y i ) 2 ,
MAE = 1 n i = 1 n | y i ^ y i | ,
ME = 1 n i = 1 n ( y i ^ y i ) ,
where n is the number of observations,  y i ^ ,   y i  denote the estimated and observed values of the i-th pixel, respectively.

3. Results

3.1. Ground Mask Extraction

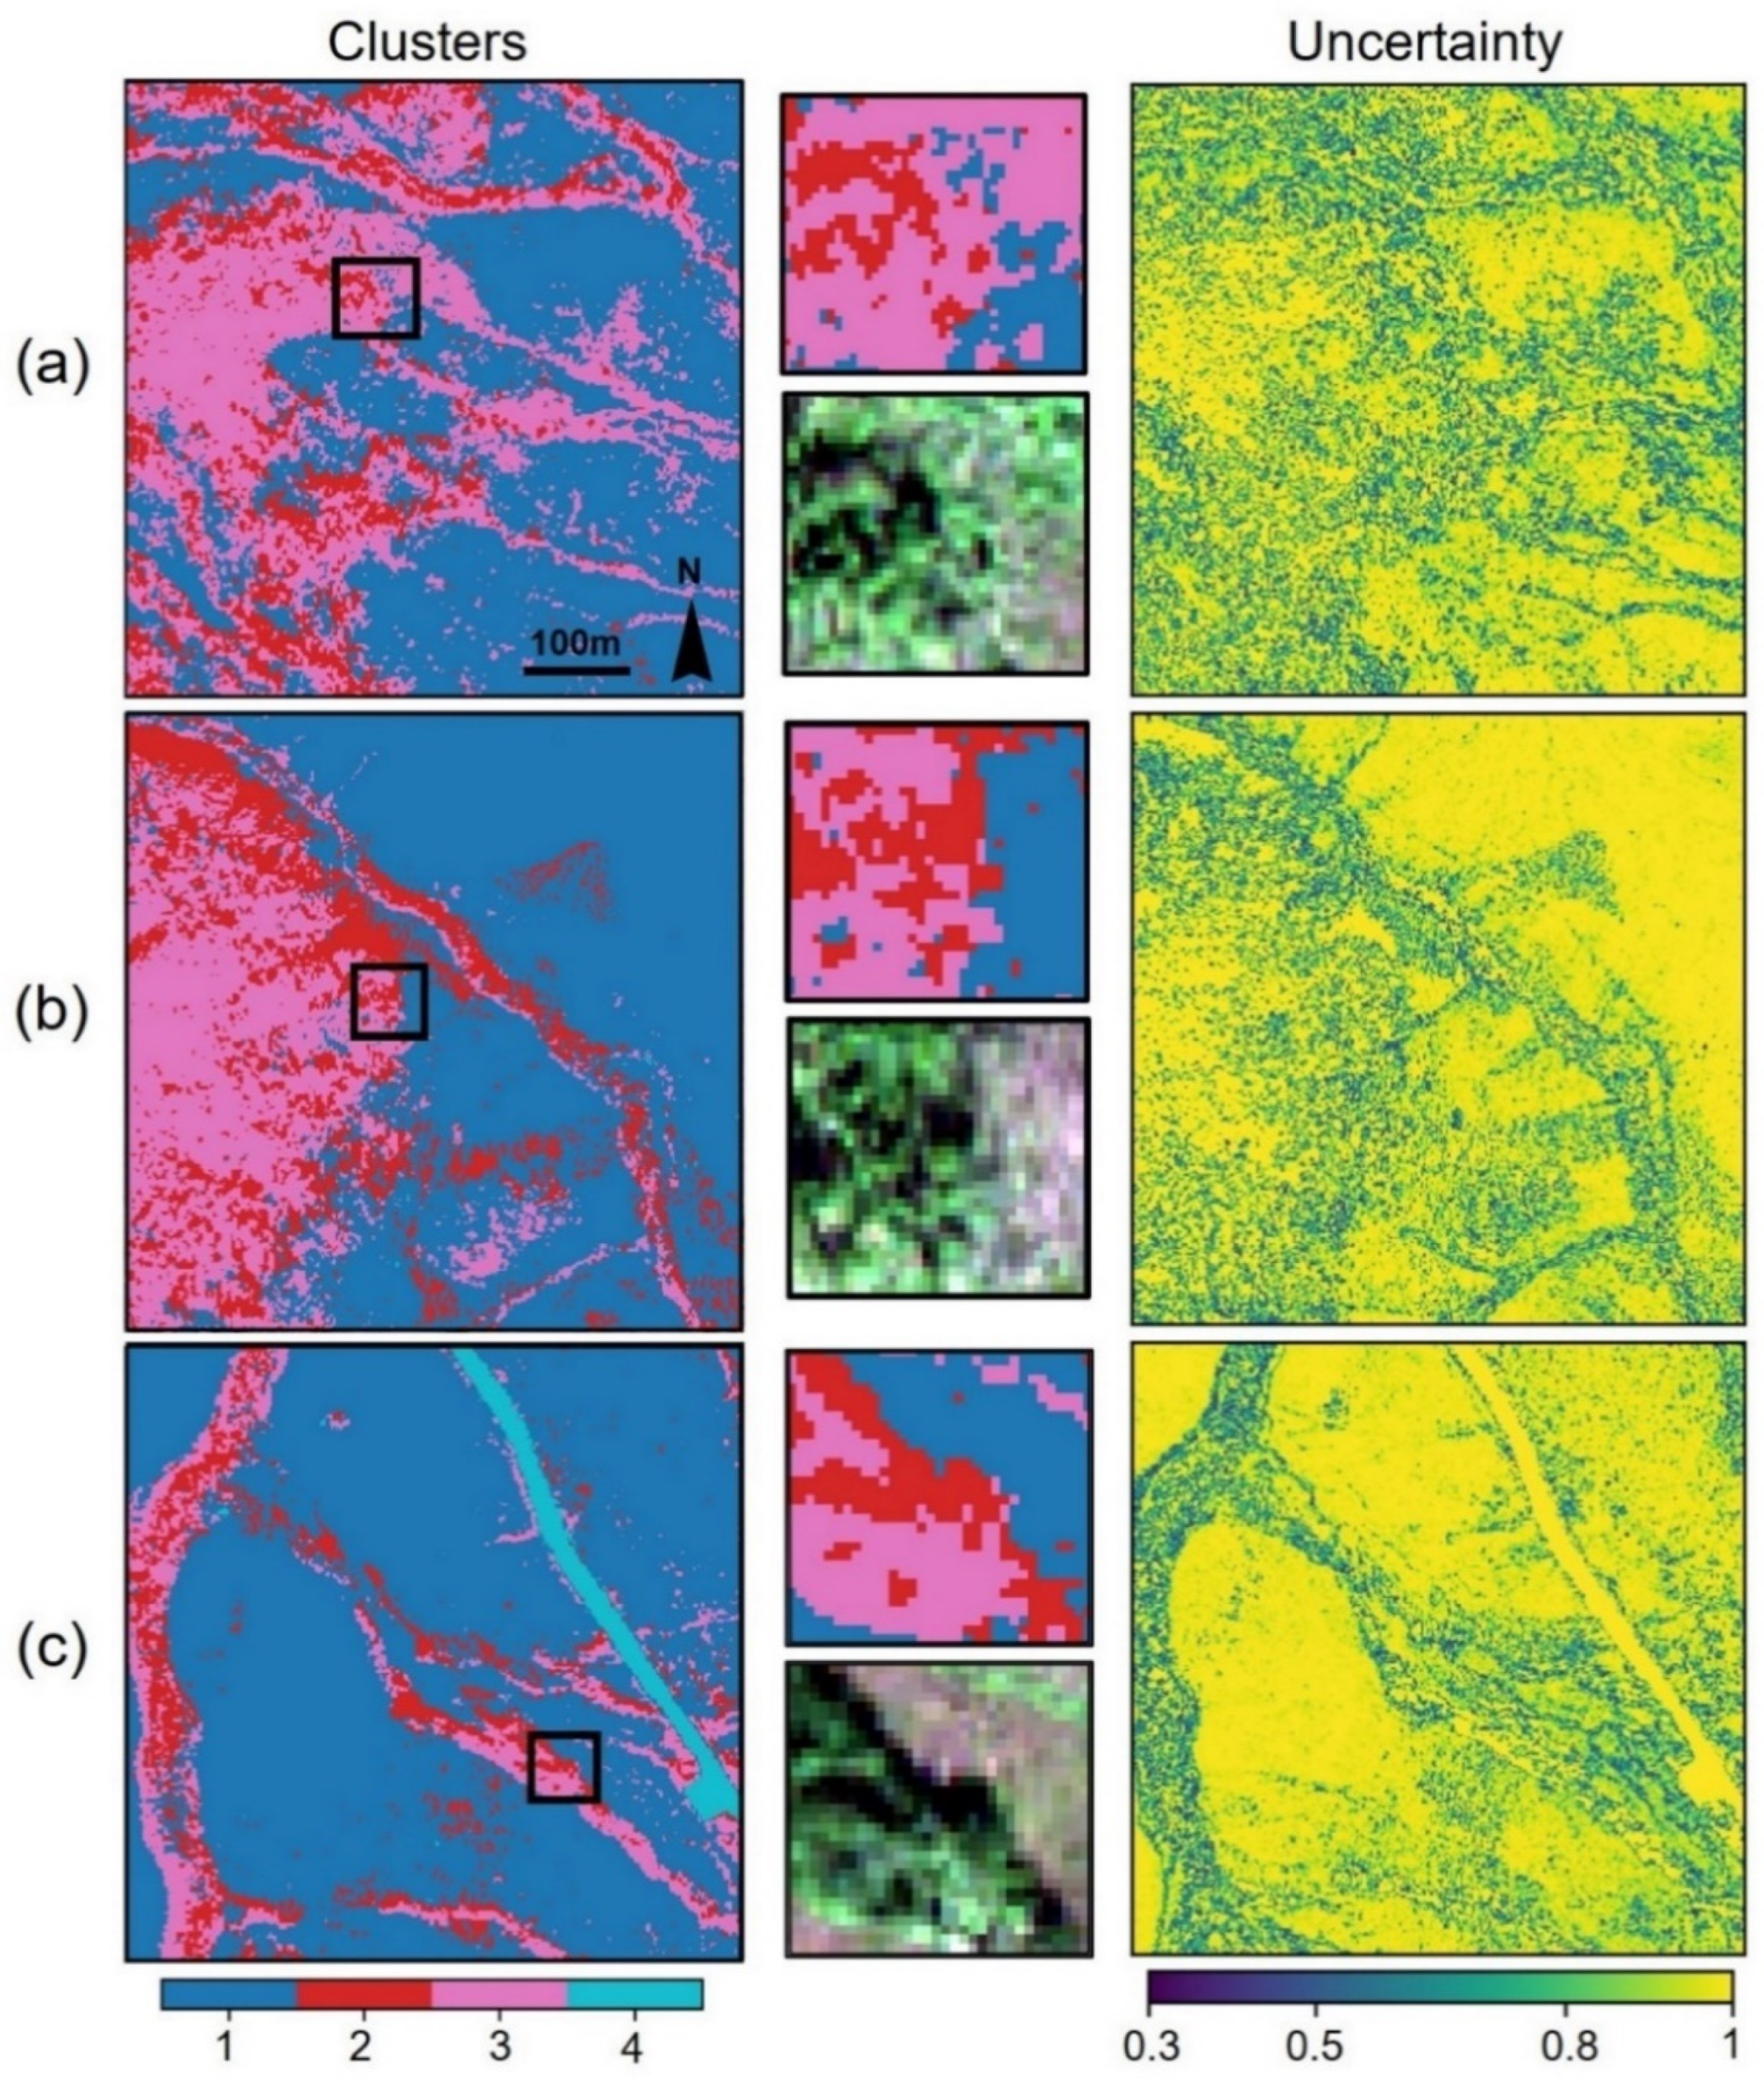
The GMM-based clusters along with the clustering uncertainties (i.e., cluster membership probability) are shown in Figure 4 Though having no significant difference in spatial patterns, the generated clusters appear slightly more separable with additional spectra-derived features (NDVI, MSAVI, NDWI) than using multispectral band only (black-outlined areas in Figure A1). Overall, the cluster maps exhibit spatial patterns consistent with the satellite images at all study sites, indicating good performances of the GMM-based clustering in grouping similar pixels (Figure 4). Based on the NDVI and NDWI rules, cluster 1 was determined as the pseudo-ground class for all study sites. The rest three clusters (2–4) are found to be darker regions (e.g., shadow, dark green vegetation, cluster 2), green vegetation (cluster 3), and an additional concrete road class (cluster 4) after visually inspecting the satellite imagery (Figure 2 and Figure 4). Considering that concrete roads are commonly processed as the bare ground in lidar-derived DTMs, we therefore appended cluster 4 to the pseudo-ground class.
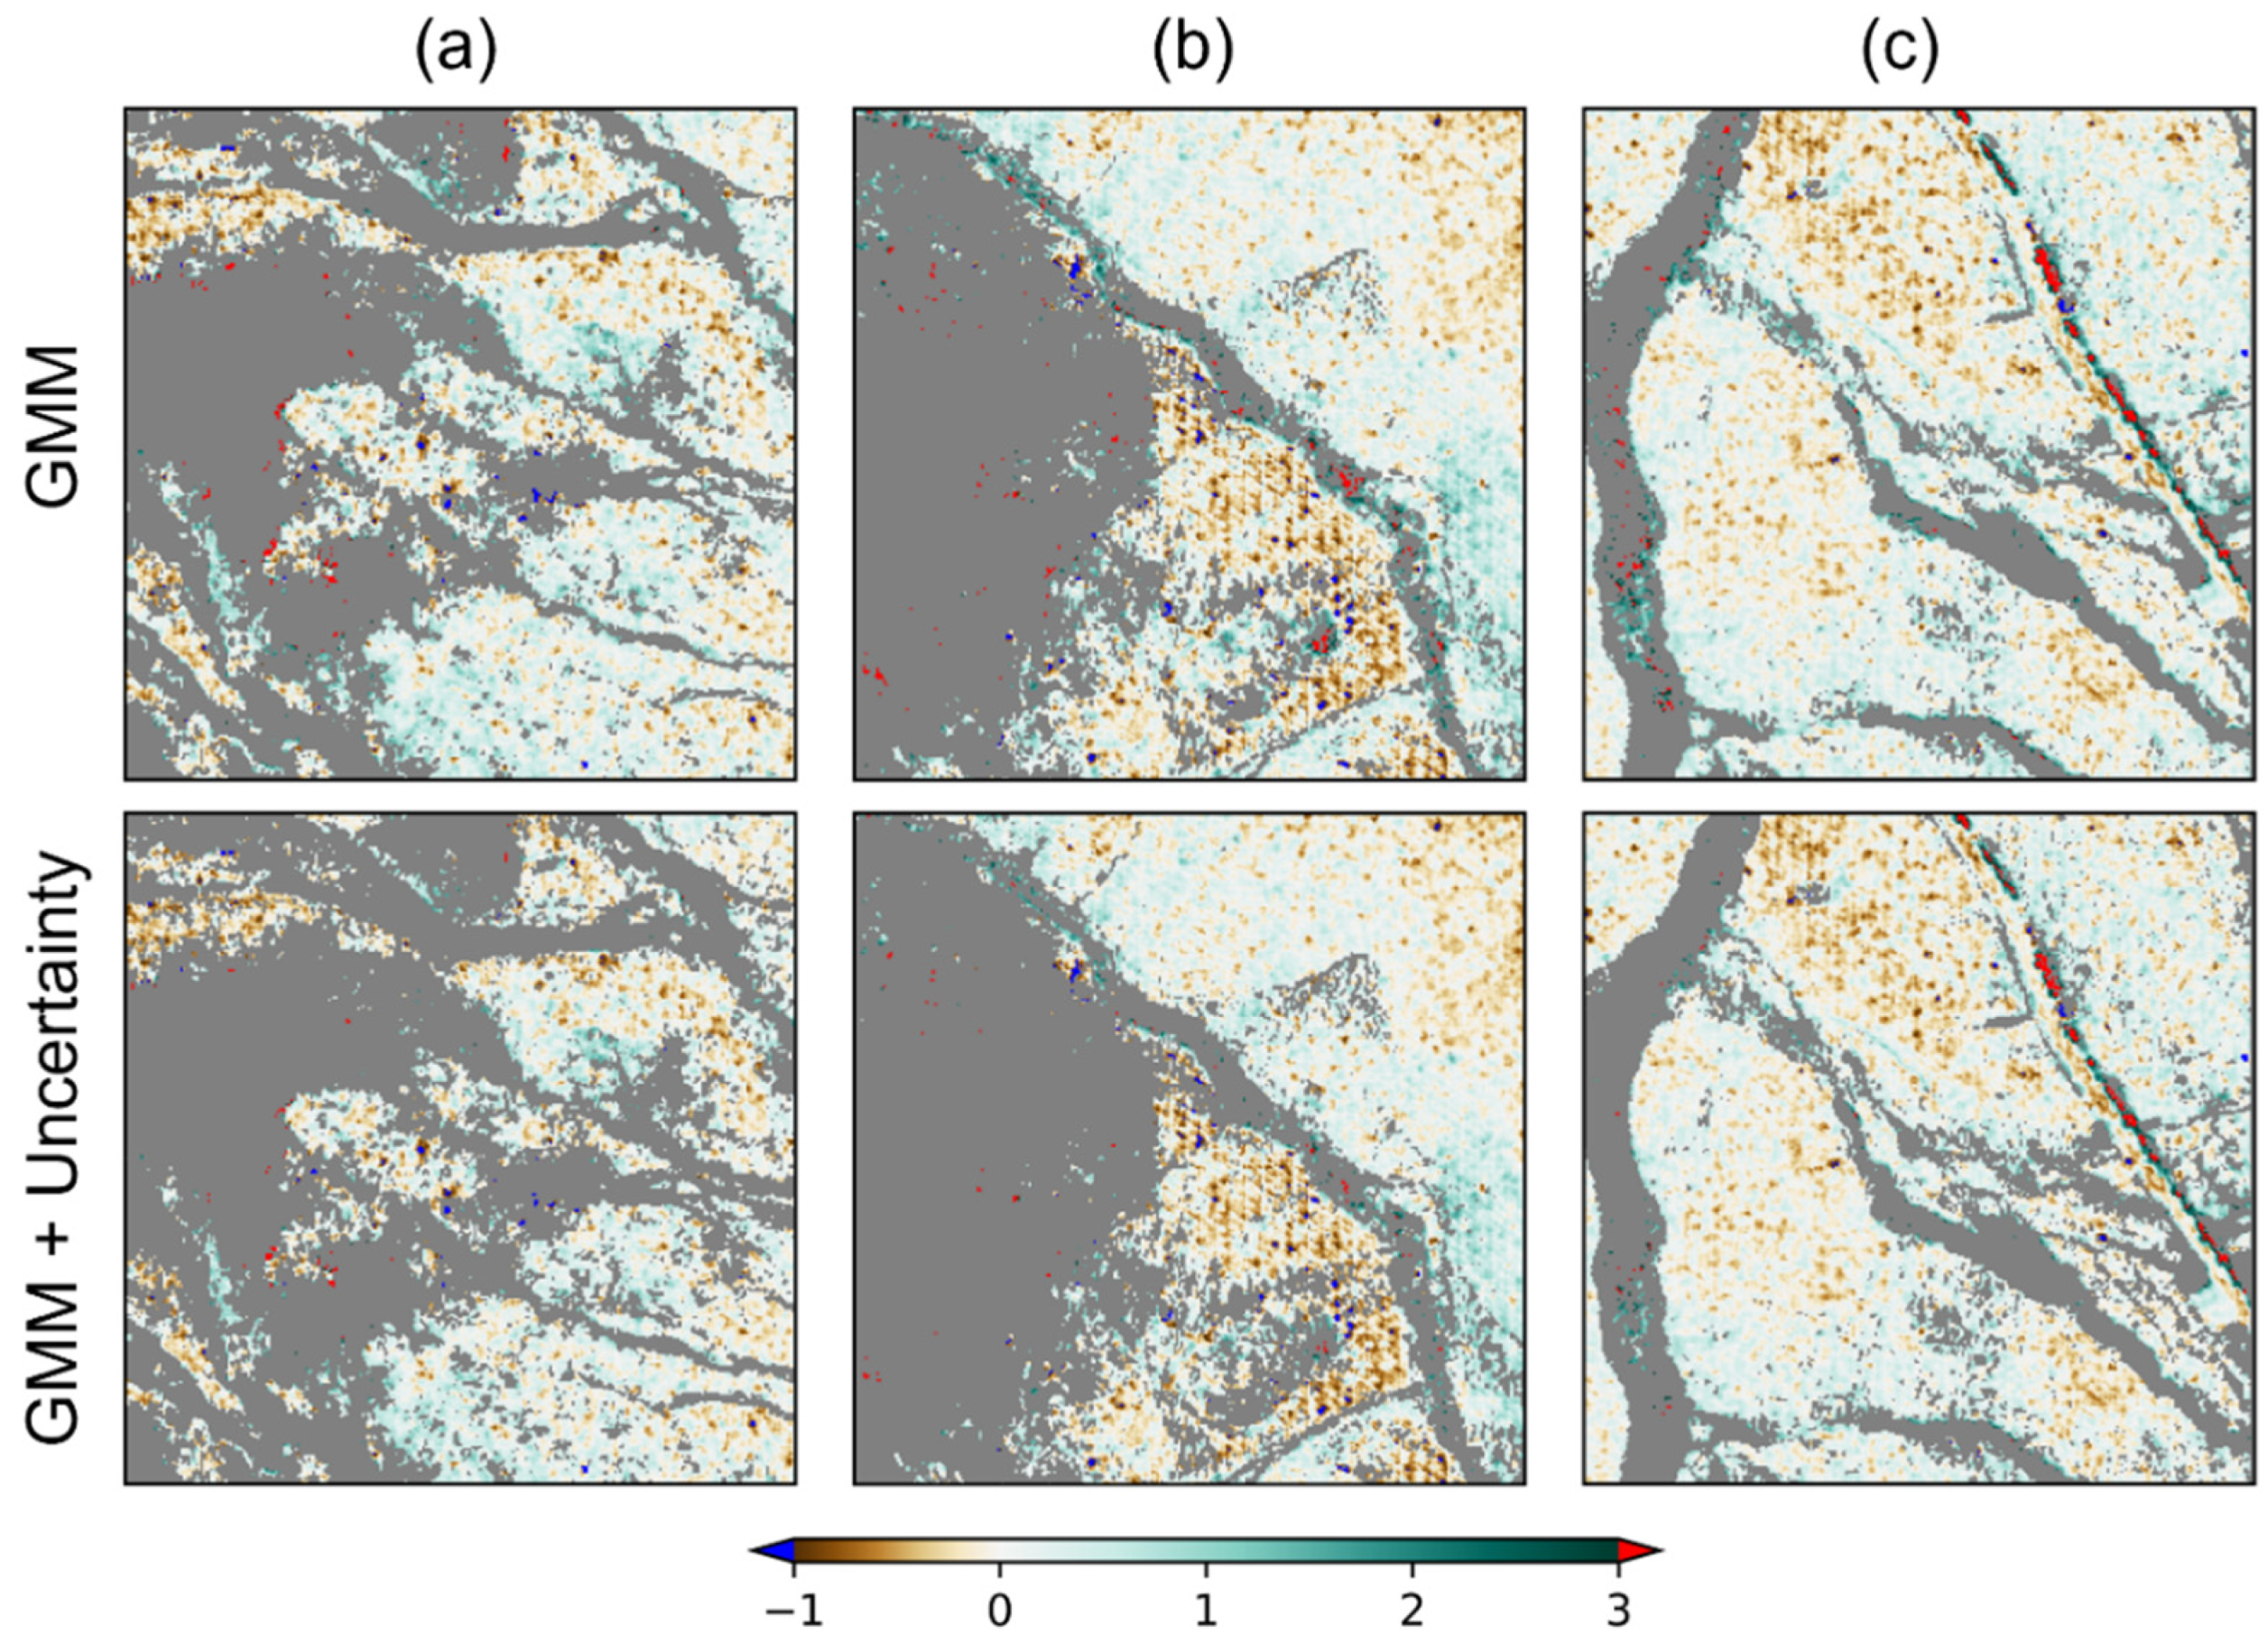
It appears that pixels with lower cluster membership probability, meaning more uncertainty about the dominant cluster, are generally located at areas with higher levels of spatial variability, e.g., canopy gaps, vegetation-ground boundaries (Figure 2 and Figure 4). In contrast, more spatially homogenous regions such as the top of dense canopy or ground surface are characterized by much purer clustering results (i.e., higher cluster membership probability, Figure 4). To demonstrate the value of uncertainty measures, we show ground masks generated from GMM clustering only and refined by cluster membership probability of >0.8 in Figure 5. Instead of displaying a binary map of each ground mask, DEM differences between ArcticDEM and lidar-derived DTM overlaid with different ground masks are presented for better assessment and comparison. Clearly, positive DEM differences indicate vegetated areas. Overall, it could be observed that vegetated pixels > 3 m are mostly filtered out in GMM-derived ground masks. Refinement based on clustering uncertainty further removes some tall vegetation (with DEM differences > 3 m) located at the vegetated areas or vegetation-to-ground boundaries (Figure 5).
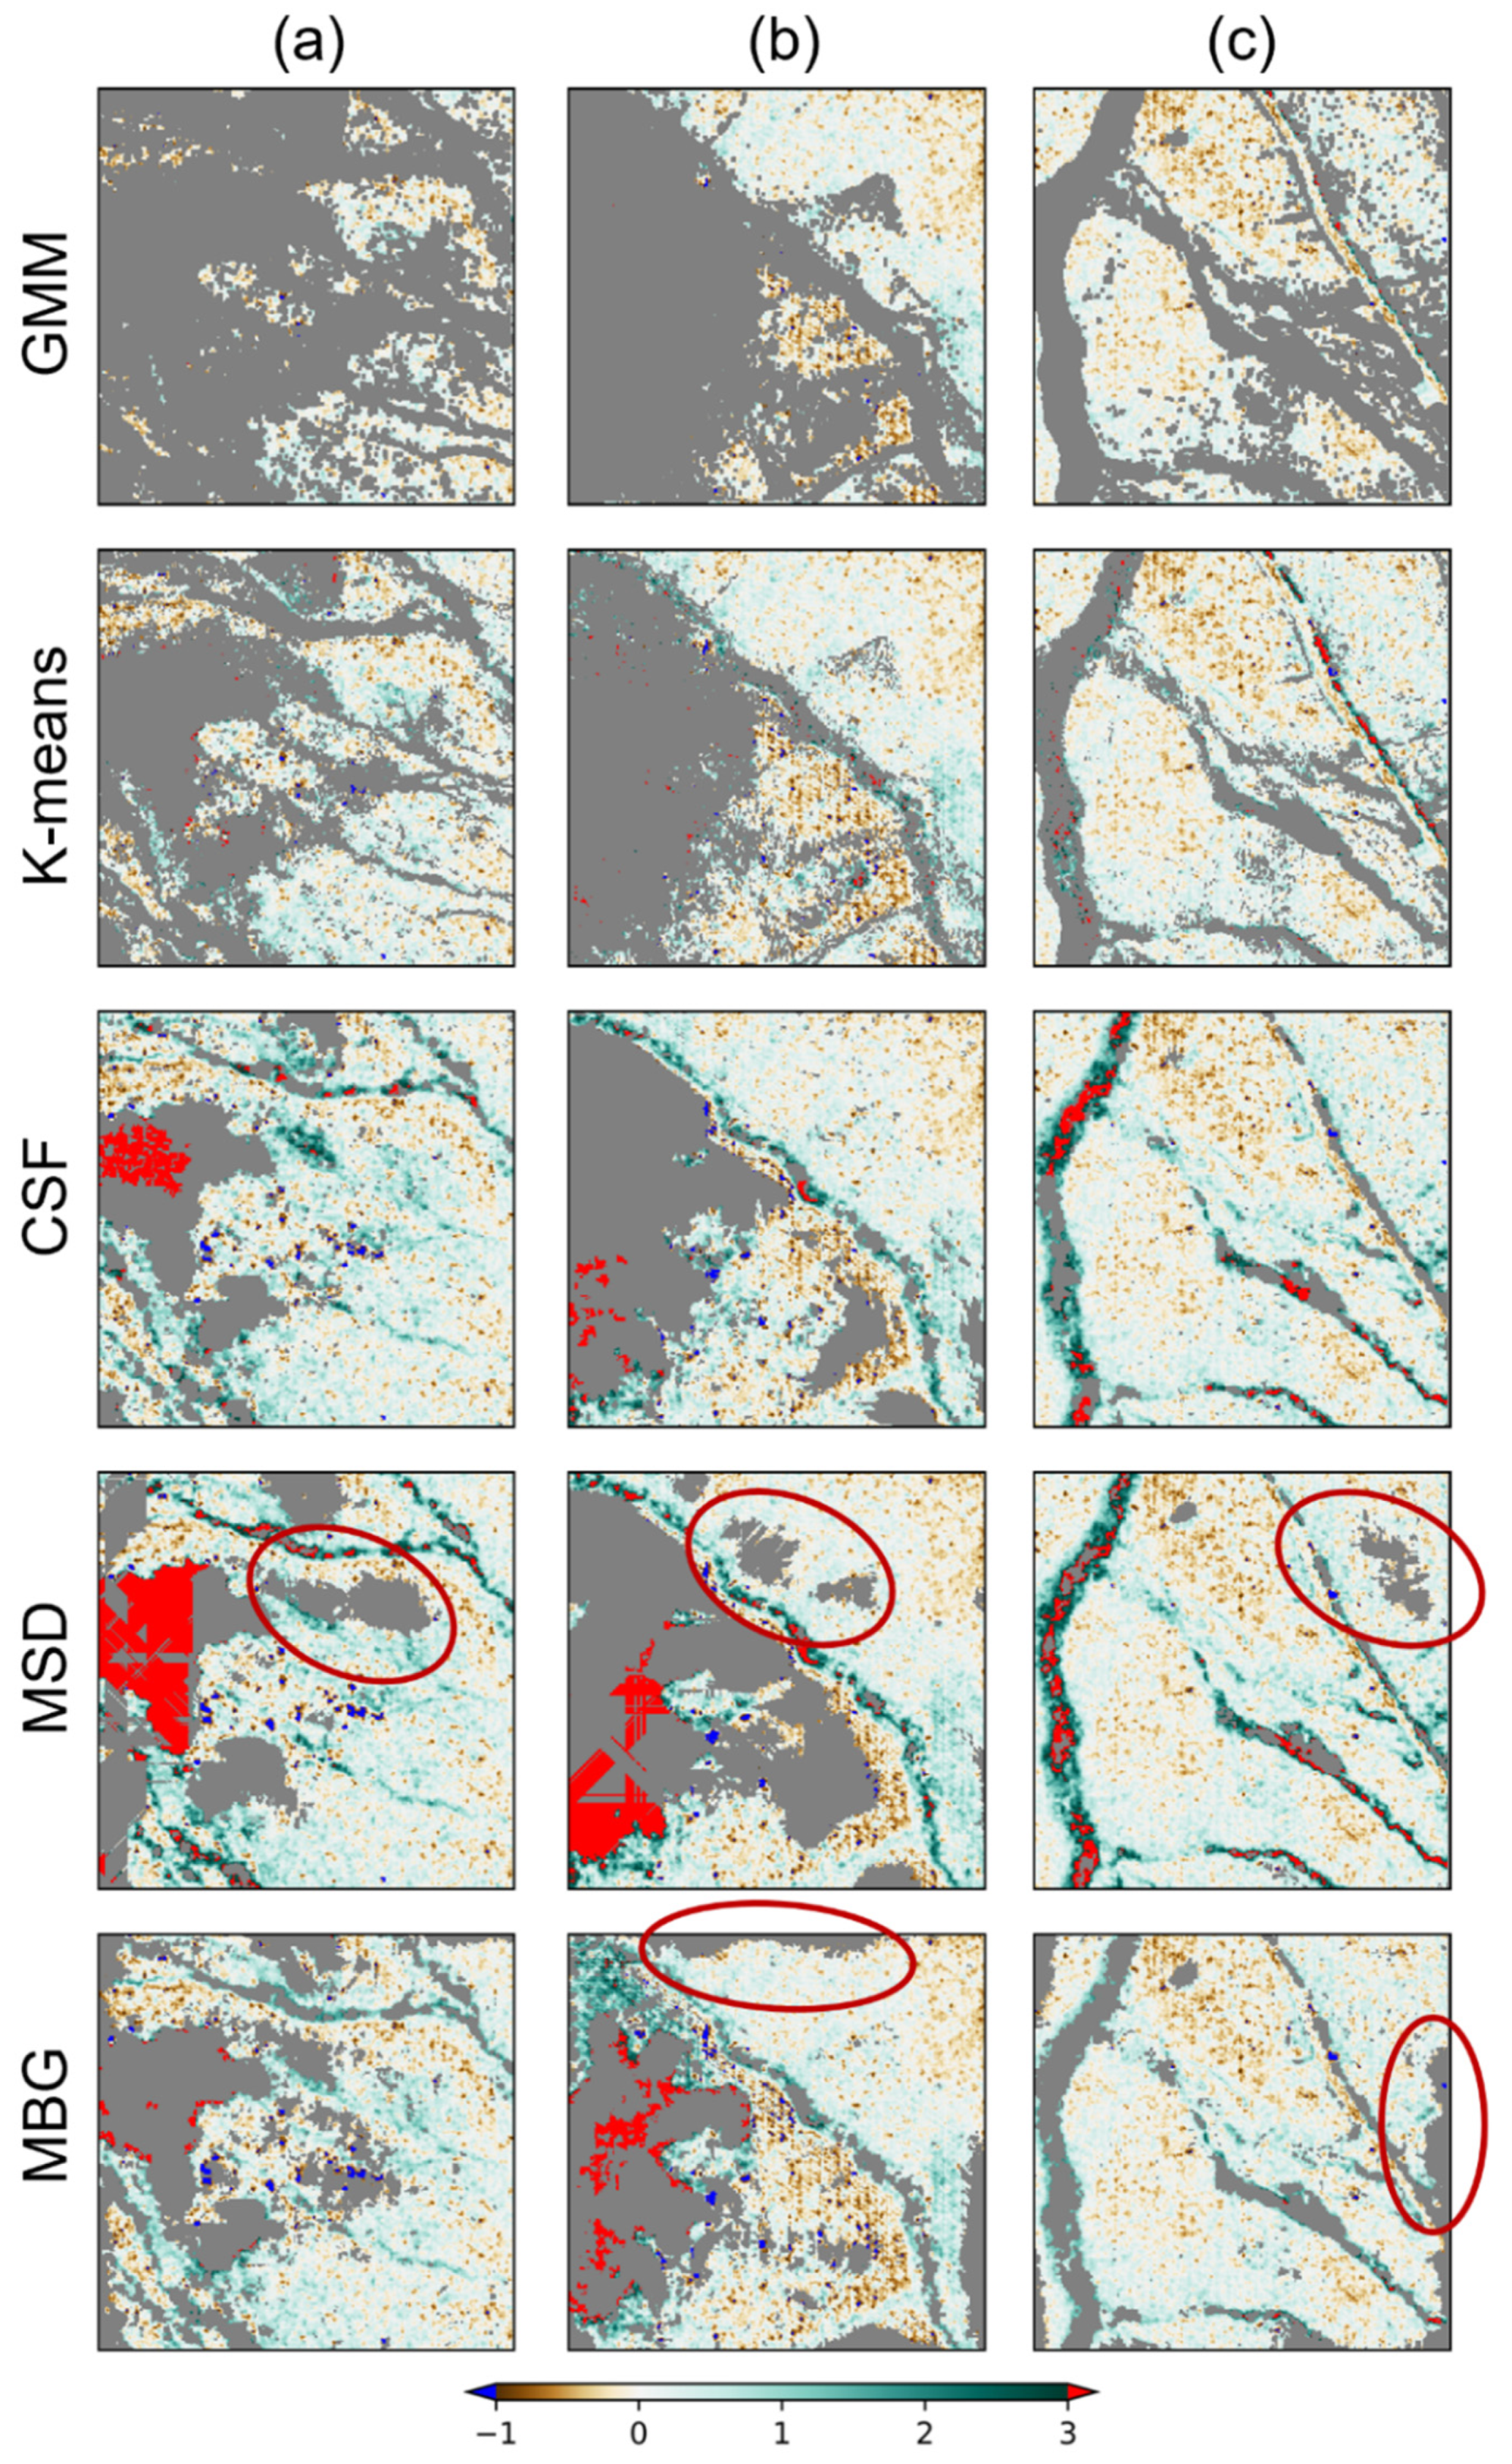
The final GMM-based ground masks derived from refining pseudo-ground clusters with clustering uncertainty and morphological erosion are shown in Figure 6. Compared to the ground masks in Figure 5, sparsely distributed vegetation pixels are effectively removed by morphological operation. Among the three study sites, Site-2 has larger void areas with no ground observations due to denser canopy cover (Figure 2), creating more complicated scenarios for DTM interpolation (see results in Section 3.2). Figure 6 also shows ground masks corresponding to K-means and three comparative ground filtering-based methods. Compared to K-means and the ground filtering-based methods, the GMM-based method clears most of the vegetated pixels (particularly tall vegetation with DEM differences > 3 m). In contrast, K-means-derived ground masks exhibit very similar spatial patterns to those generated by GMM with no uncertainty refinement (Figure 5). MSD tends to misidentify ground pixels as non-ground at positions where the ground-to-vegetation transitions are less drastic than topographic variations (outlined by red ellipses). MBG generally does a better job than CSF and MSD in discriminating ground from non-ground pixels. However, it has a similar issue to MSD, especially at the boundaries of the study sites (Site-2, Site-3). Moreover, all filtering-based methods confuse some low areas at large forest patches with ground pixels and fail to detect some tall vegetation at the vegetation-to-ground boundaries. Overall, the spatial patterns of ground pixels are better preserved in GMM-based ground masks with much less tall vegetation present (Figure 5 and Figure 6).
Table 1 and Table 2 list detailed accuracy metrics of ground masks derived from GMM, K-means, and three ground filtering methods. Table 1 provides categorical accuracy assessment on ground identification by evaluating the classification accuracy of discriminating ground pixels from non-ground pixels. GMM achieves significantly lower TIs (i.e., commission errors, 0.288–0.413) and higher OAs (0.634–0.722) than the filtering-based methods at all study sites (Table 1). We also notice that GMM-based ground masks have larger TII errors (i.e., omission errors) than the others, especially at Site-1 (0.682) and Site-3 (0.306). This can be attributed to the uncertainty refinement and morphological erosion used for removing low-confidence and sparsely distributed pseudo-ground pixels (Figure 5 and Figure 6). Despite relatively low TP rates (0.129–0.389), GMM-derived ground masks achieve comparable F1 scores to other methods at Site-2 (0.654) at Site-3 (0.690). CSF- and MBG-derived ground masks score higher F1s at Site-1 (0.629, 0.628). K-means receives the highest F1s at both Site-2 (0.683) and Site-3 (0.742). However, their large TI errors may cause severe overpredictions in spatial interpolation. Likewise, despite high TPs (0.332–0.538), MSD may also suffer from overpredictions given its rather high TI errors (0.434–0.555).
Table 2 provides a quantitative accuracy assessment of ground identification by calculating vertical accuracy metrics of the ArcticDEM values at identified ground pixels compared to the lidar-derived reference DTM. Because ArcticDEM values at identified ground pixels will be used as DTM samples for subsequent DTM interpolation, the vertical accuracy of identified ground pixels is an important quality metric that matters more to spatial interpolation results. The results show GMM’s superior capability in identifying high-quality ground pixels with much lower errors (0.328–0.348 m RMSEs, 0.005–0.006 rRMSE, 0.233–0.256 m MAEs, and 0.039–0.058 m MEs) than the other methods. Comparatively, CSF and MSD produce less desirable ground pixels that have much larger elevation errors (>2.5 m RMSEs at Site-1). MBG performs satisfactorily in identifying reliable ground pixels at Site-1 and Site-3 (<1 m RMSEs), yet the extracted ground masks fail to remove tall vegetation, resulting in 2.411 m RMSE and 0.812 m MAE at Site-2. The remaining vegetation also brings larger errors (0.522–0.635 m RMSEs) in K-means derived ground masks than GMM-derived. Given the results in Table 1 and Table 2, GMM appears to be the best ground identification method considering its lowest TI errors, highest overall accuracies, and best quality (i.e., smallest elevation differences to the reference DTMs) of ground pixels.

3.2. DTM Interpolation

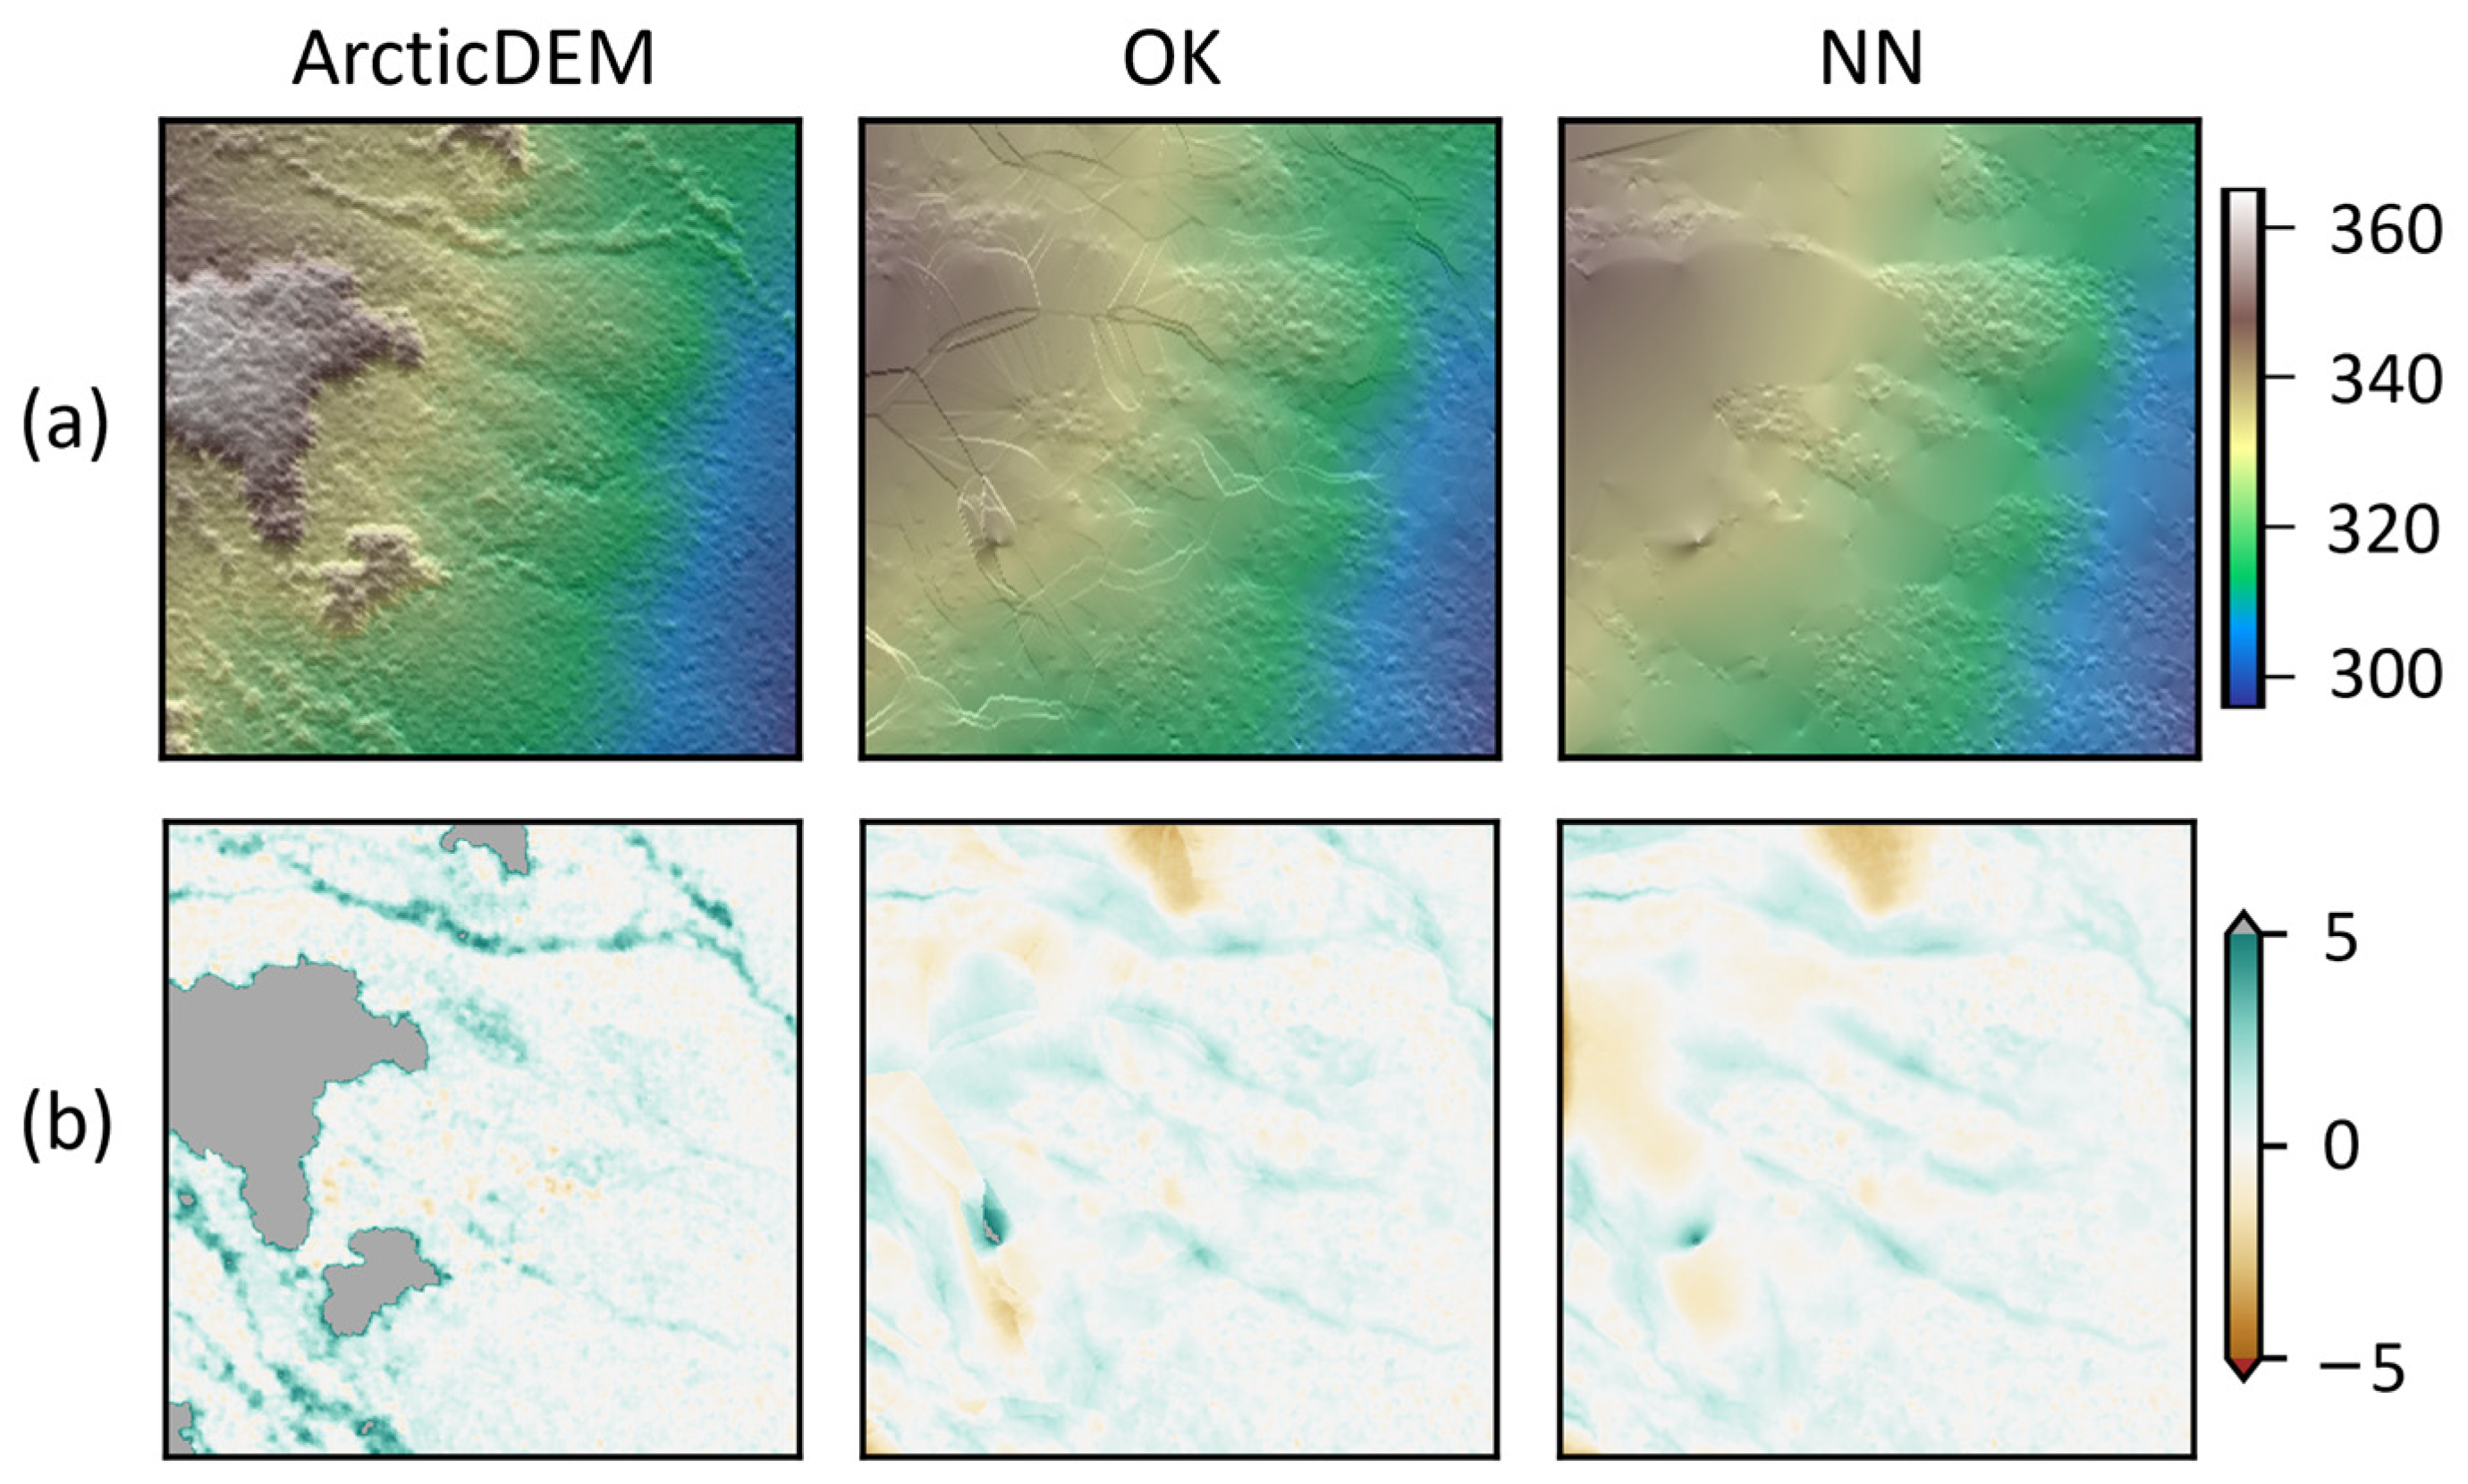
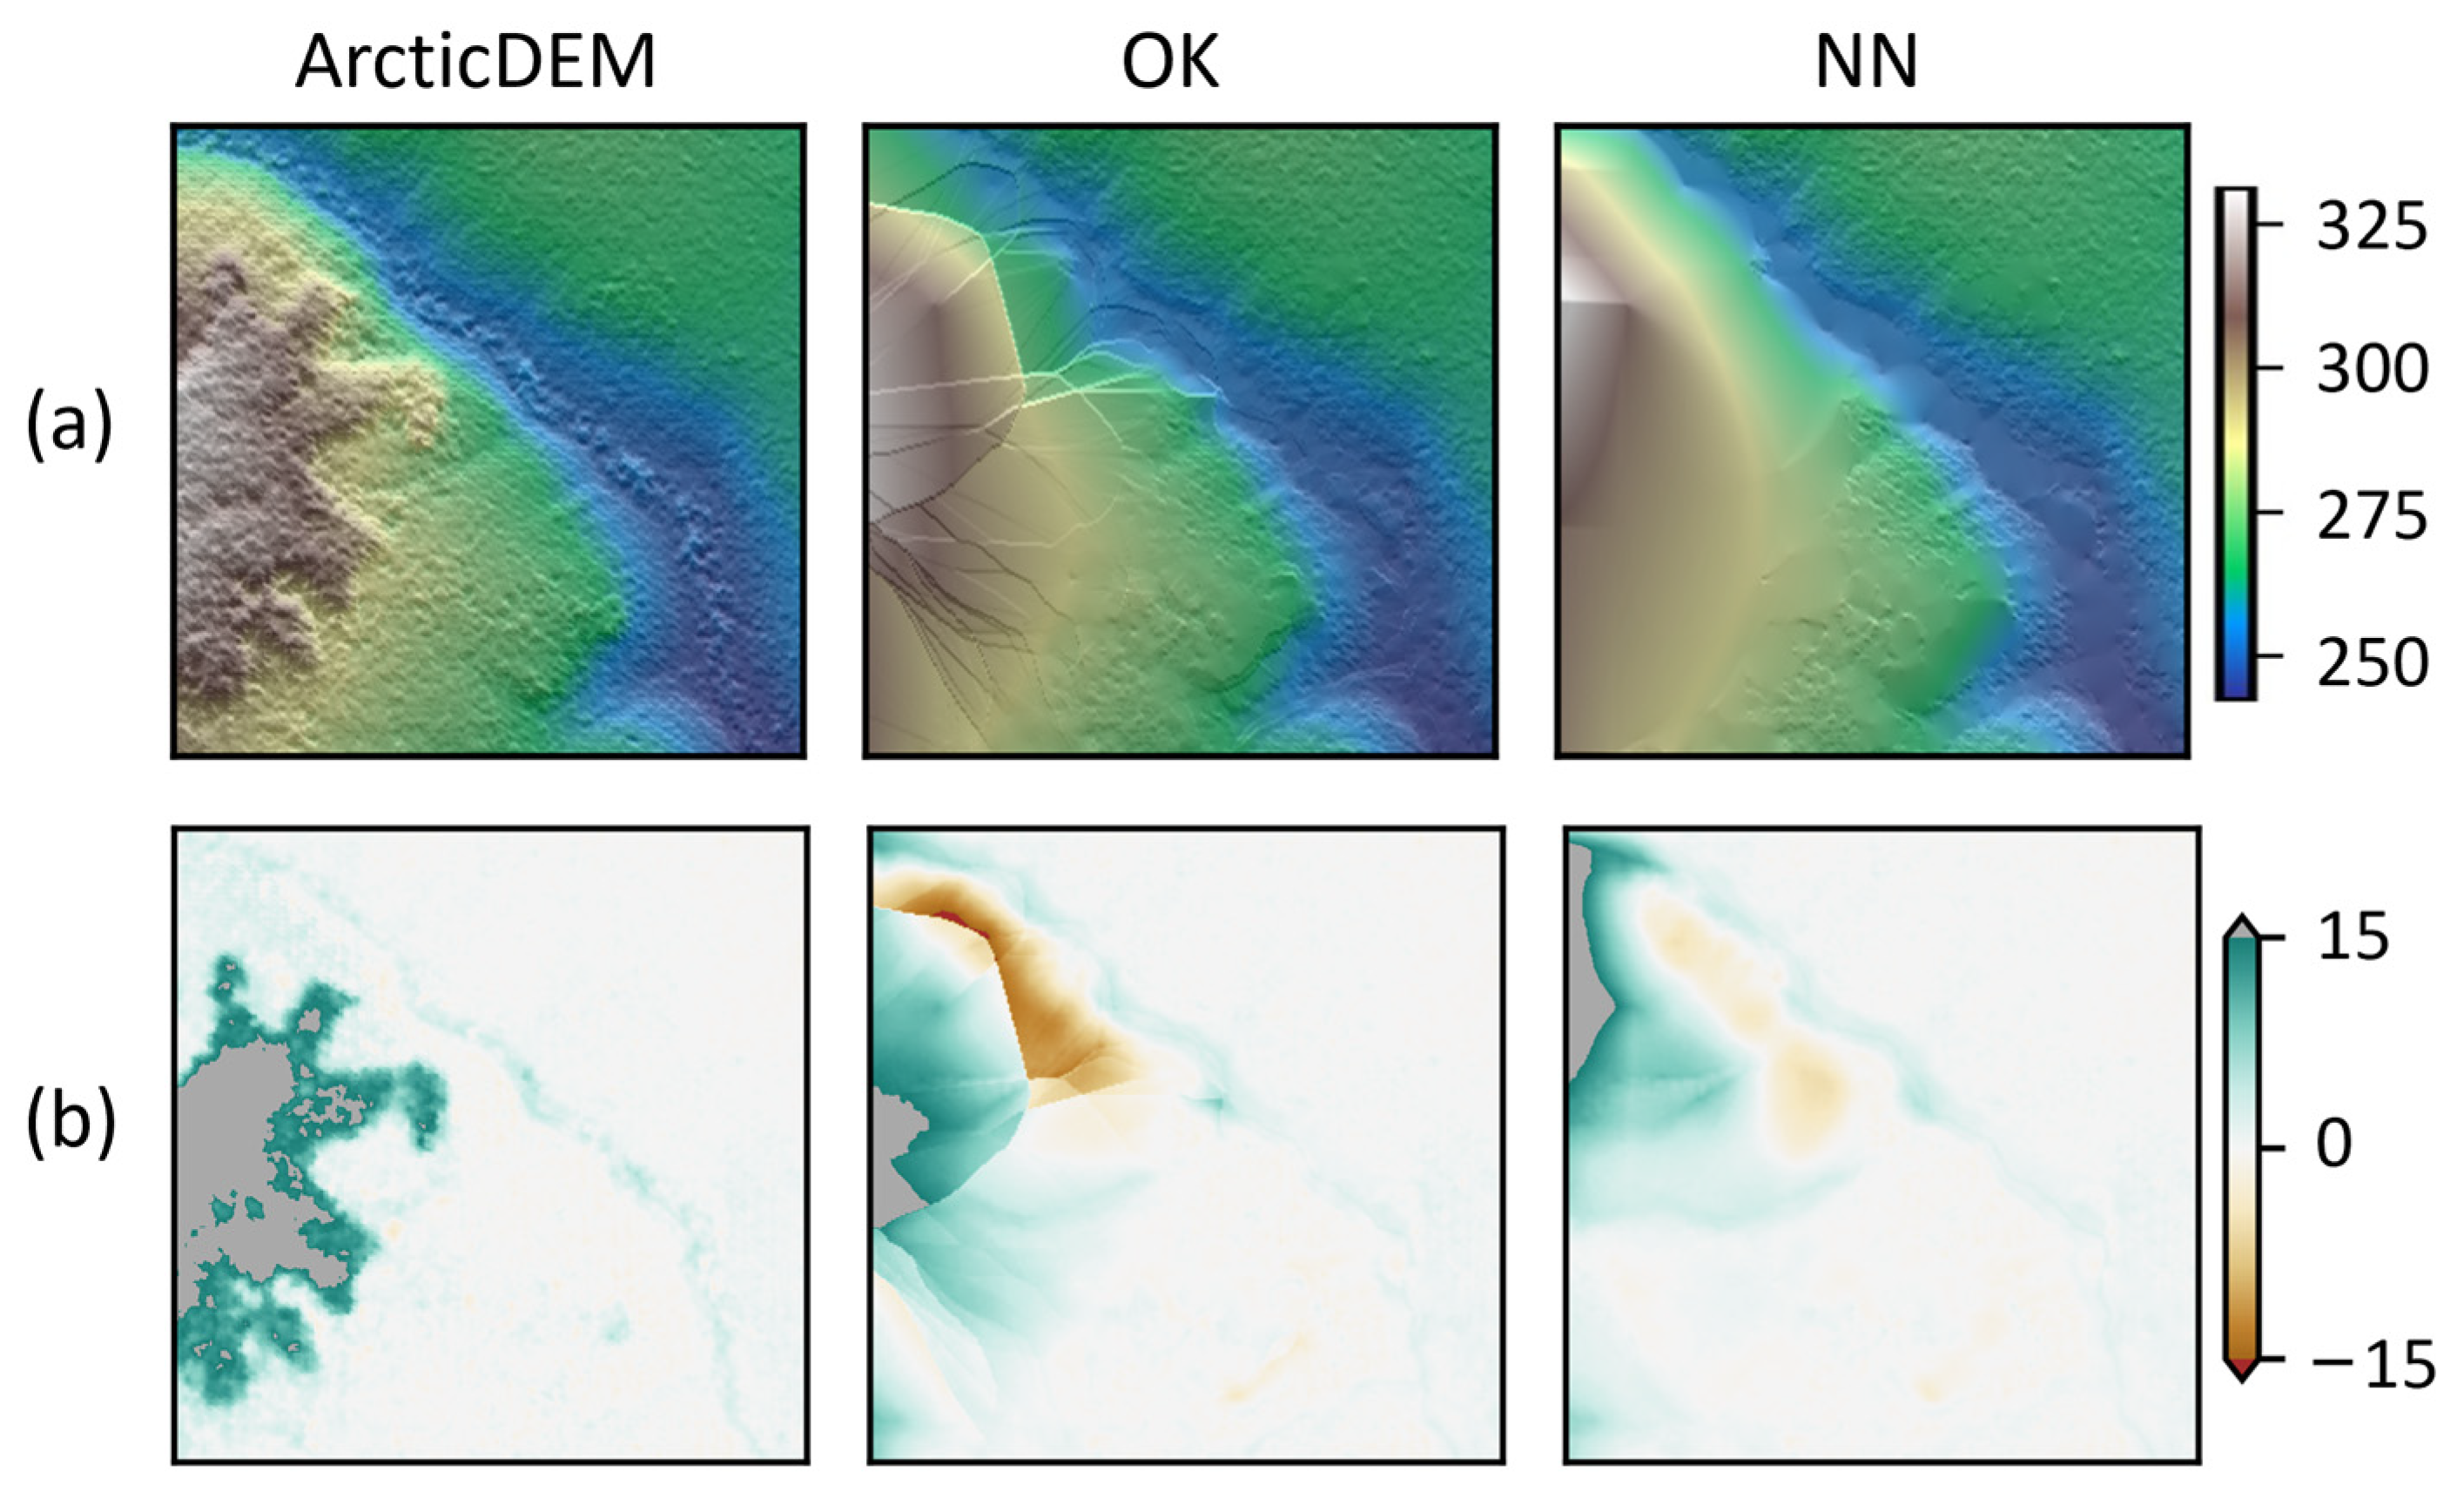
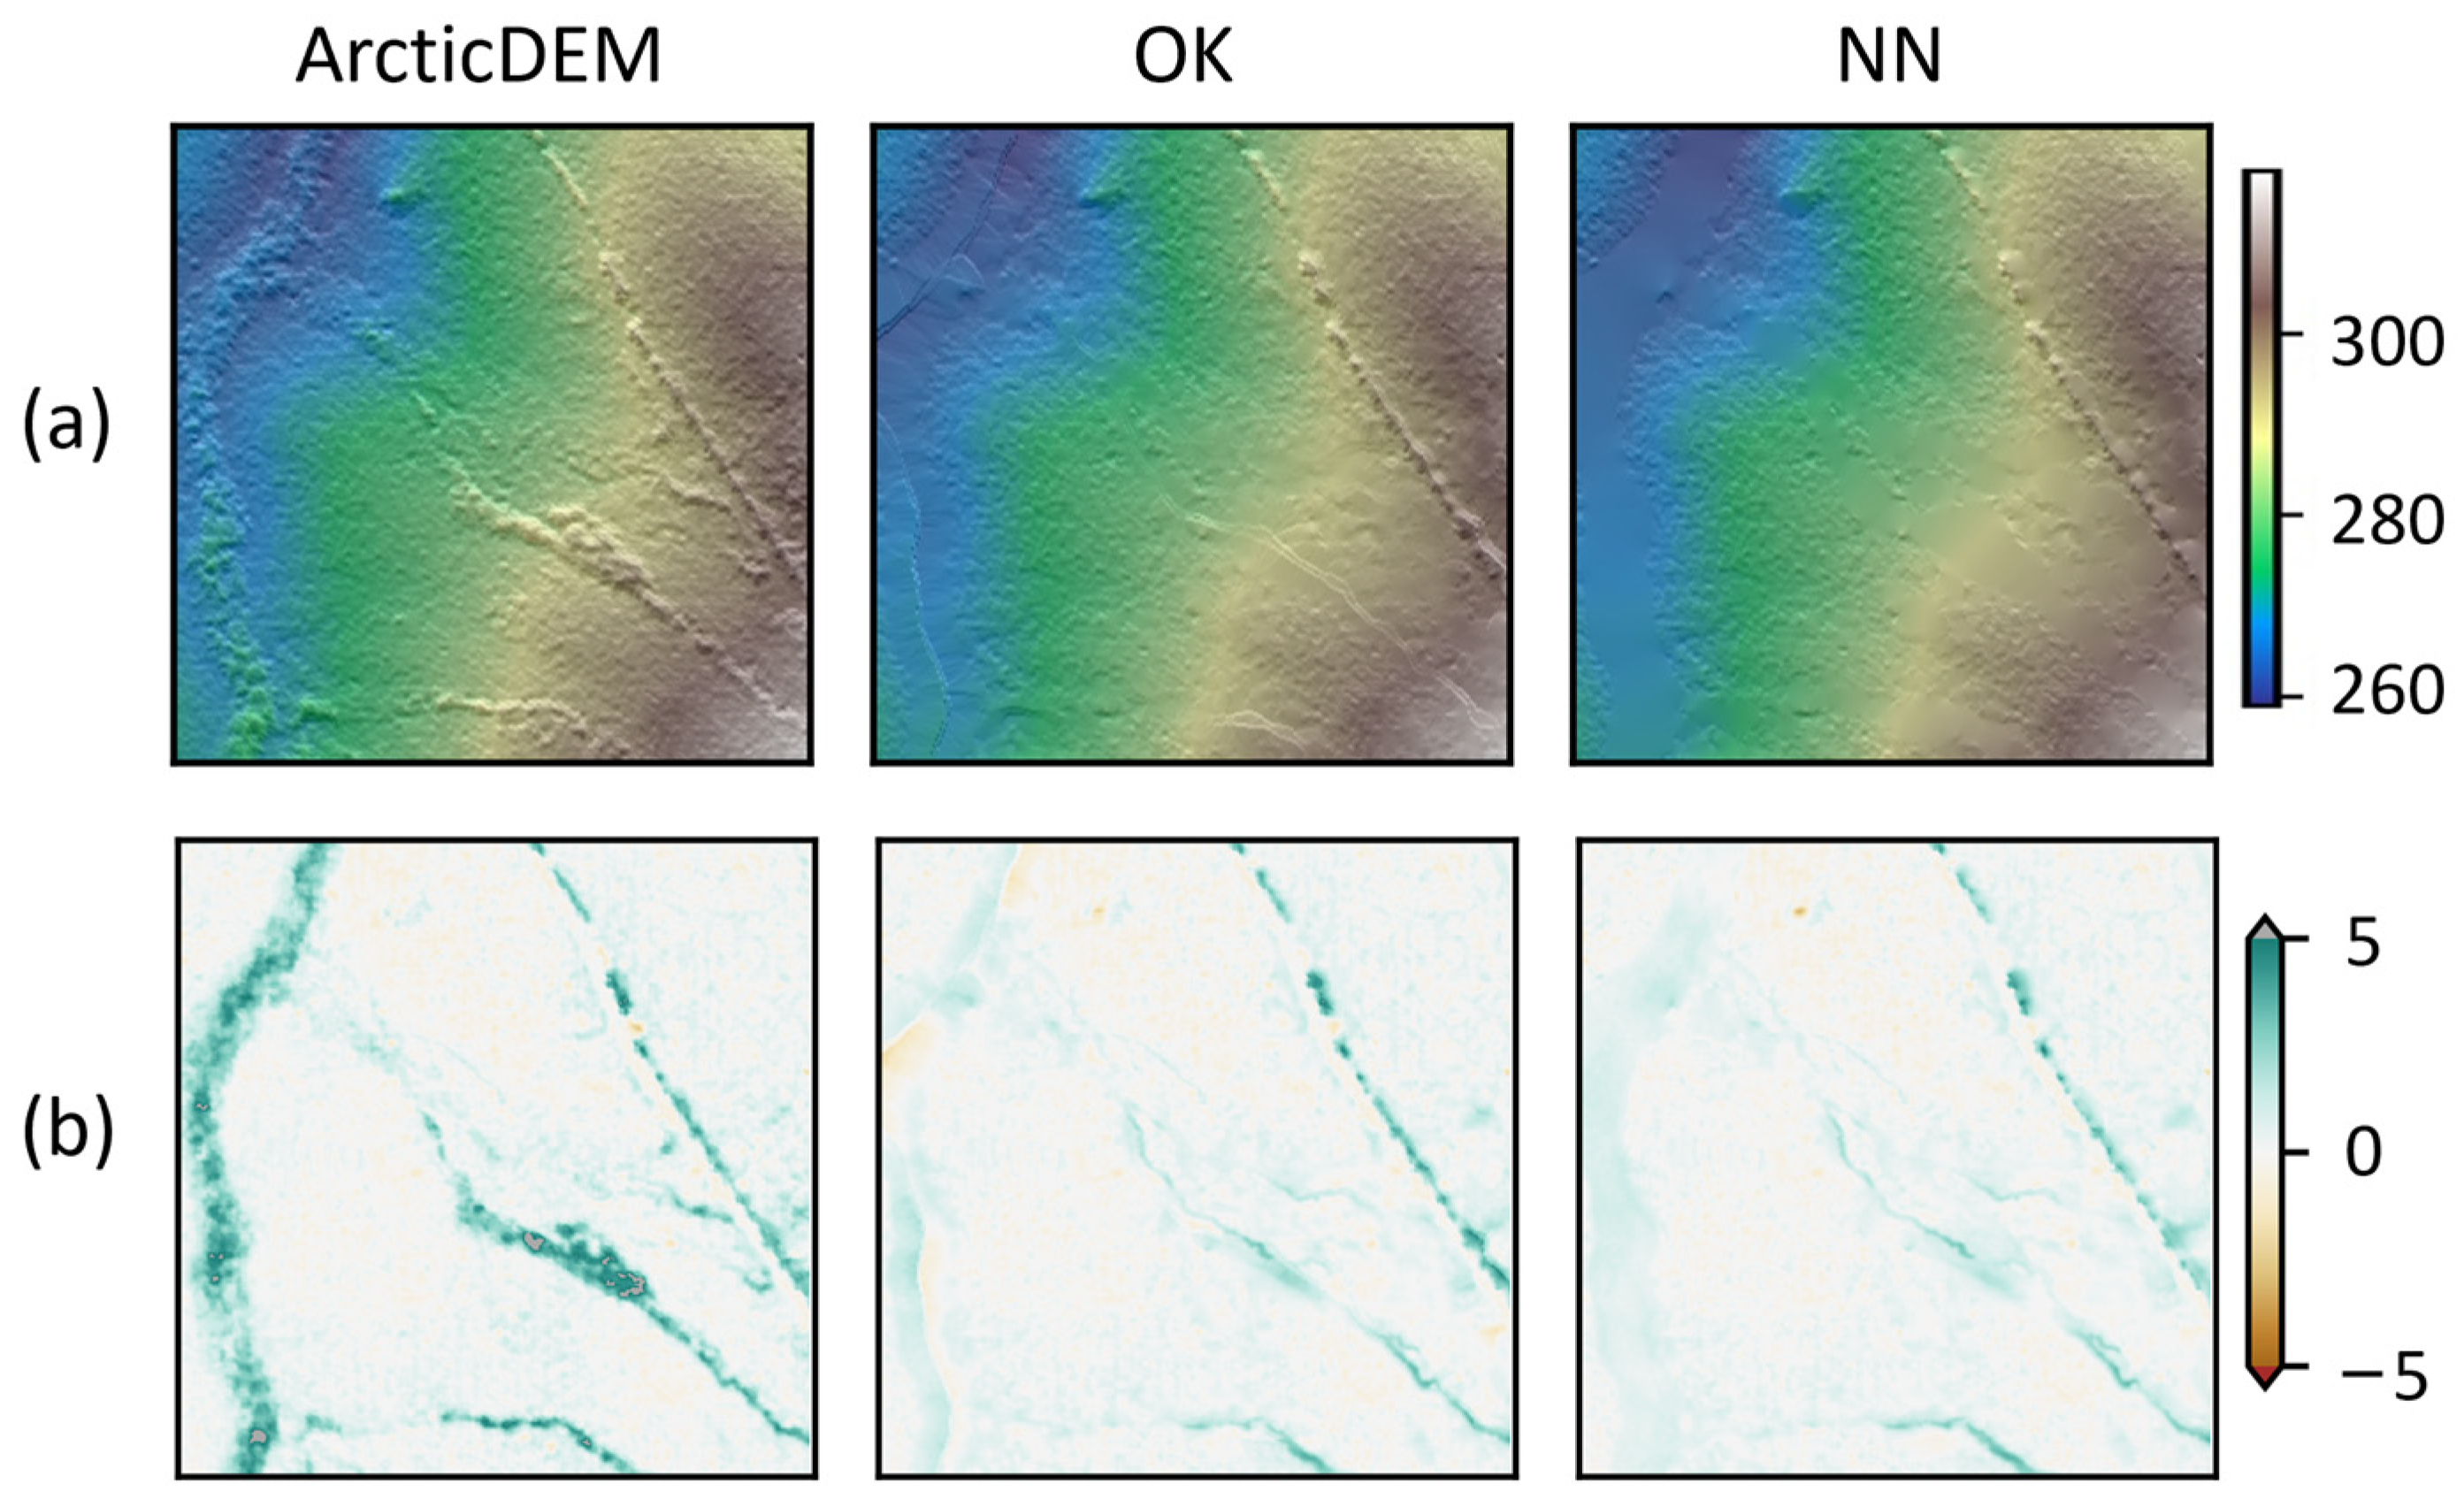
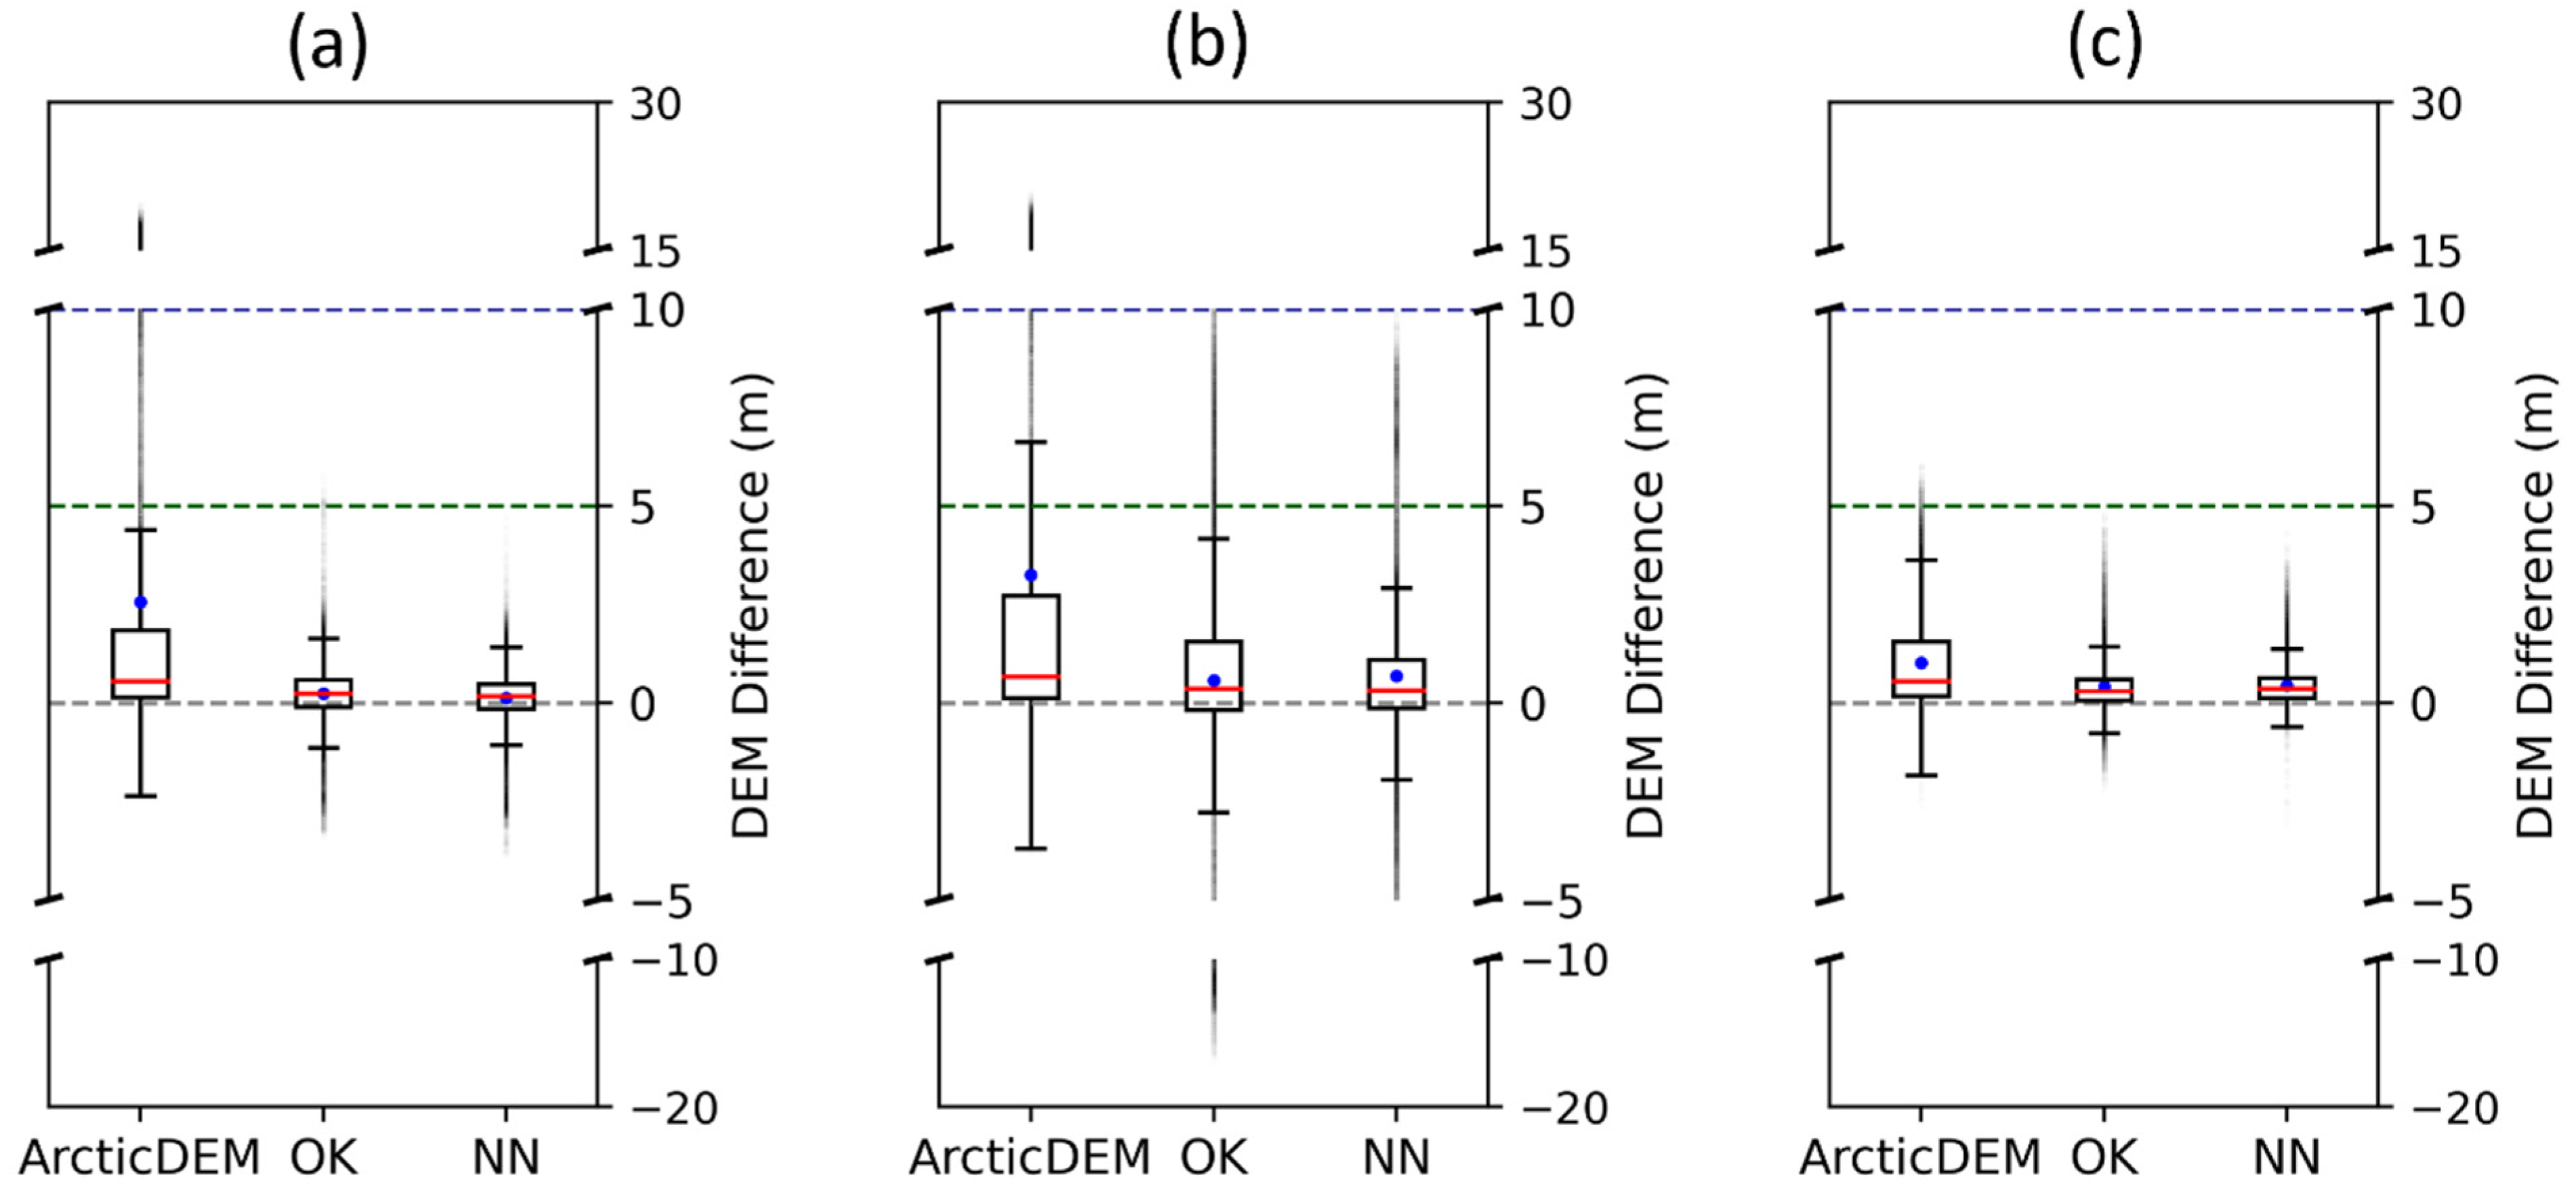
DTM interpolation results based on GMM-based ground masks were evaluated quantitatively by calculating error metrics in comparison to the lidar-derived reference DTMs (Table 3, Table 4 and Table 5 for Site-1, -2, -3, respectively). In addition to error metrics, extreme values at non-ground areas were also reported in Table 3, Table 4 and Table 5 where upper (UE) and lower (LE) extreme values were calculated as the percentage of pixels with <−3 m and >3 m vertical errors, respectively. Qualitatively, we mapped the interpolated DTMs and their differences to the reference DTMs to visualize the spatial patterns of the predicted DTMs (Figure 7, Figure 8 and Figure 9 for Site-1, -2, -3 respectively). Boxplots were additionally plotted to illustrate the distribution of DEM differences for both ArcticDEM and the predicted DTMs (Figure 10). In general, positive deviations from the reference DTMs are found in ArcticDEMs at all study sites (positive MEs in Table 3, Table 4 and Table 5, right-skewed boxplots, Figure 10), suggesting positive biases in ArcticDEMs compared to the lidar-derived DTMs due to the vegetation effects. Comparatively, Site-1 and Site-2 have taller vegetation (>10 m, Figure 10a,b) and larger portions of UE (~20%, Table 3 and Table 4) than Site-3 where vegetation heights are mostly <5 m (Figure 10c). Overall, spatial interpolation techniques, together with GMM-based ground masks, effectively shorten the differences between ArcticDEMs and the lidar-derived reference DTMs at all study sites.
Specifically, at Site-1, natural neighbor (NN) predicts better DTMs than ordinary kriging (OK), which reduces elevation differences of ArcticDEM at entire regions from 4.722, 2.136, 2.015 to 0.648, 0.449, and 0.113 m for RMSE, MAE, ME, respectively, with rRMSE being reduced from 0.088 to 0.012 (Table 3). Furthermore, the original UE in ArcticDEM (19.282%) has been substantially lowered to <0.3% by all interpolations. Qualitatively, both OK and NN effectively remove vegetation taller than 5 m from ArcticDEM (Figure 7b), shifting the original positively skewed distribution of elevation difference towards a normal one (Figure 10a). However, it should be noted that all interpolation methods tend to flatten the valleys previously covered by dense canopies (Figure 7a,b). Furthermore, a general underestimation of DTM can be found at the northern-elevated areas in all methods (Figure 7b), resulting in 0.101–0.154% of LE (Table 3).
The DTM interpolation results at Site-2 show larger errors (0.026–0.047 rRMSEs in Table 4) than those at Site-1 (Table 3), particularly on the west side of the region where the land surface is elevated and covered by dense canopies (Figure 8). Like Site-1, NN also predicts more accurate DTM than OK interpolation, which effectively decreases the RMSE of ArcticDEM by >65% (from 4.841 to 1.677 m, Table 4). Compared with NN (Table 4 and Figure 10b), OK-interpolated DTMs suffer more from both overestimation (>15% UE) and underestimation (8.277% LE), resulting in 0.354 m ME. Like Site-1, none of the presented methods could well recover the terrain information under dense canopies with large interpolation uncertainties present (Figure 8) due to the lack of exposed ground areas on WV-2 imagery that enable sufficient ground identification. Consequently, all interpolated DTMs demonstrate significant artifacts on the west side of the region (Figure 8a) in comparison with the reference DTM (Figure 2). This indicates a major limitation of using optical stereo imagery in reconstructing bare ground topography in densely forested areas (Figure 2).
Site-3 has much lower vertical errors in ArcticDEM than the other two sites due to its sparser canopy cover and lower topographic variation (Figure 9, Table 5). All spatial interpolation techniques are effective at further reducing the elevation errors in ArcticDEM (Table 5). DEM error maps (Figure 9b) and boxplots (Figure 10c) also suggest the good performances of all interpolation techniques in removing tall vegetation from ArcticDEM, shifting the mean and median of DEM differences to ~0 m, and recovering the underlying terrain surface (Figure 9a). Consistent with the results at Site-1 and Site-2, NN produces more accurate DTM than OK, which reduces ArcticDEM error metrics by more than half (e.g., 0.521 m RMSE, 0.009 rRMSE, Table 5).

4. Discussion

4.1. Ground Identification

Extracting DTMs from optical-stereo-imagery generated DSMs requires reliable ground observations as input to spatial interpolation methods. Errors in the extracted ground pixels can affect the accuracy of DTM interpolation. Existing filtering-based ground identification methods primarily employ the point cloud/DSM product in deriving DTMs, such as CSF [21], MSD [26], and MBG [27]. In essence, all these techniques identify ground points based on DEM distinctions among neighboring pixels. They may perform well in lidar-based point cloud/DSM as lidar receives ground returns even under vegetation canopies. Comparatively, point clouds generated from optical stereoscopy are much sparser and spatially non-overlapped [60] due to geometric occlusion [31] or low-contrast surfaces [14]. Without sufficient ground exposure, filtering-based ground identification methods may misclassify low areas between large forest patches as ground or misidentify steep topography as non-ground objects when topographic changes are more substantial than the vegetation-to-ground transitions in optical stereoscopy-derived DSMs.
To address the above-mentioned misidentification issues in filtering-based techniques, we developed a GMM-based ground identification method by taking advantage of the spectral information of optical imagery, which also enables the quantification of the cluster membership probability to identify high-confidence ground pixels. Our results demonstrate the superior performance of the GMM-based method over K-means and filtering-based ground identification methods by locating the highest-quality ground samples. While more advanced supervised classification algorithms (e.g., support vector machine [61], random forest [30], and deep convolutional neural networks [62]) can be used to classify ground and non-ground from optical imagery, they are not suitable for forested sites in high-latitude regions where training samples are rarely available. Our GMM-based method is unsupervised and has great potential for high latitude regions covered by ArcticDEM.

4.2. Spatial Interpolation

Though ground identification is often considered the most critical step in estimating DTM from DEM products, our results suggest varying performance and inconsistencies of spatial interpolation techniques in DTM prediction across three study sites due to uncertainties in the ground masks and topographic variations. Specifically, for scenarios with mild topography (e.g., Site-3), both OK and NN work well even with high omission errors in the ground masks. However, for scenarios with high topographic variations (e.g., Site-2), lacking ground samples at elevated locations could lead to significant underestimation in both NN and OK. Overall, TIN-based NN appears more robust to uncertainties in the ground masks than OK, resulting in lower errors in DTM interpolation. Our finding of NN’s better performance has concurred with Bater and Coops (2009) [33] and Bandara et al. (2011) [63], who also found NN more robust than other interpolation techniques on DTM interpolation.

4.3. Future Improvement

This study only explored the use of optical imagery for ground identification. As optical data cannot see through vegetation canopy, the effectiveness of GMM and filtering-based methods depends on how much ground exposure can be observed from optical imagery. Our results show that forest patches lead to large void areas in the derived ground masks where none of the spatial interpolation techniques can fully recover the terrain information under dense canopies. To reveal more topographic details and improve overall terrain prediction, future studies can explore additional data for better ground identification and DTM generation. First, optical stereoscopy acquired with different solar geometry conditions may capture surfaces related to different canopy layers [64]. Moreover, multi-temporal optical stereoscopy-generated DEMs tied to different seasons can be used to uncover more ground pixels, especially for deciduous species, e.g., leaf-off stages [65]. In these regards, combining optical stereoscopy under different acquisition conditions (e.g., leaf-on and leaf-off, high and low sun elevation angles) would undoubtedly benefit the ground identification or canopy height estimation from one stereo-pair solely. Second, active sensors such as lidar and synthetic aperture radar (SAR) have better penetrating capability than optical sensors, thus providing supplementary vertical information for estimating bare ground or canopy height. With increasingly free access to spaceborne lidar, e.g., ICESat-2 [66], and SAR, e.g., ALOS-PALSAR [67,68], Sentinel-1 [69], and the upcoming mission ESA-BIOMASS [70], it is anticipated that our DTM estimation approach could be further improved by integrating optical data with active sensor data.
On the other hand, though our study demonstrates the robustness of NN in comparison with OK in DTM interpolation regarding the uncertainties of ground samples, Guo et al. (2010) reported more accurate results from kriging-based methods than NN-interpolated [36]. Moreover, inverse distance weighting (IDW) interpolation was considered preferable to kriging- and TIN-based methods at a micro-scale [32]. To comprehend the performance of spatial interpolation, previous studies assessed the influences of topographic variations or sampling densities on DEM interpolation by simulating ground samples with different densities [32,36,71,72]. However, there are key distinctions between their experiments and ours, making their findings unsuitable for our problem. First, these studies were not designed for DTM derived from optical stereoscopy (e.g., ArcticDEM). The findings of Guo et al. (2010) [36] and Agüera-Vega et al. (2020) [32] were built on lidar and unmanned aerial vehicle-derived point clouds, different from those derived from satellite-based stereoscopy (way much sparser). In Aguilar et al. (2005) [71] and Šiljeg et al. (2019) [72], the spatial interpolation techniques were directly performed on photogrammetry-derived point clouds/DEMs without discriminating ground from non-ground areas (e.g., vegetation). Second, the random ground sampling strategies adopted in studies working on photogrammetry-based datasets [32,71] did not consider the presence of vegetation, which cannot reflect the real vegetation distribution in the Arctic and forested regions (e.g., clustered). Lastly, there generally lacks a discussion on DTM interpolation regarding the influences of uncertainties (omission or commission errors) in the ground masks. Given these, we will conduct a comprehensive analysis to evaluate the robustness and consistency of spatial interpolation techniques on optical stereoscopy based terrain reconstruction under different scenarios that involve both real data analysis and simulation study.

5. Conclusions

ArcticDEM provides fundamental elevation data to scientific studies in the Arctic region, yet its ecological/hydrological applications are limited by the fact that the height information of surface objects is coupled with the underlying topography in the DEM products. To address this, we proposed a GMM-based ground identification algorithm and compared it with three state-of-the-art filtering-based methods for ArcticDTM prediction. Our results demonstrate that the proposed DTM generation method greatly reduces the differences between ArcticDEMs and lidar-derived DTMs. Compared with filtering-based ground identification, our GMM-based method identifies more reliable ground observations with smaller vertical errors to lidar data. Moreover, natural neighbor performs more robustly in DTM interpolation than ordinary kriging at all study sites. Though specifically designed for DTM extraction from ArcticDEM, our proposed method could be transferred to any other forested regions besides the Arctic region. This study also highlighted the limitation of optical stereoscopy in ground identification over densely forested areas. In future work, optical stereoscopy with different acquisition conditions and other active remote sensing data from spaceborne lidar and SAR will be explored to supplement the ground observations to improve the overall DTM prediction. On the other hand, a simulation study will be designed to fully comprehend the performance of spatial interpolation techniques on optical stereoscopy based DTM estimation under various scenarios.

Author Contributions

Conceptualization, T.Z., D.L.; methodology, T.Z., D.L.; formal analysis, T.Z.; data curation, T.Z.; validation, T.Z.; writing—original draft preparation, T.Z.; writing—review and editing, T.Z., D.L.; supervision, D.L.; funding acquisition, D.L. All authors have read and agreed to the published version of the manuscript.

Funding

This research was funded by the National Science Foundation under grant #1724786.

Data Availability Statement

The source 2 m ArcticDEM strip product and its source WorldView-2 imagery were requested from the Polar Geospatial Center. The lidar data used for model validation can be downloaded from the Alaska Elevation Portal (https://elevation.alaska.gov/). All data used for this study were published on the NSF Arctic Data Center [Identifier ID: urn:uuid:3b100b1d-c057-4026-b909-21cf9d52013b].

Acknowledgments

We would like to thank Mike Cloutier and the Polar Geospatial Center for collecting and processing WorldView-2 imagery and ArcticDEMs.

Conflicts of Interest

The authors declare no conflict of interest.

Appendix A

This appendix describes the mechanisms and parameter settings of the comparative filtering-based ground identification methods, including CSF [21], MBG [27], and MSD [26].
Specifically, CSF places a simulated cloth on top of the reverse DEM point cloud connected by movable particles through “virtual springs”. The net force of internal and external forces then determines the displacement of these particles and forms the final shape of the simulated cloth (i.e., the lowest surface all point clouds can reach). Ground and non-ground points are then separated based on their relative distances to the simulated cloth. There are 4 user-defined parameters in CSF implementation: cloth_resolution (horizontal resolution of the neighboring particles on the simulated cloth), rigidness (rigidness of the cloth with three options: 1, 2, 3), time_step (displacement of particles during each iteration), and bsloopsmooth (boolean input for conducting steep slope post-processing). Here we changed the cloth_resolution to 2 m in accordance with the spatial resolution of our dataset. The remaining parameters: time_step was set as default according to the parameter guide of CSF implementation, and rigidness was set to 1 with post-processing of handling steep slopes.
The extracted non-ground objects from the original DEM in MBG include small objects detected by morphological opening and non-ground segments outlined by segmentation and morphological region growing. The entire process of non-ground segmentation is comprised of four steps: (1) non-ground “seed points” identification by Canny edge detectors and Gaussian probabilistic voting; (2) initial segmentation by morphologically dilating the “seed points”; (3) segment expansion by appending the outer boundary pixels if their relative heights to the mean elevation of these segments are within the given tolerance values; (4) labeling the segment as a non-ground object if its mean elevation is greater than that of its outer perimeter. The user-defined parameters on MBG implementation include: (1) size of structure element (ws, morphological opening) and elevation difference (th) for small object extraction, (2) two parameters (cannysigma, removeedgesvariance) to obtain clean edges from the Canny edge detector, (3) size of local filter (votemaxwinsize), height difference (voteheightdifference) and sigma of Gaussian kernel for “seed points” voting, (4) elevation difference (th) for initial segmentation, and (5) size of structure element (thickstep, morphological dilation), maximum iteration number (segiteration), upper (tu), lower (tl) and final threshold (ts) of elevation difference for regional growing. For our study sites, we changed ws to 21, all other parameters remained the default.
The algorithm of MSD can be outlined in three steps: (1) correcting local topography by removing slope-induced topographic changes (local slope is estimated from the difference between the original and Gaussian blurred DEMs); (2) scanning all pixels from 8 directions using a local filter and identifying the lowest points as ground pixels; (3) classifying the remaining pixels into ground/non-ground based upon their height differences to the lowest points or slope changes to previous pixels. The user-defined parameters in MSD include the size of the local filter (iDistance, step 2), the threshold of height difference (dThrDeltaMin, step 3) and threshold of slope changes (dThrDeltaSlope, step 3). For parameter setting, here we changed dThrDeltaMin to 3.5 m and dThrDeltaSlope to 35 degrees. We additionally noticed that the ground sample distance (Spacing) in the source code was fixed to 1 m in computing SlopeLocal (Algorithm 1) [26]. Given the spatial resolution of our data, we changed Spacing to 2 m.
Figure A1. GMM clustering results by inputting different features, (ac) correspond to Site-1, Site-2, and Site-3, respectively. The areas outlined by circles are highlighted for comparison. Here, MB stands for the WV-2 multispectral bands. Indices refer to the additionally included vegetation (NDVI, MSAVI) and water indices (NDWI) (Section 2.2.1).
Remotesensing 15 02061 g0a1

References

  1. Uysal, M.; Toprak, A.S.; Polat, N. DEM Generation with UAV Photogrammetry and Accuracy Analysis in Sahitler Hill. Measurement 2015, 73, 539–543. [Google Scholar] [CrossRef]
  2. Ariza-Villaverde, A.B.; Jiménez-Hornero, F.J.; De Ravé, E.G. Influence of DEM Resolution on Drainage Network Extraction: A Multifractal Analysis. Geomorphology 2015, 241, 243–254. [Google Scholar] [CrossRef]
  3. Delbridge, B.G.; Bürgmann, R.; Fielding, E.; Hensley, S.; Schulz, W.H. Three-Dimensional Surface Deformation Derived from Airborne Interferometric UAVSAR: Application to the Slumgullion Landslide. J. Geophys. Res. Solid Earth 2016, 121, 3951–3977. [Google Scholar] [CrossRef] [Green Version]
  4. Huang, M.-H.; Fielding, E.J.; Liang, C.; Milillo, P.; Bekaert, D.; Dreger, D.; Salzer, J. Coseismic Deformation and Triggered Landslides of the 2016 Mw 6.2 Amatrice Earthquake in Italy. Geophys. Res. Lett. 2017, 44, 1266–1274. [Google Scholar] [CrossRef] [Green Version]
  5. Akca, D.; Gruen, A.; Smagas, K.; Jimeno, E.; Stylianidis, E.; Altan, O.; Martin, V.S.; Garcia, A.; Poli, D.; Hofer, M. A Precision Estimation Method for Volumetric Changes. In Proceedings of the 2019 9th International Conference on Recent Advances in Space Technologies (RAST), Istanbul, Turkey, 11–14 June 2019; pp. 245–251. [Google Scholar]
  6. Tang, C.; Tanyas, H.; van Westen, C.J.; Tang, C.; Fan, X.; Jetten, V.G. Analysing Post-Earthquake Mass Movement Volume Dynamics with Multi-Source DEMs. Eng. Geol. 2019, 248, 89–101. [Google Scholar] [CrossRef]
  7. Guth, P.L.; Van Niekerk, A.; Grohmann, C.H.; Muller, J.-P.; Hawker, L.; Florinsky, I.V.; Gesch, D.; Reuter, H.I.; Herrera-Cruz, V.; Riazanoff, S.; et al. Digital Elevation Models: Terminology and Definitions. Remote Sens. 2021, 13, 3581. [Google Scholar] [CrossRef]
  8. Meddens, A.J.H.; Vierling, L.A.; Eitel, J.U.H.; Jennewein, J.S.; White, J.C.; Wulder, M.A. Developing 5 m Resolution Canopy Height and Digital Terrain Models from WorldView and ArcticDEM Data. Remote Sens. Environ. 2018, 218, 174–188. [Google Scholar] [CrossRef]
  9. Sadeghi, Y.; St-Onge, B.; Leblon, B.; Simard, M. Canopy Height Model (CHM) Derived from a TanDEM-X InSAR DSM and an Airborne Lidar DTM in Boreal Forest. IEEE J. Sel. Top. Appl. Earth Obs. Remote Sens. 2016, 9, 381–397. [Google Scholar] [CrossRef]
  10. Bolch, T.; Buchroithner, M.; Pieczonka, T.; Kunert, A. Planimetric and Volumetric Glacier Changes in the Khumbu Himal, Nepal, since 1962 Using Corona, Landsat TM and ASTER Data. J. Glaciol. 2008, 54, 592–600. [Google Scholar] [CrossRef] [Green Version]
  11. Kääb, A.; Vollmer, M. Surface Geometry, Thickness Changes and Flow Fields on Creeping Mountain Permafrost: Automatic Extraction by Digital Image Analysis. Permafr. Periglac. Process. 2000, 11, 315–326. [Google Scholar] [CrossRef]
  12. Erdogan, M.; Yilmaz, A. Detection of Building Damage Caused by Van Earthquake Using Image and Digital Surface Model (DSM) Difference. Int. J. Remote Sens. 2019, 40, 3772–3786. [Google Scholar] [CrossRef]
  13. Shen, D.; Qian, T.; Chen, W.; Chi, Y.; Wang, J. A Quantitative Flood-Related Building Damage Evaluation Method Using Airborne LiDAR Data and 2-D Hydraulic Model. Water 2019, 11, 987. [Google Scholar] [CrossRef] [Green Version]
  14. Noh, M.-J.; Howat, I.M. The Surface Extraction from TIN Based Search-Space Minimization (SETSM) Algorithm. ISPRS J. Photogramm. Remote Sens. 2017, 129, 55–76. [Google Scholar] [CrossRef]
  15. Barr, I.D.; Dokukin, M.D.; Kougkoulos, I.; Livingstone, S.J.; Lovell, H.; Małecki, J.; Muraviev, A.Y. Using ArcticDEM to Analyse the Dimensions and Dynamics of Debris-Covered Glaciers in Kamchatka, Russia. Geosciences 2018, 8, 216. [Google Scholar] [CrossRef] [Green Version]
  16. Dai, C.; Howat, I.M.; Freymueller, J.T.; Vijay, S.; Jia, Y. Characterization of the 2008 Phreatomagmatic Eruption of Okmok from ArcticDEM and InSAR: Deposition, Erosion, and Deformation. J. Geophys. Res. Solid Earth 2020, 125, e2019JB018977. [Google Scholar] [CrossRef]
  17. Dai, C.; Howat, I.M. Measuring Lava Flows with ArcticDEM: Application to the 2012–2013 Eruption of Tolbachik, Kamchatka. Geophys. Res. Lett. 2017, 44, 12–133. [Google Scholar] [CrossRef] [Green Version]
  18. Puliti, S.; Hauglin, M.; Breidenbach, J.; Montesano, P.; Neigh, C.S.R.; Rahlf, J.; Solberg, S.; Klingenberg, T.F.; Astrup, R. Modelling Above-Ground Biomass Stock over Norway Using National Forest Inventory Data with ArcticDEM and Sentinel-2 Data. Remote Sens. Environ. 2020, 236, 111501. [Google Scholar] [CrossRef]
  19. Dai, C.; Durand, M.; Howat, I.M.; Altenau, E.H.; Pavelsky, T.M. Estimating River Surface Elevation From ArcticDEM. Geophys. Res. Lett. 2018, 45, 3107–3114. [Google Scholar] [CrossRef]
  20. Xiao, C.; Qin, R.; Xie, X.; Huang, X. Individual Tree Detection and Crown Delineation with 3d Information from Multi-View Satellite Images. Photogramm. Eng. Remote Sens. 2019, 85, 55–63. [Google Scholar] [CrossRef] [Green Version]
  21. Zhang, W.; Qi, J.; Wan, P.; Wang, H.; Xie, D.; Wang, X.; Yan, G. An Easy-to-Use Airborne LiDAR Data Filtering Method Based on Cloth Simulation. Remote Sens. 2016, 8, 501. [Google Scholar] [CrossRef]
  22. Zeybek, M.; Şanlıoğlu, İ. Point Cloud Filtering on UAV Based Point Cloud. Measurement 2019, 133, 99–111. [Google Scholar] [CrossRef]
  23. Evans, J.S.; Hudak, A.T. A Multiscale Curvature Algorithm for Classifying Discrete Return LiDAR in Forested Environments. IEEE Trans. Geosci. Remote Sens. 2007, 45, 1029–1038. [Google Scholar] [CrossRef]
  24. Axelsson, P. DEM Generation from Laser Scanner Data Using Adaptive TIN Models. Int. Arch. Photogramm. Remote Sens. 2000, 33, 110–117. [Google Scholar]
  25. Meng, X.; Wang, L.; Silván-Cárdenas, J.L.; Currit, N. A Multi-Directional Ground Filtering Algorithm for Airborne LIDAR. ISPRS J. Photogramm. Remote Sens. 2009, 64, 117–124. [Google Scholar] [CrossRef] [Green Version]
  26. Perko, R.; Raggam, H.; Roth, P.M. Mapping with Pléiades—End-to-End Workflow. Remote Sens. 2019, 11, 2052. [Google Scholar] [CrossRef] [Green Version]
  27. Özcan, A.H.; Ünsalan, C.; Reinartz, P. Ground Filtering and DTM Generation from DSM Data Using Probabilistic Voting and Segmentation. Int. J. Remote Sens. 2018, 39, 2860–2883. [Google Scholar] [CrossRef]
  28. Pingel, T.J.; Clarke, K.C.; McBride, W.A. An Improved Simple Morphological Filter for the Terrain Classification of Airborne LIDAR Data. ISPRS J. Photogramm. Remote Sens. 2013, 77, 21–30. [Google Scholar] [CrossRef]
  29. Mongus, D.; Lukač, N.; Žalik, B. Ground and Building Extraction from LiDAR Data Based on Differential Morphological Profiles and Locally Fitted Surfaces. ISPRS J. Photogramm. Remote Sens. 2014, 93, 145–156. [Google Scholar] [CrossRef]
  30. Tian, J.; Krauss, T.; Reinartz, P. DTM Generation in Forest Regions from Satellite Stereo Imagery. Int. Arch. Photogramm. Remote Sens. Spat. Inf. Sci. 2014, 40, 401. [Google Scholar] [CrossRef]
  31. St-Onge, B.; Vega, C.; Fournier, R.A.; Hu, Y. Mapping Canopy Height Using a Combination of Digital Stereo-Photogrammetry and Lidar. Int. J. Remote Sens. 2008, 29, 3343–3364. [Google Scholar] [CrossRef]
  32. Agüera-Vega, F.; Agüera-Puntas, M.; Martínez-Carricondo, P.; Mancini, F.; Carvajal, F. Effects of Point Cloud Density, Interpolation Method and Grid Size on Derived Digital Terrain Model Accuracy at Micro Topography Level. Int. J. Remote Sens. 2020, 41, 8281–8299. [Google Scholar] [CrossRef]
  33. Bater, C.W.; Coops, N.C. Evaluating Error Associated with Lidar-Derived DEM Interpolation. Comput. Geosci. 2009, 35, 289–300. [Google Scholar] [CrossRef]
  34. Garnero, G.; Godone, D. Comparisons between Different Interpolation Techniques. Int. Arch. Photogramm. Remote Sens. Spat. Inf. Sci. 2013, 5, W3. [Google Scholar] [CrossRef] [Green Version]
  35. Ghandehari, M.; Buttenfield, B.P.; Farmer, C.J.Q. Comparing the Accuracy of Estimated Terrain Elevations across Spatial Resolution. Int. J. Remote Sens. 2019, 40, 5025–5049. [Google Scholar] [CrossRef]
  36. Guo, Q.; Li, W.; Yu, H.; Alvarez, O. Effects of Topographic Variability and Lidar Sampling Density on Several DEM Interpolation Methods. Photogramm. Eng. Remote Sens. 2010, 76, 701–712. [Google Scholar] [CrossRef] [Green Version]
  37. Chen, C.; Li, Y. A Fast Global Interpolation Method for Digital Terrain Model Generation from Large LiDAR-Derived Data. Remote Sens. 2019, 11, 1324. [Google Scholar] [CrossRef] [Green Version]
  38. Meng, X.; Lin, Y.; Yan, L.; Gao, X.; Yao, Y.; Wang, C.; Luo, S. Airborne LiDAR Point Cloud Filtering by a Multilevel Adaptive Filter Based on Morphological Reconstruction and Thin Plate Spline Interpolation. Electronics 2019, 8, 1153. [Google Scholar] [CrossRef] [Green Version]
  39. Razak, K.A.; Santangelo, M.; Van Westen, C.J.; Straatsma, M.W.; de Jong, S.M. Generating an Optimal DTM from Airborne Laser Scanning Data for Landslide Mapping in a Tropical Forest Environment. Geomorphology 2013, 190, 112–125. [Google Scholar] [CrossRef]
  40. Stereńczak, K.; Ciesielski, M.; Balazy, R.; Zawiła-Niedźwiecki, T. Comparison of Various Algorithms for DTM Interpolation from LIDAR Data in Dense Mountain Forests. Eur. J. Remote Sens. 2016, 49, 599–621. [Google Scholar] [CrossRef]
  41. Viereck, L.A.; Little, E.L. Alaska Trees and Shrubs; US Forest Service: Washington, DC, USA, 1972.
  42. Porter, C.; Morin, P.; Howat, I.; Noh, M.-J.; Bates, B.; Peterman, K.; Keesey, S.; Schlenk, M.; Gardiner, J.; Tomko, K.; et al. ArcticDEM. version 3. 2018; Harvard Dataverse, V1. [Google Scholar] [CrossRef]
  43. Hubbard, T.D.; Koehler, R.D.; Combellick, R.A. High-Resolution Lidar Data for Alaska Infrastructure Corridors; Alaska Division of Geological & Geophysical Surveys: Fairbanks, AK, USA, 2011; Volume 3, p. 291. [CrossRef]
  44. Rusinkiewicz, S.; Levoy, M. Efficient Variants of the ICP Algorithm. In Proceedings of the Third International Conference on 3-D Digital Imaging and Modeling, Quebec City, QC, Canada, 28 May–1 June 2001; pp. 145–152. [Google Scholar]
  45. McLachlan, G.J.; Basford, K.E. Mixture Models. Inference and Applications to Clustering; Dekker: New York, NY, USA, 1988. [Google Scholar]
  46. Raykov, Y.P.; Boukouvalas, A.; Baig, F.; Little, M.A. What to Do When K-Means Clustering Fails: A Simple yet Principled Alternative Algorithm. PLoS ONE 2016, 11, e0162259. [Google Scholar] [CrossRef] [Green Version]
  47. Biernacki, C.; Celeux, G.; Govaert, G. Assessing a Mixture Model for Clustering with the Integrated Completed Likelihood. IEEE Trans. Pattern Anal. Mach. Intell. 2000, 22, 719–725. [Google Scholar] [CrossRef]
  48. McLachlan, G.J.; Peel, D. Finite Mixture Models; John Wiley & Sons: Hoboken, NJ, USA, 2004; ISBN 978-0-471-65406-3. [Google Scholar]
  49. Pedregosa, F.; Varoquaux, G.; Gramfort, A.; Michel, V.; Thirion, B.; Grisel, O.; Blondel, M.; Prettenhofer, P.; Weiss, R.; Dubourg, V. Scikit-Learn: Machine Learning in Python. J. Mach. Learn. Res. 2011, 12, 2825–2830. [Google Scholar]
  50. Bailey, T.L.; Elkan, C. Fitting a Mixture Model by Expectation Maximization to Discover Motifs in Bipolymers. Proc. Int. Conf. Intell. Syst. Mol. Biol. 1994, 2, 28–36. [Google Scholar] [PubMed]
  51. Schwarz, G. Estimating the Dimension of a Model. Ann. Stat. 1978, 6, 461–464. [Google Scholar] [CrossRef]
  52. Qi, J.; Chehbouni, A.; Huete, A.R.; Kerr, Y.H.; Sorooshian, S. A Modified Soil Adjusted Vegetation Index. Remote Sens. Environ. 1994, 48, 119–126. [Google Scholar] [CrossRef]
  53. McFeeters, S.K. The Use of the Normalized Difference Water Index (NDWI) in the Delineation of Open Water Features. Int. J. Remote Sens. 1996, 17, 1425–1432. [Google Scholar] [CrossRef]
  54. Cressie, N. Spatial Prediction and Ordinary Kriging. Math. Geol. 1988, 20, 405–421. [Google Scholar] [CrossRef]
  55. Zhu, X.; Liu, D.; Chen, J. A New Geostatistical Approach for Filling Gaps in Landsat ETM+ SLC-off Images. Remote Sens. Environ. 2012, 124, 49–60. [Google Scholar] [CrossRef]
  56. Tily, R.; Brace, C.J. A Study of Natural Neighbour Interpolation and Its Application to Automotive Engine Test Data. Proc. Inst. Mech. Eng. Part J. Automob. Eng. 2006, 220, 1003–1017. [Google Scholar] [CrossRef]
  57. Pebesma, E.J. Multivariable Geostatistics in S: The Gstat Package. Comput. Geosci. 2004, 30, 683–691. [Google Scholar] [CrossRef]
  58. Ribeiro, P.J., Jr.; Diggle, P.J. GeoR: A Package for Geostatistical Analysis. R News 2001, 1, 14–18. [Google Scholar]
  59. Barsi, Á.; Kugler, Z.; László, I.; Szabó, G.; Abdulmutalib, H.M. Accuracy Dimensions in Remote Sensing. Int. Arch. Photogramm. Remote Sens. Spat. Inf. Sci. 2018, XLII-3, 61–67. [Google Scholar] [CrossRef] [Green Version]
  60. DeWitt, J.D.; Warner, T.A.; Chirico, P.G.; Bergstresser, S.E. Creating High-Resolution Bare-Earth Digital Elevation Models (DEMs) from Stereo Imagery in an Area of Densely Vegetated Deciduous Forest Using Combinations of Procedures Designed for Lidar Point Cloud Filtering. GISci. Remote Sens. 2017, 54, 552–572. [Google Scholar] [CrossRef]
  61. McDaniel, M.W.; Nishihata, T.; Brooks, C.A.; Salesses, P.; Iagnemma, K. Terrain Classification and Identification of Tree Stems Using Ground-Based LiDAR. J. Field Robot. 2012, 29, 891–910. [Google Scholar] [CrossRef]
  62. Scott, G.J.; England, M.R.; Starms, W.A.; Marcum, R.A.; Davis, C.H. Training Deep Convolutional Neural Networks for Land–Cover Classification of High-Resolution Imagery. IEEE Geosci. Remote Sens. Lett. 2017, 14, 549–553. [Google Scholar] [CrossRef]
  63. Bandara, K.R.M.U.; Samarakoon, L.; Shrestha, R.P.; Kamiya, Y. Automated Generation of Digital Terrain Model Using Point Clouds of Digital Surface Model in Forest Area. Remote Sens. 2011, 3, 845–858. [Google Scholar] [CrossRef] [Green Version]
  64. Montesano, P.M.; Neigh, C.; Sun, G.; Duncanson, L.; Van Den Hoek, J.; Ranson, K.J. The Use of Sun Elevation Angle for Stereogrammetric Boreal Forest Height in Open Canopies. Remote Sens. Environ. 2017, 196, 76–88. [Google Scholar] [CrossRef] [Green Version]
  65. Vastaranta, M.; Yu, X.; Luoma, V.; Karjalainen, M.; Saarinen, N.; Wulder, M.A.; White, J.C.; Persson, H.J.; Hollaus, M.; Yrttimaa, T.; et al. Aboveground Forest Biomass Derived Using Multiple Dates of WorldView-2 Stereo-Imagery: Quantifying the Improvement in Estimation Accuracy. Int. J. Remote Sens. 2018, 39, 8766–8783. [Google Scholar] [CrossRef] [Green Version]
  66. Abdalati, W.; Zwally, H.J.; Bindschadler, R.; Csatho, B.; Farrell, S.L.; Fricker, H.A.; Harding, D.; Kwok, R.; Lefsky, M.; Markus, T.; et al. The ICESat-2 Laser Altimetry Mission. Proc. IEEE 2010, 98, 735–751. [Google Scholar] [CrossRef]
  67. Cartus, O.; Kellndorfer, J.; Rombach, M.; Walker, W. Mapping Canopy Height and Growing Stock Volume Using Airborne Lidar, ALOS PALSAR and Landsat ETM+. Remote Sens. 2012, 4, 3320–3345. [Google Scholar] [CrossRef] [Green Version]
  68. Urbazaev, M.; Cremer, F.; Migliavacca, M.; Reichstein, M.; Schmullius, C.; Thiel, C. Potential of Multi-Temporal ALOS-2 PALSAR-2 ScanSAR Data for Vegetation Height Estimation in Tropical Forests of Mexico. Remote Sens. 2018, 10, 1277. [Google Scholar] [CrossRef] [Green Version]
  69. Bartsch, A.; Widhalm, B.; Leibman, M.; Ermokhina, K.; Kumpula, T.; Skarin, A.; Wilcox, E.J.; Jones, B.M.; Frost, G.V.; Höfler, A.; et al. Feasibility of Tundra Vegetation Height Retrieval from Sentinel-1 and Sentinel-2 Data. Remote Sens. Environ. 2020, 237, 111515. [Google Scholar] [CrossRef]
  70. Carreiras, J.M.; Quegan, S.; Le Toan, T.; Minh, D.H.T.; Saatchi, S.S.; Carvalhais, N.; Reichstein, M.; Scipal, K. Coverage of High Biomass Forests by the ESA BIOMASS Mission under Defense Restrictions. Remote Sens. Environ. 2017, 196, 154–162. [Google Scholar] [CrossRef]
  71. Aguilar, F.J.; Agüera, F.; Aguilar, M.A.; Carvajal, F. Effects of Terrain Morphology, Sampling Density, and Interpolation Methods on Grid DEM Accuracy. Photogramm. Eng. Remote Sens. 2005, 71, 805–816. [Google Scholar] [CrossRef] [Green Version]
  72. Šiljeg, A.; Barada, M.; Marić, I.; Roland, V. The Effect of User-Defined Parameters on DTM Accuracy—Development of a Hybrid Model. Appl. Geomat. 2019, 11, 81–96. [Google Scholar] [CrossRef]
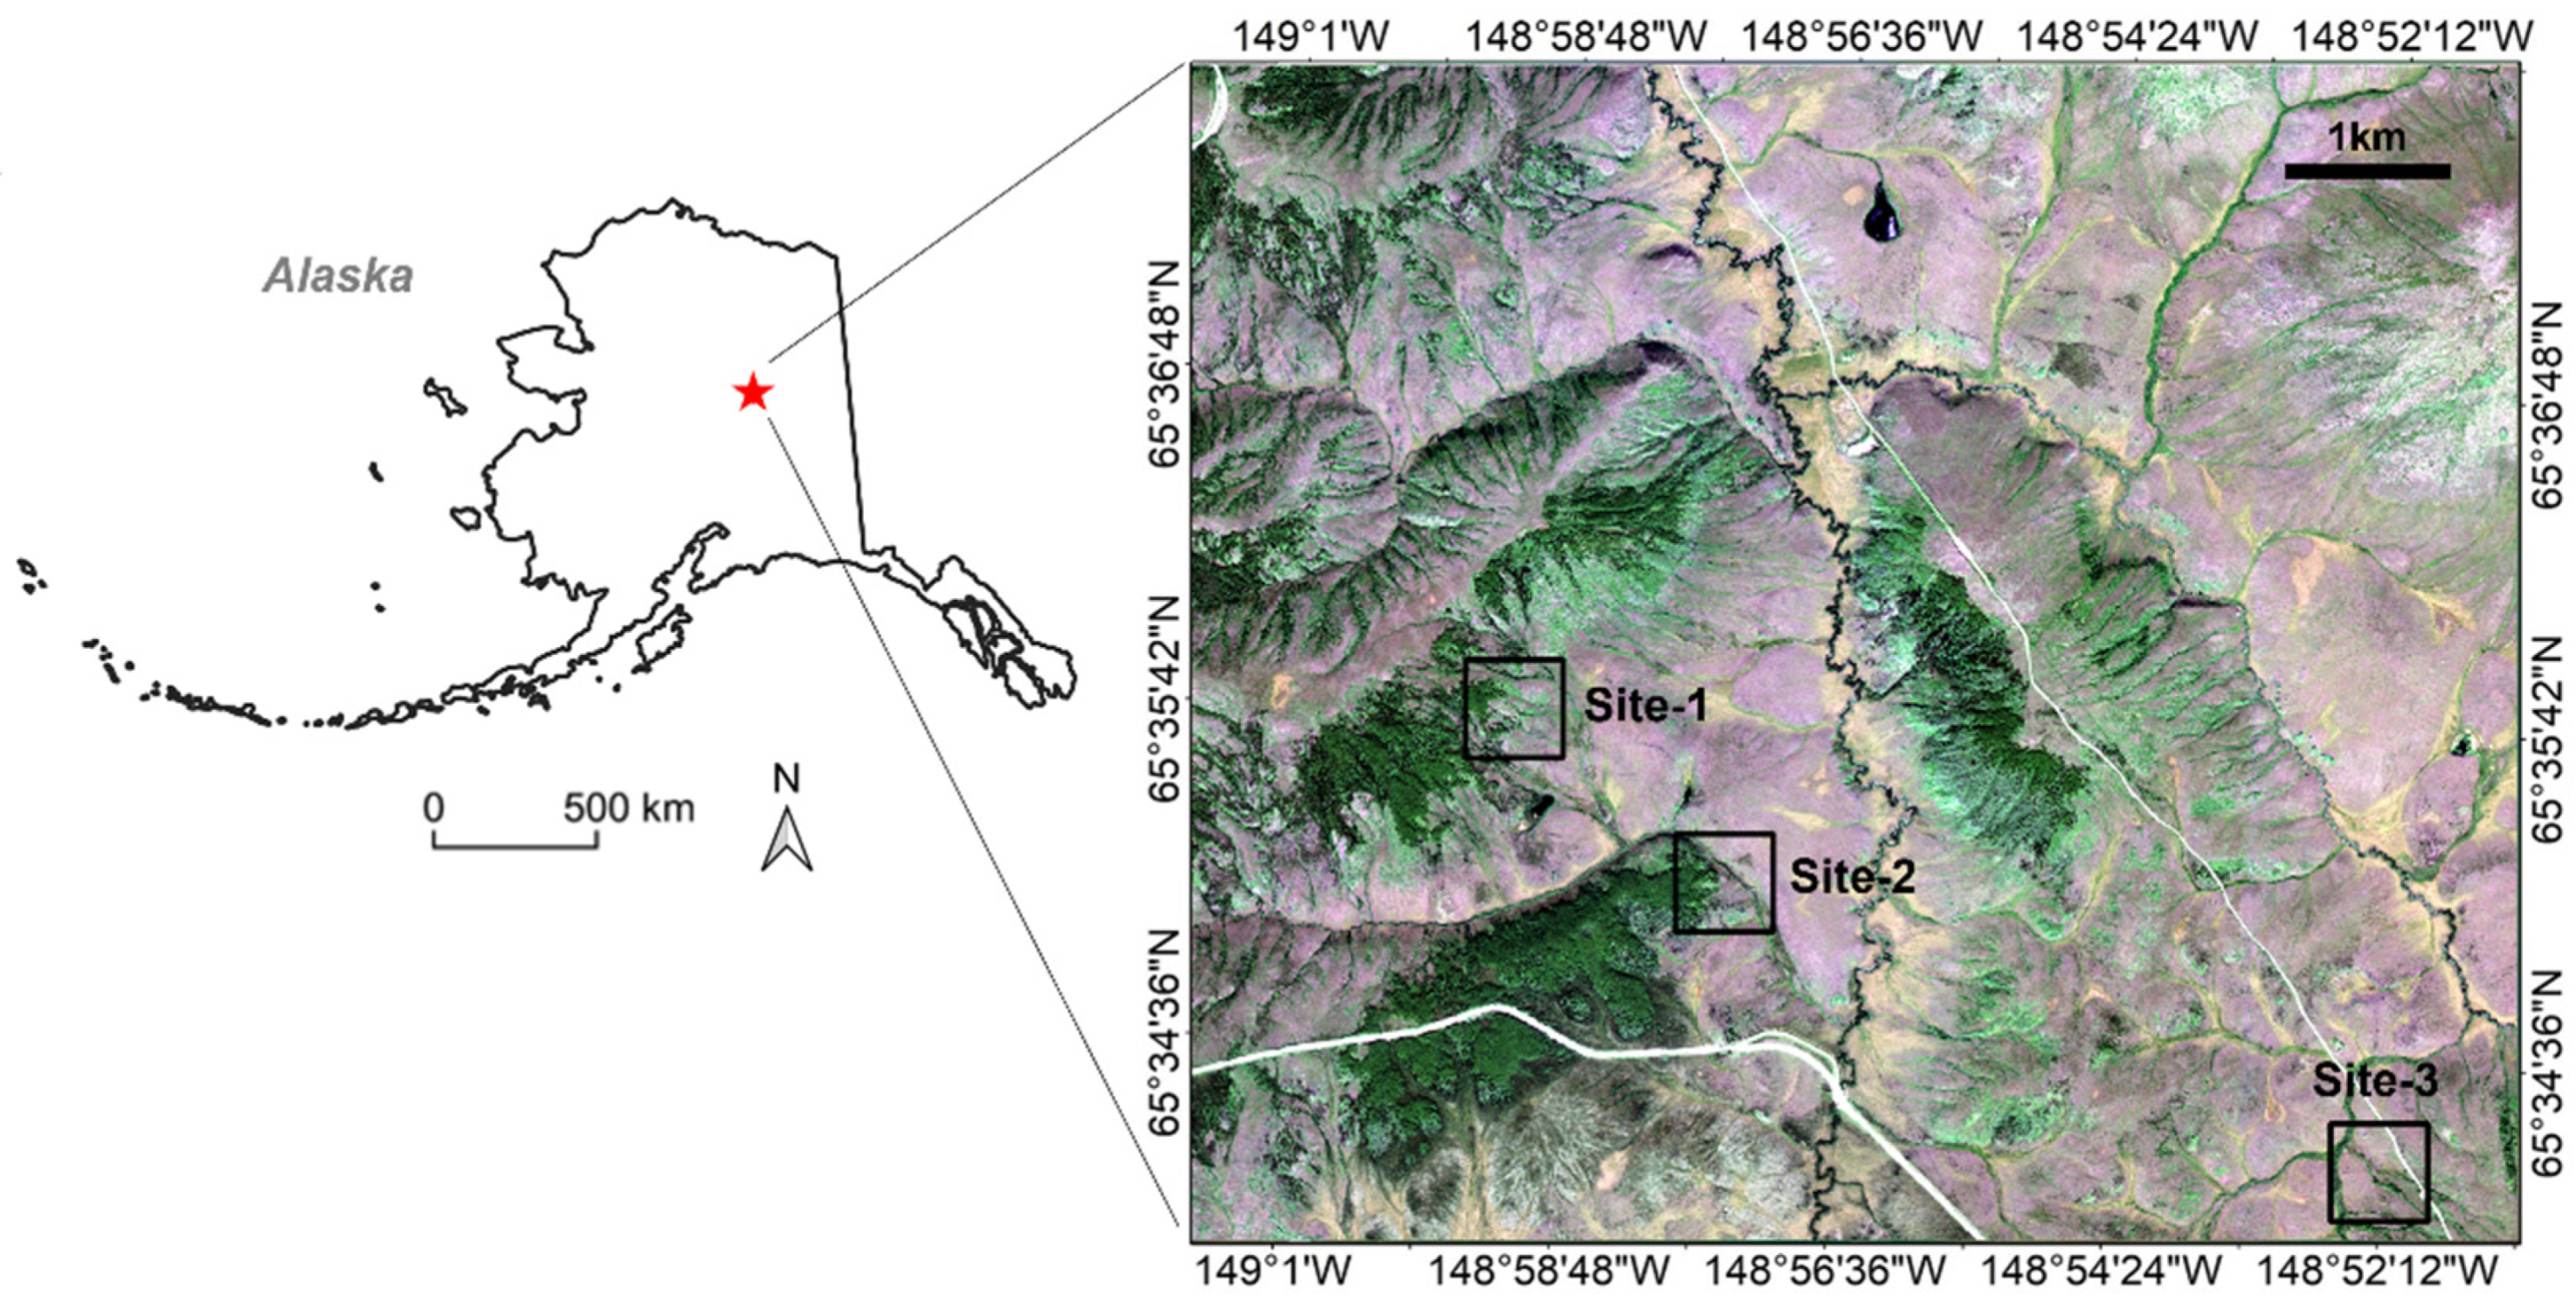
Figure 1. Overview of the study region displayed by the WV-2 composited RGB imagery of which the geographic location in Alaska is marked by a red star. Site-1, Site-2, and Site-3 are indicated by black boxes.
Remotesensing 15 02061 g001
Figure 2. Vegetation and topography characteristics of three study sites, (ac) correspond to Site-1, Site-2, and Site-3, respectively. The RGB image was composited from the WV-2 imagery, and the white surface at Site-3 is the concrete road.
Remotesensing 15 02061 g002
Figure 3. Flowchart of the proposed method. Bold letter indicates the output from the last step.
Remotesensing 15 02061 g003
Figure 4. Pixel-wise clustering results and the associated uncertainty maps, (ac) correspond to Site-1, Site-2, and Site-3, respectively. The four clusters 1, 2, 3, 4 were identified as pseudo-ground, darker regions (e.g., shadow, dark green vegetation), green vegetation, and concrete road, respectively. Clustering results at locations outlined by black boxes were magnified for better comparison with satellite RGB images. Uncertainty maps display the cluster membership probabilities. Higher cluster membership probabilities imply purer clustering results with lower confidences being other clusters, whereas lower probabilities suggest more ambiguities in discriminating one cluster from others.
Remotesensing 15 02061 g004
Figure 5. GMM-based ground masks overlaid with DEM differences (ArcticDEM—lidar-derived DTM), (ac) correspond to Site-1, Site-2, and Site-3, respectively. The void areas displayed by grey color represent the non-ground locations in all ground masks. Positive DEM differences indicate vegetated areas. Here, GMM represents the identified pseudo-ground cluster and GMM + uncertainty indicates refinement by cluster membership probabilities.
Remotesensing 15 02061 g005
Figure 6. Ground masks derived from GMM, K-means, and three comparative ground filtering methods overlaid with DEM differences (ArcticDEM − lidar-derived DTM), (ac) correspond to Site-1, Site-2, and Site-3, respectively. The void areas displayed by grey color represent the non-ground locations in all ground masks. Positive DEM differences indicate vegetated areas. Here, GMM represents pseudo-ground pixels refined by both clustering membership probability > 0.8 and morphological erosion.
Remotesensing 15 02061 g006
Figure 7. ArcticDEM and DTM interpolation at Site-1: (a) ArcticDEM, DTMs predicted by OK and NN spatial interpolation techniques, and (b) elevation difference maps between ArcticDEM, the predicted DTMs and the reference lidar-derived DTMs.
Remotesensing 15 02061 g007
Figure 8. ArcticDEM and DTM interpolation at Site-2: (a) ArcticDEM, DTMs predicted by OK and NN spatial interpolation techniques, and (b) elevation difference maps between ArcticDEM, the predicted DTMs and the reference lidar-derived DTMs.
Remotesensing 15 02061 g008
Figure 9. ArcticDEM and DTM interpolation at Site-3: (a) ArcticDEM, DTMs predicted by OK and NN spatial interpolation techniques, and (b) elevation difference maps between ArcticDEM, the predicted DTMs and the reference lidar-derived DTMs.
Remotesensing 15 02061 g009
Figure 10. Boxplots of DEM differences, (ac) correspond to Site-1, Site-2, and Site-3, respectively. Here, boxplots were analyzed over non-ground pixels (excluding areas outside the triangulation network) with grey, green, and blue dashed lines indicating the locations of 0 m, 5 m, 10 m DEM differences. Median, mean values were marked by red solid line, blue dot, respectively.
Remotesensing 15 02061 g010
Table 1. Classification accuracy assessment on ground identification. Bold numbers indicate the best results.
MethodTPTITIIOAF1
Site-1GMM0.1290.4130.6820.6340.413
K-means0.2680.4580.3360.6370.597
CSF0.3740.5240.0740.5580.629
MSD0.3510.5550.1320.5080.588
MBG0.3380.4970.1650.6000.628
Site-2GMM0.2630.2880.3950.7220.654
K-means0.3330.3830.2340.6910.683
CSF0.3590.4370.1730.6460.670
MSD0.3320.4840.2360.5870.616
MBG0.3610.4670.1690.6100.649
Site-3GMM0.3890.3140.3060.6510.690
K-means0.4890.3550.1260.660.742
CSF0.5370.4210.0410.5870.722
MSD0.5380.4340.0390.5660.712
MBG0.4990.3860.1090.6260.727
Table 2. Vertical accuracy assessment on ground identification. Bold numbers indicate the best results.
MethodRMSE (m)rRMSEMAE (m)ME (m)
Site-1GMM0.3280.0060.2500.058
K-means0.5380.0100.3390.174
CSF2.5160.0470.8360.689
MSD4.0000.0741.5761.443
MBG0.8670.0160.4380.267
Site-2GMM0.3430.0050.2560.039
K-means0.6350.0100.3500.143
CSF1.4670.0230.5340.347
MSD3.3500.0521.2721.099
MBG2.4110.0370.8120.603
Site-3GMM0.3480.0060.2330.047
K-means0.5220.0090.3050.146
CSF0.7800.0140.4420.306
MSD0.8800.0160.5100.378
MBG0.4320.0080.2980.146
Table 3. Model evaluation metrics at Site-1. Areas outside the triangulation network were not evaluated for both ArcticDEM and the interpolated DTMs. Percentages of lower (LE) and upper (UE) extreme values were calculated in non-ground areas. Bold numbers indicate the best results.
MethodRMSE (m)rRMSEMAE (m)ME (m)LE (%)UE (%)
ArcticDEM4.7220.0882.1362.0150.00019.282
OK0.6770.0130.4700.1950.1010.288
NN0.6480.0120.4490.1130.1540.054
Table 4. Model evaluation metrics at Site-2. Areas outside the triangulation network were not evaluated for both ArcticDEM and the interpolated DTMs. Percentages of lower (LE) and upper (UE) extreme values were calculated in non-ground areas. Bold numbers indicate the best results.
MethodRMSE (m)rRMSEMAE (m)ME (m)LE (%)UE (%)
ArcticDEM4.8410.0752.1061.9390.01524.104
OK3.0280.0471.4590.3548.27715.318
NN1.6770.0260.870.4233.2298.734
Table 5. Model evaluation metrics at Site-3. Areas outside the triangulation network were not evaluated for both ArcticDEM and the interpolated DTMs. Percentages of lower (LE) and upper (UE) extreme values were calculated in non-ground areas. Bold numbers indicate the best results.
MethodRMSE (m)rRMSEMAE (m)ME (m)LE (%)UE (%)
ArcticDEM1.0710.0190.5940.4670.0009.487
OK0.5630.0100.3530.2030.0000.902
NN0.5210.0090.3420.2210.0050.326
Disclaimer/Publisher’s Note: The statements, opinions and data contained in all publications are solely those of the individual author(s) and contributor(s) and not of MDPI and/or the editor(s). MDPI and/or the editor(s) disclaim responsibility for any injury to people or property resulting from any ideas, methods, instructions or products referred to in the content.