
Response of the Stream Geomorphic Index to Fault Activity in the Lianfeng–Ningnan Segment (LNS) of the Lianfeng Fault on the Eastern Margin of the Tibetan Plateau


Abstract
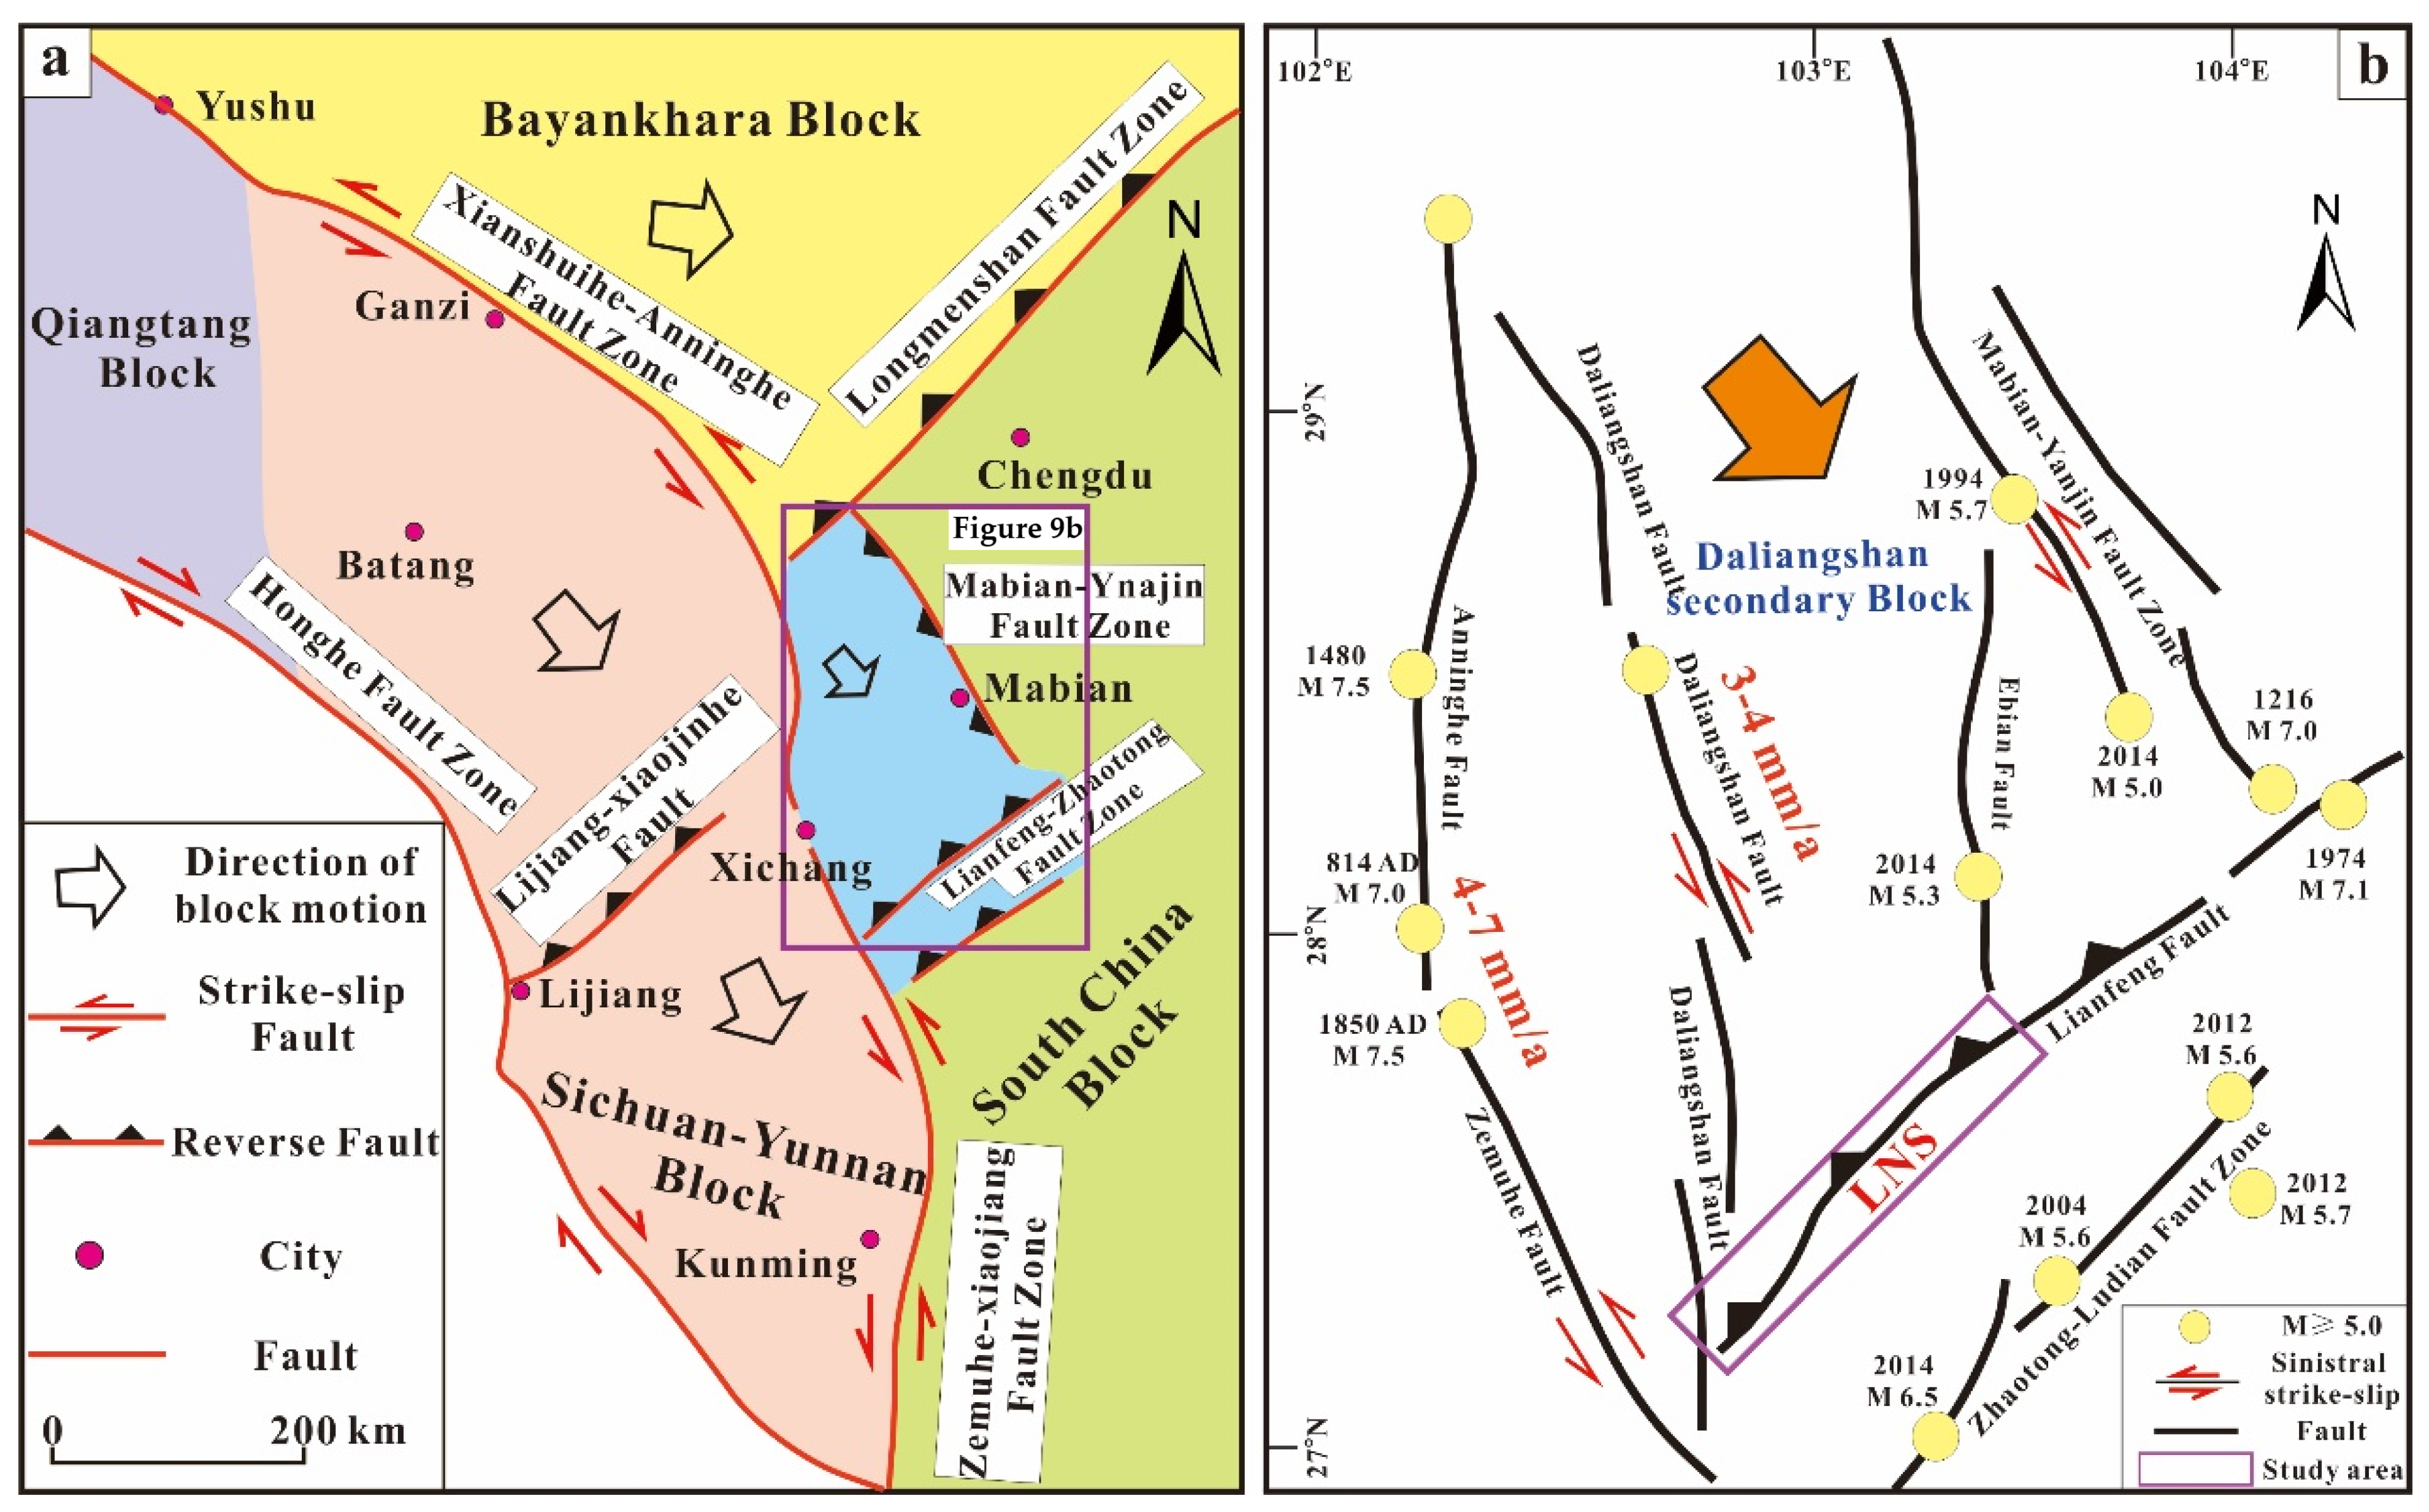
:1. Introduction
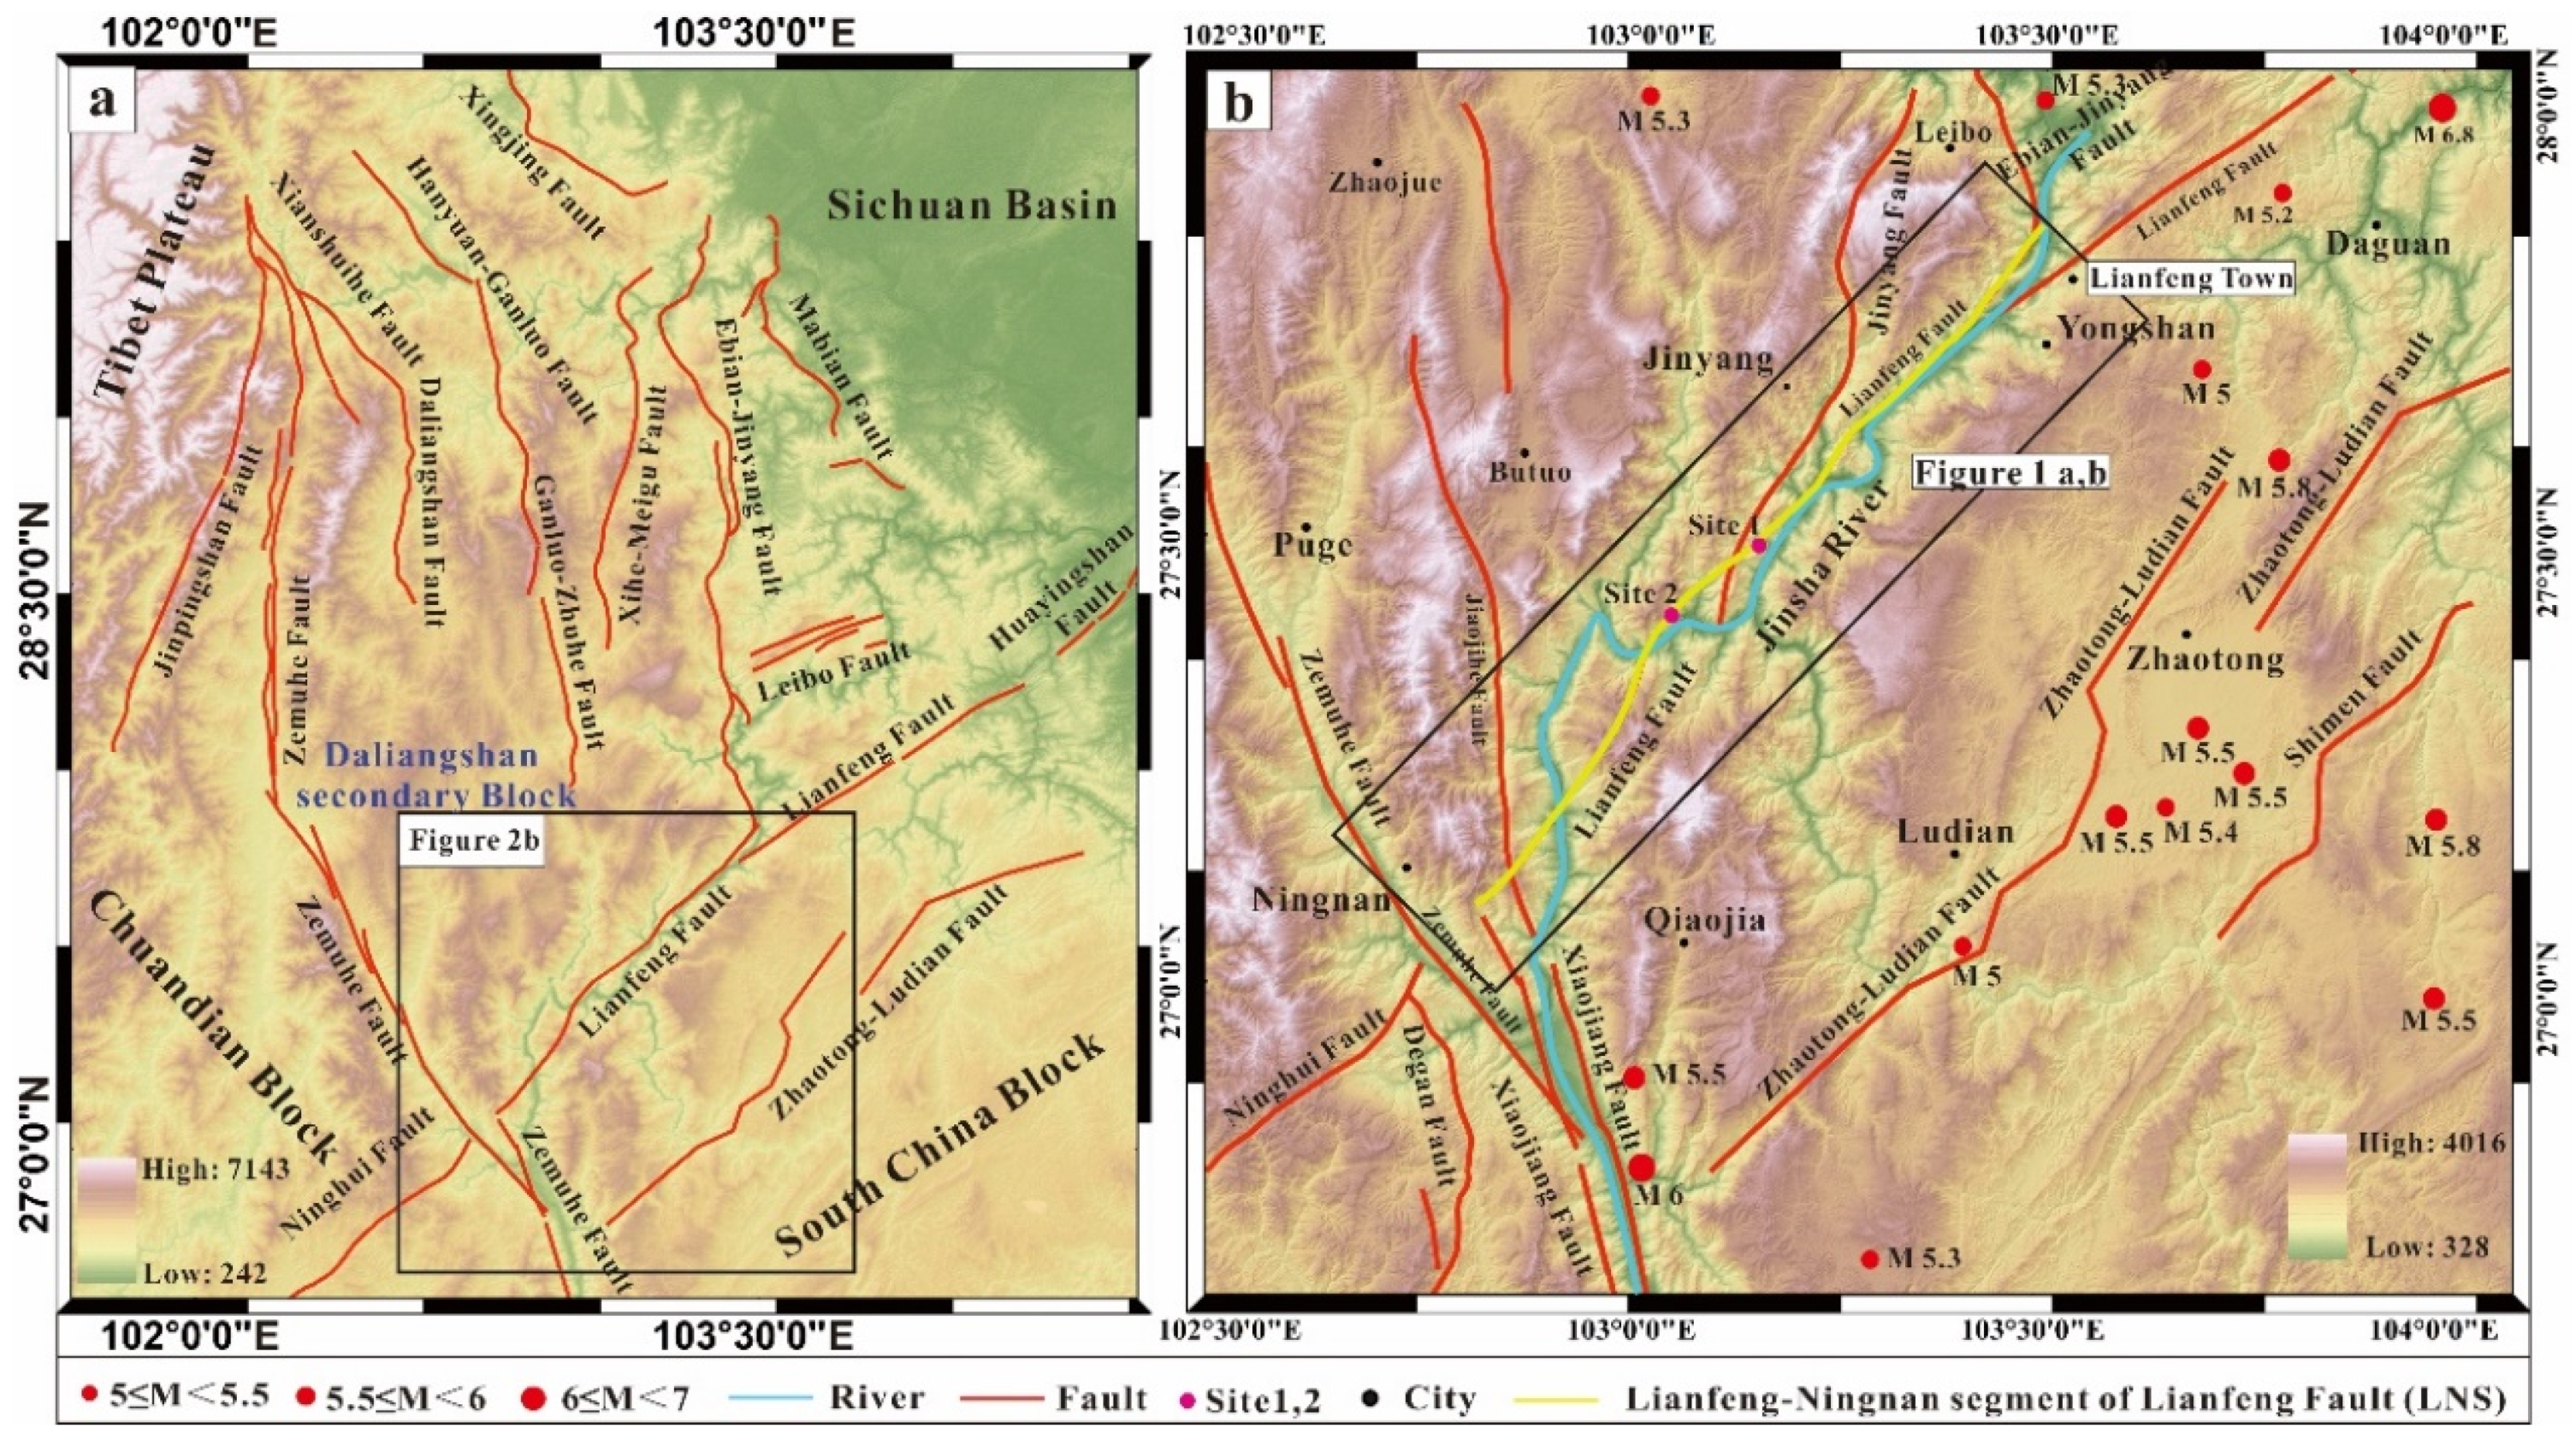
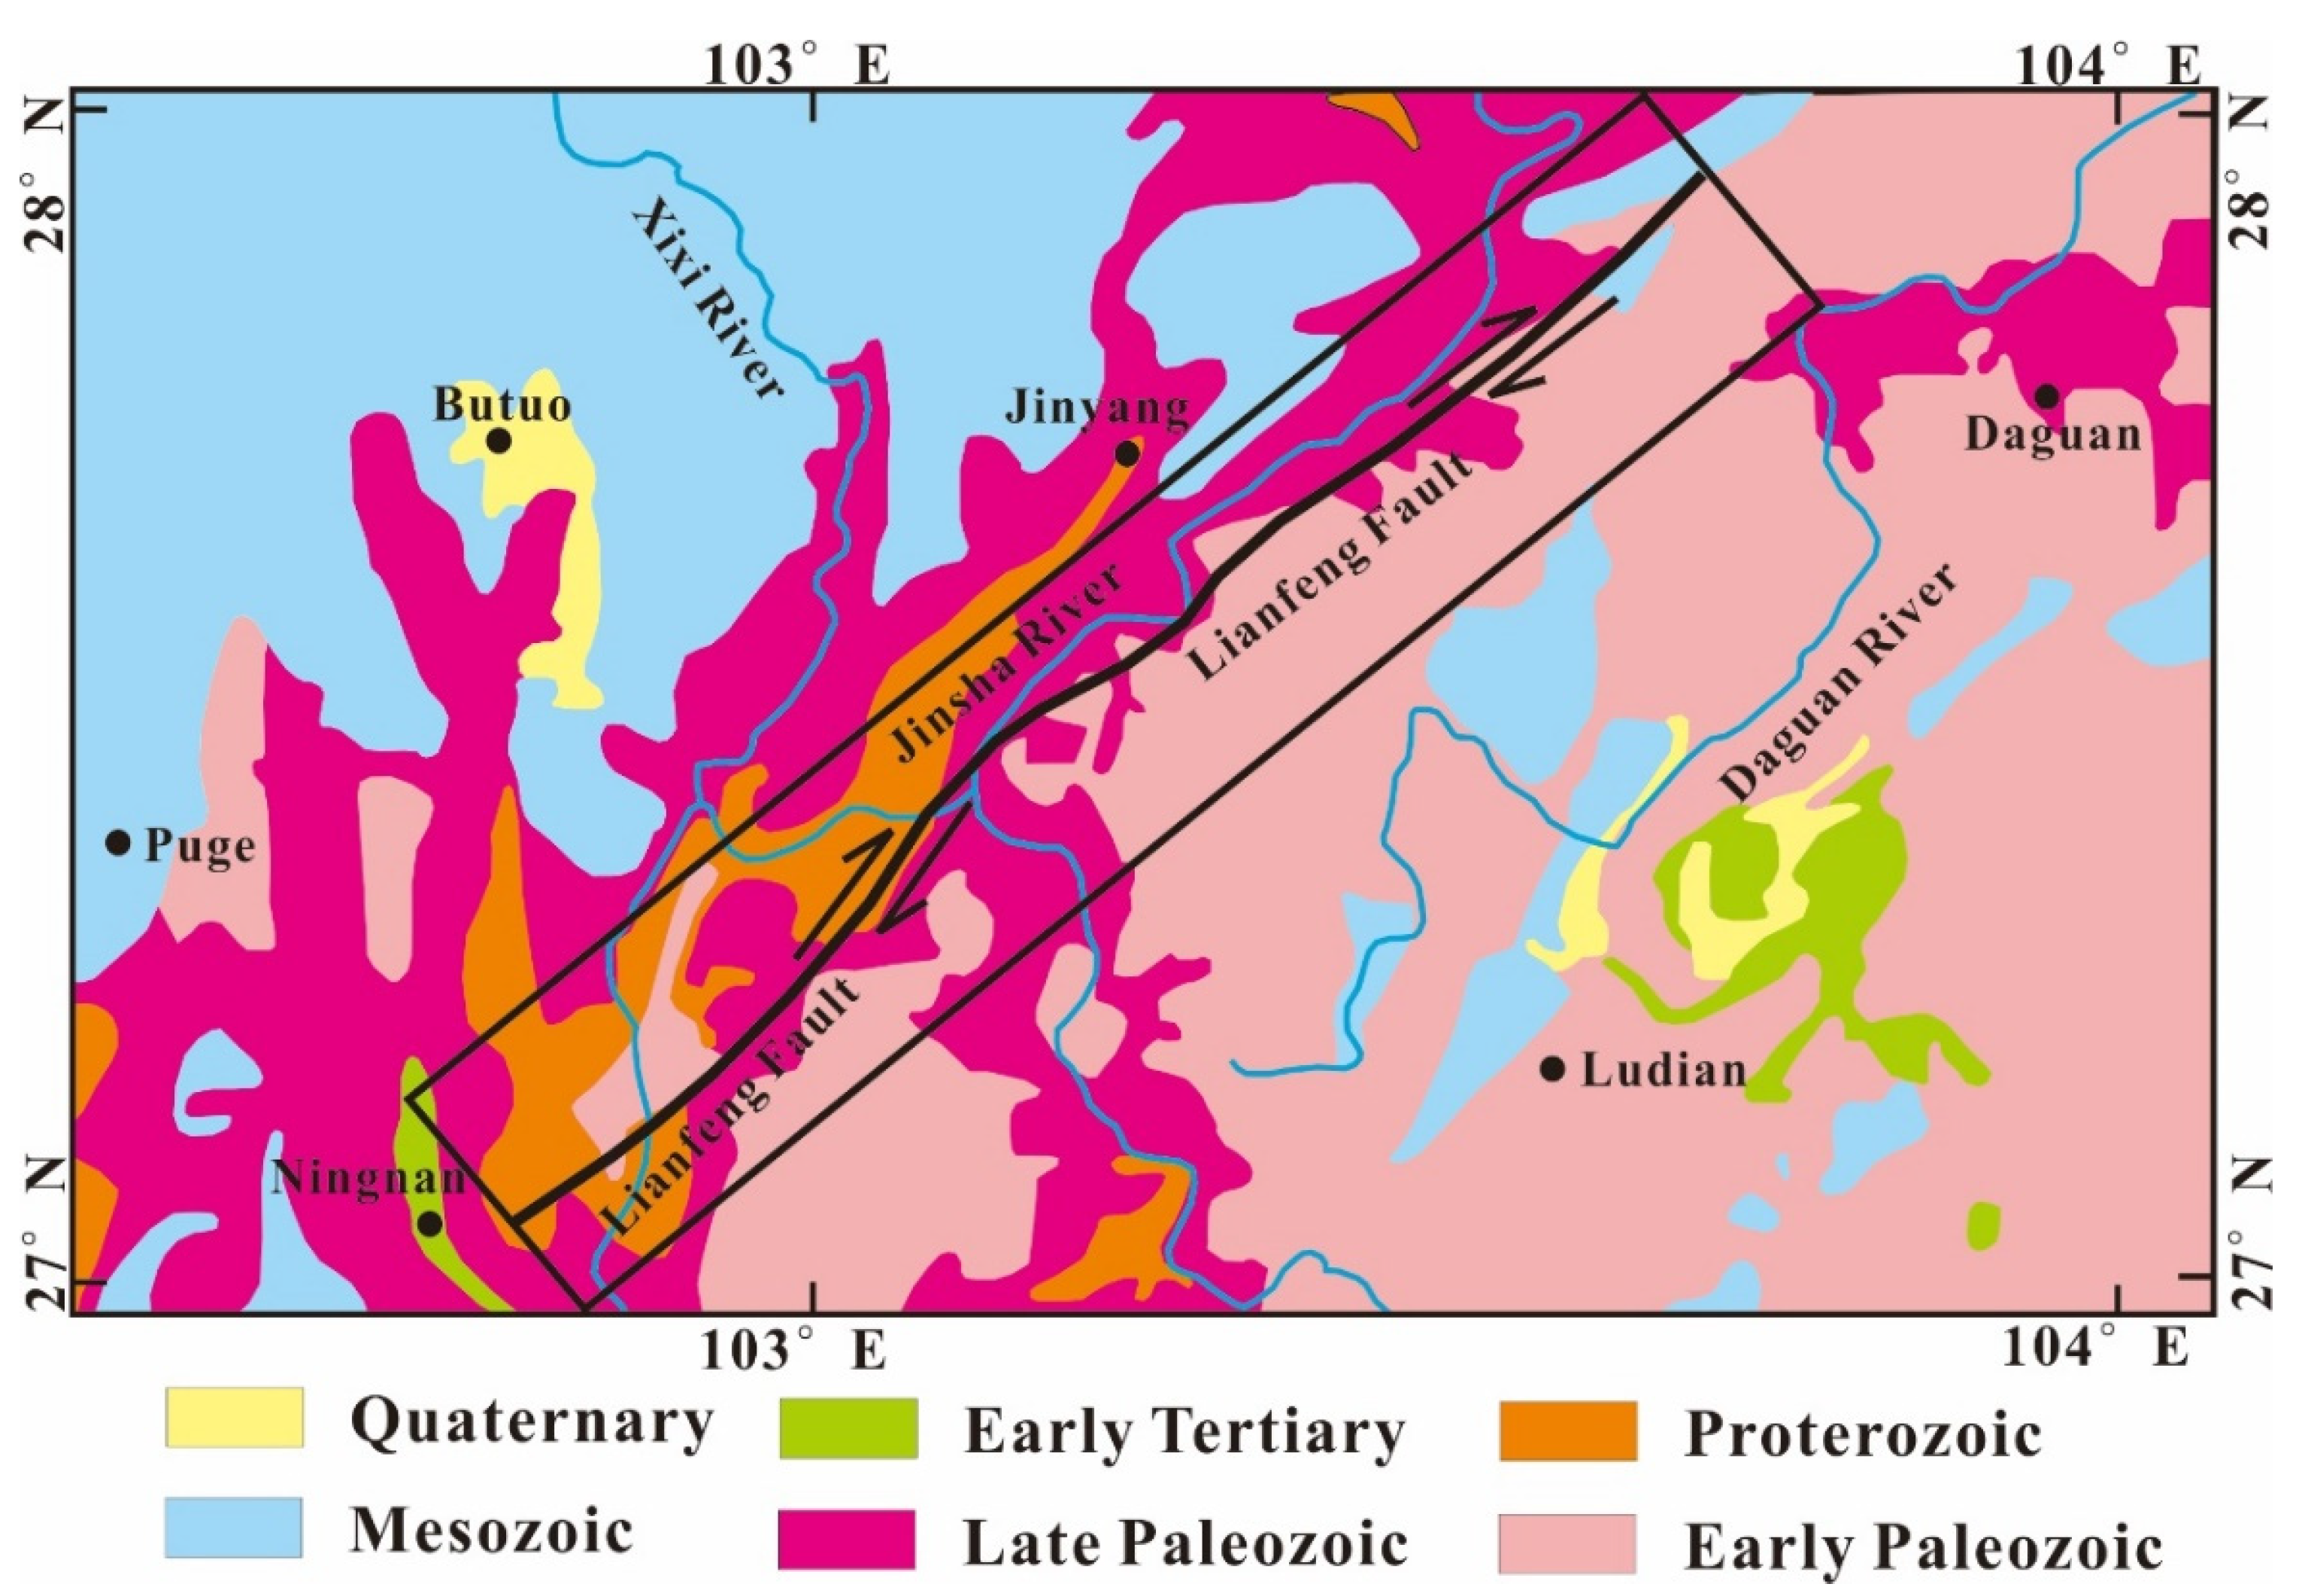
2. Regional Seismic and Geological Tectonic Setting
3. Methods
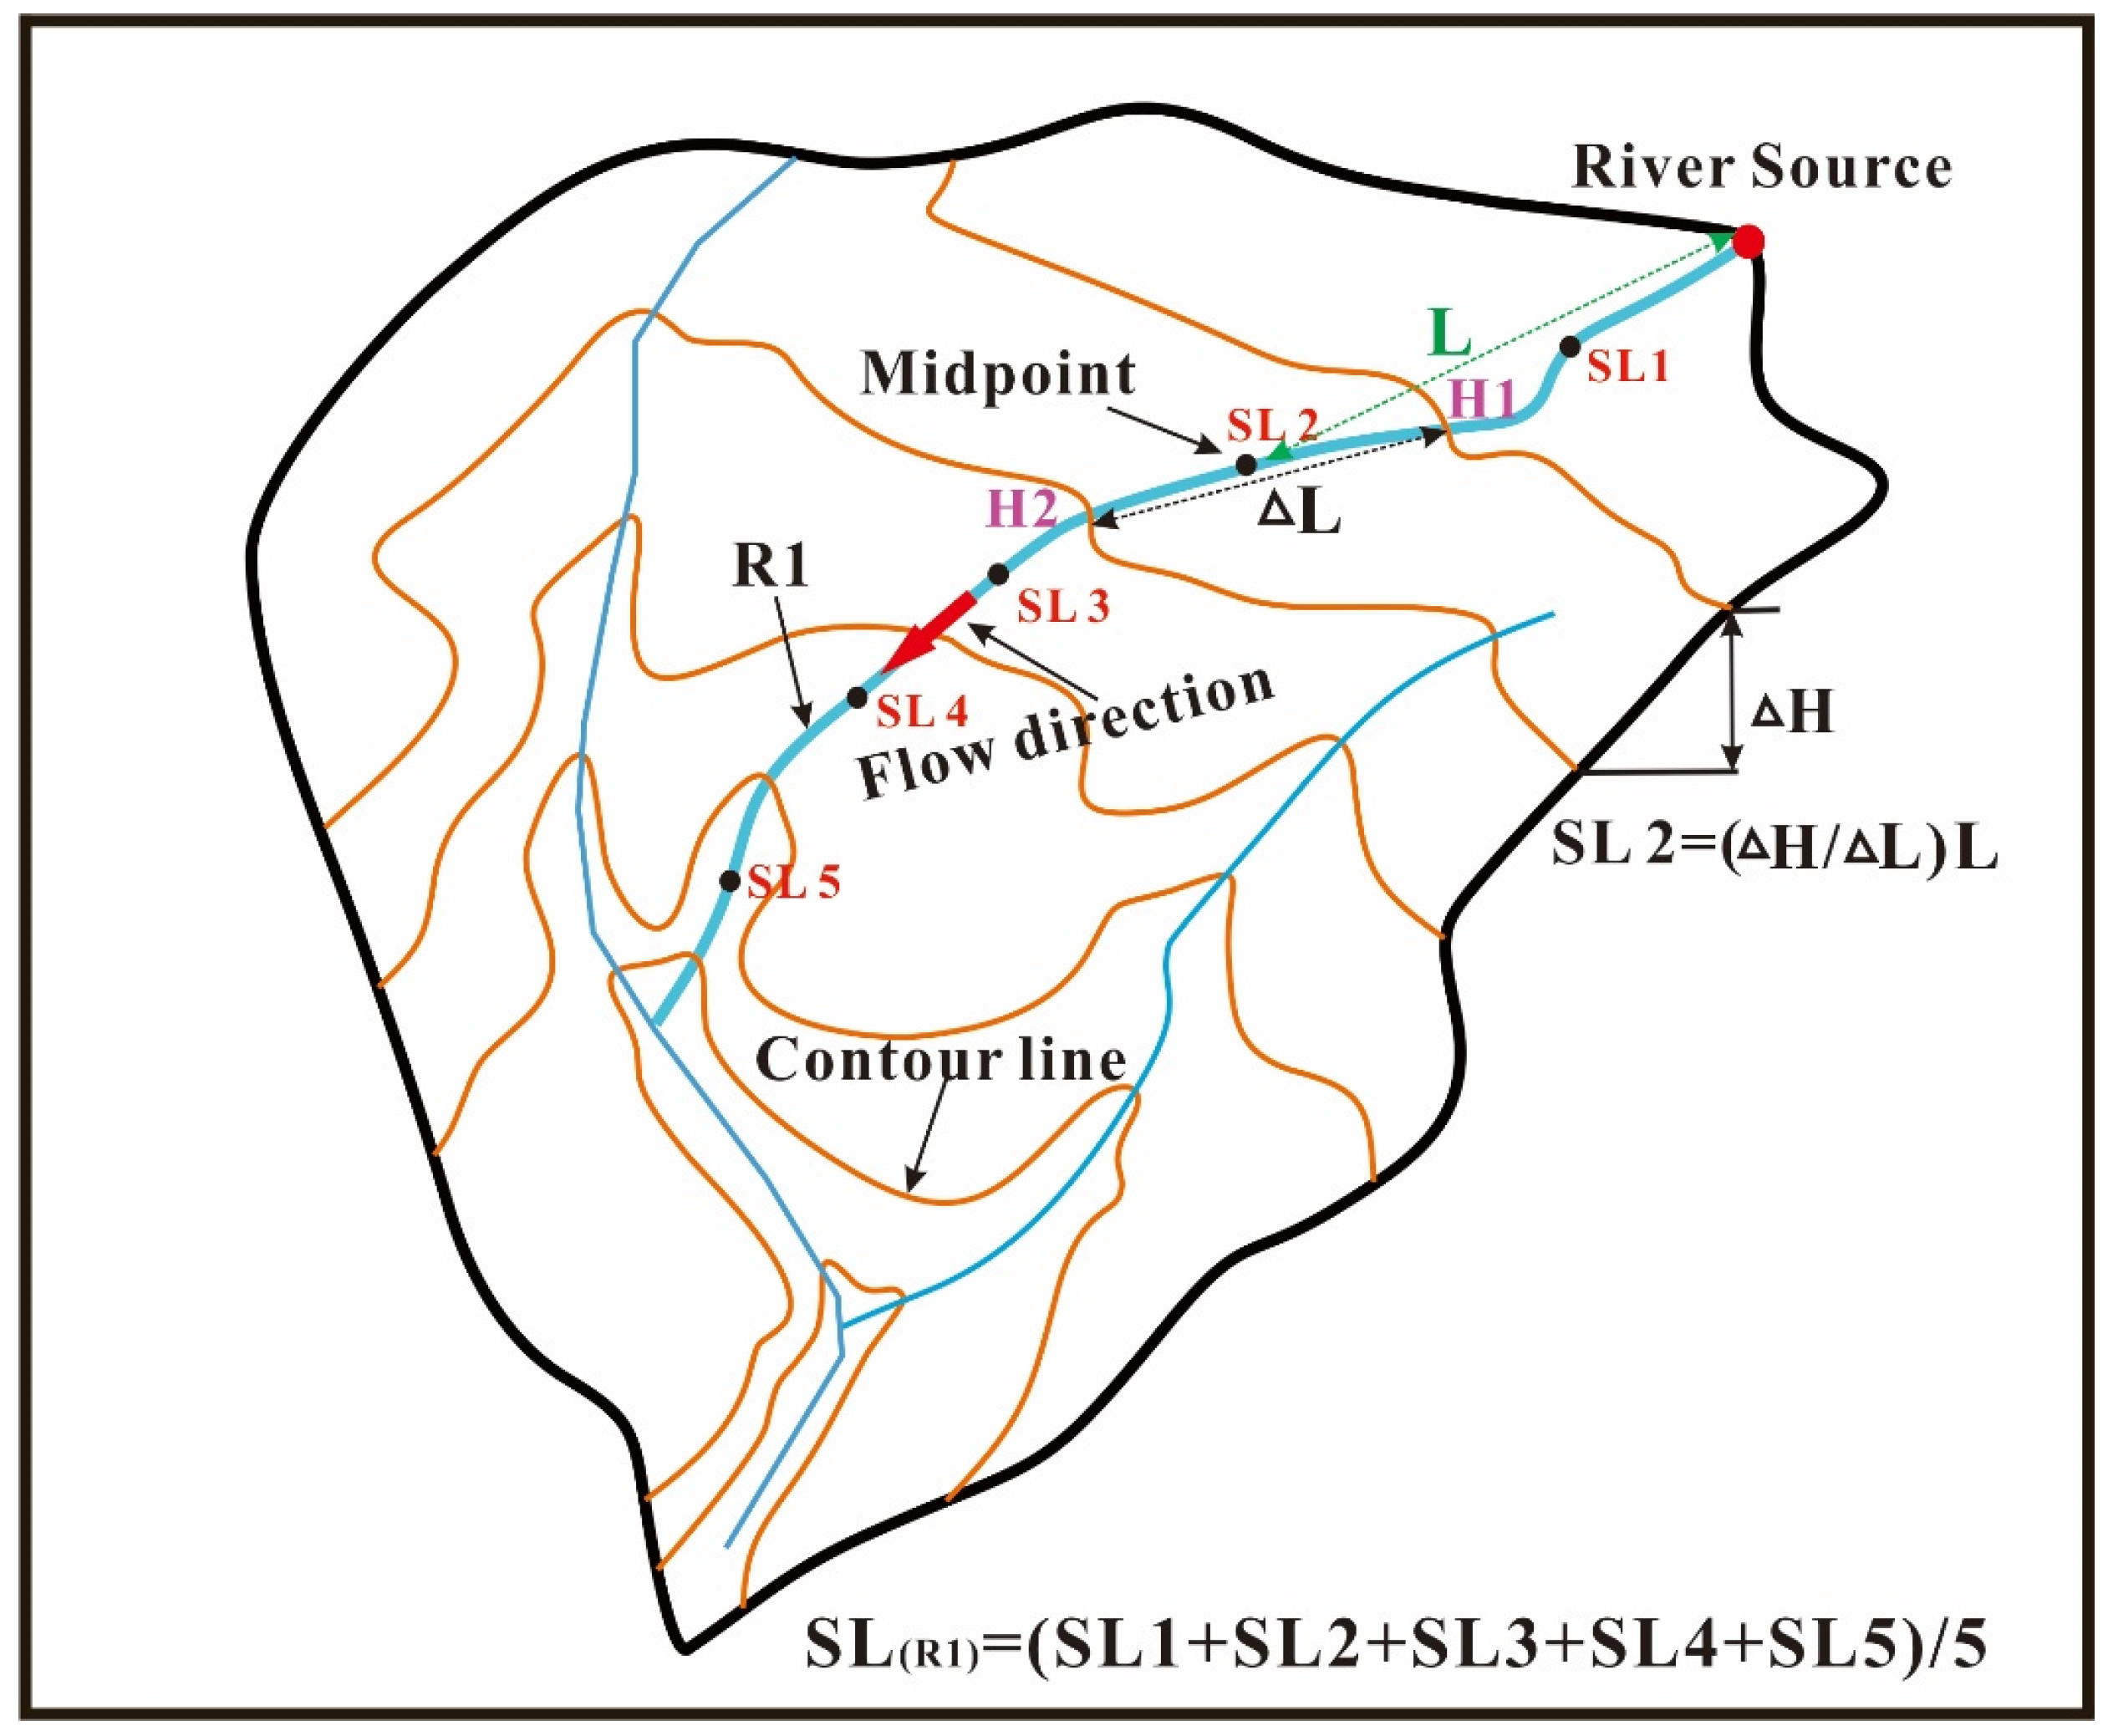
3.1. Stream Length Gradient (SL)
3.2. Hypsometric Integral (HI)
4. Results
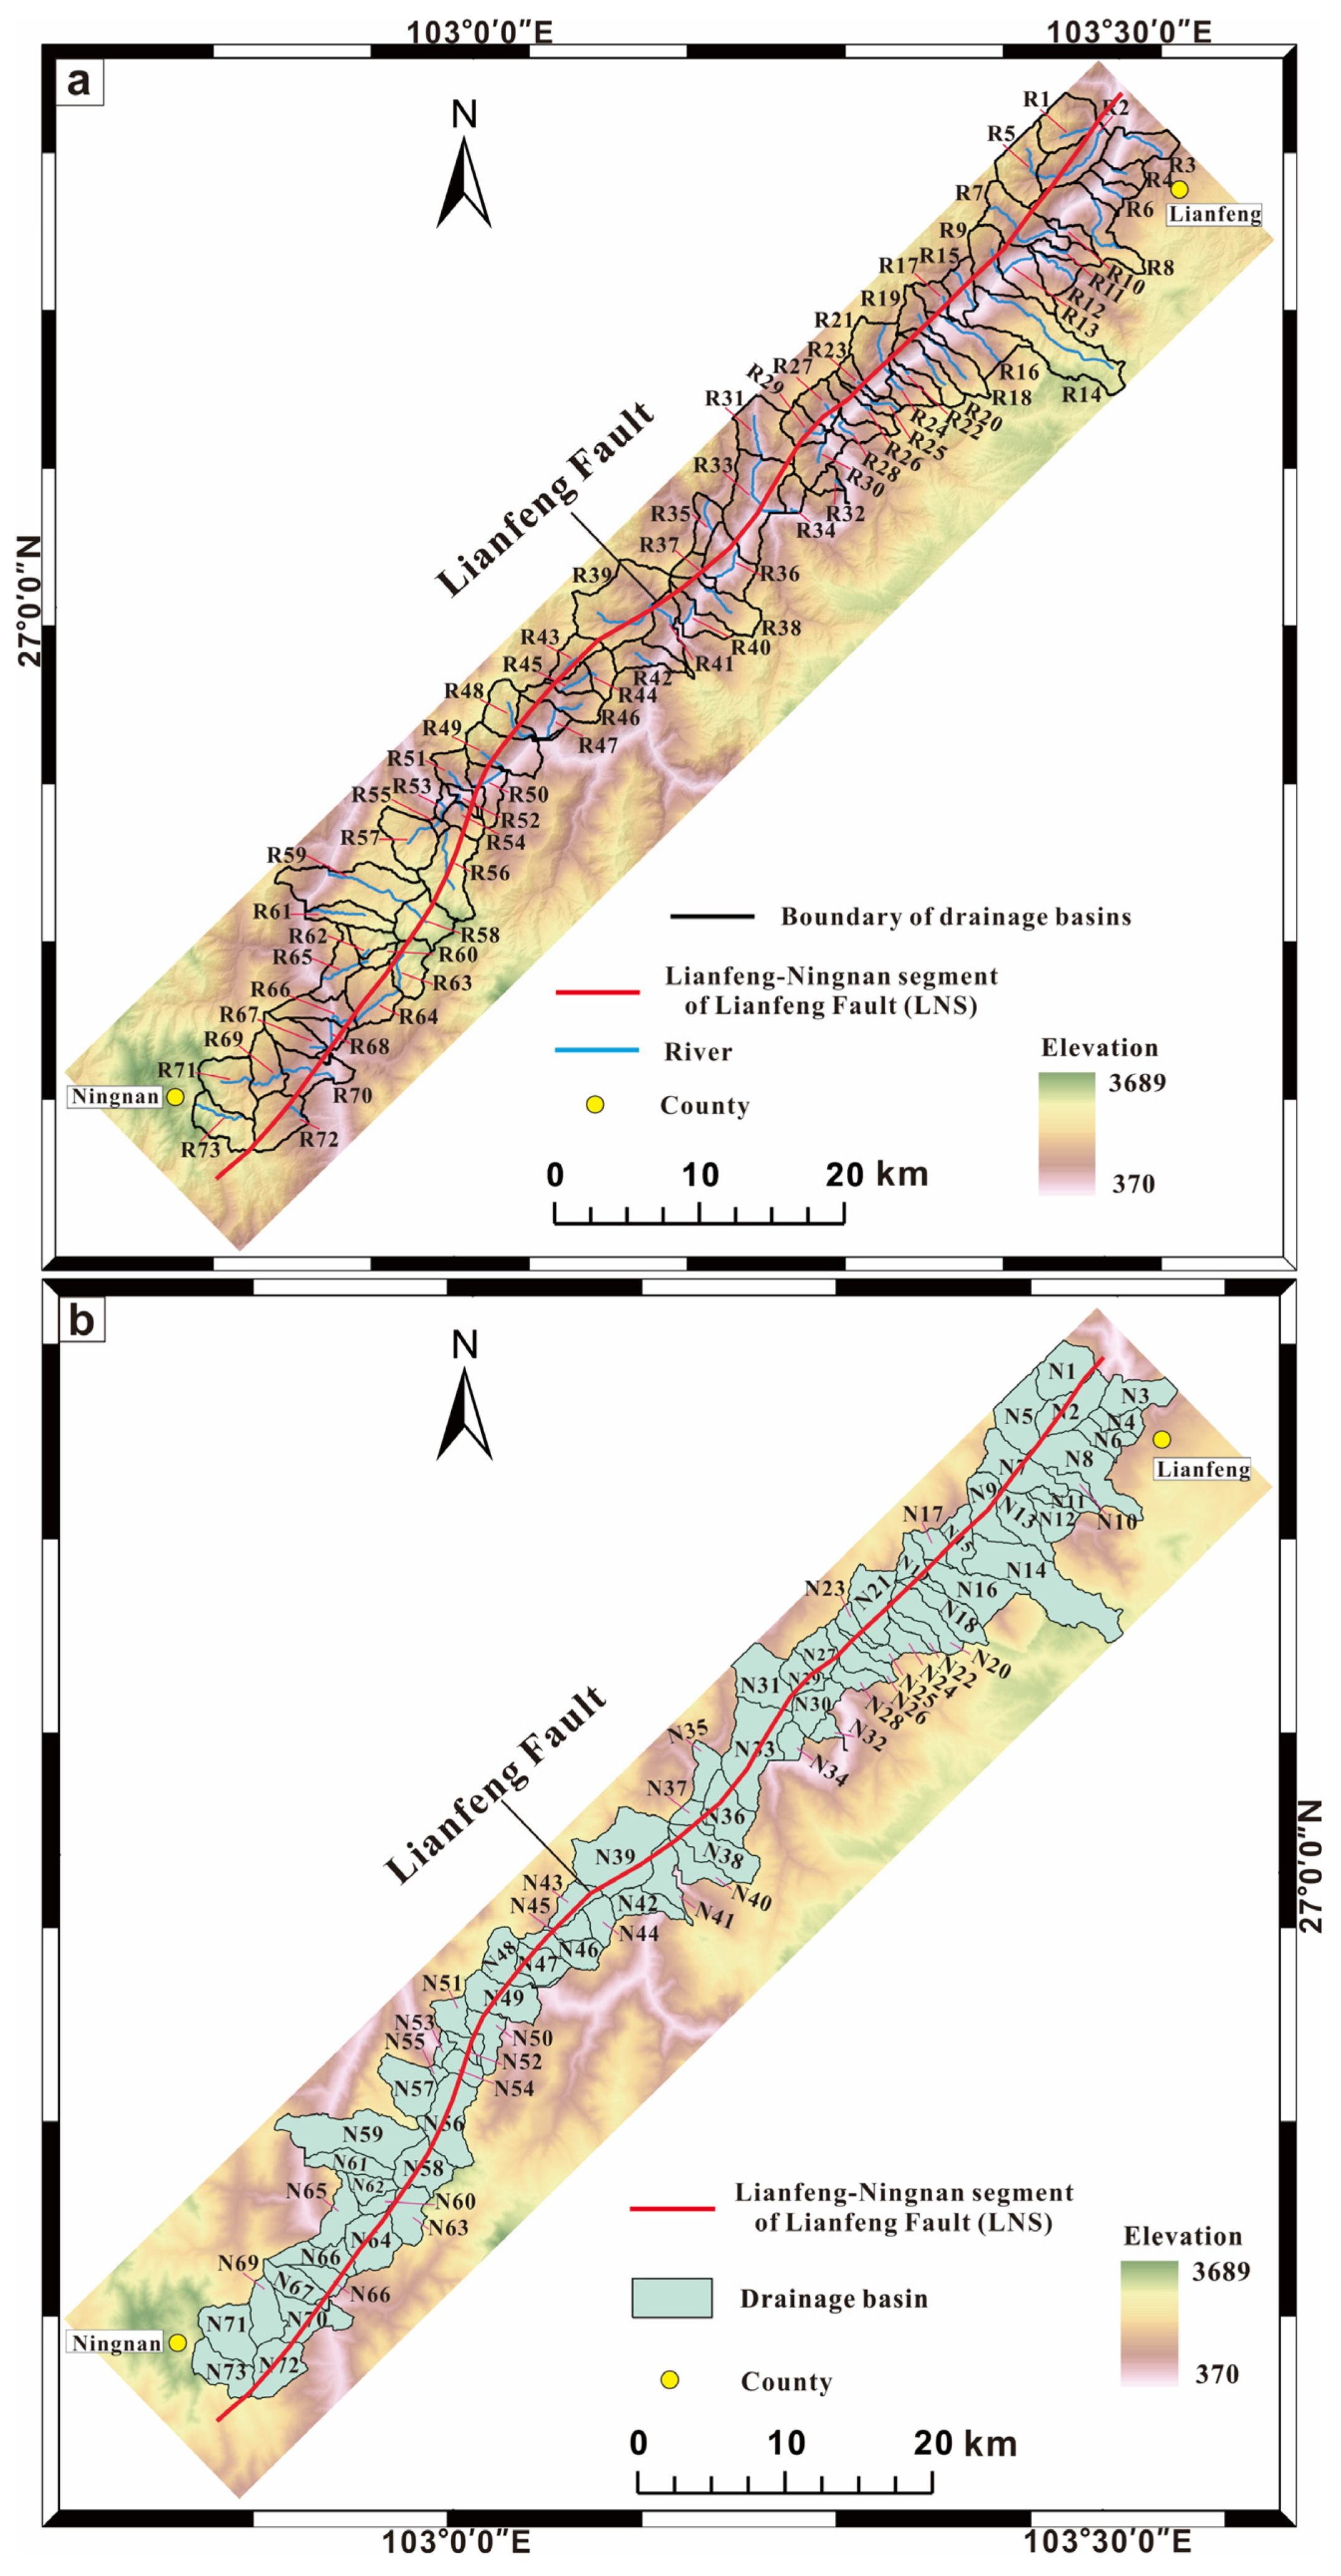
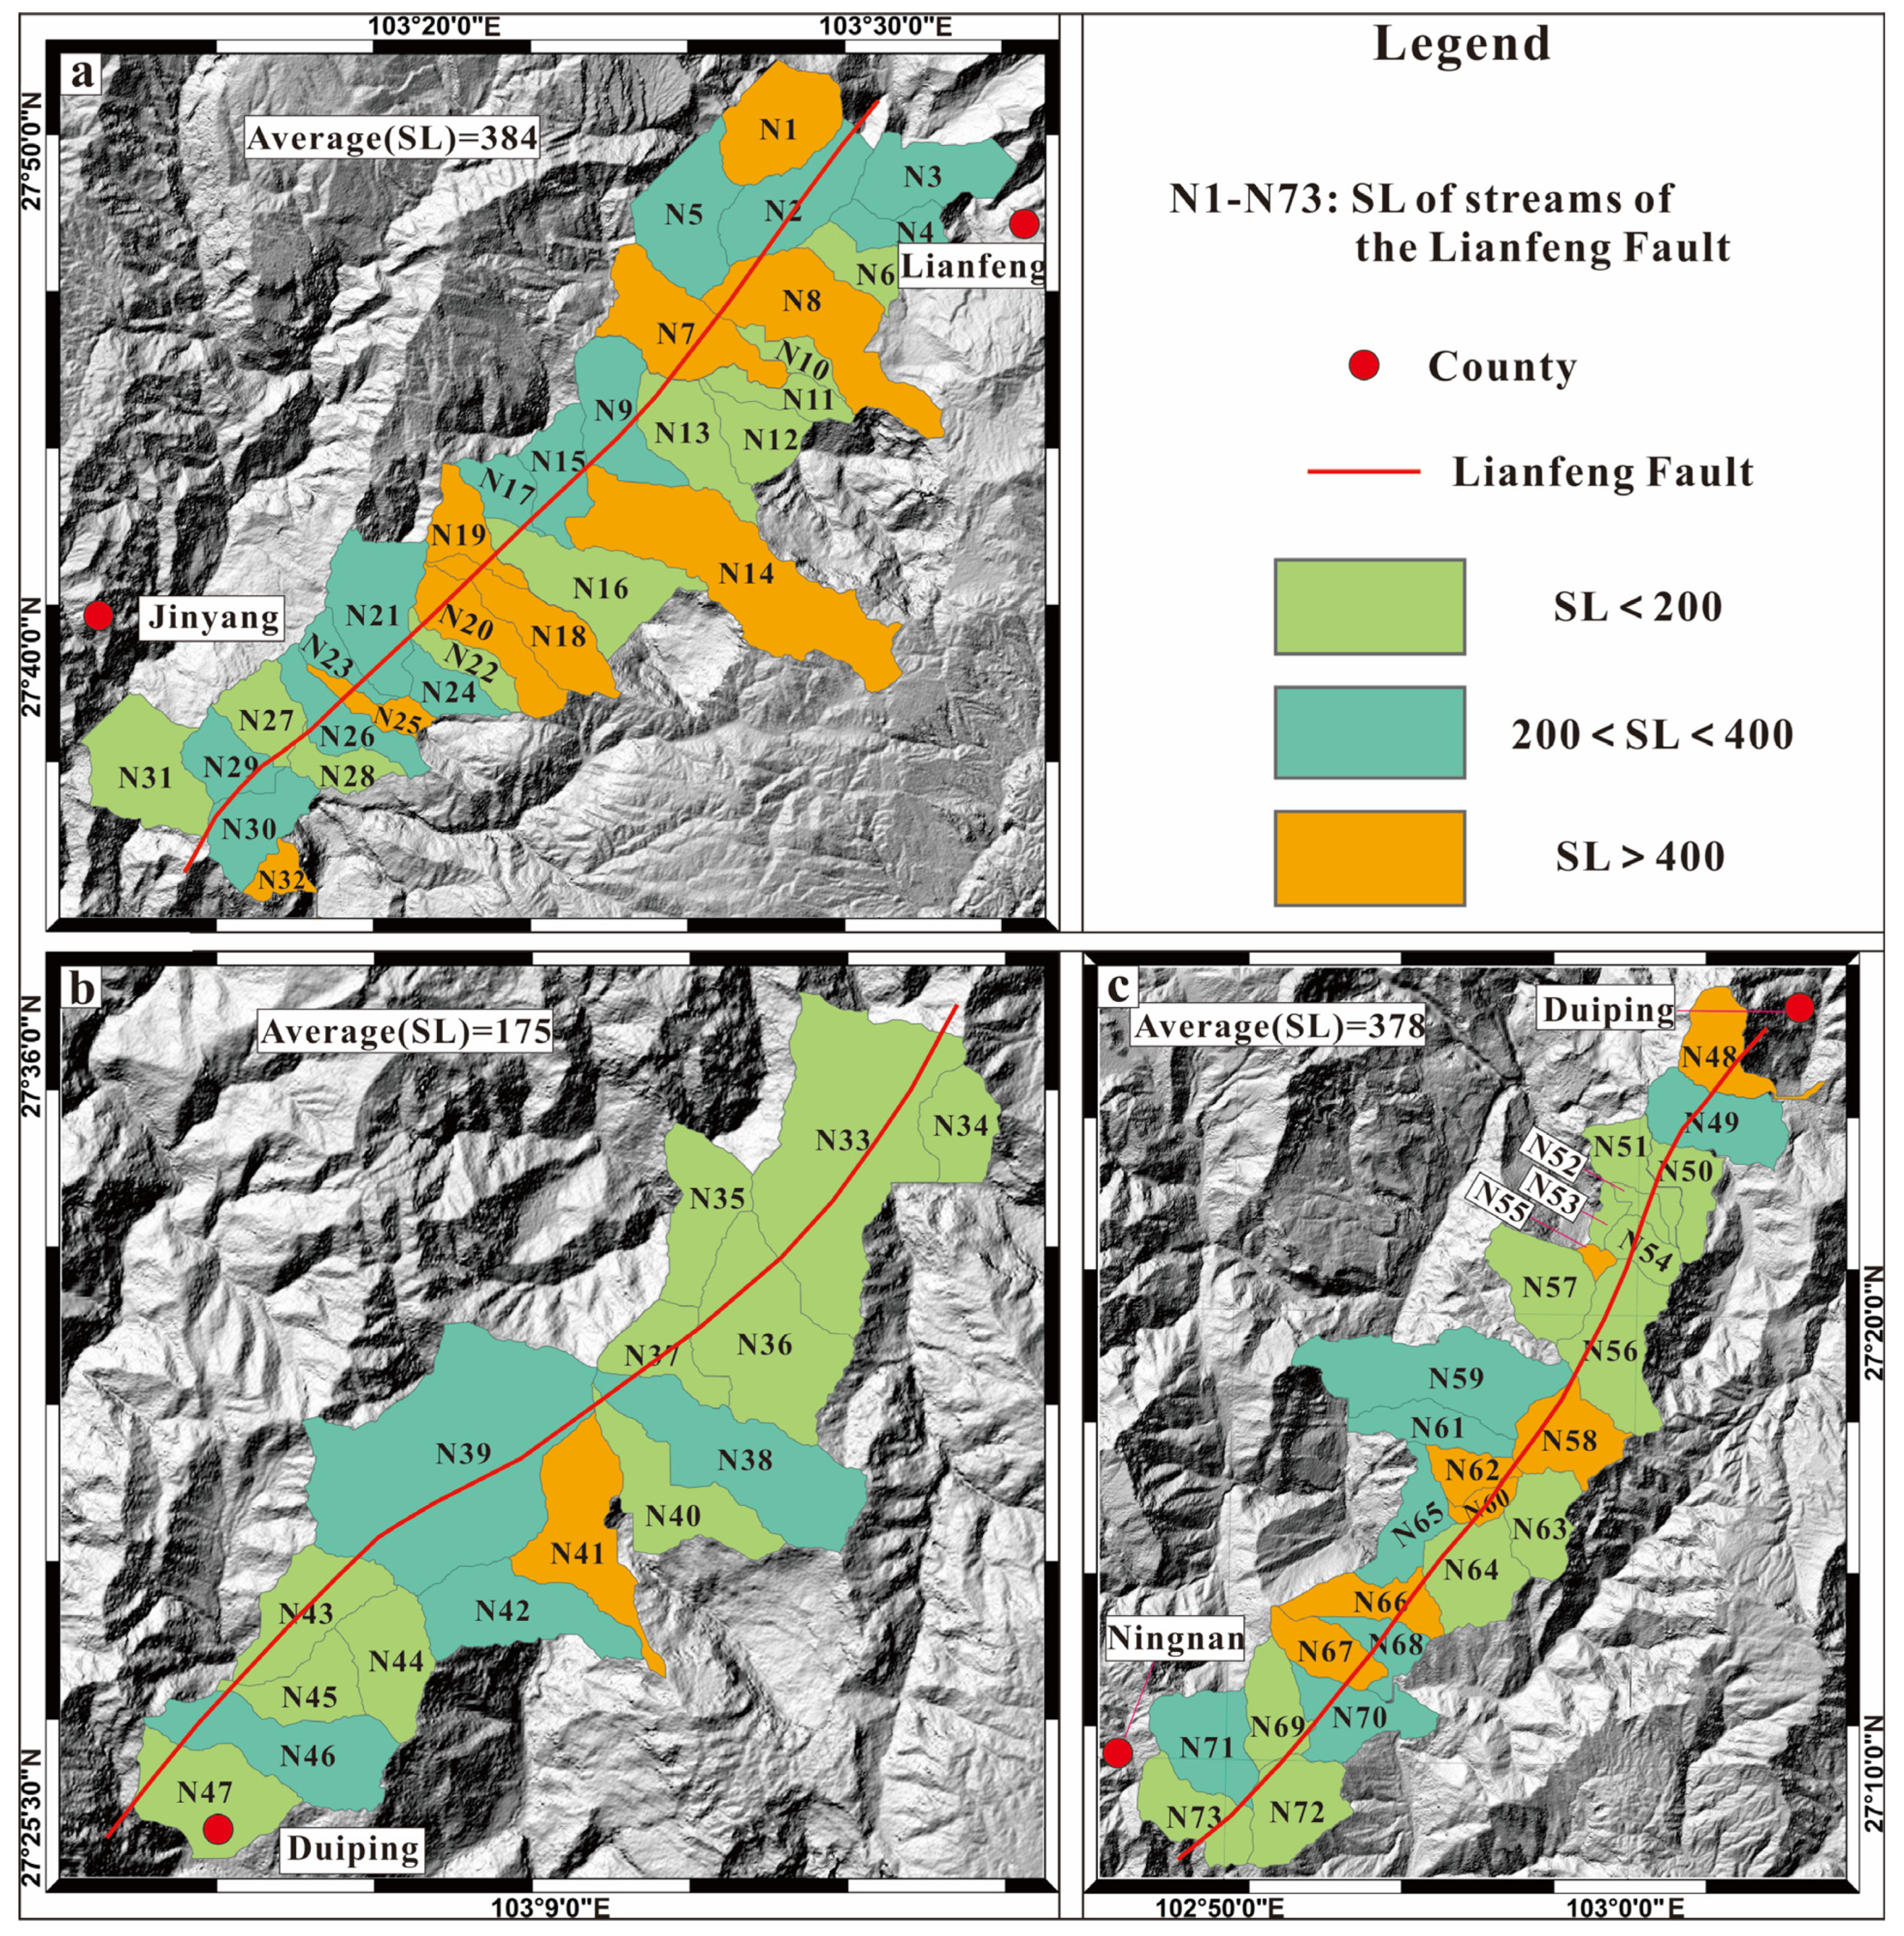
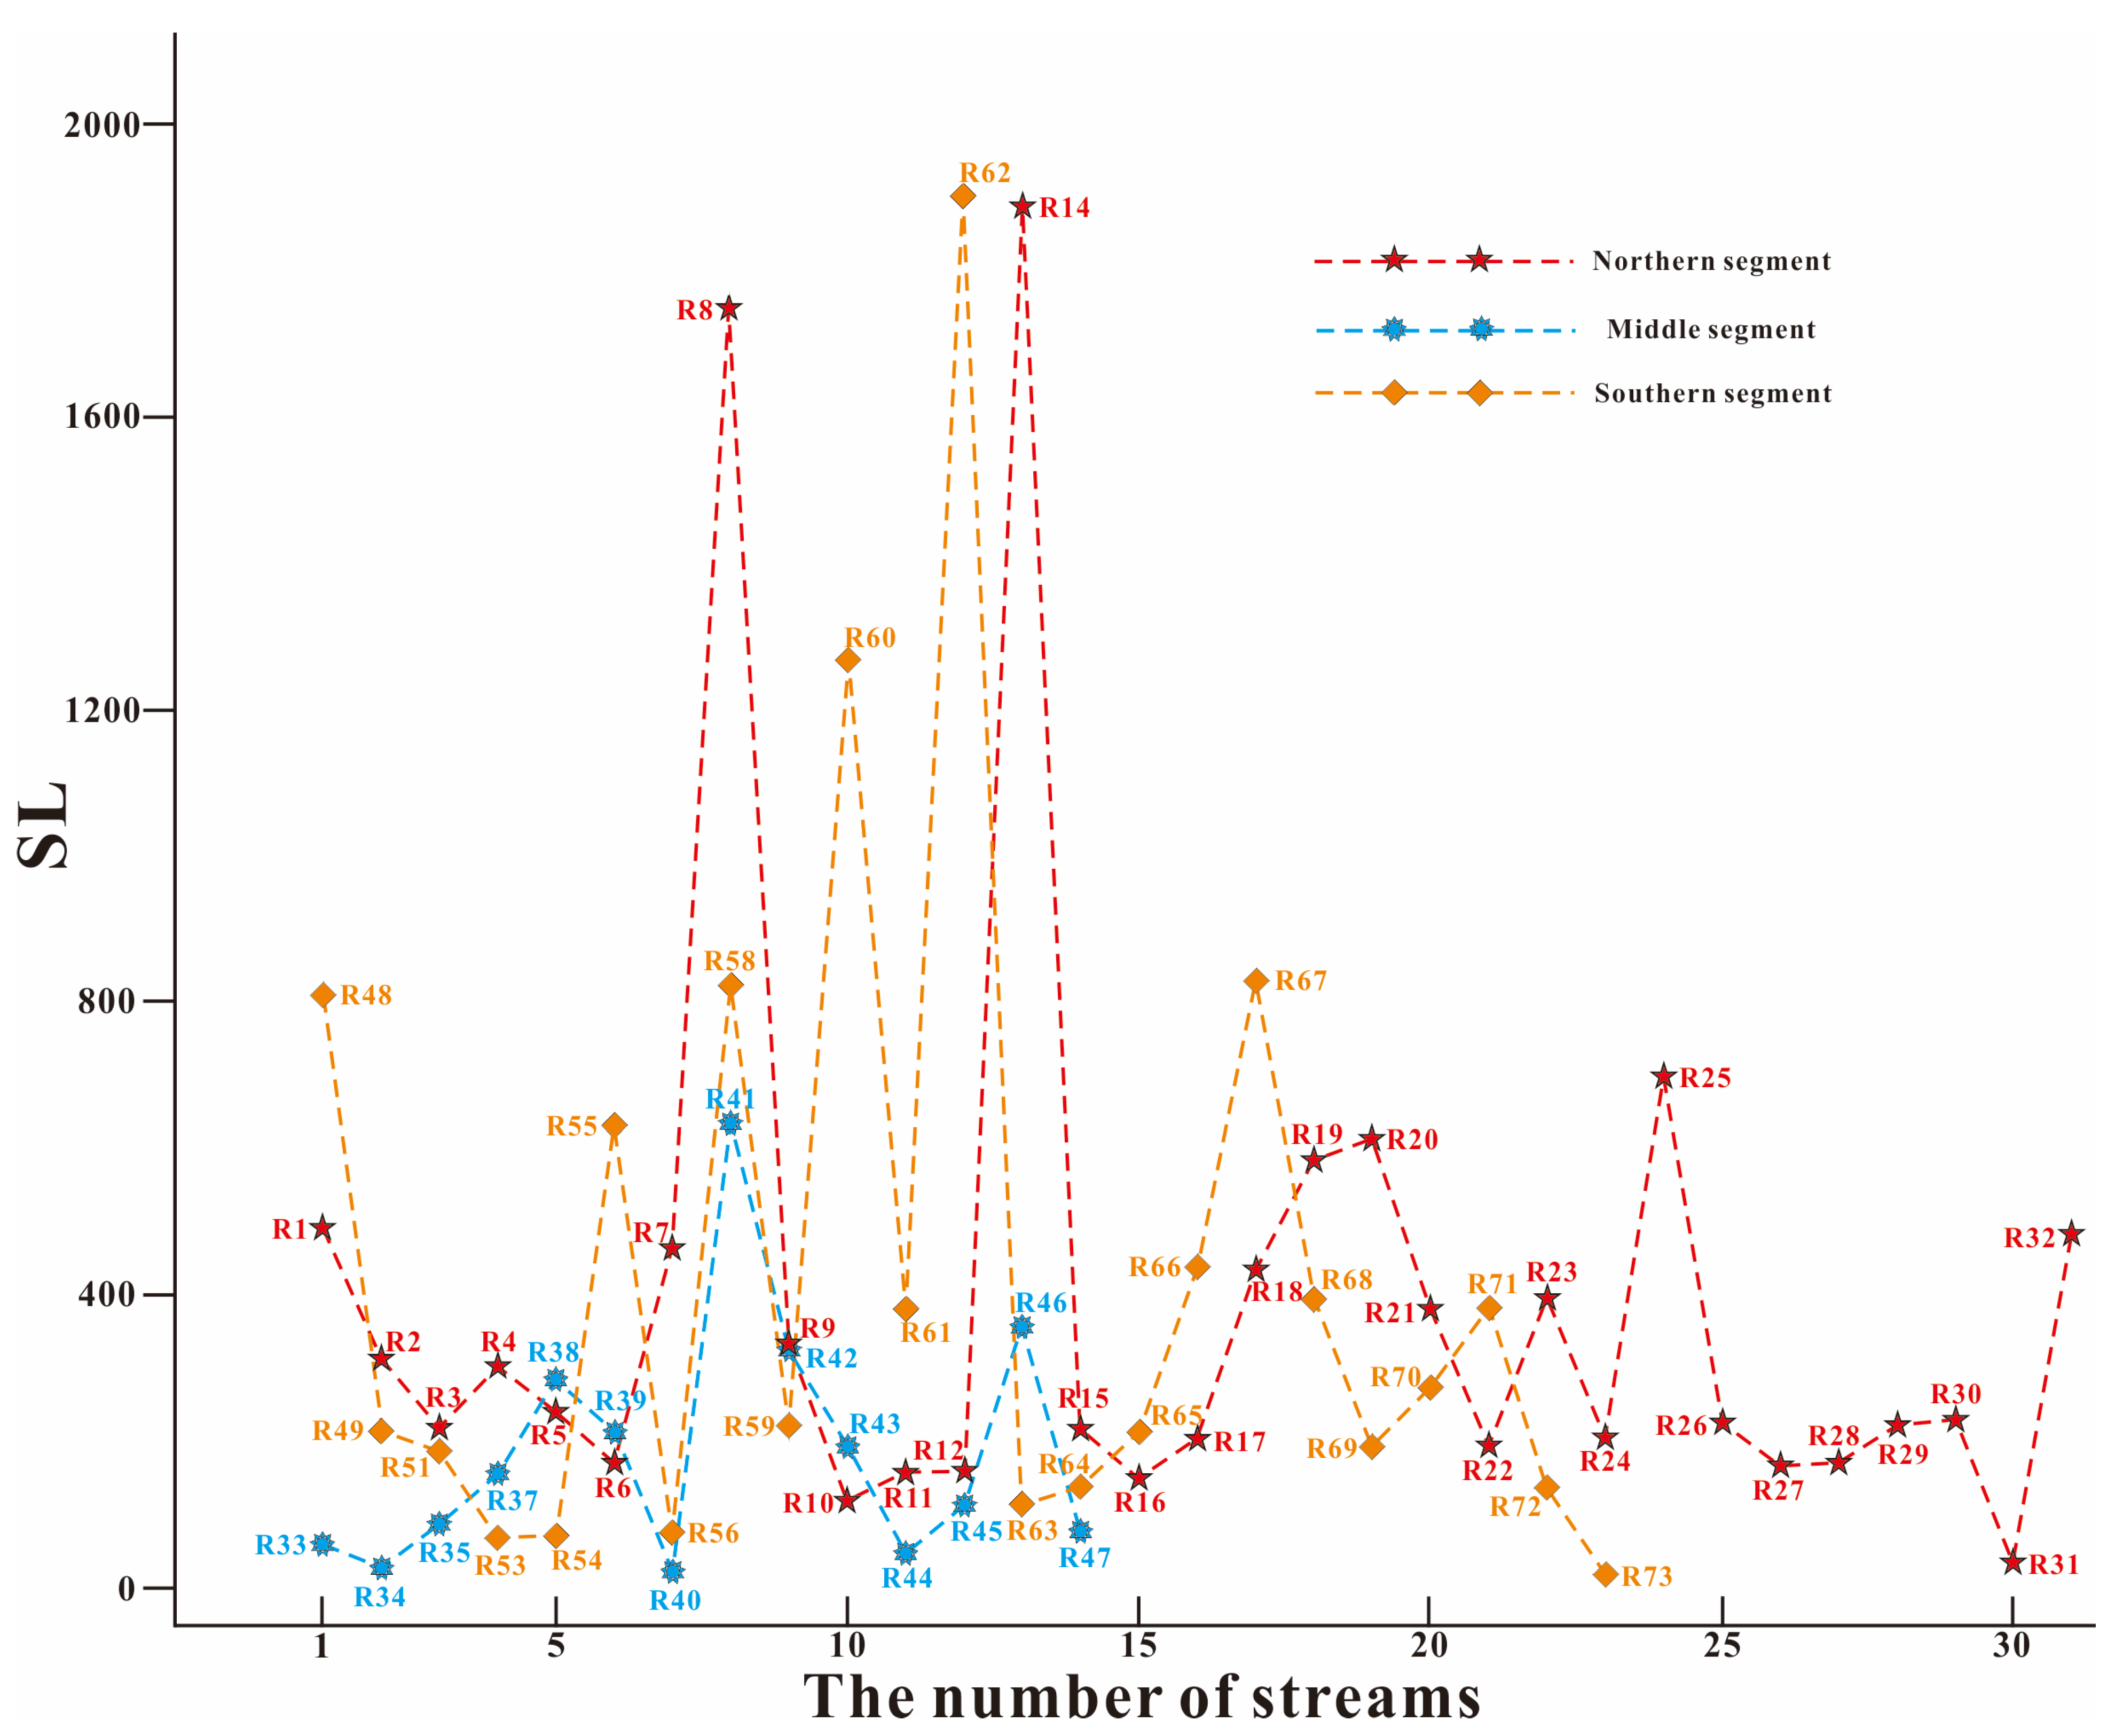
4.1. SL of LNS
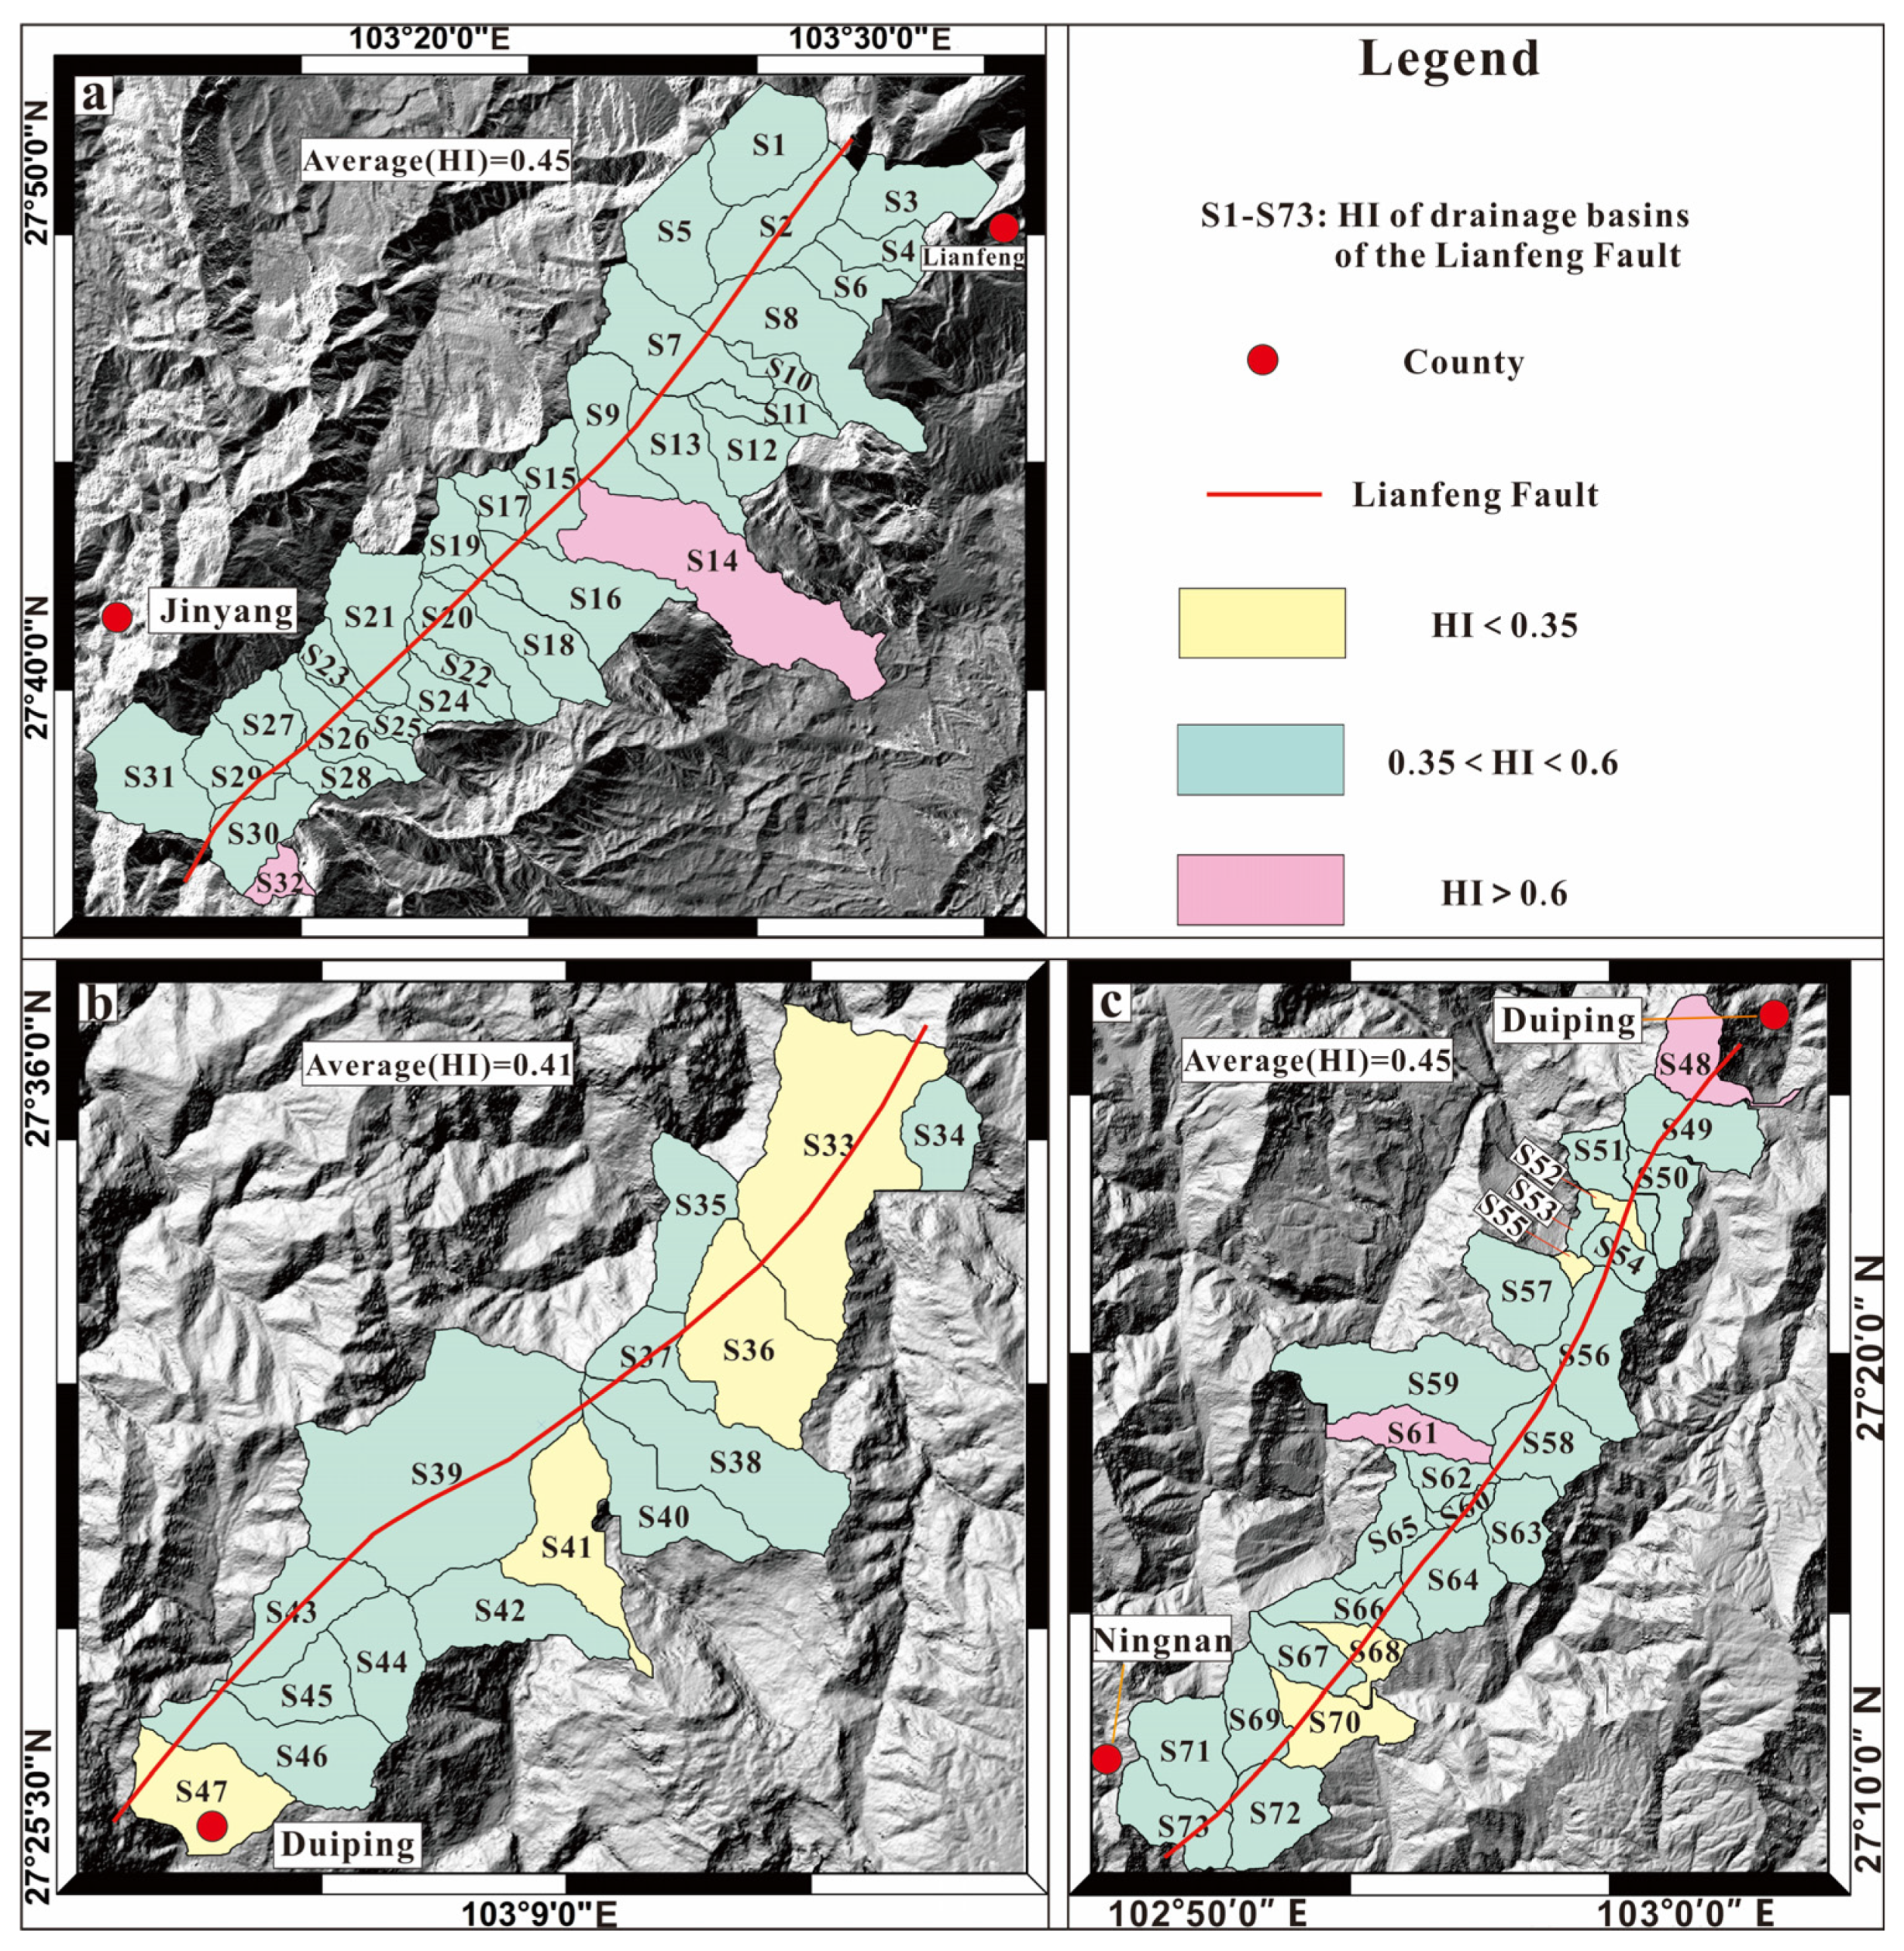
4.2. HI of the LNS
5. Discussion
5.1. Limitations and Adaptability
5.2. Lithology and Climate
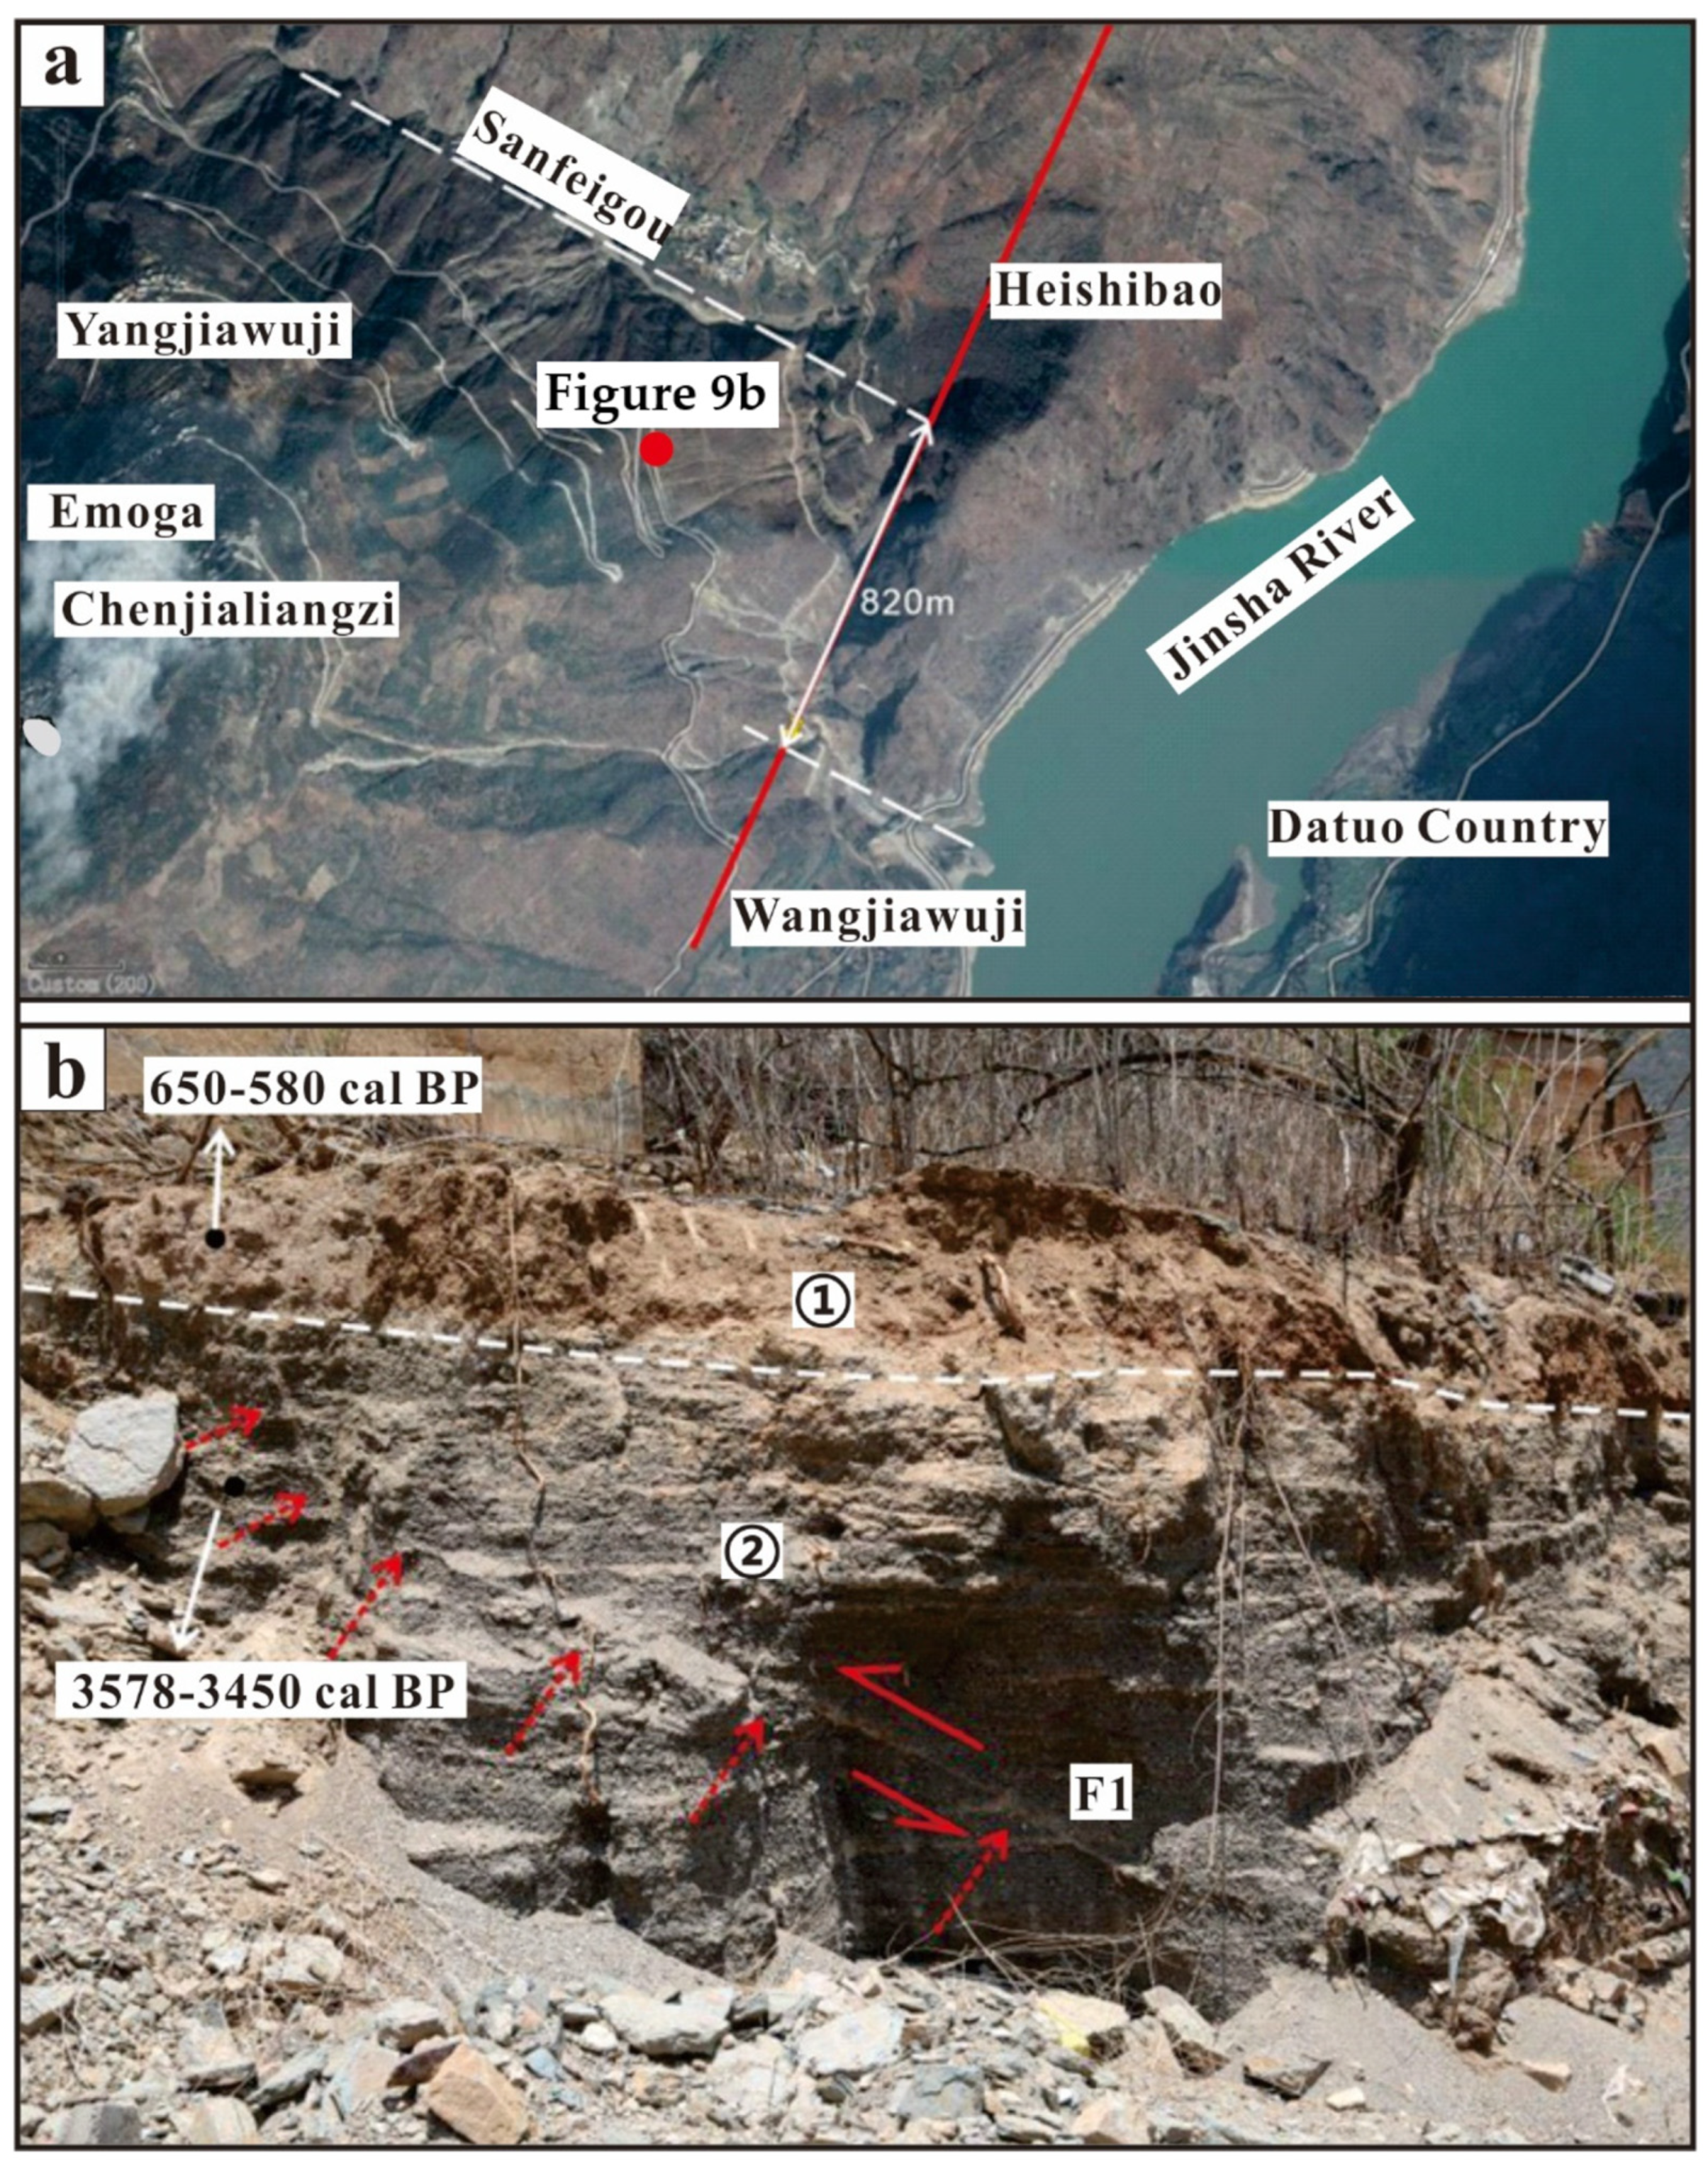
5.3. Tectonics
6. Conclusions
- Based on DEM and ArcGIS hydrological analysis tools, 73 streams and their drainage basins in the LNS region were extracted. A calculation of the stream length gradient and hypsometric integral revealed that the regional stream geomorphic index was distributed differently spatially. The development of stream geomorphology in the LNS is generally in the prime stage. In the LNS area, the tectonic activity intensity indicated by the stream geomorphic index shows that the tectonic activity in the southern and northern segments is stronger, while the tectonic activity in the middle segment is relatively weak.
- There is no significant difference in the spatial distribution of lithology and climate in the LNS region, meaning lithology and climate are not the main factors controlling the regional stream geomorphic index.
- The analysis of the terrace profile and typical geomorphology in the LNS area reveals that the LNS was an active fault in the Holocene. Based on the analysis of regional single fault activity, block movement and regional fault interaction, we conclude that tectonics are the main factor contributing to the differential spatial distribution of the stream geomorphic index.
Author Contributions
Funding
Data Availability Statement
Acknowledgments
Conflicts of Interest
References
- Wen, X.Z.; Du, F.; Yi, G.X.; Long, F.; Fan, J.; Yang, P.X.; Xiong, R.W.; Liu, X.X.; Liu, Q. Earthquake risk background of Zhaotong and Lianfeng fault zones in eastern Sichuan-Yunnan boundary. Chin. J. Geophys. 2013, 56, 3361–3372. [Google Scholar]
- Chang, Z.; Zhou, R.; An, X.; Chen, Y.; Zhou, Q.; Li, J. Late quaternary activity of Zhaotong-Ludian fault and its tectonic significance. Seismol. Geol. 2014, 36, 1260–1279. [Google Scholar]
- Xie, Z.; Zheng, Y.; Liu, C.; Xiong, X.; Li, Y.; Zheng, X. Source parameters of the 2014 MS6.5 ludian earthquake sequence and their implications on the seismogenic structure. Seismol. Res. Lett. 2015, 86, 1614–1621. [Google Scholar] [CrossRef]
- Zhang, W. Study on Late Quaternary Activity Characteristics of Lianfeng and Zhaotong Fault Zones; Institute of Earthquake Prediction, China Earthquake Administration: Beijing, China, 2018. [Google Scholar]
- Wang, Y. Geomorphic and Sedimentary Records of Tectonic Activity Since Late Cenozoic in the Lianfeng Fault Belt and Its Adjacent Areas; Institute of Crustal Stress, China Earthquake Administration: Beijing, China, 2019. [Google Scholar]
- Xu, X.; Jiang, G.; Yu, G.; Wu, X.; Zhang, J.; Li, X. Determination of seismogenic fault and discussion on its tectonic attributes for the Ludian M6.5 earthquake. Chin. J. Geophys. 2014, 57, 3060–3068. [Google Scholar]
- Zhang, W.; Li, W.; Tian, Q.; Xu, Y.; Wang, L. Discussion on Quaternary activity characteristics of Lianfeng and Zhaotong fault zone based on deformation of broad vally surface of Niulan River. Earthquake 2018, 38, 22–36. [Google Scholar]
- Wang, Y.; Li, D. Geomorphological and sedimentary records of Late Quaternary activities of Qiaojia-Jinyang segment of Lianfeng fault zone, Southwest China. Environ. Earth Sci. 2022, 81, 155. [Google Scholar] [CrossRef]
- Bi, L. Study on Parameters of Active Tectonic Geomorphology Based on DEM; China Earthquake Administration: Beijing, China, 2011. [Google Scholar]
- He, X.; Zhang, X.; He, Z. Research progress and thinking of neotectonic movement based on tectonic geomorphic parameters. Geoscience 2014, 28, 119–130. [Google Scholar]
- Dong, S.; Zhang, P.; Zhang, H.; Zheng, W.; Chen, H. Drainage responses to the activity of the langshan range-front fault and tectonic implications. J. Earth Sci. 2018, 29, 193–209. [Google Scholar] [CrossRef]
- He, C.; Rao, G.; Yang, R.; Hu, J.; Yao, Q.; Yang, C.J. Divide migration in response to asymmetric uplift: Insights from the Wula Shan horst, North China. Geomorphology 2019, 339, 44–57. [Google Scholar] [CrossRef]
- Strahler, A.N. Hypsometric (area-altitude) analysis of erosional topography. GSA Bull. 1952, 63, 1117–1142. [Google Scholar] [CrossRef]
- Walcott, R.C.; Summerfield, M.A. Scale dependence of hypsometric intergrals: An analysis of southeast African basins. Geomorphology 2008, 96, 174–186. [Google Scholar] [CrossRef]
- Zhao, H.; Li, Y.; Yang, J. The slope index of river length and the neotectonic significance of Hack profile in the North Tianshan Basin. Acta Sci. Univ. Pekin. 2010, 46, 237–244. [Google Scholar]
- Zhang, J.; Li, C.; Zhang, M. Golmud river basin area—Elevation integral values of geomorphology analysis. J. Mt. 2011, 29, 257–268. [Google Scholar]
- Guo, L.; He, Z.; Li, L. Response of stream Geomorphic Indices to Piedmont Fault Activity in the Northern Segment of the Red River Fault Zone. Remote Sens. 2023, 15, 988. [Google Scholar] [CrossRef]
- Bashir, B.; Alsalman, A.; Bachir, H.; Elnobi, M. GIS-Analysis for Active Tectonics Assessment of Wadi Al-Arish, Egypt. Appl. Sci. 2023, 13, 2659. [Google Scholar] [CrossRef]
- Derakhshani, R.; Zaresefat, M.; Nikpeyman, V.; GhasemiNejad, A.; Shafifieibafti, S.; Rashidi, A.; Nemati, M.; Raoof, A. Machine Learning-Based Assessment of Watershed Morphometry in Makran. Land 2023, 12, 776. [Google Scholar] [CrossRef]
- Barman, B.K.; Rao, C.U.; Rao, K.S.; Patel, A.; Kushwaha, K.; Singh, S.K. Geomorphic Analysis, Morphometric-based Prioritization and Tectonic Implications in Chite Lui River, Northeast India. J. Geol. Soc. India 2021, 97, 385–395. [Google Scholar] [CrossRef]
- Anand, A.; Pradhan, S. Assessment of active tectonics from geomorphic indices and morphometric parameters in part of Ganga basin. J. Mt. Sci. 2019, 16, 1943–1961. [Google Scholar] [CrossRef]
- Zhou, R.; Tang, R.; Qian, H.; Wen, D.; Ma, S.; He, Y.; Pu, X. Application of earthquake structure analogy method: A case study of Huaying Mountain fault zone in eastern Sichuan. Seismol. Res. 1997, 3, 68–74. [Google Scholar]
- Liu, X. Study on the Major Faults in the Middle Part of the Eastern Boundary of Sichuan-Yunnan Block and the Interseismic Deformation of the Southern Section of Longmenshan Fault Belt; Institute of Geology, China Earthquake Administration: Beijing, China, 2017. [Google Scholar]
- Font, M.; Amorese, D.; Lagarde, J.-L. DEM and GIS analysis of the stream gradient index to evaluate effects of tectonics: The Normandy intraplate area (NW France). Geomorphology 2010, 119, 172–180. [Google Scholar] [CrossRef]
- Glade, R.C.; Shobe, C.M.; Anderson, R.S.; Tucker, G.E. Canyon shape and erosion dynamics governed by channel-hillslope feedbacks. Geology 2019, 47, 650–654. [Google Scholar] [CrossRef]
- Hayakawa, Y.S.; Oguchi, T. GIS analysis of fluvial knickzone distribution in Japanese mountain watersheds. Geomorphology 2009, 111, 27–37. [Google Scholar] [CrossRef]
- Goldrick, G.; Bishop, P. Regional analysis of bedrock stream long profiles: Evaluation of Hack’s SL form, and formulation and assessment of an alternative (the DS form). Earth Surf. Process. Landf. 2007, 32, 649–671. [Google Scholar] [CrossRef]
- Clark, M.K.; Schoenbohm, L.M.; Royden, L.H.; Whipple, K.X.; Burchfiel, B.C.; Zhang, X.; Tang, W.; Wang, E.; Chen, L. Surface uplift, tectonics, and erosion of eastern Tibet from large-scale drainage patterns. Tectonics 2004, 23, TC1006. [Google Scholar] [CrossRef]
- Hack, J.T. Stream-profile analysis and stream-gradient index. J. Res. U.S. Geol. Surv. 1973, 1, 421–429. [Google Scholar]
- Ji, Y.; Gao, H.; Pan, B.; Li, Z.; Guan, D.; Du, G. New tectonic significance of SL parameter and Hack profile in the upper reaches of Weihe River Basin. J. Lanzhou Univ. 2011, 47, 16. [Google Scholar]
- Xu, W.; Yuan, Z.; Liu, Z.; Gao, Z. Zhongtiao mountains north river geomorphic parameter and the new tectonic significance. J. Arid Areas 2018, 9, 10091017. [Google Scholar]
- Gao, M.; Zeilinger, G.; Xu, X.; Wang, Q.; Hao, M. DEM and GIS analysis of geomorphic indices for evaluating recent uplift of the northeastern margin of the Tibetan Plateau, China. Geomorphology 2013, 190, 61–72. [Google Scholar] [CrossRef]
- Kirby, E.; Whipple, K.X.; Tang, W.; Chen, Z. Distribution of active rock uplift along the eastern margin of the Tibetan Plateau: Inferences from bedrock channel longitudinal profiles. J. Geophys. Res. Solid Earth 2003, 108, 2217. [Google Scholar] [CrossRef]
- Ma, T.X.; Yang, W.G.; Zhu, L.D.; Zhang, H.L.; Zhong, Z.; Xie, L.; Mai, Y.J.; Luo, L.; Cao, Z.C. Geomorphic parameter characteristics and tectonic geomorphic significance in the middle reaches of Yarlung Zangbo River. J. Chengdu Univ. Technol. 2022, 49, 502–512. [Google Scholar]
- Singh, O.; Sarangi, A.; Sharma, M.C. Hypsometric integral estimation methods and its relevance on erosion status of north-western lesser himalayan watersheds. Water Resour. Manag. 2008, 22, 1545–1560. [Google Scholar] [CrossRef]
- Davis, W.M. The geographical cycle. Geogr. J. 1899, 14, 481–504. [Google Scholar] [CrossRef]
- Wang, J. Response of Fluvial Geomorphic Index and Lacustrine Deposition to Piedmont Fault Activity in Daqingshan Basin; Emergency Management Department of National Natural Disaster Prevention Research Institute: Beijing, China, 2021. [Google Scholar]
- Guan, X.; Pang, L.; Jiang, Y. Spatial characteristics and tectonic geomorphic significance of geomorphic metrology indexes in Taihang Mountains. Chin. J. Geomech. 2021, 27, 280–293. [Google Scholar]
- Xin, Z.; Xu, J.; Ma, Y. Hypsometric integral analysis and its sediment yield implications in the loess Plateau, China. J. Mt. Sci. 2008, 3, 335–363. [Google Scholar]
- Chang, Z.Y.; Wang, J.; Bai, S.-B.; Zhang, Z.G. Area of elevation comparing the calculation methods of integral value. J. Resour. Environ. Arid Areas 2015, 29, 171–175. [Google Scholar] [CrossRef]
- Pike, R.; Wilson, S. Elevation-relief ratio, hypsometric integral, and geomorphic area-altitude analysis. Geol. Soc. Am. Bull. 1971, 82, 1079–1084. [Google Scholar] [CrossRef]
- Wang, J.Y.; He, Z.T. Responses of stream geomorphic indices to piedmont fault activity in the Daqingshan area of China. J. Earth Sci. 2020, 31, 978–987. [Google Scholar] [CrossRef]
- Liang, O.; Ren, J.; Lv, Y. Response of fluvial geomorphic features to the activity of Huya fault zone in the Fujiang River Basin. Seismol. Geol. 2018, 40, 42–56. [Google Scholar]
- Liang, O.B. Fluvial Geomorphic Index and Its Tectonic Signifificance at the Eastern Foot of Helan Mountain; Institute of Crustal Stress, China Earthquake Administration: Beijing, China, 2019. [Google Scholar]
- Zhu, S. Climate changes in Liangshan Mountain areas since 10000 years before. Yunnan Geogr. Environ. Res. 2007, 2, 1–4. [Google Scholar]
- Zheng, Z.; Liang, X.; Wang, J.; Mo, F.; Liu, K.; Li, J.; Fan, Y. Analyses of variation characteristics of the precipitation in the North of Liangshan City in recent 50 years. Chin. Agric. Sci. Bull. 2014, 30, 250–255. [Google Scholar]
- Zhang, H.; Yang, N.; Liu, S.F.; Zhang, Y.Q. New progress in the application of digital elevation model (DEM) in the study of tectonic geomorphology. Geol. Bull. 2006, 6, 660–669. [Google Scholar]
- Liu, J.; Zhang, J.Y.; Ge, Y.K.; Wang, W.; Zeng, L.; Li, G.; Lin, X. Tectonic geomorphology: A cross study on the interaction of tectono-climate-surface processes. Chin. Sci. Bull. 2018, 63, 3070–3088. [Google Scholar]
- Cao, P.J.; Cheng, S.Y.; Lin, H.X.; Wang, X.; Li, M.; Chen, J. Application and prospect of DEM in quantitative analysis of tectonic geomorphology. J. Geomech. 2021, 27, 949–962. [Google Scholar]
- Tapponnier, P.; Peltzer, G.; Le Dain, A.Y.; Armijo, R.; Cobbold, P. Propagating extrusion tectonics in Asia: New insights from simple experiments with plasticine. Geology 1982, 10, 611–616. [Google Scholar] [CrossRef]
- Tapponnier, P.; Peltzer, G.; Armijo, R. On the mechanics of the collision between India and Asia. Geol. Soc. Lond. Spec. Publ. 1986, 19, 113–157. [Google Scholar] [CrossRef]
- Tapponnier, P.; Zhiqin, X.; Roger, F.; Meyer, B.; Arnaud, N.; Wittlinger, G.; Yang, J. Oblique stepwise rise and growth of the Tibet plateau. Science 2001, 294, 1671–1677. [Google Scholar] [CrossRef]
- Zhang, P.Z.; Wang, M.; Gan, W.J. Slip rates along major active faults from GPS measurements and constraints on contemporary continental tectonics. Earth Sci. Front. 2003, 10, 81–92. [Google Scholar]
- Xu, X.W.; Wen, X.Z.; Zheng, R.Z.; Ma, W.; Song, F.; Yu, G. Pattern of latest tectonic motion and dynamics of faulted blocks in Yunnan and Sichuan. Sci. China 2003, 33, 151–162. [Google Scholar]
- Chen, G. Fresh Water River Fault Zone Structure, Landform and Seismicity Research; China University of Geosciences: Wuhan, China, 2022. [Google Scholar]
- Liang, J.M. Characteristics of the Late-Quaternary fault activity of the Xianshuihe Fault; Institute of Earthquake Prediction, China Earthquake Administration: Beijing, China, 2019. [Google Scholar]
- Yu, J. Study on Fault Activity Rate in Typical Section of Zemuhe Fault Zone; Institute of Earthquake Prediction, China Earthquake Administration: Beijing, China, 2010. [Google Scholar]
- Ren, Z. Study on Palaeoearthquake in Zemuhe Fault Zone; Institute of Earthquake Prediction, China Earthquake Administration: Beijing, China, 2007. [Google Scholar]
- Song, J. Study on the Differentiation of Segmental-Locking in the Anning He-Zemuhe-Xiaojiang Fault Zone and Stress Evolution Characteristics in Sichuan-Yunnan Region; Institute of Seismology, China Earthquake Administration: Beijing, China, 2016. [Google Scholar]
- Tang, R.C.; Han, W.B. Active Faults and Earthquakes in Sichuan; Seismological Press: Beijing, China, 1993. [Google Scholar]
- He, H.L.; Ikeda, Y. Faulting on the Anninghe fault zone, Southwest China in Late Quaternary and its movement model. Acta Seismol. Sin. 2007, 20, 571–583. [Google Scholar] [CrossRef]
- Ran, Y.K.; Chen, L.C.; Cheng, J.W.; Gong, H.L. Late quaternary surface deformation and rupture behavior of strong earthquake on the segment north of Mianning of the Anninghe fault. Sci. China D Earth Sci. 2008, 51, 1224–1237. [Google Scholar] [CrossRef]
- Zhou, R.J. Average slip rate of Daliang Mountains Fault zone in Sichuan in late Quaternary period. J. Seismol. Res. 2003, 26, 191–196. [Google Scholar]
- Chen, C.Y.; He, H.L. Crust shortening of Daliangshan tectonic zone in Cenozoic era and its implication. Seismol. Geol. 2008, 30, 443–453. [Google Scholar]
- Wei, Z.Y.; He, H.L.; Shi, F.; Xu, Y.R.; Bi, L.S.; Sun, H.Y. Slip rate on the south segment of Daliangshan Fault zone. Seismol. Geol. 2012, 34, 282–293. [Google Scholar]
- Wang, W.L.; Wu, J.P.; Fang, L.H.; Lai, G.J. 2014 Ludian MS6.5 earthquake sequence Double difference positioning. Chin. J. Geophys. 2014, 57, 3042–3051. [Google Scholar]
- Zhang, Y.; Chen, Y.T.; Xu, L.S.; Wei, X.; Jin, M.; Zhang, S. 2014 MW6.1 earthquake in Ludian, Yunnan Province: A Conjugate rupture earthquake. Chin. J. Geophys. 2015, 58, 153–162. [Google Scholar]
- Wan, Y.G.; Shen, Z.K.; Sheng, S.Z.; Xu, X. The impact of the 2008 Yutian M7.3 earthquake on Zhou Influence of circumferential faults and regional structural interpretation of normal fault mechanism. Chin. J. Geophys. 2010, 53, 280–289. [Google Scholar]
- Xu, X.W.; Tan, X.B.; Wu, G.D.; Chen, J.; Shen, J.; Fang, W.; Song, H. Surface rupture in the 2008 Yutian MS7.3 earthquake Discussion on strip characteristics and their construction Attributes. Seismol. Geol. 2011, 33, 462–471. [Google Scholar]
- Cheng, H.; Pang, Y.; Dong, Y.; Zhang, H.; Shi, Y. Yu Tian twice in 2008 and 2014 MS7.3 Stress environment of earthquake breeding. Chin. J. Geophys. 2014, 57, 3238–3246. [Google Scholar]
- Wu, W. Stress distribution characteristics of fault intersection in Anninghe-Zemuhe fault zone and its surrounding areas. Seismol. Res. 2020, 43, 601–609+767. [Google Scholar]
- Du, P. Evolution history and deformation mechanism of the Zemuhe fault zone. Sichuan Earthq. 2000, 65–79. [Google Scholar] [CrossRef]
- Song, F.; Li, R.; Xu, X. Preliminary results of paleo-earthquake research on the Daliangshan fault zone in Sichuan Province. Seismol. Geol. 2002, 24, 27–34. [Google Scholar]
- He, H.; Yasuta, I.; He, Y.; Masami, T.; Chen, J.; Chen, C.; Tian, L.; Tomoo, E.; Shinsuke, O. Bending and straightening of the middle part of Xianshuihe-Xiaojiang fault system in the new Daliangshan Fault belt. Sci. China Earth Sci. 2008, 38, 564–574. [Google Scholar]
- Zhang, Q.; Peng, X.; Zhu, J. Tectonic characteristics and activity of Majian-Lebo-Emian-Jinyang fault. J. Sichuan Geol. 2019, 39, 30–33. [Google Scholar]
- Zhang, S.; Nie, G.; Liu, X.; Ren, J.; Su, G. Fault movement association and seismic subdivision Characteristics of Yingjing-Mabian-Yanjin Thrusting tectonic Belt. Seismol. Geol. 2005, 27, 221–233. [Google Scholar]


| Segment | Stream | SL | Average SL | Drainage Basin | HI | Average HI |
|---|---|---|---|---|---|---|
| Northern segment | R1 | 494 | 384 | N1 | 0.49 | 0.45 |
| R2 | 315 | N2 | 0.41 | |||
| R3 | 219 | N3 | 0.38 | |||
| R4 | 306 | N4 | 0.52 | |||
| R5 | 242 | N5 | 0.48 | |||
| R6 | 174 | N6 | 0.42 | |||
| R7 | 467 | N7 | 0.49 | |||
| R8 | 1750 | N8 | 0.41 | |||
| R9 | 336 | N9 | 0.41 | |||
| R10 | 121 | N10 | 0.43 | |||
| R11 | 161 | N11 | 0.38 | |||
| R12 | 162 | N12 | 0.37 | |||
| R13 | 1 | N13 | 0.36 | |||
| R14 | 1889 | N14 | 0.60 | |||
| R15 | 220 | N15 | 0.38 | |||
| R16 | 153 | N16 | 0.36 | |||
| R17 | 208 | N17 | 0.42 | |||
| R18 | 440 | N18 | 0.41 | |||
| R19 | 587 | N19 | 0.47 | |||
| R20 | 618 | N20 | 0.40 | |||
| R21 | 384 | N21 | 0.48 | |||
| R22 | 198 | N22 | 0.44 | |||
| R23 | 398 | N23 | 0.50 | |||
| R24 | 210 | N24 | 0.45 | |||
| R25 | 700 | N25 | 0.52 | |||
| R26 | 226 | N26 | 0.43 | |||
| R27 | 169 | N27 | 0.48 | |||
| R28 | 175 | N28 | 0.42 | |||
| R29 | 225 | N29 | 0.55 | |||
| R30 | 233 | N30 | 0.47 | |||
| R31 | 39 | N31 | 0.46 | |||
| R32 | 487 | N32 | 0.66 | |||
| Middle segment | R33 | 63 | 175 | N33 | 0.34 | 0.41 |
| R34 | 30 | N34 | 0.47 | |||
| R35 | 91 | N35 | 0.36 | |||
| R36 | 3 | N36 | 0.33 | |||
| R37 | 158 | N37 | 0.51 | |||
| R38 | 286 | N38 | 0.46 | |||
| R39 | 215 | N39 | 0.44 | |||
| R40 | 24 | N40 | 0.39 | |||
| R41 | 637 | N41 | 0.32 | |||
| R42 | 327 | N42 | 0.47 | |||
| R43 | 196 | N43 | 0.53 | |||
| R44 | 49 | N44 | 0.48 | |||
| R45 | 115 | N45 | 0.46 | |||
| R46 | 358 | N46 | 0.39 | |||
| R47 | 80 | N47 | 0.31 | |||
| Southern segment | R48 | 811 | 378 | N48 | 0.66 | 0.45 |
| R49 | 217 | N49 | 0.37 | |||
| R50 | 9 | N50 | 0.35 | |||
| R51 | 188 | N51 | 0.39 | |||
| R52 | 1 | N52 | 0.28 | |||
| R53 | 71 | N53 | 0.37 | |||
| R54 | 73 | N54 | 0.49 | |||
| R55 | 633 | N55 | 0.31 | |||
| R56 | 78 | N56 | 0.56 | |||
| R57 | 1 | N57 | 0.50 | |||
| R58 | 825 | N58 | 0.54 | |||
| R59 | 224 | N59 | 0.54 | |||
| R60 | 1269 | N60 | 0.51 | |||
| R61 | 385 | N61 | 0.63 | |||
| R62 | 1900 | N62 | 0.49 | |||
| R63 | 118 | N63 | 0.60 | |||
| R64 | 141 | N64 | 0.40 | |||
| R65 | 217 | N65 | 0.52 | |||
| R66 | 442 | N66 | 0.37 | |||
| R67 | 831 | N67 | 0.48 | |||
| R68 | 396 | N68 | 0.27 | |||
| R69 | 196 | N69 | 0.51 | |||
| R70 | 276 | N70 | 0.32 | |||
| R71 | 385 | N71 | 0.43 | |||
| R72 | 139 | N72 | 0.50 | |||
| R73 | 20 | N73 | 0.43 |
Disclaimer/Publisher’s Note: The statements, opinions and data contained in all publications are solely those of the individual author(s) and contributor(s) and not of MDPI and/or the editor(s). MDPI and/or the editor(s) disclaim responsibility for any injury to people or property resulting from any ideas, methods, instructions or products referred to in the content. |
© 2023 by the authors. Licensee MDPI, Basel, Switzerland. This article is an open access article distributed under the terms and conditions of the Creative Commons Attribution (CC BY) license (https://creativecommons.org/licenses/by/4.0/).
Share and Cite
Xu, D.; He, Z.; Guo, L.; Wu, L.; Li, L. Response of the Stream Geomorphic Index to Fault Activity in the Lianfeng–Ningnan Segment (LNS) of the Lianfeng Fault on the Eastern Margin of the Tibetan Plateau. Remote Sens. 2023, 15, 2309. https://doi.org/10.3390/rs15092309
Xu D, He Z, Guo L, Wu L, Li L. Response of the Stream Geomorphic Index to Fault Activity in the Lianfeng–Ningnan Segment (LNS) of the Lianfeng Fault on the Eastern Margin of the Tibetan Plateau. Remote Sensing. 2023; 15(9):2309. https://doi.org/10.3390/rs15092309
Chicago/Turabian StyleXu, Dongsheng, Zhongtai He, Long Guo, Liangliang Wu, and Linlin Li. 2023. "Response of the Stream Geomorphic Index to Fault Activity in the Lianfeng–Ningnan Segment (LNS) of the Lianfeng Fault on the Eastern Margin of the Tibetan Plateau" Remote Sensing 15, no. 9: 2309. https://doi.org/10.3390/rs15092309
APA StyleXu, D., He, Z., Guo, L., Wu, L., & Li, L. (2023). Response of the Stream Geomorphic Index to Fault Activity in the Lianfeng–Ningnan Segment (LNS) of the Lianfeng Fault on the Eastern Margin of the Tibetan Plateau. Remote Sensing, 15(9), 2309. https://doi.org/10.3390/rs15092309