Article

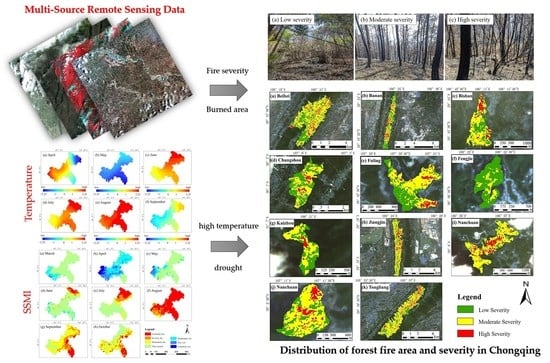
Forest Fire Mapping Using Multi-Source Remote Sensing Data: A Case Study in Chongqing

1
Chongqing Jinfo Mountain Karst Ecosystem National Observation and Research Station, School of Geographical Sciences, Southwest University, Chongqing 400715, China
2
Chongqing Engineering Research Center for Remote Sensing Big Data Application, School of Geographical Sciences, Southwest University, Chongqing 400715, China
*
Author to whom correspondence should be addressed.
Remote Sens. 2023, 15(9), 2323; https://doi.org/10.3390/rs15092323
Submission received: 15 March 2023 / Revised: 25 April 2023 / Accepted: 26 April 2023 / Published: 28 April 2023
(This article belongs to the Special Issue Remote Sensing Applications in Wildfire Research and Management)

Abstract

:
Forest fires are one of the most severe natural disasters facing global ecosystems, as they have a significant impact on ecological security and social development. As remote sensing technology has developed, burned areas can now be quickly extracted to support fire monitoring and post-disaster recovery. This study focused on monitoring forest fires that occurred in Chongqing, China, in August 2022. The burned area was identified using various satellite images, including Sentinel-2, Landsat8, Environmental Mitigation II A (HJ2A), and Gaofen-6 (GF-6). The burned area was extracted using visual interpretation, differenced Normalized Difference Vegetation Index (dNDVI), and differenced Normalized Burnup Ratio (dNBR). The results showed that: (1) The results of the three monitoring methods were very consistent, with a coefficient of determination R2 > 0.96. (2) A threshold method based on the dNBR-extracted burned area was used to analyze fire severity, with moderate-severity fires making up the majority (58.05%) of the fires. (3) Different topographic factors had some influence on the severity of the forest fires. High elevation, steep slopes and the northwestern aspect had the largest percentage of burned area.

Graphical Abstract

1. Introduction

Forest fires as a type of natural disaster are characterized by a rapid and random occurrence and relatively high destruction, making them difficult to detect and predict precisely [1]. Forest fires have had a tremendous impact on the natural environment, human activities, and climate change [2]. Scholars from different disciplines have been paying attention to forest fire research for at least 150 years. For example, Chuvieco and Congalton [3] conducted a related study on the application of remote sensing and geographic information systems to forest fire hazard mapping in 1989. Thus, monitoring the forest fire accurately is critical for the early detection of fires, tracking fire progress, improving fire-fighting efficiency, disaster damage assessment, disaster impact assessment, and dynamic vegetation restoration [4,5,6]. Satellite remote sensing has the characteristics of a short imaging period and wide coverage. Compared to traditional manual survey methods [7], satellite remote sensing has a wide range of observation capabilities and provides an effective tool for monitoring forest fires and burned areas [8]. Especially, high-resolution remote sensing images acquired during satellite overpass are used to carry out a full range of monitoring, including early fire point identification, burned area extraction and statistical analysis, and vegetation recovery monitoring of fire trails.
The burned area is defined by the area that has been affected by fire burning [9]. Through satellite remote sensing, the burned area can be differentiated from the surrounding area on the basis of changes in vegetation cover and differences in spectral bands [10]. After a forest fire, the spectrum no longer has the capacity to monitor the characteristics [11] of healthy vegetation. Moreover, large quantities of charcoal and ash accumulated in the combustion zone lead to a decrease in reflectivity in the near-infrared (NIR) band. The short-wave infrared (SWIR) band exhibits increased reflectance owing to the lack of vegetation canopy cover. Via spectral characterization, the red, NIR, and SWIR bands are often used to construct different indices to identify burned areas [12]. The Normalized Difference Vegetation Index (NDVI) [13] is one of the most widely used spectral indices for monitoring vegetation changes. The vegetation changes after a fire recorded by differences in the NDVI and the differenced Normalized Difference Vegetation Index (dNDVI) can be used to extract the burned area. The Normalized Burnup Ratio (NBR) is based on the NDVI modifying the red to SWIR bands, and this can also highlight burned areas [14]. Holden et al. [11] proposed an improved Normalized Burn Ratio-Thermal (NBRT) index based on the NBR by introducing the thermal infrared band into the formula, which can better separate burned and non-burned regions. Chuvieco and Martin [15] proposed the Burn Area Index (BAI) based on the difference between the red and NIR wavelengths before and after fire combustion. Fire severity refers to the severity with which the ecosystem is affected or destroyed by a forest fire [16], which could result in biomass loss, posing a threat to the global carbon balance [17]. Since the 1980s, several studies have focused on fire severity using remote sensing. In addition, field measurements, aircraft aerial photography, and remote sensing imaging have been used to focus on the effects of vegetation conditions, topographic factors, and environmental factors of fire severity [18,19,20].
The forest fire is influenced by four factors: meteorology, terrain, combustible material, and human factors [21]. The occurrence of forest fires is closely related to drought meteorological factors [22,23,24]. High temperature, scarce precipitation, low relative humidity, low soil moisture, strong wind, and other factors facilitate forest fires [25]. Drought is one of the extreme climate disasters globally [26,27]. It is characterized by having a wide range, long duration, great impact, and causing substantial damage [28]. In general, a drought can be classified as either a precipitation-related meteorological drought, soil-moisture-related agricultural drought, runoff-related hydrological drought, or socioeconomic drought [29,30]. During a meteorological drought, precipitation is continuously deficient for a specific period of time. Prolonged periods of low precipitation result in reduced soil moisture, causing soil drought and reduced crop yields [31]. When a drought develops to a certain extent, it impacts aquifers, lakes, and reservoirs, resulting in hydrological drought and socioeconomic losses [32,33]. Drought can be represented by mathematical indicators calculated from climatic variables, such as the Standardized Precipitation Index (SPI) [34], Standardized Soil Moisture Index (SSMI) [35,36], and Standardized Runoff Index (SRI) [37]. No matter what drought indicators are used, they vary spatiotemporally depending on the region’s climate, hydrology, and topography [38,39]. In this study, the SPI and SSMI were selected to assess the drought conditions in Chongqing. The SPI is a commonly used drought index that is solely based on precipitation. It calculates the standardized probability of precipitation during a specific timeframe [40]. The SSMI is one of the most straightforward indices developed and validated in different studies and is a powerful tool for monitoring agricultural drought [41,42].
Extreme high temperature has increased globally over recent decades [43,44,45]. In 2022, various parts of the world experienced high-temperature anomalies. Chongqing, located in the southwestern part of China was one of the areas most affected by high temperatures. In this study, we mapped forest fire burned areas in Chongqing in August 2022. Sentinel-2, Landsat8, Environmental Mitigation II A (HJ2A) and Gaofen-6 (GF-6) satellite data were obtained from multiple sources. We extracted burned areas through visual interpretation, dNDVI and dNBR methods. The burned area extracted by dNBR was classified using a threshold method to evaluate the severity of the forest fires. Meanwhile, we analyzed the relationship between forest fire severity and topographic factors. The remote sensing image data used in the study, especially the Gaofen series, have a high spatiotemporal resolution and a wide observation range. This enables the efficient and effective monitoring of forest fires and promotes the application of high-resolution remote sensing image data in forest fire prevention and control in China. Finally, we discussed the natural and human factors that affect forest fires. The structure of this paper is as follows: In the second section, the work introduces the data and methods used in the study. In the third section, we used multi-source remote sensing data to map the forest fire burned areas. Then, we analyzed the severity of forest fires and the relationship with topography. The fourth section discusses our study. The final section provides a summary.

2. Materials and Methods

2.1. Study Area

Chongqing (28°10′–32°13′N, 105°11′–110°11′E) is located in southwestern China on the upper–middle Yangtze River, covering a total area of 82,400 km2. The topography in this region is mainly hilly and mountainous, with an average elevation of approximately 400 m. The karst landscape is widely developed, and large areas of carbonate rock strata are exposed, mainly of Cambrian and Ordovician age, covering 24 districts and counties of Chongqing. The average annual precipitation ranges from 1000 to 1350 mm. Affected by the typical subtropical monsoon climate, droughts often occur in summer (e.g., July and August), and the annual average temperature ranges from 14 to 18 °C [46].
Here, our studies focused on a series of forest fires that occurred in Chongqing from August 17 to 26, 2022. Since July 2022, Chongqing has experienced a long period of extreme drought with low precipitation, concurrent with a sustained high temperature. Specifically, on the night of 17 August, a forest fire broke out in the mountains and forest under the jurisdiction of Fuling District, Chongqing. At the same time, the temperature continued to rise, reaching a peak on August 18, according to national weather station data. The fire spread rapidly to Beibei District, Nanchuan District, Jiangjin District, Banan District, Tongliang District, Fuling District, Bishan District, Changshou District, Kaizhou District, and Fengjie County (Figure 1). A series of fires lasted for nine days until all open fires were extinguished one after another on the morning of 26 August.

2.2. Data

2.2.1. Remote Sensing Data

After the forest fires in Chongqing, it was discovered that a single remote sensing dataset that meets accuracy requirements cannot fully cover the entire affected area. To map the burned areas, we utilized multiple sources of satellite remote sensing data. Specifically, we utilized GF-6, Sentinel-2, HJ2A, and Landsat8 satellite remote sensing images acquired in August and September 2022 (Table 1), allowing us to obtain comprehensive coverage of all areas affected by the fires. Additionally, on 21 October 2022, we traveled to the fire site in HuTouCun, Beibei District, where we collected remote sensing images of a representative area by using an unmanned aerial vehicle (UAV). The DJI Phantom 4 Multispectral (P4M) UAV was used to scan the burned area after the forest fires. It was equipped with one visible and five multispectral cameras (blue, green, red, red-edge, NIR), responsible for visible imaging and multispectral imaging, respectively. Then, the acquired raw UAV images were pre-processed with Pix4D software. The P4M system offers vegetation indices (VIs) and consequently obviates the necessity of obtaining reflectance data for these images. Finally, orthorectification was performed in the UTM-WGS84 projection coordinate system, and the spatial resolution of the UAV image was about 0.28 m.
In this study, Sentinel-2, Landsat 8, and HJ-2A data were selected for visual interpretation to conduct a preliminary count of fire areas. Then, GF-6 and Sentinel-2 data were used to extract the burned area by calculating dNDVI and dNBR. Based on field and UAV sampling points, thresholds were set to classify burned area results according to the dNBR extraction method. This allowed us to analyze the forest fire severity in each area.

2.2.2. Meteorological Data

Meteorological data were gathered from two sources: The Famine Early Warning Systems Network Land Data Assimilation System (FLDAS) dataset and real-time data from meteorological stations. The FLDAS dataset provides monthly temperature, wind speed, soil moisture, precipitation and other data, with a spatial resolution of 0.1° with spatial coverage from 60 S to 90 N, and 180 W to 180 E. The dataset includes data from January 1982 to present day. The dataset is available free of charge from NASA’s Earth Science Data Information Center (GES DISC) website (https://disc.gsfc.nasa.gov/datasets/FLDAS_NOAH01_C_GL_M_001/summary?keywords=FLDAS, accessed on 5 October 2022). Additionally, meteorological stations provide temperature, wind speed, soil temperature, humidity and rainfall data every 10 min. Specifically, data from meteorological stations CaoShang, HuTouCun, GanYanSuo, LanBaJing, and ShanWangPing were collected between 2018 and 2022. These stations provided support for analyzing the catalytic factors contributing to the occurrence of the Chongqing mountain fires.

2.3. Methods

2.3.1. Normalized Difference Vegetation Index (NDVI)

The NDVI [13] of the remote sensing images was calculated before and after the forest fires occurred. By subtracting the NDVI value before the fires from that after the fires, we obtained the dNDVI. A threshold method was then applied to the dNDVI to extract the burned area. Equations (1) and (2) were used to calculate the NDVI and dNDVI, respectively:
N D V I = N I R R N I R + R
d N D V I = N D V I p r e f i r e N D V I p o s t f i r e
where NIR is the near-infrared band of the remote sensing image, R is the red band, NDVIpre-fire is the pre-fire NDVI index, and NDVIpost-fire is the post-fire NDVI index.

2.3.2. Normalized Burnup Ratio (NBR)

To identify the burned area, the NBR [14] was utilized, accounting for the significant change in emissivity in the shortwave infrared (SWIR) and near-infrared (NIR) bands before and after the fires. Equations (3) and (4) were used to calculate the NBR and dNBR, respectively:
N B R = N I R S W I R N I R + S W I R
d N B R = N B R p r e f i r e N B R p o s t f i r e
where NIR is the near-infrared band of the remote sensing image, SWIR is the shortwave infrared band, NBRpre-fire is the pre-fire NBR index, and NBRpost-fire is the post-fire NBR index.

2.3.3. Threshold Method

Threshold segmentation is a commonly used, simple, and effective image segmentation method. In image segmentation work, the automatic acquisition of thresholds is commonly performed using methods such as the gray-scale histogram peak–valley method and the OTSU algorithm [47]. In this study, we conducted a field visit to the study area of HuTouCun in Beibei district on October 21, 2022 to collect sample points. We visited the burned area and observed the magnitude of this fire. Some areas were lightly burned, although the surface vegetation was burned out and new shoots were growing at the time. Some areas were badly burnt, with a thick residue of fire ash. In Figure 2, we have categorized them based on field sampling data into three fire severity levels: low severity, moderate severity, and high severity [48,49,50].
We randomly selected 100 sample points from the field survey and UAV images. Random selection refers to the selection of multiple points with different forest fire intensities in the true-color UAV image combining the measured sampling points with the visual interpretation method. These included 30 sample points of high severity represented by red, 50 sample points of moderate severity represented by yellow, and 20 sample points of low severity represented by green (Figure 3a). In this study, the dNBR calculated by Sentinel-2 was used to classify the severity of the fires. The dNBR classification results were superimposed on the sampled points and each sample point was assigned a dNBR value. Here, the threshold of dNBR for estimating the fire severity was based on the method supposed by Mazuelas [51]. Fire severity was classified into three classes as shown in Table 2 by combining the dNBR values of the field sampling points. We plotted the spatial distribution of forest fire severity levels in Figure 3b.

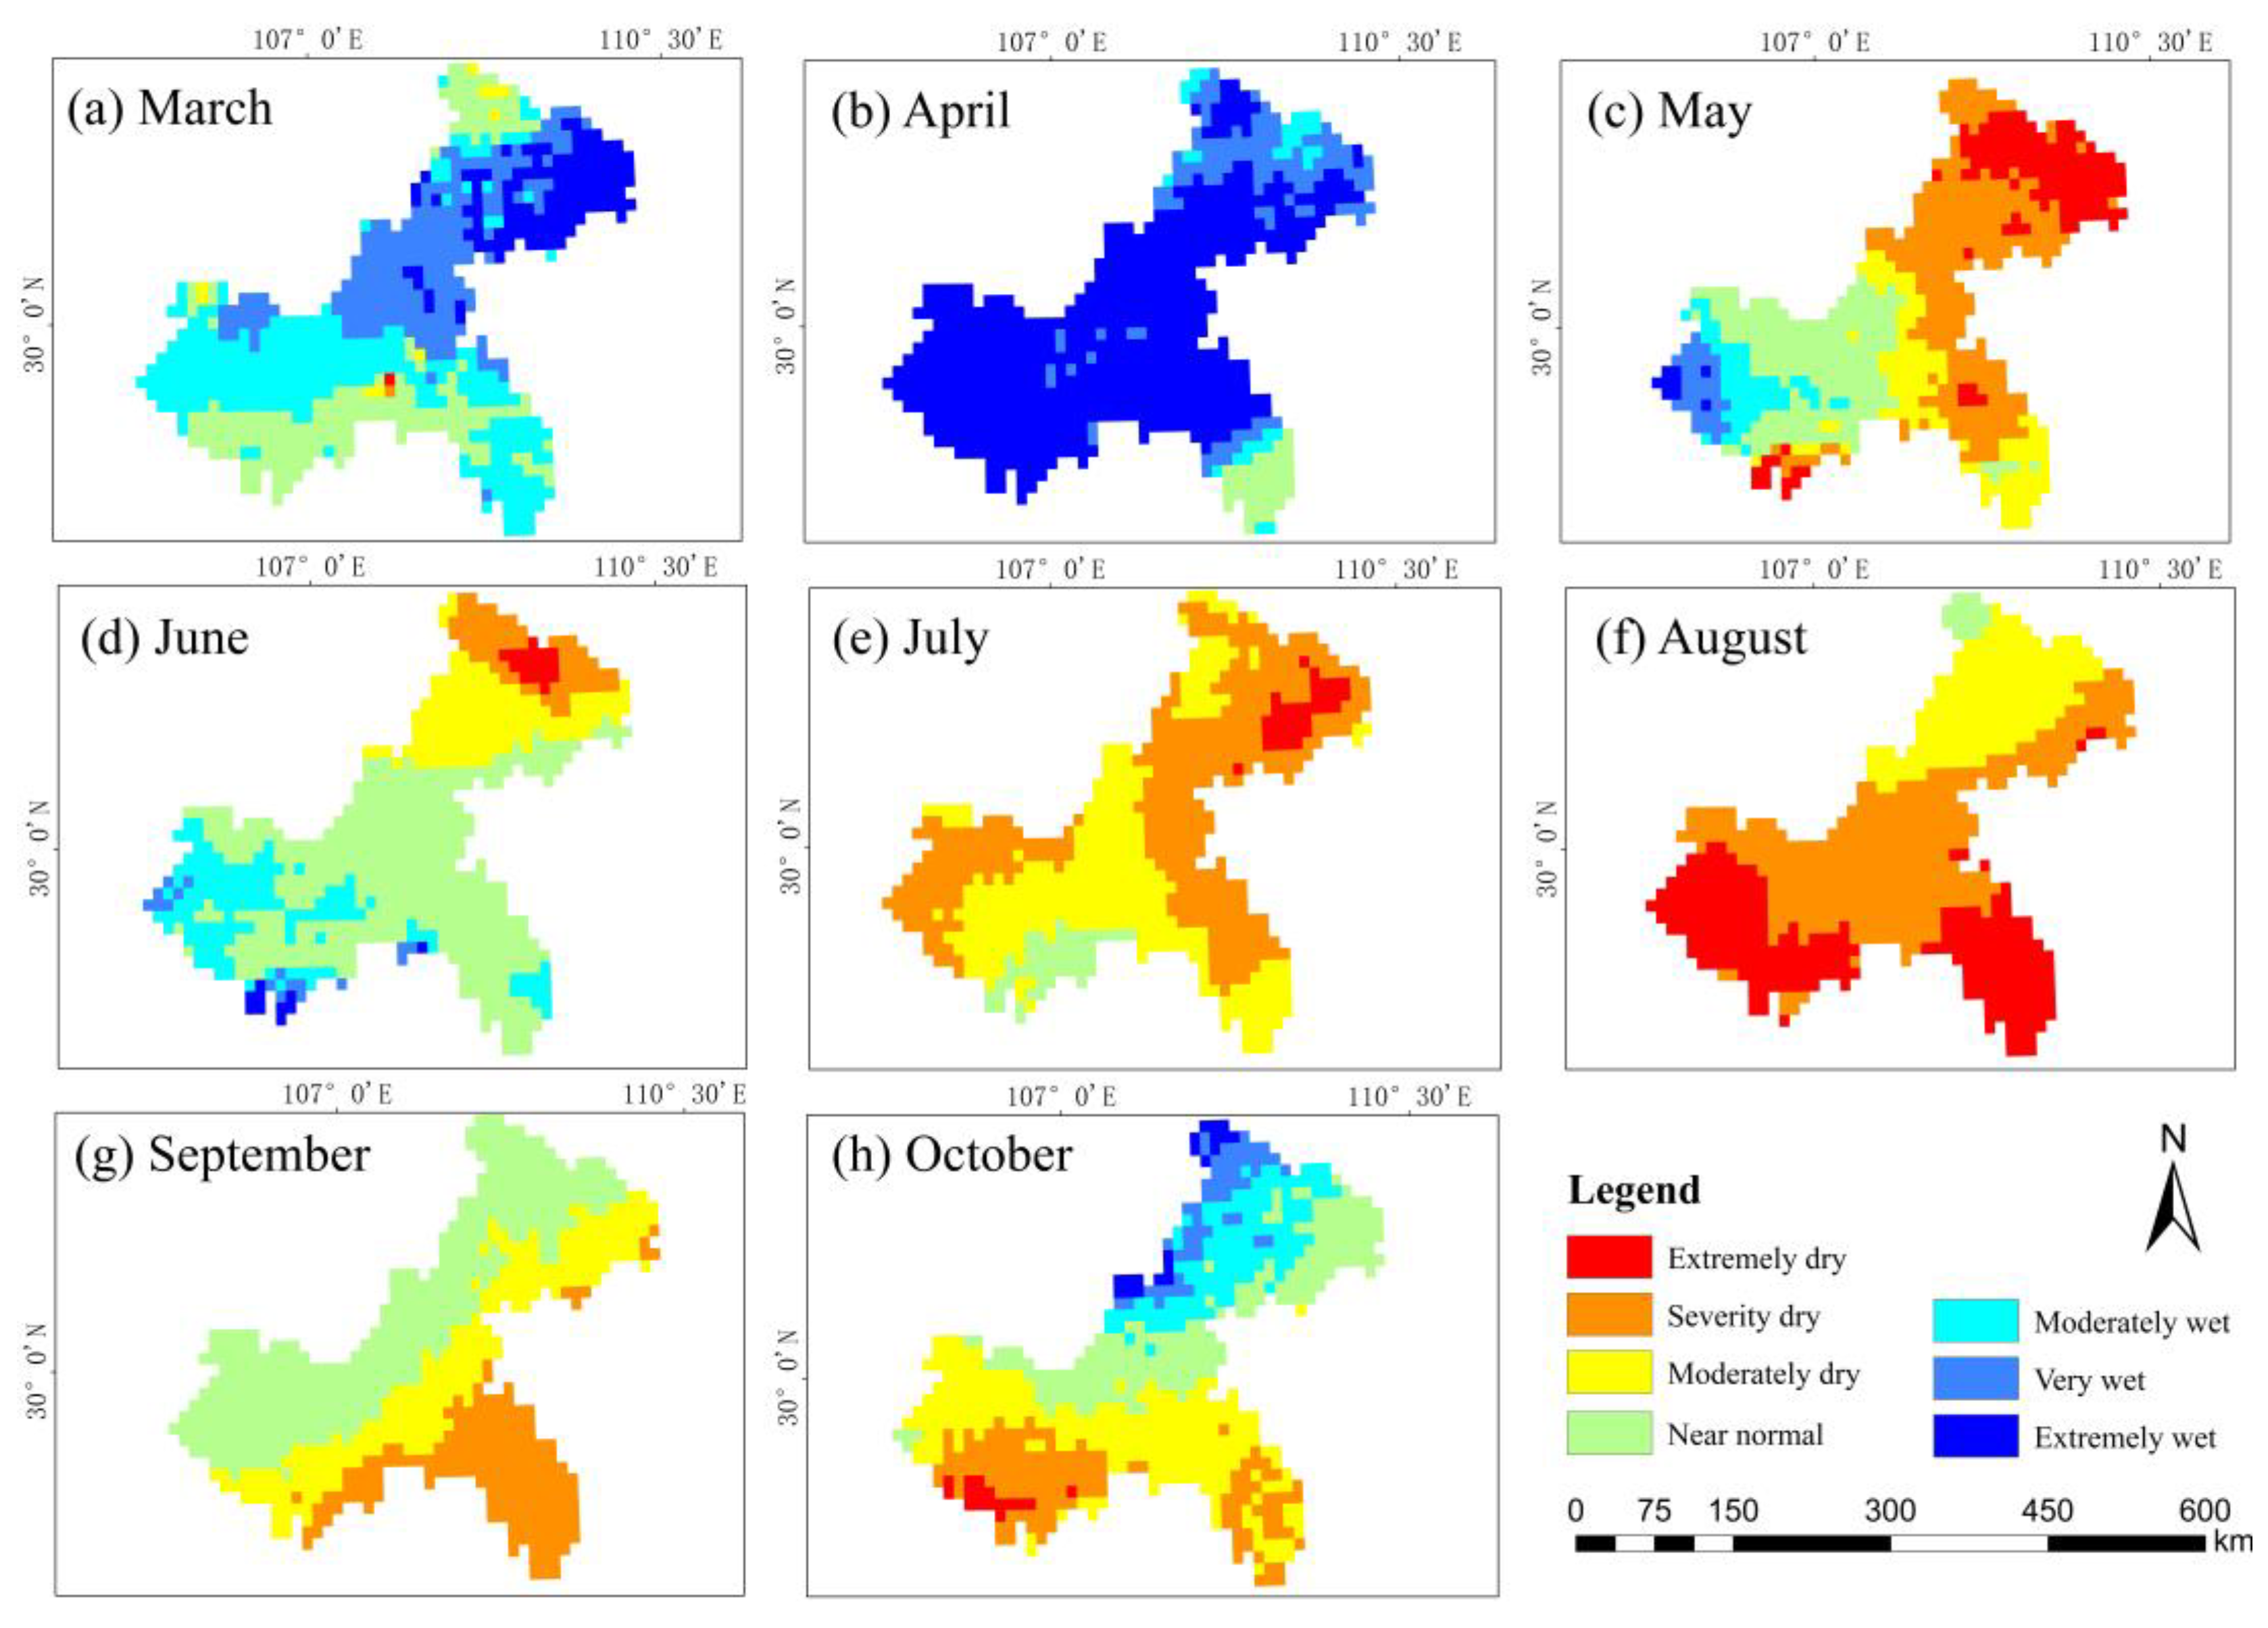
2.3.4. Drought Indicator Calculation

The SPI [34] and SSMI [35] rely on a single meteorological variable each. Specifically, the SPI employs monthly precipitation, while the SSMI uses monthly average soil moisture. Equations (5) and (6) can normalize long-term precipitation and soil moisture time series, thereby enabling the calculation of SPI and SSMI, respectively:
S P I i , j = R i , j μ R i δ R i
where SPIi,j is the SPI for month i and year j, Ri,j is the precipitation for month i and year j, μ R i is the mean of the long-term series of monthly precipitation, and δ R i is the standard deviation of the long-term series of precipitation on a monthly scale.
S S M I i , j = S M i , j μ S M i δ S M i
where SSMIi,j is the SSMI for month i and year j, SMi,j is the soil moisture for month i and year j, μ S M i is the mean of the long-term series of monthly soil moisture, and δ S M i is the standard deviation of the long-term series of soil moisture on a monthly scale.

3. Results

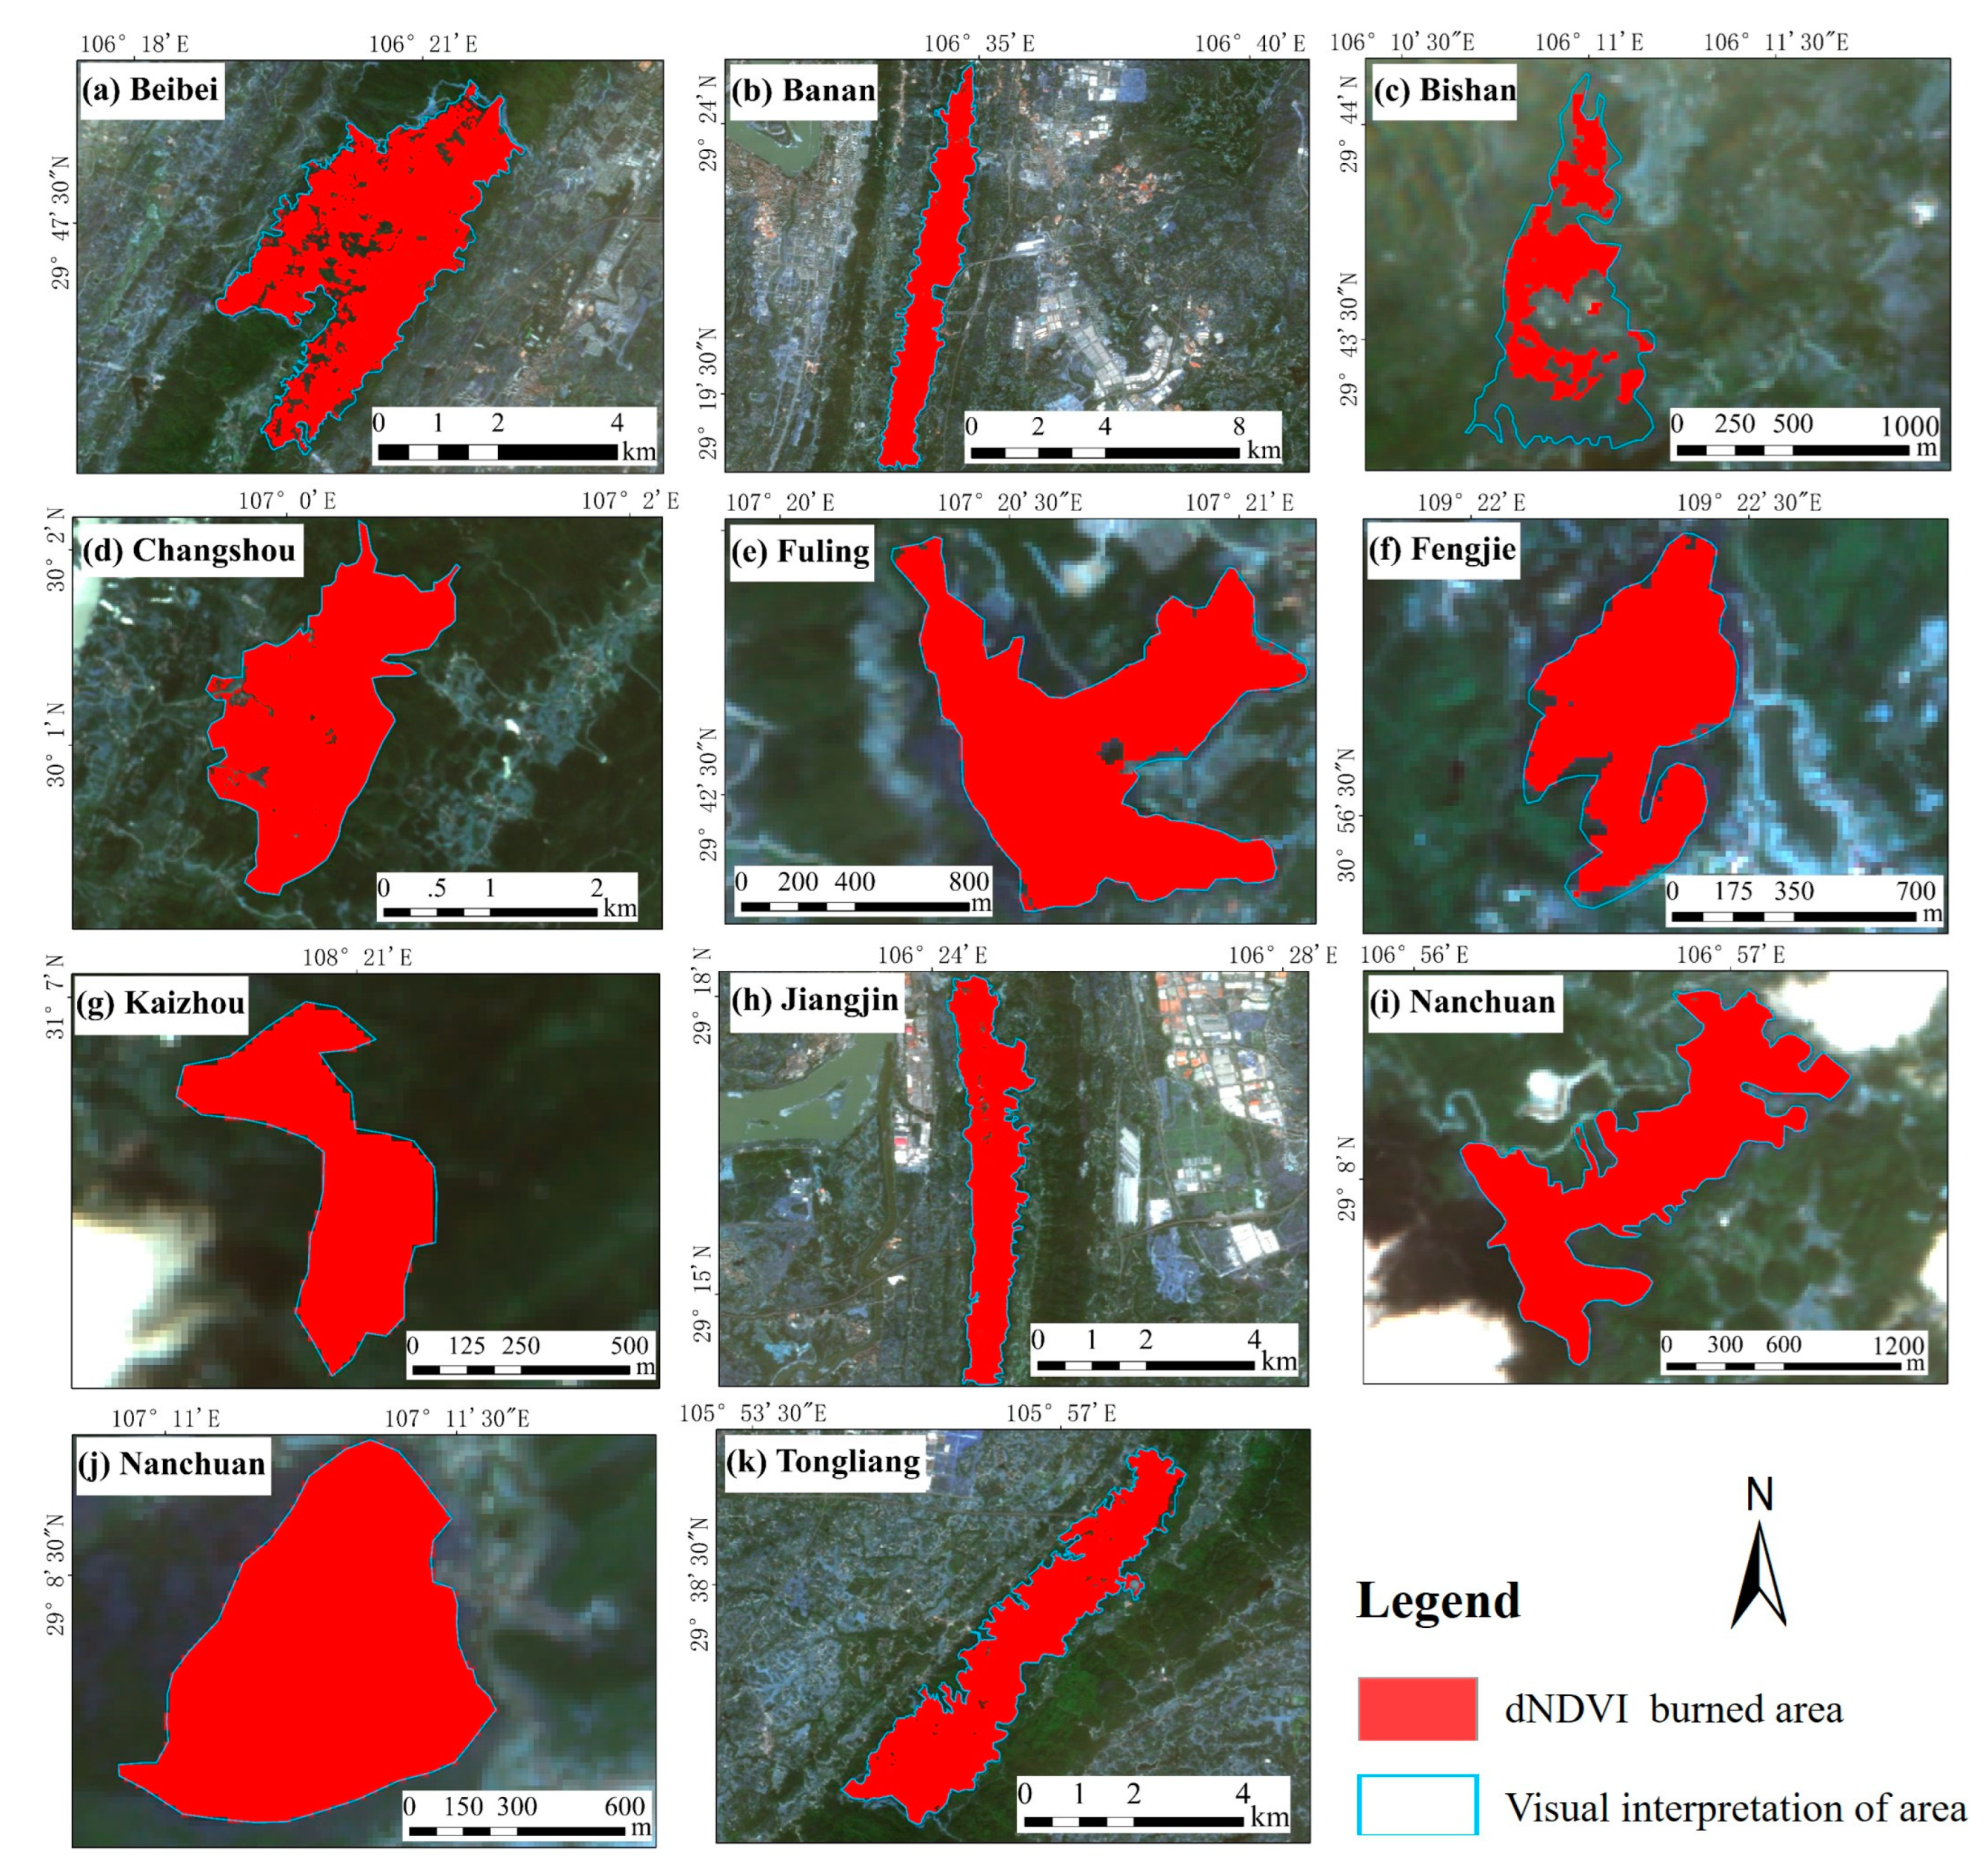
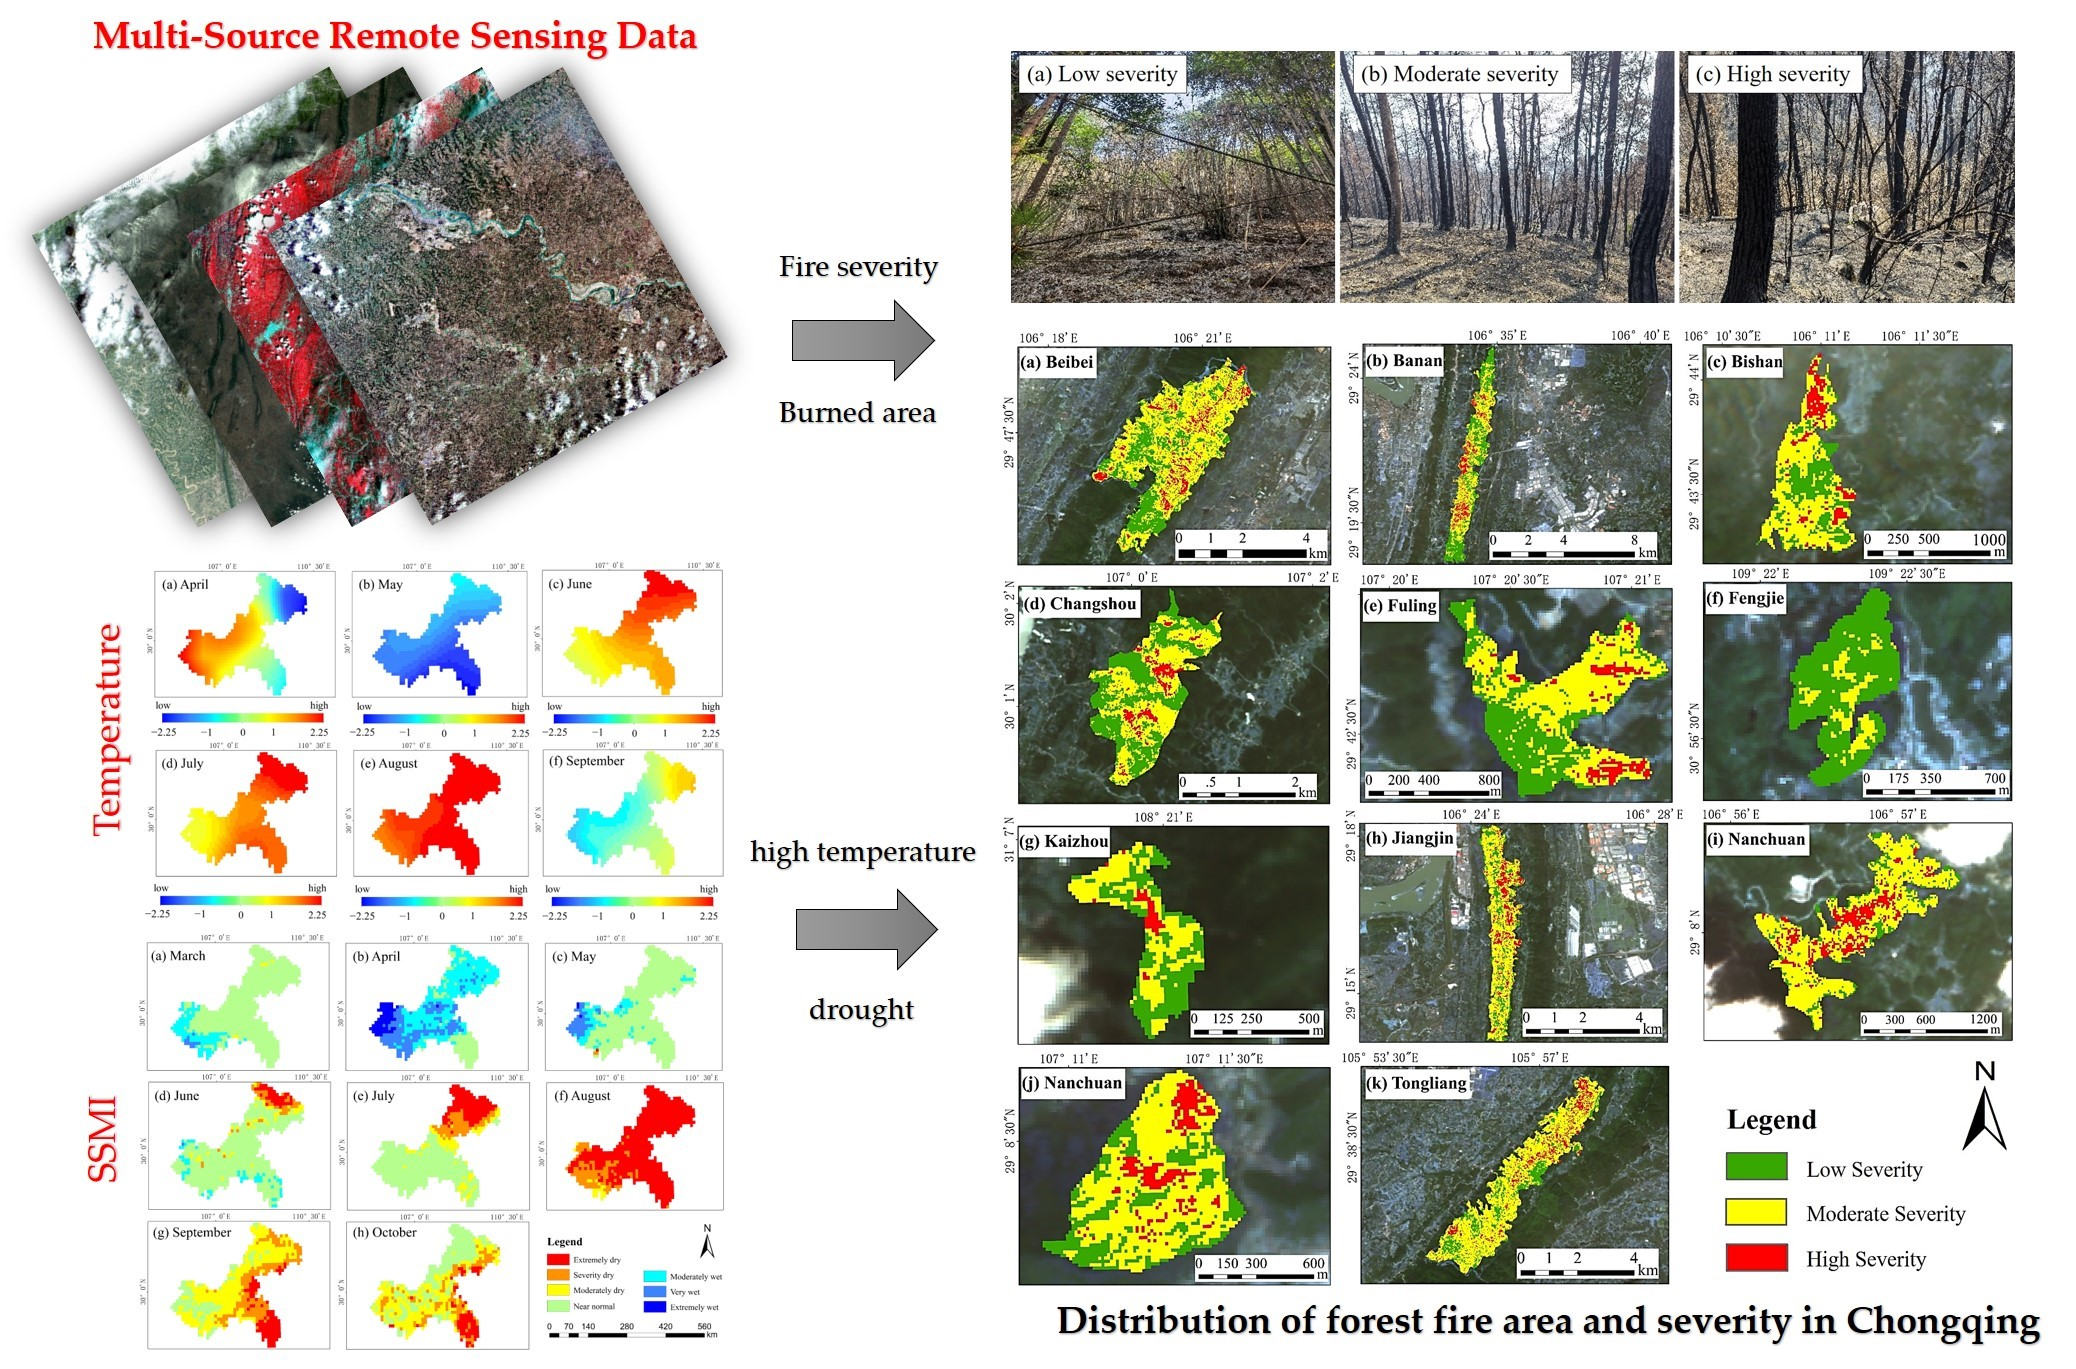
3.1. Fire Burned Area Statistics

In this study, we acquired two GF-6 images that completely covered the Chongqing fire area. Due to its high spatial resolution, the changes in brightness caused by the fires were more pronounced in the post-fire image. The burned area was extracted using the dNDVI between the two temporal phases (before and after the fires). For instance, in HuTouCun, Beibei District (Figure 4a), the dNDVI of the area ranged from 0.525 to 0.599. An extraction threshold of 0.1 was set to successfully extract the burned area. This threshold was then applied to all areas, and the results are shown in Figure 4.
The Sentinel-2 data have an SWIR band that allows for the pre- and post-fire NBR to be calculated. The burned area exhibited a more pronounced local change in brightness with the SWIR band. Burned area extraction was performed based on the dNBR calculated between the two temporal phases (before and after the fires). For instance, in HuTouCun, Beibei District (Figure 5a), the dNBR range was 0.724 to 0.861. An extraction threshold of 0.1 was set to successfully extract the burned area. This threshold was then applied to all areas, and the results are presented in Figure 5.
We conducted a qualitative analysis of the overall distribution and detailed characteristics of the burned areas extracted from visual interpretation, dNDVI, and dNBR. Figure 4 and Figure 5 clearly demonstrate that the burned areas extracted using these three methods were similar. The areas extracted using the dNDVI and dNBR algorithms were essentially within the range of visual interpretation.
We conducted a quantitative analysis of the differences in area and correlation of the burned area extracted using the three different methods, and the results are presented in Table 3. Overall, the differences between the areas extracted using the visual interpretation, dNDVI, and dNBR methods were minor.
Figure 6a demonstrates a high degree of consistency between the burned area extracted using the dNDVI and visual interpretation, with an R2 value of 0.9895, indicating a strong agreement between the two variables. Similarly, Figure 6b shows a strong coefficient of determination of 0.9638 between the burned area extracted using the dNBR and dNDVI. Figure 6c with an R2 value of 0.9802 between the burned area extracted using dNBR and visual interpretation. Overall, these results suggest that all three methods are reliable for extracting burned areas, as they exhibited high consistency across the board.

3.2. Fire Severity Analysis

In this study, we compared 100 field sampling points of different severities with the dNBR classification level (Figure 3) to verify the accuracy of this threshold classification range (Table 2). The classification results were assessed using a confusion matrix to verify the accuracy and reliability of the classification, as illustrated in Figure 7. No errors occurred at the low severity, but slight errors occurred at moderate and high severities. The overall accuracy was 93%, with a kappa coefficient of 0.8889. These results indicate the field sampling points were highly consistent with the results of the fire severity classification, and the threshold values had been set precisely.
The threshold values were applied to all areas where forest fires occurred in Chongqing, and the grading results are shown in Figure 8. The results show that these forest fires were generally of moderate severity, with very few areas of high severity. Essentially, the fires were of low severity on the edges of the fire area and more severe in the interior. This may be related to topographical factors, which will be discussed below.
We calculated the percentage share of fire severity at different levels of fire trails (Table 2). The results (Table 4) show that the overall percentages of the burned areas for each level of fire severity in Chongqing were: moderate severity (58.05%) > low severity (29.96%) > high severity (11.99%). This suggests that local forestry departments should focus on moderate-severity fire areas to develop post-fire management decisions, assist the recovery of lightly burned areas, and promote the recovery of heavily burned areas.

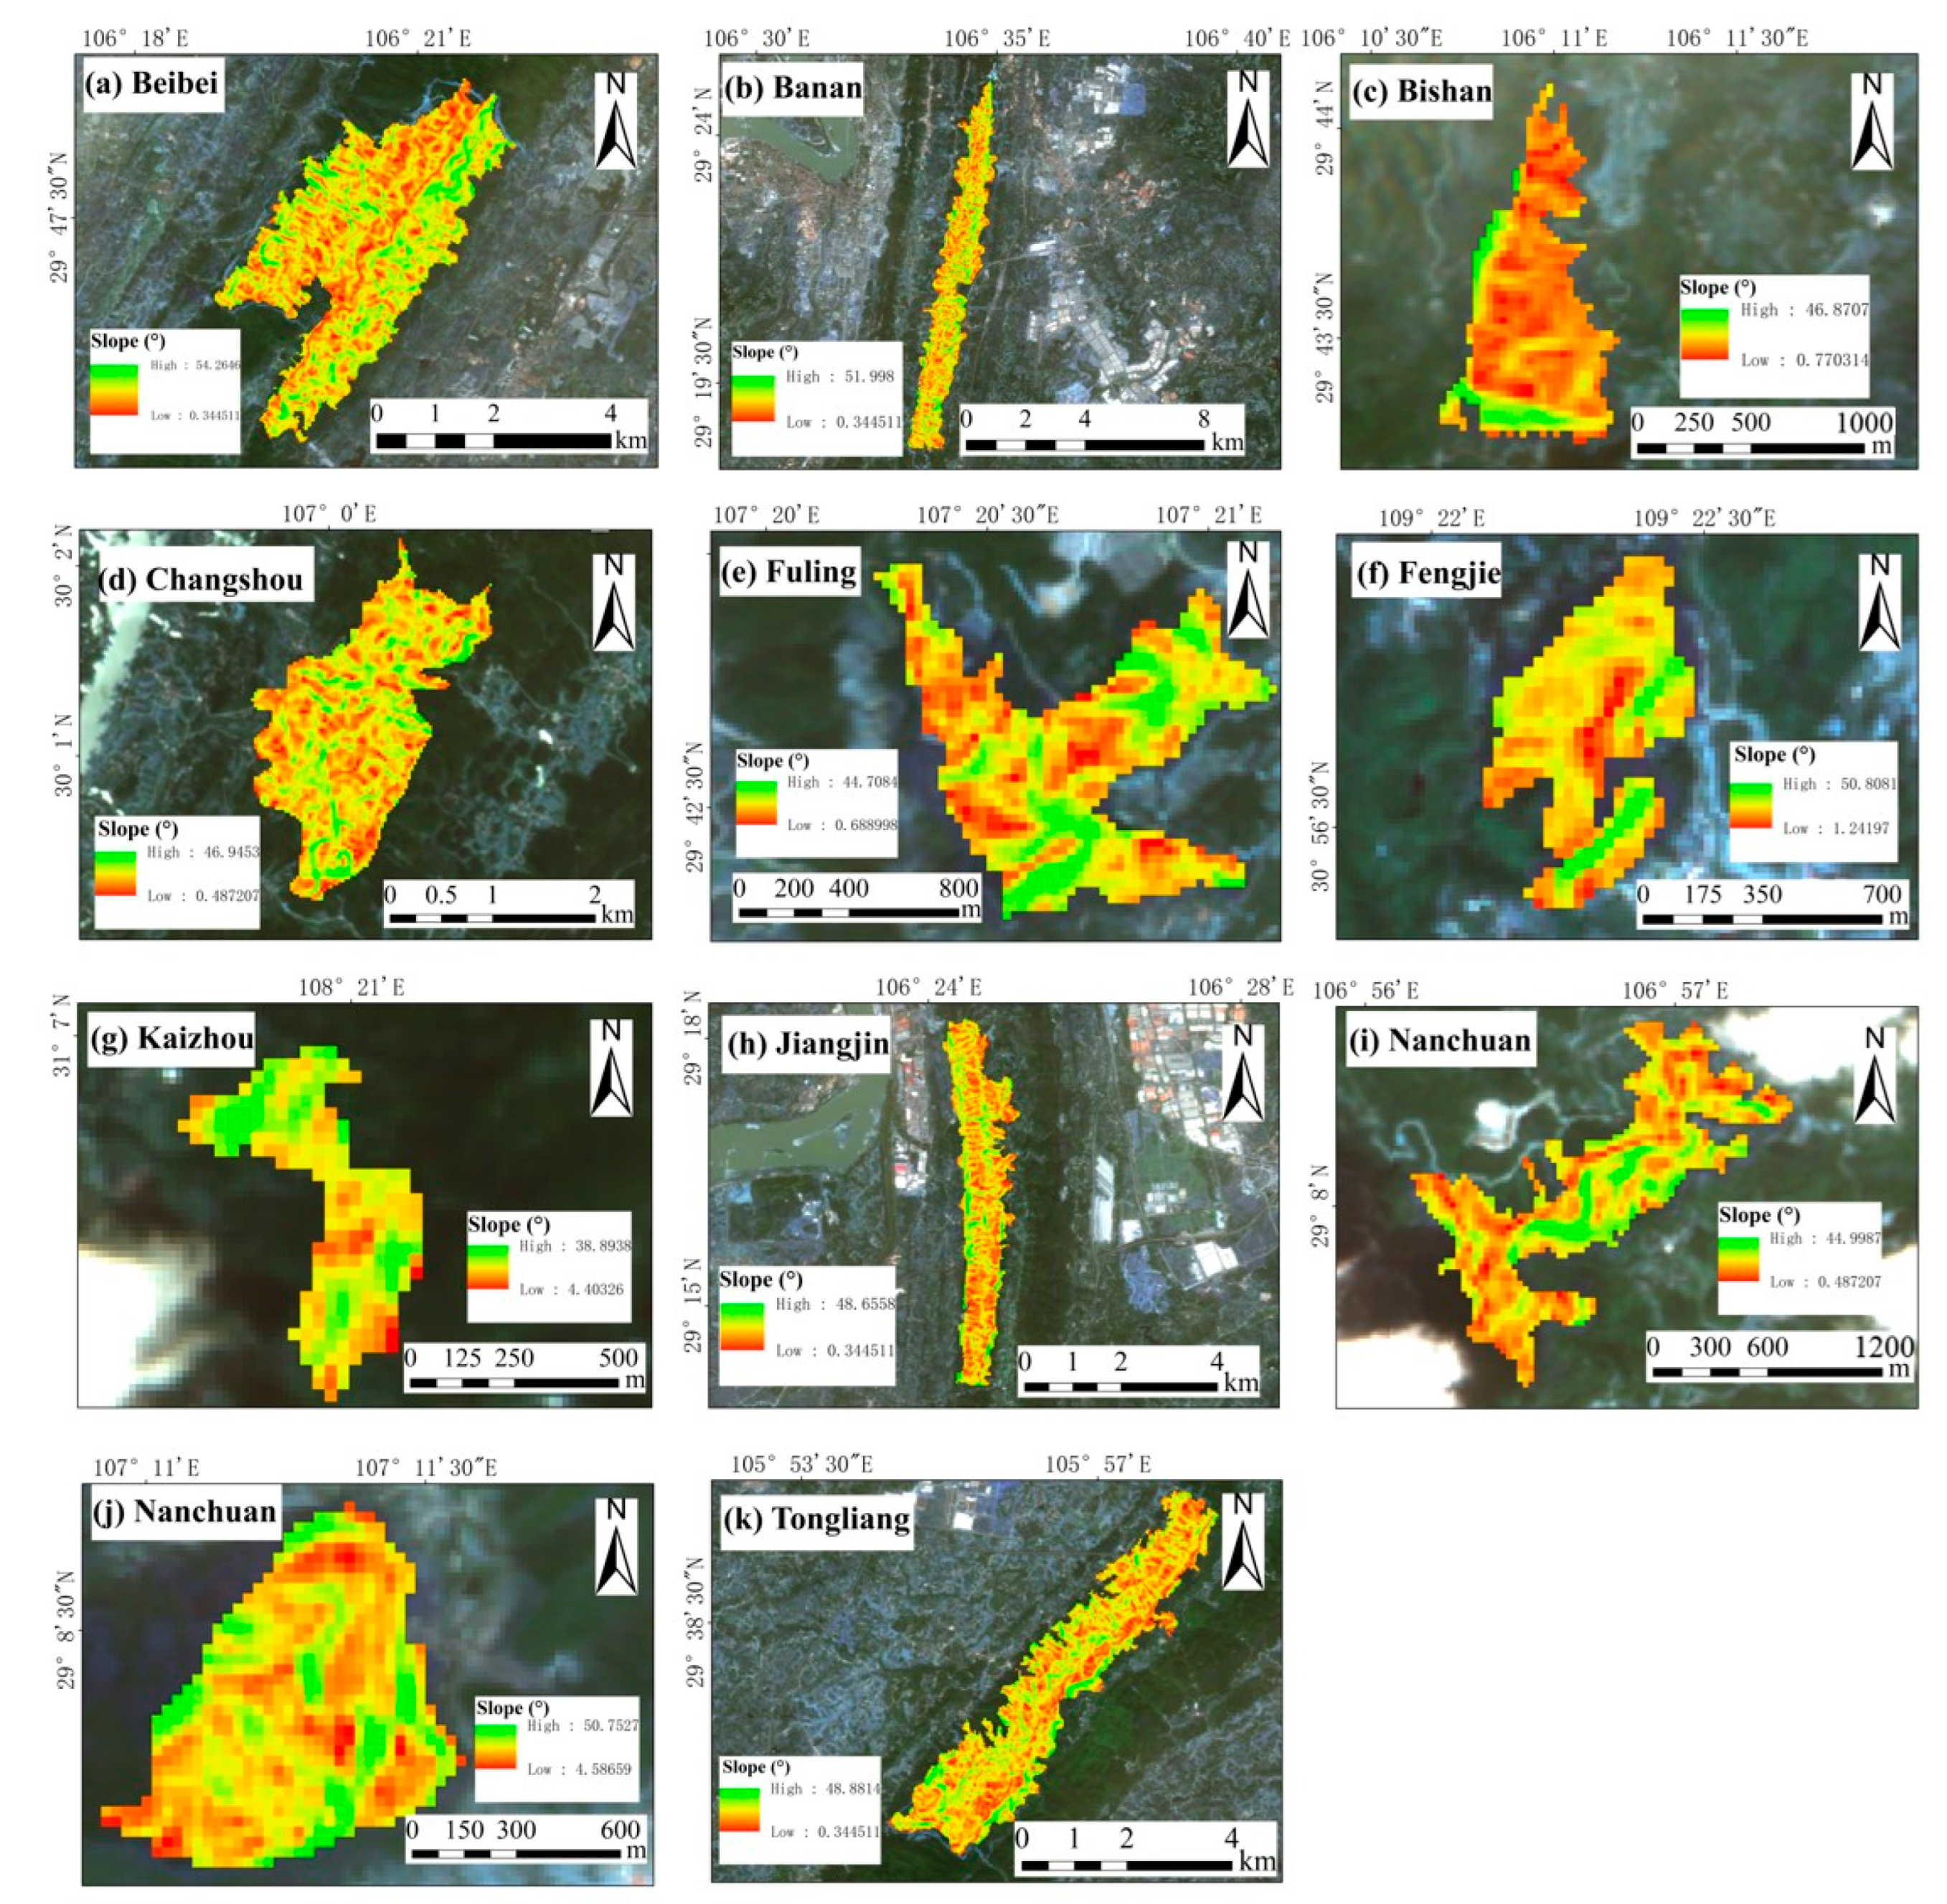
3.3. Fire Severity and Topography

Fire severity and the burned area vary according to topographic conditions [49,52,53]. In this study, the fire severity rating results were overlaid with a 30 m-resolution ASTER GDEM for statistical and analytical purposes. Elevation is the distance of the surface unit above sea level, and the mean sea level is usually used as the calculation standard. Slope is the distance between the vertical height of a unit and the horizontal surface and is used to indicate the steepness of the surface unit. Aspect is the projection of the slope normal to the horizontal plane, which is the tangent of the inclination of the slope [18].
The elevation range of the Chongqing forest fire areas was between 276 and 999 m. Figure 9 shows the elevation of each fire area, with the gradient buffer in the legend showing green for low elevation and white for high elevation. The different elevations were divided into two classes: 276–500 m and 500–999 m.
The results (Table 5) show that the overall trend of the fire severity at different elevation levels remained the same: moderate severity > low severity > high severity. The area burned at elevations of 276–500 m was approximately the same as that at elevations of 500–999 m, with 46.66% in the former and 53.34% in the latter. Overall, the areas affected by the forest fires did not have a very high elevation. Within this range, there was not a significant difference in the severity of the fires between the two different elevation classes.
The slopes of the Chongqing forest fire areas ranged from 0.35° to 54.26°. Figure 10 shows the slope values of each fire area, and the gradient buffer in the legend shows green as low slope and red as high slope. Some high slope areas can be found in all burned areas. The different slopes were divided into five classes for analysis. The gradients were flat (0°–5°), gentle (5°–11°), undulating (11°–18°), steep (18°–30°), and very steep (>30°) [54].
The results (Table 6) show that the percentages of burned areas at different slope levels were different, and the overall burned area at different slope levels was: steep (45.91%) > undulating (26.4%) > very steep (12.54%) > gentle (12.28%) > flat (2.87%). The burned area on flat ground was clearly the smallest. In the case of a fire spreading on flat ground (with no wind), the flame is approximately vertical. Most of the flat ground is grassland, and the extent of burning is relatively small in relation to the total area. As the slope increases, a large number of shrubs and trees are prone to large fires. Forestry departments can thus set forest fire prevention priorities according to different slopes; a focus should be on monitoring data such as water content and the accumulation of combustible materials in areas of steep slopes.
The slope aspect can have an effect on fire severity through heat dissipation, wind direction, and vegetation. Experiments were conducted to classify aspect into nine categories based on aspect values: no aspect (−1), north (0–22.5, 337.5–360), northeast (22.5–67.5), east (67.5–112.5), southeast (112.5–157.5), south (157.5–202.5), southwest (202.5–247.5), west (247.5–292.5), and northwest (292.5–337.5). Figure 11 shows the slope aspect of each fire area, with the gradient buffer in the legend running from red to blue, indicating the individual slope aspect rotating clockwise from the north.
After superimposing the forest fire severity map and the aspect map, we can see that the burned area of each aspect is northwest (16.31%) > west (15%) > southeast (13.57%) > east (13.55%) > north (11.99%) > southwest (10.18%) > northeast (9.77%) > south (9.64%) (Table 7). With more burned areas in the northwest, west, southeast and east, the forestry department can focus on targeting high-forest-fire areas on the east and west aspects to reduce losses.

4. Discussion

In this study, the burned area of forest fires in Chongqing was mapped using multi-source remote sensing data. The main goal of this study was to analyze the severity of the forest fire in Chongqing using the burn index. Compared with previous studies on forest fires, the innovation of this paper is that the forest fire area in Chongqing in 2022 was extracted using high-resolution remote sensing image data, such as GF-6, Sentinel-2 and UAV data. Moreover, this forest fire occurred in the time frame of high-temperature anomalies, and the catalytic effect of drought climate factors on forest fires was qualitatively analyzed by combining FLDAS and meteorological station data. At the same time, the influence of some human factors on this fire was recorded in combination with field survey visits.

4.1. Meteorological Factors Affecting Forest Fires

Based on FLDAS data from 1992 to 2022, three meteorological factors (temperature, precipitation and soil moisture) were selected to analyze their influence on catalyzing the forest fires. Table 8 provides details of the drought classification used, with negative values indicating relatively dry conditions and positive values indicating relatively wet conditions [34].
From the beginning of summer in 2022, Chongqing experienced a particularly high-temperature anomaly. Based on the FLDAS data, the 30-year Z-score [57] of the temperature in Chongqing was calculated. We selected the standard scores of the temperature from April to September for presentation. The color bar represents the Z-score value of temperature, ranging from negative (blue) to positive (red) temperature anomalies. Positive values are greater than the average value, 0 is equal to the average value, and negative values are less than the average value. Based on Figure 12, it is evident that Chongqing undergoes high-temperature anomalies during the months of July and August. It was within this time frame that the forest fire occurred.
Figure 13 shows a diagram of the SSMI for Chongqing from March to October 2022. In March, the precipitation in Chongqing was normal. The rainy season started in April and the SPI indicated positive values ranging from −0.14 to 3.56. The precipitation in the area started to decrease in May. During July and August, the SPI values were relatively low in most of the study area, thus indicating a drought event in the region. In September and October, the severity of drought in Chongqing eased.
Figure 14 shows the results of the SSMI, indicating a progressively negative SSMI value for Chongqing starting from June 2022. The study area experienced a gradual decline in soil moisture, leading to varying degrees of drought conditions. This situation was further exacerbated by the low rainfall from June to August, as indicated by the SPI results. In August, the severity and scope of drought in the region reached their peak with the drought-affected area almost covering the entire region. In September and October, the intensity and coverage of the drought decreased significantly, and the conditions were near normal in some areas.
Taking CaoShang, HuTouCun, GanYanSuo, LanBaJing, and ShanWangPing meteorological stations as examples, Figure 15 illustrates the correlation between temperature, soil moisture and precipitation from January to October 2022. These stations showed similar trends corresponding to FLDAS drought outcome indicators. July and August observed meagre precipitation levels with rising temperatures, causing soil moisture to plunge to under 40%. The combination of these three meteorological factors resulted in a severe drought, significantly conducive to the Chongqing forest fires.

4.2. Human Factors Influencing Forest Fires

The occurrence of forest fires is closely related to human factors, in addition to climatic conditions. As a sudden natural disaster, human factors are an important cause of forest fires in China in the context of a harsh climate. For example, forest fires may be caused by burning paper at graves during the Qingming season, smoking around forest vegetation in the wild, children playing with fire in flammable areas, and cooking with open fires in the wild. In the farming and harvesting season, the burning of crop residues can initiate forest fires. Forest fires can also be caused by irresponsible human behavior, such as lighting fireworks and firecrackers during holidays, celebrations, weddings, and funerals [56]. Some human factors contributed to the Chongqing forest fires. For example, high winds in Beibei District resulted in a broken power line initiating a forest fire; the burning of wild beehives in Fuling Daliang Mountain caused another forest fire; and the burning of fire ashes in Kaizhou District led to a further forest fire.

4.3. Limitations and Uncertainties

We overlaid the burned area obtained by the three methods on the burned area of the UAV. An accuracy assessment for the burned area extracted by the three methods was performed by the confusion matrix tool in ENVI (V5.3) based on the UAV image. In Figure 16, the burned areas extracted from different data sources are classified into three categories: background, unburned, burned. The different results were matched pixel by pixel (0.2 m × 0.2 m). Taking Figure 16a as an example, the horizontal axis is the burned area obtained by calculating the dNBR according to Sentinel-2, and the vertical axis is the burned area of the UAV. A total of 5,121,313 pixels were accurately classified into the unburned class, 1,079,159 pixels were incorrectly classified into burned class, and 71,528 pixels were incorrectly classified into background class.
A series of descriptive and analytical statistics (overall accuracy, producer accuracy, user accuracy and kappa statistics) derived from the confusion matrix were utilized to evaluate the accuracy of the classification results [58,59,60]. The overall accuracy of the UAV and Sentinel-2 burned area was 85.25% with a kappa coefficient of 0.77. The overall accuracy of the UAV and GF-6 burned area was 77.31% with a kappa coefficient of 0.64, and the overall accuracy of the UAV and visual interpretation burned area was 72.92% with a kappa coefficient of 0.57. Overall, the accuracy of the burned area extracted by the three methods was better. With the true value of the burned area extracted by the UAV, there was uncertainty, which can lead to errors in the accuracy evaluation.
Therefore, our study still has some deficiencies and limitations. First, Chongqing is located in the southwest region, which is affected by cloudy and rainy weather, and there are many uncertainties in the optical data. Therefore, there is uncertainty in the accuracy of the burned area with different data source choices. Next, it is difficult to obtain the real burned area data, and there is uncertainty in the burned area obtained with high-resolution UAV data, which is worth further improvement in the future. Further studies should use thermal infrared and microwave remote sensing data for multi-source data fusion to map the burned area with higher accuracy.

5. Conclusions

In this study, the burned area of forest fires in Chongqing in 2022 was mapped using multi-source remote sensing data. The burned area of these forest fires was extracted using three methods: visual interpretation, dNDVI, and dNBR. Additionally, the severity of forest fires was analyzed by setting thresholds and extracting the area of different classes of fires using the dNBR. Finally, the relationship between forest fire severity and topographic factors was analyzed. The following are the main findings of the study:
(1)
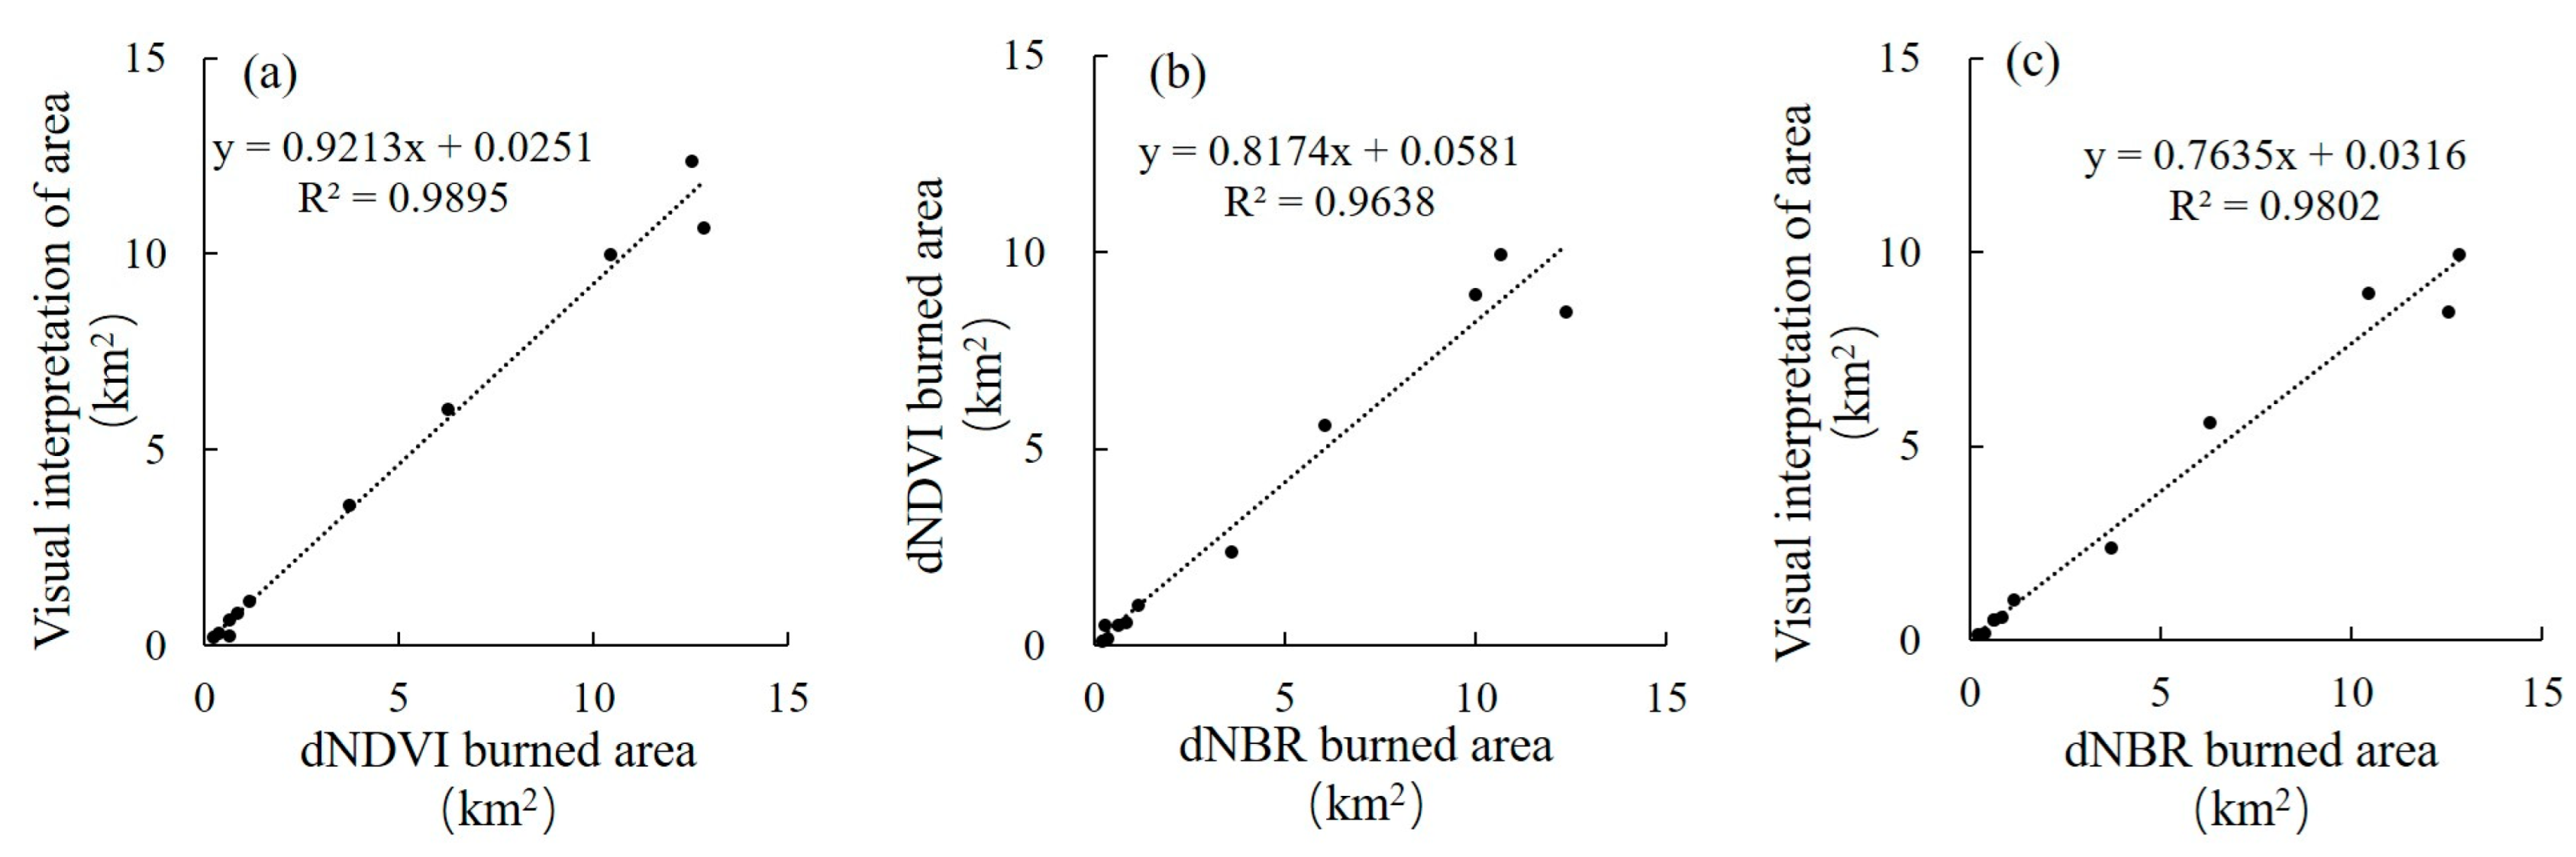
There were good correlations between the burned areas extracted using the three different methods, with coefficients of determination R2 > 0.96 in all cases.
(2)
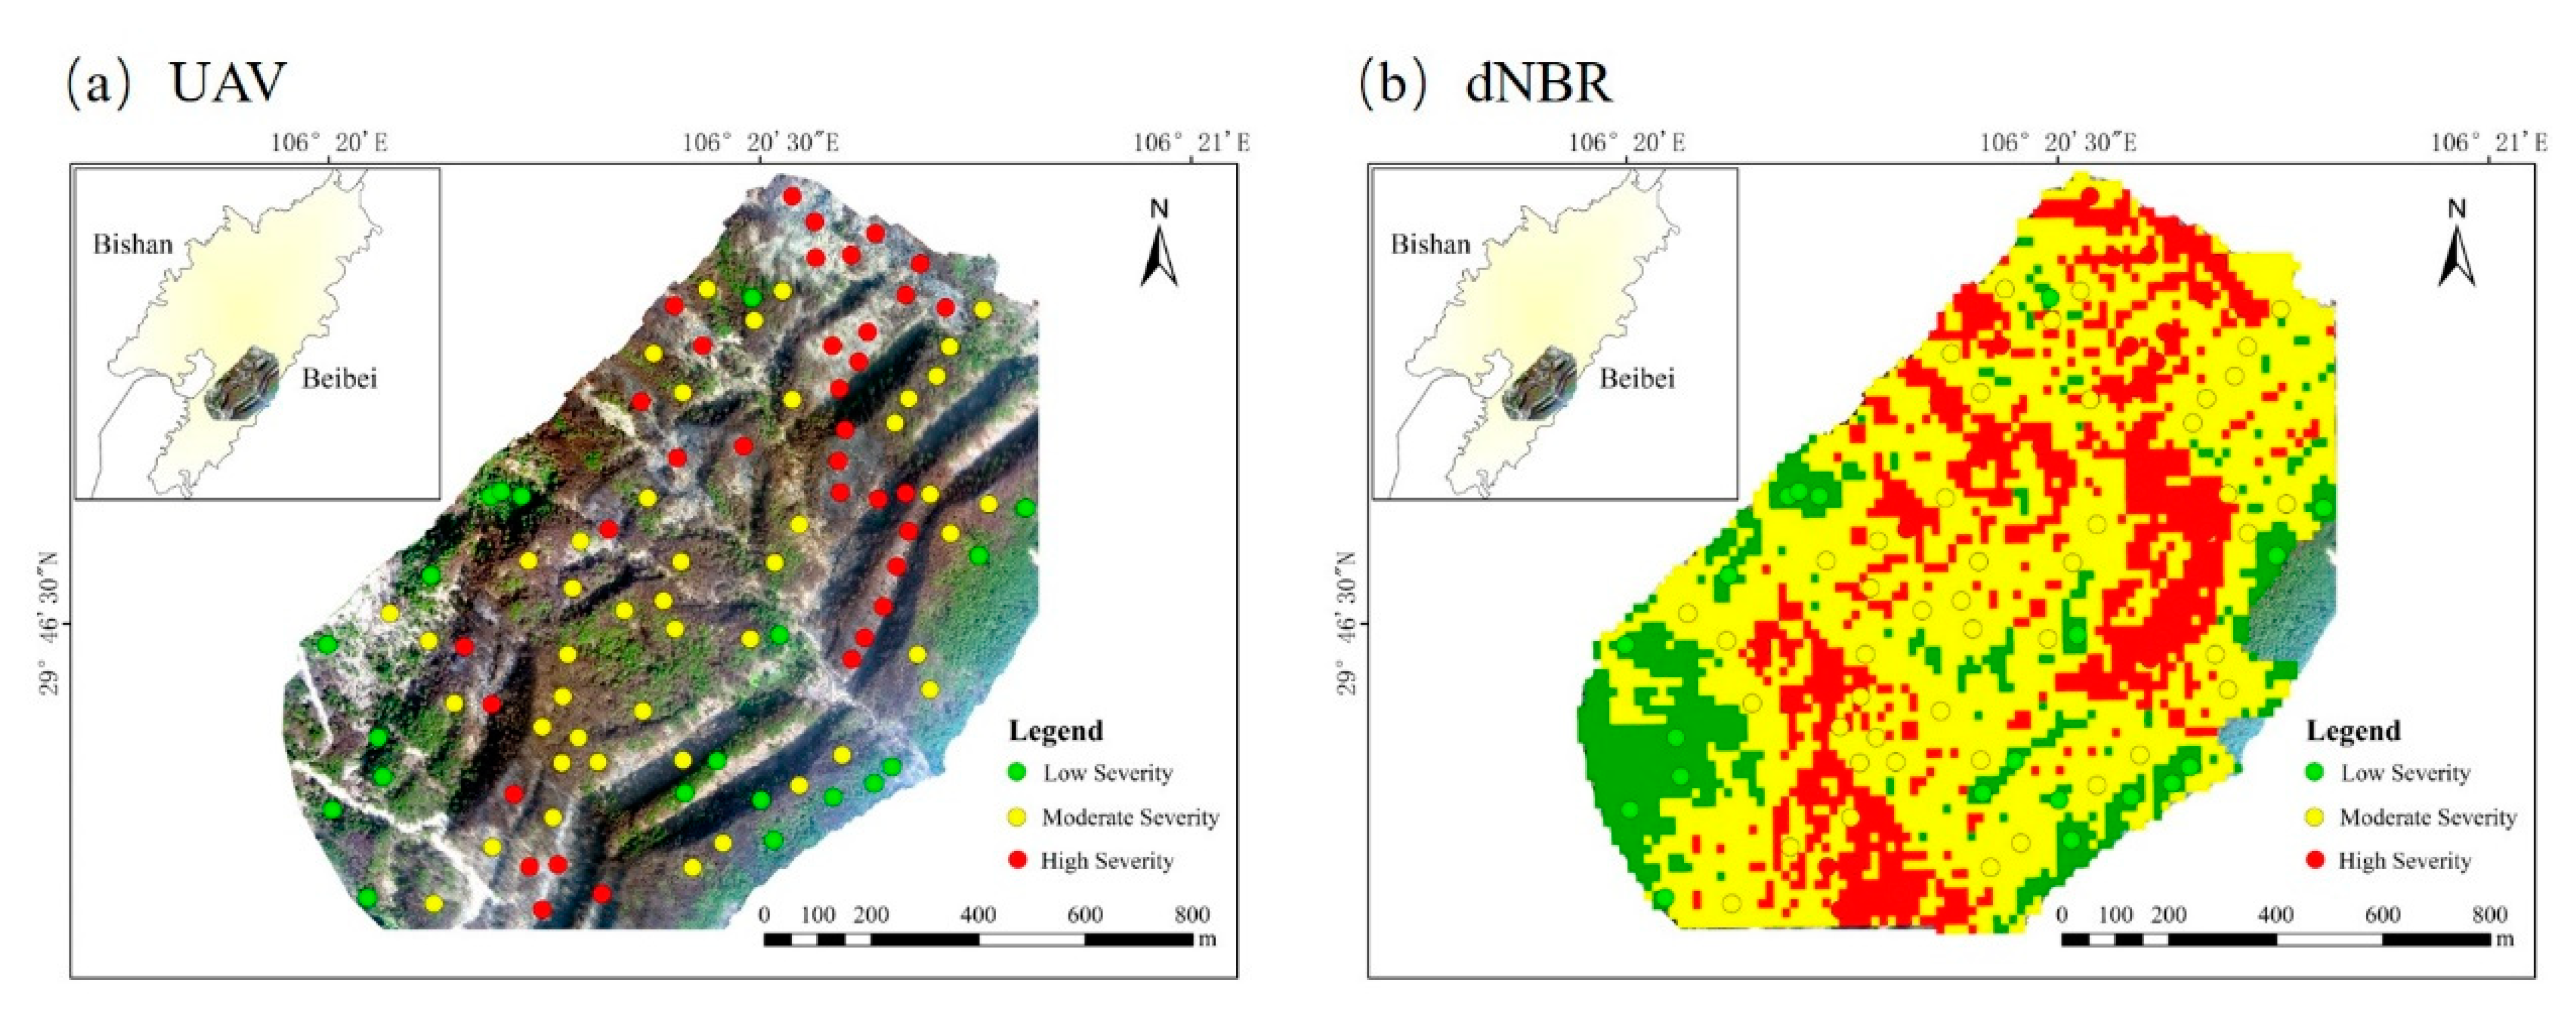
The kappa coefficient of the UAV sampling point threshold and dNBR classification results was 0.8889. On the basis of this threshold, the results of forest fire severity classification were moderate severity (58.05%) > low severity (29.96%) > high severity (11.99%).
(3)
The burned area in high-elevation areas was somewhat greater than that in low-elevation areas, accounting for 53.34% of the total burned area. With an increase in slope, each percentage showed an overall increasing trend. However, the burned area of steep slopes had the largest burned area (45.91%); flat land had the smallest burned area (2.87%). The northwest and west had more burned area accounting for 16.31% and 15%, respectively.

Author Contributions

Y.Z. and M.M. were responsible for the main research ideas and for writing the manuscript; Y.L. implemented the field experiments; Y.H., X.S. and G.D. contributed to the manuscript organization and analysis of results. All authors thoroughly reviewed and edited this paper. All authors have read and agreed to the published version of the manuscript.

Funding

This work was jointly supported by the National Science and Technology Major Project of China’s High Resolution Earth Observation System (project number: 21-Y20B01-9001-19/22) and National Natural Science Foundation of China (grant number: U2244216).

Data Availability Statement

The data presented in this study are available on request from the corresponding author.

Acknowledgments

We thank experimentalists Yuanqing Li and Debing Kong of Southwest University for providing the CPEC310 self-calibrating closed-circuit vorticity correlation system and automatic weather station observation data. Qian Feng provided the sample plot observation data. We also appreciate the fruitful suggestions from the anonymous reviewers which made the work better.

Conflicts of Interest

The authors declare no conflict of interest.

References

  1. Fu, X. The Impact of Forest Fire on Forest Ecosystem. Mod. Agric. Res. 2021, 27, 101–103. [Google Scholar]
  2. Wang, L.; Qu, J.J.; Hao, X. Forest fire detection using the normalized multi-band drought index (NMDI) with satellite measurements. Agric. For. Meteorol. 2008, 148, 1767–1776. [Google Scholar] [CrossRef]
  3. Chuvieco, E.; Congalton, R.G. Application of Remote Sensing and Geographic Information Systems to Forest Fire Hazard Mapping. Remote Sens. Environ. 1989, 2, 147–159. [Google Scholar] [CrossRef]
  4. Crosby, E.U. Fire prevention. In The Annals of the American Academy of Political and Social Science; SAGE: Thousand Oaks, CA, USA, 1905; Volume 26, pp. 224–238. [Google Scholar]
  5. Pereira, J.M. Remote sensing of burned areas in tropical savannas. Int. J. Wildland Fire 2003, 12, 259–270. [Google Scholar] [CrossRef]
  6. Jazebi, S.; de Leon, F.; Nelson, A. Review of Wildfire Management Techniques—Part I: Causes, Prevention, Detection, Suppression, and Data Analytics. IEEE Trans. Power Deliv. 2020, 35, 430–439. [Google Scholar] [CrossRef]
  7. Robinson, J.M. Fire from space: Global fire evaluation using infrared remote sensing. Int. J. Remote Sens. 1991, 12, 3–24. [Google Scholar] [CrossRef]
  8. Dozier, J. A method for satellite identification of surface temperature fields of subpixel resolution. Remote Sens. Environ. 1981, 11, 221–229. [Google Scholar] [CrossRef]
  9. Li, Q.; Cui, J.; Jiang, W.; Jiao, Q.; Gong, L.; Zhang, J.; Shen, X. Monitoring of the Fire in Muli County on March 28, 2020, based on high temporal-spatial resolution remote sensing techniques. Nat. Hazards Res. 2021, 1, 20–31. [Google Scholar] [CrossRef]
  10. Huang, X. Research on Fire Point Monitoring with High Time and High Spatial Resolution Based on Multi-Source Remote Sensing Data. Master’s Thesis, University of Electronic Science and Technology of China, Chengdu, China, 2020. [Google Scholar]
  11. Holden, Z.A.; Smith, A.; Morgan, P.; Rollins, M.G.; Gessler, P.E. Evaluation of novel thermally enhanced spectral indices for mapping fire perimeters and comparisons with fire atlas data. Int. J. Remote Sens. 2005, 26, 4801–4808. [Google Scholar] [CrossRef]
  12. Wu, L.; Shen, R.; Li, X.; Yang, H. Evaluating Different Remote Sensing Indexes for Forest Burn Scars Extraction. Remote Sens. Technol. Appl. 2014, 29, 567–574. [Google Scholar]
  13. Tucker, C.J. Red and photographic infrared linear combinations for monitoring vegetation. Remote Sens Environ. 1979, 8, 127–150. [Google Scholar] [CrossRef]
  14. García, M.L.; Caselles, V. Mapping burns and natural reforestation using Thematic Mapper data. Geocarto Int. 1991, 6, 31–37. [Google Scholar] [CrossRef]
  15. Chuvieco, E.; Martín, M.P. Cartografía de grandes incendios forestales en la Península Ibérica a partir de imágenes NOAA-AVHRR. Volumen 1998, 7, 109–128. [Google Scholar]
  16. Tariq, A.; Shu, H.; Siddiqui, S.; Mousa, B.G.; Munir, I.; Nasri, A.; Waqas, H.; Lu, L.; Baqa, M.F. Forest fire monitoring using spatial-statistical and Geo-spatial analysis of factors determining forest fire in Margalla Hills, Islamabad, Pakistan. Geomat. Nat. Hazards Risk 2021, 12, 1212–1233. [Google Scholar] [CrossRef]
  17. Aponte, C.; de Groot, W.J.; Wotton, B.M. Forest fires and climate change: Causes, consequences and management options. Int. J. Wildland Fire. 2016, 25, i–ii. [Google Scholar] [CrossRef]
  18. Liu, Y. Based GEE Study on Forest Fire Identification and Post-Fire Vegetation Restoration Assessment. Master’s Thesis, Beijing Forestry University, Beijing, China, 2020. [Google Scholar]
  19. Jain, S.K.; Keshri, R.; Goswami, A.; Sarkar, A. Application of meteorological and vegetation indices for evaluation of drought impact: A case study for Rajasthan, India. Nat. Hazards. 2010, 54, 643–656. [Google Scholar] [CrossRef]
  20. Sanders, J. Observations of fire behaviour in eucalypt woodland near the Hunter Valley, NSW, and recommendations for control strategies in extreme conditions. In Proceedings of the Bushfire’99 Australian Bushfire Conference, Albury, Australia, 7–9 July 1999. [Google Scholar]
  21. Tian, Y.; Wu, Z.; Li, M.; Wang, B.; Zhang, X. Forest Fire Spread Monitoring and Vegetation Dynamics Detection Based on Multi-Source Remote Sensing Images. Remote Sens. 2022, 14, 4431. [Google Scholar] [CrossRef]
  22. Westerling, A.L.; Hidalgo, H.G.; Cayan, D.R.; Swetnam, T.W. Warming and earlier spring increase western US forest wildfire activity. Science 2006, 313, 940–943. [Google Scholar] [CrossRef]
  23. Flannigan, M.D.; Harrington, J.B. A study of the relationship of meteorological variables to monthly provincial area burned by wildfire in Canada (1953-80). J. App. Met. 1988, 27, 441–452. [Google Scholar] [CrossRef]
  24. Bradstock, R.A.; Cohn, J.S.; Gill, A.M.; Bedward, M.; Lucas, C. Prediction of the probability of large fires in the Sydney region of south-eastern Australia using fire weather. Int. J. Wildland Fire 2009, 18, 932–943. [Google Scholar] [CrossRef]
  25. Xu, M.; Ma, W. Relationship between Arid Climatic Factors and Forest Fires. J. Glaciol. Geocryol. 2012, 34, 603–608. [Google Scholar]
  26. Wilhite, D.A. Drought as a Natural Hazard: Concepts and Definitions. Drought A Glob. Assess. 2000, I, 3–18. [Google Scholar]
  27. Huang, S.; Li, P.; Huang, Q.; Leng, G.; Hou, B.; Ma, L. The propagation from meteorological to hydrological drought and its potential influence factors. J. Hydrol. 2017, 547, 184–195. [Google Scholar] [CrossRef]
  28. Ma, Z.; Ren, X. Drying Trend over China from 1951 to 2006. Adv. Clim. Chang. Res. 2007, 3, 195. [Google Scholar]
  29. Trenberth, K.E.; Dai, A.; Van Der Schrier, G.; Jones, P.D.; Barichivich, J.; Briffa, K.R.; Sheffield, J. Global warming and changes in drought. Nat. Clim. Chang. 2014, 4, 17–22. [Google Scholar] [CrossRef]
  30. Heim Jr, R.R. A review of twentieth-century drought indices used in the United States. Bull. Am. Meteorol. Soc. 2002, 83, 1149–1166. [Google Scholar] [CrossRef]
  31. Xu, L.; Chen, N.; Yang, C.; Zhang, C.; Yu, H. A parametric multivariate drought index for drought monitoring and assessment under climate change. Agric. For. Meteorol. 2021, 310, 108657. [Google Scholar] [CrossRef]
  32. Mehran, A.; Mazdiyasni, O.; AghaKouchak, A. A hybrid framework for assessing socioeconomic drought: Linking climate variability, local resilience, and demand. J. Geophys. Res. Atmos. 2015, 120, 7520–7533. [Google Scholar] [CrossRef]
  33. Xu, L.; Chen, N.; Zhang, X.; Chen, Z. Spatiotemporal changes in China’s terrestrial water storage from GRACE satellites and its possible drivers. J. Geophys. Res. Atmos. 2019, 124, 11976–11993. [Google Scholar] [CrossRef]
  34. McKee, T.B.; Doesken, N.J.; Kleist, J. The relationship of drought frequency and duration to time scales. In Proceedings of the 8th Conference on Applied Climatology, Anaheim, CA, USA, 17–22 January 1993; American Meteorological Society: Boston, MA, USA, 1993; Volume 17, pp. 179–183. [Google Scholar]
  35. Mpelasoka, F.; Hennessy, K.; Jones, R.; Bates, B. Comparison of suitable drought indices for climate change impacts assessment over Australia towards resource management. Int. J. Climatol. A J. R. Meteorol. Soc. 2008, 28, 1283–1292. [Google Scholar] [CrossRef]
  36. AghaKouchak, A. A baseline probabilistic drought forecasting framework using standardized soil moisture index: Application to the 2012 United States drought. Hydrol. Earth Syst. Sci. 2014, 18, 2485–2492. [Google Scholar] [CrossRef]
  37. Shukla, S.; Wood, A.W. Use of a standardized runoff index for characterizing hydrologic drought. Geophys. Res. Lett. 2008, 35, L2401–L2405. [Google Scholar] [CrossRef]
  38. Hao, C.; Zhang, J.; Yao, F. Combination of multi-sensor remote sensing data for drought monitoring over Southwest China. Int. J. Appl. Earth Obs. Geoinf. 2015, 35, 270–283. [Google Scholar] [CrossRef]
  39. Haro-Monteagudo, D.; Daccache, A.; Knox, J. Exploring the utility of drought indicators to assess climate risks to agricultural productivity in a humid climate. Hydrol. Res. 2018, 49, 539–551. [Google Scholar] [CrossRef]
  40. Afshar, M.H.; Bulut, B.; Duzenli, E.; Amjad, M.; Yilmaz, M.T. Global spatiotemporal consistency between meteorological and soil moisture drought indices. Agric. Forest Meteorol. 2022, 316, 108848. [Google Scholar] [CrossRef]
  41. Sohrabi, M.M.; Ryu, J.H.; Abatzoglou, J.; Tracy, J. Development of soil moisture drought index to characterize droughts. J. Hydrol. Eng. 2015, 20, 4015025. [Google Scholar] [CrossRef]
  42. Anderson, W.B.; Zaitchik, B.F.; Hain, C.R.; Anderson, M.C.; Yilmaz, M.T.; Mecikalski, J.; Schultz, L. Towards an integrated soil moisture drought monitor for East Africa. Hydrol. Earth Syst. Sci. 2012, 16, 2893–2913. [Google Scholar] [CrossRef]
  43. Rousi, E.; Kornhuber, K.; Beobide-Arsuaga, G.; Luo, F.; Coumou, D. Accelerated western European heatwave trends linked to more-persistent double jets over Eurasia. Nat. Commun. 2022, 13, 3851. [Google Scholar] [CrossRef]
  44. Iyakaremye, V.; Zeng, G.; Ullah, I.; Gahigi, A.; Mumo, R.; Ayugi, B. Recent Observed Changes in Extreme High-Temperature Events and Associated Meteorological Conditions over Africa. Int. J. Climatol. 2022, 42, 4522–4537. [Google Scholar] [CrossRef]
  45. Wang, Y.; Hessen, D.O.; Samset, B.H.; Stordal, F. Evaluating global and regional land warming trends in the past decades with both MODIS and ERA5-Land land surface temperature data. Remote Sens. Environ. 2022, 280, 113181. [Google Scholar] [CrossRef]
  46. Jiang, Y.; Yuan, D.; Xie, S.; Li, L.; Zhang, G.; He, R. Groundwater quality and land use change in a typical karst agricultural region. J. Geogr. Sci. 2006, 16, 405–414. [Google Scholar] [CrossRef]
  47. Otsu, N. A threshold selection method from gray-level histograms. IEEE Trans. Syst. Man Cybern. 1979, 9, 62–66. [Google Scholar] [CrossRef]
  48. Roodsarabi, Z.; Sam-Khaniani, A.; Kiani, A. Investigation of post fire vegetation regrowth under different burn severities based on satellite observations. Int. J. Environ. Sci. Technol. 2022, 20, 321–340. [Google Scholar] [CrossRef]
  49. Chafer, C.J.; Noonan, M.; Macnaught, E. The post-fire measurement of fire severity and intensity in the Christmas 2001 Sydney wildfires. Int. J. Wildland Fire 2004, 13, 227. [Google Scholar] [CrossRef]
  50. White, J.D.; Ryan, K.C.; Key, C.C.; Running, S.W. Remote sensing of forest fire severity and vegetation recovery. Int. J. Wildland Fire 1996, 6, 125–136. [Google Scholar] [CrossRef]
  51. Mazuelas Benito, P.; Fernández Torralbo, A. Landsat and MODIS Images for Burned Areas Mapping in Galicia, Spain. Master’s Thesis, School of Architecture and the Built Environment Royal Institute of Technology, Stockholm, Sweden, 2012. [Google Scholar]
  52. Viedma, O.; Quesada, J.; Torres, I.; De Santis, A.; Moreno, J.M. Fire Severity in a Large Fire in a Pinus pinaster Forest is Highly Predictable from Burning Conditions, Stand Structure, and Topography. Ecosystems 2015, 18, 237–250. [Google Scholar] [CrossRef]
  53. Birch, D.S.; Morgan, P.; Kolden, C.A.; Abatzoglou, J.T.; Dillon, G.K.; Hudak, A.T.; Smith, A.M.S. Vegetation, topography and daily weather influenced burn severity in central Idaho and western Montana forests. Ecosphere 2015, 6, 1–23. [Google Scholar] [CrossRef]
  54. Rose, R.L.; Chafer, C.J. GIS and decision-tree modelling as a framework for the preparation of fire management plans in conservation reserves. In Proceedings of the ‘97Australian Bushfire Conference, Darwin, Australia, 8–10 July 1997. [Google Scholar]
  55. Asadi Zarch, M.A.; Sivakumar, B.; Sharma, A. Droughts in a warming climate: A global assessment of Standardized precipitation index (SPI) and Reconnaissance drought index (RDI). J. Hydrol. 2015, 526, 183–195. [Google Scholar] [CrossRef]
  56. Svoboda, M.; Hayes, M.; Wood, D. Standardized Precipitation Index: User Guide; World Meteorological Organization: Geneva, Switzerland, 2012. [Google Scholar]
  57. Cheadle, C.; Vawter, M.P.; Freed, W.J.; Becker, K.G. Analysis of microarray data using Z score transformation. J. Mol. Diagn. 2003, 5, 73. [Google Scholar] [CrossRef] [PubMed]
  58. Foody, G.M. Status of land cover classification accuracy assessment. Remote Sens. Environ. 2002, 80, 185–201. [Google Scholar] [CrossRef]
  59. Liu, C.; Frazier, P.; Kumar, L. Comparative assessment of the measures of thematic classification accuracy. Remote Sens. Environ. 2007, 107, 606–616. [Google Scholar] [CrossRef]
  60. Wickham, J.; Stehman, S.V.; Gass, L.; Dewitz, J.A.; Sorenson, D.G.; Granneman, B.J.; Poss, R.V.; Baer, L.A. Thematic accuracy assessment of the 2011 National Land Cover Database (NLCD). Remote Sens. Environ. 2017, 191, 328–341. [Google Scholar] [CrossRef] [PubMed]
Figure 1. Location of the study area, different fire areas and meteorological stations. Elevation data were derived from the advanced spaceborne thermal emission and reflection radiometer global digital elevation model (ASTER GDEM) data at 30 m spatial resolution. The small images surrounding the map of the study area show real-time captured images of the various fire areas.
Remotesensing 15 02323 g001
Figure 2. Examples of visual classification of the fire severity levels.
Remotesensing 15 02323 g002
Figure 3. Fire severity rating map in the field combined with sample points collected by UAV images.
Remotesensing 15 02323 g003
Figure 4. Burned area based on dNDVI.
Remotesensing 15 02323 g004
Figure 5. Burned area based on dNBR.
Remotesensing 15 02323 g005
Figure 6. Scatter plots of fire area extraction using visual interpretation, dNDVI, and dNBR. (a) is visual interpretation and dNDVI, (b) is dNDVI and dNBR, (c) is visual interpretation and dNBR.
Remotesensing 15 02323 g006
Figure 7. Confusion matrix of field UAV and dNBR classification results.
Remotesensing 15 02323 g007
Figure 8. Analysis of fire severity in each forest fire area in Chongqing.
Remotesensing 15 02323 g008
Figure 9. Elevation of each forest fire area in Chongqing.
Remotesensing 15 02323 g009
Figure 10. Slope of each forest fire area in Chongqing.
Remotesensing 15 02323 g010
Figure 11. Aspect of each forest fire area in Chongqing.
Remotesensing 15 02323 g011
Figure 12. Spatiotemporal evolution of drought in Chongqing based on the standard scores of temperatures.
Remotesensing 15 02323 g012
Figure 13. Spatiotemporal evolution of drought in Chongqing based on the SPI.
Remotesensing 15 02323 g013
Figure 14. Spatiotemporal evolution of drought in Chongqing in 2022 based on the SSMI.
Remotesensing 15 02323 g014
Figure 15. Changes in temperature, soil moisture, and rainfall at various meteorological stations in Chongqing in 2022.
Remotesensing 15 02323 g015
Figure 16. Confusion matrix of burned area extracted from different data sources and UAV results based on pixel element scale.
Remotesensing 15 02323 g016
Table 1. Information from multi-source data covering the study area.
Data TypeTemporal
Resolution
/day
Spatial
Resolution
/m
Spatial
Coverage
Data AvailableAcquisition Date RangeSource
Sentinel-2510/20global2015–now4 August 2022–5 September 2022https://scihub.copernicus.eu/, accessed on 9 September 2022
Landsat81630global2013–now6 September 2022https://earthexplorer.usgs.gov/, accessed on 8 September 2022
HJ2A2–516China2020–now6 September 2022https://data.cresda.cn/#/mapSearch, accessed on 10 September 2022
GF-62–416global2018–now8 August 2022/5 September 2022
UAV images/0.28//21 October 2022Data collected in this study
Table 2. Fire severity thresholds.
dNBRDescription
<0.15Low severity
0.15–0.4Moderate severity
>0.4High severity
Table 3. Comparison of visual interpretation, dNDVI, and dNBR methods for extracting the burned area.
Location NameVisual Interpretation (km2)dNDVI (km2)dNBR (km2)
Shentong Town, Nanchuan1.151.141.03
Sanquan Town, Nanchuan0.640.640.50
Jiangjin6.276.035.61
Banan12.5412.378.47
Tongliang10.449.998.93
Fuling0.840.820.59
Bishan0.640.260.51
Beibei12.8310.659.94
Changshou3.713.582.37
Fengjie0.370.330.17
Kaizhou0.210.200.13
Table 4. Area and proportion of different fire severities.
Location NameLow Severity (km2)Moderate Severity (km2)High Severity (km2)
Shentong Town, Nanchuan0.130.770.19
Sanquan Town, Nanchuan0.160.380.08
Jiangjin 1.263.830.94
Banan 4.755.721.61
Tongliang1.946.911.17
Fuling 0.300.420.07
Bishan 0.180.360.08
Beibei 3.607.511.30
Changshou 1.641.670.28
Fengjie 0.260.060
Kaizhou 0.080.090.01
Total14.3127.735.73
Percentage29.96%58.05%11.99%
Table 5. Burned area for various fire intensities at different elevations.
Elevation (m)Low Severity (km2)Moderate Severity (km2)High Severity (km2)Total (km2)Percentage
276–5007.1013.192.5722.8646.66%
500–9997.4015.762.9826.1353.34%
Table 6. Burned area for various forest fire severities at different slopes.
Slope (°)Low Severity (km2) Moderate Severity (km2) High Severity (km2)Total (km2)Percentage
Flat0.420.800.181.402.87%
Gentle1.833.450.736.0112.28%
Undulating3.877.511.5312.9126.4%
Steep6.6113.382.4722.4545.91%
Very steep1.763.750.626.1412.54%
Table 7. Burned area for various forest fire severities at different aspects.
Aspect Low Severity (km2) Moderate Severity (km2) High Severity (km2)Total (km2)Percentage
North1.893.480.505.8711.99%
Northeast1.612.720.454.789.77%
East2.263.700.676.6313.55%
Southeast1.893.850.906.6413.57%
South1.312.710.704.729.64%
Southwest1.143.060.784.9810.18%
West1.944.610.797.3415%
Northwest2.464.760.767.9816.31%
Table 8. Drought classification [55,56].
Drought IndexDescription
≥2.0Extremely wet
1.5 to 1.99Very wet
1.0 to 1.49Moderately wet
−0.99 to 0.99Near normal
−1 to −1.49Moderately dry
−1.5 to −1.99Severely dry
≤−2.0Extremely dry
Disclaimer/Publisher’s Note: The statements, opinions and data contained in all publications are solely those of the individual author(s) and contributor(s) and not of MDPI and/or the editor(s). MDPI and/or the editor(s) disclaim responsibility for any injury to people or property resulting from any ideas, methods, instructions or products referred to in the content.

