Article

Three-Dimensional Modeling and Non-Invasive Diagnosis of a Huge and Complex Heritage Building: The Patriarchal Basilica of Santa Maria Assunta in Aquileia (Udine, Italy)

1
Institute of Heritage Sciences (ISPC), National Council of Researches, Via Salaria Km. 29,300, Monterotondo St., 00015 Rome, Italy
2
Department of Agricultural, Environmental and Food Sciences, University of Molise, Via De Sanctis snc, 86100 Campobasso, Italy
*
Author to whom correspondence should be addressed.
Remote Sens. 2023, 15(9), 2386; https://doi.org/10.3390/rs15092386
Submission received: 22 February 2023 / Revised: 26 April 2023 / Accepted: 28 April 2023 / Published: 2 May 2023

Abstract

:
Three-dimensional modeling and non-invasive diagnosis are fundamental prerequisites for planning reliable assessments of the seismic vulnerability, renovation and conservation of heritage buildings. In the case of multi-layered, huge and complex ancient constructions, various problems can be encountered in the early design phases of interventions, among which there is often a lack of an adequate building documentation. Such issues include drawings that are without a metric scale, not detailed, not updated or not reflecting the real situation. In addition, the fragility of these constructions requires an accurate census of every sign of deterioration in order to prepare an ad hoc intervention for the site. As an example, in this paper, the results of a survey regarding the Patriarchal Basilica of Santa Maria Assunta (Aquileia, Italy) are reported. The basilica has a rich history of about two thousand years. in which each era has marked the actual architectural layout with its own culture and art. The result is an intricate association of complementary and/or interdependent elements that make the building very complex. Given the need to obtain accurate documentation, a realistic representation and a simulation of the criticalities of the structure, which previously did not exist or were not sufficiently accurate, a multi-methodological and multi-scale diagnosis was performed. In detail, the ground-penetrating radar (GPR) technique was applied to verify the presence of structures still buried under some internal surfaces, and a topographic survey, terrestrial laser scanning (TLS), and structure for motion (SfM) aerial and terrestrial photogrammetry were integrated for the detailed survey of the entire internal and external macro-structure. The resulting outcome provided the comprehensive information needed for preparing projects for the preservation, management and restoration of the basilica and the buildings connected to it.

1. Introduction

Three-dimensional modeling and non-invasive diagnosis are the starting point for a highly accurate, detailed and reliable assessment of the status quo of a heritage building. Therefore, the work planning must be carefully prepared by evaluating the purpose of the survey, the degree of detail to be achieved, the correct tools to use for gathering the site data, the timing of data acquisition and processing, the multiple data integration strategy of different formats and the type of post-production output to be processed. In addition, documenting huge and complex buildings, with numerous architectonical details, and narrow or not very accessible interiors, is a challenge considering the correct planning of the survey, the processing of a large amount of dissimilar data and the delivery of cost-effective solutions that are easy to use and interpret. It follows that collaborative work among heterogeneous teams with different types of expertise is required. In recent years, the use of non-invasive geomatic and geophysical techniques has assumed an increasingly important role in the field of cultural heritage [1,2,3,4,5].
Three-dimensional modeling is obtained through laser scanning technology (TLS) and close-range photogrammetry using terrestrial or aerial photography with unmanned devices as drones. These tools allow for the acquisition of point clouds for the geometric characterization of the artefact and the identification of any critical issues. There are some differences in the two technologies:
-
The principles of data acquisition are based alternatively on polar sensing (TLS) or on the forward intersection in space (photogrammetry), which lead to a similar result, point clouds, but with different characteristics.
-
Acquisition time is generally fast with photographic cameras but data processing in longer.
-
The resolution is higher in photographic acquisition using very accurate sensors, which also help to solve shadow and occlusion problems during laser scanning acquisitions.
-
Active laser is independent from external lighting.
-
Costs are higher for sophisticated laser instruments than for photogrammetric instruments.
For these reasons, an integrated use of the two methods is recommended during the analysis of complex cultural heritage considering the specific necessities of each diagnostic study. Regarding built cultural heritage, many authors report applications of indirect surveys to identify phenomena of degradation occurring over time such as cracking of walls and columns, presence of humidity, and irregularity of the structure in plan and height [6,7,8,9,10,11,12,13,14,15].
Geophysical methods are very useful for assessing the presence of underground structures, addressing conservation and stability issues of architectural monuments, allowing inspection of soil foundations and mechanical properties of structural elements [16,17,18,19], and exploring internal and superficial structures of precious and delicate targets such as statues, wall paintings and mosaics inside historical buildings [20,21,22]. Among the non-destructive techniques [23], ground-penetrating radar (GPR) is widely used thanks to the miniaturization of the instrumentation, the high investigation resolution and the minimal impact on the surfaces to be analyzed. In fact, many papers report successful applications of the method for different purposes [24,25,26,27,28,29,30,31,32,33].
Following the trend of research in building diagnosis, in this paper the results of a survey of the Patriarchal Basilica of Santa Maria Assunta (Aquileia, Italy) (Figure 1) are reported. The work was carried out within the framework of a collaboration agreement between the Superintendence of Archaeology, Arts and Landscape of Friuli Venezia Giulia and the University of Molise, with the aim of planning targeted restoration interventions and assessing the seismic hazard and the vulnerability of the structure (the activities were financed within the framework of the Ministerial Decree of 19 February 2018). The intervention was realized in compliance with the “Guidelines for the evaluation and reduction of the seismic risk of the cultural heritage” issued by the Italian Ministry of Culture (Ministerial Decree of 14 January 2008). They provide for a series of actions summarized in the following phases:
-
Cognitive investigation through which the current state of the building is defined with plano-altimetric and structural surveys and a damage and deformation state assessment of the structure.
-
Historical-critical analysis that guides the designers in the reconstruction of the current state of stress in the light of the changes and events that have affected the building over time.
-
Mechanical characterization of materials.
-
Definition of the levels of knowledge and the consequent factors of confidence of the structures.
-
Structural analysis using numerical models created based on the acquired data.
-
Critical evaluation of the results obtained.
The aim of the research was to reach a more in-depth level of knowledge of the surveyed subject in the framework of the first step of the previous workflow. To this end, standard methodological approaches were adopted as follows:
-
External topographic survey with total stations aimed at creating a topographic grid with a monograph of fiducial points.
-
Close-range photogrammetry using terrestrial or aerial photography of the external areas.
-
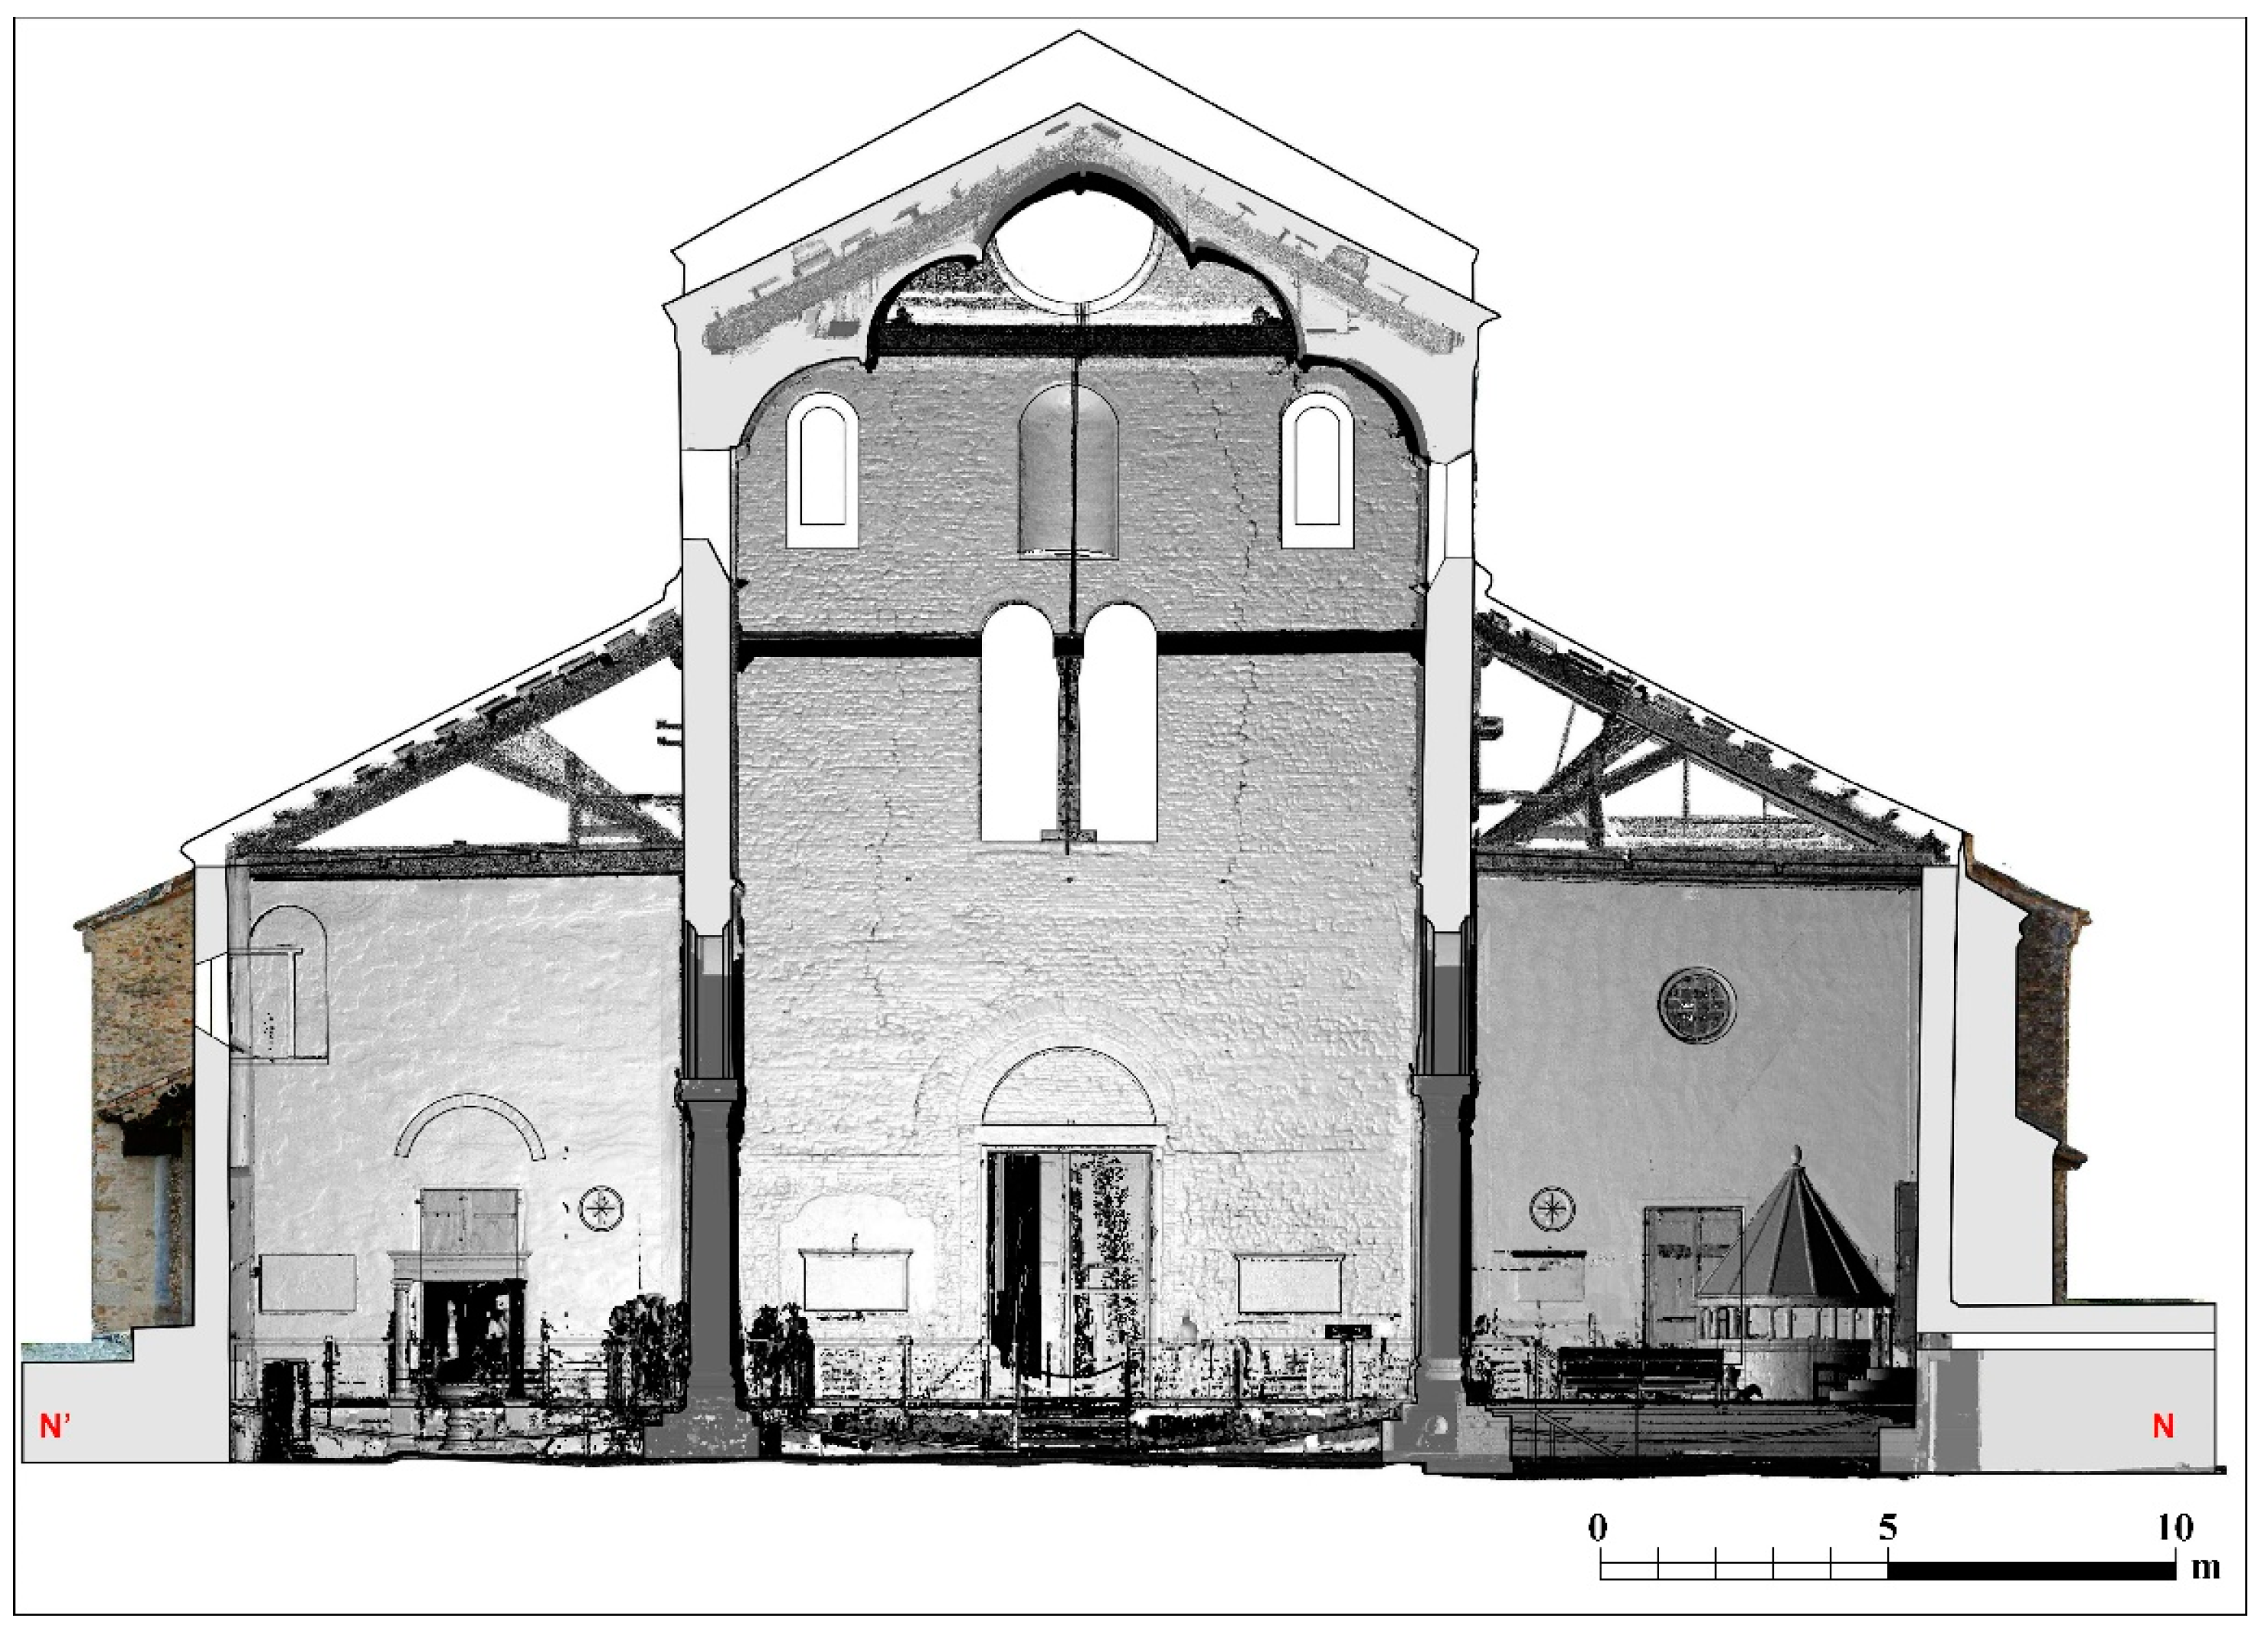
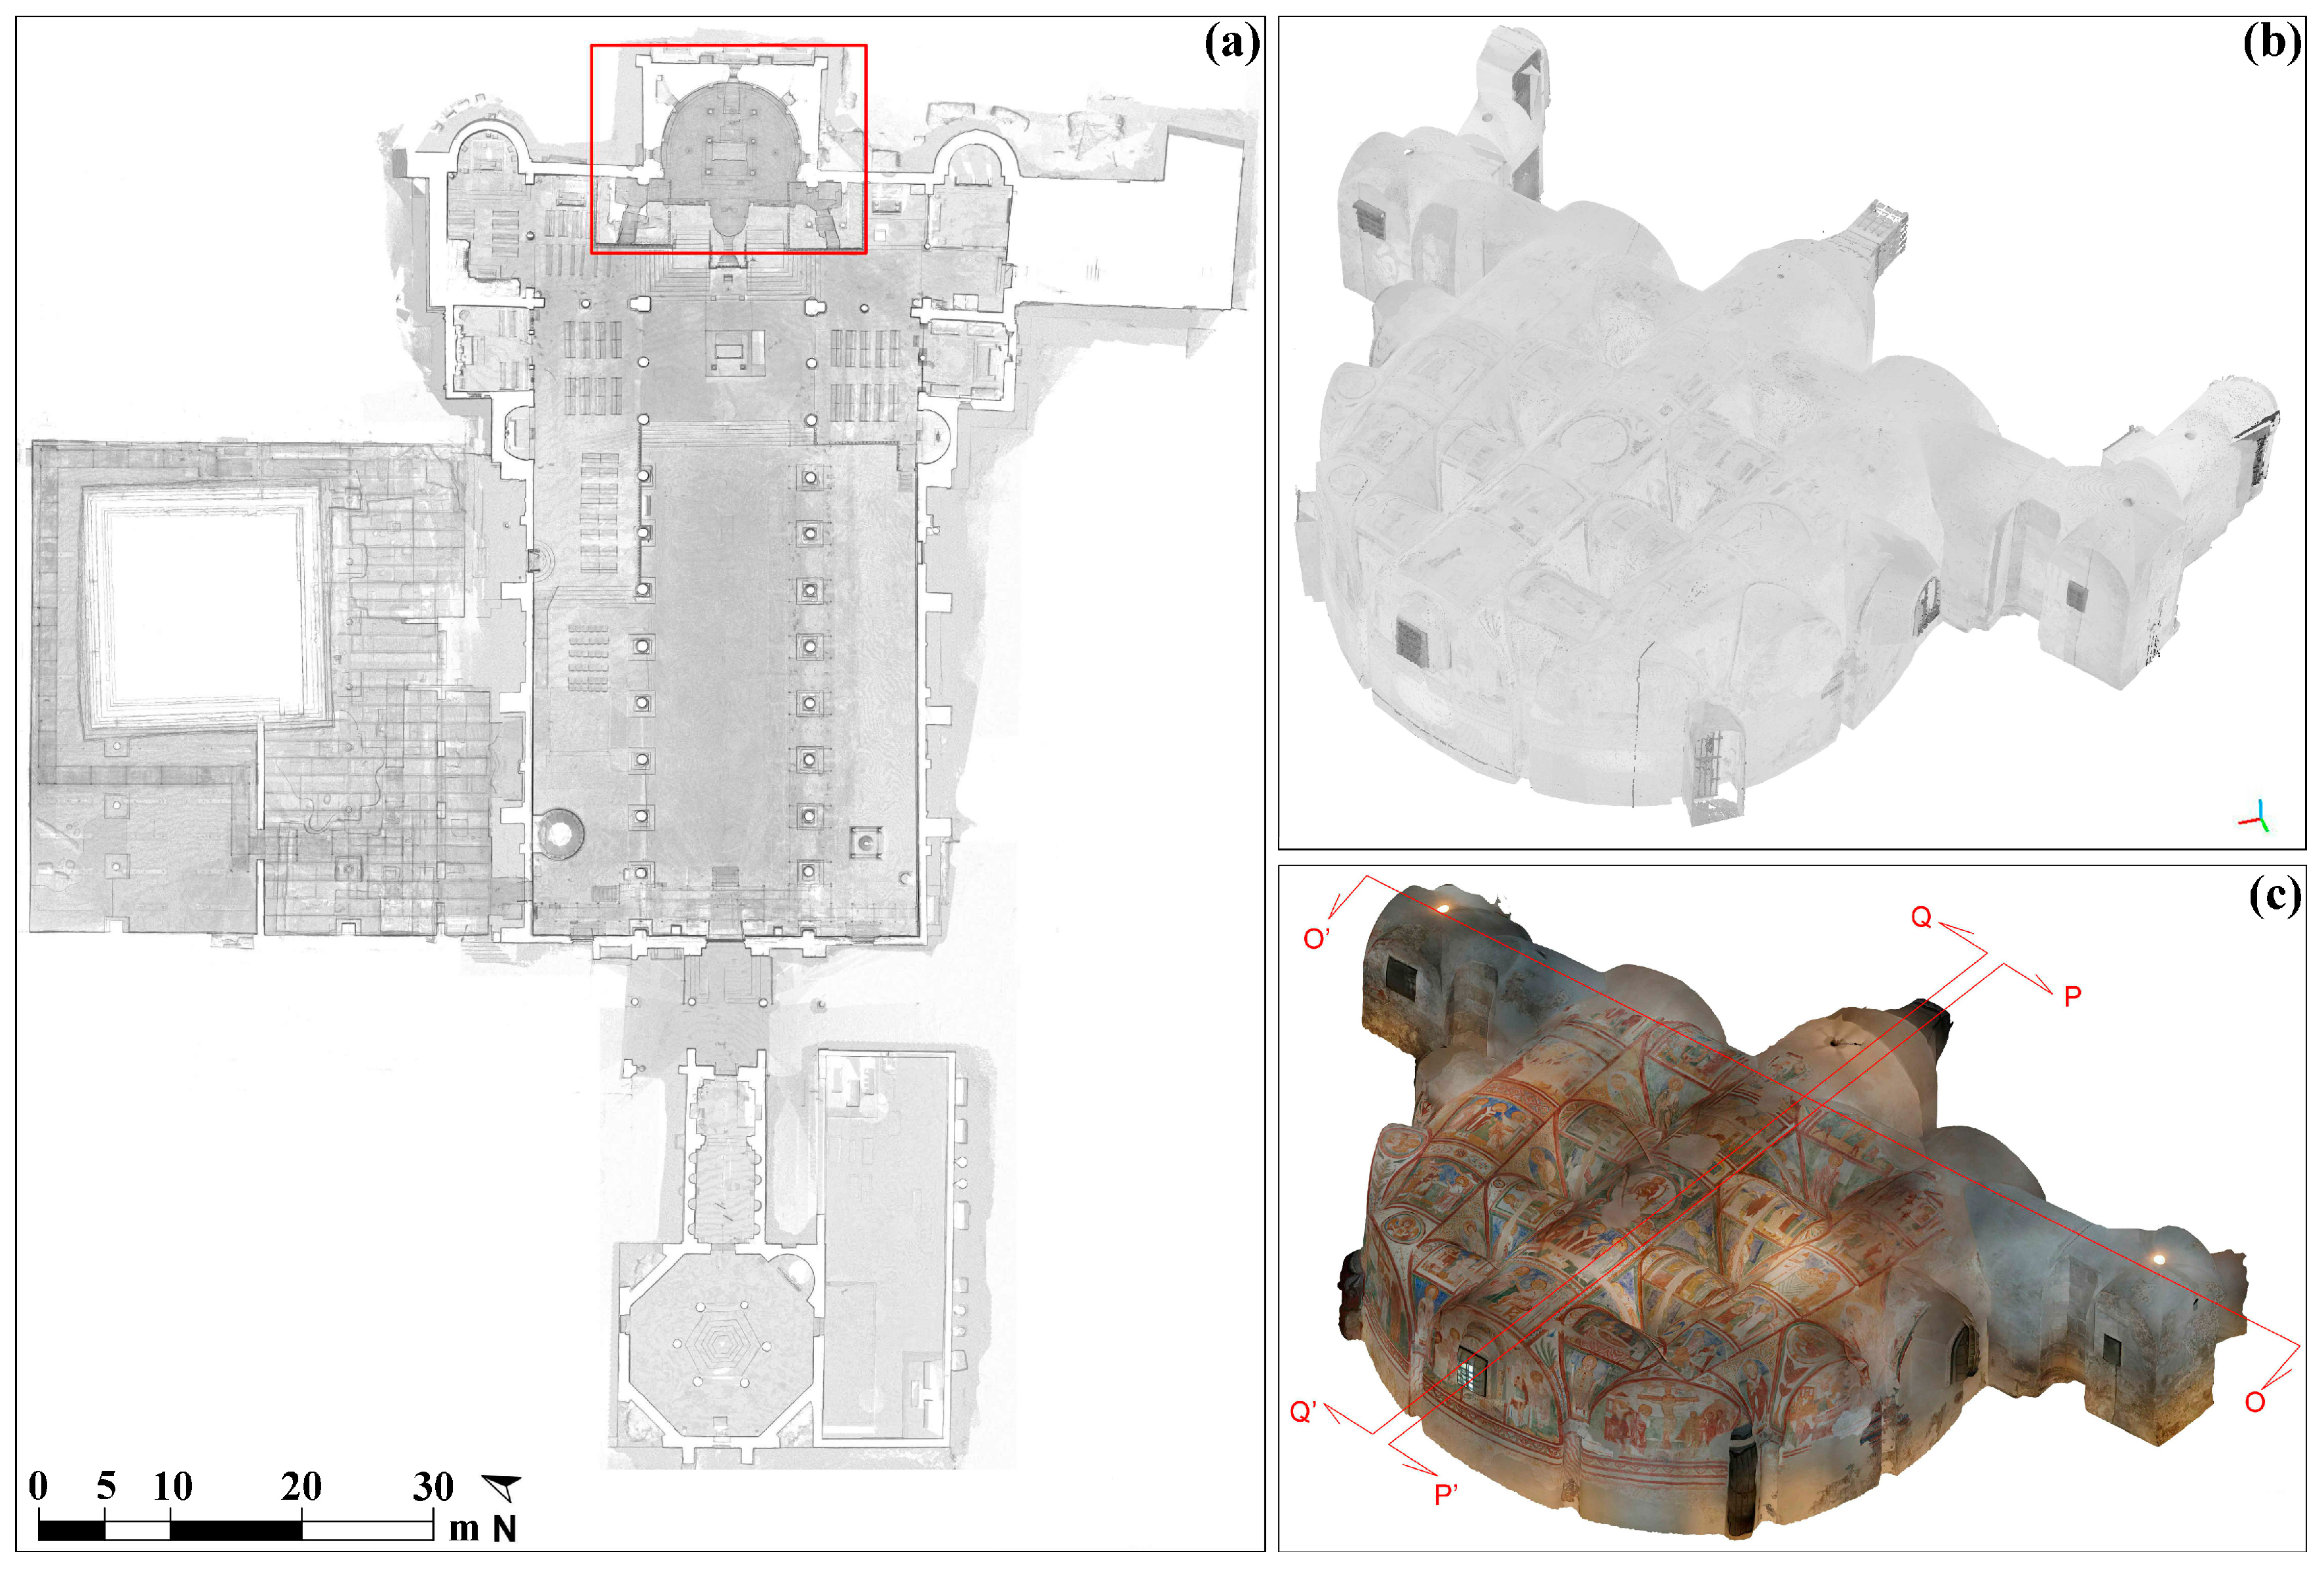
Three-dimensional laser scanner survey of the interior of the church, the crypt, the baptistery and the bell tower.
-
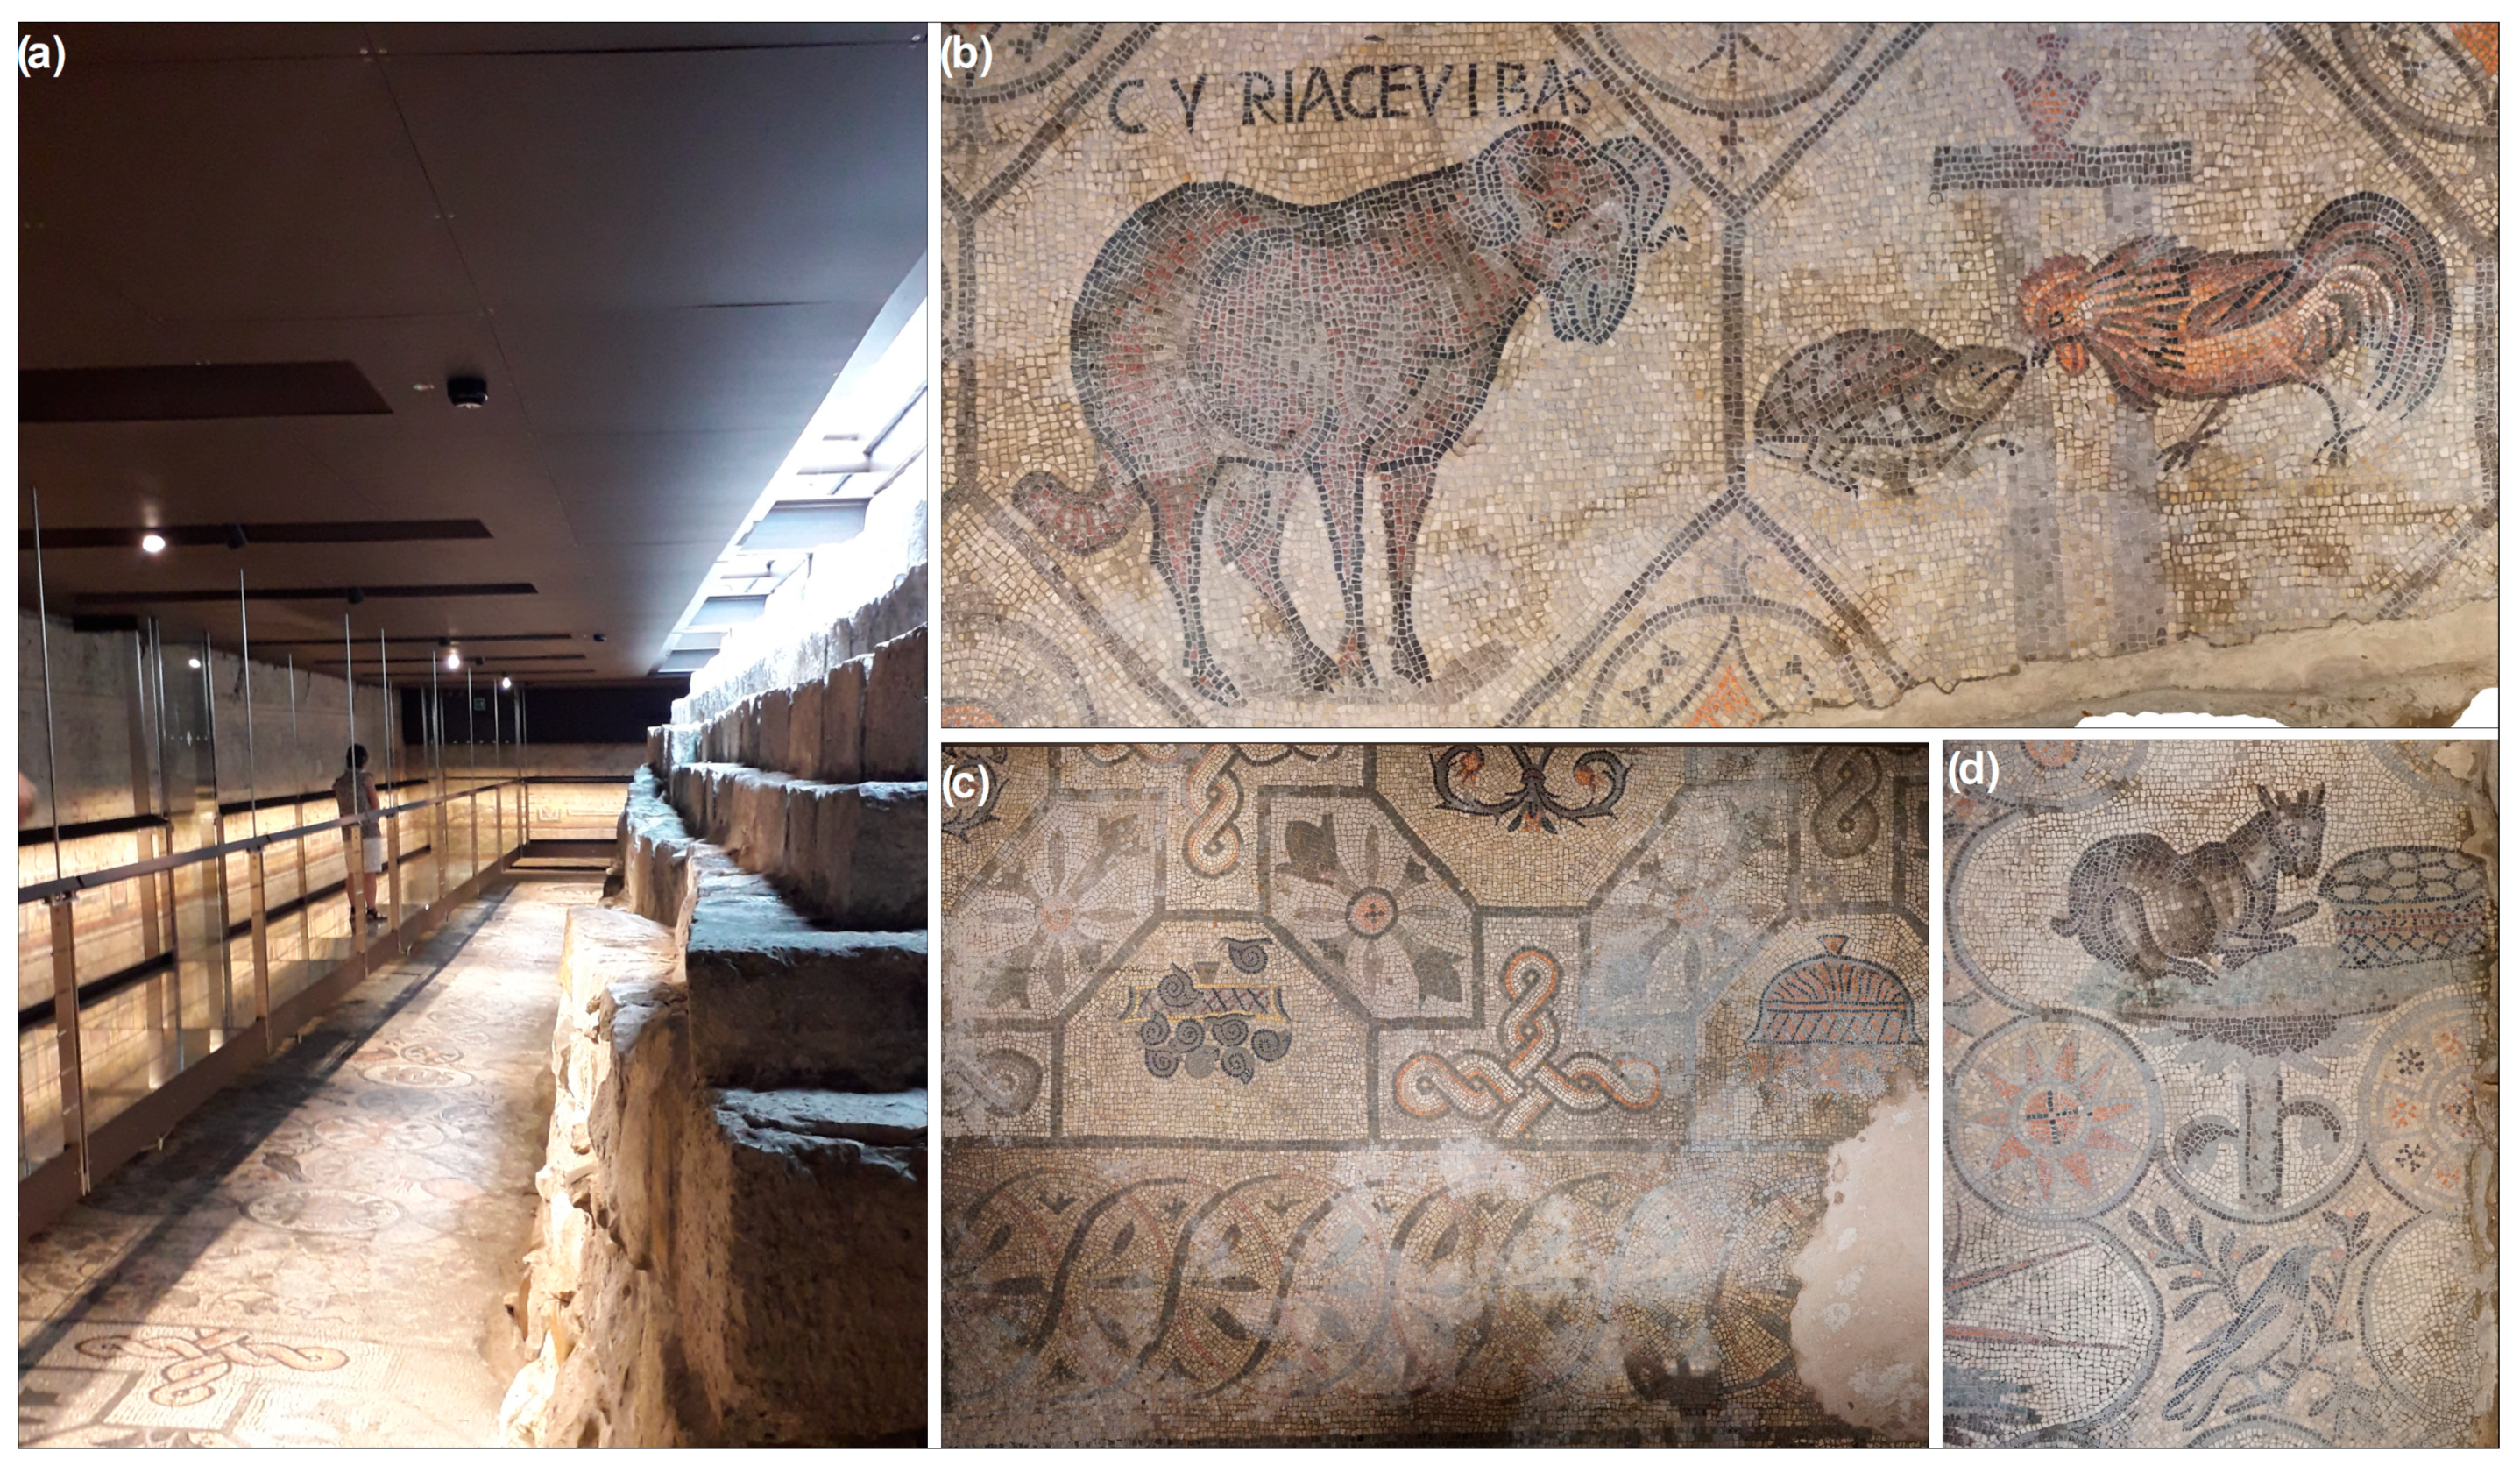
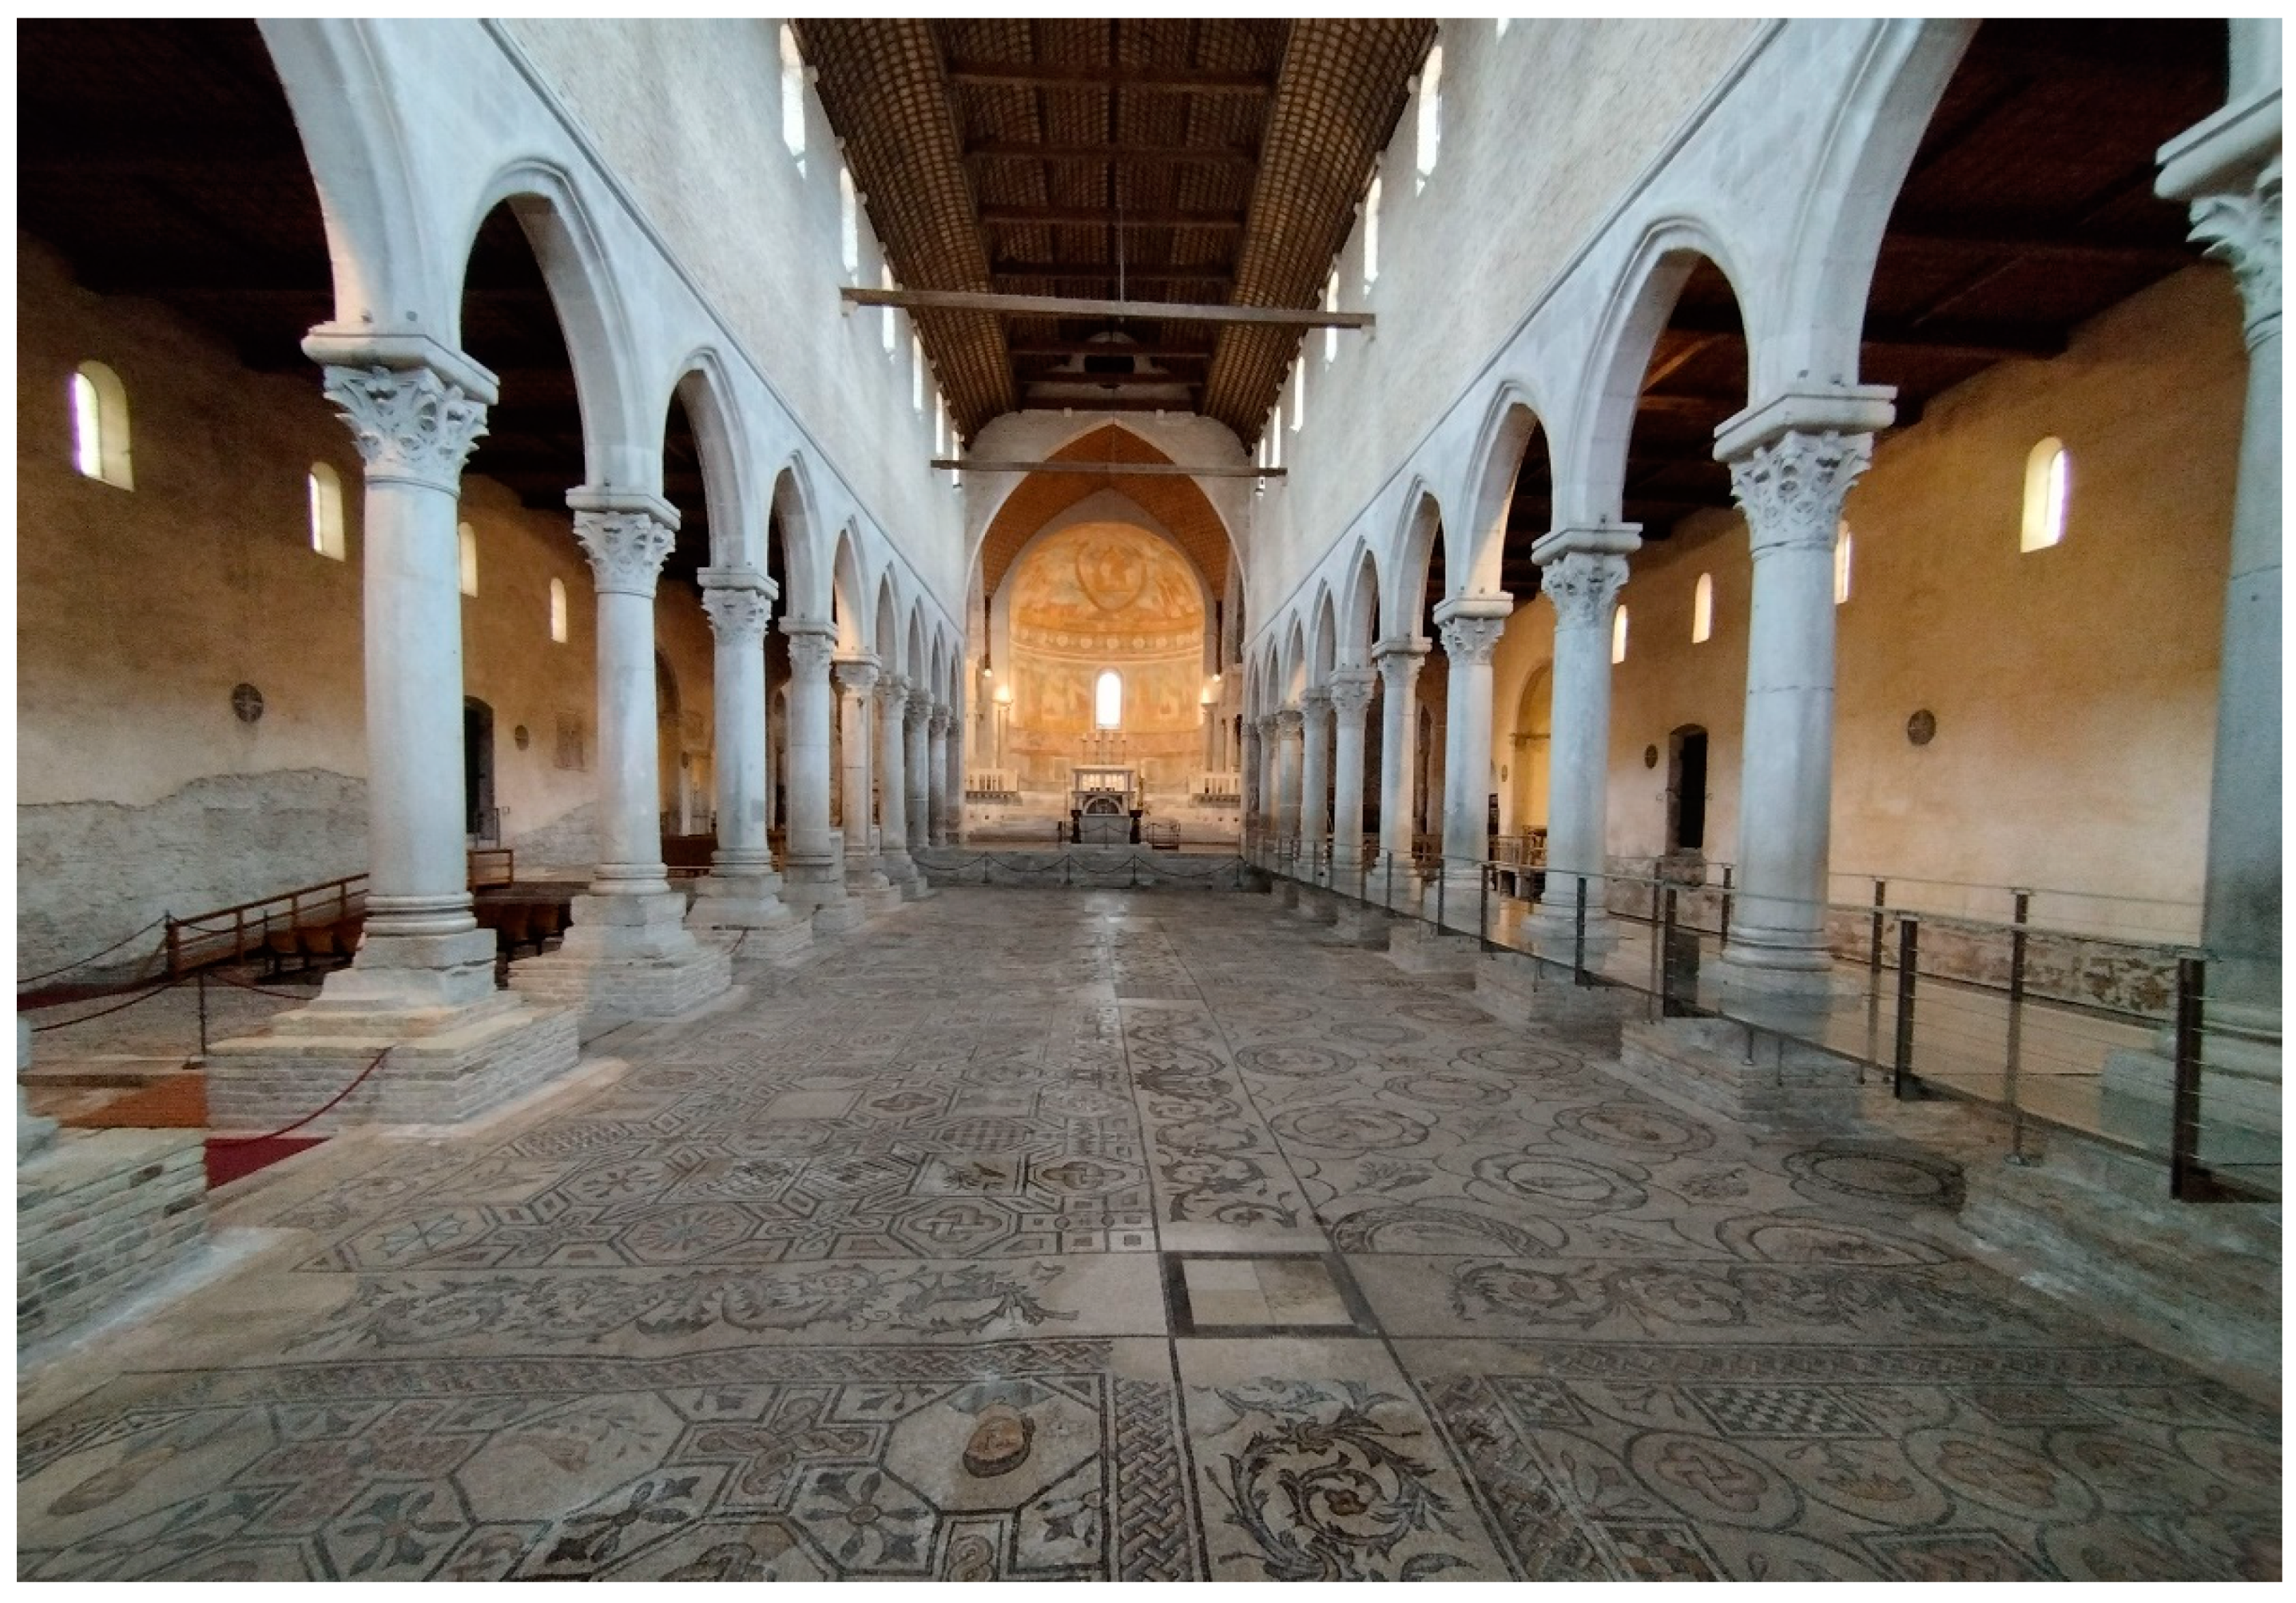
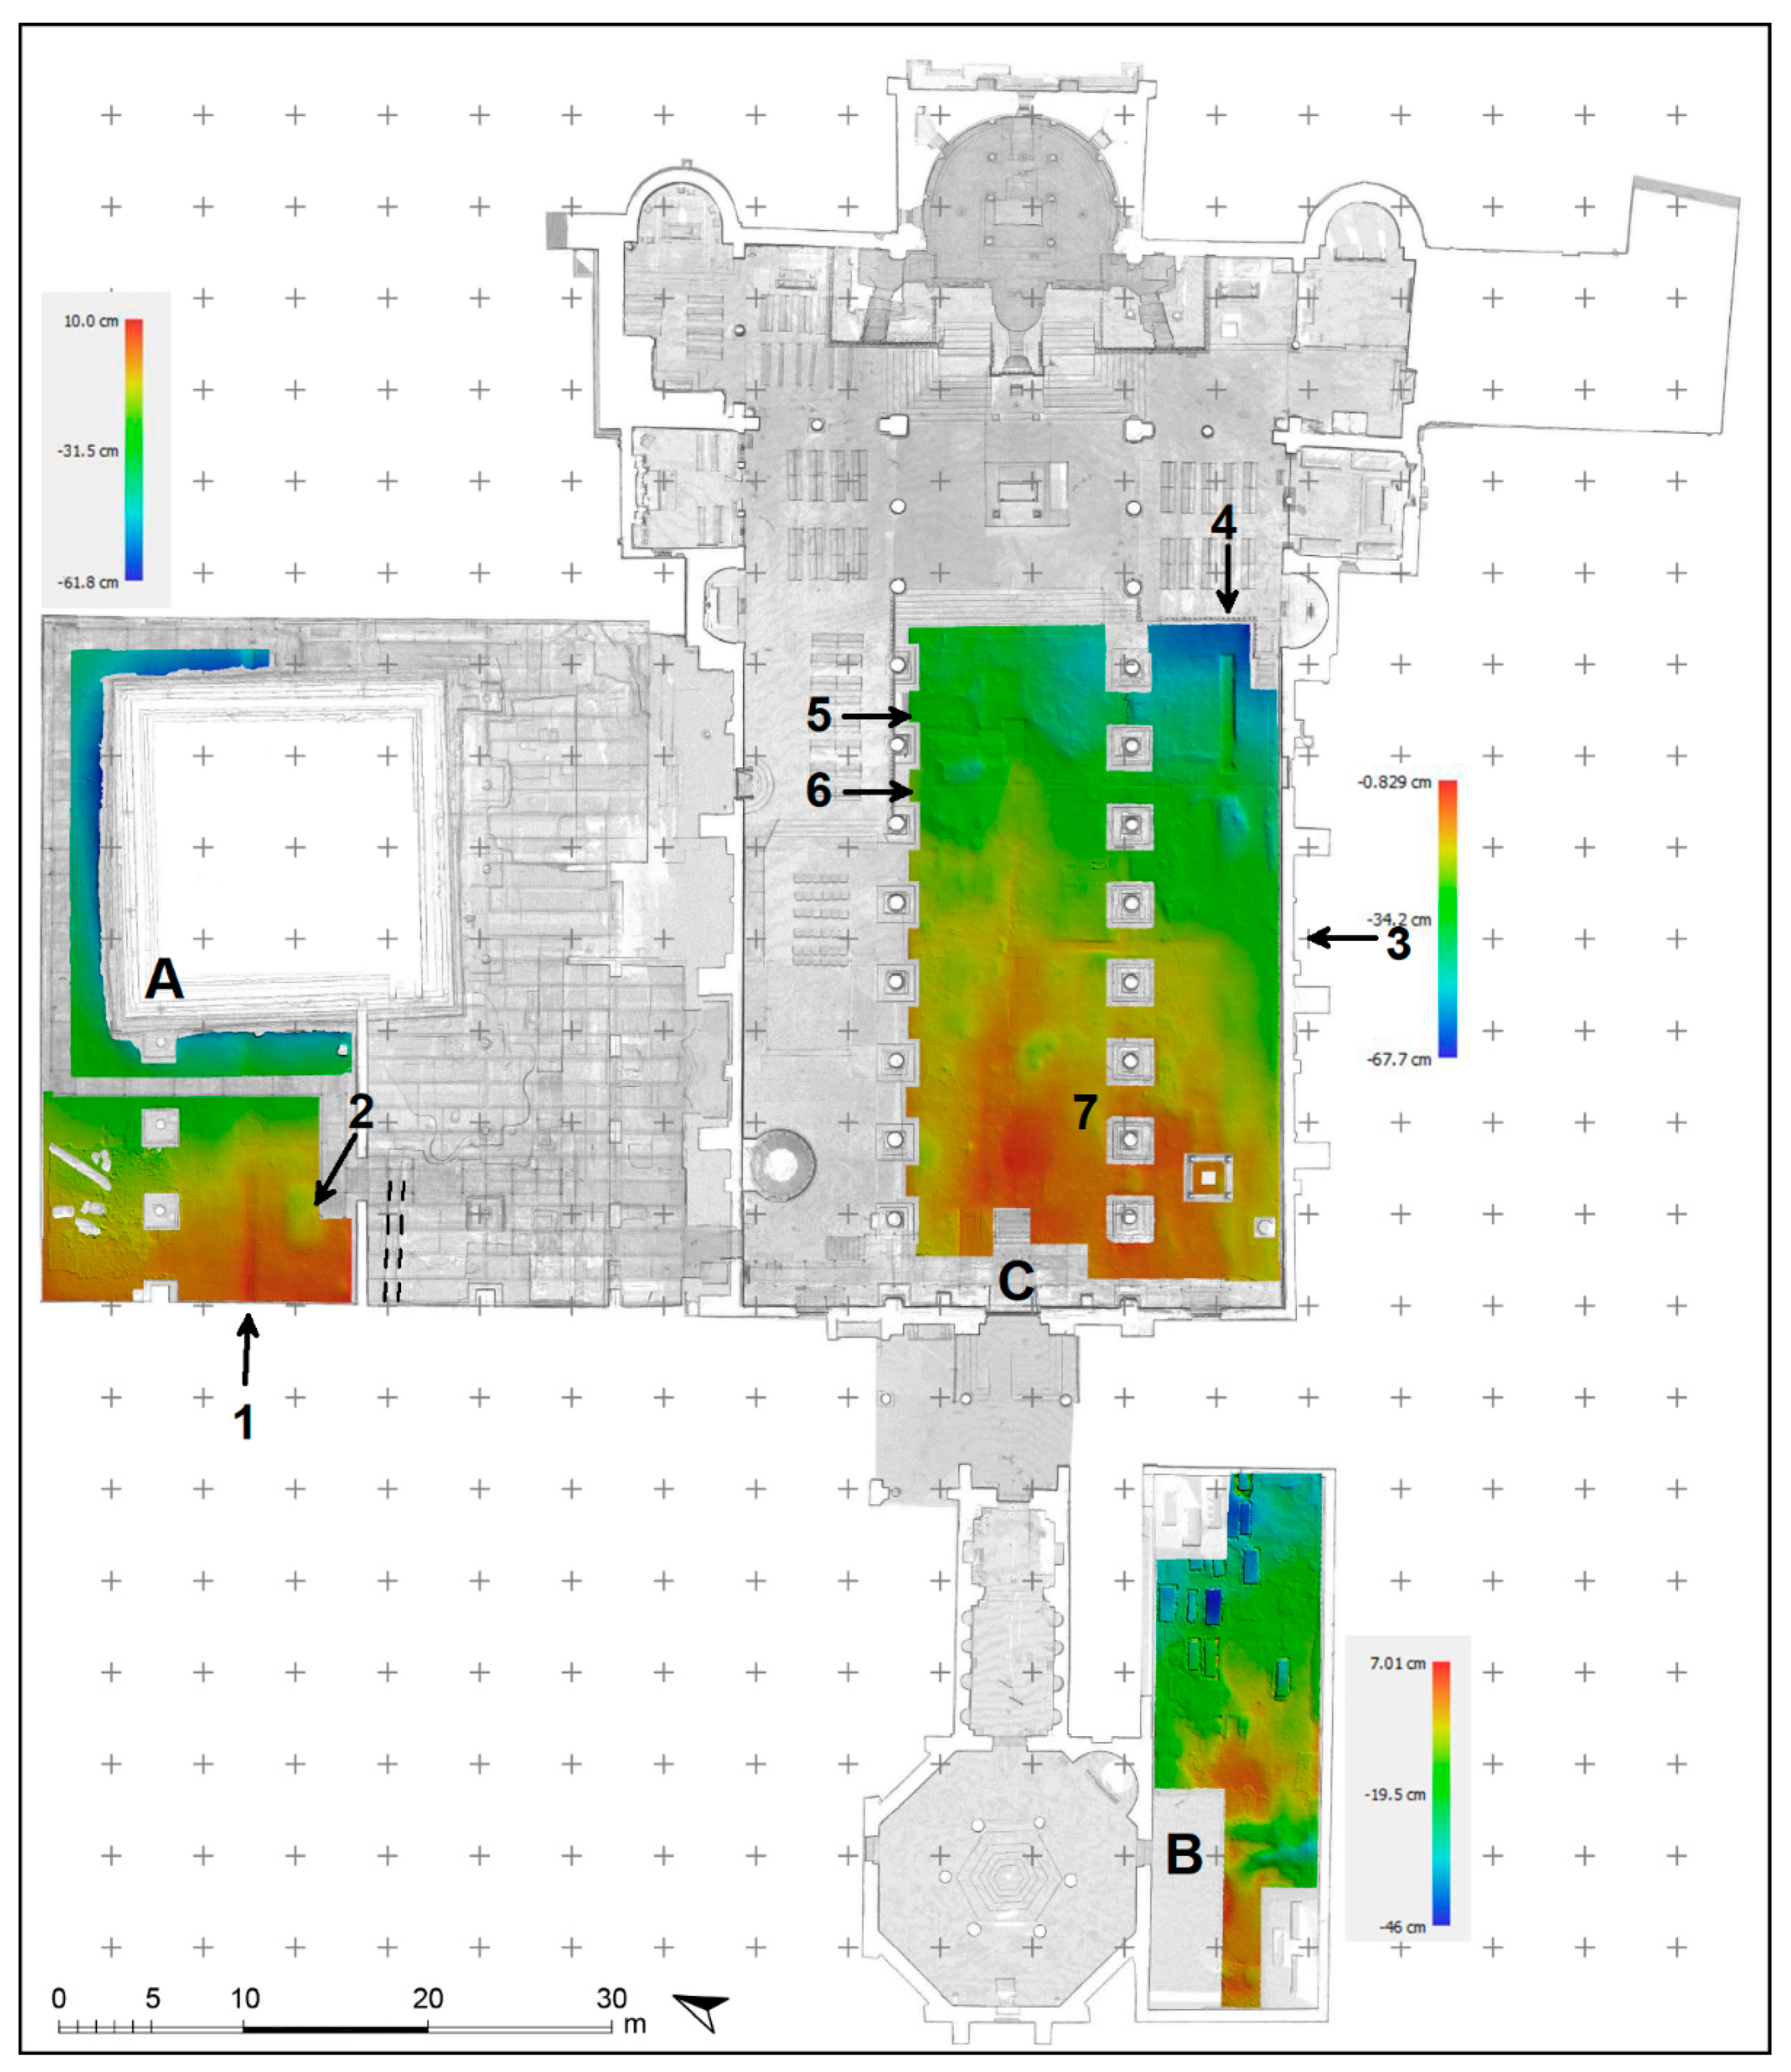
Terrestrial photogrammetric survey of the floor mosaics.
-
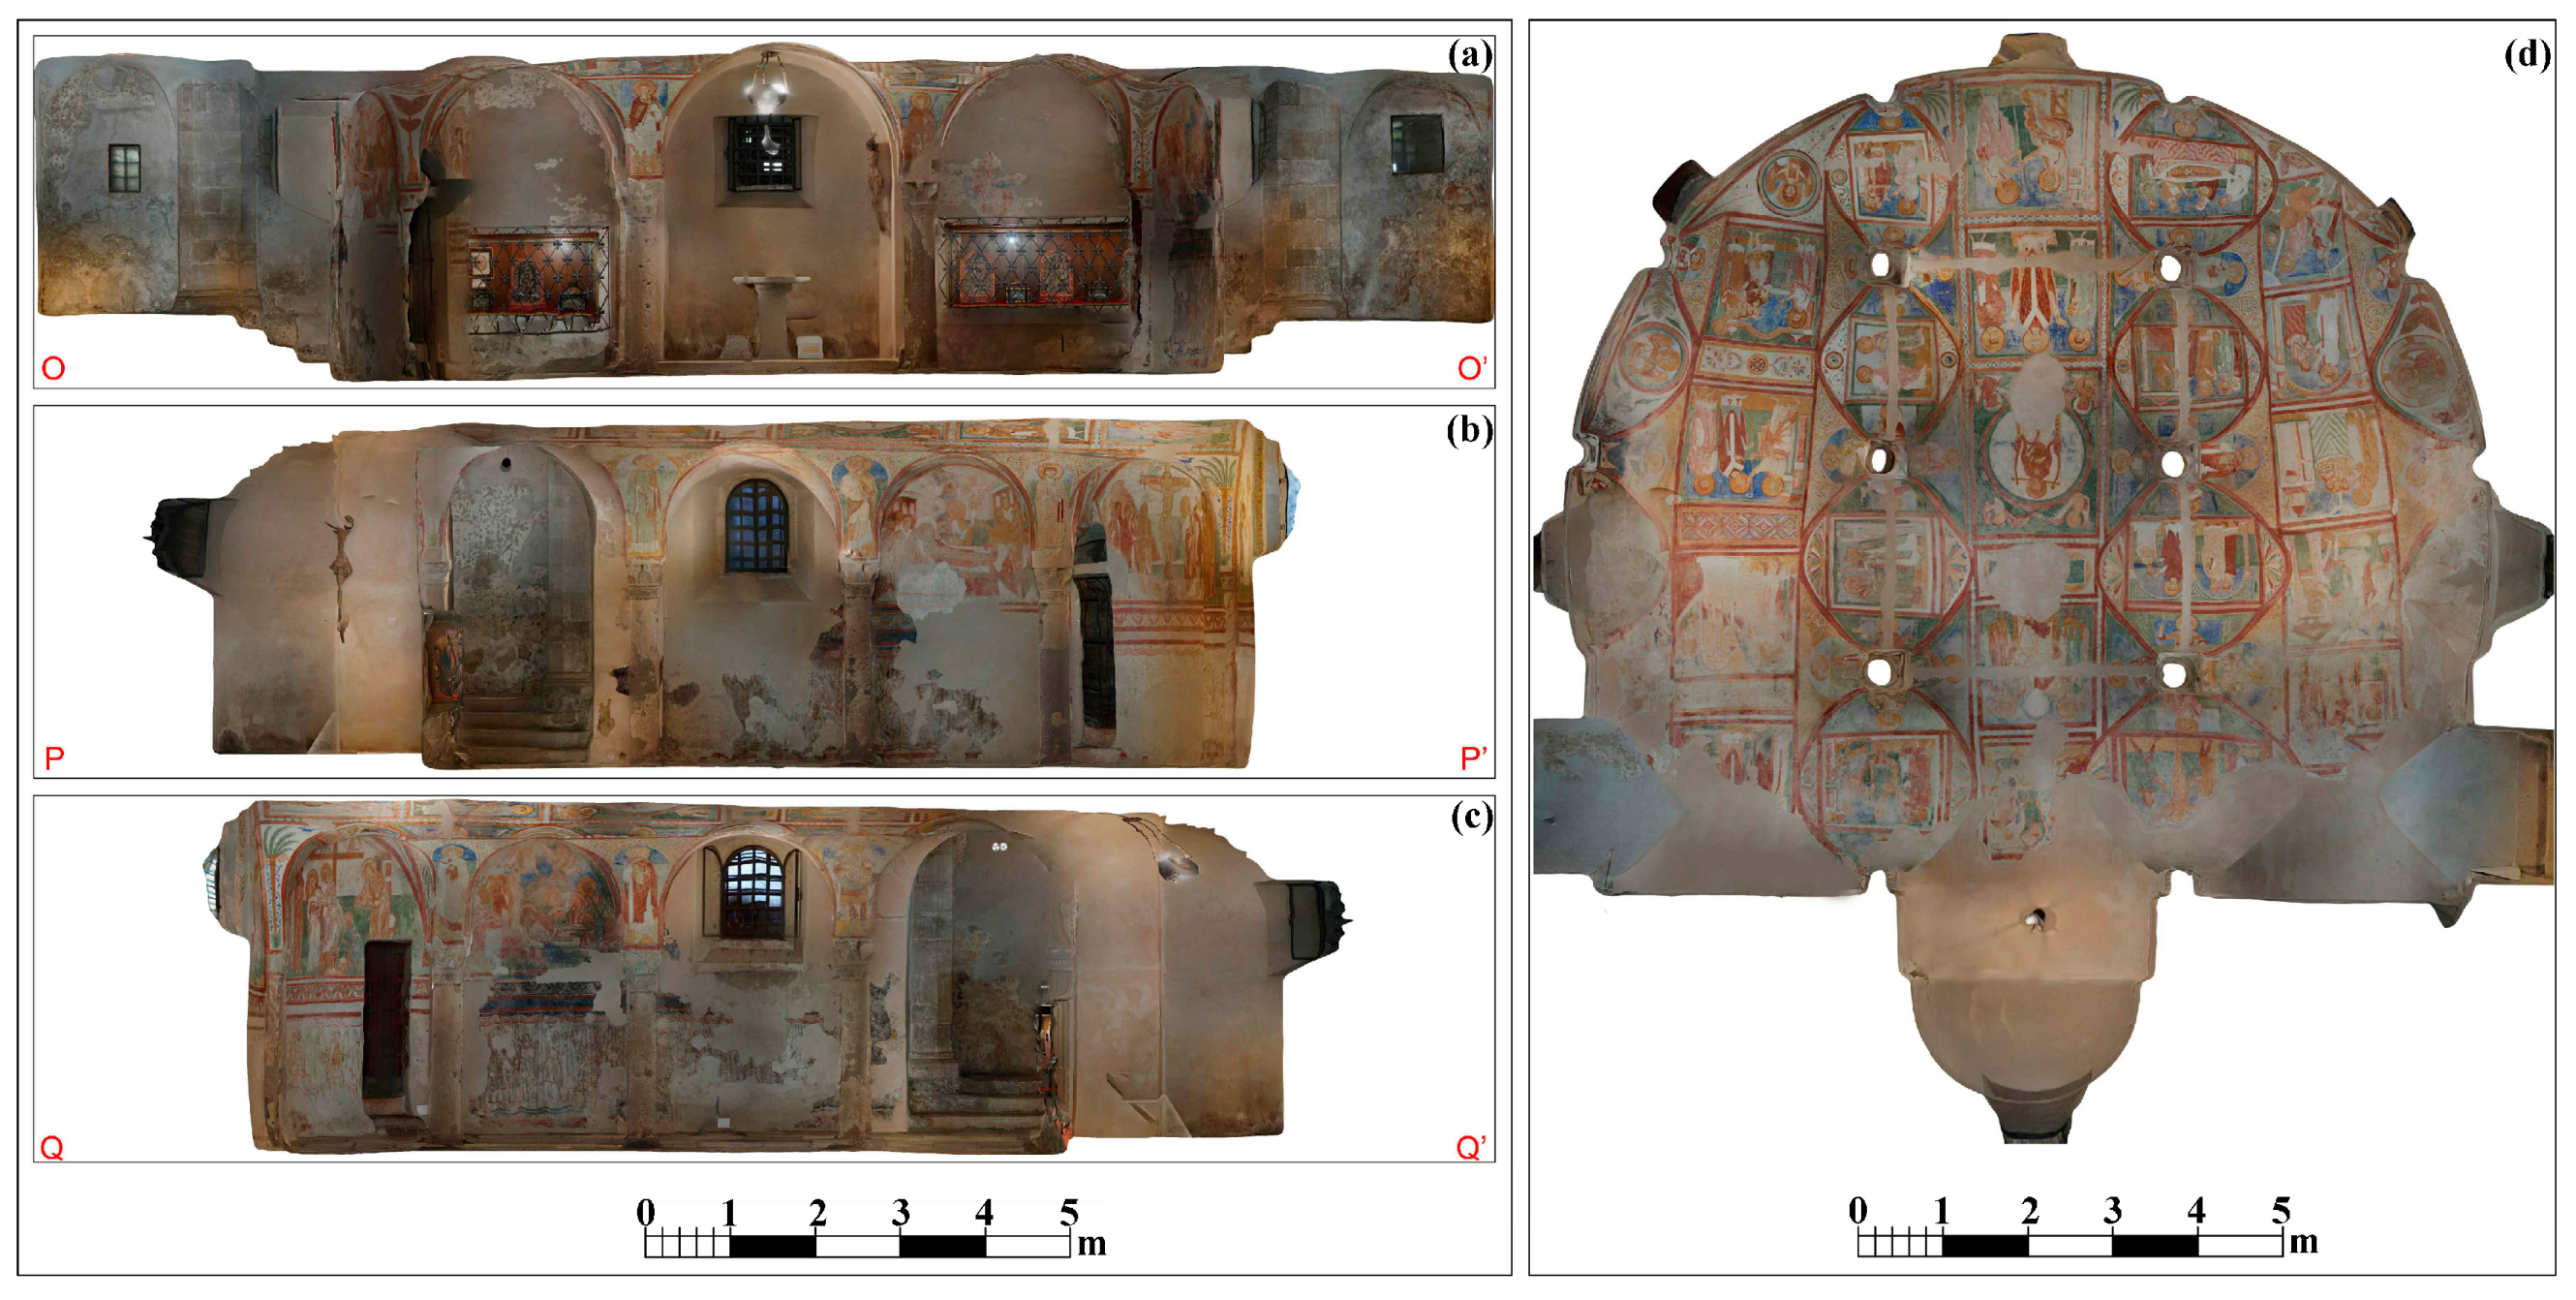
Photogrammetric survey of the frescoes in the crypt.
-
Non-invasive diagnostic investigations with GPR on floors and walls for the evaluation of buried structures inside the surfaces.
The results provided highly detailed documentation, which did not exist until now (a partial survey was carried out through a TLS survey in 2012 [34]), of the complex architectural heritage, and highlighted several weaknesses of the buildings.

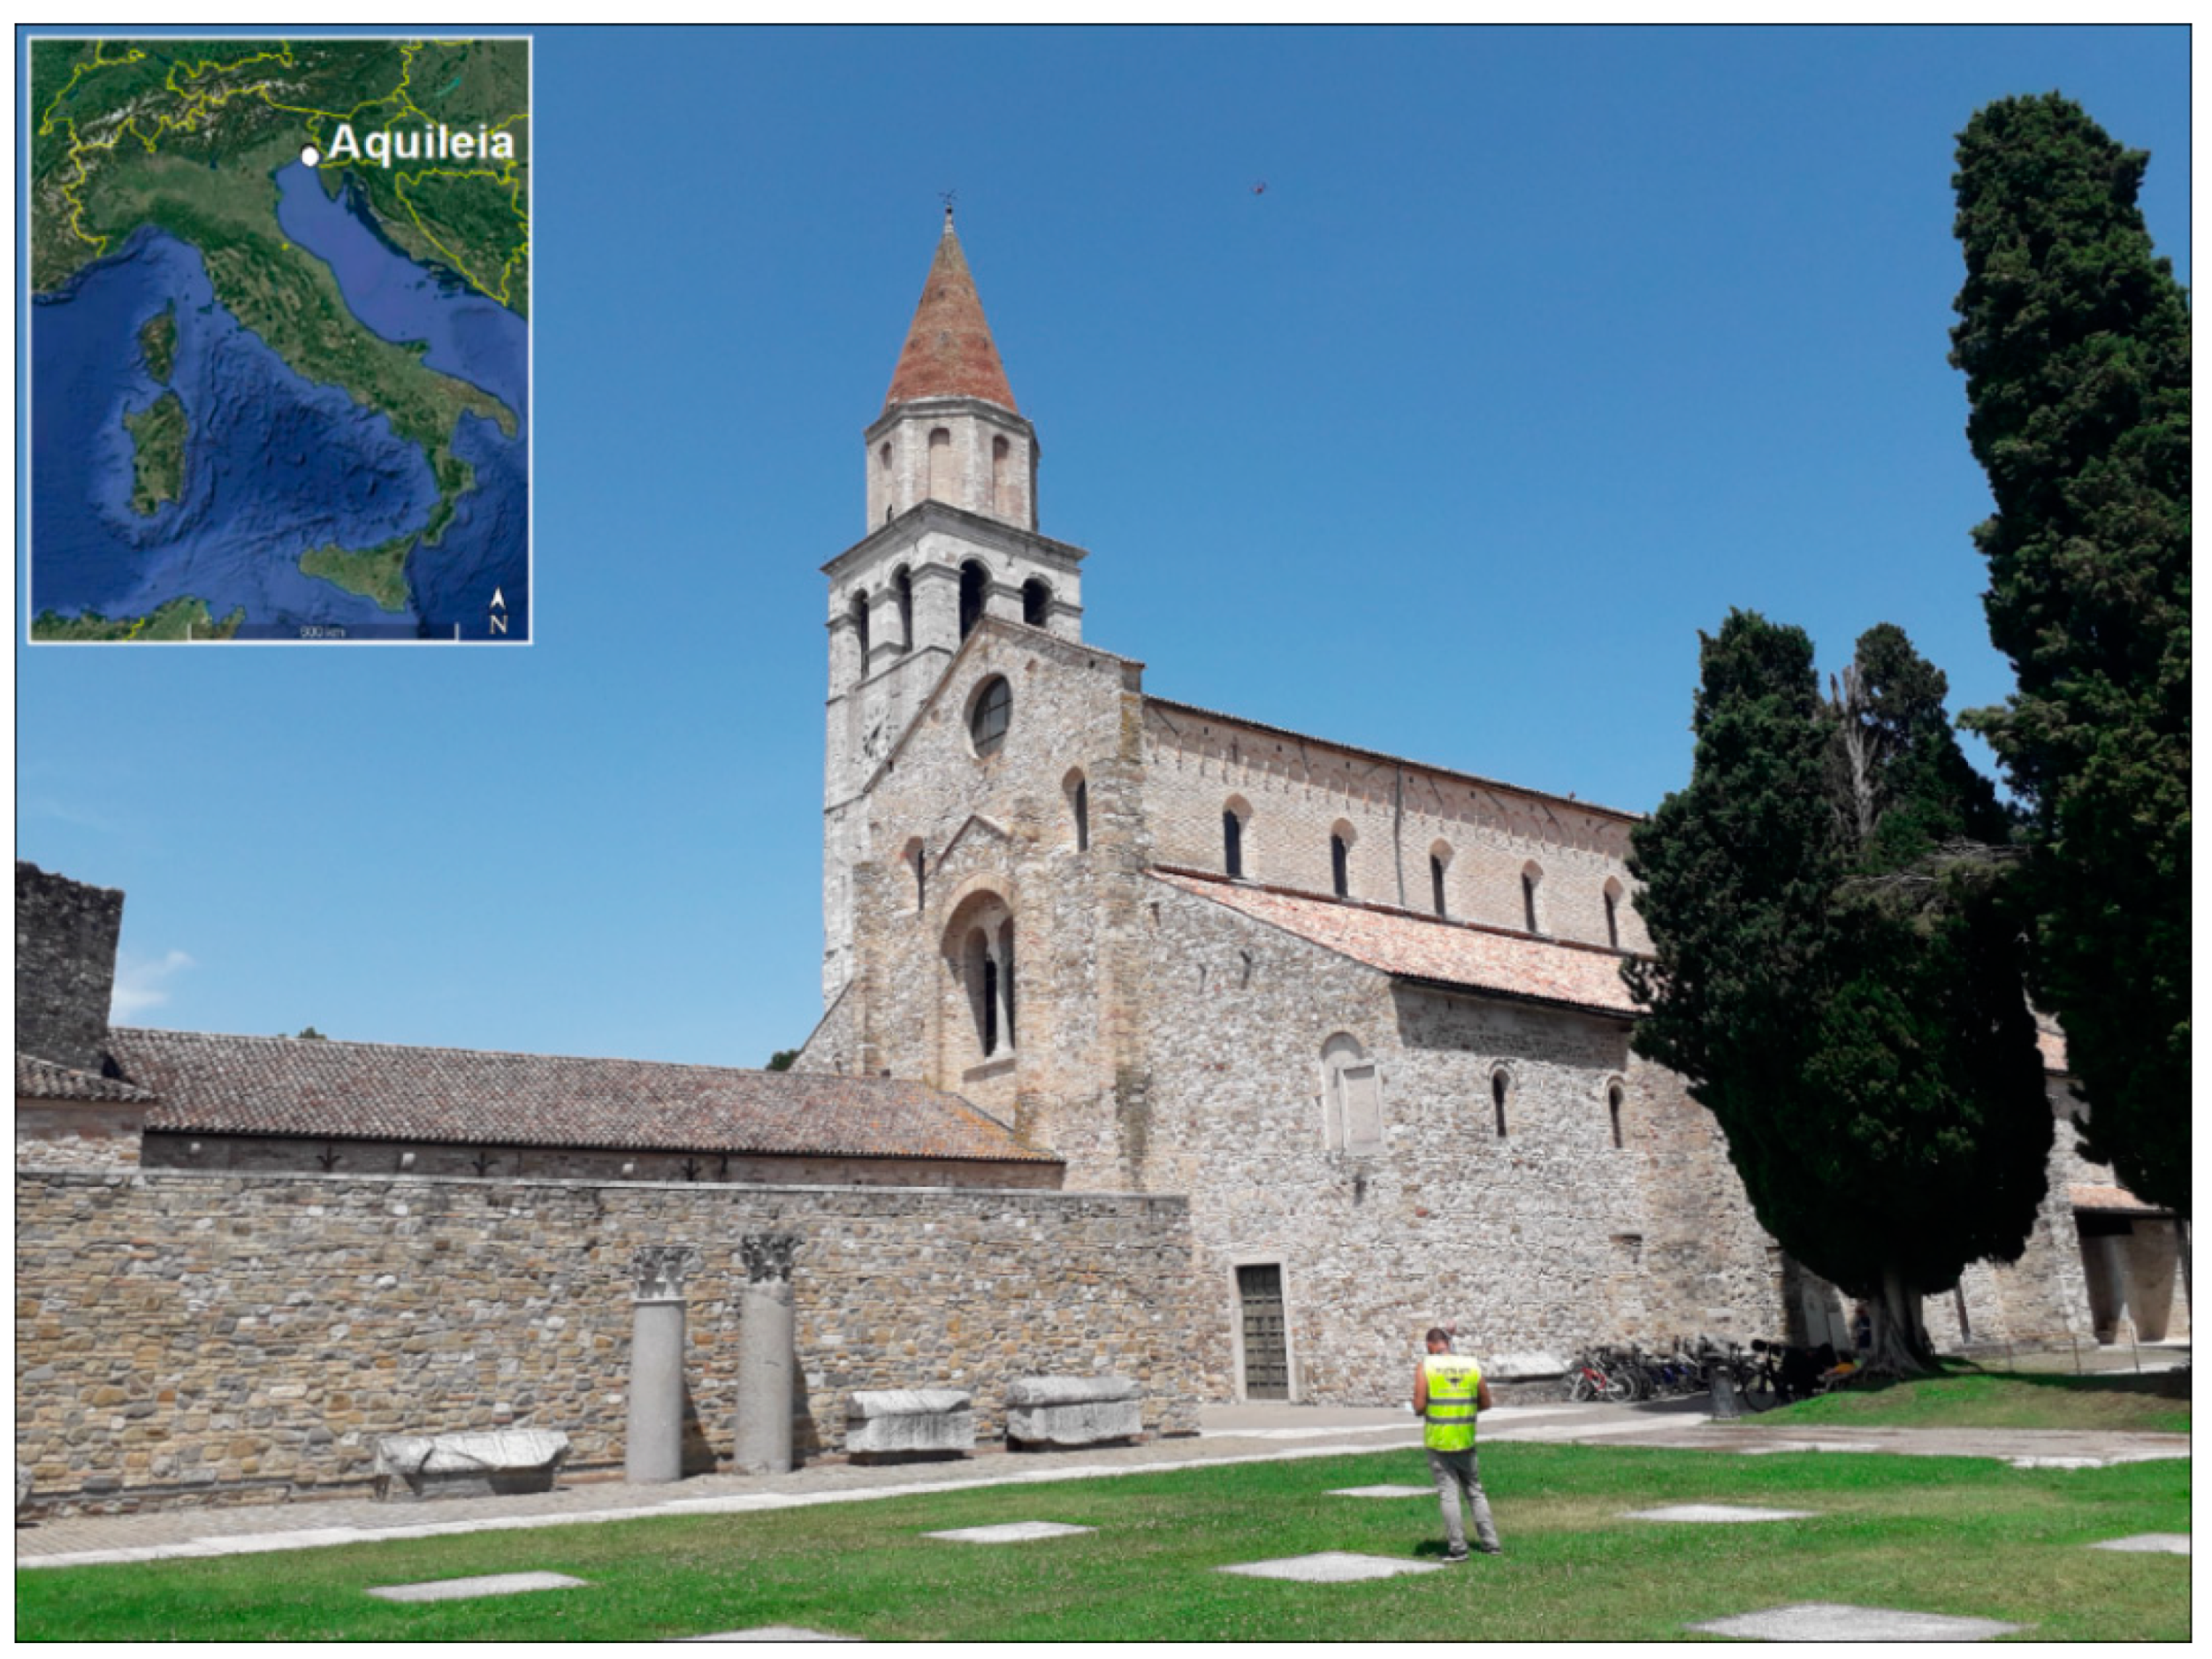
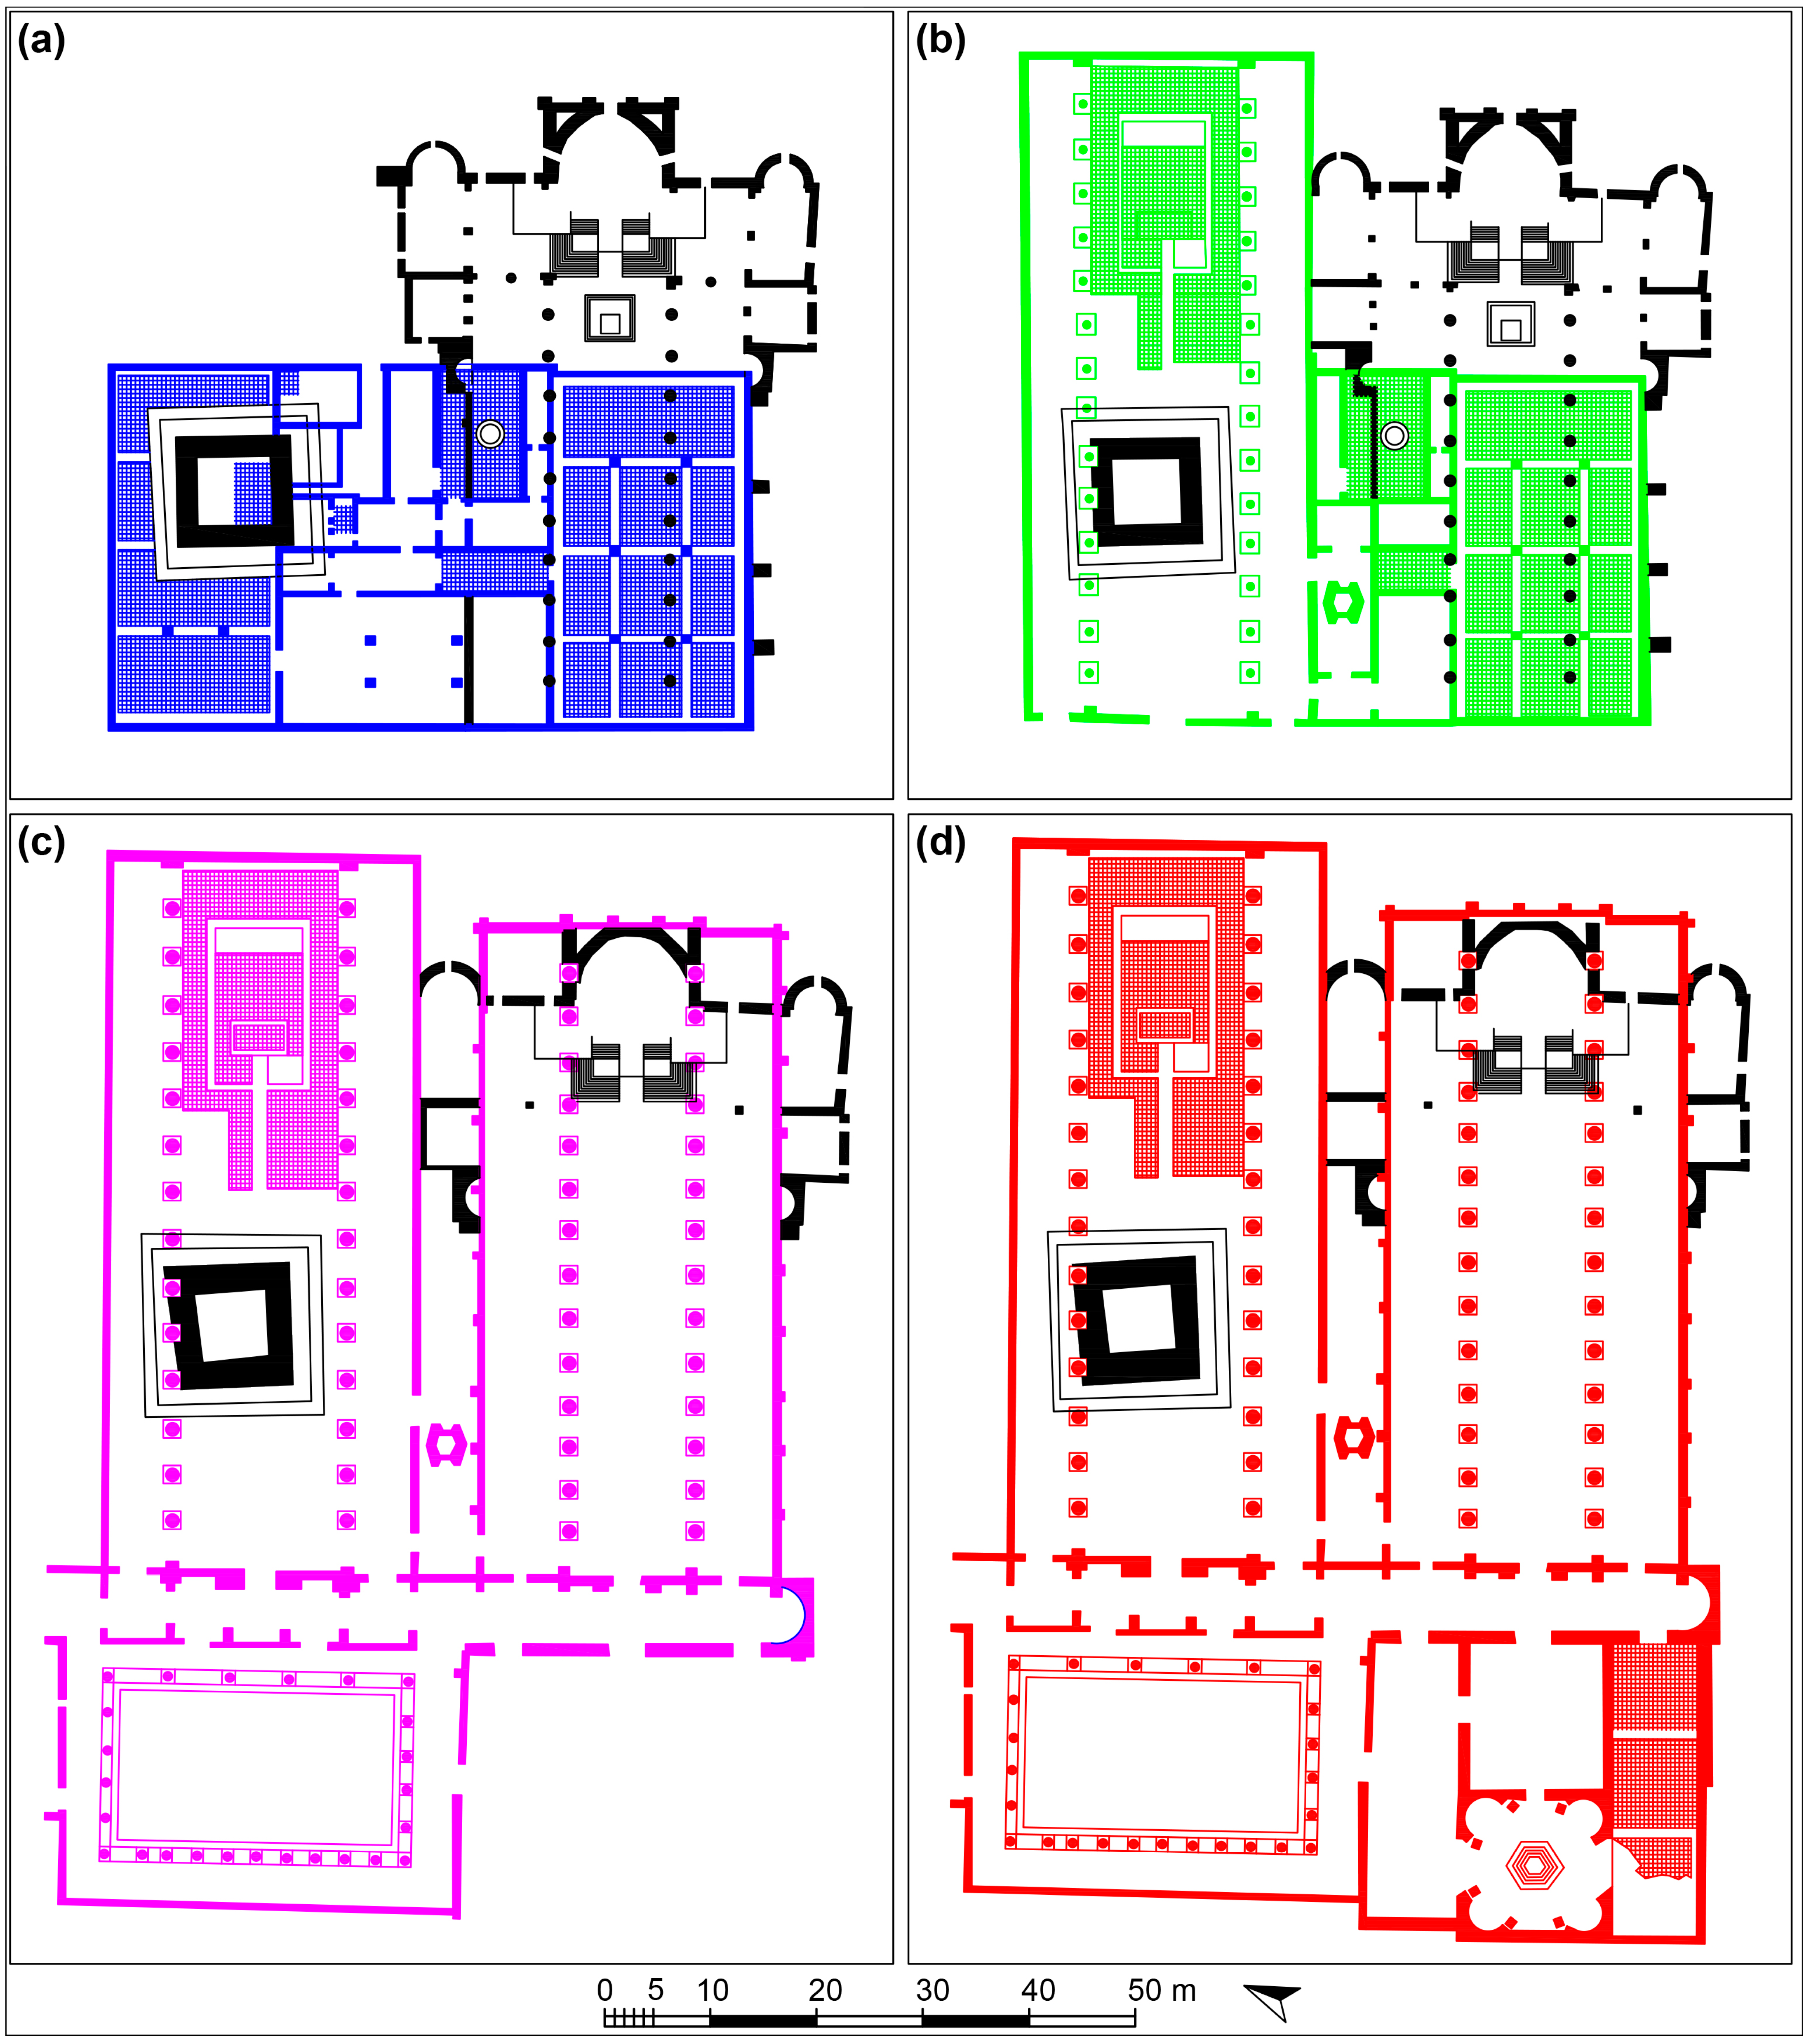
2. The Patriarchal Basilica of Santa Maria Assunta in Aquileia (Udine, Italy)

2.1. Geological Background

The Patriarchal Basilica of Santa Maria Assunta is located in Aquileia (Udine, Italy). The city is located in an alluvial morphological context, the Lower Friulian Plain, in which subsidence processes are in progress, as in the entire arch of the Po valley, which extends from Veneto to Emilia-Romagna. From a lithological point of view, loose and saturated sandy-silty surface horizons are recognized, following a mostly cohesive horizon, which gives place to the underlying thickened sandy beam [35]. The site under analysis falls within the seismic micro-zoning mesh indicated as low hazard [36]. Despite this, Aquileia is surrounded by significant seismogenic structures. In fact, the Carnic-Friuli region represents one of the most seismically active sectors in all of northern Italy [37]. It is probable that Aquileia was affected by the propagation of distant epicenters with high magnitudes. Considering the historical sources (Catalog of Strong Earthquakes in Italy in the most recent version [38], Catalog of earthquakes and tsunamis from 11th to 15th century [39] and the Parametric Catalog of Italian Earthquakes [40]), regarding the seismic effects in Aquileia and its basilica, the information concerns only the earthquakes of 988 and 1348.

2.2. Historical Background

The city was founded in 181 BC as a Roman colony and it became one of the largest cities of the Roman Empire under the Emperor Diocletian, having a river port and splendid public buildings. Starting from 313 AD, following the Edict of Milan, which decreed an end to religious persecutions, the first cult building in Aquileia dedicated to the Virgin and to the saints Ermacora and Fortunato was built according to the will of Bishop Theodore [41]. It was built in a peripheral area of the city on remains of Roman residences [42] and consisted of two parallel rooms (oriented from west to east, both about 37 × 20 m), decorated with floor mosaics and connected by a transversal room covered by cocciopesto (brick with lime mortar), oriented from south to north (Figure 2a). The gaps in the decorations still visible today suggest the position of the pillars, of which there must have been six in the main halls and four in the central hall. The entrance to the structure was from the east. Various small service rooms, the changing room and the baptistery were located north of the transverse hall. Today it is possible to admire inside the Patriarchal Basilica of Santa Maria Assunta the splendid floor mosaics from this phase [43,44] (Figure 3 and Figure 4), which are the largest early Christian mosaics in the Western world (760 m2).
The northern mosaic (Figure 3a), partially destroyed during the construction of the bell tower, mainly contains floral motifs and representations of animals (Figure 3b–d). Perhaps the best-known depiction is the fight between the rooster and the tortoise that are, respectively, an allegory of Christ and a symbol of the dark powers of evil (Figure 3a).
The southern mosaic is divided into four parts, starting from the actual entrance (Figure 4). In the first, various portraits of donors, nodes with crossed ellipses and animals appear. In the second area, there are male and female portraits, depictions of the seasons, enclosed in clip-on medallions, and animals. In the third part, in the central panel, the allegorical scene of winged Victory with crown and palm is represented. Finally, the fourth span, which concludes the cycle of representations, consists of a single mosaic carpet, which represents a sea full of fish, with the story of Jonah, a Jewish prophet, sent by God to preach in Mesopotamia [45]. Among the most interesting images is Jonah praying with his hands raised to save the ship and crew from the storm, or in the jaws of the sea monster, or while being spat on by the monster and while resting under a pergola of vines of pumpkin. All around, sea waves, various fish, octopuses, mollusks and even ducks are represented.
In the following centuries, the basilica was rebuilt four times, superimposing the new buildings on the remains of the previous ones. In the mid-4th century, the north hall was enlarged (Figure 2b) and the four-sided portico in front of the facade was created (Figure 2c). The basilica was divided into three naves by twenty-eight columns and was connected, through the baptistery, to the south hall of the Theodorian basilica. On the sides of the baptistery, two large symmetrical rectangular rooms were decorated with mosaic floors dated between the end of the 4th century and the first decades of the 5th century [46]. Of the northern one, only small fragments remain; the southern one, on the other hand, preserves a large surface, with figures of animals and elaborate geometric motifs.
Subsequently, at the time of Bishop Chromatius (388-407), the southern hall was also enlarged and new buildings, including the current baptistery, were built (Figure 2d) [47]. Attila destroyed the northern hall during the siege in 452 and it was not rebuilt. In the first half of the 9th century, the patriarch Maxentius began to renovate the ancient buildings by inserting a semicircular central apse, two side apses and the crypt [48].
After the earthquake of 988, the patriarch Poppone started a radical restoration of the complex in Romanesque style [49]. The facade and the altar were rebuilt and the wooden roof was added. The bell tower was built in the 11th century [50]. In the second half of the 12th century, the patriarch Ulrich of Treffen added the frescoes in the crypt [51,52] (Figure 5). In 1348, after an earthquake, the patriarch Marquardo di Randeck replaced the round arches of the central nave with pointed arches, and in the 15th century the wooden ceiling in the shape of a ship was built, which can still be observed today.

3. Survey Methodologies

3.1. Digital Survey

3.1.1. Topographic Survey

In order to acquire the coordinates of points in space in a local reference system established in advance, a survey with a total station was carried out using the MTS 805R instrument. The activities were preceded by a careful territorial survey considering the geometry of the area and the location of the elements to be surveyed in the territory. A topographical network was therefore created with a framing of vertices organized in primary benchmarks set in such a way as to minimize the sequence of measurements. This was enabled by considering the largest possible areas using the polygonal scheme, setting up a chain of closed points around the building in which each one is visible from the previous and following points, and bypassing the visual obstacles. To avoid the propagation of errors in the measurements, for each station point, cross-checks were carried out with known points (building edges, road crossings, etc.) which allowed redistribution and compensation of inaccuracies. Finally, secondary polygonal schemes were then connected to the main polygonal near the elements to be surveyed in detail.

3.1.2. Terrestrial Laser Scanner (TLS)

For several years, the use of TLSs has become a widespread part of surveying activities in architectural and archaeological fields in order to obtain homogeneous and consistent numerical data on which to perform all section and projection operations. Laser scanning enables the automatic and direct measurement of 3D points. Specifically, laser beams are actively emitted and a sensor captures the backscattered signal to obtain a large 3D description of a surface using point clouds [53,54]. The indiscriminate acquisition of point clouds by the instrument conditions the known critical act and the choice of what one wants to represent. The critical act has shifted from the data acquisition stage to the processing stage through several steps including preprocessing of data, registration of clouds, deletion of superfluous data, transformation of clouds into surfaces, determination of viewing planes and final representation. At the same time, searching for the complete scan of a monument is a difficult quest in view of the complexity of the monument under consideration. TLSs and registration algorithms developed in recent times (Iterative Close Point algorithms, ICPs) make it possible to extend the limits of surveying in a complex area from planimetric and elevation points of view [55]. Thus, it is now possible to imagine and carry out surveys of large structures, articulated on different planes and with a complex distribution of internal structures, while maintaining high quality standards in the overall representation of the monument.
Current instrumental resolutions are capable of visualizing millimeter details even at a distance of several tens of meters. In the case of the Basilica of Aquileia, two phase-difference laser scanners, the FARO Focus 3D MS120 and FARO 3D X330, the latter with a longer range for hard-to-reach areas, were used outside and inside the basilica complex. In total, more than 250 scans were conducted with a resolution of one point every 6 mm at 10 m distance.
To facilitate the data-recording algorithms, redundant scans were performed from different viewpoints within the basilica complex. The management of field acquisitions is now mainly based on basic topography and redundant overlaying of laser data aimed at maximum coverage of the areas to be surveyed and minimizing the shaded areas still present in the upper and inner parts of the monument [56].
The monument complex was segmented into several bodies in which the scanning groups were performed. The boundary areas between the different bodies were used to record the various parts of the complex and ensure a complete working of the entire basilica.
To obviate the well-known problems of error propagation, which are inevitable on articulated routes of this kind, the integrated use of the total station allowed fixing some known points on the scans of the central nave of the basilica and the adjacent archaeological complex. This system permitted the definition of the relative position of the mother scans in the virtual space on which all others were docked through manual point recognition and the application of ICP and bundle adjustment algorithms.

3.1.3. SfM Aerial and Terrestrial Survey

Part of the work was carried out using SfM-based digital terrestrial and aerial photogrammetry systems. These techniques are based on algorithms that extract the notable points from single photos, deduce the photographic parameters and cross the recognizable points on several photos, detecting the coordinates in the space of the points themselves [57,58]. Given the complexity of the building, the choice of the two selected methods enabled preliminary photo modeling work of the exterior architectural part of the basilica, taking into account the shaded areas of the upper part also present in the TLS acquisitions. In order to obtain information related to the exterior high part and the roof, acquisitions from a drone were carried out to complete the information of the exterior. The surveying was carried out using a remotely piloted aircraft (Yuneec H520, camera with CMOS sensor (1”), fixed focal length of 26 mm and resolution of 20 million pixels) with a manual flight control. The images (nadiral and oblique) were acquired through a circular flight around the monument by varying the flight altitude and the distance from the basilica [59]. The acquisitions of the exterior perimeter of the basilica were carried out in order to integrate the information of the elevations and to have enough information for the generation of the orthophotos. The external orientation of the photographic captures was performed by taking advantage of the laser scanner information of the exterior and, in some cases, the targets positioned and recorded by the total station.
Despite having different resolutions, the data matching was always organized with an alignment error of less than 0.025 cm.
Ground photogrammetry was achieved using a Mirrorless Sony Alpha 5100, equipped with a CMOS sensor (23.5 × 15.6) having 24 million pixels and a focal length of 16–50 mm, positioned on a telescopic pole. Frames were acquired along horizontal bands, ensuring an average overlap of 80% both horizontally and vertically.
In this way, two data sets were obtained consisting of 1.015 frames for the drone survey and 5.211 frames for the survey with the digital ground camera.
Data processing of images was performed with Agisoft Metashape software (LLC. St. Petersburg, Russia) [60] using the structure from motion (SfM) technique [61,62]. Considering the large size of the data set, the 3D model was processed by dividing it into 8 blocks (church tower, north, east, south, and west parts of the basilica, crypt, mosaics and baptistery). For each block, data processing followed precise steps:
-
Aligning images: In this step, the position of the camera is found, the orientation (interior and exterior parameters) of each photo is determined and the model is built with a discrete point cloud. Interior parameters include camera focal length, coordinates of the image principal point and lens distortion coefficients. Exterior orientation parameters (three translation components and three Euler rotation angles) define the position and orientation of the camera. They are estimated during image alignment [60].
-
Building the dense cloud: Dense point generation is based on depth maps that are calculated through dense stereo matching. Depth maps are estimated for the overlapping image pairs considering their relative exterior and interior orientation parameters estimated with bound adjustment. Multiple pairwise depth maps generated for each camera are merged together into a combined depth map. Depth maps generated for each camera are transformed into the partial dense cloud points, which are then merged into a final dense cloud point with an additional noise filtering step applied in the overlapping regions. The normals in the partial dense cloud points are calculated using plane fitting to the pixel neighborhood in the combined depth maps, and the colors are sampled from the images [60].
-
Placing ground control point markers: Setting the coordinate system provides correct scaling of the model. To align each block into one 3D model, the coordinates from the survey with the total station were entered. This process is of great importance as it can compromise the correct scaling of the model and its location in space [60].
-
Building the 3D mesh model: The generation of the mesh allows transformation of the dense cloud points into a triangulated surface. To optimize the model and simplify it, algorithms were applied using the “optimization method” and “decimation filter”. In this way, it was possible to manage a lighter and more compact model with fewer errors [60].
-
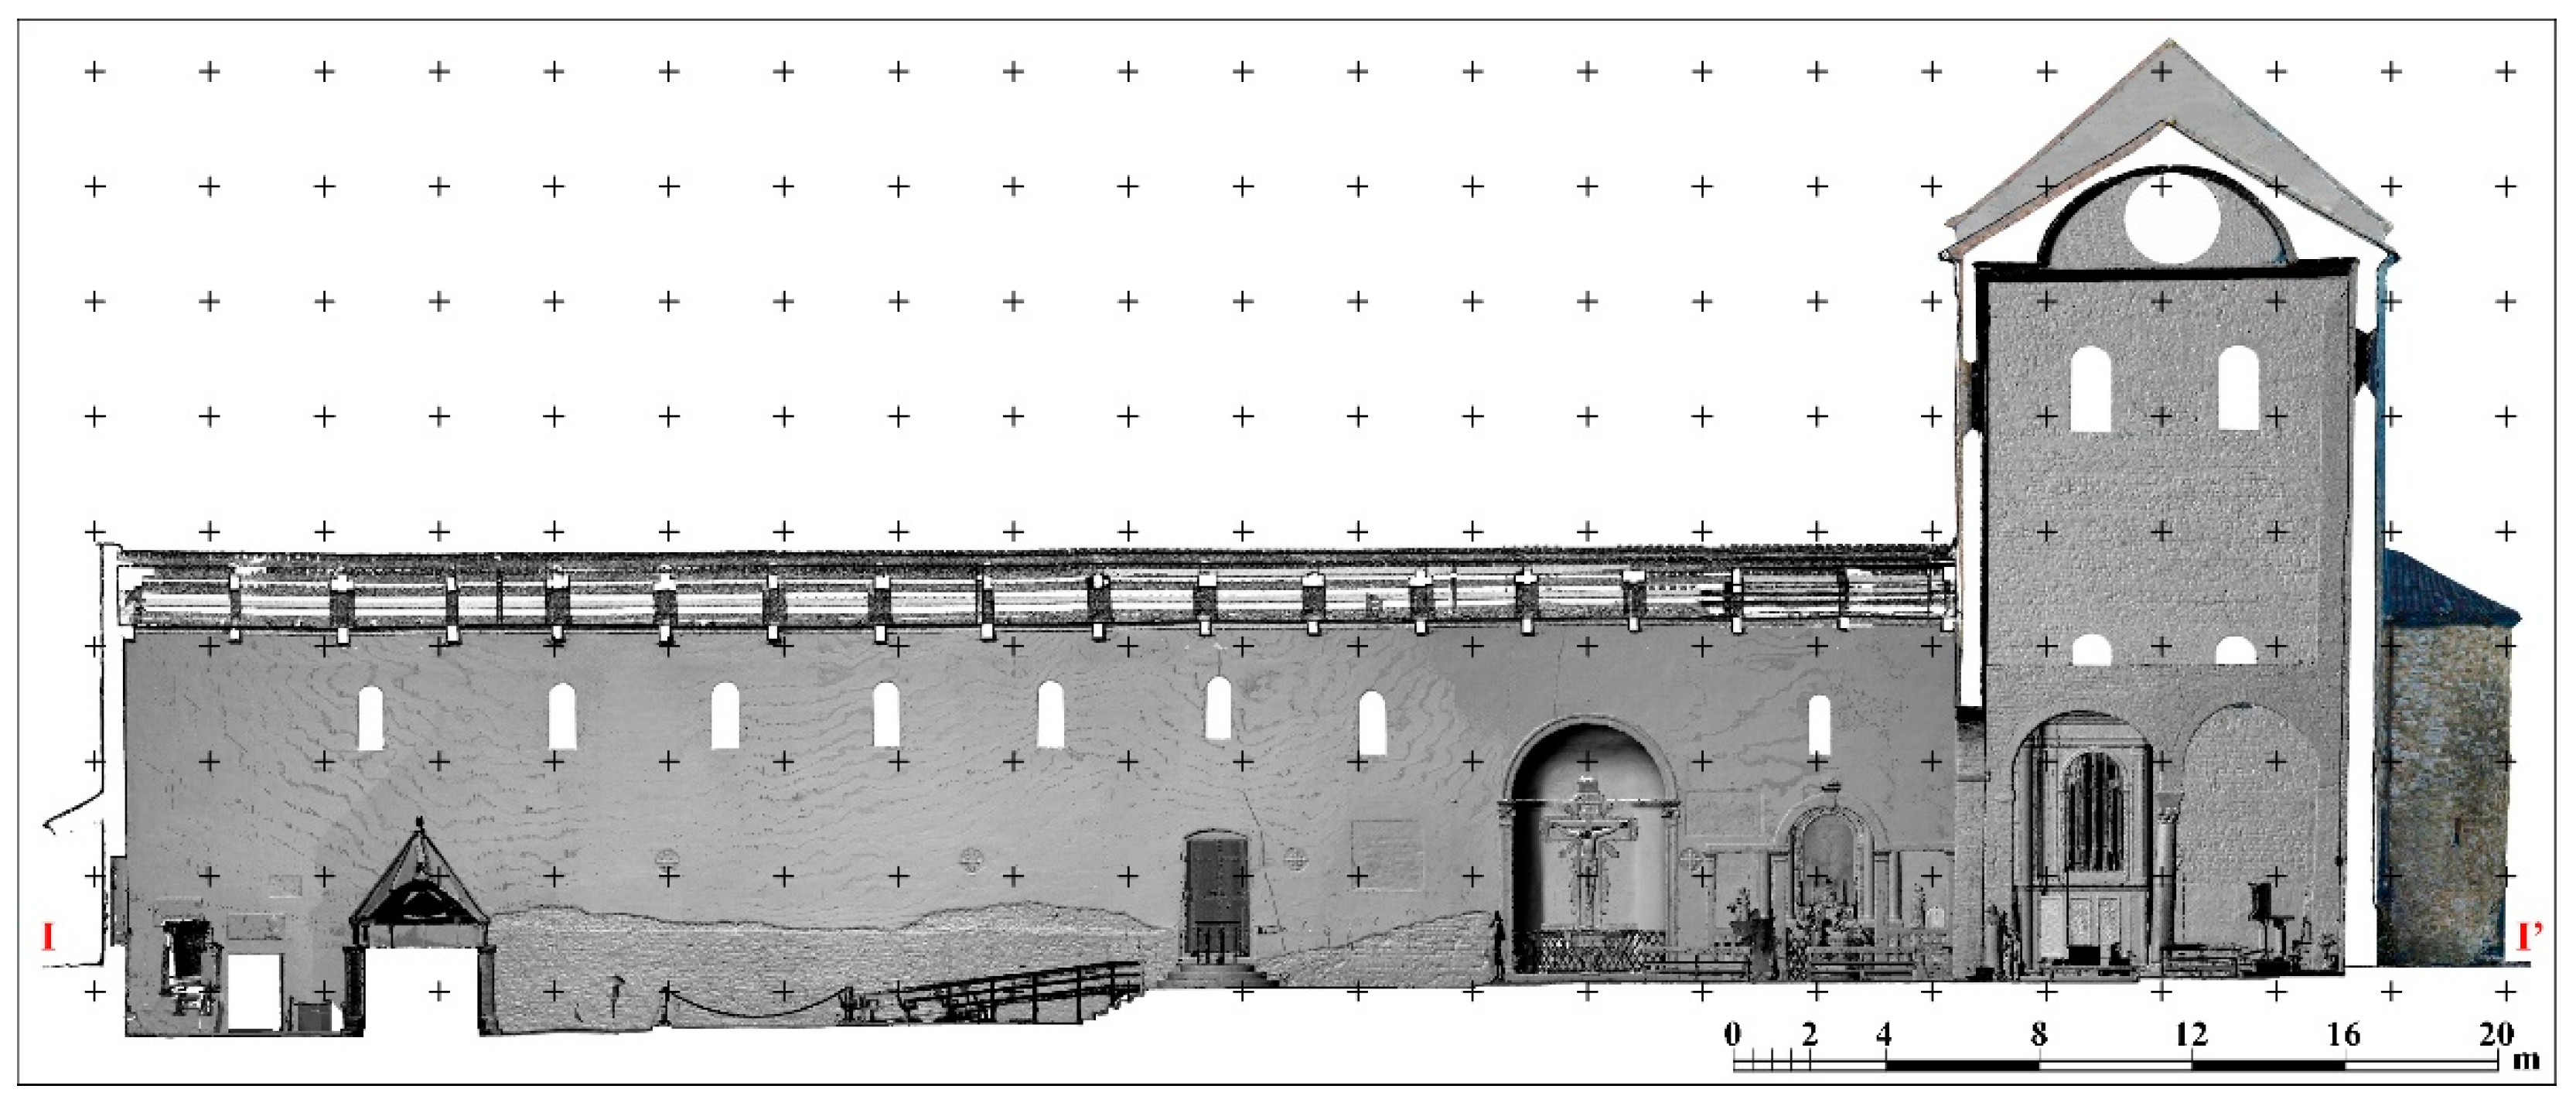
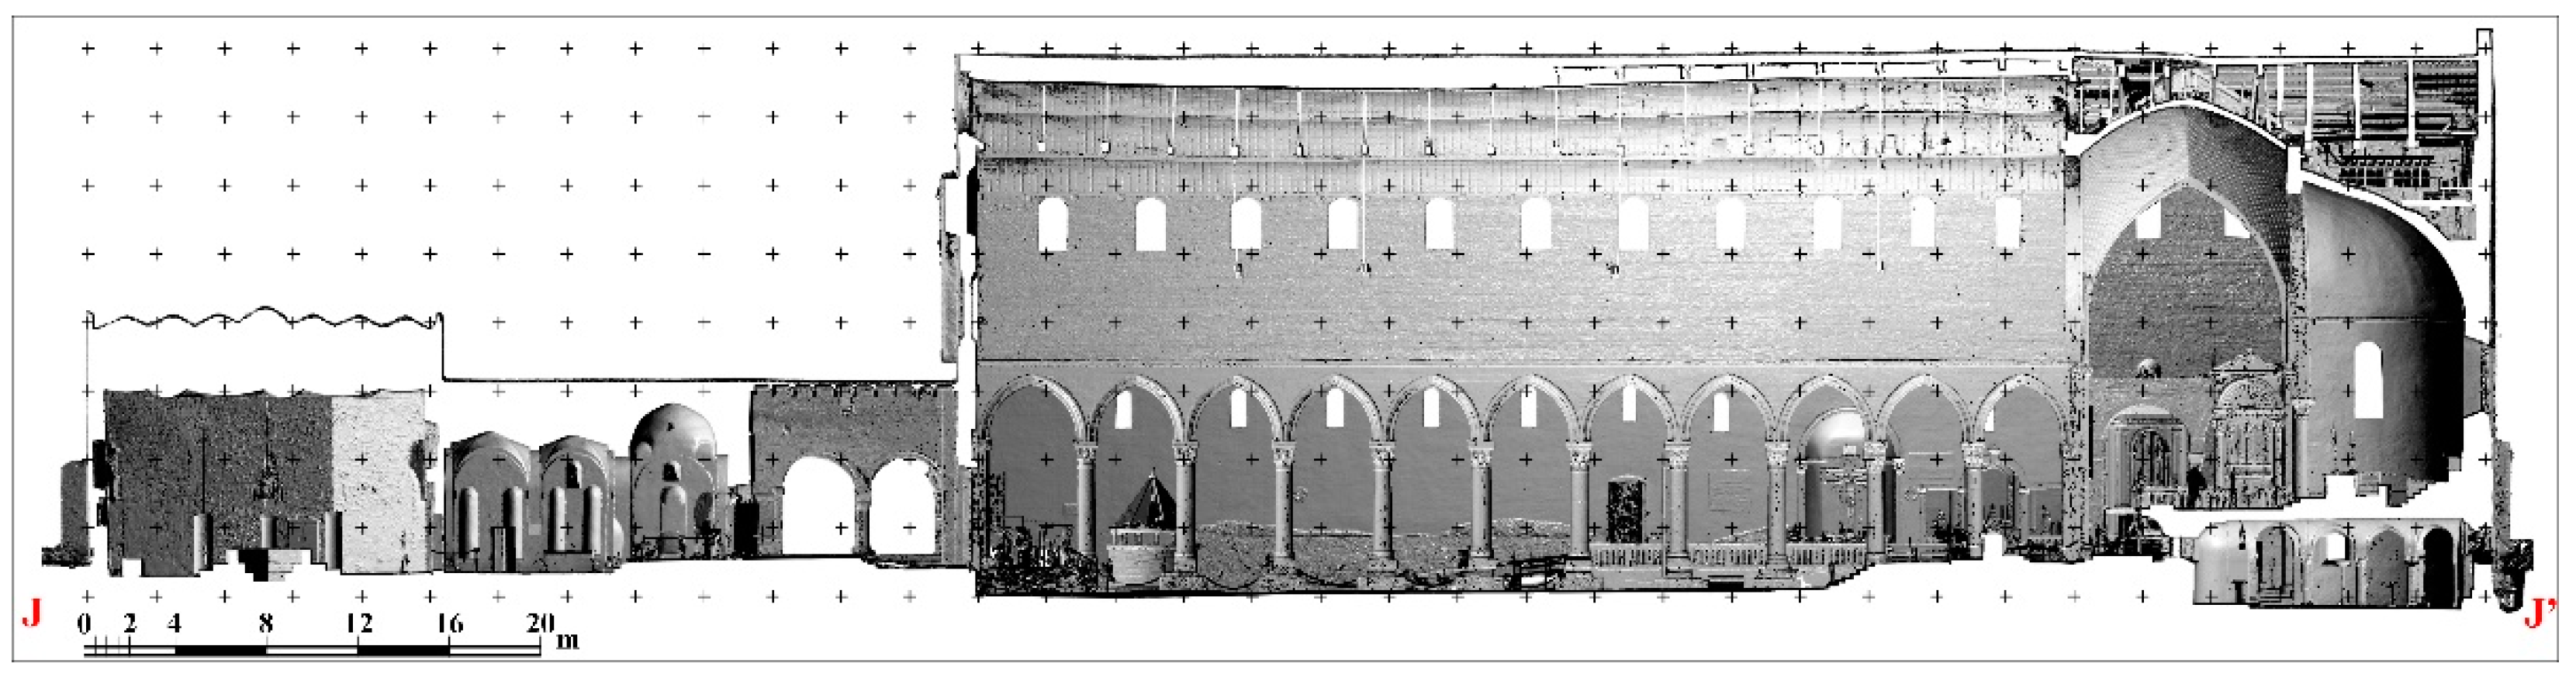
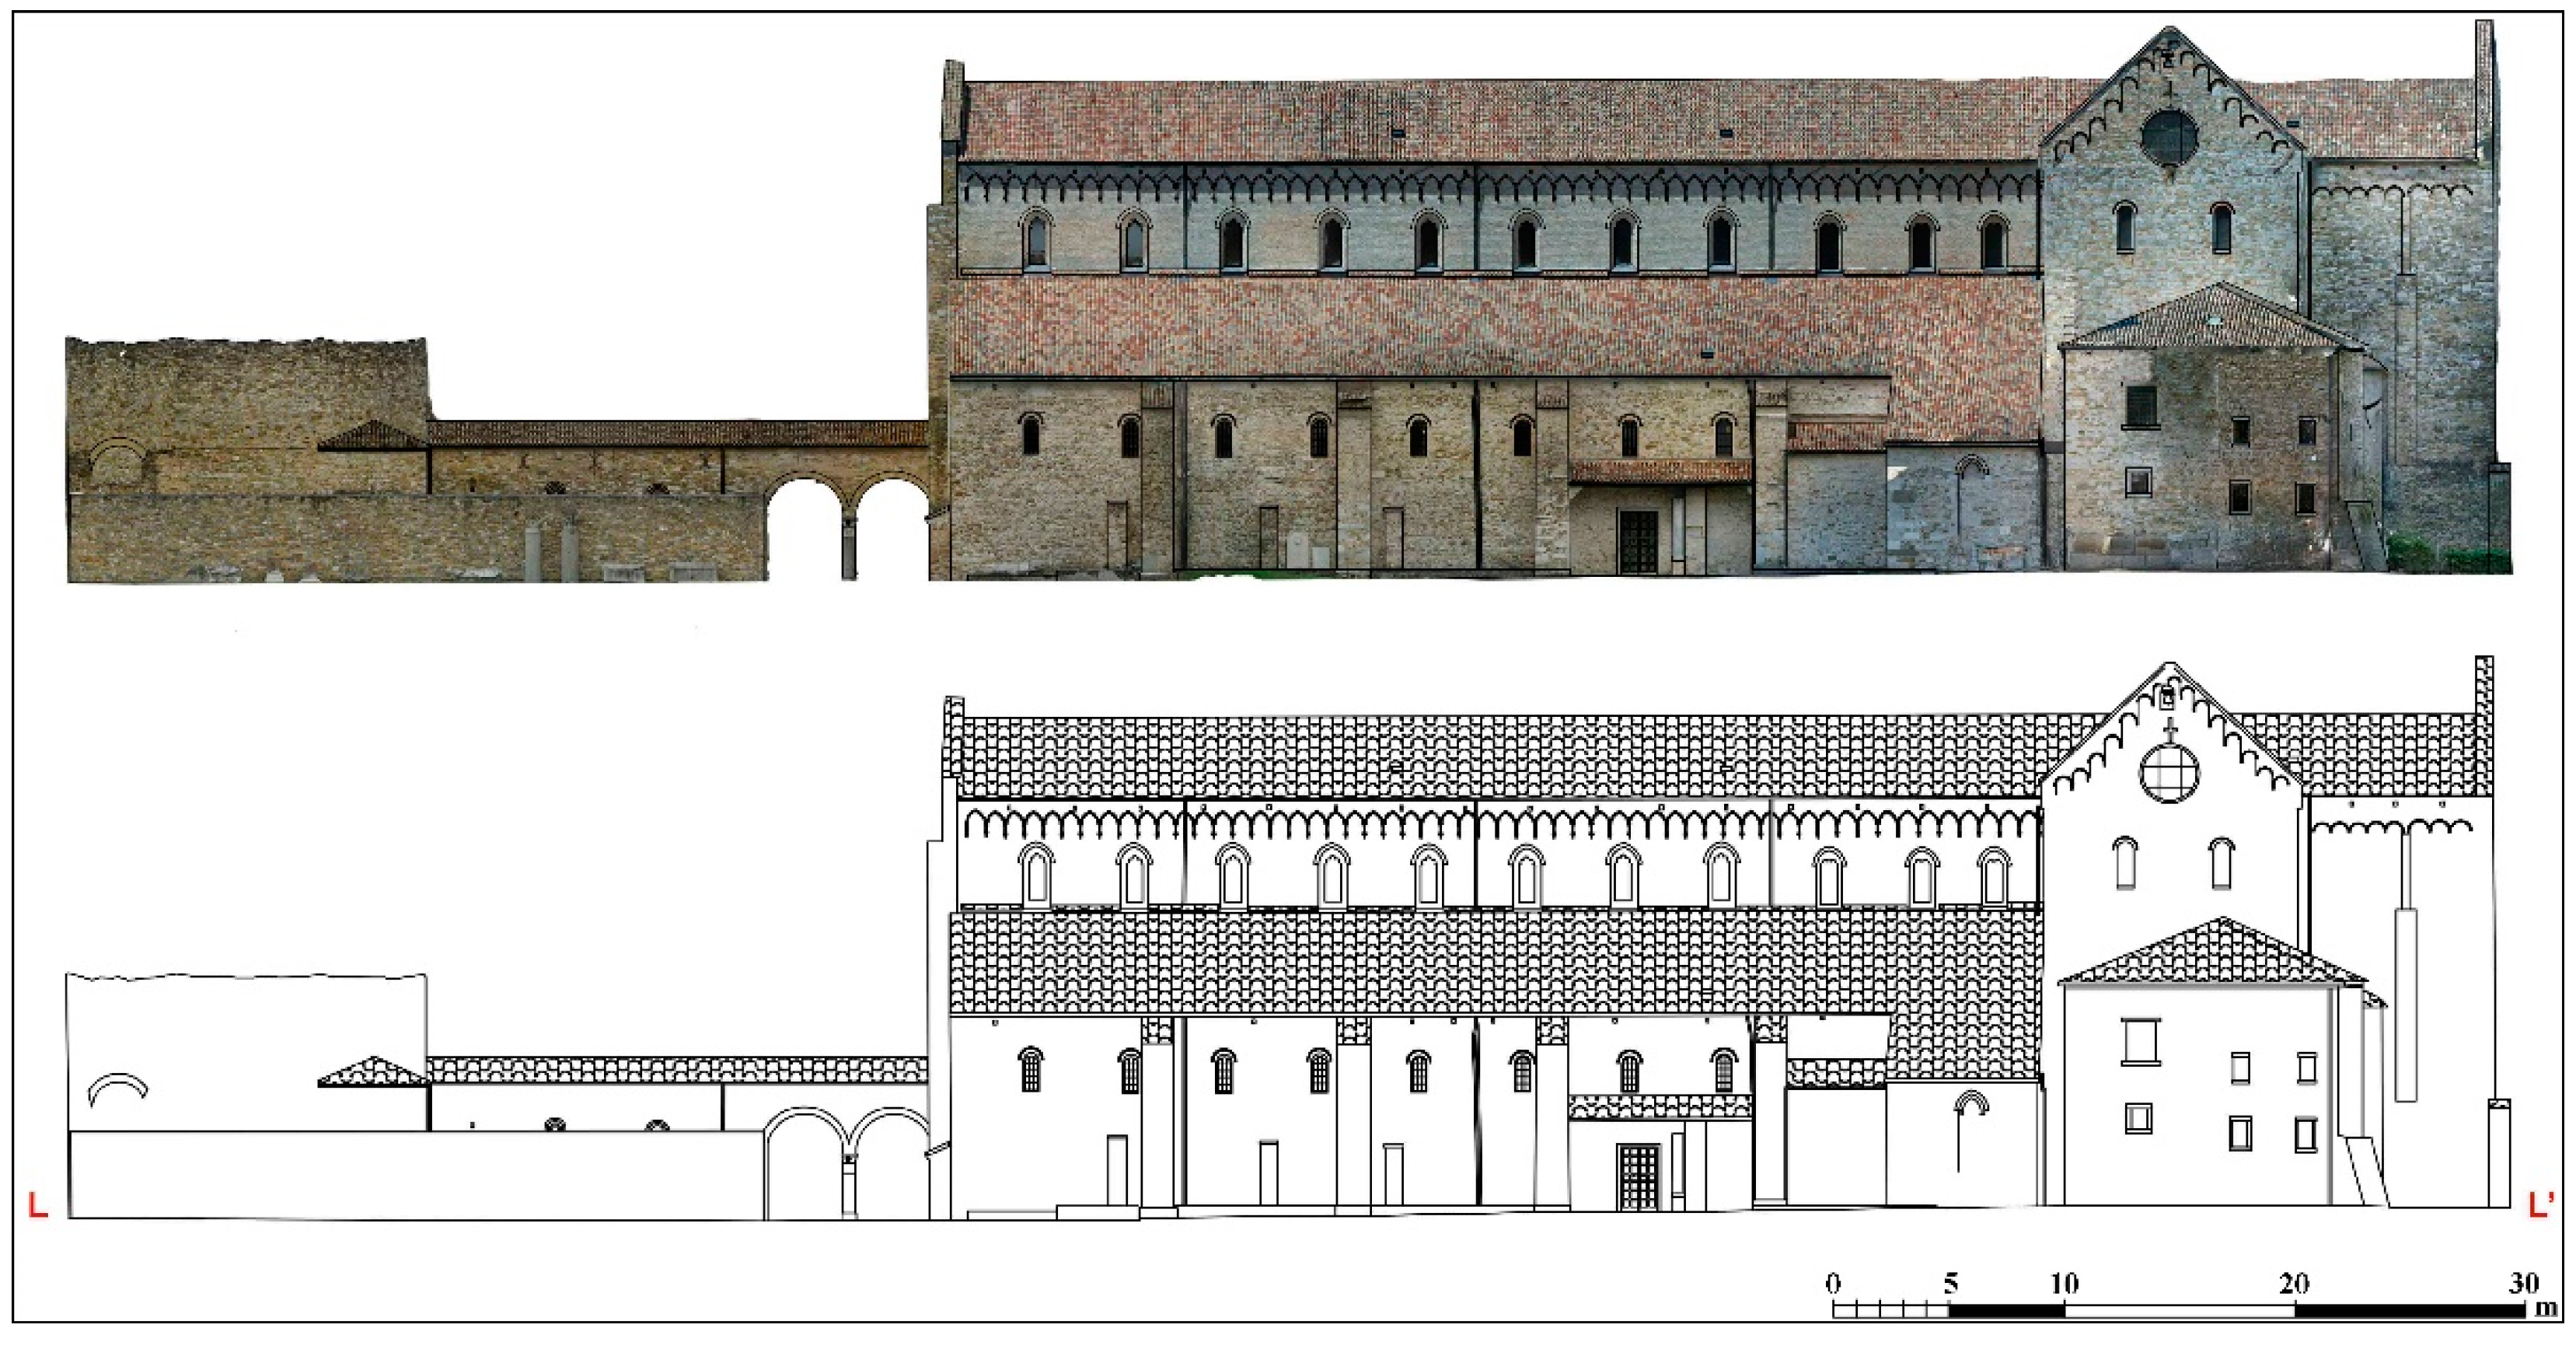
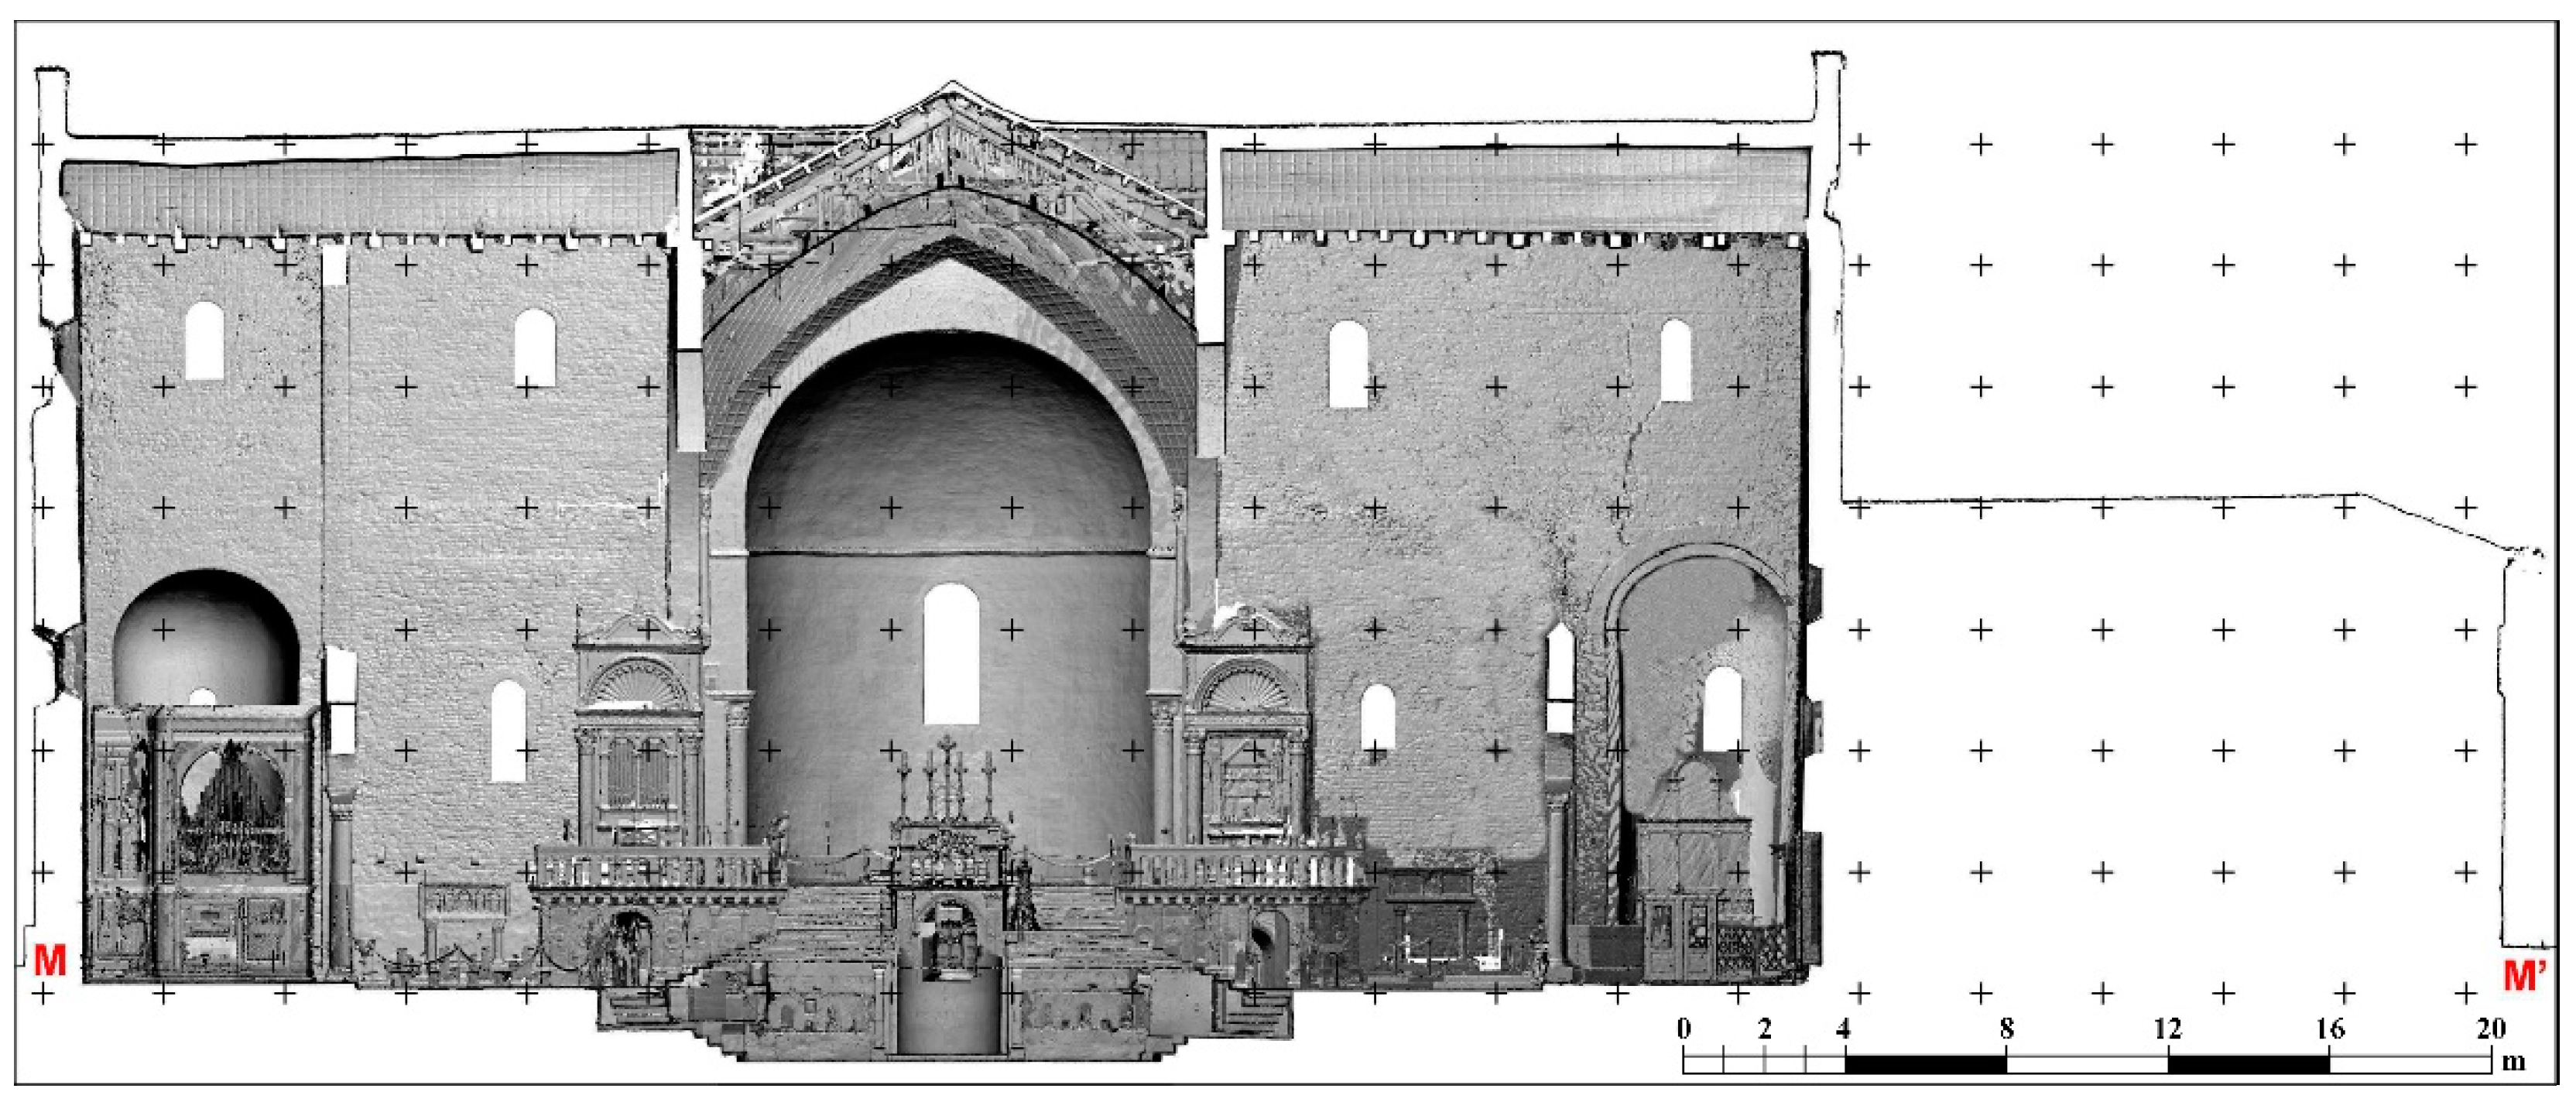
Building the texture: In the last step, color content was applied to the mesh [60]. The texture algorithm allows applying photographic images to the model, thereby obtaining a photorealistic 3D model. Finally, it was possible to generate georeferenced orthophotos, Digital Elevation Models (DEMs) relating to the mosaics, the elevations and the vector representation of the sections (using Cloud Compare software (Paris, France)).

3.1.4. Integrated Data Management
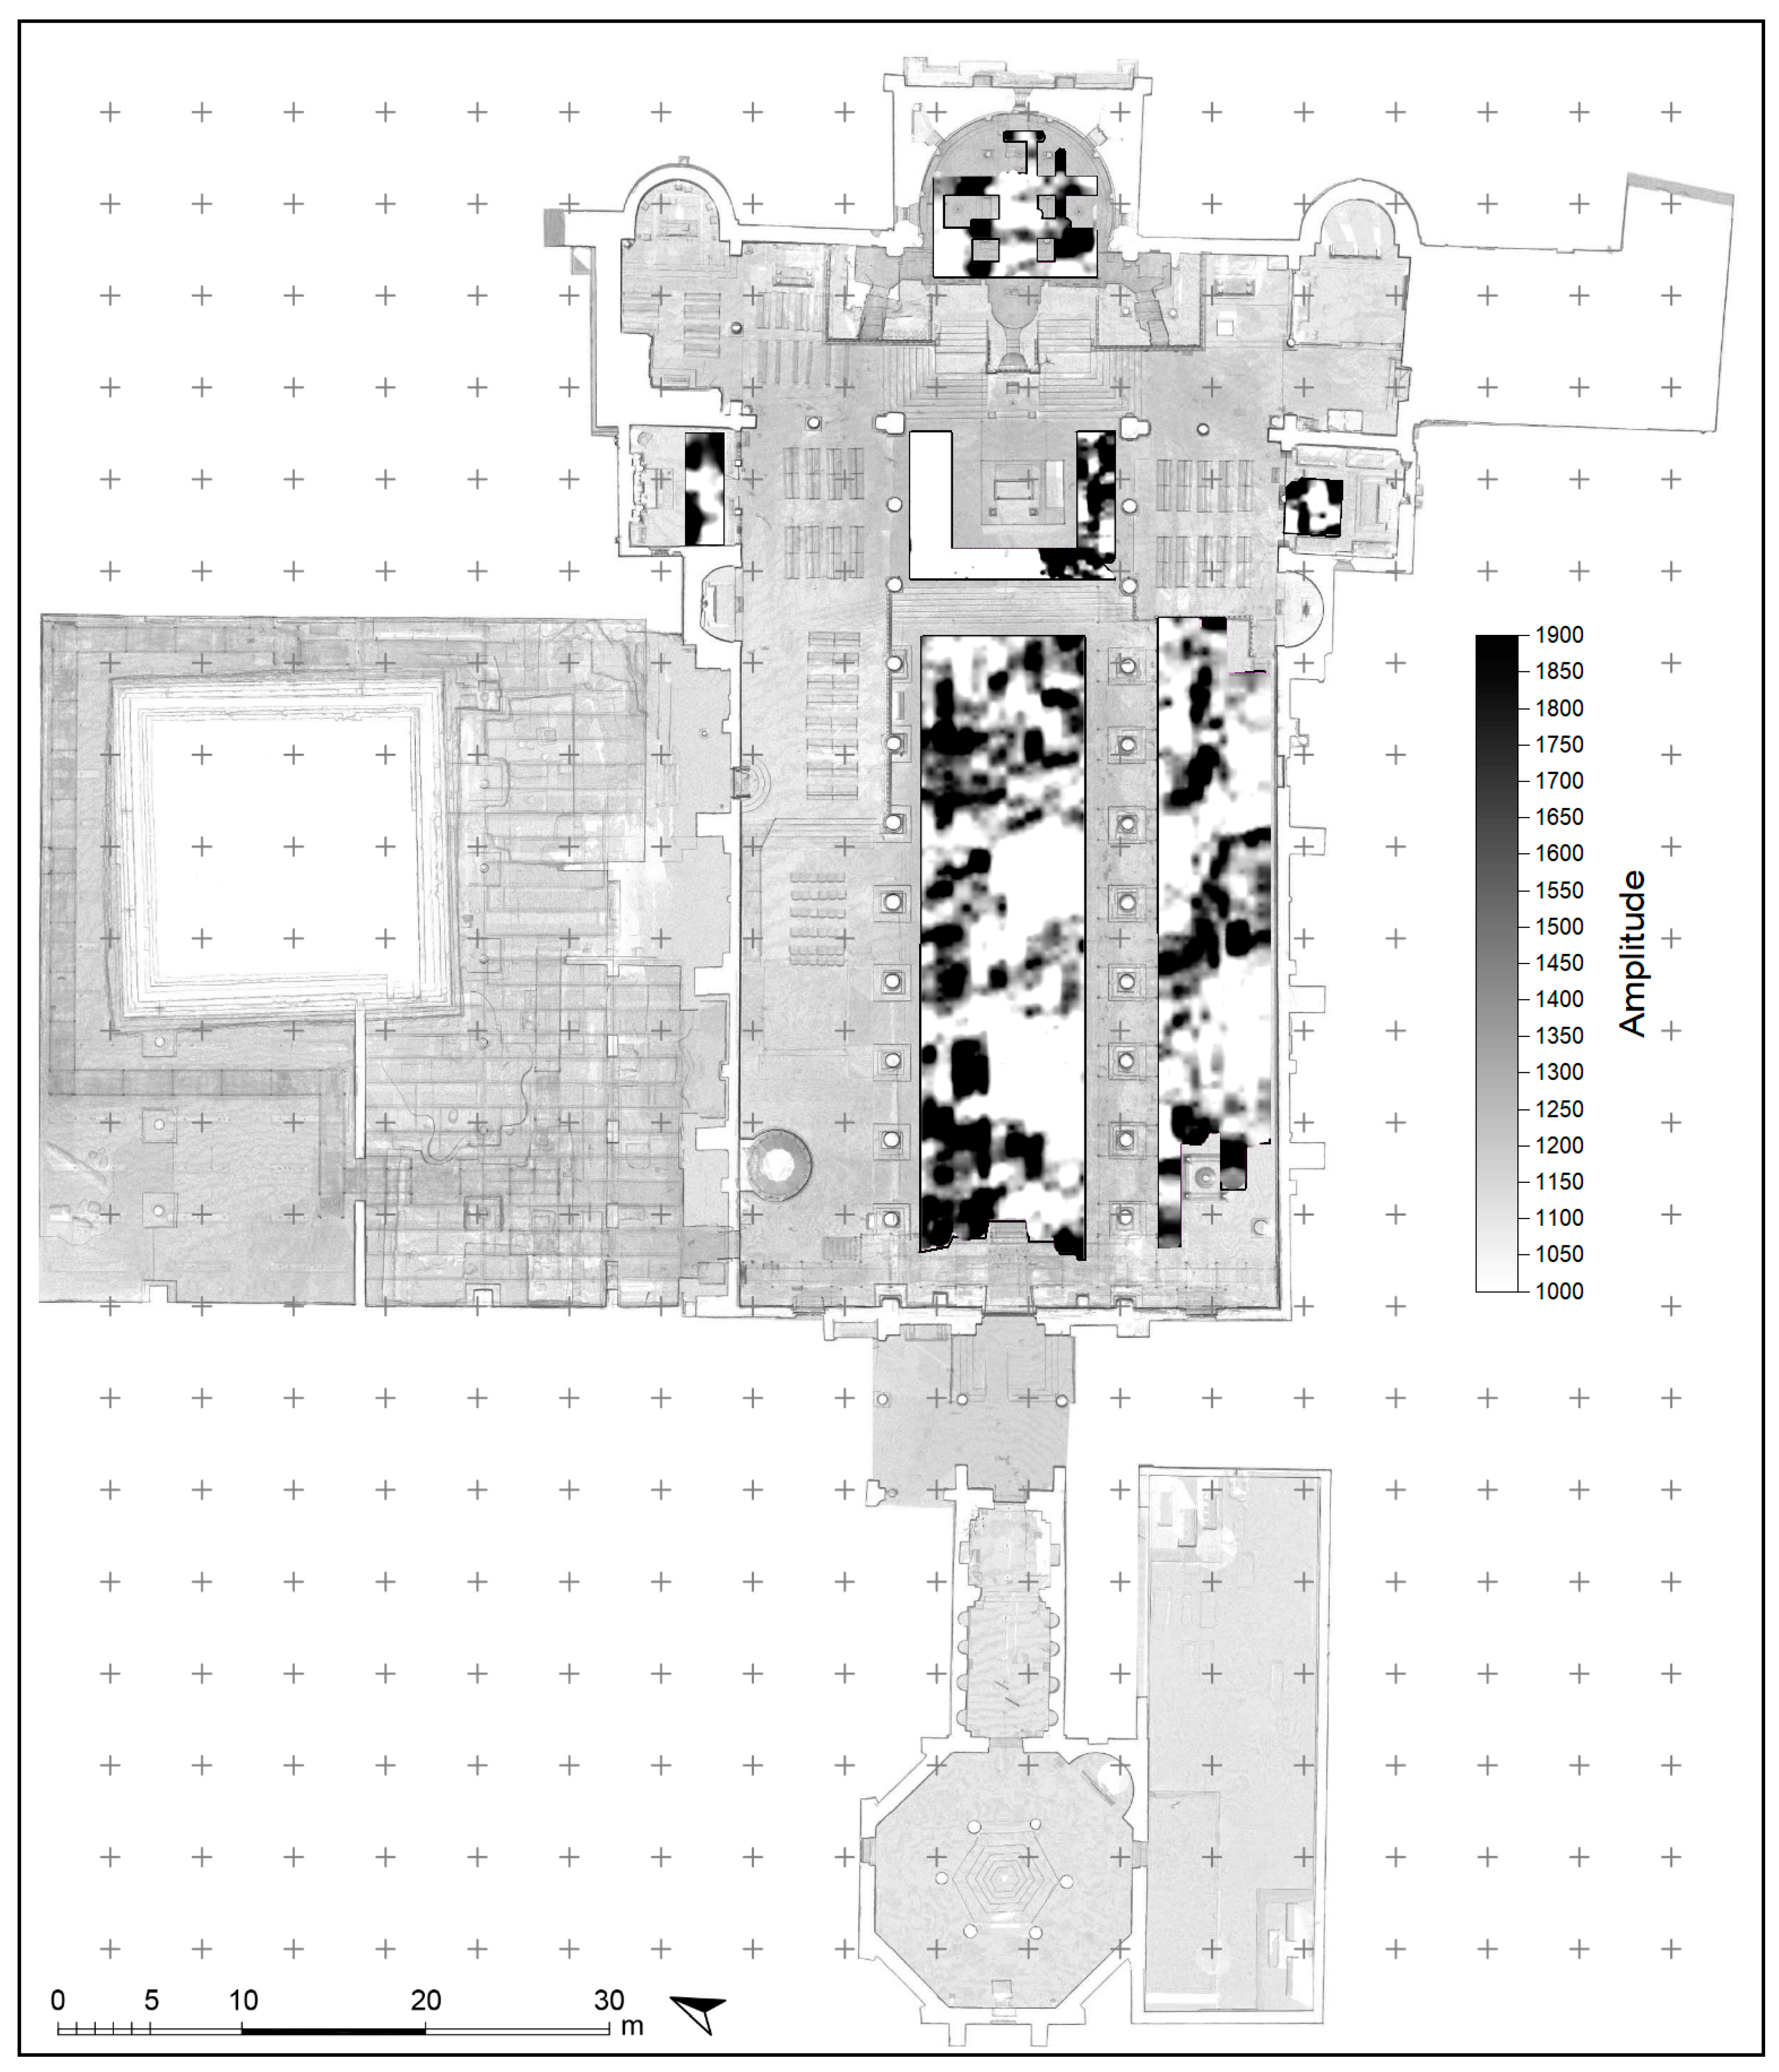
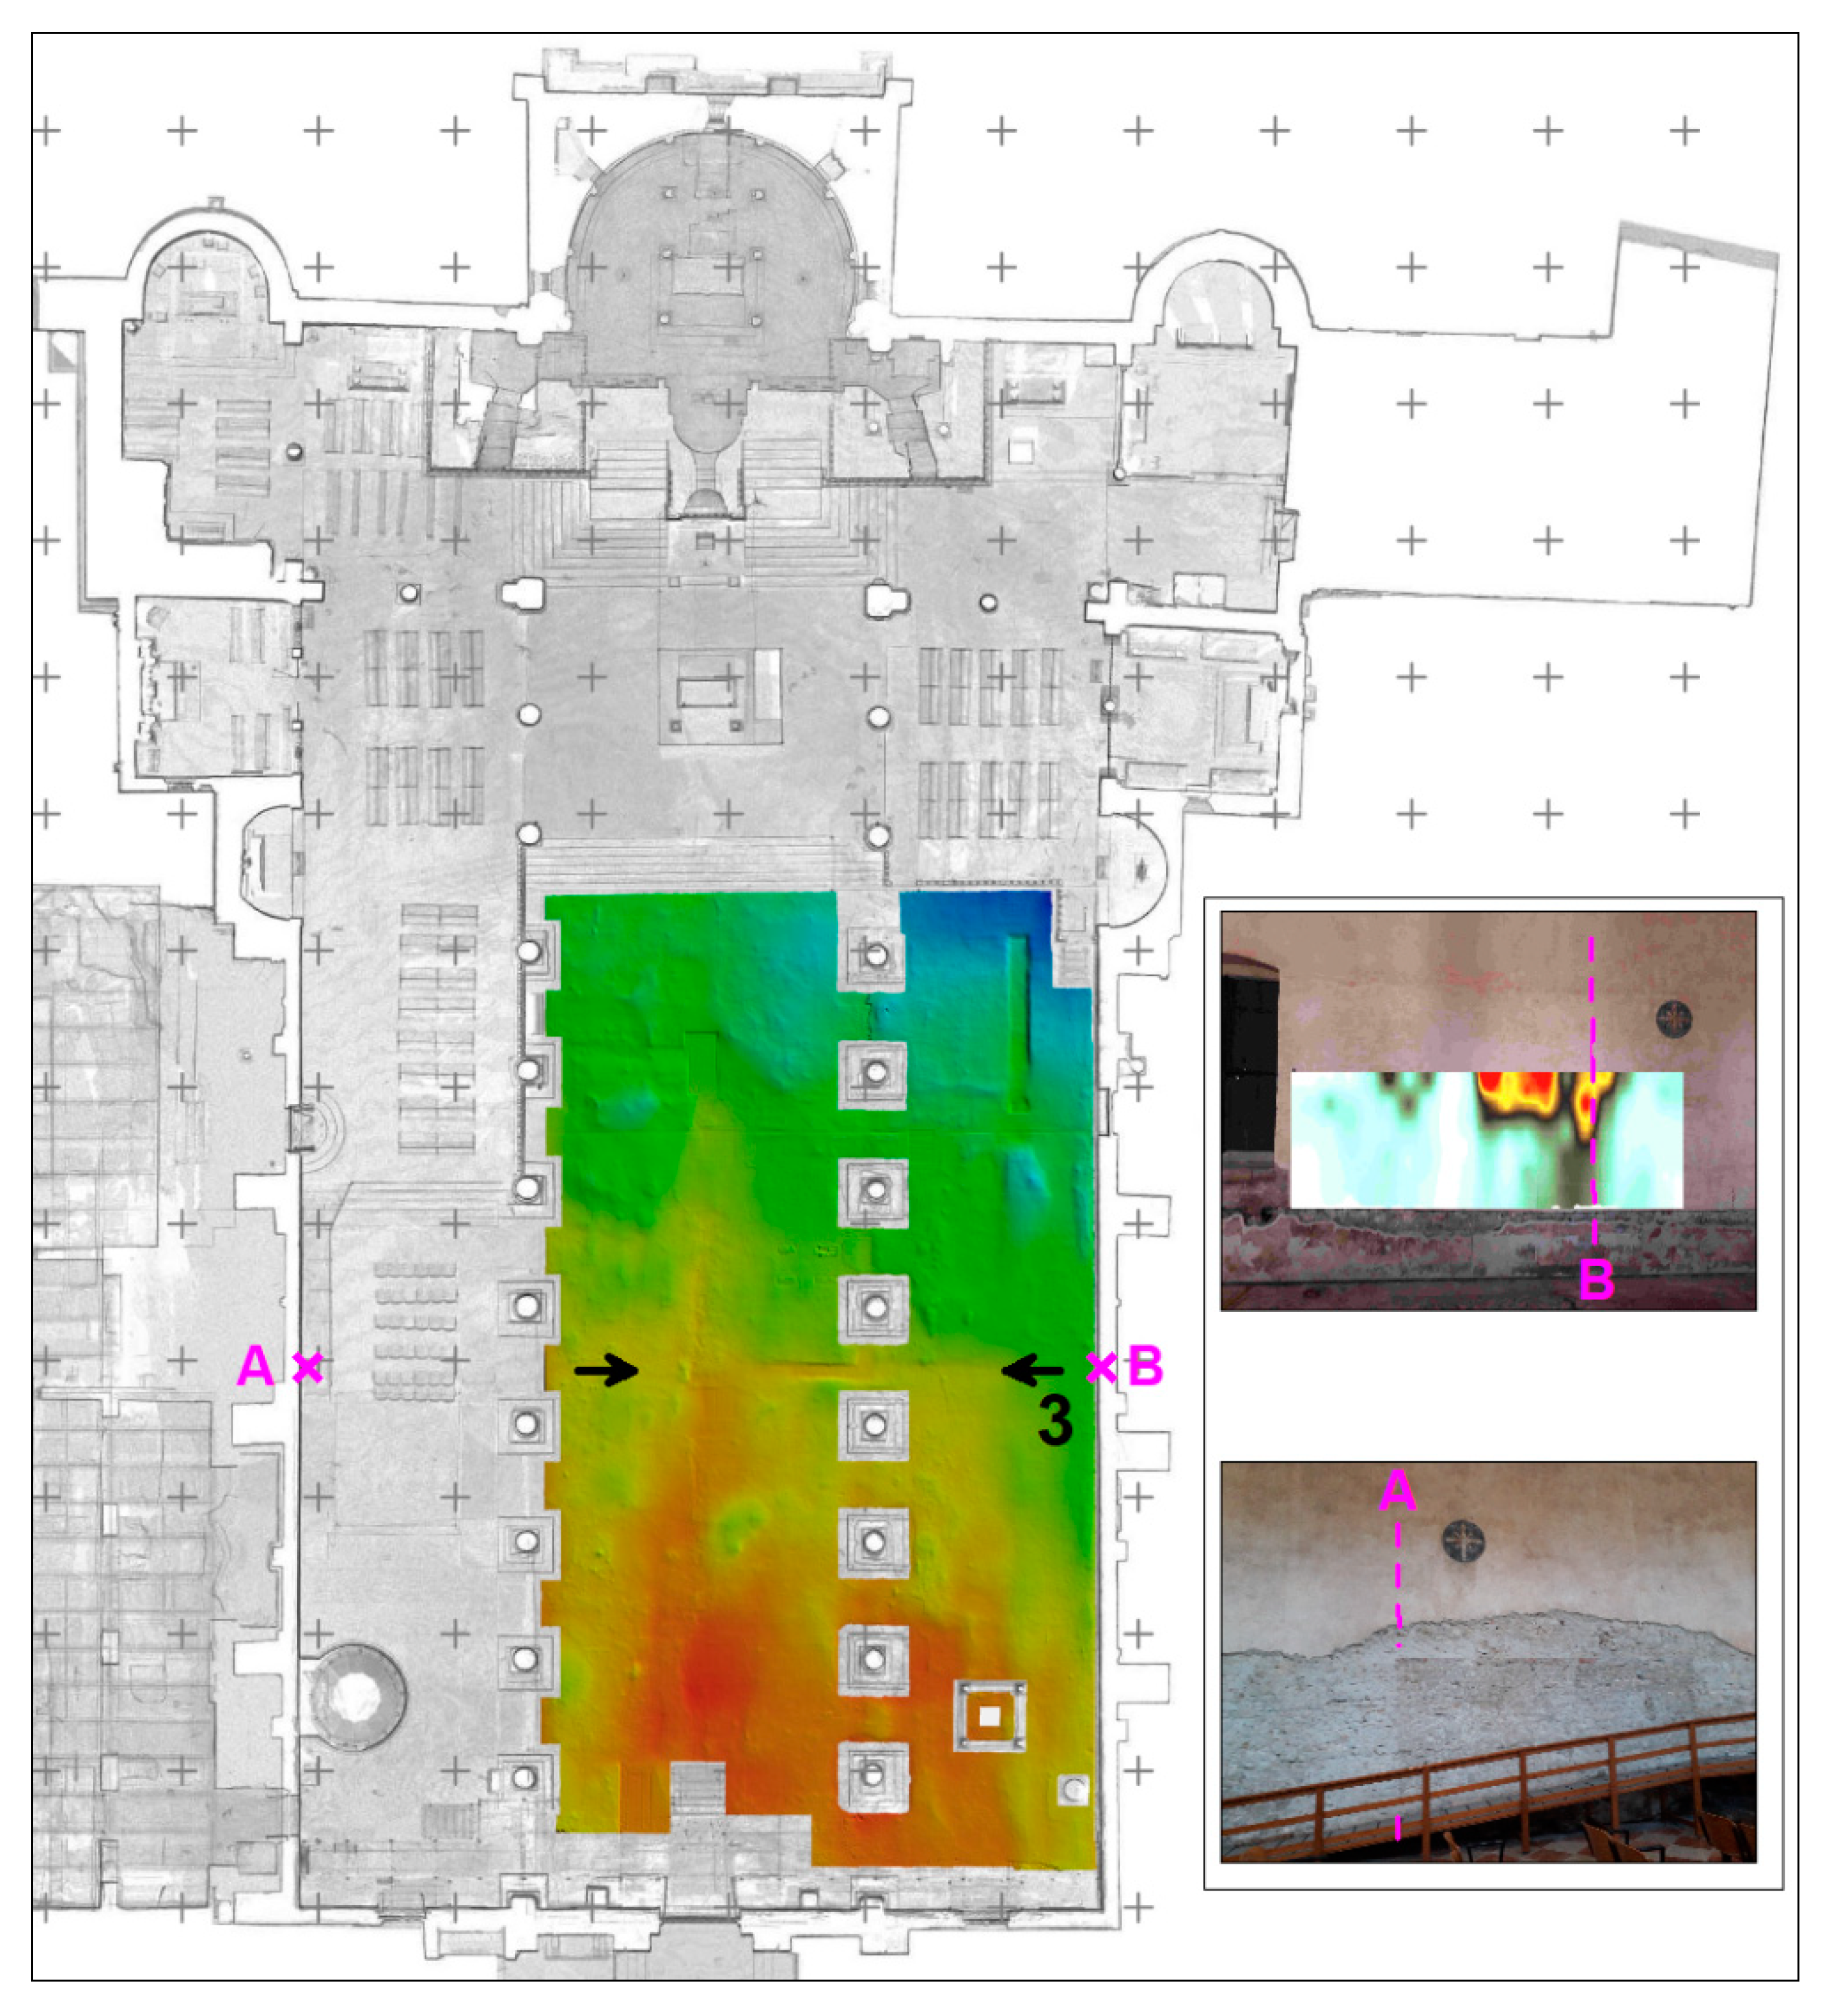
The data acquired by the different systems are heterogeneous data with completely different information, in terms of both resolution and accuracy. Data integration was enabled by different software tools in the various steps related to data processing. In particular, the most delicate step was related to the roto-translation between the different parts of the basilica within a single reference system. Considering the laser and total station data are more accurate depending on the organization of the fieldwork, some point clouds of the laser were oriented with respect to the total station data. On these, all others were recorded with both manual and automatic point recognition systems. From the laser point clouds, second-order points were recorded to integrate data derived from architectural and aerial photogrammetry of the exterior [63]. Differences in resolution between the two systems resulted in increased registration error between the two parts. Cloud Compare software was used to provide a further estimate of the metric quality of the clouds generated between photogrammetric and laser scanner data. By importing the two clouds in Cloud Compare, it is possible to reduce the deviation and compact the clouds using the “Cloud to Cloud” command. The algorithm allows having a statistical estimate (Gauss function), in which a histogram highlights the deviation intervals between the two clouds. The result is obtained by calculating the mean of the deviations and the standard deviation.
Among the various algorithms that were used for the representation of architectural structures, special consideration was given to the X-ray visualization of JRC Reconstructor 3D software (Brescia, Italy). X-ray visualization was used to represent discontinuities of apparent contours and edges of structures (Figure 6). The use of this visualization system allowed overcoming the problem of mesh processing in architectural representation, taking into account that all apparent contours are visualized by the system. In order to distinguish those to be represented from those that should not be displayed, the correct positioning and distance of the cutting plane are crucial. After creating a section plane, it is necessary to associate a reference user coordinate system (UCS) and a projector that will be used to cut the model. Everything that falls inside the section line should be represented; what is outside, on the other hand, should be eliminated. Care must also be taken in setting up the distance of the projector to avoid representing information that is not relevant to the model. The result of this visualization enables the very accurate highlighting of details that mesh surfaces are unable to detect; the point cloud in most cases highlighted architectural moldings and other details that are often difficult to represent very well.

3.2. GPR

GPR is an active electromagnetic method. During data acquisition, the transmitter-receiver antenna is pulled along the surface and signals are sent into the ground. Depending on the features of the material, the radar pulse can be reflected, attenuated, and diffused or totally dissipated. In the case of reflections, the received signal is related to the transmitted signal as a function of the travel velocity [4].
The GPR survey involved the floor mosaic of the southern hall of the Theodorian Church inside the modern basilica, the floors of the crypt and of the lateral chapels, and some portion of walls. The instrumentation used was the IDS RIS-K2 georadar equipped with a TRMF (200–600 MHz) multi-frequency monostatic antenna for the ground survey and a 3 GHz antenna for high-resolution surveys of walls. Radar reflections on each line were recorded as 16-bit data in a time window of 90 ns and 40 ns (respectively, for the 200–600 MHz and 3 GHz antennas), acquiring 512 samples per radar scan at 25 scans per mark (unit/marker, 1). During data acquisition, readings were performed continuously on lines arranged in regular grids. On the floors, the spacing between lines was set to 0.5 m, while on the walls the spacing was 0.1 m. Standard techniques were used during data processing using the IdsGred [64] and GPR−SLICE 7.0 software (Schwerzenbach, Swizzerland) [65], using the following techniques [66]: data editing and conversion, dc-drift removal via bandpass filtering, time-zero correction, background removal in the frequency domain and automatic gaining. Results are presented without converting time in depth as the complexity of layers made it difficult to estimate the velocity of propagation of waves, and thus apply the migration filter.
Finally, radargram profiles taken over a survey grid representing 3D volume data sets were integrated to produce horizontal time slice maps in order to connect anomalies from closely spaced profiles. Time slice maps aid in the interpretation of archaeological data by effectively showing the size, shape, location and depth of buried targets. In each time slice map based on each individual grid, the relative normalization will display the own maximum and minimum grid values. Depending on the color table assumed, the strongest reflector and weakest reflector will be emphasized. In this work, a gray scale was used to avoid misinterpreting ghost features at the boundaries between two colors.

4. Results and Discussion

The 3D scan and the aerial and terrestrial photogrammetric survey allowed the creation of a 3D model of the interior and exterior of the basilica, the baptistery and the bell tower made up of approximately 386,733,987 million points (Figure 7). The enormous complexity of the basilica makes it impossible, from both a technical and a principal point of view, to represent an exhaustive set of every single architectural aspect of the monument. In this perspective, only some of the potential graphic representations that can be extracted from the analysis of the three-dimensional model obtained from the survey activities of the monument and its appurtenances are presented. In general, from a preliminary analysis, it was possible to define some constructive aspects, analyze the main components and define the main structural criticalities of the basilica.
Figure 8 shows the horizontal section of the architectural complex extrapolated to the height shown in the lower left box of about one meter from the floor of the central nave. Since it is an X-ray view, it allows viewing everything below the section including the underground excavations of the northern hall of the Theodorian Church and the crypt, as well as the plan of the bell tower, the baptistery and the modern church. It represents a significant advance in the documentation previously available in terms of accuracy, detail and precision, and provides evidence of some considerable irregularities. In the figure, a grid has been superimposed on the plan in order to visually evaluate, for each cell, the presence of corners of the walls that are not entirely regular.
The Basilica of Aquileia today is the result of an intricate interweaving of overlapping elements placed in different time intervals. A complete analysis of each historical construction phase is not the objective of this work, which instead aims to highlight critical elements that could make the current structure vulnerable and endanger the conservation of the site and the safety of the many users who visit it daily.
The plan of the modern church shows a structure with three naves with an unusual width of the lateral naves certainly due to the need to place walls and columns on old foundations [33]. In fact, the three naves have a greater width on the side of the entrance (left nave 7.19 m, central nave 10.80 m, right nave 7.13 m) which tends to narrow towards the apse by about 0.10 m (left nave 7.17 m, central nave 10.68 m, right nave 7.09 m). Two rows of 10 columns support 11 arches and separate the 3 naves. A large central portal flanked by two small side doors guarantees the access. Two other openings open at the level of the seventh arch and are slightly asymmetrical. This area does not show particular irregularities in the geometry, while the easternmost part has evident differences. The two small apsidal niches just before the altar are not perfectly aligned and symmetrical with respect to the center of the nave. The body, composed of the altar, two side chapels, the transept, the apse and the sacristy (the room to the right of the altar), is rotated about −3° towards the right side of the church. Furthermore, in this sector the non-perpendicularity of the walls can be observed, which is, for example, very evident in the Sant’Ambrogio Chapel (to the right of the ship). Externally, the absence of symmetry of the external buttresses is noted. The baptistery and the rooms connected to it are not perfectly aligned with the church but they too are slightly rotated towards the right side of the complex. The bell tower does not appear quadrangular and it is not parallel to the basilica, but it is rotated about 2°.
Figure 8 also indicates the location of a selection of sections and side elevations presented below. The bell tower has construction irregularities that make it visibly distorted (Figure 9). It is 69.95 m high, 11.50 m wide at the base, and tapers off in elevation where, at the level of the upper limit of the bell cell, it reaches a width of 10.70 m. Although poles reinforced its foundations, in the Middle Ages there were already problems of statics which led to a necessary strengthening of the base with a large supplementary stepped plinth [44]. Today the tower is divided into five blocks, distinguishable by shaped horizontal bands, an octagonal lantern in simple masonry and a conical brick roof. The first basal block probably represents the only element dating back to the first construction phase, which took place in the period of the reign of Poppo, between 940 and 1060 [50]. It is stylistically different from the others; the surfaces are smooth and leveled and are decorated in the corners by pilasters 1.15 m wide. The entrance, which was at ground level in the first phase of construction, is located on the southern side at a height of 5.37 m (with respect to the walking surface) and is accessed by an external staircase together with the stepped reinforcement plinth [44,50]. The deformations highlighted by the survey are of a constructive nature due to the numerous interventions that have been carried out over time. In detail, a slope of the main body from bottom to top in a north–south direction of 2° appears (see sections AA’–CC’ and EE’–GG’) and in an east–west direction of 1° (see sections BB’–DD’ and FF’–HH)’. Furthermore, the bell cell, reconstructed in modern times with its arches, the octagonal lantern and the conical brick roof are not centered with respect to the center of gravity of the bell tower. They are shifted in a southwest direction, but straight with respect to an ideal line perpendicular to the horizontal plane, as if to balance the distortion of the shaft. The internal staircase is located in the northwest corner of the tower. It has a spiral structure and is lit by small slit windows. The openings are distributed irregularly, arranged in two crooked rows on elevations BB’ and DD’ and in a single row on elevations AA’ and CC’. The riser of the steps is lower at the base of the bell tower and, vice versa, higher at the top. This generates more twist as the bells are reached. The shaft of the staircase follows the general inclination of the structure.
Analyzing Figure 10, Figure 11, Figure 12, Figure 13, Figure 14 and Figure 15 (vertical side elevations (I–N) in the positions indicated in Figure 8), it is possible to notice that some walls are not perfectly perpendicular to the horizontal support plane. In particular, the entrance facade and the external wall of the right transept show an inclination of about 1° outwards. The column of the left transept (vertical side elevation I-I, Figure 10) is inclined about 2° towards the apse. By comparison, the right transept column is straight (vertical side elevation K-K’, Figure 12). The vaulted ceiling of the central nave and the ceiling of the left transept have a considerable depression in the central portion, of approximately 0.5 m and 0.15 m, respectively, at the maximum point (Figure 11). The most consistent fractures affect the central part of the left nave (Figure 10), the internal part of the main facade (Figure 15) and the walls of the transepts (Figure 14). The fractures develop vertically; no horizontal fractures are documented. The survey of these critical issues represents a current state of the art and can be used for monitoring of millimeter deviations over time. As anticipated, because of targeted inspections, according to the needs of future activities, similar representations can be obtained in the most suitable formats. All this information is contained in the acquired data set.
Figure 16 and Figure 17 show some drawings related to the crypt. In particular, a reflectance visualization (Figure 16b) and a mirrored visualization (Figure 16c) of the 3D model are reproduced, a survey detail that has not been previously realized. Figure 17c represents an orthophoto of the vaulted ceiling. The crypt, probably the oldest part of the basilica, is not perfectly centered with respect to the body of the basilica. The plan highlights the construction of a semicircular apse, enlarged towards the west until it assumes a U shape, included in an external quadrangular structure. The access to the room is via two openings on the sides of the presbytery on the western side where there is a small niche in the center. The vaulted ceiling, enriched by frescoes dating back to the 12th century illustrating the legend of the evangelist Marco, is supported by six columns.
The DEM of the mosaic surfaces of the crypt of the excavations, the main basilica and the Süd-Halle shows some irregularities, which suggest the presence of underground and very shallow archaeological structures (Figure 18). The DEM was generated based on the dense cloud. This option was preferred to the mesh model, as it provides results that are more accurate and allows for faster processing, since the mesh generation step can be skipped. A pixel size of 2.25 mm/pix was chosen according to the average ground sampling resolution of the original images.
In detail, in the crypt of the excavations (A in Figure 18), a variation in elevation of 71.8 cm was registered. While the mosaic around the tower is placed at a lower level of the whole scale in the range between −61.8 cm and −31.5 cm, the western one has higher elevations (in the range between −31.5 cm and 10 cm). In addition, we note a rectilinear convex anomaly (1 in Figure 18), parallel to the portion of the wall in the light on the right of the image (dashed black in Figure 18) and a concave rectangular anomaly (2 in Figure 18). The latter has dimensions compatible with a burial. The presence of buried structures probably prevented the manufacturers of the mosaics from laying a homogeneous mosaic on the ground with respect to the altitude, or conditioned the subsidence of the deposits over the years, opposing resistance to the lowering of the floor compared to areas without archaeological remains.
In the Süd-Halle (B in Figure 18), the DEM shows overall variations of about 48 cm. It clearly highlights already known discrepancies due to the presence of eleven tombs that cut through the mosaic which materialize with depressions in the model and the absence of mosaic tiles (medium elevations). The highest altitudes are recorded in the points where the mosaic is preserved.
The analysis of the DEM of the floor mosaic of the basilica (C in Figure 18) also shows the distribution of irregularities attributable to older structures present below the current surface. In detail, the surface of the mosaic is not perfectly flat and a difference in height of about 0.67 m was found between the highest points (towards the entrance to the basilica, n. 7 in Figure 18) and the lowest points (near the altar). In the DEM, four buried walls clearly emerge (numbers 4–6, indicated with black arrows in Figure 18). These deformations are arranged in a regular manner forming an orthogonal grid in synchrony with the most ancient archaeological structures found on the site, allowing us to imagine the delineation of very large chambers. At the point indicated with the n. 7, even if the dividing walls are not clearly highlighted, the area with the greatest elevation has regular outlines.
The GPR results confirm the presence of buried structures, even if they are not perfectly comparable to the surface DEM as they relate to different subsoil portions (Figure 19). The GPR map shows an articulated distribution of amplitude maxima of the electromagnetic signal, which seem to define regular rooms, with trends perfectly in line with the current building. In the crypt of the frescoes, on the altar in the right portion, in the two chapels and in the easternmost potion of the central and southern nave, the maxima of amplitude are clear and not very thick. Conversely, at the entrance to the basilica in the investigated western part, the anomalous zones describe highly disturbed regions. From the comparison with the DEM (Figure 20), these areas fall within the zone indicated with n. 7. The four elements mentioned in DEM shallow analysis (nn. 3–6) are partially connected to the GPR anomalies in depth, supporting the hypothesis of the presence of walls. In addition, the wall section n. 3 seems to join up with the point where an abrupt variation in the wall stratigraphy is noted on the wall of the left aisle and, at the specular point on the right aisle, the GPR results show a probable similar variation in the wall texture (Figure 21).

5. Conclusions

In this paper, the issues related to the status quo of a huge and complex heritage building, such as the Patriarchal Basilica of Santa Maria Assunta in Aquileia, were investigated in an organic and exhaustive way, validating standard methodological workflows. Surveying was not an easy task. The data acquisition, integrated processing and interpretation of the results required a large amount of work and high precision at every stage. The final product was the acquisition of detailed documentation, which was previously non-existent or approximate, and is useful as a starting point for planning reliable assessments of the seismic vulnerability, renovation and conservation of heritage buildings.
The integration of TLS and aerial and terrestrial photogrammetry allowed a complete geometric survey of the construction, defining with high precision the plano-altimetric characteristics of all the masonry elements. In the absence of previous documentation, it was possible to identify the position and dimensions of beams, pillars, stairs and partitions, and roof slabs, determining their type and vertical section. Some construction anomalies were detected in the structure, as highlighted in the bell tower, and some weaknesses were identified in the ceilings of the naves and in the walls of the entrance and transept. The crack pattern was also evaluated by classifying the lesions from a geometric point of view (extension and width). In addition, detailed representations, which were not previously elaborated, were produced for some environments. The integrated analysis of GPR and DEM results led to hypothesizing about the presence of buried structures belonging to the oldest construction phases under the investigated floors.
For the sake of brevity, only a part of the possible graphical representations was presented here. Although these observations may be regrettable considering the age of the structure and its many construction phases superimposed over time, the data obtained are new and useful for continuing the analysis and restoration processes. Following the Italian legislation on seismic vulnerability, this work will be useful for designers and engineers to identify the constituent elements of the resistant body, placing particular attention on the construction techniques, the construction details and the connections between the elements. Furthermore, starting from a visual survey to the programming of further destructive and non-destructive tests, it will represent the basis for the exact identification of the materials by evaluating both the level of degradation and the mechanical properties. The well-known construction path of the artefact and the changes it has undergone over time, together with the results obtained, will help to identify the possible areas of discontinuity of the material and guide the structural analysis using numerical models.

Author Contributions

Conceptualization, A.A., M.C., R.G., V.G. and P.M.; methodology, A.A., M.C., R.G., V.G. and P.M.; investigation, A.A., M.C., R.G., V.G. and P.M.; data curation, A.A., M.C., R.G., V.G. and P.M.; writing—original draft preparation, A.A., M.C., R.G., V.G. and P.M.; writing—review and editing, A.A., M.C., R.G., V.G. and P.M.; project administration, P.M.; funding acquisition, P.M. All authors have read and agreed to the published version of the manuscript.

Funding

This research was funded by SUPERINTENDENCE OF ARCHEOLOGY, ARTS AND LANDSCAPE OF FRIULI VENEZIA GIULIA (Funding number: CUP F37E18000180001, CIG Z3C3151094) and the APC was funded by UNIVERSITY OF MOLISE (Paolo Mauriello, Project Responsible for University of Molise).

Data Availability Statement

Data can be requested from the authors.

Acknowledgments

We are very thankful to Simonetta Bonomi, Head of the Superintendence of Archeology, Arts and Landscape of Friuli Venezia Giulia for involving us in this important project.

Conflicts of Interest

The authors declare no conflict of interest.

References

  1. El-Hakim, S.F.; Beraldin, J.A.; Picard, M.; Vettore, A. Effective 3D modeling of heritage sites. In Proceedings of the Fourth International Conference on 3-D Digital Imaging and Modeling, Banff, AB, Canada, 6–10 October 2003; pp. 302–309. [Google Scholar]
  2. Stojaković, V.; Tepavcevic, B. Optimal Methodes For 3D modeling of devastated architectural objects. In Proceedings of the 3rd ISPRS International Workshop 3D-ARCH, Trento, Italy, 25–28 February 2009. [Google Scholar]
  3. Münster, S.; Koehler, T. 3D reconstruction of cultural heritage artifacts: A literature based survey of recent projects and workflows. In Virtual Palaces, Part II. Lost Palaces and Their Afterlife Virtual Reconstruction between Science and Media; Hoppe, S., Breitling, S., Eds.; Paladium: Heidelberg, Germany, 2016; pp. 87–102. [Google Scholar]
  4. Cozzolino, M.; Di Giovanni, E.; Mauriello, P.; Piro, S.; Zamuner, D. Geophysical Methods for Cultural Heritage Management; Springer Geophysics Series; Springer Nature: Cham, Switzerland, 2018. [Google Scholar]
  5. Barrile, V.; Bernardo, E.; Fotia, A.; Bilotta, G. Integration of Laser Scanner, Ground-Penetrating Radar, 3D Models and Mixed Reality for Artistic, Archaeological and Cultural Heritage Dissemination. Heritage 2022, 5, 1529–1550. [Google Scholar] [CrossRef]
  6. Kersten, T.P.; Hinrichsen, N.; Lindstaedt, M.; Weber, C.; Schreyer, K.; Tschirschwitz, F. Architectural Historical 4D Documentation of the Old-Segeberg Town House by Photogrammetry, Terrestrial Laser Scanning and Historical Analysis. In Digital Heritage. Progress in Cultural Heritage: Documentation, Preservation, and Protection. EuroMed 2014. Lecture Notes in Computer Science; Springer: Cham, Switzerland, 2014; Volume 8740. [Google Scholar] [CrossRef]
  7. Fawzy, H.E.D. 3D laser scanning and close-range photogrammetry for buildings documentation: A hybrid technique towards a better accuracy. Alex. Eng. J. 2019, 58, 1191–1204. [Google Scholar] [CrossRef]
  8. Alidoost, F.; Arefi, H. An image-based technique for 3D building reconstruction using multi-view UAV images. ISPRS 2015, XL-1/W5, 43–46. [Google Scholar] [CrossRef]
  9. Murtiyoso, A.; Koehl, M.; Grussenmeyer, P.; Freville, T. Acquisition and processing protocols for UAV images: 3D modeling of historical buildings using photogrammetry. ISPRS Ann. Photogramm. 2017, IV-2/W2, 163–170. [Google Scholar] [CrossRef]
  10. Pawłowicz, J.A. Importance of laser scanning resolution in the process of recreating the architectural details of historical buildings. IOP Conf. Ser. Mater. Sci. Eng. 2017, 245, 052038. [Google Scholar] [CrossRef]
  11. Cozzolino, M.; Di Meo, A.; Gentile, V. The contribution of indirect topographic surveys (photogrammetry and laser scanner) and GPR investigations in the study of the vulnerability of the Abbey of Santa Maria a Mare, Tremiti Islands (Italy). Ann. Geophys. 2019, 62, 71. [Google Scholar] [CrossRef]
  12. Pancani, G.; Bigongiari, M. Digital survey for the structural analysis of the Verruca fortress. Procedia Struct. Integr. 2020, 29, 149–156. [Google Scholar] [CrossRef]
  13. Bertocci, S.; Arrighetti, A.; Lumini, A.; Cioli, F. Multidisciplinary study for the documentation of the Ramintoja Church in Vilnius. Development of 3D models for virtualization and historical reconstruction. Disegnarecon 2021, 14, 1–17. [Google Scholar] [CrossRef]
  14. Hu, Y.; Feng, B.; Hou, M. A study on the detection of bulging disease in ancient city walls based on fitted initial outer planes from 3D point cloud data. Herit. Sci. 2023, 11, 10. [Google Scholar] [CrossRef]
  15. Tysiac, P.; Sieńska, A.; Tarnowska, M.; Kedziorski, P.; Jagoda, M. Combination of terrestrial laser scanning and UAV photogrammetry for 3D modellingand degradation assessment of heritage building based on a lighting analysis: Case study—St. Adalbert Church in Gdansk, Poland. Herit. Sci. 2023, 11, 53. [Google Scholar] [CrossRef]
  16. Tsourlos, P.I.; Tsokas, G.N. Non-destructive electrical resistivity tomography survey at the south walls of the Acropolis of Athens. Archaeol. Prospect. 2011, 18, 173–186. [Google Scholar] [CrossRef]
  17. Pérez-Gracia, V.; Caselles, J.O.; Clapes, J.; Osorio, R.; Martínez, G.; Canas, J.A. Integrated near-surface geophysical survey of the Cathedral of Mallorca. J. Archaeol. Sci. 2009, 36, 1289–1299. [Google Scholar] [CrossRef]
  18. Angelis, D.; Tsourlos, P.; Tsokas, G.; Vargemezis, G.; Zacharopoulou, G.; Power, C. Combined application of GPR and ERT for the assessment of a wall structure at the Heptapyrgion fortress (Thessaloniki, Greece). J. Appl. Geophys. 2018, 152, 208–220. [Google Scholar] [CrossRef]
  19. Pieraccini, M.; Miccinesi, L.; Conti, A.; Fiorini, L.; Tucci, G.; Pieri, I.; Corazzini, S. Integration of GPR and TLS for investigating the floor of the ‘Salone dei Cinquecento’ in Palazzo Vecchio, Florence, Italy. Archaeol. Prospect. 2020, 30, 27–32. [Google Scholar] [CrossRef]
  20. Matias, M.; Almeida, F.; Moura, R.; Barraca, N. High resolution NDT in the characterization of the inner structure and materials of heritage buildings walls and columns. Constr. Build. Mater. 2021, 267, 121726. [Google Scholar] [CrossRef]
  21. Manataki, M.; Maris, C.; Sarris, A.; Vafidis, A. Using GPR to Evaluate the Stratigraphic Condition of the Mosaic of the Dolphins in Delos Island, Greece, in order to Adopt the necessary Conservation measures. In Proceedings of the 10th International Workshop on Advanced Ground Penetrating Radar, The Hague, The Netherlands, 9–11 September 2019; pp. 1–7. [Google Scholar]
  22. Piroddi, L.; Vignoli, G.; Trogu, A.; Deidda, G.P. Non-destructive Diagnostics of Architectonic Elements in San Giuseppe Calasanzio’s Church in Cagliari: A Test-case for Micro-geophysical Methods within the Framework of Holistic/integrated Protocols for Artefact Knowledge. In Proceedings of the 2018 IEEE International Conference on Metrology for Archaeology and Cultural Heritage, Cassino, Italy, 22–24 October 2018; pp. 17–21. [Google Scholar]
  23. McCann, D.M.; Forde, M.C. Review of NDT methods in the assessment of concrete and masonry structures. NDT E Int. 2001, 34, 71–84. [Google Scholar] [CrossRef]
  24. Maierhofer, C.; Leipold, S. Radar investigation of masonry structures. NDT E Int. 2001, 34, 139–147. [Google Scholar] [CrossRef]
  25. Lachowicz, J.; Rucka, M. Diagnostics of pillars in St. Mary’s Church (Gdańsk, Poland) using the GPR method. Int. J. Archit. Herit. 2019, 13, 1223–1233. [Google Scholar] [CrossRef]
  26. Labropoulos, K.; Moropoulou, A. Ground penetrating radar investigation of the bell tower of the church of the Holy Sepulchre. Constr. Build. Mater. 2013, 47, 689–700. [Google Scholar] [CrossRef]
  27. Catapano, I.; Ludeno, G.; Soldovieri, F.; Tosti, F.; Padeletti, G. Structural assessment via ground penetrating radar at the Consoli Palace of Gubbio (Italy). Remote Sens. 2018, 10, 45. [Google Scholar] [CrossRef]
  28. De Domenico, D.; Campo, D.; Teramo, A. FDTD modelling in high-resolution 2D and 3D GPR surveys on a reinforced concrete column in a double wall of hollow bricks. Near Surf. Geophys. 2013, 11, 29–40. [Google Scholar] [CrossRef]
  29. Orlando, L. Detecting steel rods and micro-piles: A case history in a civil engineering application, J. Appl. Geophys. 2012, 81, 130–138. [Google Scholar] [CrossRef]
  30. Binda, L.; Zanzi, L.; Lualdi, M.; Condoleo, P. The use of georadar to assess damage to a masonry Bell Tower in Cremona, Italy. NDT E Int. 2005, 38, 171–179. [Google Scholar] [CrossRef]
  31. Negri, S.; Aiello, M.A. High-resolution GPR survey for masonry wall diagnostics. J. Build. Eng. 2021, 33, 101817. [Google Scholar] [CrossRef]
  32. González-Drigo, R.; Pérez-Gracia, V.; Di Capua, D.; Pujades, L.G. GPR survey applied to Modernista buildings in Barcelona: The cultural heritage of the College of Industrial Engineering. J. Cult. Herit. 2008, 9, 196–202. [Google Scholar] [CrossRef]
  33. Santos-Assunçao, S.; Perez-Gracia, V.; Caselles, O.; Clapes, J.; Salinas, V. Assessment of Complex Masonry Structures with GPR Compared to Other Non-Destructive Testing Studies. Remote Sens. 2014, 6, 8220–8237. [Google Scholar] [CrossRef]
  34. Visintini, D.; Crosilla, F.; Sepic, F. Laser scanning survey of the Aquileia Basilica (Italy) and automatic modeling of the volumetric primitives. Int. Arch. Photogramm. Remote Sens. Spat. Inf. Sci. 2012, XXXVI, 5. [Google Scholar]
  35. Available online: https://www.fondazioneaquileia.it/files/documenti/04_relazione_geologica.pdf (accessed on 15 April 2023).
  36. Available online: http://zonesismiche.mi.ingv.it/documenti/mappa_opcm3519.pdf (accessed on 15 April 2023).
  37. Marchesini, A.; Poli, M.E.; Bonini, L.; Busetti, M.; Piano, C.; Dal Cin, M.; Paiero, G.; Areggi, G.; Civil, D.; Ponton, M.; et al. Guidelines for the use of the georeferenced database of active faults of the Friuli Venezia Giulia Region. Geological Service—Autonomous Region Friuli Venezia Giulia, 2021. Available online: https://www.regione.fvg.it/rafvg/export/sites/default/RAFVG/ambiente-territorio/geologia/FOGLIA35/allegati/Faglie_Attive_-_Linee_guida.pdf (accessed on 15 November 2022).
  38. Guidoboni, E.; Ferrari, G.; Tarabusi, G.; Sgattoni, G.; Comastri, A.; Mariotti, D.; Ciuccarelli, C.; Bianchi, M.G.; Valensise, G. CFTI5Med, the new release of the catalogue of strong earthquakes in Italy and in the Mediterranean area. Sci. Data 2019, 6, 80. [Google Scholar] [CrossRef]
  39. Guidoboni, E.; Comastri, A. Catalogue of Earthquakes and Tsunamis in the Mediterranean Area: 11th–15th Century; INGV-SGA: Bologna, Italy, 2005. [Google Scholar]
  40. Rovida, A.; Locati, M.; Camassi, R.; Lolli, B.; Gasperini, P.; Antonucci, A. Catalogo Parametrico dei Terremoti Italiani (CPTI15), Versione 3.0; Istituto Nazionale di Geofisica e Vulcanologia (INGV): Roma, Italy, 2021. [Google Scholar] [CrossRef]
  41. Maselli Scotti, F.; Tiussi, C. Assetto urbanistico e funzionale dell’are del nucleo basilicale teodoriano prima della sua costruzione. Antich. Altoadriatiche 2010, LXIX(I), 123–156. [Google Scholar]
  42. Bertacchi, L. Un decennio di scavi e scoperte di interesse paleocristiano ad Aquileia. Antich. Altoadriatiche 1974, VI, 63–91. [Google Scholar]
  43. Lehmann, T. I mosaici nelle aule teodoriane sotto la basilica patriarcale di Aquileia: Status questionis. Antich. Altoadriatiche 2006, LXII(I), 61–82. [Google Scholar]
  44. Ulmer, C. La Basilica di Aquileia; Ulmer Kunstbuch: Munsingen, Switzerland, 2021. [Google Scholar]
  45. Bisconti, F. Il tappeto di Giona: Interpretazioni interne e relazioni esterne. Antich. Altoadriatiche 2010, LXIX, 217–236. [Google Scholar]
  46. Tiussi, C. La ricerca archeologica. La scoperta della Sudhalle e le indagini fino alla metà del Novecento. In L’aula Meridionale del Battistero di Aquileia. Contesto, Scoperta, Valorizzazione; Fozzati, L., Ed.; Mondadori Electa: Milano, Italy, 2015; pp. 65–73. [Google Scholar]
  47. Brant, O. Il battistero “cromaziano”. Antich. Altoadriatiche 2010, LXIX(I), 323–354. [Google Scholar]
  48. Barral, I.; Altet, X. La Basilica di Massenzio ad Aquileia: Un grande monumento romanico del primo XI secolo. Antich. Altoadriatiche 2006, LXII, 211–240. [Google Scholar]
  49. Altan, M.G.B. Poppone, il “Deutschtum” forogiuliese, i Benedettini. Boll. Del Grup. Archeol. Aquil. 1996, 6, 73–79. [Google Scholar]
  50. Bertacchi, L. La torre campanaria di Aquileia. Aquil. Nostra 1971, XLII, 1–36. [Google Scholar]
  51. Valenzano, G. La Basilica e il palazzo patriarcale di Aquileia. In Proceedings of the Atti del Convegno Medioevo. La Chiesa e il Palazzo, Parma, Italia, 20–24 September 2005; pp. 271–279. [Google Scholar]
  52. Viganò, A.M. Basilica di Aquileia, Cripta Degli Affreschi; Bruno Fachin: Trieste, Italy, 2015. [Google Scholar]
  53. Vosselman, G.; Maas, H.G. Airborne and Terrestrial Laser Scanning; Whittles: Caithness, UK, 2010. [Google Scholar]
  54. Remondino, F.; Campana, S. (Eds.) 3D Recording and Modelling in Archaeology and Cultural Heritage—Theory and Best Practices; BAR International Series 2598; BAR Publishing: Oxford, UK, 2014. [Google Scholar]
  55. Dong, Z.; Liang, F.; Yang, B.; Xu, Y.; Zang, Y.; Li, J.; Wang, Y.; Dai, W.; Fan, H.; Hyyppä, J.; et al. Registration of large-scale terrestrial laser scanner point clouds: A review and benchmark. ISPRS J. Photogramm. Remote Sens. 2020, 163, 327–342. [Google Scholar] [CrossRef]
  56. Carpiceci, M.; Angelini, A. Looking for the full scan: S. Zenone chapel. In 2018 Metrology for Archaeology and Cultural Heritage (MetroArchaeo); IEEE: Cassino, Italy, 2018; pp. 345–350. [Google Scholar] [CrossRef]
  57. Colomina, I.; Molina, P. Unmanned aerial systems for photogrammetry and remote sensing: A review. ISPRS J. Photogramm. Remote Sens. 2014, 92, 79–97. [Google Scholar] [CrossRef]
  58. Murtiyoso, A.; Grussenmeyer, P. Documentation of heritage buildings using Close-range uav images: Dense matching issues, comparison and case studies. Photogramm. Rec. 2017, 32, 206–229. [Google Scholar] [CrossRef]
  59. Marín-Buzón, C.; Pérez-Romero, A.; López-Castro, J.L.; Ben Jerbania, I.; Manzano-Agugliaro, F. Photogrammetry as a New Scientific Tool in Archaeology: Worldwide Research Trends. Sustainability 2021, 13, 5319. [Google Scholar] [CrossRef]
  60. Available online: https://www.agisoft.com/pdf/metashape_2_0_en.pdf (accessed on 18 November 2022).
  61. Verhoeven, G. Taking computer vision aloft—Archaeological three-dimensional reconstructions from aerial photographs with photoscan. Archaeol. Prospect. 2011, 18, 67–73. [Google Scholar] [CrossRef]
  62. Cutugno, M.; Robustelli, U.; Pugliano, G. Structure-from-Motion 3D Reconstruction of the Historical Overpass Ponte della Cerra: A Comparison between MicMac® Open Source Software and Metashape®. Drones 2022, 6, 242. [Google Scholar] [CrossRef]
  63. Angelini, A.; Portarena, D. Advice for archaeological survey with recent technologies. Acta IMEKO 2018, 7, 42–51. [Google Scholar] [CrossRef]
  64. Ground Penetrating Radar, Products. Available online: www.idsgeoradar.com (accessed on 15 November 2022).
  65. Goodman, D. GPR-SLICE. In Ground Penetrating Radar Imaging Software, User’s Manual; Geophysical Archaeometry Laboratory: Los Angeles, CA, USA, 2004. [Google Scholar]
  66. Catapano, I.; Gennarelli, G.; Ludeno, G.; Soldovieri, F.; Persico, R. Ground-penetrating radar: Operation principle and data processing. In Wiley Encyclopedia of Electrical and Electronics Engineering; Webster, J.G., Ed.; Wiley: Hoboken, NJ, USA, 2019; pp. 1–23. [Google Scholar] [CrossRef]
Figure 1. Southwestern view of the Patriarchal Basilica of Santa Maria Assunta and location of Aquileia depicted on a Google EarthTM satellite image of Italy.
Remotesensing 15 02386 g001
Figure 2. Theodorian basilica, first half of the 4th century (blue lines in (a)), post-Theodorian north, mid-4th century (green lines in (b), pink lines in (c)), post-Theodorian south, end of the 4th century or after the middle of the 5th century (red lines in (d)). In black, the plan of the current building.
Remotesensing 15 02386 g002
Figure 3. The northern hall of the Theodorian Church (a) and details of the mosaics (bd) close to the foundation of the tower hill.
Remotesensing 15 02386 g003
Figure 4. The southern hall of the Theodorian Church, the modern basilica.
Remotesensing 15 02386 g004
Figure 5. A view of the crypt (a) and details of the frescoes (b,c).
Remotesensing 15 02386 g005
Figure 6. Details of X-ray maps highlighting fractures on the internal façade (a) and the right transept (b).
Remotesensing 15 02386 g006
Figure 7. A western view of the 3D point cloud of the Patriarchal Basilica of Santa Maria Assunta obtained using laser scanning and aerial and terrestrial photogrammetric survey.
Remotesensing 15 02386 g007
Figure 8. Horizontal section (X-ray) located as in the lower left box and location of some significant internal and external side elevations.
Remotesensing 15 02386 g008
Figure 9. External side elevations (AD, top) and internal X-ray sections (EH, bottom) of the bell tower whose location is shown in Figure 7.
Remotesensing 15 02386 g009
Figure 10. Internal side elevation I-I’ showing the results of the normal computing on the cloud.
Remotesensing 15 02386 g010
Figure 11. Internal side elevation J-J’ showing the results of the normal computing on the cloud.
Remotesensing 15 02386 g011
Figure 12. Internal side elevation K-K’ showing the results of the normal computing on the cloud.
Remotesensing 15 02386 g012
Figure 13. External side elevation L-L’ showing the results of the normal computing on the cloud.
Remotesensing 15 02386 g013
Figure 14. Internal side elevation M-M’ showing the results of the normal computing on the cloud.
Remotesensing 15 02386 g014
Figure 15. Internal side elevation N-N’ showing the results of the normal computing on the cloud.
Remotesensing 15 02386 g015
Figure 16. Location of the crypt with indication of the side locations O-Q reported in Figure 7 (a), reflectance (b) and mirrored (c) display of the 3D model.
Remotesensing 15 02386 g016
Figure 17. Side elevations (ac) and orthophoto of the vaulted ceiling (d).
Remotesensing 15 02386 g017
Figure 18. Deformation framework of the mosaics of the crypt of excavations (A), the Süd-Halle (B) and the main basilica (C).
Remotesensing 15 02386 g018
Figure 19. GPR slice relative to the time window 17–21 ns.
Remotesensing 15 02386 g019
Figure 20. Comparison between DEM (a) and GPR results where only absolute amplitude values greater than 1800 are displayed (b). Numbers 1-7 refer to the main anomalies explained in the text.
Remotesensing 15 02386 g020
Figure 21. Joint interpretation of DEM and GPR anomalies.
Remotesensing 15 02386 g021
Disclaimer/Publisher’s Note: The statements, opinions and data contained in all publications are solely those of the individual author(s) and contributor(s) and not of MDPI and/or the editor(s). MDPI and/or the editor(s) disclaim responsibility for any injury to people or property resulting from any ideas, methods, instructions or products referred to in the content.

