Construction and Assessment of a Drought-Monitoring Index Based on Multi-Source Data Using a Bias-Corrected Random Forest (BCRF) Model
Abstract
:1. Introduction
- (1)
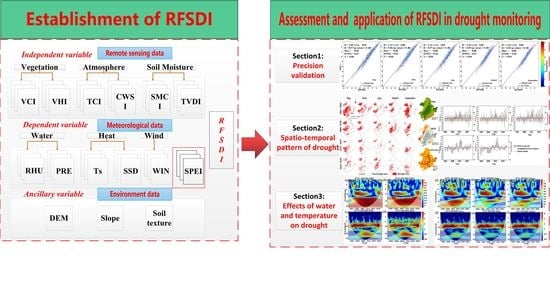
- This study proposes a new index suitable for agricultural drought monitoring in the NEC region based on the bias-corrected random forest (BCRF) model using multi-source data.
- (2)
- The applicability of the new agricultural-drought-monitoring index in NEC is evaluated, and the new index is used to explore the spatiotemporal patterns of agricultural drought in NEC, along with the response model of agricultural drought to climate change.
2. Material and Methods
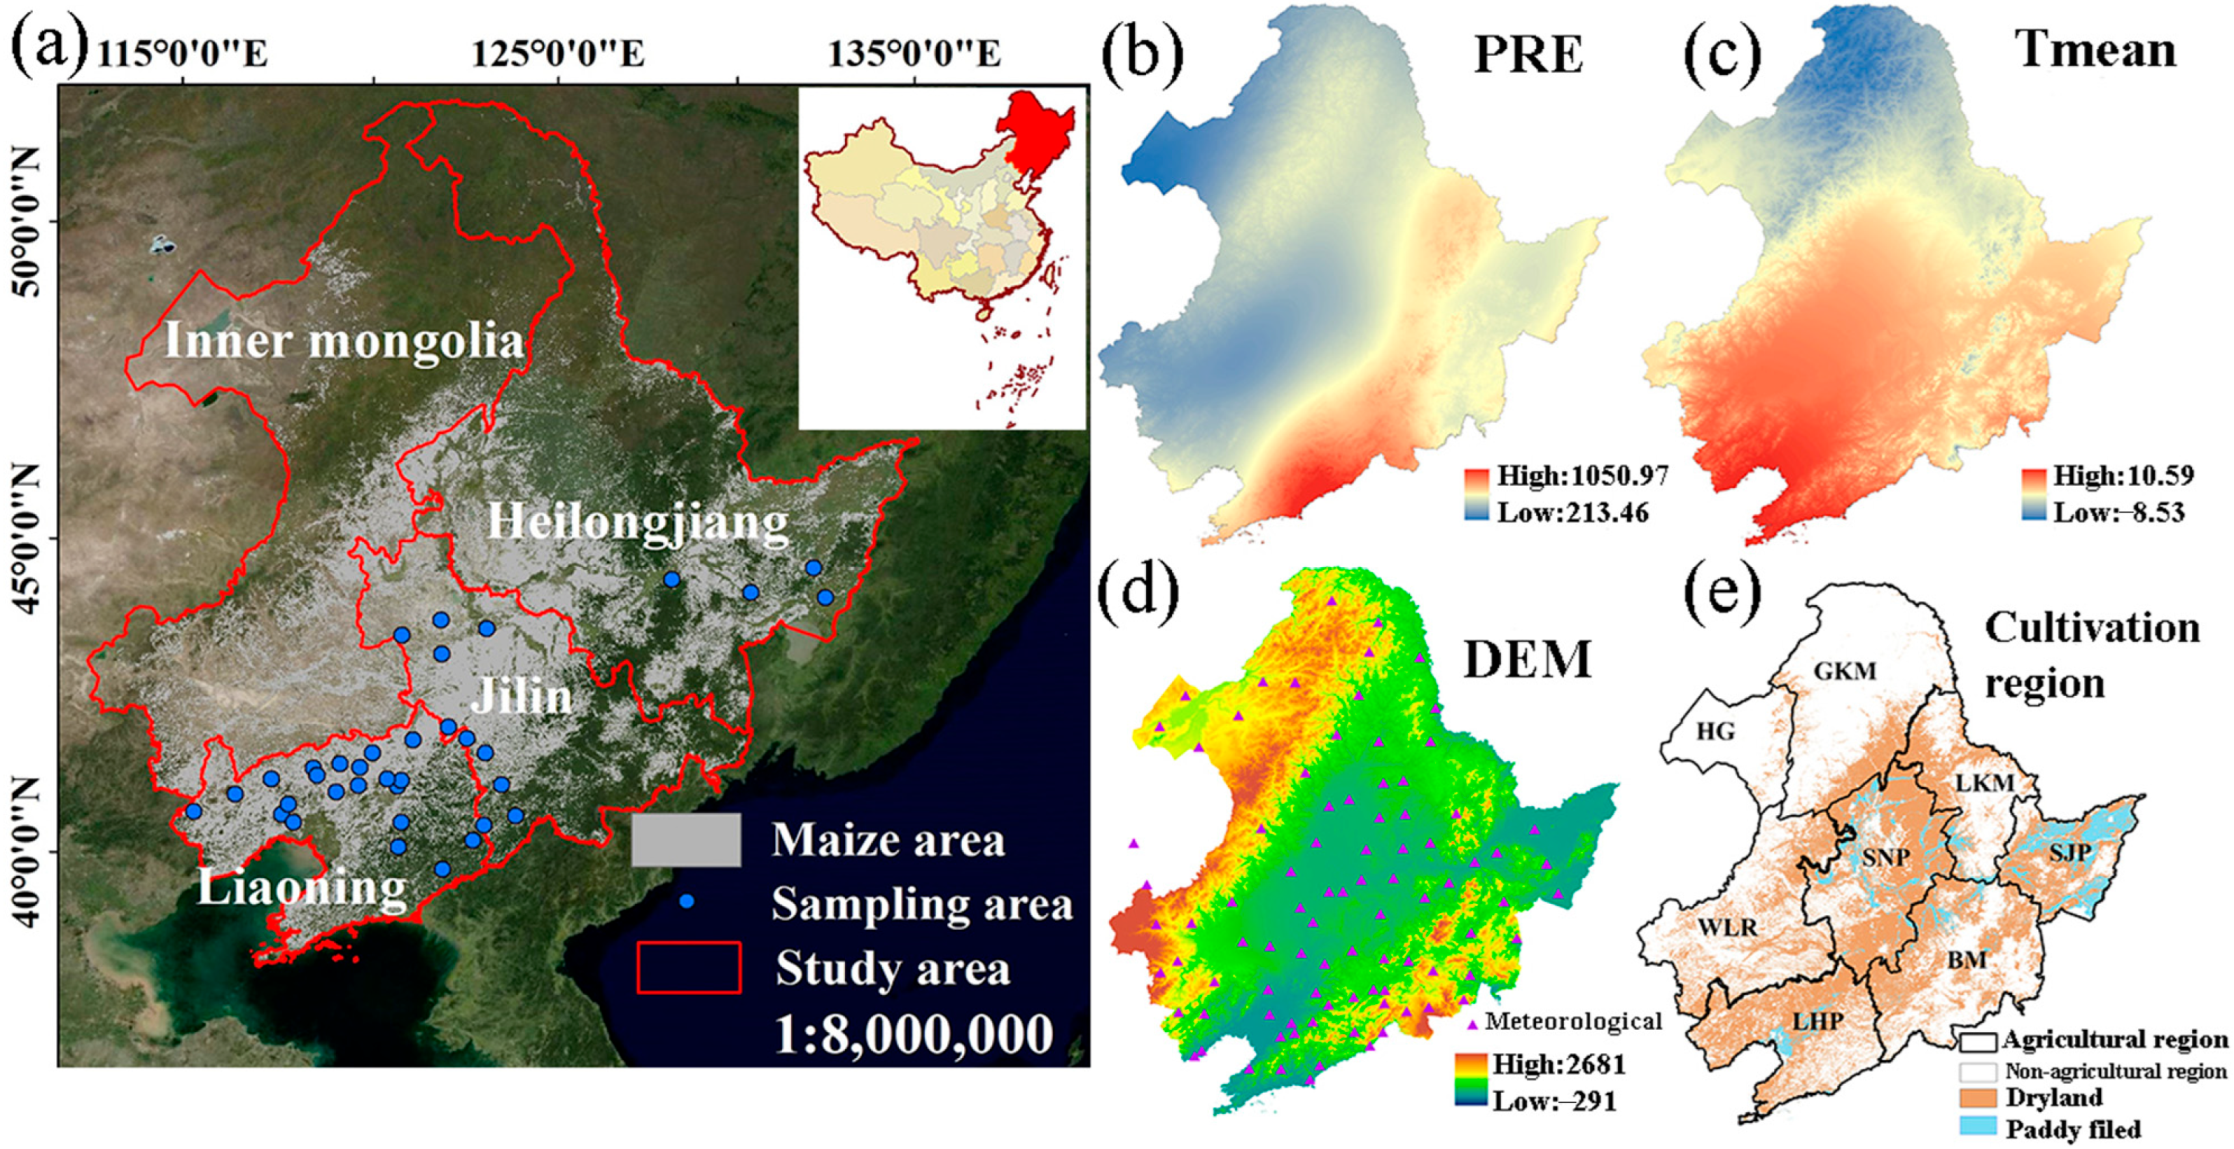
2.1. Study Area
2.2. Data Sources and Data Processing
2.2.1. Remote Sensing Data
2.2.2. Meteorological Data
2.2.3. Field Survey Data
2.2.4. Topographic and Soil Data
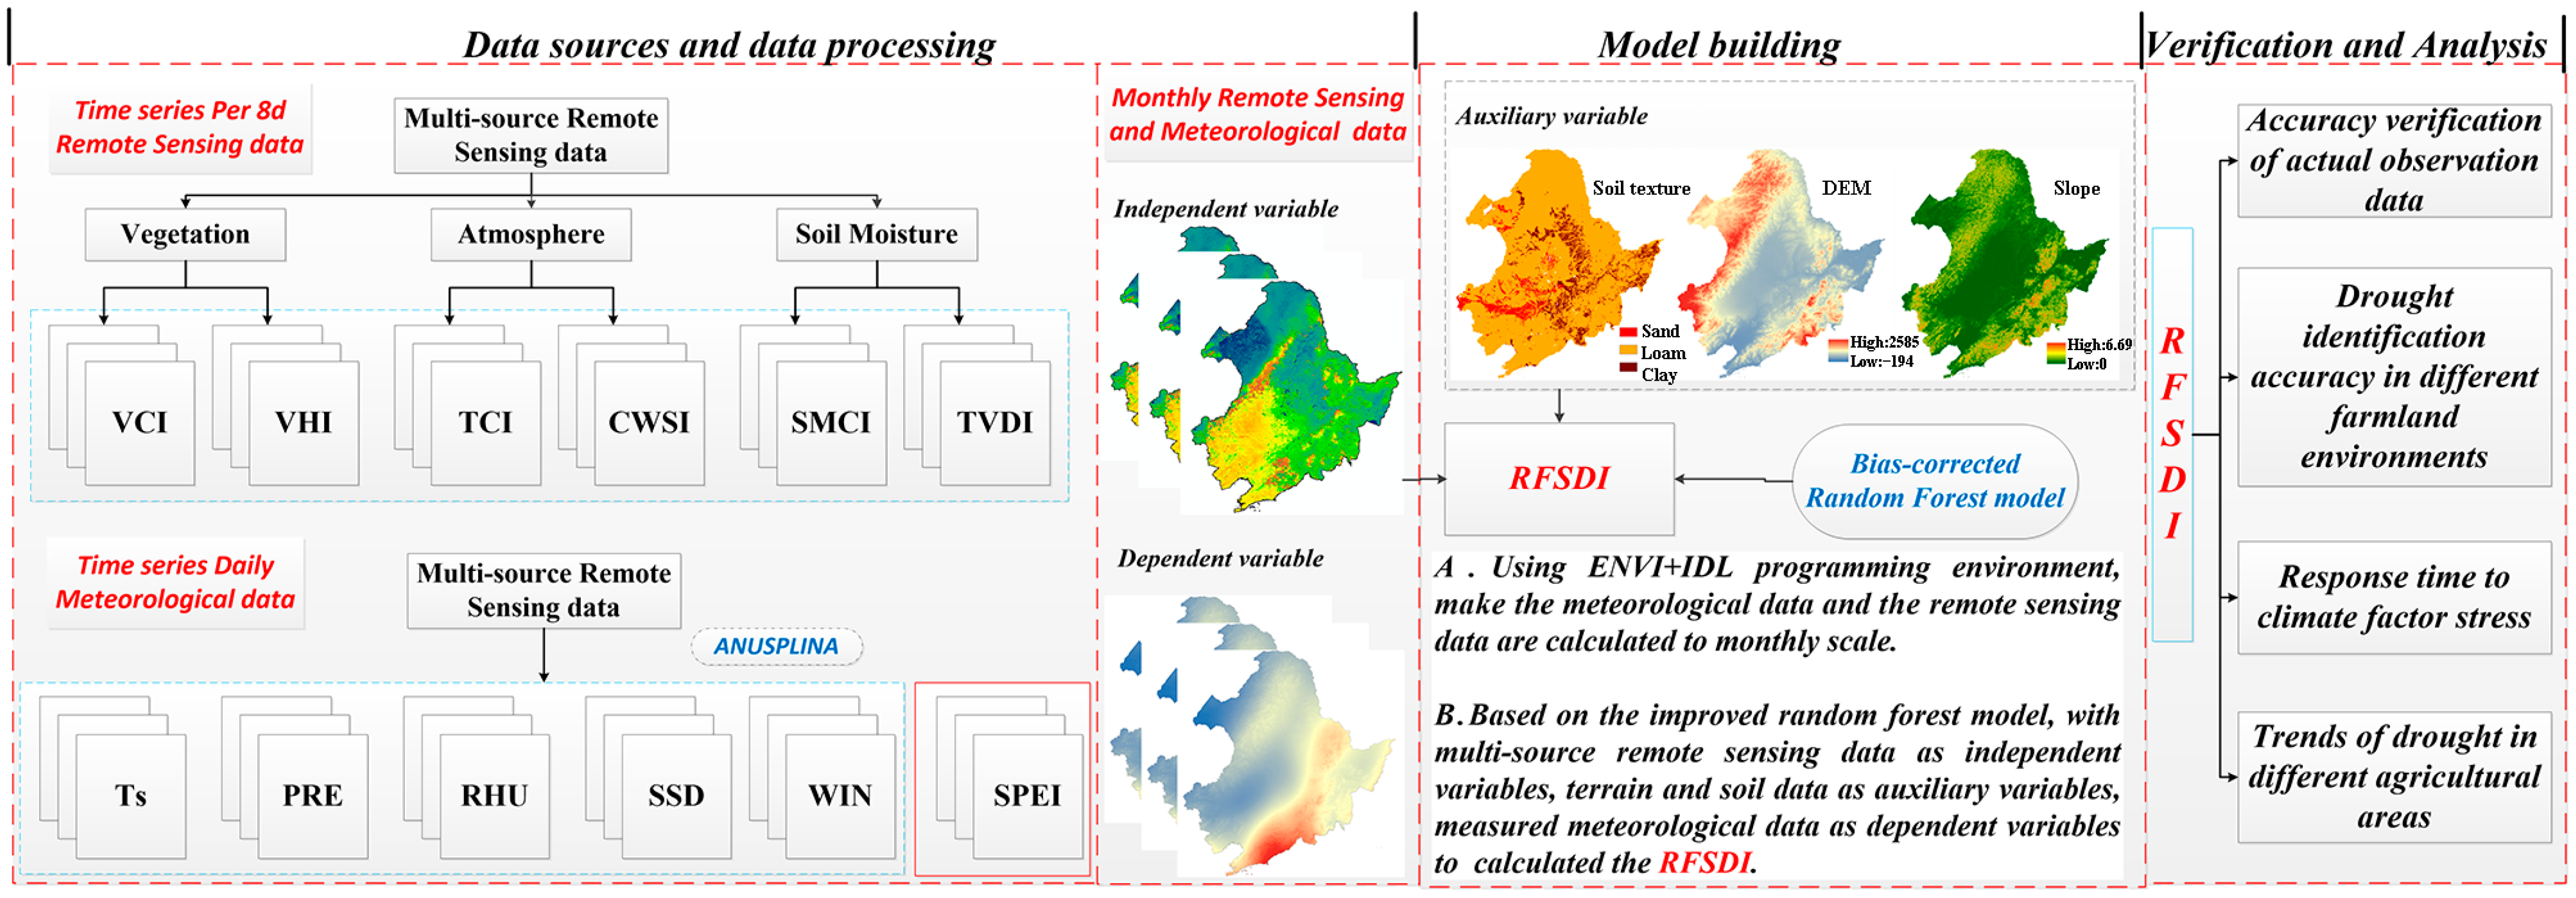
2.3. Construction of the BCRF Model
- (1)
- The RF model Ytrain = RF (Xtrain, Ztrain) is constructed without deviation correction. This formula outputs the predicted Y*train value of the RF model training set. The predicted value of the model test set is Y*tset, and the predicted residual of the test set is RF*tset = RFres (Xtest, Y*test, Ztest). The residual value Rtrain= Ytrain − Y*train of the observed and predicted training set values is then output. In addition, the residual value Rtrain and the sample data are used to construct the residual model Rtrain.
- (2)
- The training set prediction residual R*train and the training set prediction value Y*train are fitted to the simple linear regression line Rtrain = a + bY*train, where a and b are constants, and the line is found to rotate to R*train = 0°, assuming θ.
- (3)
- The best angle in (θ − α, θ + α) is determined, where α is the angle. In this paper, the value of 10° corresponds to the minimal prediction error in the training set. This angle value is saved and assumed to be θ*. The rotation matrix of θ* is used to estimate the residual value, and the sum of the predicted value after rotation and the residual value is the final predicted value.
- (4)
- The actual observed SPEI was selected as the dependent variable. The temperature condition index (TCI), vegetation condition index (VCI), vegetation health index (VHI), temperature vegetation drought index (TVDI), crop water stress index (CWSI), and soil moisture condition index (SMCI) were used as independent variables. Terrain data and soil texture data were used as auxiliary variables.
- (5)
- The data were randomly divided into a test set (20%) and a training set (80%). Based on the BCRF model, different combinations of independent variables were introduced into the regression model to construct the model.
- (6)
- Model evaluation terms such as the R2 and RMSE were used to evaluate the advantages and disadvantages of different combinations of independent variables when constructing the models to select the best regression model and construct the RFSDI.
2.4. Construction of Model-Building Parameters
2.4.1. Dependent Variable Construction
2.4.2. Independent Variable Construction
2.5. Multiple Stepwise Regression Model
2.6. Time-Series Crossover Wavelet Model
3. Results
3.1. Accuracy of the BCRF Model
3.2. Assessment of the Drought-Monitoring Applicability and Drought-Monitoring Capability of the RFSDI
3.2.1. Applicability of the RFSDI_3 to Agricultural Drought Monitoring in Different Months
3.2.2. RFSDI Simulates the Drought Trends of Meteorological Stations in NEC
3.2.3. Spatial Distribution of Drought Conditions in Typical Dry Years
3.3. Spatiotemporal Pattern of Drought in NEC Based on the RFSDI
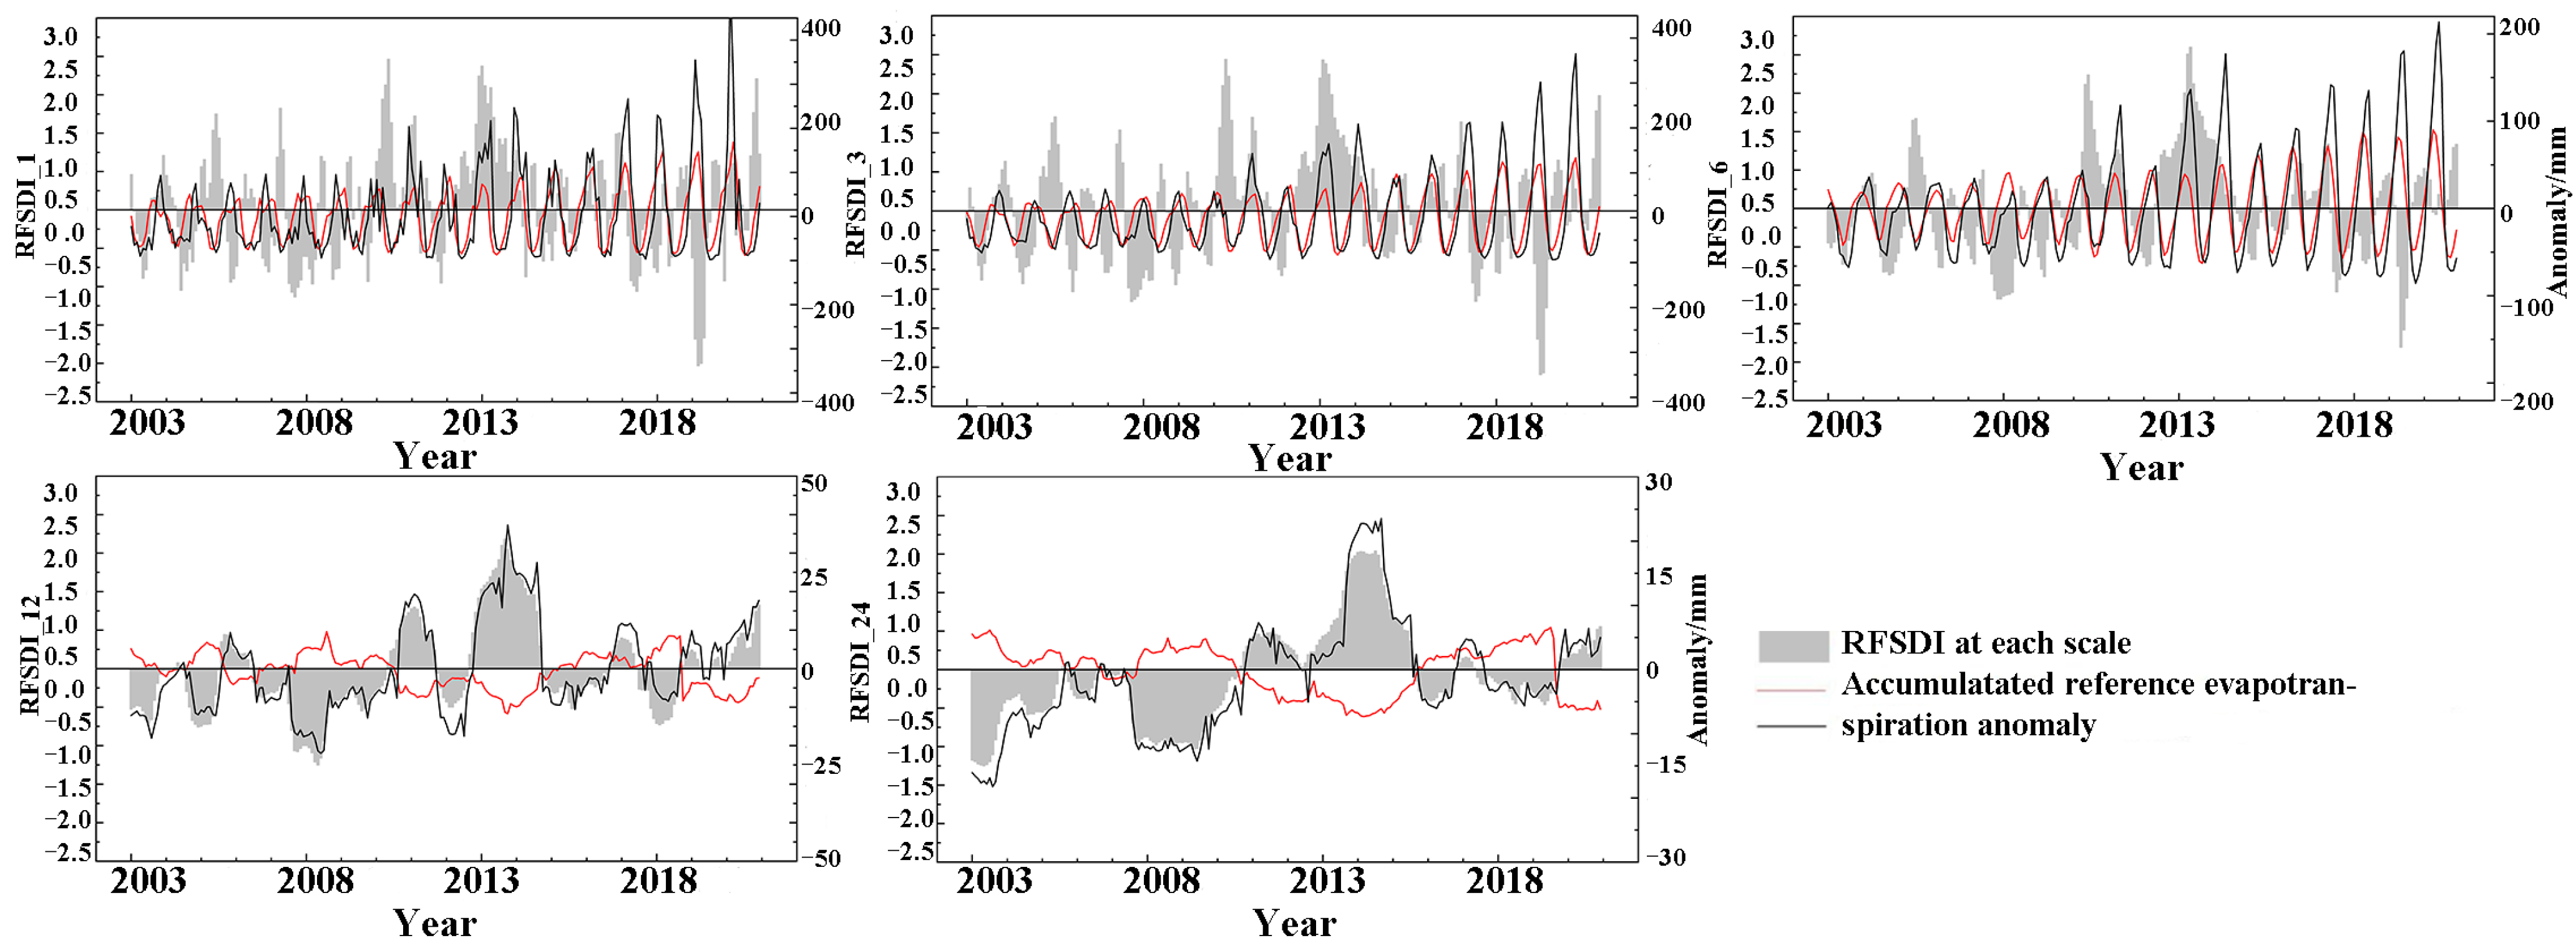
3.4. Multi-Scale Characteristics of Drought from 2003 to 2020
3.5. Drought Dominates Climate Variables during the Growing Season
3.6. Effects of Water Stress on Agricultural Drought in NEC
4. Discussion
4.1. RFSDI Construction Variable Selection Principle and Drought Identification Accuracy
4.2. Spatiotemporal Pattern of Drought in NEC Based on the RFSDI
4.3. Drought in Different Agricultural Areas in NEC
4.4. Effects of Climate Change on Agricultural Drought in NEC
5. Conclusions
- (1)
- The RFSDI constructed in this study has a high degree of fit with the actual observed SPEI and field drought survey data, accurately describing the spatial and temporal patterns of and evolution trend in agricultural drought in NEC and identifying drought-stressed areas.
- (2)
- From 2003 to 2020, the influence range of spring drought in NEC was the widest, the summer drought weakened, and the autumn drought increased again. The central and western plains of the study area were most seriously affected by drought stress due to the combined action of disaster-causing factors and disaster-prone environments.
- (3)
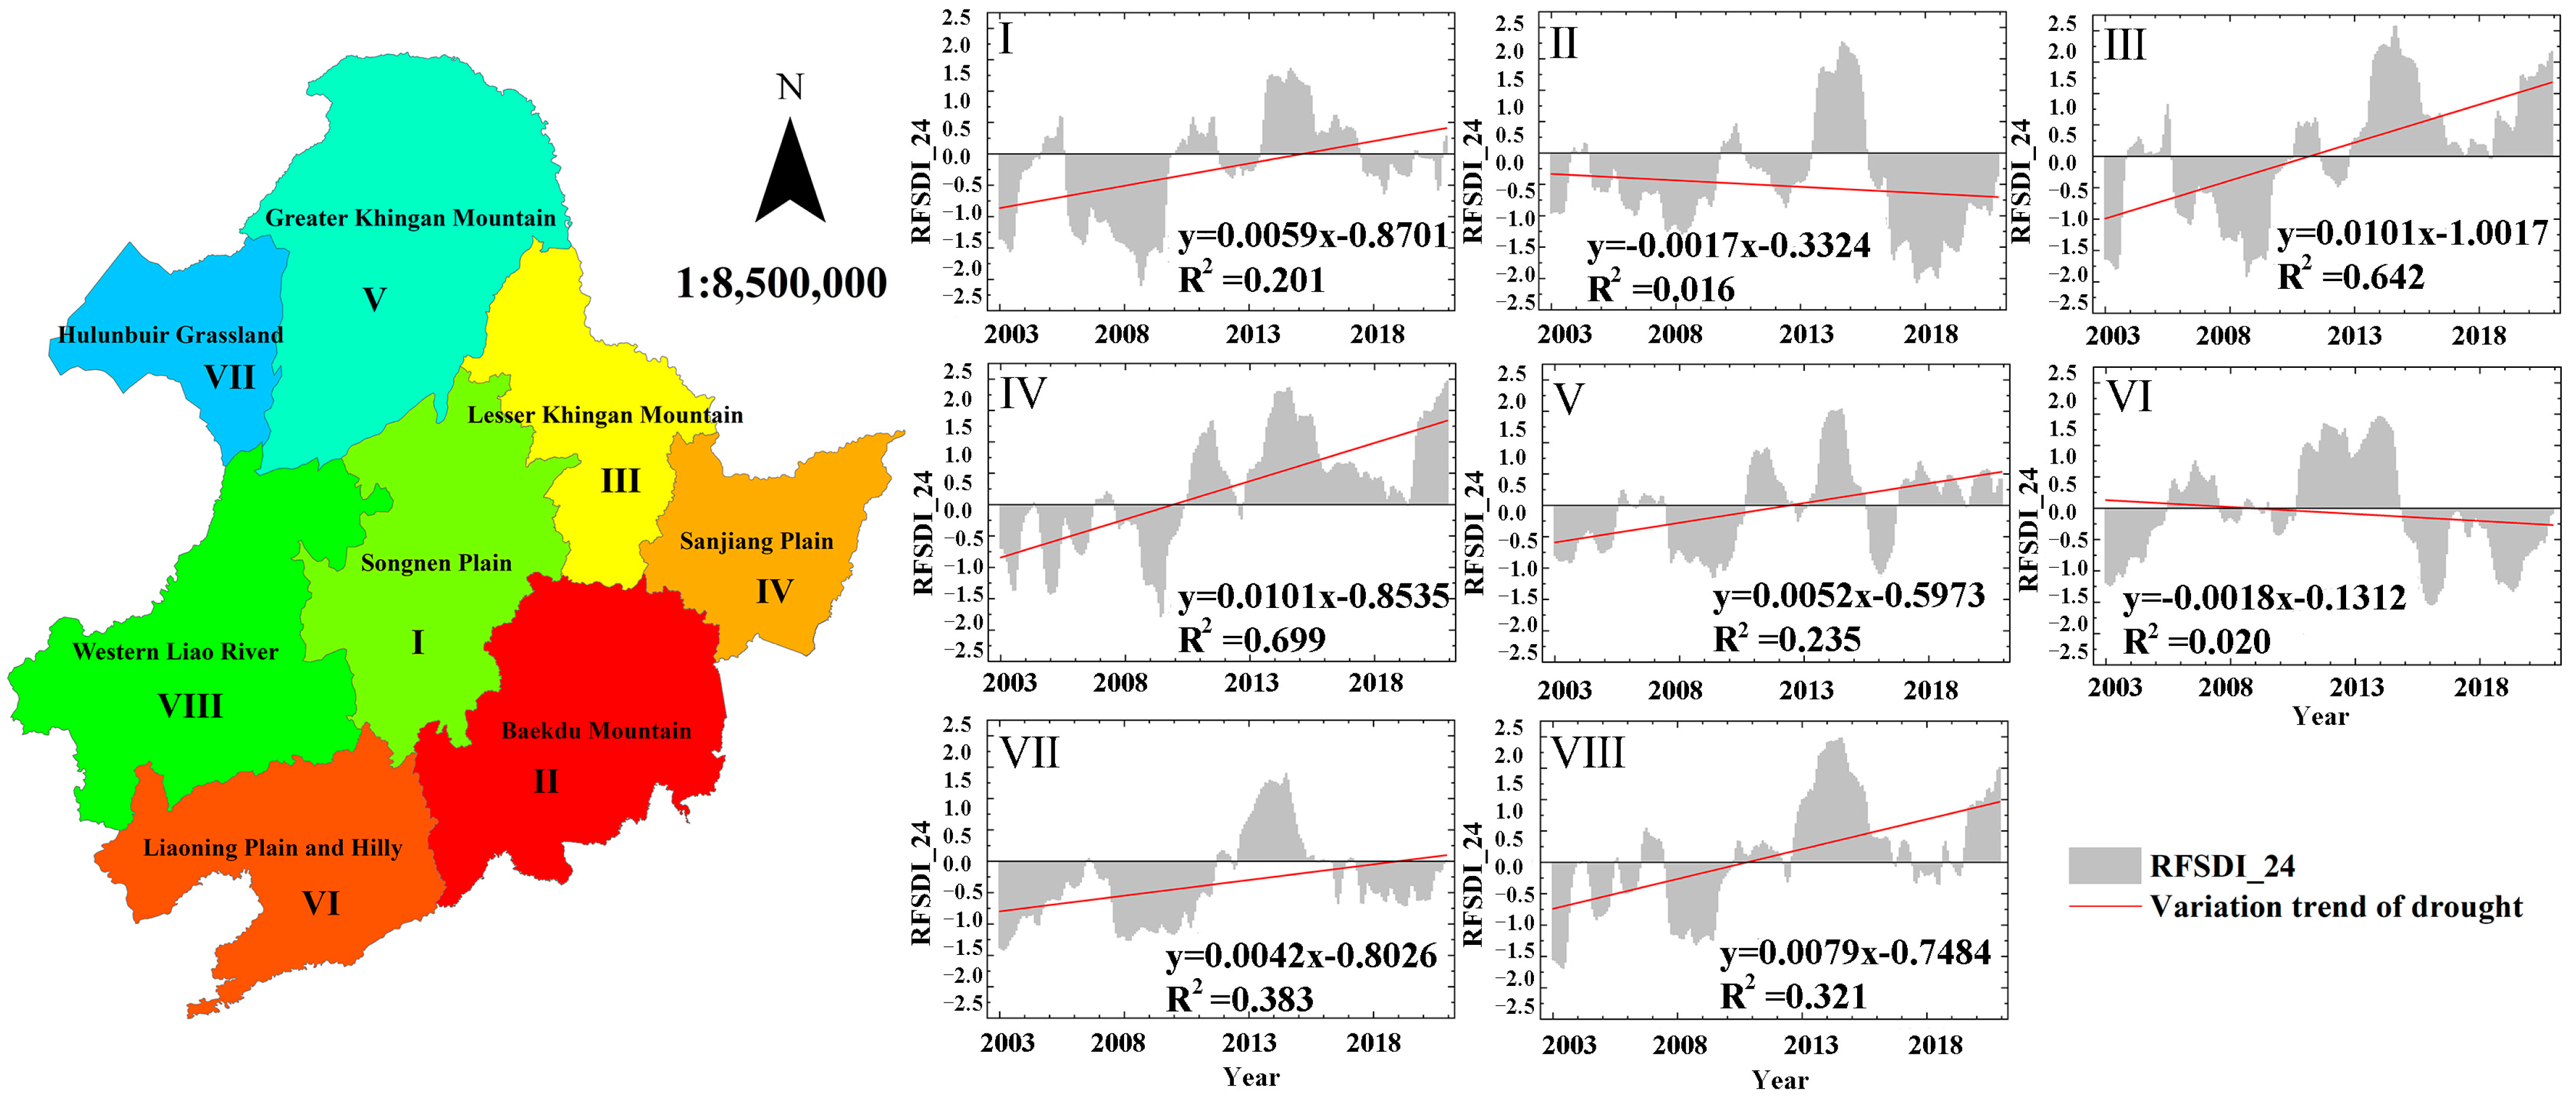
- From 2003 to 2020, the overall drought in NEC showed a slowing trend. Due to the influence of climate and geographical factors, the trend in drought in different agricultural areas varied. From an interannual perspective, the agricultural drought in NEC exhibited cyclical changes of nearly 10 years.
- (4)
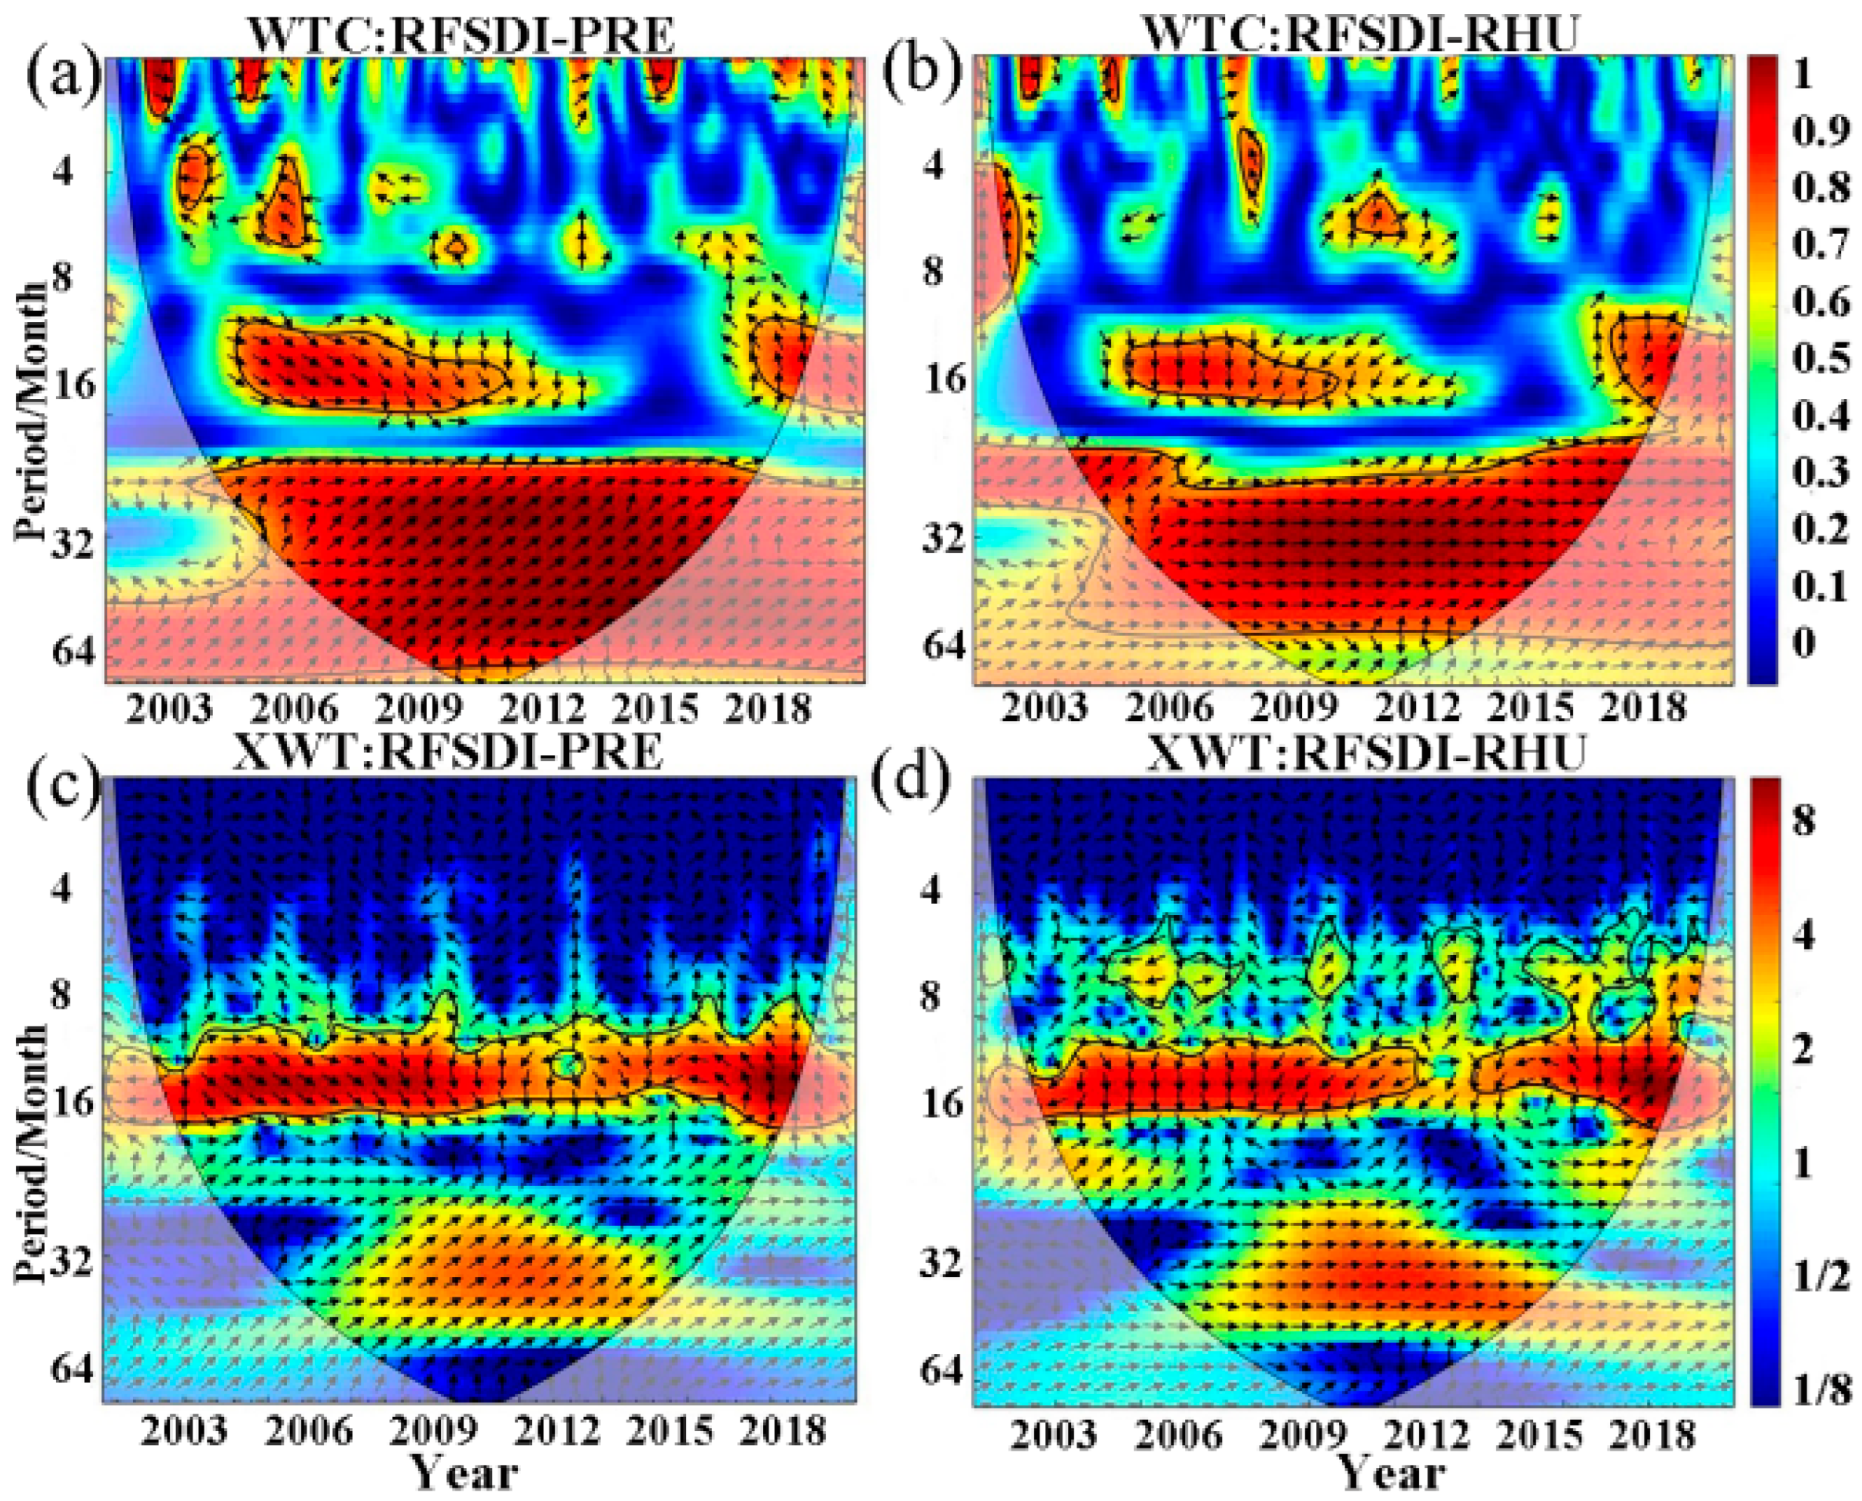
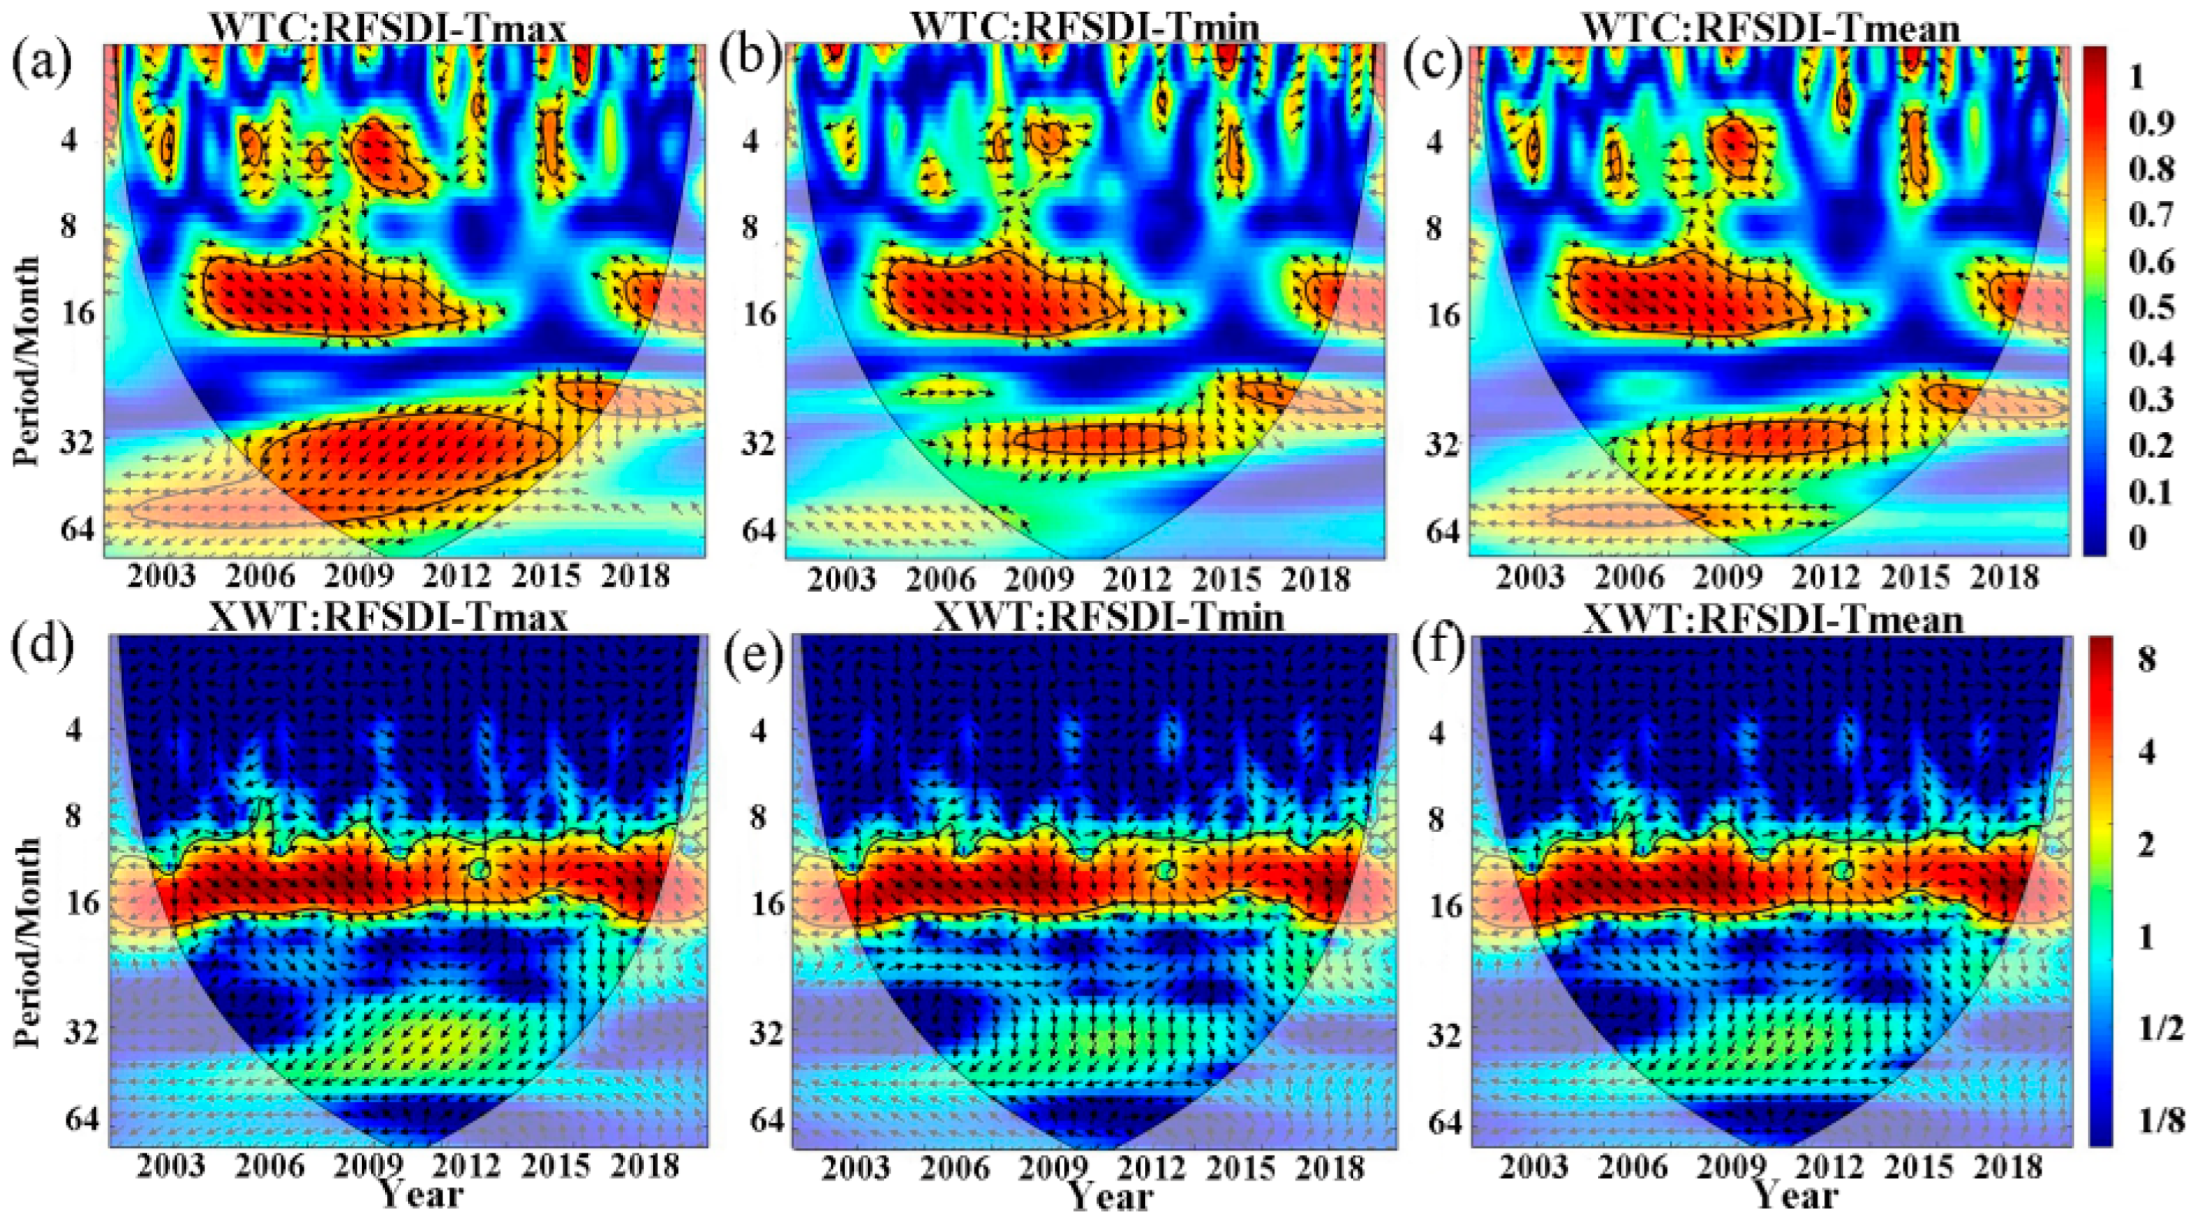
- The dominant climate variables affecting agricultural drought during the growing season included PRE, Ts, RHU, and SSD. A significant correlation was found between the changes in water and heat and the occurrence of agricultural drought in NEC. A lag of 1.5–4.5 months was found between the decrease in precipitation and soil moisture and the occurrence time of agricultural drought.
Author Contributions
Funding
Acknowledgments
Conflicts of Interest
References
- Wang, X.; Pan, S.; Pan, N.; Pan, P. Grassland productivity response to droughts in northern China monitored by satellite-based solar-induced chlorophyll fluorescence. J. Sci. Total Environ. 2022, 830, 154550. [Google Scholar] [CrossRef] [PubMed]
- Xie, N.; Xin, J.; Liu, S. China’s regional meteorological disaster loss analysis and evaluation based on grey cluster model. Nat. Hazards 2014, 71, 1067–1089. [Google Scholar] [CrossRef]
- Qin, Y.; Xiao, X.; Wigneron, J.-P.; Ciais, P.; Canadell, J.G.; Brandt, M.; Li, X.; Fan, L.; Wu, X.; Tang, H.; et al. Large loss and rapid recovery of vegetation cover and aboveground biomass over forest areas in Australia during 2019–2020. Remote Sens. Environ. 2022, 278, 113087. [Google Scholar] [CrossRef]
- Zhang, J. Risk assessment of drought disaster in the maize-growing region of Songliao Plain, China. J. Agric. Ecosyst. Environ. 2004, 102, 133–153. [Google Scholar] [CrossRef]
- Wasti, S.; Wang, Y. Spatial and temporal analysis of HCHO response to drought in South Korea. J. Sci. Total Environ. 2022, 852, 158451. [Google Scholar] [CrossRef]
- Song, Y.; Fang, S.; Yang, Z.; Shen, S. Drought indices based on MODIS data compared over a maize-growing season in Songliao Plain, China. J. Appl. Remote Sens. 2018, 12, 046003. [Google Scholar] [CrossRef]
- Basit, A.; Ni, J.; Khan, F.U.; Sajid, M.; Umair, M.; Makanda, T.A. Impact assessment of drought monitoring events and vegetation dynamics based on multi-satellite remote sensing data over Pakistan. J. Environ. Sci. Pollut. Res. 2023, 30, 12223–12234. [Google Scholar] [CrossRef]
- Tian, Y.; Yang, Y.; Bao, Z.; Song, X.; Wang, G.; Liu, C.; Wu, H.; Mo, Y. An Analysis of the Impact of Groundwater Overdraft on Runoff Generation in the North China Plain with a Hydrological Modeling Framework. J. Water 2022, 14, 1758. [Google Scholar] [CrossRef]
- Fu, R.; Chen, R.; Wang, C.; Chen, X.; Gu, H.; Wang, C.; Xu, B.; Liu, G.; Yin, G. Generating High-Resolution and Long-Term SPEI Dataset over Southwest China through Downscaling EEAD Product by Machine Learning. J. Remote Sens. 2022, 14, 1662. [Google Scholar] [CrossRef]
- Vicente-Serrano, S.M.; Beguería, S.; López-Moreno, J.I. A Multiscalar Drought Index Sensitive to Global Warming: The Standardized Precipitation Evapotranspiration Index. J. Clim. 2010, 23, 1696–1718. [Google Scholar] [CrossRef]
- Uddin, M.J.; Hu, J.; Islam, A.R.M.T.; Eibek, K.U.; Nasrin, Z.M. A comprehensive statistical assessment of drought indices to monitor drought status in Bangladesh. J. Arab. J. Geosci. 2020, 13, 323. [Google Scholar] [CrossRef]
- Liu, X.; Guo, P.; Tan, Q.; Xin, J.; Li, Y.; Tang, Y. Drought risk evaluation model with interval number ranking and its application. J. Sci. Total Environ. 2019, 685, 1042–1057. [Google Scholar] [CrossRef]
- Qiao, L.; Qian, H.; Di Huo, A. A Review of Remote Sensing Drought Monitoring Method. J. Adv. Mater. Res. 2015, 1073–1076, 1891–1894. [Google Scholar] [CrossRef]
- Kogan, F. World droughts in the new millennium from AVHRR-based vegetation healthindices. J. Eos Trans. Am. Geophys. Union 2002, 83, 557–563. [Google Scholar] [CrossRef]
- Hu, X.; Ren, H.; Tansey, K.; Zheng, Y.; Ghent, D.; Liu, X.; Yan, L. Agricultural drought monitoring using European Space Agency Sentinel 3A land surface temperature and normalized difference vegetation index imageries. J. Agric. For. Meteorol. 2019, 279, 107707. [Google Scholar] [CrossRef]
- Guo, H.; Bao, A.; Ndayisaba, F.; Liu, T.; Jiapaer, G.; El-Tantawi, A.M.; De Maeyer, P. Space-time characterization of drought events and their impacts on vegetation in Central Asia. J. Hydrol. 2018, 564, 1165–1178. [Google Scholar] [CrossRef]
- Merino, A.; López, L.; Hermida, L.; Sánchez, J.L.; García-Ortega, E.; Gascón, E.; Fernández-González, S. Identification of drought phases in a 110-year record from Western Mediterranean basin: Trends, anomalies and periodicity analysis for Iberian Peninsula. J. Glob. Planet. Chang. 2015, 133, 96–108. [Google Scholar] [CrossRef]
- Qutbudin, I.; Shiru, M.S.; Sharafati, A.; Ahmed, K.; Al-Ansari, N.; Yaseen, Z.M.; Shahid, S.; Wang, X. Seasonal Drought Pattern Changes Due to Climate Variability: Case Study in Afghanistan. J. Water 2019, 11, 1096. [Google Scholar] [CrossRef]
- Leng, G.; Hall, J. Crop yield sensitivity of global major agricultural countries to droughts and the projected changes in the future. Sci. Total Environ. 2019, 654, 811–821. [Google Scholar] [CrossRef]
- Kumar, K.A.; Reddy, G.O.; Masilamani, P.; Turkar, S.Y.; Sandeep, P. Integrated drought monitoring index: A tool to monitor agricultural drought by using time series datasets of space-based earth observation satellites. J. Adv. Space Res. 2021, 67, 298–315. [Google Scholar] [CrossRef]
- Anyamba, A.; Small, J.L.; Tucker, C.J.; Pak, E.W. Thirty-two Years of Sahelian Zone Growing Season Non—Stationary NDVI3g Patterns and Trends. J. Remote Sens. 2014, 6, 3101–3122. [Google Scholar] [CrossRef]
- Zhu, K.; Ying, L. Information Source Detection in the SIR Model: A Sample-Path-Based Approach. J. IEEE/ACM Trans. Netw. 2014, 24, 408–421. [Google Scholar] [CrossRef]
- Wu, Q.; Zhong, R.; Zhao, W.; Song, K.; Du, L. Land-cover classification using GF-2 images and airborne lidar data based on random forest. J. Int. J. Remote Sens. 2018, 40, 2410–2426. [Google Scholar] [CrossRef]
- Li, C.; Adu, B.; Wu, J.; Qin, G.; Li, H.; Han, Y. Spatial and temporal variations of drought in sichuan province from 2001 to 2020 based on modified temperature vegetation dryness index (tvdi)—Sciencedirect. J. Ecol. Indic. 2022, 139, 108883. [Google Scholar] [CrossRef]
- Brown, J.F.; Wardlow, B.D.; Tadesse, T.; Hayes, M.J.; Reed, B.C. The Vegetation Drought Response Index (VegDRI): A New Integrated Approach for Monitoring Drought Stress in Vegetation. J. GiSci. Remote Sens. 2008, 45, 16–46. [Google Scholar] [CrossRef]
- Zhang, Q.; Shi, R.; Xu, C.-Y.; Sun, P.; Yu, H.; Zhao, J. Multisource data-based integrated drought monitoring index: Model development and application. J. Hydrol. 2022, 615, 128644. [Google Scholar] [CrossRef]
- Zhang, Q.; Yu, H.; Sun, P.; Singh, V.P.; Shi, P. Multisource data based agricultural drought monitoring and agricultural loss in China. J. Glob. Planet Chang. 2019, 172, 298–306. [Google Scholar] [CrossRef]
- Wan, W.; Liu, Z.; Li, B.; Fang, H.; Wu, H.; Yang, H. Evaluating soil erosion by introducing crop residue cover and anthropogenic disturbance intensity into cropland C-factor calculation: Novel estimations from a cropland-dominant region of Northeast China. J. Soil Tillage Res. 2022, 219, 105343. [Google Scholar] [CrossRef]
- Hao, P.; Zhan, Y.; Wang, L.; Niu, Z.; Shakir, M. Feature Selection of Time Series MODIS Data for Early Crop Classification Using Random Forest: A Case Study in Kansas, USA. Remote Sens. 2015, 7, 5347–5369. [Google Scholar] [CrossRef]
- Duan, Y.; Zhong, J.; Shuai, G.; Zhu, S.; Gu, X. Time-scale transferring deep convolutional. Neural network for mapping early rice. In Proceedings of the C. IGARSS 2018—2018 IEEE International Geoscience and Remote Sensing Symposium, Valencia, Spain, 22–27 July 2018. [Google Scholar]
- Hijmans, R.J.; Cameron, S.E.; Parra, J.L.; Jones, P.G.; Jarvis, A. Very high resolution interpolated climate surfaces for global land areas. J. Int. J. Climatol. 2005, 25, 1965–1978. [Google Scholar] [CrossRef]
- Song, J. Bias corrections for Random Forest in regression using residual rotation. J. Korean Stat. Soc. 2015, 44, 321–326. [Google Scholar] [CrossRef]
- Sandholt, I.; Rasmussen, K.; Andersen, J. A simple interpretation of the surface temperature/vegetation index space for assessment of surface moisture status. J. Remote Sens. Environ. 2002, 79, 213–224. [Google Scholar] [CrossRef]
- Nabaei, S.; Sharafati, A.; Yaseen, Z.M.; Shahid, S. Copula based assessment of meteorological drought characteristics: Regional investigation of Iran. J. Agric. For. Meteorol. 2019, 276–277, 107611. [Google Scholar] [CrossRef]
- Du, L.; Song, N.; Liu, K.; Hou, J.; Hu, Y.; Zhu, Y.; Wang, X.; Wang, L.; Guo, Y. Comparison of Two Simulation Methods of the Temperature Vegetation Dryness Index (TVDI) for Drought Monitoring in Semi-Arid Regions of China. J. Remote Sens. 2017, 9, 177. [Google Scholar] [CrossRef]
- Ranzi, R.; Caronna, P.; Tomirotti, M. Impact of climatic and land use changes on river flows in the Southern Alps. In Sustainable Water Resources Planning and Management Under Climate Change; Springer: Berlin/Heidelberg, Germany, 2017; pp. 61–83. [Google Scholar]
- Zhang, Q.; Hu, Z. Assessment of drought during corn growing season in Northeast China. J. Theor. Appl. Clim. 2018, 133, 1315–1321. [Google Scholar] [CrossRef]
- Yan, H.; Zhou, G.; Yang, F.; Lu, X. DEM correction to the TVDI method on drought monitoring in karst areas. Int. J. Remote Sens. 2019, 40, 2166–2189. [Google Scholar] [CrossRef]
- Wu, D.H.; Zhao, X.; Liang, S.L.; Zhou, T.; Huang, K.C.; Tang, B.J.; Zhao, W.Q. Time-lag effects of global vegetation responses to climate change. J. Glob. Chang. Biol. 2015, 21, 3520–3531. [Google Scholar] [CrossRef]




| Time of Investigation | Developmental Stage of Spring Maize | Soil Texture | Gradient/° | Altitude/m | ||||||
|---|---|---|---|---|---|---|---|---|---|---|
| Sand | Loam | Clay | 0–0.5 | 0.5–2.0 | >2.0 | 0–100 | 100–200 | >200 | ||
| 14–18 May | Seedling | 1 | 5 | – | 3 | 2 | – | 1 | 2 | 3 |
| 12–19 July | Large bell mouth | 1 | 3 | 4 | 4 | 4 | 1 | 3 | 2 | 4 |
| 6–14 August | Grouting | 4 | 14 | 5 | 11 | 5 | 7 | 10 | 2 | 11 |
| Month | Independent Variable | R2 | RMSE | ||
|---|---|---|---|---|---|
| RF | BCRF | RF | BCRF | ||
| 5 | TVDI, CWSI, SMCI, TCI | 0.85 | 0.88 | 0.30 | 0.28 |
| 6 | TVDI, CWSI, SMCI, TCI, VCI, VHI | 0.83 | 0.86 | 0.30 | 0.29 |
| 7 | TVDI, CWSI, SMCI, VCI, VHI | 0.82 | 0.87 | 0.32 | 0.30 |
| 8 | TVDI, CWSI, SMCI, TCI, VCI, VHI | 0.83 | 0.87 | 0.38 | 0.36 |
| 9 | TVDI, CWSI, SMCI, TCI, VCI, VHI | 0.83 | 0.89 | 0.39 | 0.37 |
| Item | May | July | August | ||||
|---|---|---|---|---|---|---|---|
| SPEI | RFSDI | SPEI | RFSDI | SPEI | RFSDI | ||
| Accuracy (%) | Drought | 83.30 | 100.00 | 66.67 | 100.00 | 68.42 | 77.78 |
| Non-drought | – | – | 60.00 | 80.00 | 66.47 | 100.00 | |
| Item | Month | Average Growth Season | ||||
|---|---|---|---|---|---|---|
| 5 | 6 | 7 | 8 | 9 | ||
| Shapiro–Wilk Sig. | 0.506 | 0.694 | 0.299 | 0.531 | 0.208 | 0.416 |
| Normal distribution (Y/N) | Y | Y | Y | Y | Y | Y |
| Month | Model Veriables | Model R2 | Unstandardization Coefficient | Standardization Coefficient | Sig |
|---|---|---|---|---|---|
| May | (Constant) | 0.962 | −2.313 | – | 0.001 |
| PRE | 0.011 | 0.668 | 0.008 | ||
| RHU | 0.031 | 0.199 | 0.006 | ||
| Tmax | −0.033 | −0.231 | 0.000 | ||
| June | (Constant) | 0.955 | −1.150 | – | 0.000 |
| PRE | 0.014 | 0.406 | 0.000 | ||
| RHU | 0.048 | 0.166 | 0.004 | ||
| SSD | −0.101 | −0.721 | 0.003 | ||
| Tmin | −0.120 | −0.362 | 0.007 | ||
| July | (Constant) | 0.956 | −5.398 | – | 0.000 |
| PRE | 0.013 | 0.652 | 0.000 | ||
| RHU | 0.106 | 0.626 | 0.001 | ||
| SSD | −0.401 | −0.139 | 0.001 | ||
| August | (Constant) | 0.971 | 1.650 | – | 0.003 |
| PRE | 0.027 | 0.413 | 0.006 | ||
| RHU | 0.116 | 0.401 | 0.000 | ||
| Tmean | 0.421 | 0.125 | 0.002 | ||
| September | (Constant) | 0.983 | −4.417 | – | 0.000 |
| PRE | 0.018 | 0.570 | 0.000 | ||
| RHU | 0.058 | 0.550 | 0.000 | ||
| Tmax | −0.128 | −0.265 | 0.002 | ||
| Average growth season | (Constant) | 0.944 | −2.152 | – | 0.019 |
| PRE | 0.021 | 0.556 | 0.000 | ||
| RHU | 0.030 | 0.229 | 0.003 | ||
| Tmax | −0.053 | −0.079 | 0.000 | ||
| SSD | 0.177 | 0.243 | 0.001 |
| Month | Equation of Linear Regression |
|---|---|
| 5 | RFSDI_3May = −2.313 + 0.011PRE + 0.031RHU − 0.033Tmax |
| 6 | RFSDI_3June = −1.150 + 0.014PRE + 0.048RHU − 0.101SSD − 0.120Tmin |
| 7 | RFSDI_3July= −5.398 + 0.013PRE + 0.106RHU − 0.401SSD |
| 8 | RFSDI_3August= 1.650 + 0.027PRE + 0.116RHU + 0.421Tmean |
| 9 | RFSDI_3September= −4.417 + 0.018PRE + 0.058RHU − 0.128Tmax |
| Growth season | RFSDI_3Growth= −2.152 + 0.021PRE + 0.030RHU + 0.177SSD − 0.053Tmax |
Disclaimer/Publisher’s Note: The statements, opinions and data contained in all publications are solely those of the individual author(s) and contributor(s) and not of MDPI and/or the editor(s). MDPI and/or the editor(s) disclaim responsibility for any injury to people or property resulting from any ideas, methods, instructions or products referred to in the content. |
© 2023 by the authors. Licensee MDPI, Basel, Switzerland. This article is an open access article distributed under the terms and conditions of the Creative Commons Attribution (CC BY) license (https://creativecommons.org/licenses/by/4.0/).
Share and Cite
Wang, Y.; Meng, L.; Liu, H.; Luo, C.; Bao, Y.; Qi, B.; Zhang, X. Construction and Assessment of a Drought-Monitoring Index Based on Multi-Source Data Using a Bias-Corrected Random Forest (BCRF) Model. Remote Sens. 2023, 15, 2477. https://doi.org/10.3390/rs15092477
Wang Y, Meng L, Liu H, Luo C, Bao Y, Qi B, Zhang X. Construction and Assessment of a Drought-Monitoring Index Based on Multi-Source Data Using a Bias-Corrected Random Forest (BCRF) Model. Remote Sensing. 2023; 15(9):2477. https://doi.org/10.3390/rs15092477
Chicago/Turabian StyleWang, Yihao, Linghua Meng, Huanjun Liu, Chong Luo, Yilin Bao, Beisong Qi, and Xinle Zhang. 2023. "Construction and Assessment of a Drought-Monitoring Index Based on Multi-Source Data Using a Bias-Corrected Random Forest (BCRF) Model" Remote Sensing 15, no. 9: 2477. https://doi.org/10.3390/rs15092477
APA StyleWang, Y., Meng, L., Liu, H., Luo, C., Bao, Y., Qi, B., & Zhang, X. (2023). Construction and Assessment of a Drought-Monitoring Index Based on Multi-Source Data Using a Bias-Corrected Random Forest (BCRF) Model. Remote Sensing, 15(9), 2477. https://doi.org/10.3390/rs15092477


