Article

High-Frequency Microbarograph-Observed Pressure Variations Associated with Gust Fronts during an Extreme Rainfall Event

1
Foshan Tornado Research Center, China Meteorological Administration Tornado Key Laboratory, Guangdong Meteorological Service, Foshan 528000, China
2
Southern Marine Science and Engineering Guangdong Laboratory (Zhuhai), Zhuhai 519082, China
3
School of Atmospheric Sciences, Sun Yat-sen University, Zhuhai 519082, China
4
Key Laboratory of Transportation Meteorology of China Meteorological Administration, Nanjing Joint Institute for Atmospheric Sciences, Nanjing 210009, China
*
Author to whom correspondence should be addressed.
Remote Sens. 2024, 16(1), 101; https://doi.org/10.3390/rs16010101
Submission received: 8 September 2023 / Revised: 12 December 2023 / Accepted: 22 December 2023 / Published: 26 December 2023

Abstract

:
This study aims to explore the roles of multiple gust fronts (i.e., outflow boundaries) during a short-lived extreme rainfall that occurred in the Greater Bay Area of South China in the afternoon of 1 August 2021. Through the use of microbarographs and Doppler weather radars, the research highlights how the interactions of five gust fronts, approaching the region from different directions, have contributed to the high precipitation efficiency and damaging surface winds during the event. The close convergence of these gust fronts funneled unstable air masses into the region of interest, priming the mesoscale convective environment. Some isolated convection initiated before the gust fronts’ arrival. Preceding the arrival of these gust fronts, subtle wave-like pressure jumps were identified from the high-frequency (1 Hz) microbarograph observations. The amplitude of the pressure jump is approximately 40 Pa with minimal changes in air temperature. During the early stage of the gust front passages, very high-frequency oscillations in surface pressure are recognized, indicating interaction between the density currents and the low-level troposphere. As suggested through numerical simulations, the subtle pressure jumps are associated with upward displacements of isentropic surfaces aloft, deepening the moist layer and enhancing the lapse rate that are conducive to convective development. The simulated vertical profiles show no evident capping inversion above the dry neutral boundary layer, suggesting that the pressure jumps are likely to be dynamically induced through the collision of the outflows and environmental air masses. The findings of this study suggest the potential application of microbarographs in the nowcasting of the convective development associated with gust fronts.

1. Introduction

Located on the southern coasts of China, the Guangdong-Hong Kong-Macao Greater Bay Area (also referred to as the Greater Bay Area) is the largest and most populated (population of more than 60 million) urban area among the four largest bay areas in the globe (i.e., the bay areas of New York City, San Francisco, and Tokyo). Climatologically, the Greater Bay Area is a rainfall hotspot that is characterized by an annual rainfall accumulation of ~2000 mm. The large urban agglomerations in this region are vulnerable to heavy rainfall and the possibly associated flood exposure. In the rainy season, the warm-sector heavy rainfall (defined as a type of heavy rainfall that occurs in the warm sector at least 200−300 km from a surface front or without any front in South China) often abruptly occurs with poorer forecasting skill compared with frontal rainfall [1,2,3,4,5]. Sometimes, it can be an extreme rainfall event and thus often leads to flash floods and waterlogging. Prior studies have suggested that the frequency of extreme rainfall in the Greater Bay Area has significantly increased along with hourly rainfall enhancement in recent years [6,7]. Understanding the mechanisms of regional warm-sector extreme rainfall is thus one of the keys to potentially improve the forecasting skill of severe weather in this highly populated area.
The warm-sector rainfall in South China is demonstrated to be associated with many factors, such as topographic effects, surface heating, urban heat island, and low-level jets [8,9,10,11,12,13,14]. This type of rainfall is often associated with weak synoptic disturbances, responsible for up to 39% of the extreme hourly rainfall records in this region [15]. When strong synoptic disturbances are absent, the initiation of warm-sector rainfall may be closely related to surface convergent boundaries, such as cold outflow boundaries, and wind shift lines, especially in the presence of high moisture content and instability [4,5,16,17]. Storm-generated surface outflows often play an important role in the initiation of convection and subsequent convective development by providing forced lifting. For example, during the high-impact record-breaking rainfall (daily maximum of 524.1 mm) that occurred in the Greater Bay area during 6–7 May 2017, the interaction between cold pool outflows and low-level onshore flows is demonstrated to be responsible for the initiation and maintenance of extreme-rainfall-producing systems [18,19]. The forcing of an urban heat island also combinedly impacts the timing and location of convection initiation and the subsequent rainfall distribution [18].
The interaction (e.g., merging, intersecting, and colliding) of surface convergent boundaries often produces favorable conditions for convection initiation (CI) or intensification and thus provides guidance for CI nowcasting [20,21,22,23,24,25,26]. Based on ground-based radars, Wilson and Schreiber [21] documented that 71% of boundary collision processes triggered thunderstorms in the Denver, Colorado area. The satellite-based studies also showed that 73% of afternoon thunderstorms in the Southeastern United States were a result of the interactions of outflow boundaries [27]. The colliding outflow boundaries can enhance the low-level convergence and upward motions and thus aid in convective initiation and evolution [28]. Although boundary interaction tends to increase the probability of initiating deep convection, it does not always trigger convection. The triggering of convection can also take place prior to the boundary interaction [29,30,31,32,33].
In addition to forced lifting, outflow boundaries may dynamically produce atmospheric disturbances ahead of their leading edges, priming the mesoscale convective environment or directly triggering new storms [4,5,17,33,34,35,36,37]. This process may produce atmospheric bores that are a gravity wave response generated when storm-generated cold outflows force the layer of enhanced static stability upward [38,39,40]. During the plain elevated convection at night (PECAN) field campaign, observed bores were demonstrated to be closely related to the initiation of nocturnal convection in the Great Plains [34,41]. By creating an upward displacement of the ambient air, bores may provide a more convectively favorable condition by increasing the convective available potential energy (CAPE), reducing the convective inhibition (CIN), and lowering the level of free convection (LFC) [35,42,43,44,45]. These influences occur before the arrival of gust front (i.e., leading edges of outflow boundaries), thus providing a preconditioning for deep convection both dynamically and thermally [44,45,46,47].
In addition to the appearance of ripples reflected through radar fine lines, bores can be observed through small changes in surface pressure. A bulge in pressure that accompanies minimal (or no) change in surface temperature typically indicates the existence of a bore [46,47]. In addition to the surface measurements, upper-level observations from a lidar, Doppler radar, Doppler sodar, and microwave radiometers are also helpful for exploring the vertical structure of bores and their influences in the boundary layer [34,38,41]. Higher-precision surface pressure measurements are helpful for capturing bore signals, such as microbarographs that typically have a precision of less than 0.1 hPa [48,49,50,51]. In recent years, the Greater Bay area in China has deployed several microbarographs that allow sampling pressure with a precision of 0.001 hPa at a time interval of 1 s [52,53,54,55]. These microbarographs may be helpful for identifying subtle pressure disturbances.
The goal of this study is to conduct a detailed analysis of a warm-sector extreme rainfall that was associated with multiple gust fronts in the Greater Bay Area. With the aid of newly deployed microbarographs, the detections and measurements of pressure disturbances related to gust fronts were assessed. These microbarographs provide high-precision pressure observations that are beneficial to the examination of the pressure disturbances prior to the arrival and during the passage of cold pool outflows. Given the high impact of the extreme rainfall that occurs in the highly populated and well-industrialized Greater Bay Area, improving our understanding of the possible triggering mechanisms would be of great help for disaster prevention and mitigation in this region. More details of the microbarographs are presented in Section 2. Section 3 presents the overview of the warm-sector extreme rainfall case and the interactions among multiple outflow boundaries. The pressure disturbances associated with storm outflows in the low-shear environment are also discussed in this section. In Section 4, numerical simulations are conducted to discuss the preconditioning of convective development associated with the pressure disturbances. The manuscript is then concluded in Section 5.

2. Materials and Methods

The surface analysis was conducted primarily based on the quality-controlled observations obtained from the in situ surface weather stations, including the national-level stations and regional-level stations in South China. In the region of interest, Foshan city, there were 251 automated weather stations during the rainfall event (Figure 1). Most stations provided observations of surface horizontal winds, pressure, temperature, and relative humidity as well as precipitation at a time interval of 5 min. These data were processed with quality-controlled procedures that include the climatological limit value test, internal consistency test, and space and time continuity tests.
In addition to the surface pressure provided by these weather stations, higher-frequency pressure observations were available through five microbarographs that were equipped with high-precision electronic pressure sensors (Figure 1). These pressure data provided an opportunity to analyze pressure variability at a time interval of 1 s during the passage of gust fronts. To eliminate the influence of temperature change on air pressure, a copper shell was employed as an insulation box and a microbarograph was deployed in the insulation copper shell with a constant ambient temperature of 45 °C. When the temperature was lower than 45 °C, a heating plate inside would guarantee the temperature around the pressure sensor and keep temperature deviation within ±0.5 °C. Noise filtering was employed for the purpose of data collection to avoid interference from noise. Compared with the barometers of traditional weather stations that have a measurement accuracy of 0.1 hPa, these microbarographs provided a much higher measurement accuracy of 0.001 hPa and had a data sampling frequency of 1 Hz. Meanwhile, the surface stations that were equipped with microbarographs also provided the air temperature, horizontal wind, and humidity data every 5 min.
The mosaics of radar reflectivity factors obtained from the operational dual-polarization S-band weather radars in South China were utilized to analyze the evolution of convective systems. The fine structures of storms and the associated radar fine lines (e.g., gust fronts) were primarily assessed using two dual-polarization S-band radars deployed in Guangzhou city and Zhaoqing city (Figure 1a). The storms and gust fronts of interest were mainly located within a 40 km range of the two radars. These radars conform to the weather surveillance radar-1988 Doppler (WSR-88D) used in the United States in terms of both hardware and software. During this event, it operated in volume coverage pattern 21 (VCP21) with a volumetric update time of nearly 360 s. The radar data were collected in 250 m range bins approximately every 1° in azimuth with the radar beam widths of approximately 1° in both horizontal and vertical directions.
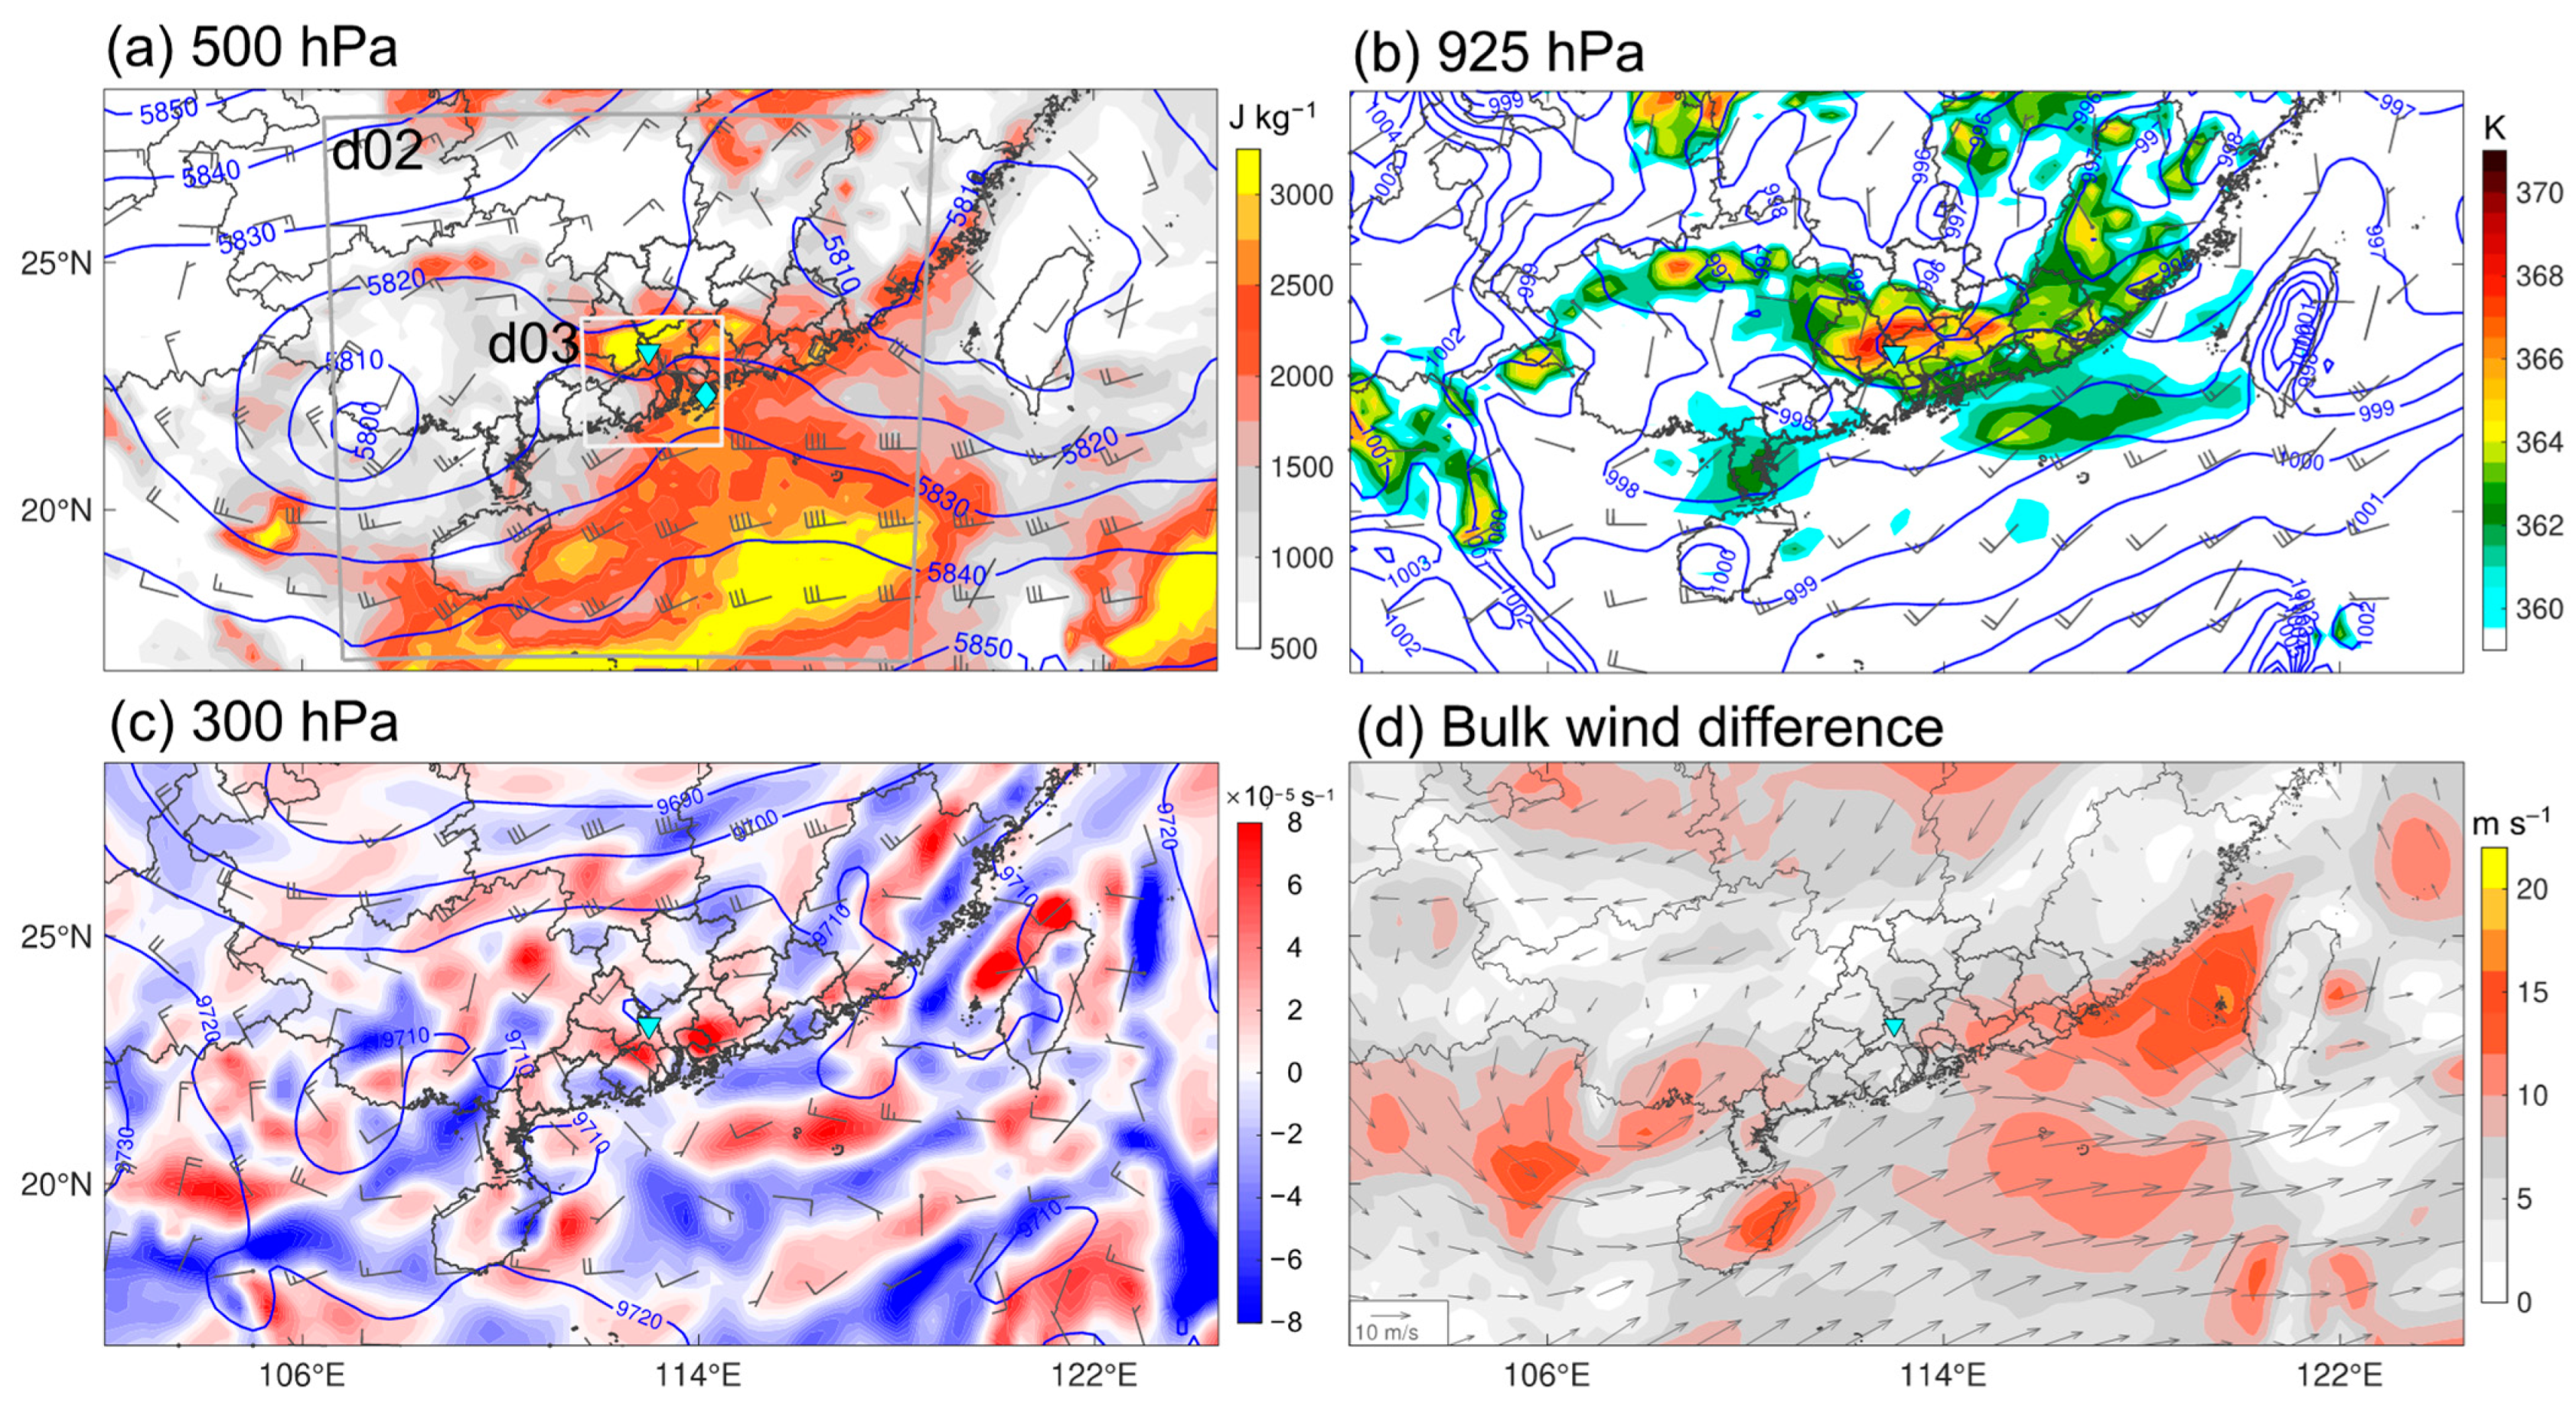
To investigate the upper-level mesoscale convective environment, high-resolution dynamically downscaled numerical simulations were conducted using the advanced research weather research and forecasting (ARW-WRF) model [56]. Three two-way nested domains were configured with horizontal grid spacings of 9 km, 3 km, and 1 km, respectively (Figure 2a). The model had 50 vertical levels and the highest model level was located at 50 hPa. The main physical parameterization schemes that were used included the WSM six-class microphysics scheme [57], Monin–Obukhov–Janjic Eta scheme [58] for surface layer parameterization, YSU PBL scheme [59], and RRTMG (the revised rapid radiative transfer model) longwave and shortwave radiation scheme [60] for longwave and shortwave radiation. The model was initiated at 0800 LST on 1 August 2021 and integrated for 24 h. The initial and lateral boundary conditions for modeling were provided through the fifth generation of ECMWF atmospheric reanalysis data (ERA5) [61]. The ERA5 data were hourly available at a horizontal resolution of 0.25° with 37 vertical pressure levels. The model outputs of the innermost domain were saved every 1 min.

3. Results

3.1. Overview of the Short-Lived Extreme Rainfall

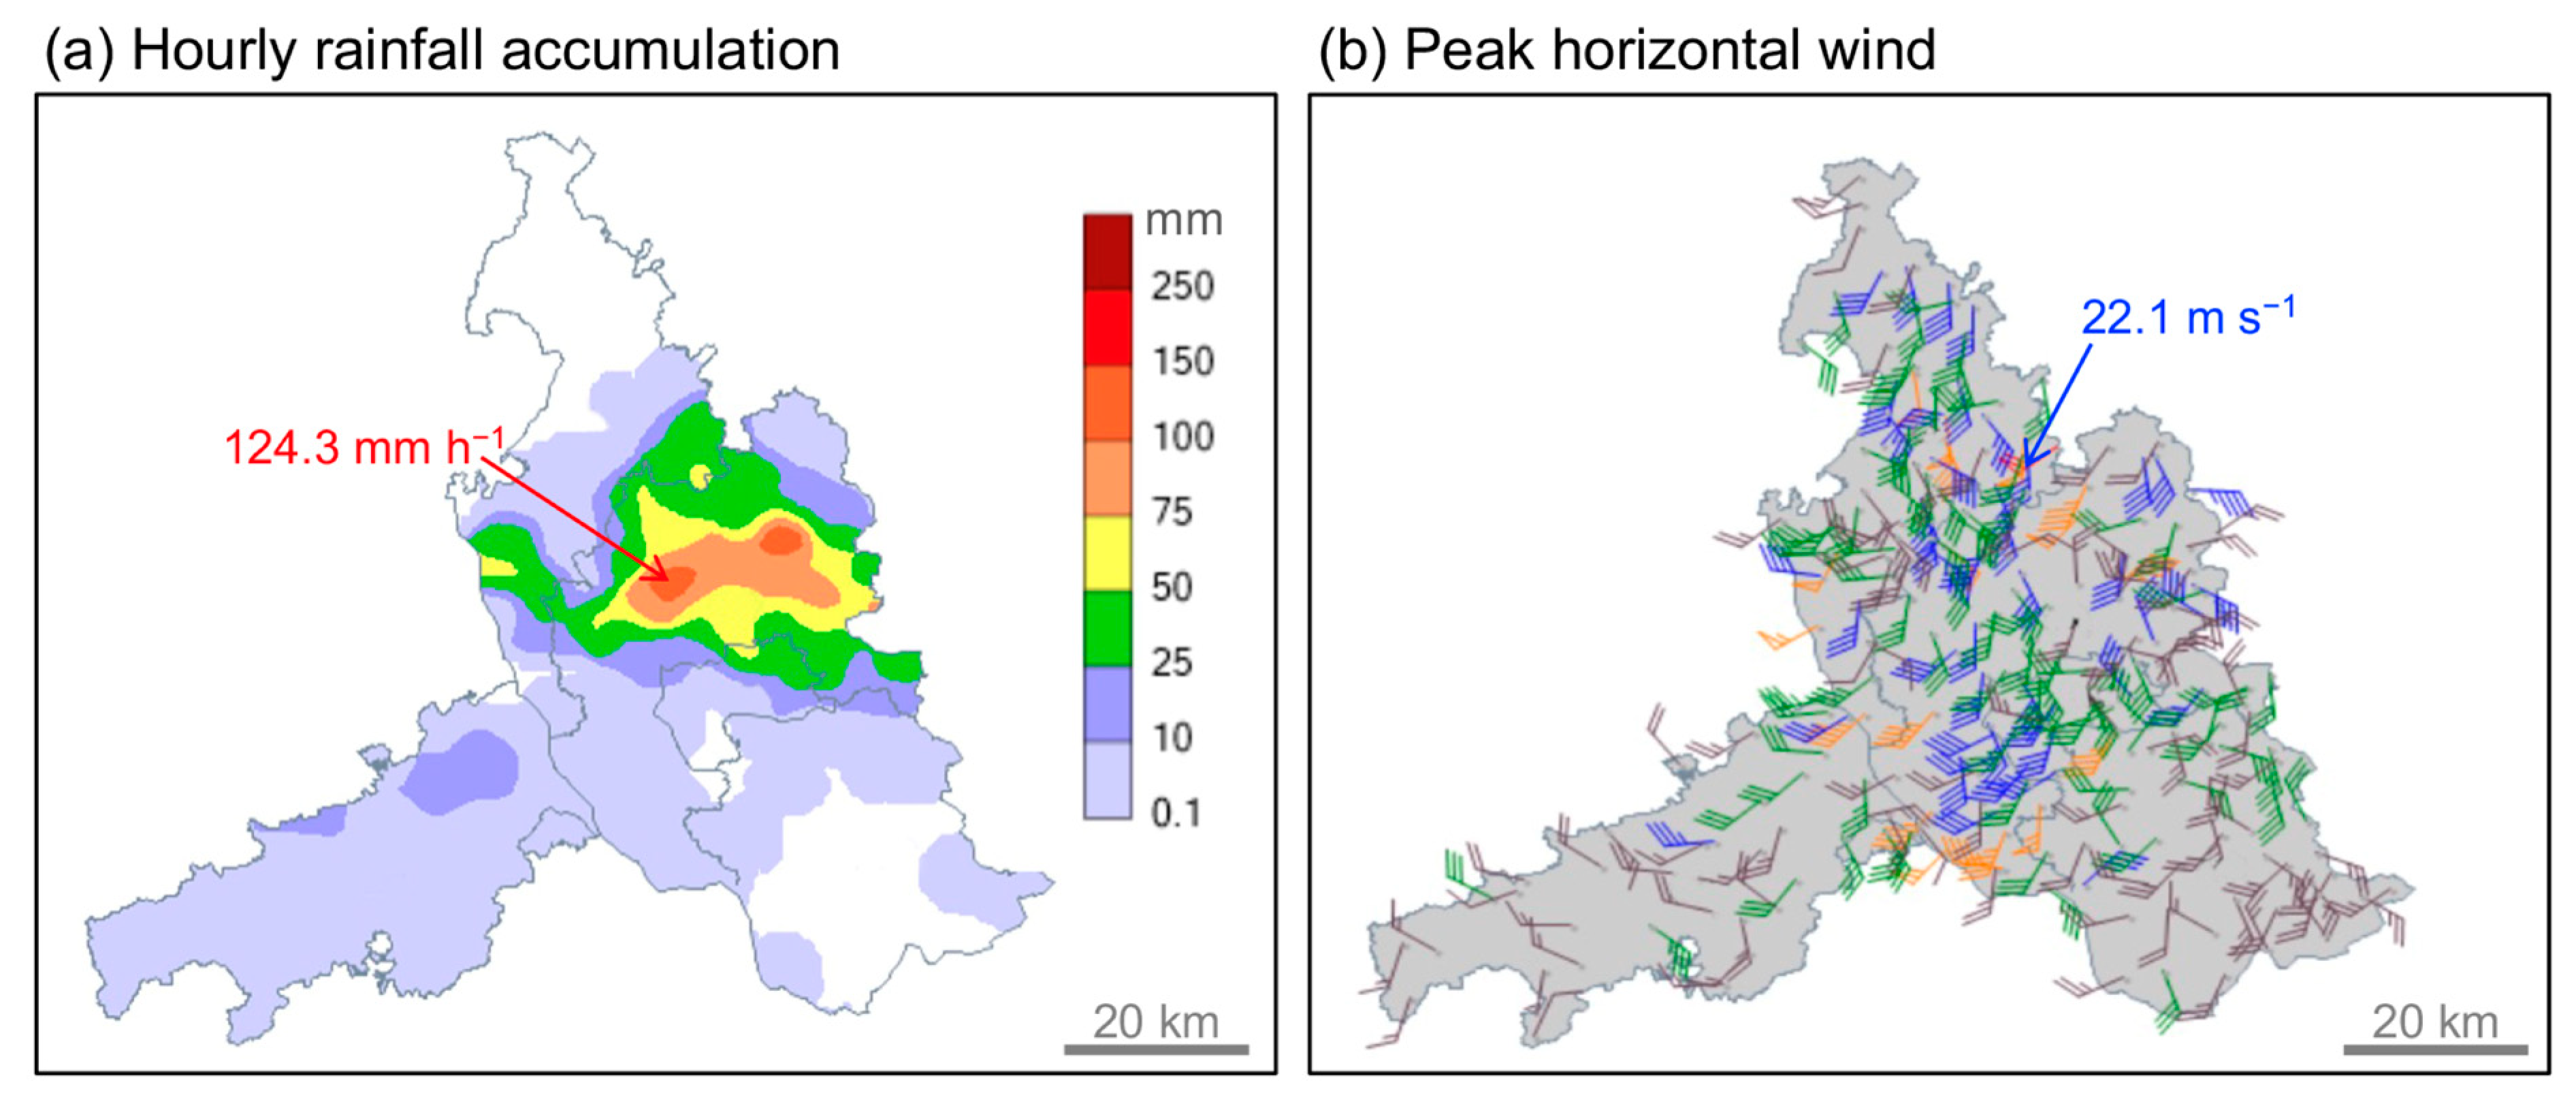
The extreme rainfall event occurred in Foshan city (refer to the blue ellipse in Figure 3) during the late afternoon on 1 August 2021. Before 1600 LST on that day, widespread storms dominated the coastal regions while the Foshan area was convection-free (Figure 3a,b). The first occurrence of convective echoes (greater than 40 dBZ) in Foshan was recognized before 1700 LST, indicating the initiation of convection. The initiated convection appeared to be several scattered isolated storms (Figure 4). These initiated storms were surrounded pre-existing storms to the west, south, and east (Figure 3c). In the following hour, the triggered storms rapidly grew upscale (refer to the arrow in Figure 2d), creating a peak rain rate of 124.3 mm h−1 at one weather station (marked through the arrow in Figure 5a). Such a rain rate became the second highest recorded in this city (highest record = 126.6 mm h−1). Strong gusts were also observed during 1720–1800 LST, reaching a maximum speed of 22.1 m s−1 (Figure 5b). The rainfall systems underwent dissipation after 1830 LST, indicating short-lived extreme rainfall.
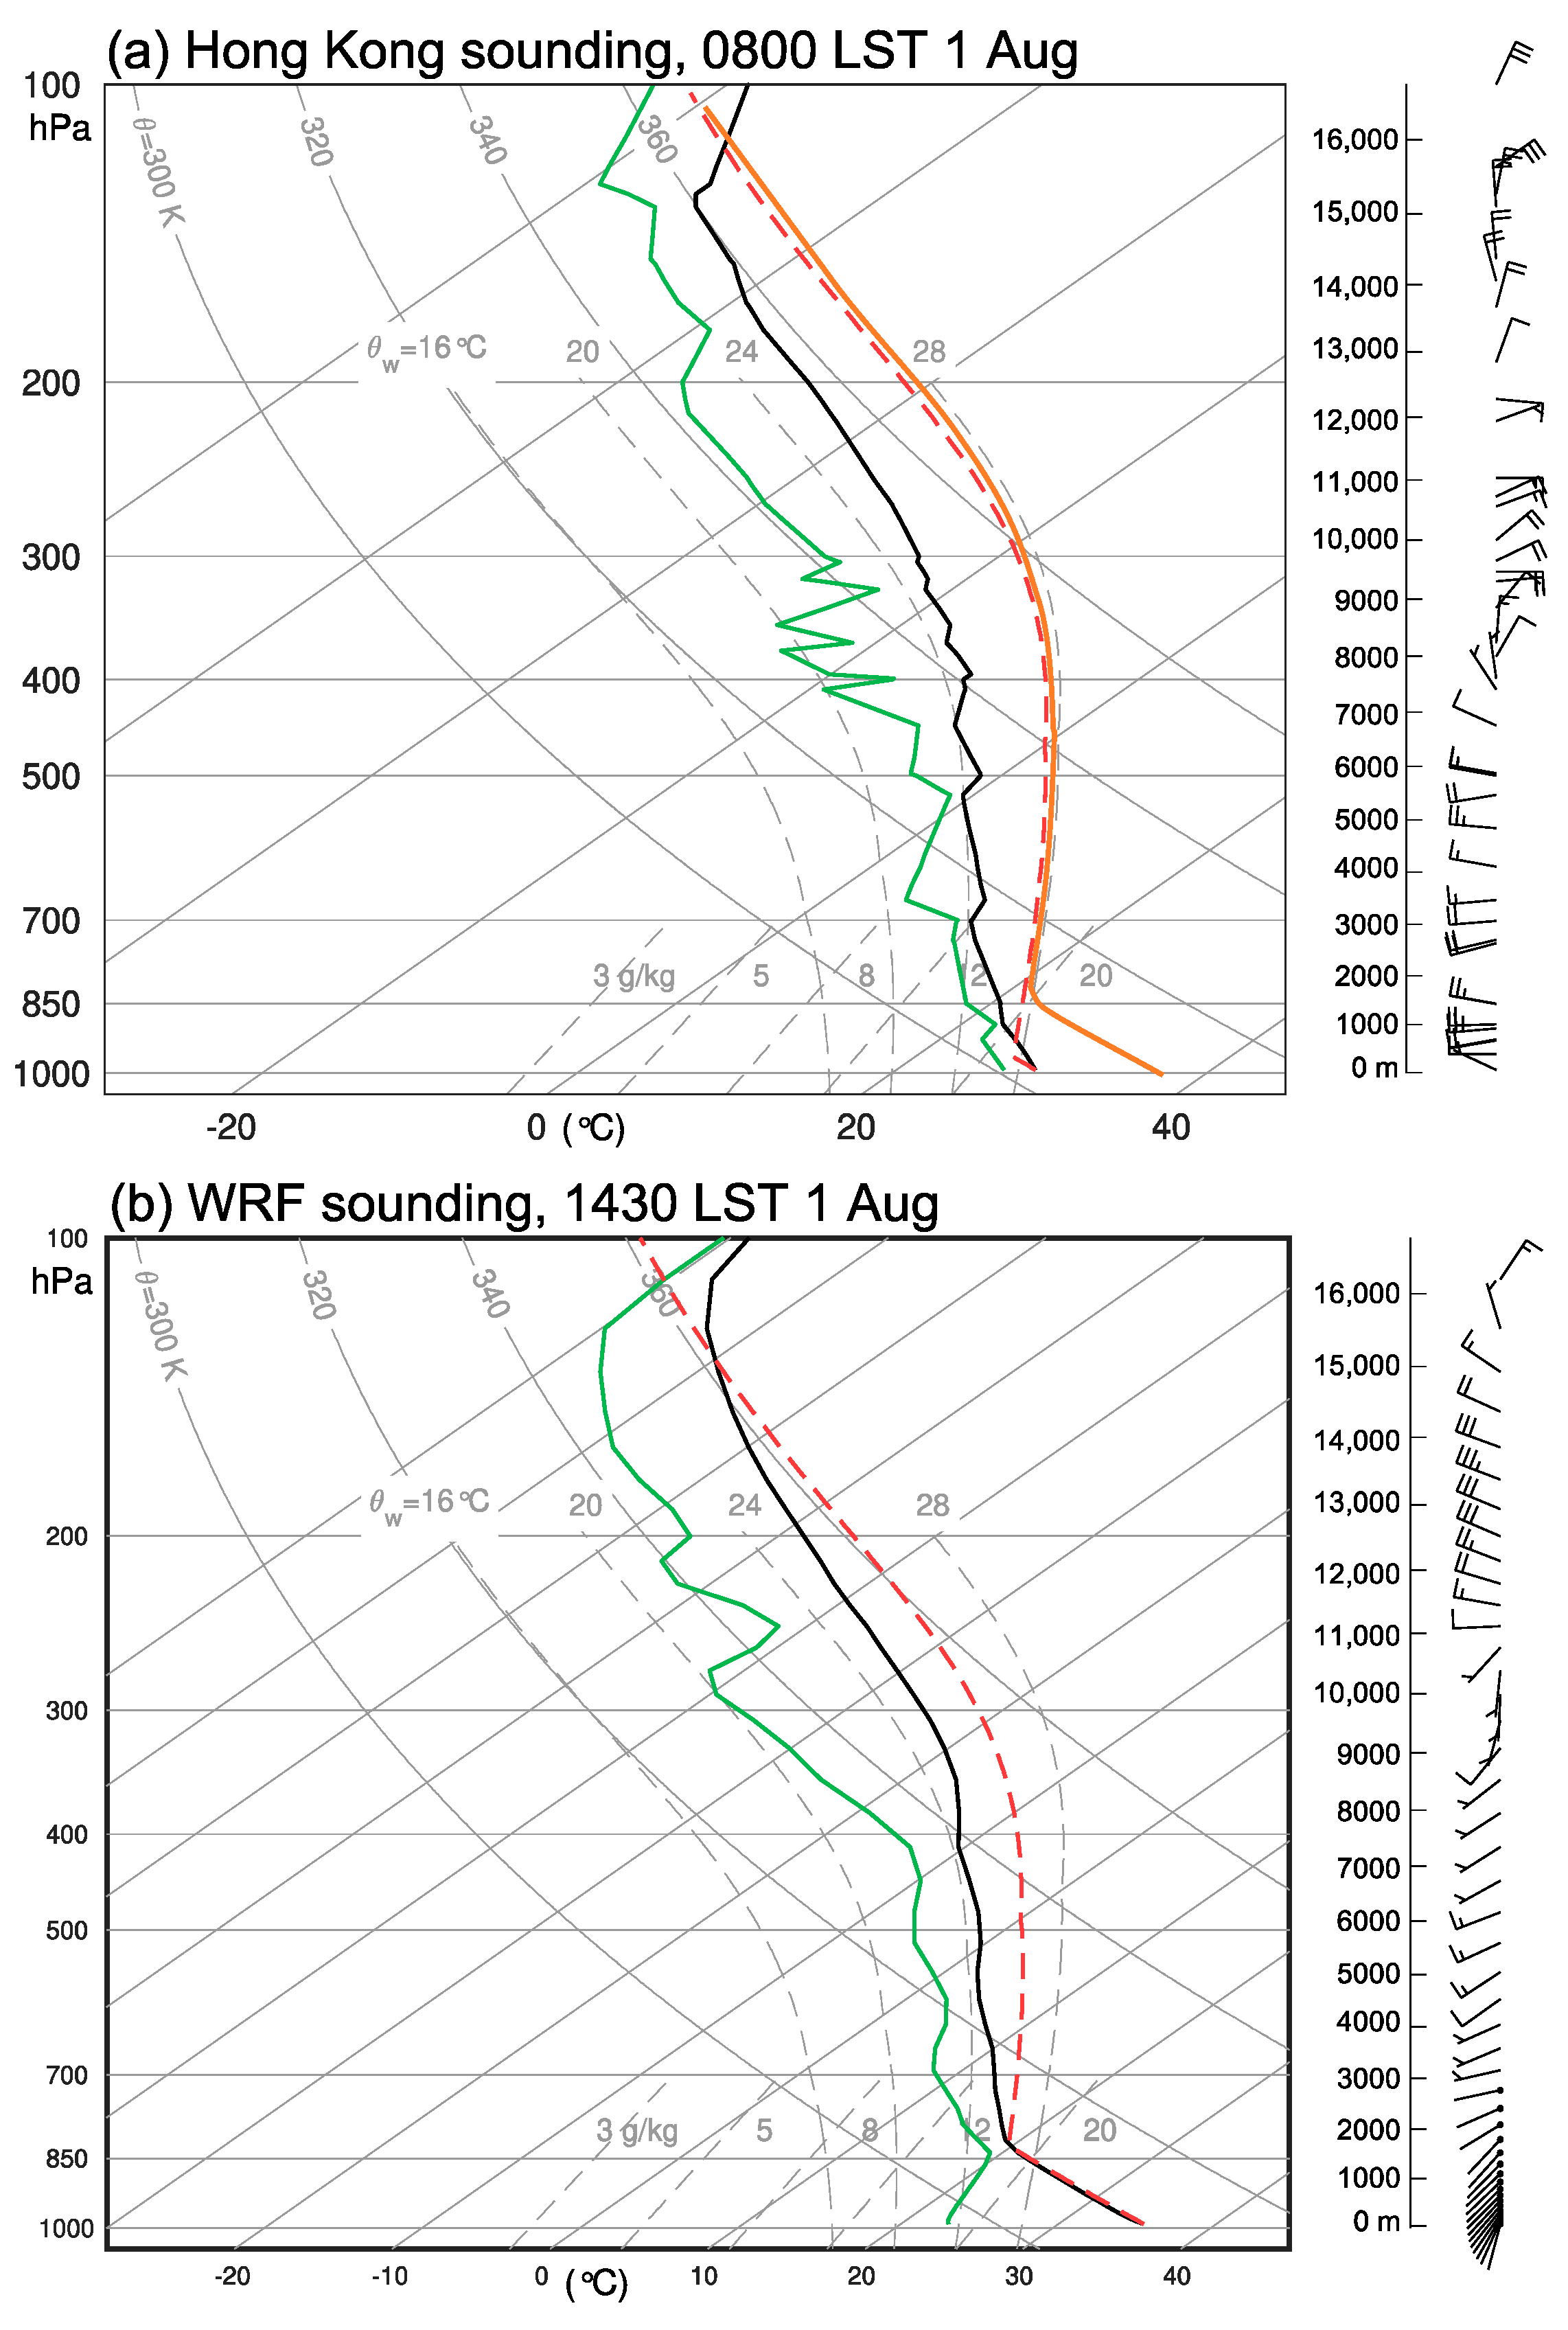
The synoptic analysis suggests that the widespread rainstorms in the coastal area of South China took place in an environment that was characterized by strong synoptic forcing but low vertical wind shear (Figure 2). It was a warm-sector rainfall event since the rainfall process occurred in South China without frontal systems [1,2]. The region of interest (refer to the triangle in Figure 2) was beneath an almost zonally oriented elongated 500-hPa trough and was located in a surface low-pressure area with high instability (Figure 2a,b). This area was characterized by deep-layer wind shifts according to a southwest–northeast orientation and divergence on the upper level (Figure 2a–c). Although the synoptic-scale disturbances primed the mesoscale environment for storms by way of large-scale mean ascent, this region featured modest vertical wind shear (Figure 2d). The sounding profiles taken at Hong Kong at 0800 LST (Figure 6a) and 2000 LST (not shown) on 1 August show that, despite the high values of surfaced-based CAPE in place (2882 J kg−1), the 0–6 km layer bulk wind differences (BWDs) as a proxy of vertical wind shear [62] were only 3.8 m s−1 and 2.3 m s−1, respectively. Considering that 0–6 km BWD is typically applied to cases in middle latitudes with an equilibrium level (EL) height near 12 km [63], the storm environments were also assessed by referencing the EL height in this case. According to the observed sounding profile at Hong Kong, the computed EL height of a surface-based air parcel was 16.1 km AGL. The halfway point in EL height (8 km layer) was thus selected to assess the characterized vertical wind shear. The computed 0–8 km BWD was 4.6 m s−1, slightly greater than the 0–6 km BWD.
It is worth noting that the Hong Kong sounding is located on the coast while the Foshan area is located inland. After a simple correction to the soundings using the surface air temperature (36.0 °C) and relative humidity (50%) at 1400 LST as observed from a surface station in the storm region, the surfaced-based CAPE increased to 3009 J kg−1. Prior studies have suggested that such environmental conditions (low shear, high CAPE) are conducive to pulse storms that often produce severe weather in a short period of time and also dissipate in a short time [62].

3.2. Radar Analysis on the Mesoscale Boundaries and Associated Storms

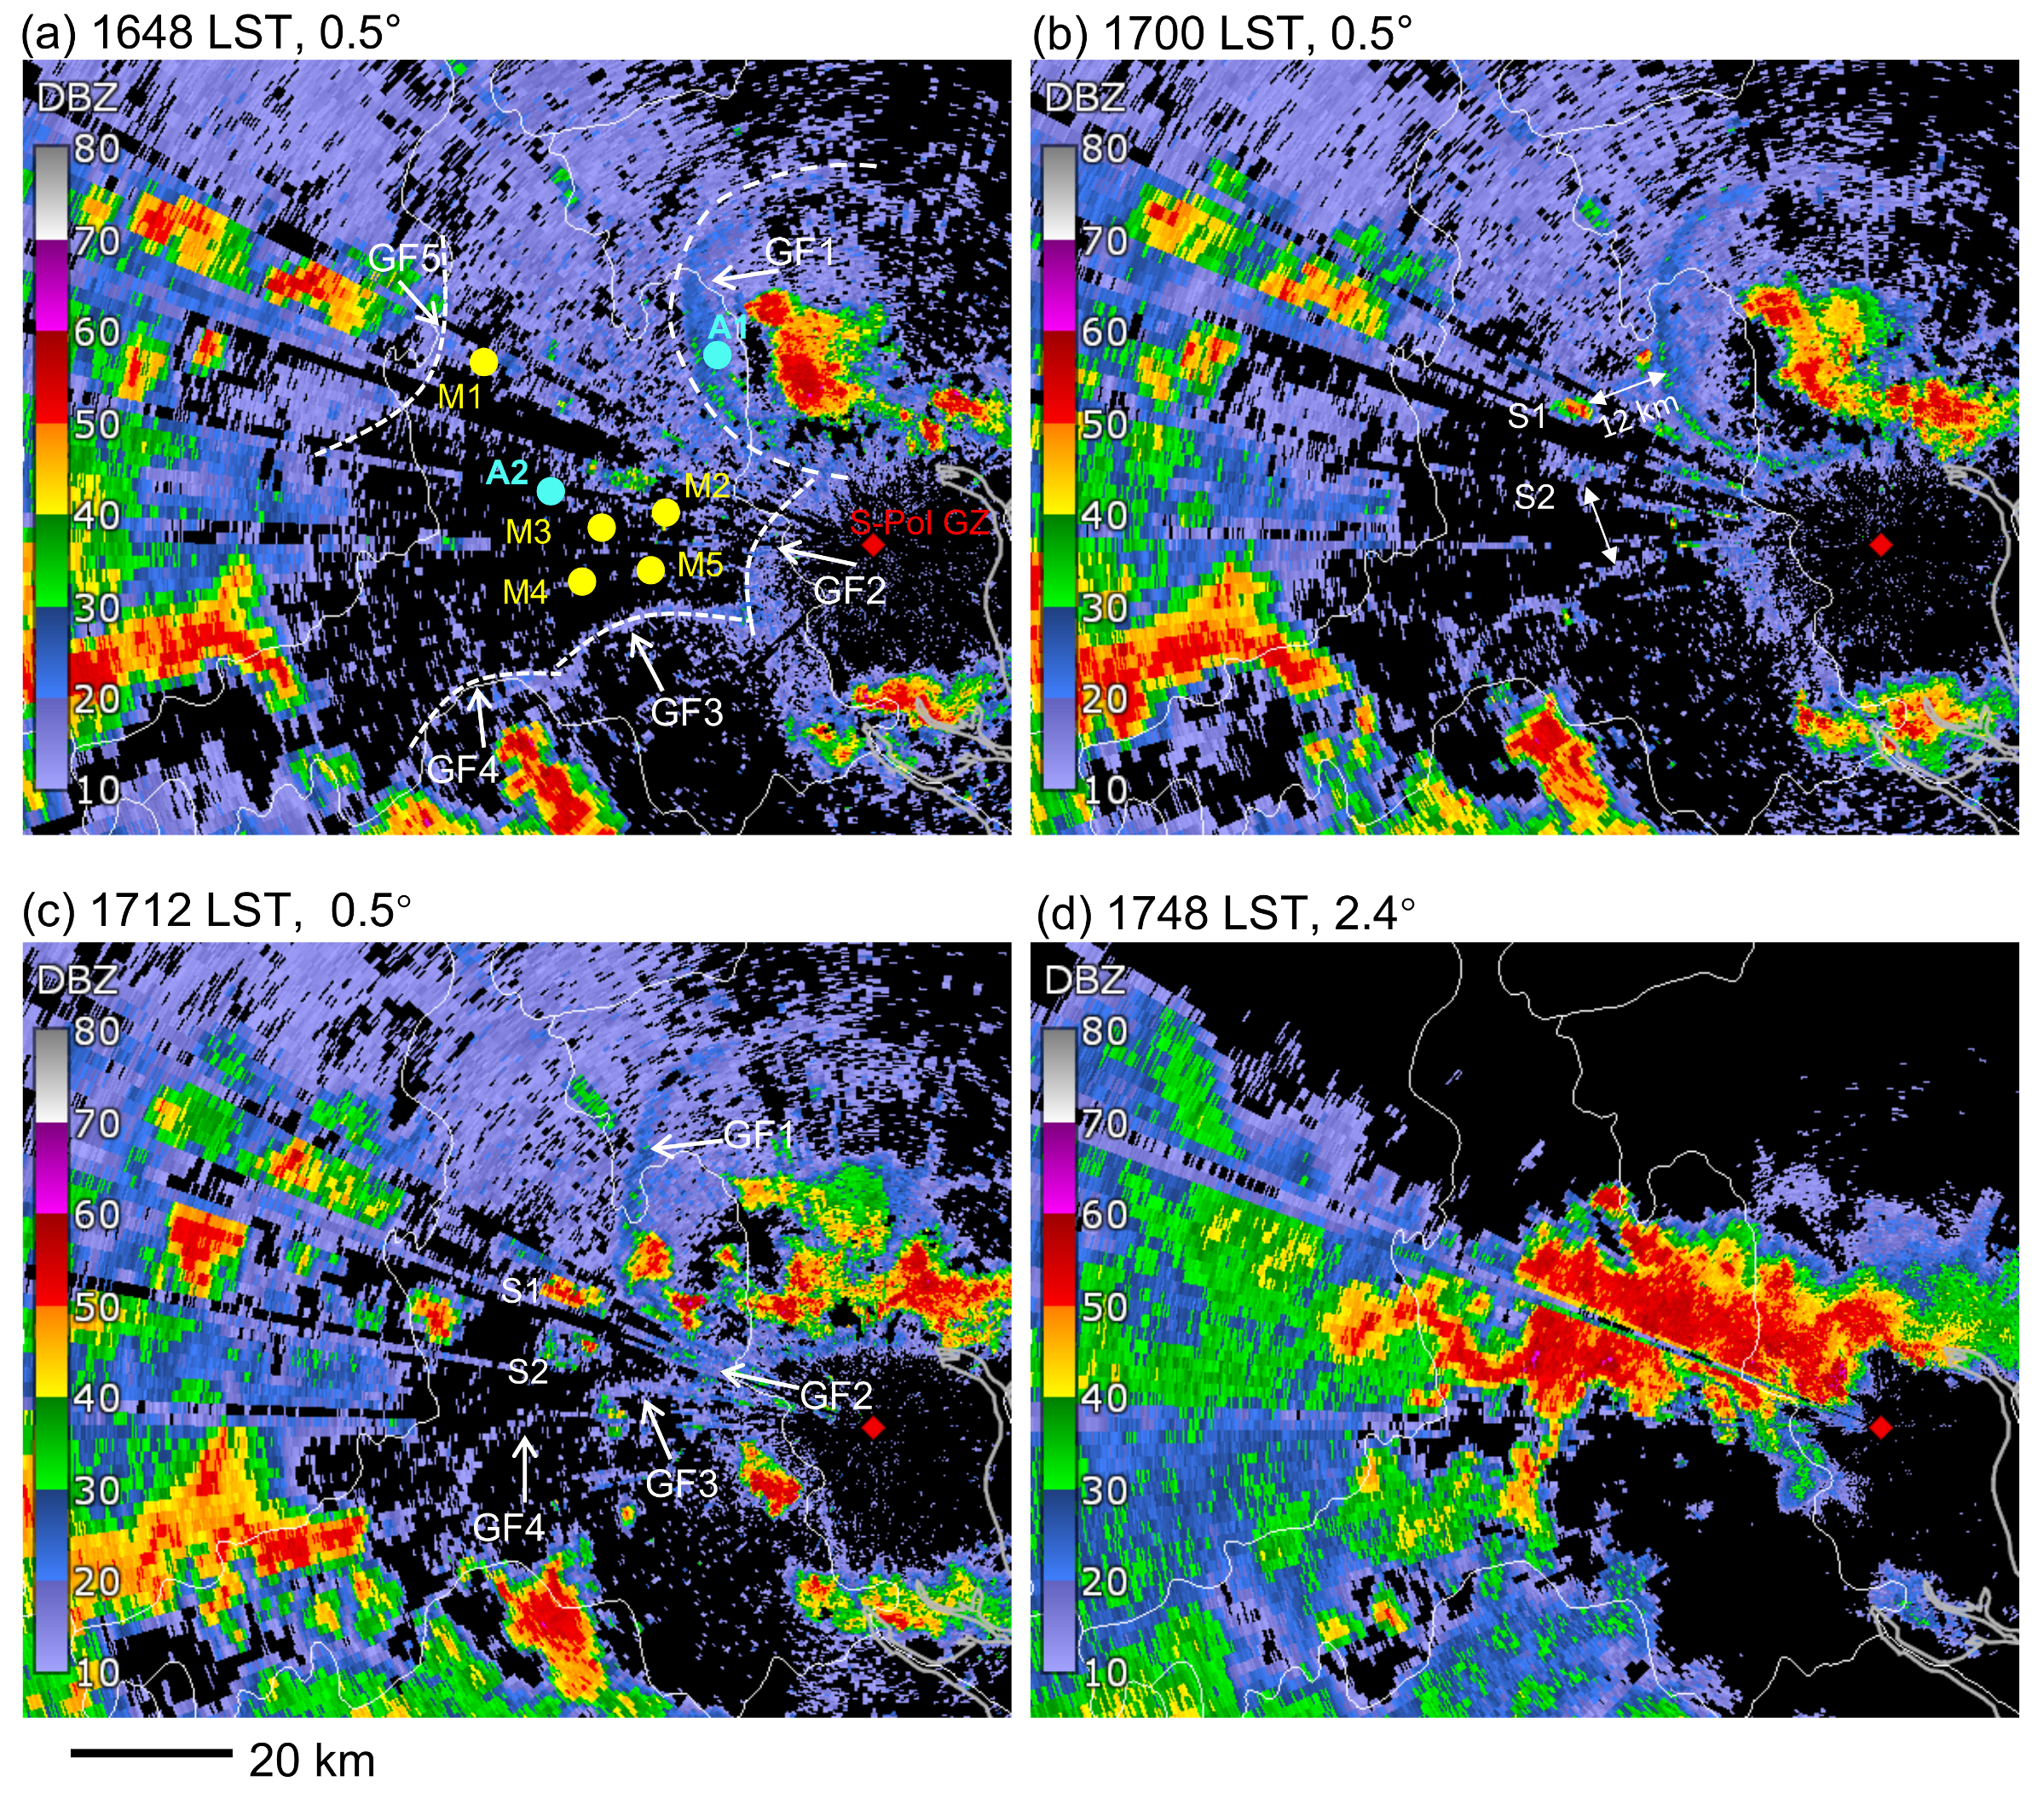
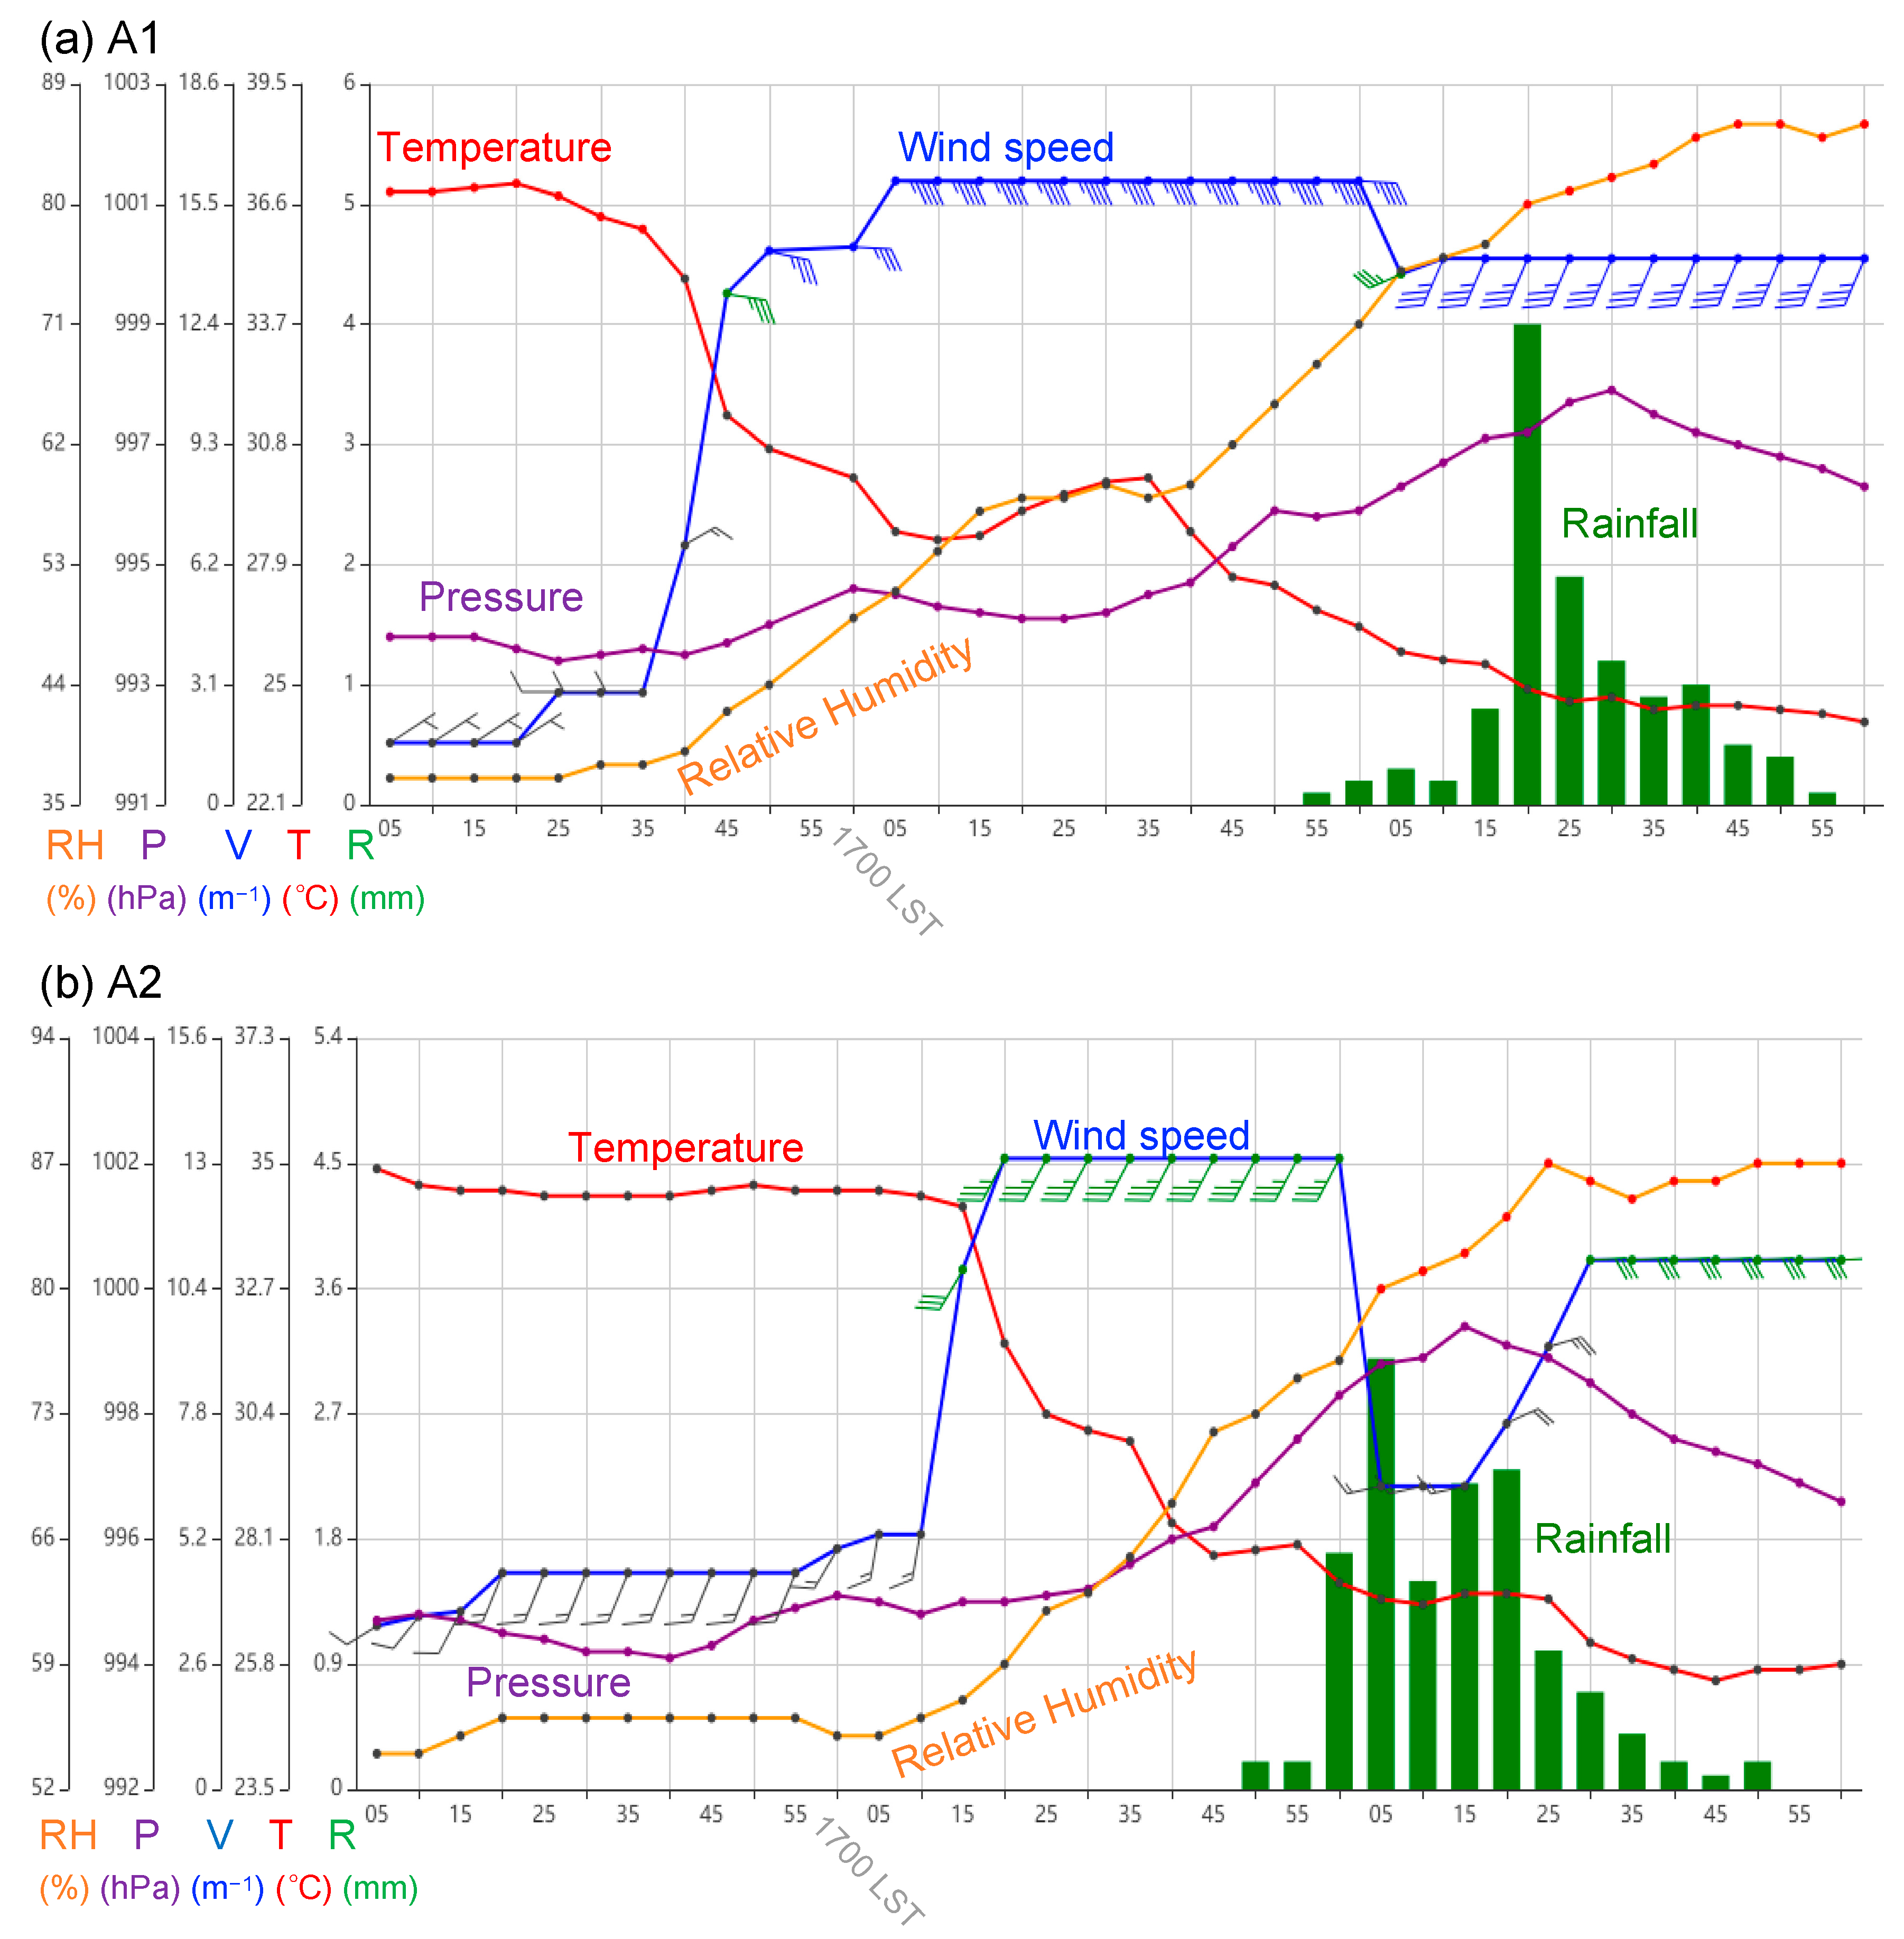
In this section, the general evolution of the surface mesoscale boundaries identified using Doppler radars are first discussed. Closer inspection of the lowest-level radar reflectivity shows that the interactions of multiple-radar fine lines were identified prior to the storm initiation of interest. Figure 4 shows the evolutions of the low-level reflectivity factor of the S-Pol GZ. At 1642 LST, a pulse storm that was located to the east of Foshan city generated a radar fine line in a circular shape. The west part of the radar fine line (labeled GF1 in Figure 4a) moved into the region of interest. Meanwhile, a series of well-defined radar fine lines (labeled GF2, GF3, and GF4 in Figure 4a) that emanated from the southern storms were identified. Figure 7a shows that the surface air temperature had dropped by approximately 7 °C from 1630 to 1710 LST when the radar fine line GF1 moved across station A1. An abrupt shift in wind direction occurred as the weak westerlies (~2 m s−1) rapidly turned to easterly high winds at a speed of 18 m s−1. To the southwest of this station, the prevailing southwesterlies also underwent a sharp enhancement in speed after the passage of GF1 during 1710–1720 LST (Figure 7b). The changes in surface air temperature, pressure, wind speed, and direction during the passage of radar fine lines suggest that these fine lines were storm-generated cold outflow boundaries (i.e., gust fronts).
The details of the distributions and evolution of the multiple gust fronts are presented in Figure 8. Gust fronts GF1–GF4 manifested as a scalloped pattern on which multiple intersection points were located. Another gust front, GF5, that was identified through the S-Pol ZQ moved toward the east from the western border of Foshan. Prior to the arrival of these gust fronts, several storms (e.g., storms S1 and S2 in Figure 4) had been triggered. These storms were likely from the afternoon thermal convection or were triggered due to other unknown factors because no evident convergence was present near the storm positions. Storms S1 and S2 were initiated approximately 12 km ahead of the gust fronts GF1 and GF3, respectively (Figure 4b). New vigorous storms were also located on the gust fronts and over the intersection points of adjacent gust fronts while these storms were generally short-lived. Previous studies have demonstrated that these intersection regions are favorable for convection initiation, but the triggered convection tend to be short-lived because the underlying surface is quickly dominated by cold pools [29,31].
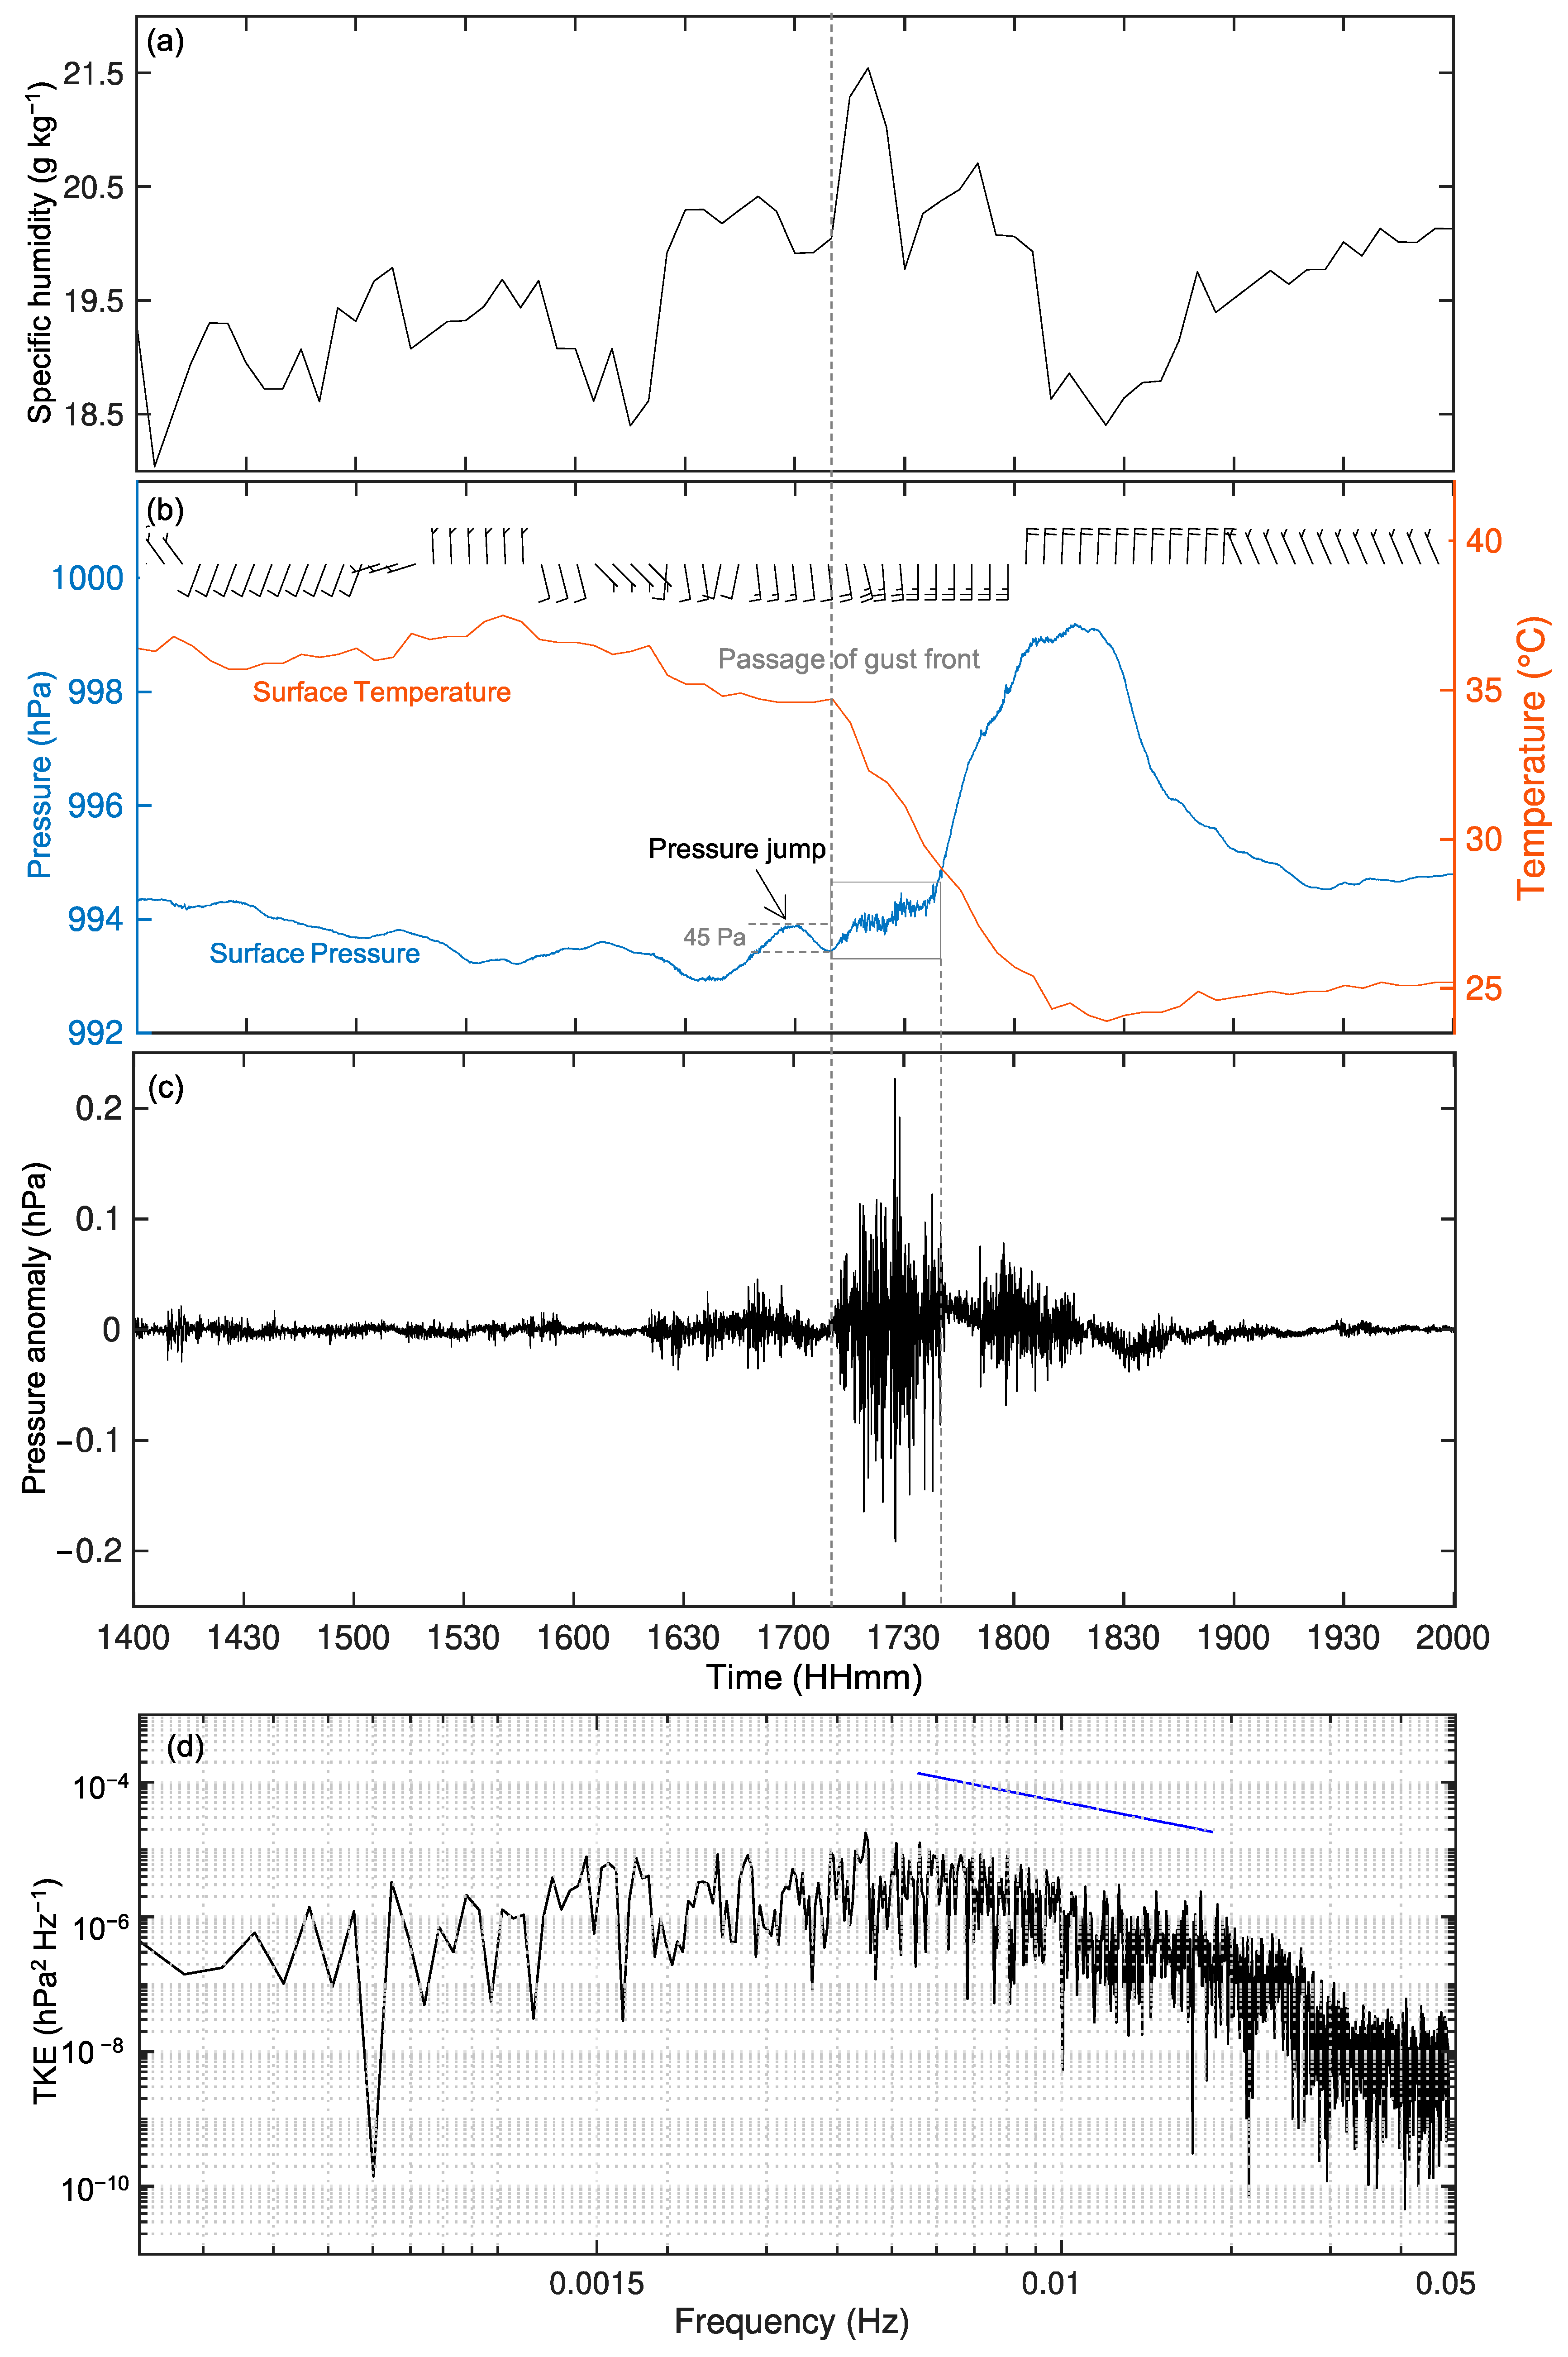
These five gust fronts approached each other and squeezed the low-level air masses in the region of interest (the position of later extreme rainfall). Given the gust fronts’ mutual close approaching (Figure 8), the squeezed low-level moist air masses were presumed to prime the mesoscale environment for convection initiation by way of moisture pooling and forced lifting. Figure 9a presents the time series of moisture content at station M2. The specific humidity underwent an increase before the arrival of gust fronts. The average specific humidity during 1630–1710 LST increased by approximately 2 g kg−1 compared with that during 1400–1630 LST. It is worth noting that, while most stations underwent a general increase in moisture, the amplitudes varied among stations. After the passage of the gust front from 1710 LST, the specific humidity further increased by approximately 2 g kg−1 (Figure 9a). With the low-level moistening, the conditional instability of surface-based air parcels would further increase, supportive of the preconditioning to the subsequent vigorous deep convection.
The moisture and instability from the unstable air masses that were squeezed by the approaching gust fronts were then quickly replaced through the low-level stabilized cool air masses behind the gust fronts. As a result, the precipitation process only lasted for a short time period. Additionally, under the low-shear environment, the newborn storms in the Foshan area behaved as a pulse storm nature. Circular-shape outflow boundaries were identified rapidly emanating from these storms and cut off the inflows. Most rainfall gauges from surface weather stations recorded a time period of rainfall less than 1 h.
During this extreme rainfall event, in addition to the passage of gust fronts, observations from some microbarographs identified subtle pressure jumps immediately before the arrival of gust fronts (refer to the black arrow in Figure 9b and Figure 10a,b). The five microbarographs deployed in the Foshan region were located close to the interacting zone of gust fronts GF1–GF5 (Figure 8). At 1700 LST, gust front GF3 arrived at stations M4 and M5 as indicated through the sharp decreases in surface air temperature (Figure 10c,d). It then arrived at stations M3 and M2 at 1705 LST and 1712 LST, respectively (Figure 8). At 1712 LST, station M1 was swept by gust front GF1. Consequently, the observations from microbarograph stations M2–M5 were primarily representative of the measurements for gust front GF3. In the case at hand, three microbarographs (M1, M2 and M3) captured well-defined pressure jumps approximately 15–25 min prior to the passage of gust fronts. The surface pressure underwent a gentle increase and then a decrease until the gust front’s arrival when the surface air temperature started to drop rapidly. The amplitudes of pressure jumps ranged from 30 to 50 Pa with little changes in air temperature (Figure 9b and Figure 10a,b). Here, the amplitudes were calculated using the differences between the peak pressure and the subsequent minimum pressure over the periods as indicated through the horizontal dashed lines in Figure 9 and Figure 10. Such an amplitude of pressure rise is comparable to the measurement of a developing bore in the Great Plains region of the United States during the IHOP_2002 field campaign (refer to Figure 6a in Knupp 2006).
According to the observed horizontal wind speeds during the passage of gust fronts, the pressure jumps were estimated to precede the gust fronts by 12–15 km. The distance was estimated according to the propagation speed of gust front and the time window between the onset of pressure jump and the following gust front’s arrival at a surface weather station. Recalling the distances (~12 km) of the newborn storms and neighboring gust fronts as discussed in the above section, these pressure jumps that preceded the gust fronts were estimated to have arrived at the convection initiation positions when the focused storms began to initiate.
Among the five microbarographs, the wave-like pressure variations were well-defined only when the stations were characterized by a rapid drop in air temperature during the passage of gust fronts. At stations M1–M3, where evident pressure jumps were present, the air temperature decreased by approximately 7 °C, 10 °C, and 6 °C during a short time period of 25 min after the gust front passages, respectively (Figure 9a and Figure 10a,b). In contrast, the temperature drops were relatively calmer at stations M4 and M5 where the wave-like pressure variations were absent. At these stations, the air temperature decreased by 3.4 °C and 4.0 °C within a 25 min period after the arrival of the gust front GF3, respectively (Figure 10c,d). Both microbarographs M3 and M4 were located on the gust front GF3 (Figure 8), while only microbarograph M3 identified the wave-like pressure structure, suggesting that this phenomenon was also sensitive to the horizontal heterogeneity of density current strength along the entire length of the outflow boundary.
Near these microbarographs, pressure jumps were also observed by some conventional surface weather stations, although they were not as distinct as those observed through microbarographs. For example, the conventional surface weather station A2 (Figure 8) appeared to have sampled a slight pressure jump from 1645 to 1710 LST (Figure 7b). The pressure increased to its peak intensity at 1700 LST, while the air temperature started to rapidly decrease from 1715 LST, indicative of the passage of gust front GF1. In this area, the rainfall started at 1750 LST (refer to the green bars in Figure 7b). Compared with the conventional station that was equipped with a traditional barometer, microbarographs provided a better portrait of the surface pressure variation.
Owing to high-frequency sampling (1 Hz) and high measurement accuracy (0.001 hPa), some turbulent components associated with small-scale eddies can be captured using these microbarographs. During the passage of the aforementioned gust fronts, very high-frequency oscillations were salient (refer to the pressure variations in the dashed boxes in Figure 9b and Figure 10a,b). Figure 9c shows the surface pressure anomalies by subtracting the 9-point running average of pressure. The pressure anomalies were generally within 15 Pa. Figure 9d presents the turbulent pressure spectrum using the data taken during the passage of gust front GF3. The frequency of the energy peak primarily ranged from 0.005 to 0.01 Hz. This turbulence established a cascading rate resembling the K−5/3 inertial subrange slope toward the higher-frequency end. The high-frequency variation in surface pressure during the passage of the gust front may suggest vigorous turbulence as a result of the interaction between the gust front nose and the ambient atmosphere in the near surface layer. During the passage of gust fronts, the surface pressure increased gently while the surface air temperature rapidly decreased by approximately 6–7 °C (e.g., Figure 9a and Figure 10a,b). A detailed analysis of the evolution and dynamics of these cold pool outflow-associated phenomena is beyond the scope of the present study, although it warrants an investigation in the near future.
After this time period, the surface pressure dramatically increased and the air temperature continued to decrease (Figure 9b and Figure 10). A close inspection of rainfall shows that the subsequent rapid increases in surface pressure and decreases in temperature were associated with new cold pools produced through the new convection in the region of interest (as indicated by the rainfall observations in Figure 7). These locally formed cold pools generated surface pressure increases of 400–500 Pa. Such a cool layer near the ground and the associated gust fronts that quickly moved away from parent storms were responsible for the short-lived nature of the extreme rainfall in this case.

4. Discussion

Previous studies suggest that atmospheric bores may be generated when cold pool outflows impinge upon a stable surface layer. The bores ahead of these outflow boundaries often lead to vertical displacements of low-level layers, which tend to enhance the vertical mixing and thus prime the convective environment [28]. Often, the near surface temperature remains the same or even increases during a bore passage. In the case at hand, the surface air temperature appeared to hold steady as the pressure pulse went by. Based on the observations, a wave-like structure was recognized during this process. In this section, we present an analysis on the vertical environmental profiles based on the simulated results from the innermost WRF domain as introduced in Section 2.
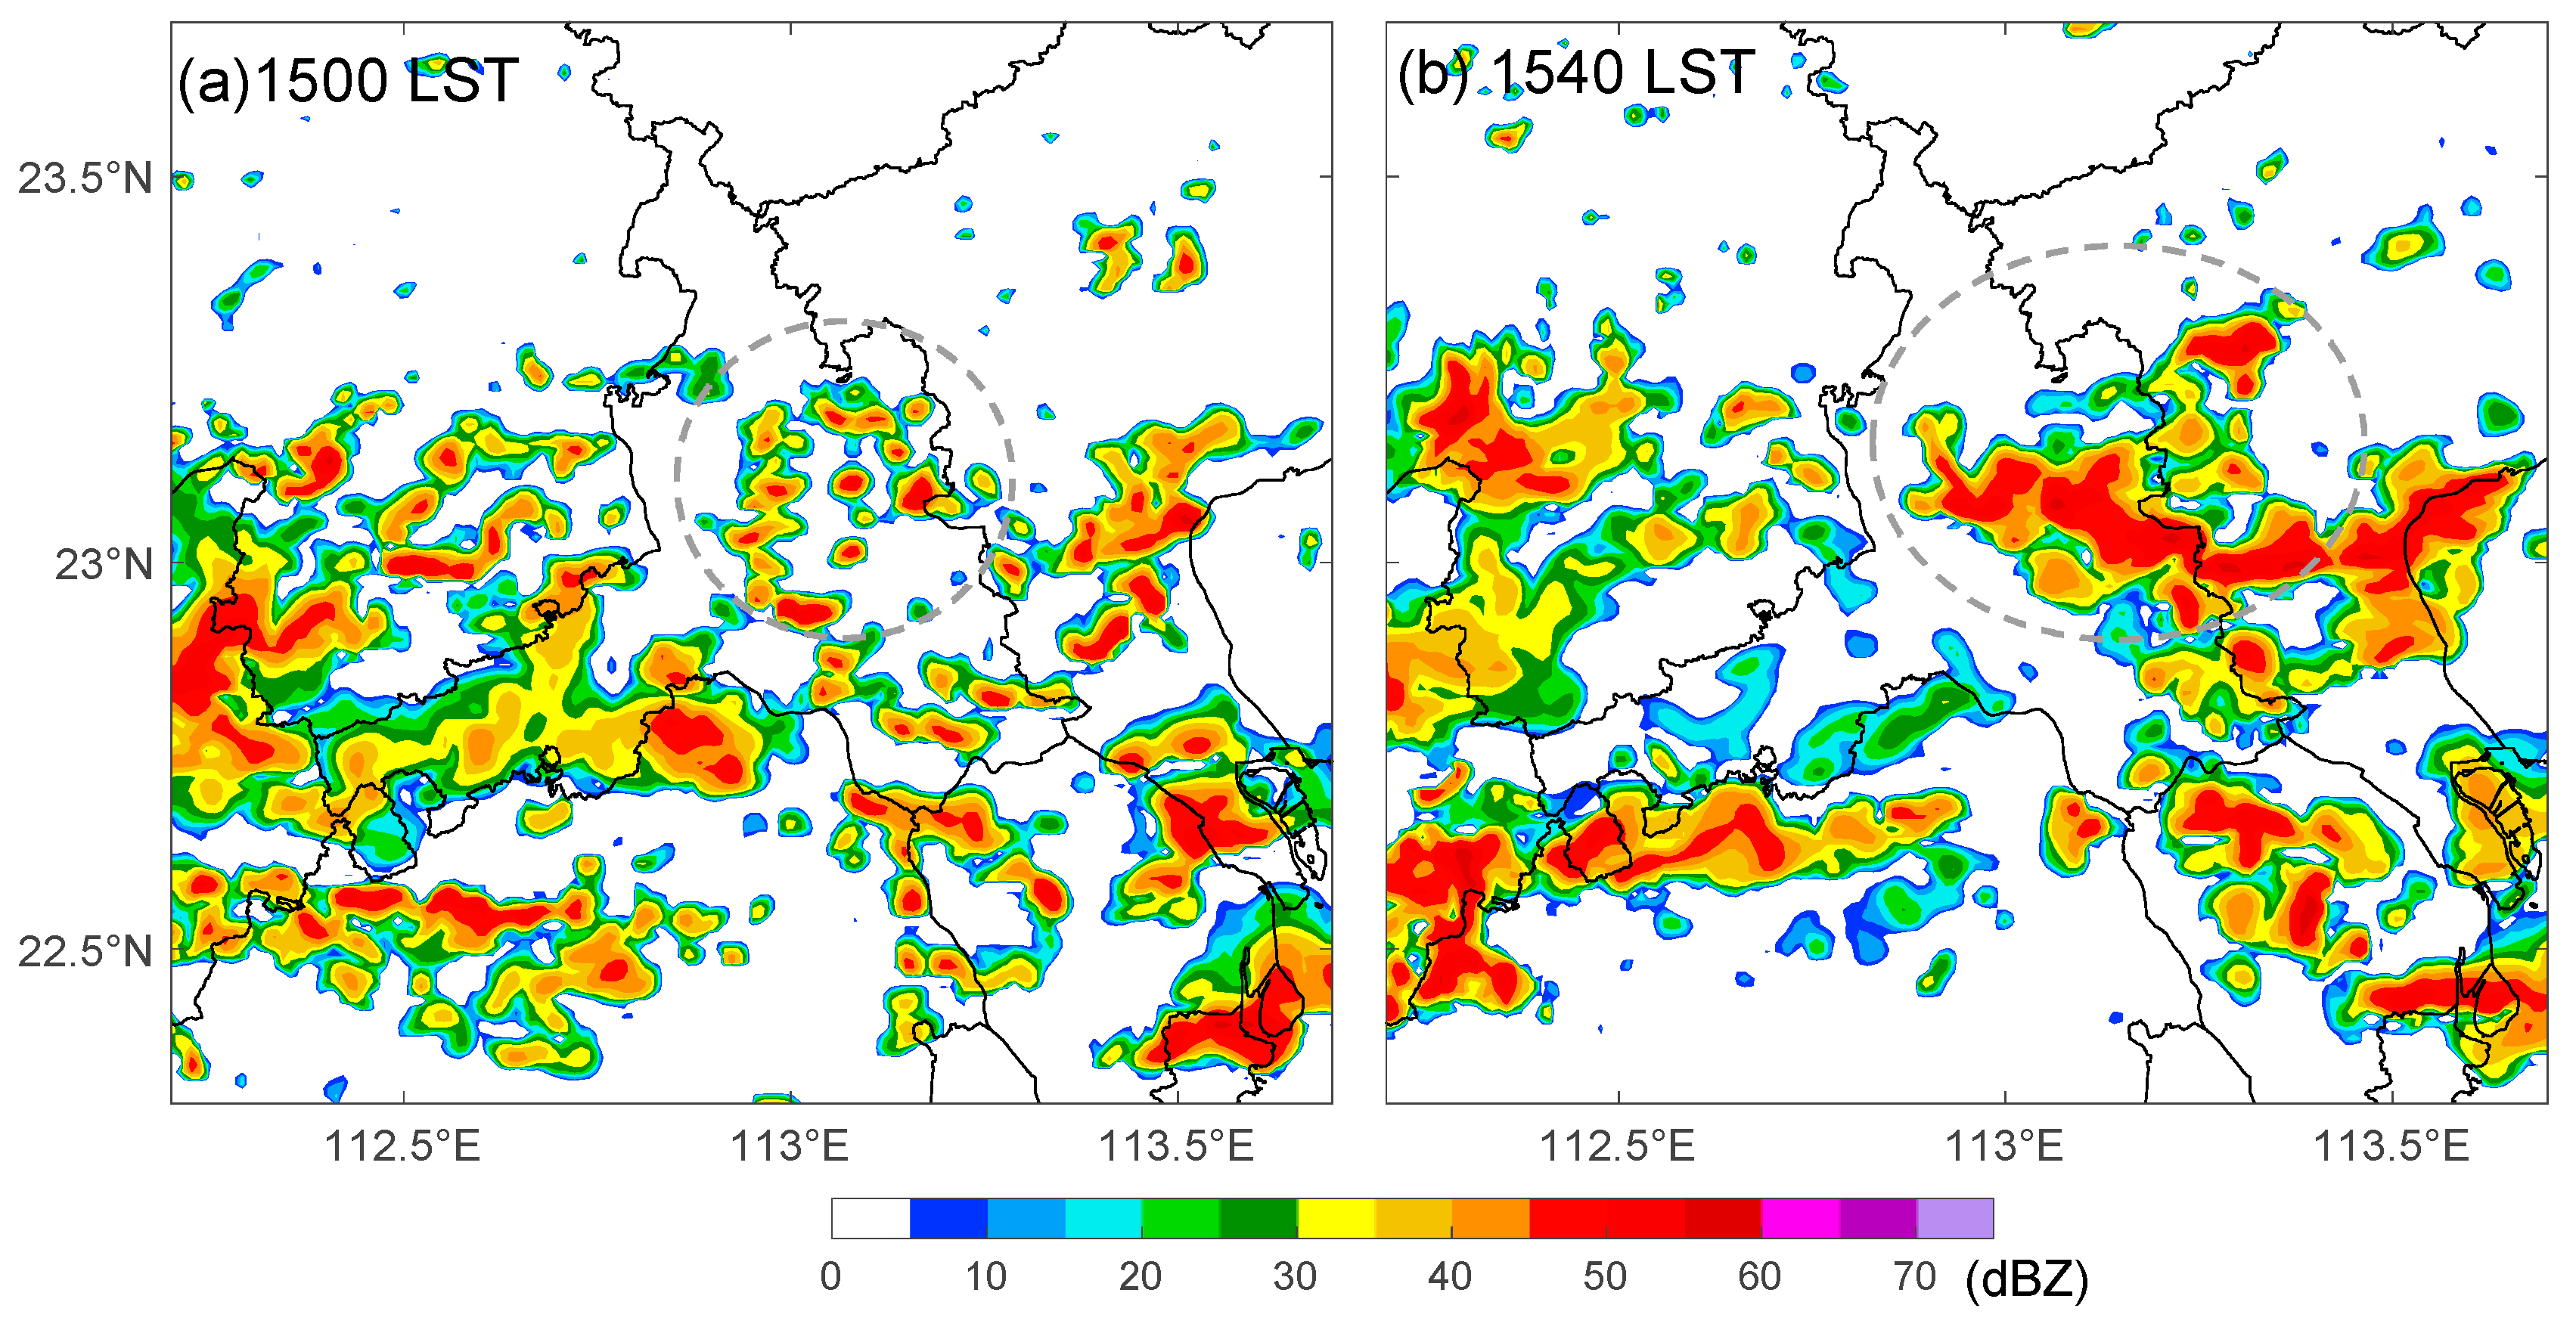
Figure 11 presents the simulated maximum column reflectivity in the innermost model domain. In the region of interest, the simulated scattered storms began in the afternoon at 1440 LST (refer to the dashed ellipse in Figure 11a). Dozens of minutes later, these storms further developed into a larger-size precipitation system in a zonal orientation (refer to the dashed ellipse in Figure 11b) like that observed through operational radars (Figure 4d). Compared with the observations, the simulated convection in the Foshan area generally began approximately 2 h sooner. A closer inspection of the evolution of these storms shows that the modeled cold pool outflows were not exactly the same as the observed ones (refer to the low-temperature areas in Figure 12). The strongest cold pools were located in the southwest part of Foshan. However, the region of interest was indeed surrounded by multiple approaching cold pool outflows. It is worth noting that our goal is the depiction of the environmental conditions associated with the pressure variations preceding the passage of gust fronts, so it is not necessary to perfectly mimic the observed gust fronts GF1–GF5.
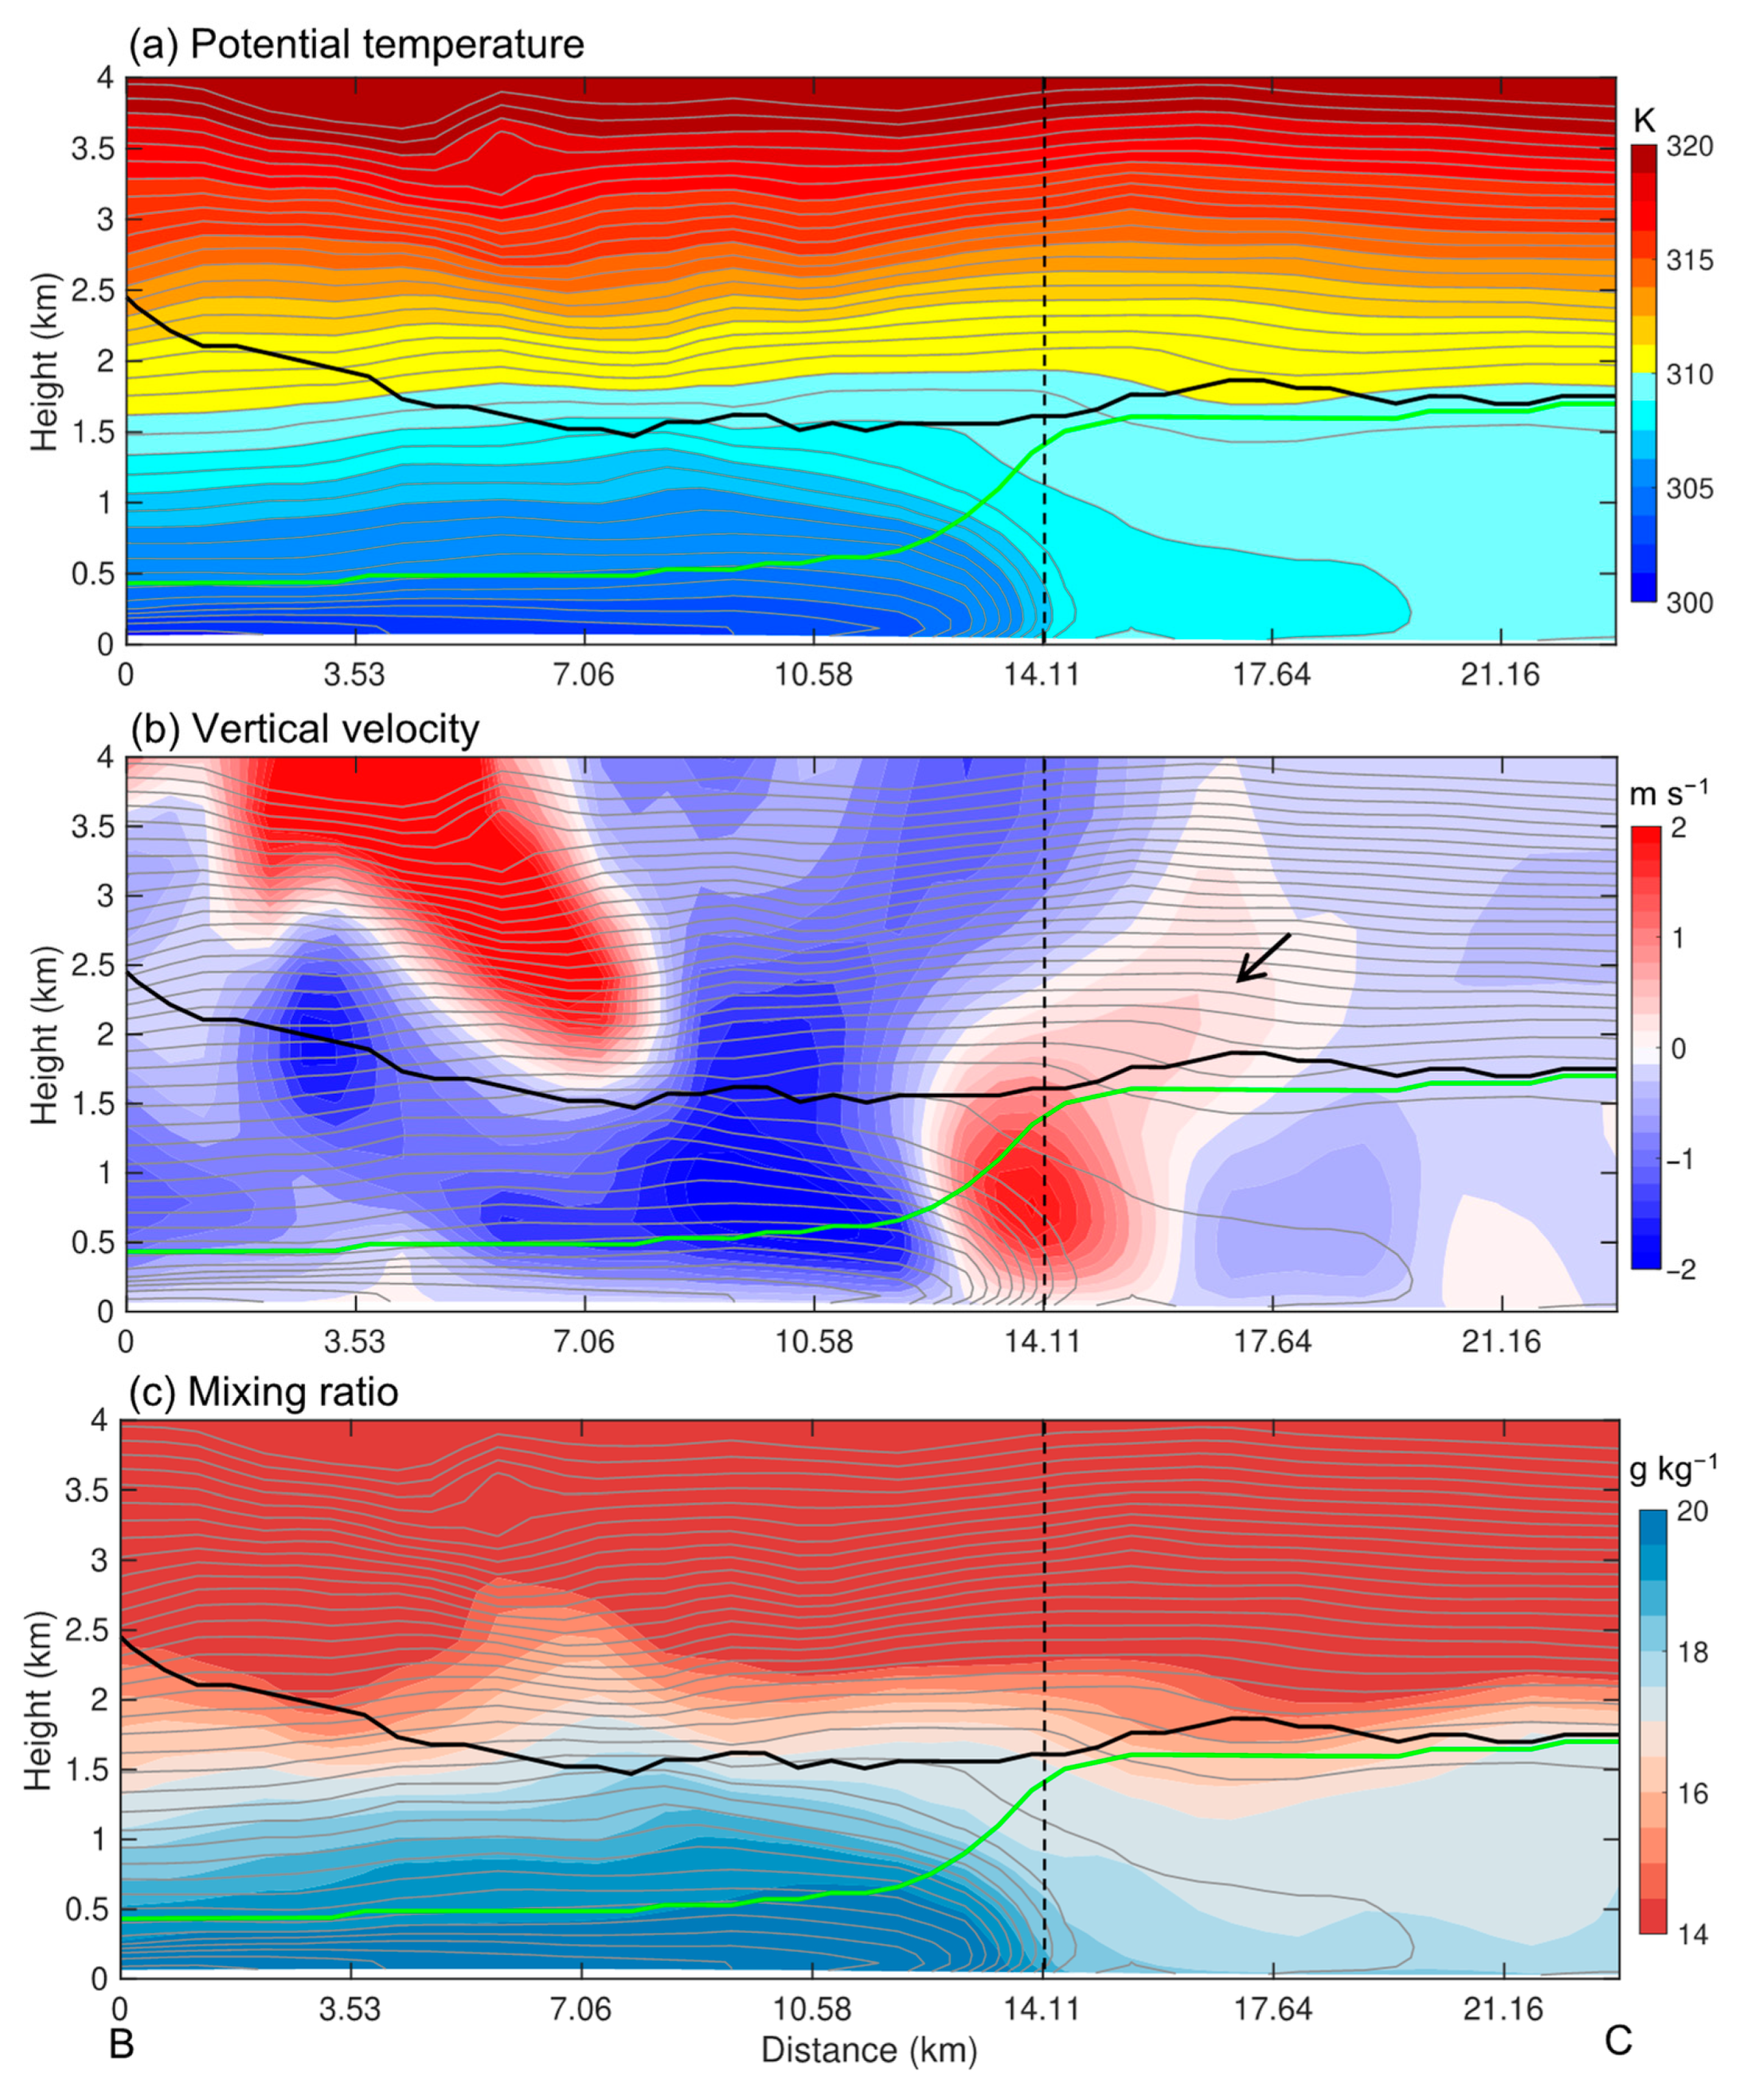
The simulated results show that a subtle increase in surface pressure was identified prior to the passage of cold pool outflow boundaries (Figure 13). The simulated surface pressure slightly increased by approximately 20 Pa from 1445 to 1450 LST and then decreased by approximately 20 Pa in the following 5 min. In agreement with the surface observations, the decrease in simulated surface pressure ended with the rapid drop in air temperature (refer to the red line in Figure 13). Figure 14 presents the vertical cross sections of meteorological variables along the BC as shown in Figure 12. The rough locations of the leading edges of cold pool outflows can be identified by referring to the steep gradient of potential temperature (Figure 14a). Slantwise upward motions were identified ahead of the outflow boundary aloft to a layer of approximately 2 km above ground level (AGL), with upward displacements of isentropic surfaces (denoted through the arrow in Figure 14b) and moisture increases in the aloft layers (Figure 14c). The vertical profile of horizontal winds suggests that the 1–3 km layer was characterized by very gentle southwesterlies (Figure 6b) and thus the isentropic surface displacements were less likely a result of advection.
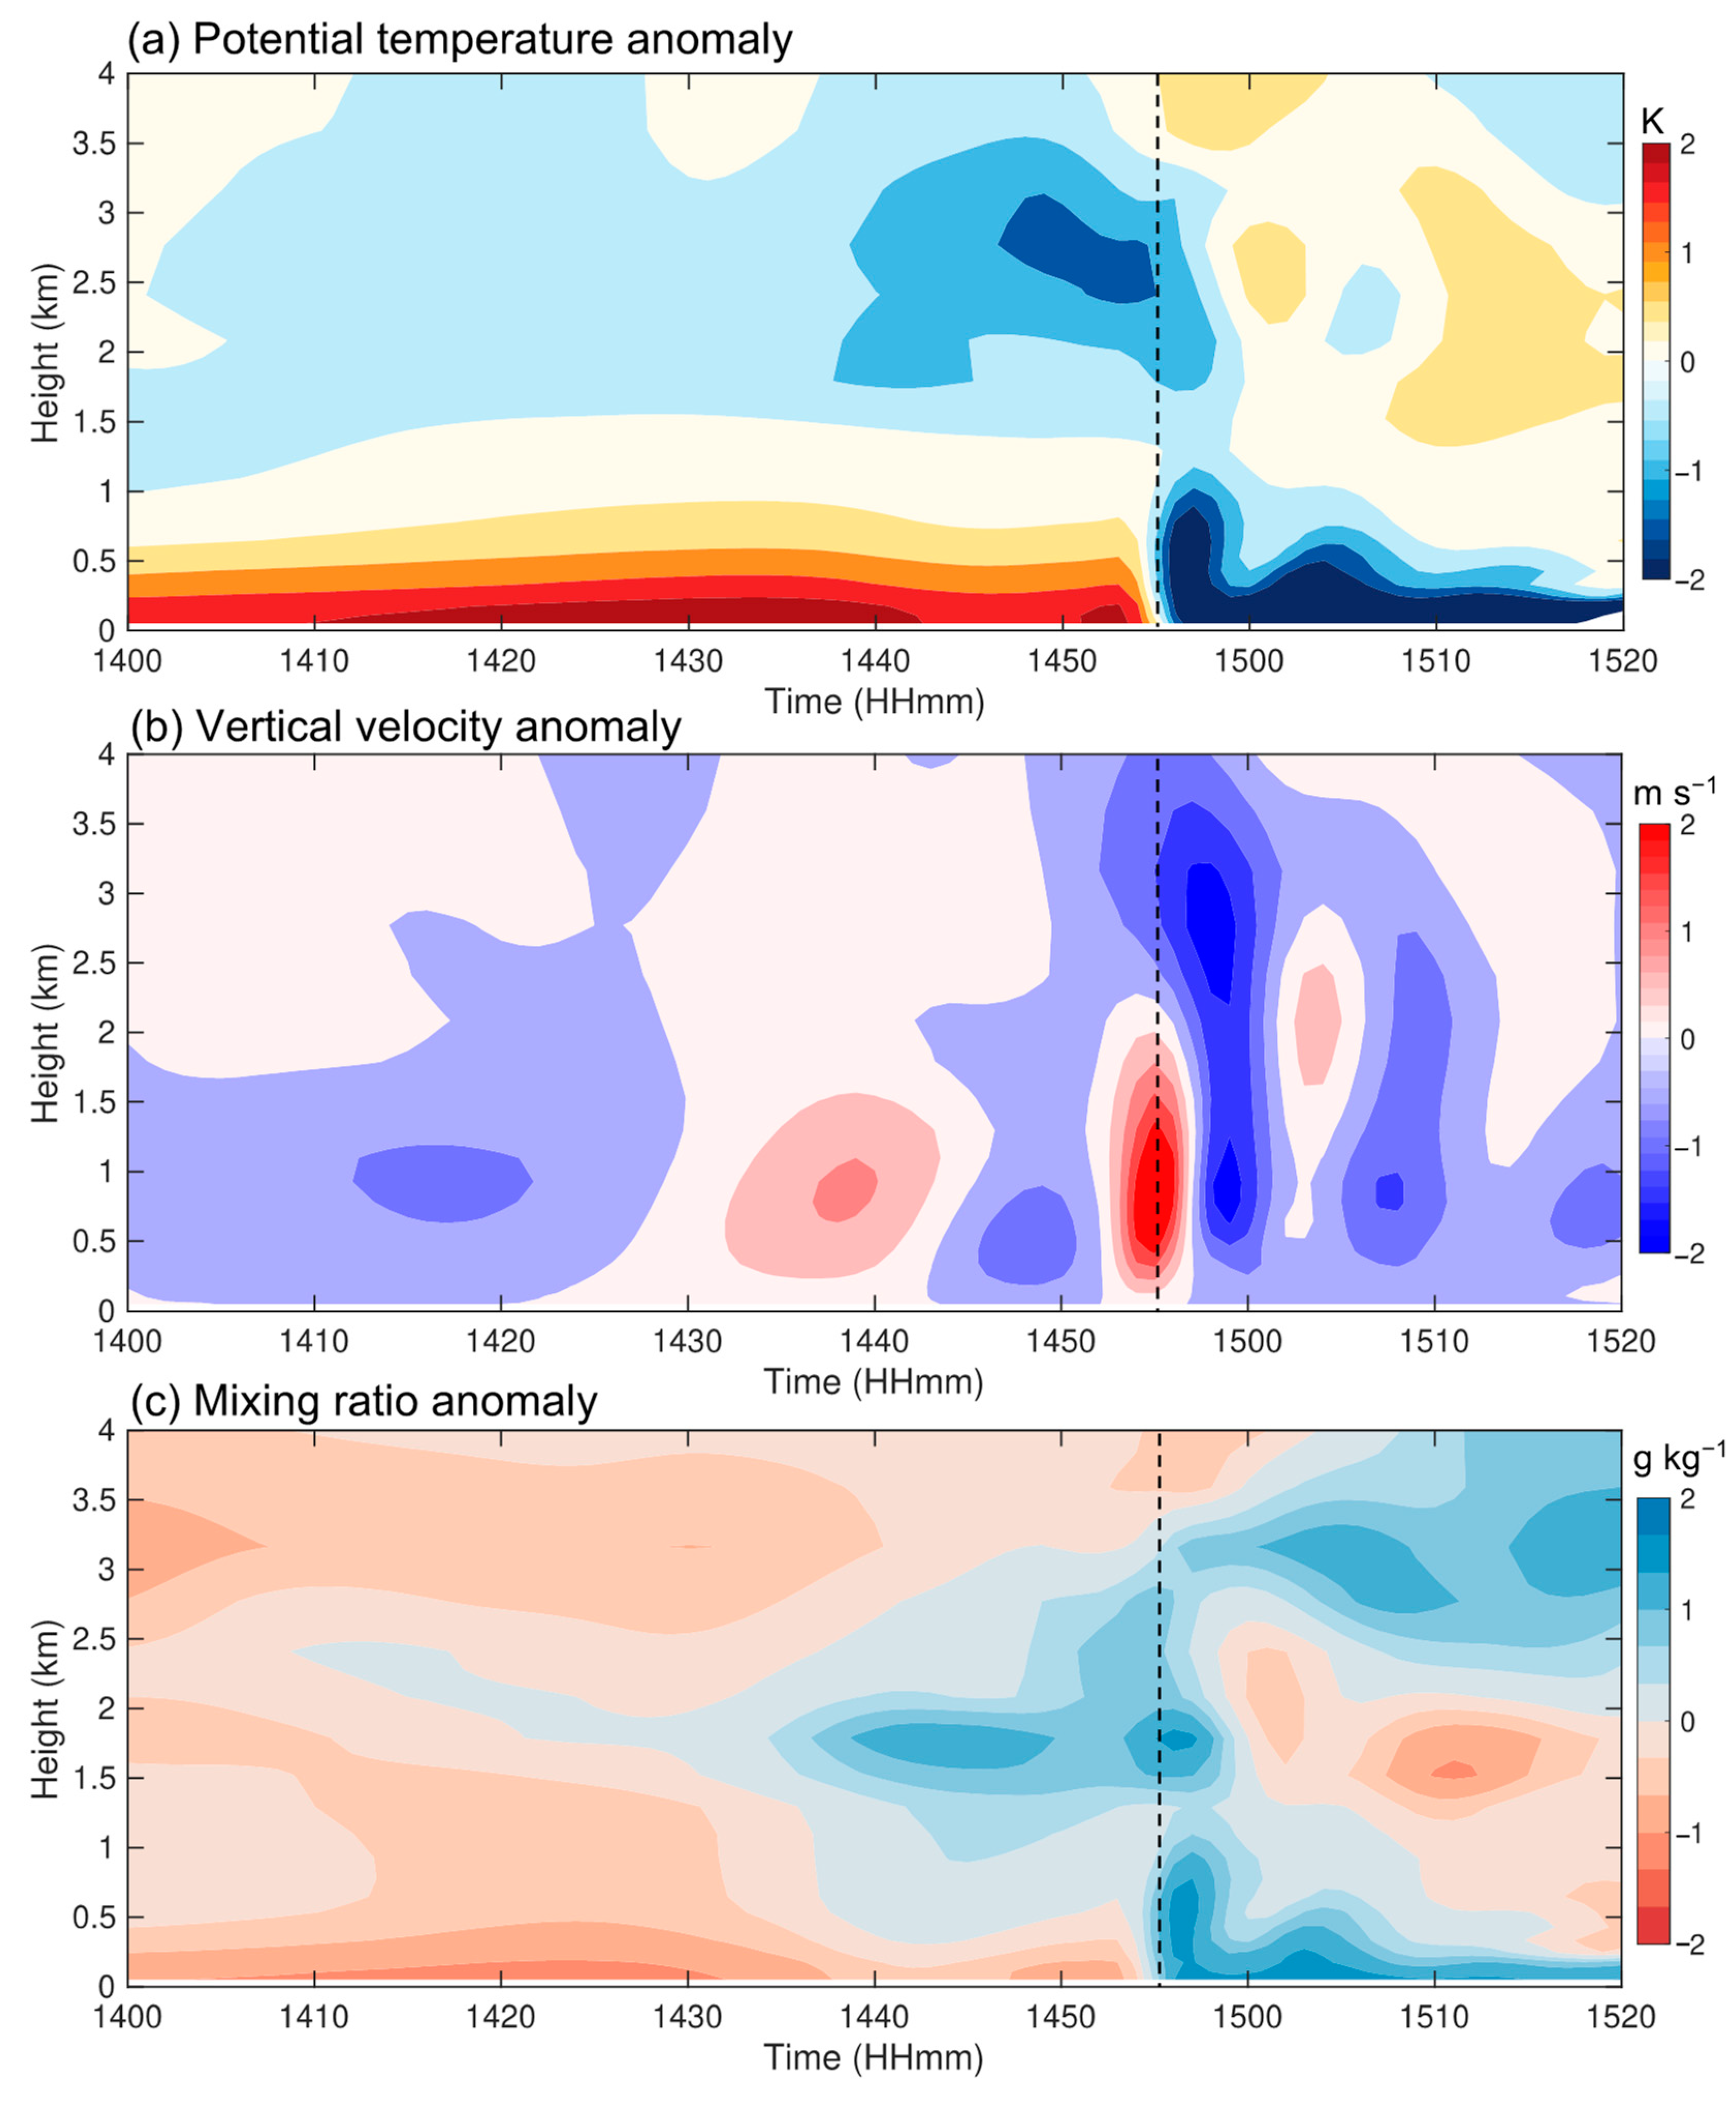
Figure 15 shows the time series of the vertical profiles at location A as shown in Figure 12. The moistening accompanied by the surface pressure jumps was found mostly evident in the 1.5–2 km AGL layer (Figure 15c). This aloft moistening started from ~1440 LST prior to the arrival of the gust front at 1455 LST. The simulated moisture enhancement aloft generally reached ~1 g kg−1. This phenomenon illustrates that the dynamic disturbance ahead of the gust front could provide a beneficial environment for convection by deepening the moist layer. Meanwhile, the vertical displacements of isentropic surfaces could lead to an evident deficit of potential temperature above 1.5 km AGL during 1440–1455 LST (Figure 15a). The resultant cooling tendency in the 1.5–3 km layer would be characterized by an enhanced low-level lapse rate (i.e., increasing the buoyant updrafts of lifted air parcels) prior to the forced lifting of outflow boundaries. Along with the moistening tendency in these layers, the preconditioning tended to weaken the entrainment of ambient dry air and produce greater buoyantly updrafts when air parcels were lifted above their levels of free convection (LFCs) after the arrival of outflow boundaries, contributing to subsequent convective initiation and development.
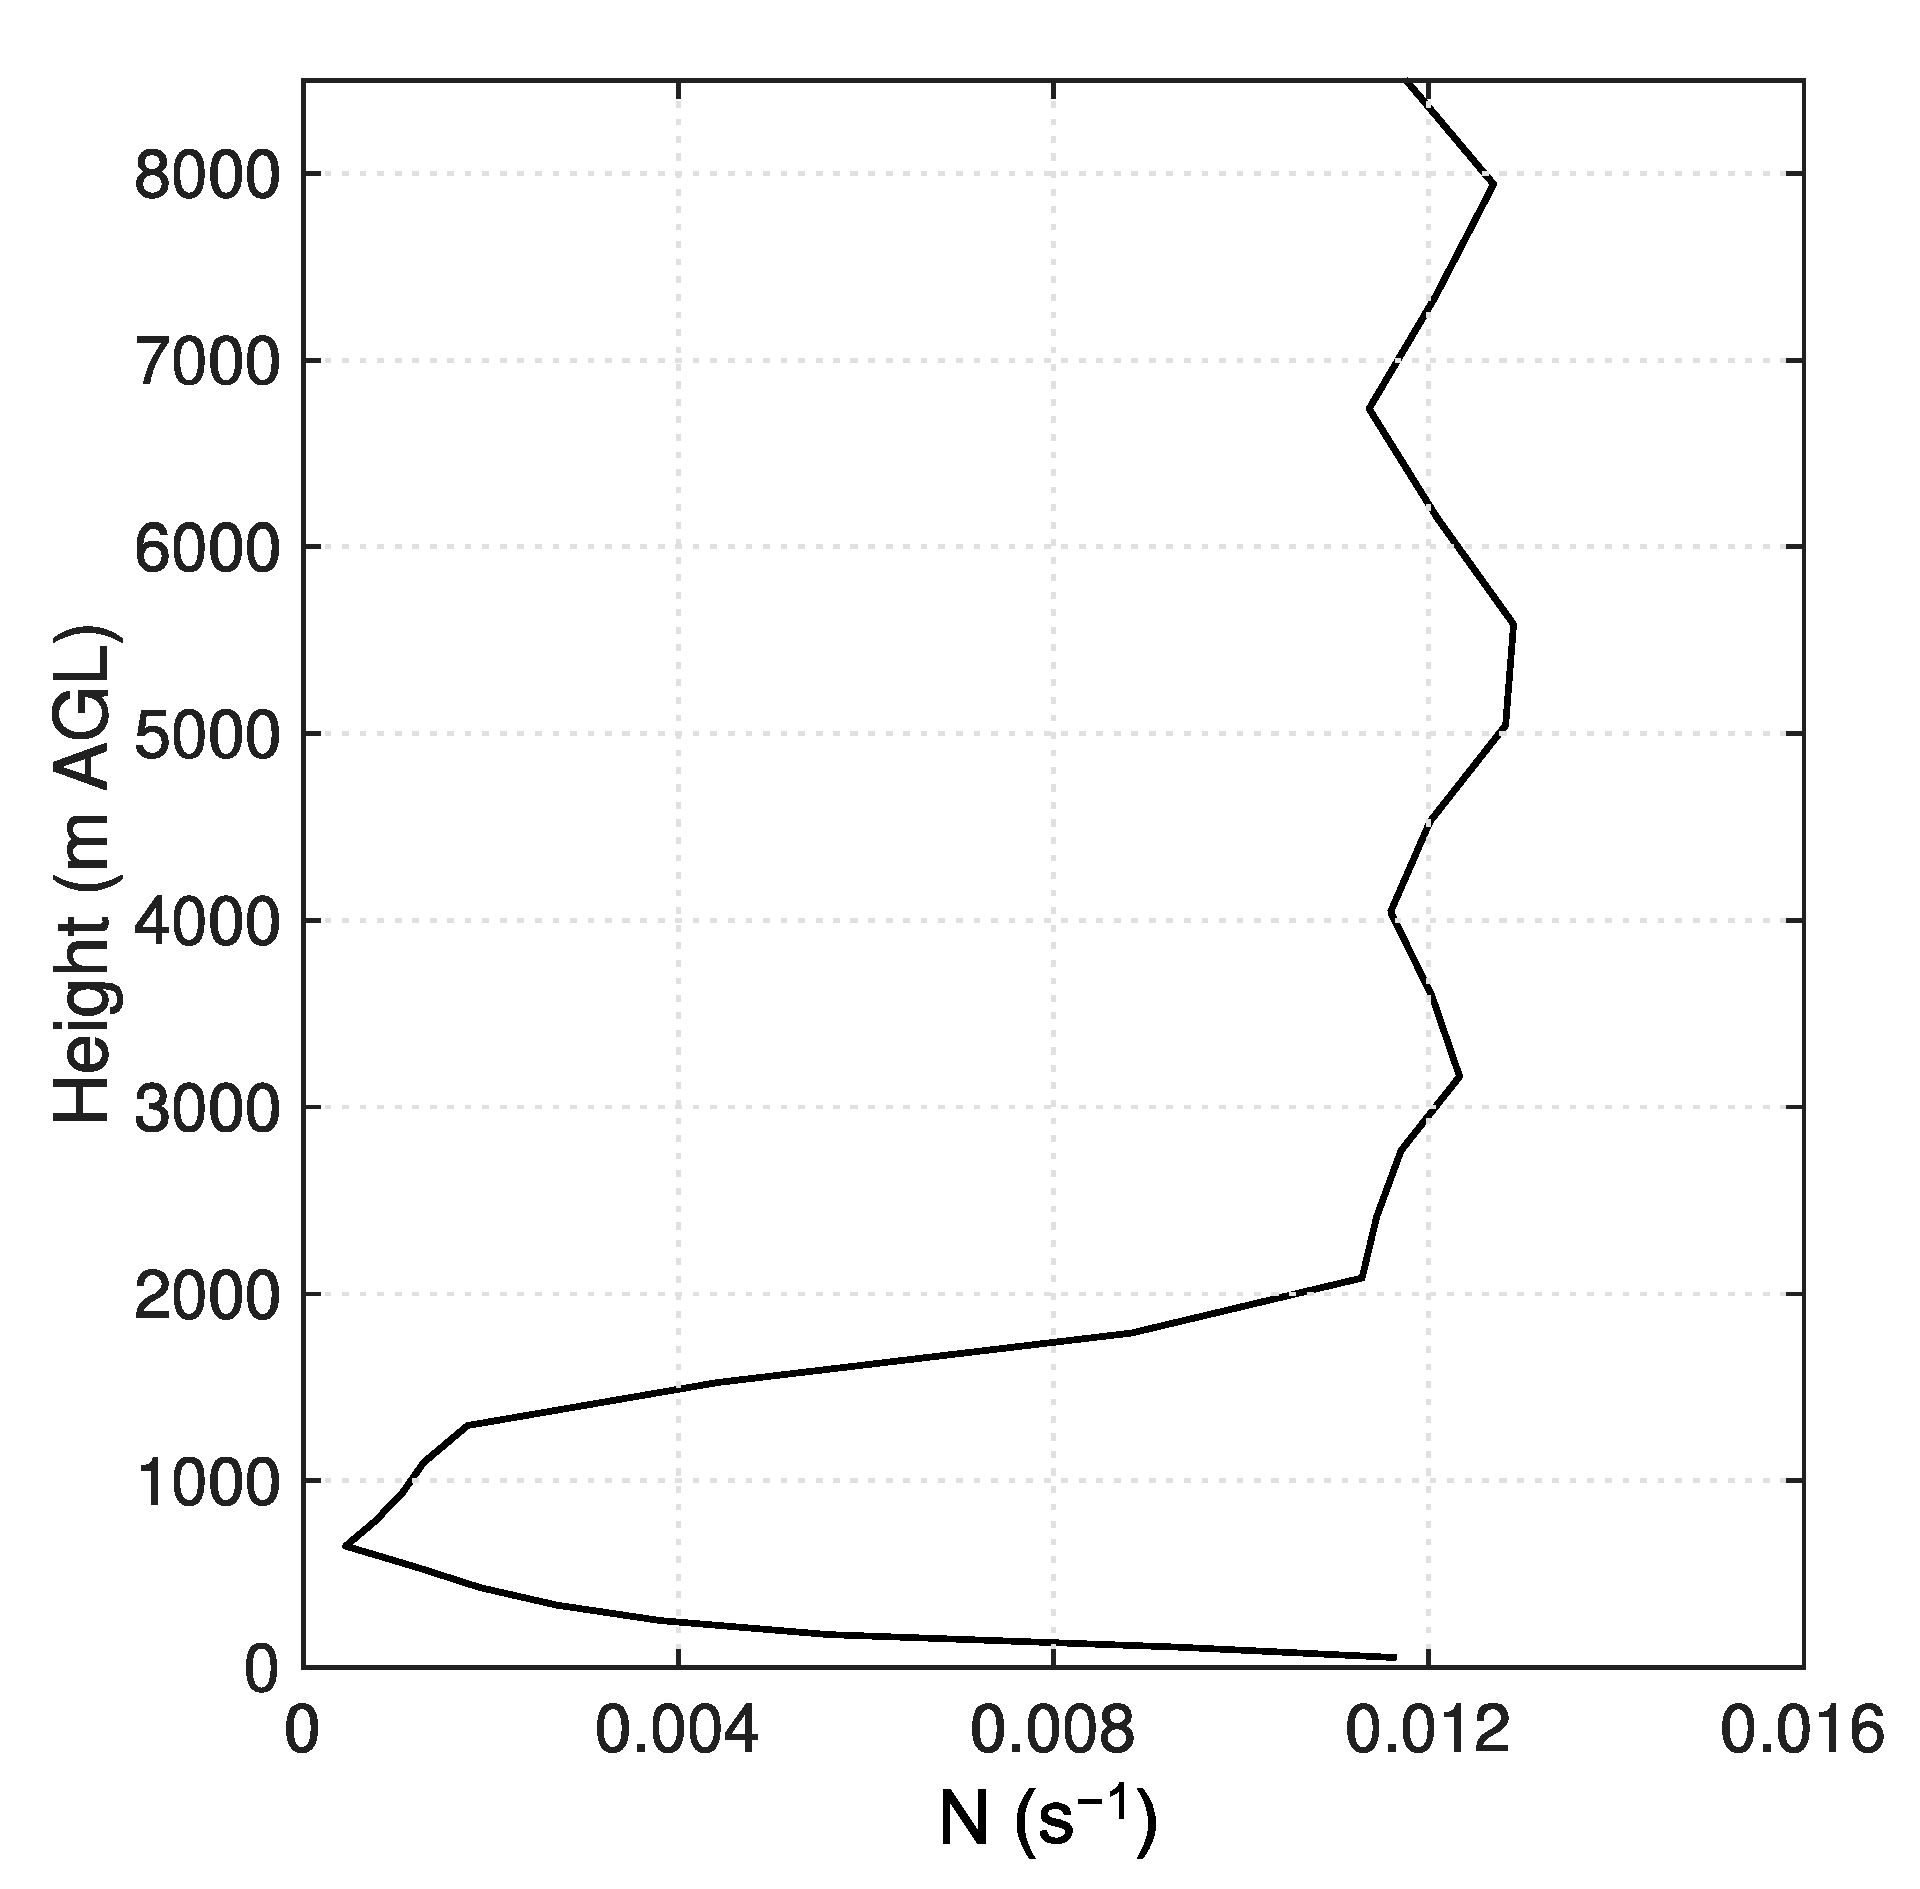
Prior studies have suggested that the bore generation typically occurs when static stability is sufficiently high in the near-ground layer [35,36,38,41,44,45,46]. In the current study, the simulated sounding profile (location A in Figure 12) shows that the boundary layer was a well-mixed dry neutral layer (i.e., the environmental lapse rate is equal to the dry adiabatic lapse rate below 1.7 km AGL as shown in Figure 6b). The Brunt–Väisälä frequency ( N = g θ v θ v z ) was also calculated to estimate the stability of low-level air to vertical displacements. Here, g and θ v represent the acceleration due to gravity and ambient virtual potential temperature, respectively. The N values increased from nearly 0 s−1 at 0.65 km AGL to a maximum value of 0.011 s−1 at 2 km AGL and then maintained nearly constant value with height (Figure 16). It appears low static stability in the boundary layer and no evident capping inversion above 2 km. The absence of an inversion layer leads to an inability to assess the formation and strength of the bore-like disturbance using the two-layer hydraulic theory [44]. In the case at hand, the subtle pressure jumps were more likely dynamically induced through the collision of the outflows and environmental air masses rather than bores.
Although the subtle pressure jump preceding the gust front’s arrival is seemingly contributive to storm initiation during this event, extensive case studies are warranted to characterize the degree of such contribution to the regional extreme rainfall. The forthcoming field campaign of severe weather over the Greater Bay Area may provide further opportunity to sample the vertical variations associated with these disturbances with additionally deployed microwave radiometers and wind profiling radars. On the other hand, the high-frequency oscillation in surface pressure behind the leading edge of the density current is also an interesting topic. The differences of such observational facts between different scenarios, such as warm/cold fronts, and land–sea breeze fronts will be investigated in near-future research.

5. Conclusions

On 1 August 2021, a short-lived extreme rainfall event occurred in the Great Bay Area in South China, setting a new record of the second highest precipitation in Foshan City. The convection occurred in a low-shear environment, but was influenced by strong mesoscale forcings (gust fronts) observed using two dual-polarization S-band operational radars. The evolutions of clearly visible fine lines in the reflectivity factor demonstrated the presence of five gust fronts approaching each other during this process. These gust fronts likely squeezed the air horizontally and moistened the surroundings through the collision of the cold pool outflows and environmental air masses in the dry neutral boundary layer. It is interesting that, without any clear surface convergent boundary, several storms that were located in the extreme rainfall region began before the arrival of gust fronts at a distance of approximately 12 km. The subsequently arriving gust fronts triggered multiple intense storms at their intersection points, eventually coalescing them into a large convective system. Consequently, the sudden lifting of surface moisture and subsequent reduction of inflow contributed to the event’s extreme and short-lived nature.
During this process, changes in surface air temperature, pressure, wind speed, and direction were observed by conventional surface weather stations. Additionally, the use of five microbarographs allowed for more precise pressure data with an accuracy of 0.001 hPa at a time interval of 1 s, providing better detection and depiction of the pressure variations compared with traditional barometers. High-frequency pressure oscillations during the passage of the gust front, a seldomly noticed phenomenon, were also captured. Likely owing to the effects of the horizontal squeezing of air masses by approaching gust fronts and the collision of outflows and environmental air masses, an increase in the water vapor mixing ratio was recognized before the arrival of the gust fronts, creating a moister environment and favorable conditions for subsequent deep convection. Additionally, the estimated distance between the leading edge of the subtle pressure jump and the rear gust front was 12–15 km and was generally consistent with the distance between the new convection and its neighboring gust front. These phenomena may imply a connection between convection initiation and the pressure variation observed using microbarographs.
The WRF model was further employed to compensate for the lack of vertical observations, reasonably replicating a similar process. The simulation demonstrated that the cold and dense outflows interacted with the surrounding air, generating a small wave-like pressure jump consistent with the observations. The positive increase in the vertical velocity and the mixing ratio preceding the gust front acted as a precondition contributed via these effects. The upward displacements of low-level airmass amplified the vertical lapse rate of temperature and deepened the moist layer, thereby creating favorable conditions for convection and contributing to the occurrence of extreme rainfall. However, further investigation is needed to ascertain whether the new convection prior to the gust fronts was directly associated with the pressure jumps or resulted from other factors.

Author Contributions

Conceptualization, L.B. and J.Z.; methodology, J.Z., Z.L. and L.B.; software, J.Z.; validation, J.Z., L.B., Y.D. and S.Z.; formal analysis, J.Z. and L.B.; investigation, J.Z. and L.B.; resources, J.Z. and Z.L.; data curation, J.Z. and Z.L.; writing—original draft preparation, J.Z.; writing—review and editing, J.Z., L.B., Z.L., Y.D. and S.Z.; visualization, J.Z.; supervision, L.B.; project administration, Z.L.; funding acquisition, L.B. and Z.L. All authors have read and agreed to the published version of the manuscript.

Funding

This research was funded by the National Natural Science Foundation of China, grant number U2242203, 42275006 and 42122033, the Guangdong Basic and Applied Basic Research Foundation, grant number 2021A1515011647, and the Science and Technology Research Project for Society of Foshan, grant number 2120001008761, and the Youth Foundation of Guangdong Meteorological Service, grant number GRMC2021Q18.

Data Availability Statement

The reanalysis data used for this article can be accessed on the European Centre for Medium-Range Weather Forecasts (ECMWF) website https://cds.climate.copernicus.eu/cdsapp#!/dataset/reanalysis-era5-pressure-levels?tab=form (accessed on 22 December 2023). The observational data can be downloaded from the meteorological data sharing network provided by the National Meteorological Information Center of the China Meteorological Administration at http://data.cma.cn/en (accessed on 22 December 2023).

Acknowledgments

We gratefully acknowledge the funding support from the National Natural Science Foundation of China and the Guangdong Basic and Applied Basic Research Foundation. We thank colleges who helped to deploy the microbarographs in Foshan and we also thank the editor and reviewers for their review efforts and feedback. The authors also greatly benefited from discussions with Y. Qiang Sun, Dale R. Durran, and Richard Rotunno.

Conflicts of Interest

The authors declare no conflicts of interest.

References

  1. Huang, S.; Li, Z.; Bao, C. Heavy Rainfall over Southern China in the Pre-Summer Rainy Season; Guangdong Science and Technology Press: Guangdong, China, 1996; p. 230. (In Chinese) [Google Scholar]
  2. Luo, Y.; Xia, R.; Chan, J. Characteristics, Physical Mechanisms, and Prediction of Pre-summer Rainfall over South China: Research Progress during 2008-2019. J. Meteorol. Soc. Jpn. Ser. II 2020, 98, 19–42. [Google Scholar] [CrossRef]
  3. Sun, J.; Zhang, Y.; Liu, R.; Fu, S.; Tian, F. A Review of Research on Warm-Sector Heavy Rainfall in China. Adv. Atmos. Sci. 2019, 36, 1299–1307. [Google Scholar] [CrossRef]
  4. Wang, H.; Luo, Y.; Jou, B.J.-D. Initiation, maintenance, and properties of convection in an extreme rainfall event during SCMREX: Observational analysis. J. Geophys. Res. Atmos. 2014, 119, 13–206. [Google Scholar] [CrossRef]
  5. Wu, M.; Luo, Y. Mesoscale observational analysis of lifting mechanism of a warm-sector convective system producing the maximal daily precipitation in China mainland during pre-summer rainy season of 2015. J. Meteorol. Res. 2016, 30, 719–736. [Google Scholar] [CrossRef]
  6. Lu, H.; Chen, S.; Guo, Y.; He, H.; Chen, S. Spatial-Temporal Variation Characteristics of Extremely Heavy Precipitation Frequency over Southern China in the Last 50 Years. J. Trop. Meteorol. 2012, 28, 219–227. [Google Scholar] [CrossRef]
  7. Wu, N.; Zhuang, X.; Min, J.; Meng, Z. Practical and Intrinsic Predictability of a Warm-Sector Torrential Rainfall Event in the South China Monsoon Region. J. Geophys. Res. Atmos. 2020, 125, e2019JD031313. [Google Scholar] [CrossRef]
  8. Jiang, Z.; Zhang, D.L.; Xia, R.; Qian, T. Diurnal Variations of Pre-Summer Rainfall over Southern China. J. Clim. 2017, 30, 755–773. [Google Scholar] [CrossRef]
  9. Wu, M.; Luo, Y.; Chen, F.; Wong, W.K. Observed Link of Extreme Hourly Precipitation Changes to Urbanization over Coastal South China. J. Appl. Meteorol. Climatol. 2019, 58, 1799–1819. [Google Scholar] [CrossRef]
  10. Du, Y.; Chen, G. Heavy Rainfall Associated with Double Low-Level Jets over Southern China. Part I: Ensemble-Based Analysis. Mon. Weather Rev. 2018, 146, 3827–3844. [Google Scholar] [CrossRef]
  11. Du, Y.; Chen, G. Heavy Rainfall Associated with Double Low-Level Jets over Southern China. Part II: Convection Initiation. Mon. Weather Rev. 2019, 147, 543–565. [Google Scholar] [CrossRef]
  12. Chen, X.; Zhang, F.; Zhao, K. Influence of Monsoonal Wind Speed and Moisture Content on Intensity and Diurnal Variations of the Mei-Yu Season Coastal Rainfall over South China. J. Atmos. Sci. 2017, 74, 2835–2856. [Google Scholar] [CrossRef]
  13. Du, Y.; Chen, G.; Han, B.; Mai, C.; Bai, L.; Li, M. Convection Initiation and Growth at the Coast of South China. Part I: Effect of the Marine Boundary Layer Jet. Mon. Weather Rev. 2020, 148, 3847–3869. [Google Scholar] [CrossRef]
  14. Du, Y.; Chen, G.; Han, B.; Bai, L.; Li, M. Convection Initiation and Growth at the Coast of South China. Part II: Effects of the Terrain, Coastline, and Cold Pools. Mon. Weather Rev. 2020, 148, 3871–3892. [Google Scholar] [CrossRef]
  15. Luo, Y.; Wu, M.; Ren, F.; Li, J.; Wong, W.-K. Synoptic Situations of Extreme Hourly Precipitation over China. J. Clim. 2016, 29, 8703–8719. [Google Scholar] [CrossRef]
  16. Johns, R.H.; Doswell, C.A. Severe Local Storms Forecasting. Weather Forecast. 1992, 7, 588–612. [Google Scholar] [CrossRef]
  17. Liu, X.; Luo, Y.; Guan, Z.; Zhang, D.-L. An Extreme Rainfall Event in Coastal South China During SCMREX-2014: Formation and Roles of Rainband and Echo Trainings. J. Geophys. Res. Atmos. 2018, 123, 9256–9278. [Google Scholar] [CrossRef]
  18. Huang, Y.; Liu, Y.; Liu, Y.; Li, H.; Knievel, J.C. Mechanisms for a Record-Breaking Rainfall in the Coastal Metropolitan City of Guangzhou, China: Observation Analysis and Nested Very Large Eddy Simulation with the WRF Model. J. Geophys. Res. Atmos. 2019, 124, 1370–1391. [Google Scholar] [CrossRef]
  19. Zhang, S.; Liang, Z.; Wang, D.; Chen, G. Nocturnal Convection Initiation over Inland South China during a Record-Breaking Heavy Rainfall Event. Mon. Weather Rev. 2022, 150, 2935–2957. [Google Scholar] [CrossRef]
  20. Droegemeier, K.K.; Wilhelmson, R.B. Three-Dimensional Numerical Modeling of Convection Produced by Interacting Thunderstorm Outflows. Part I: Control Simulation and Low-Level Moisture Variations. J. Atmos. Sci. 1985, 42, 2381–2403. [Google Scholar] [CrossRef]
  21. Wilson, J.W.; Schreiber, W.E. Initiation of Convective Storms at Radar-Observed Boundary-Layer Convergence Lines. Mon. Weather Rev. 1986, 114, 2516–2536. [Google Scholar] [CrossRef]
  22. Carbone, R.E.; Conway, J.W.; Crook, N.A.; Moncrieff, M.W. The Generation and Propagation of a Nocturnal Squall Line. Part I: Observations and Implications for Mesoscale Predictability. Mon. Weather Rev. 1990, 118, 26–49. [Google Scholar] [CrossRef]
  23. Weiss, C.C.; Bluestein, H.B. Airborne Pseudo–Dual Doppler Analysis of a Dryline–Outflow Boundary Intersection. Mon. Weather Rev. 2002, 130, 1207–1226. [Google Scholar] [CrossRef]
  24. Wilson, J.W.; Roberts, R.D. Summary of Convective Storm Initiation and Evolution during IHOP: Observational and Modeling Perspective. Mon. Weather Rev. 2006, 134, 23–47. [Google Scholar] [CrossRef]
  25. Wakimoto, R.M.; Murphey, H.V. Analysis of Convergence Boundaries Observed during IHOP_2002. Mon. Weather Rev. 2010, 138, 2737–2760. [Google Scholar] [CrossRef]
  26. Mai, C.; Du, Y.; Li, M. Processes of Colliding Cold Pools Derived from a 356-m-High Shenzhen Met-Tower during an Extremely Heavy Rainfall Event. Mon. Weather Rev. 2023, 151, 1571–1585. [Google Scholar] [CrossRef]
  27. Purdom, J.F.W.; Marcus, K. Thunderstorm trigger mechanisms over the southeast United States. In Proceedings of the 12th Conference on Severe Local Storms of the American Meteorological Society, San Antonio, TX, USA, 12–15 January 1982; American Meteorological Society: Boston, MA, USA; pp. 487–488. [Google Scholar]
  28. Weckwerth, T.M.; Wakimoto, R.M. The Initiation and Organization of Convective Cells atop a Cold-Air Outflow Boundary. Mon. Weather Rev. 1992, 120, 2169–2187. [Google Scholar] [CrossRef]
  29. Kingsmill, D.E. Convection Initiation Associated with a Sea-Breeze Front, a Gust Front, and Their Collision. Mon. Weather Rev. 1995, 123, 2913–2933. [Google Scholar] [CrossRef]
  30. Fankhauser, J.C.; Crook, N.A.; Tuttle, J.; Miller, L.J.; Wade, C.G. Initiation of Deep Convection along Boundary Layer Convergence Lines in a Semitropical Environment. Mon. Weather Rev. 1995, 123, 291–314. [Google Scholar] [CrossRef]
  31. Bai, L.; Meng, Z.; Huang, Y.; Zhang, Y.; Niu, S.; Su, T. Convection Initiation Resulting from the Interaction Between a Quasi-Stationary Dryline and Intersecting Gust Fronts: A Case Study. J. Geophys. Res. Atmos. 2019, 124, 2379–2396. [Google Scholar] [CrossRef]
  32. Harrison, S.J.; Mecikalski, J.R.; Knupp, K.R. Analysis of Outflow Boundary Collisions in North-Central Alabama. Weather Forecast. 2009, 24, 1680–1690. [Google Scholar] [CrossRef]
  33. Karan, H.; Knupp, K. Radar and Profiler Analysis of Colliding Boundaries: A Case Study. Mon. Weather Rev. 2009, 137, 2203–2222. [Google Scholar] [CrossRef]
  34. Haghi, K.R.; Geerts, B.; Chipilski, H.G.; Johnson, A.; Degelia, S.; Imy, D.; Parsons, D.B.; Adams-Selin, R.D.; Turner, D.D.; Wang, X. Bore-ing into Nocturnal Convection. Bull. Am. Meteorol. Soc. 2019, 100, 1103–1121. [Google Scholar] [CrossRef]
  35. Zhang, S.; Parsons, D.B.; Wang, Y. Wave Disturbances and Their Role in the Maintenance, Structure, and Evolution of a Mesoscale Convection System. J. Atmos. Sci. 2020, 77, 51–77. [Google Scholar] [CrossRef]
  36. Zhang, S.; Parsons, D.B.; Xu, X.; Wang, Y.; Liu, J.; Abulikemu, A.; Shen, W.; Zhang, X.; Zhang, S. A modeling study of an atmospheric bore associated with a nocturnal convective system over China. J. Geophys. Res. Atmos. 2020, 125, e2019JD032279. [Google Scholar] [CrossRef]
  37. Zhang, S.; Parsons, D.B.; Xu, X.; Sun, J.; Wu, T.; Xu, F.; Na, W.; Chen, G. Bores observed during the warm season of 2015–2019 over the southern North China Plain. Geophys. Res. Lett. 2022, 49, e2022GL099205. [Google Scholar] [CrossRef]
  38. Crook, N.A. Trapping of Low-Level Internal Gravity Waves. J. Atmos. Sci. 1988, 45, 1533–1541. [Google Scholar] [CrossRef]
  39. Rottman, J.W.; Simpson, J.E. The formation of internal bores in the atmosphere: A laboratory model. Q. J. R. Meteorol. Soc. 1989, 115, 941–963. [Google Scholar] [CrossRef]
  40. Haghi, K.R.; Durran, D.R. On the Dynamics of Atmospheric Bores. J. Atmos. Sci. 2021, 78, 313–327. [Google Scholar] [CrossRef]
  41. Geerts, B.; Parsons, D.; Ziegler, C.L.; Weckwerth, T.M.; Biggerstaff, M.I.; Clark, R.D.; Coniglio, M.C.; Demoz, B.B.; Ferrare, R.A.; Gallus, W.A.; et al. The 2015 Plains Elevated Convection at Night Field Project. Bull. Am. Meteorol. Soc. 2017, 98, 767–786. [Google Scholar] [CrossRef]
  42. Loveless, D.M.; Wagner, T.J.; Turner, D.D.; Ackerman, S.A.; Feltz, W.F. A Composite Perspective on Bore Passages during the PECAN Campaign. Mon. Weather Rev. 2019, 147, 1395–1413. [Google Scholar] [CrossRef]
  43. Parsons, D.B.; Haghi, K.R.; Halbert, K.T.; Elmer, B.; Wang, J. The Potential Role of Atmospheric Bores and Gravity Waves in the Initiation and Maintenance of Nocturnal Convection over the Southern Great Plains. J. Atmos. Sci. 2019, 76, 43–68. [Google Scholar] [CrossRef]
  44. Knupp, K. Observational Analysis of a Gust Front to Bore to Solitary Wave Transition within an Evolving Nocturnal Boundary Layer. J. Atmos. Sci. 2006, 63, 2016–2035. [Google Scholar] [CrossRef]
  45. Koch, S.E.; Feltz, W.; Fabry, F.; Pagowski, M.; Geerts, B.; Bedka, K.M.; Miller, D.O.; Wilson, J.W. Turbulent Mixing Processes in Atmospheric Bores and Solitary Waves Deduced from Profiling Systems and Numerical Simulation. Mon. Weather Rev. 2008, 136, 1373–1400. [Google Scholar] [CrossRef]
  46. Haghi, K.R.; Parsons, D.B.; Shapiro, A. Bores Observed during IHOP_2002: The Relationship of Bores to the Nocturnal Environment. Mon. Weather Rev. 2017, 145, 3929–3946. [Google Scholar] [CrossRef]
  47. Blake, B.T.; Parsons, D.B.; Haghi, K.R.; Castleberry, S.G. The Structure, Evolution, and Dynamics of a Nocturnal Convective System Simulated Using the WRF-ARW Model. Mon. Weather Rev. 2017, 145, 3179–3201. [Google Scholar] [CrossRef]
  48. Kortschinski, J.; Murty, R.C.; Curry, M.J. Microbarograph for meteorological studies: Design, theory and analysis. J. Phys. E Sci. Instrum. 1971, 4, 307. [Google Scholar] [CrossRef]
  49. Balachandran, N.K. Gravity Waves from Thunderstorms. Mon. Weather Rev. 1980, 108, 804–816. [Google Scholar] [CrossRef]
  50. Nappo, C.J.; Crawford, T.L.; Eckman, R.M.; Auble, D.L. A high-precision sensitive electronic microbarograph network. In Proceedings of the Seventh Symposium on Meteorological Observations and Instrumentation, New Orleans, LA, USA, 13–18 January 1991; American Meteorological Society: Boston, MA, USA; pp. J179–J181. [Google Scholar]
  51. Anderson, P.; Mobbs, S.; King, J.; McConnell, I.; Rees, J. A microbarograph for internal gravity wave studies in Antarctica. Antarct. Sci. 1992, 4, 241–248. [Google Scholar] [CrossRef]
  52. Li, Q.; Li, S.; Zhao, C. A Study of Array Detection of Atmospheric Gravity Waves on Severe Hailstorm Process. Guizhou Geol. 2001, 18, 73–78. (In Chinese) [Google Scholar] [CrossRef]
  53. Wang, X.; Lei, H.; Feng, L.; Zhu, J.; Li, Z.; Jiang, Z. Analysis of the characteristics of gravity waves during a local rainstorm event in Foshan, China. Atmos. Ocean. Sci. Lett. 2020, 13, 163–170. [Google Scholar] [CrossRef]
  54. Wang, X.; Ran, L.; Qi, Y.; Ma, S.; Mu, X.; Jiang, Z.; Bi, X. Analysis of characteristics gravity waves of heavy rainfall event based on microbarograph observation. Acta Phys. Sin. 2021, 70, 271–283. [Google Scholar] [CrossRef]
  55. Zhang, J.; Li, Z.; Huang, X. The Analysis Between Foshan Heavy Precipitation and Pre-Signal of Sliding Discrete Power Spectrum on Micromanometer. Adv. Meteorol. Sci. Technol. 2020, 10, 86–89. (In Chinese) [Google Scholar] [CrossRef]
  56. Skamarock, W.C.; Klemp, J.B.; Dudhia, J.; Gill, D.O.; Barker, D.; Duda, M.G.; Huang, X.Y.; Wang, W.; Powers, J.G. A Description of the Advanced Research WRF Version 3; (No. NCAR/TN-475+STR, 113 pp.); University Corporation for Atmospheric Research: Boulder, CO, USA, 2008. [Google Scholar] [CrossRef]
  57. Hong, S.-Y.; Dudhia, J.; Chen, S.-H. A Revised Approach to Ice Microphysical Processes for the Bulk Parameterization of Clouds and Precipitation. Mon. Weather Rev. 2004, 132, 103–120. [Google Scholar] [CrossRef]
  58. Janjic, Z.I. The surface layer in the NCEP eta model. In Proceedings of the 11th Conference on Numerical Weather Prediction, Norfolk, VA, USA, 19–23 August 1996; pp. 354–355. [Google Scholar]
  59. Noh, Y.; Cheon, W.G.; Hong, S.Y.; Raasch, S. Improvement of the K-profile Model for the Planetary Boundary Layer based on Large Eddy Simulation Data. Bound. Layer Meteorol. 2003, 107, 401–427. [Google Scholar] [CrossRef]
  60. Iacono, M.; Delamere, J.; Mlawer, E.; Shephard, M.; Clough, S.; Collins, W. Radiative Forcing by Long-Lived Greenhouse Gases: Calculations with the AER Radiative Transfer Models. J. Geophys. Res. 2008, 113, D13103. [Google Scholar] [CrossRef]
  61. Hersbach, H.; Bill, B.; Berrisford, P.; Hirahara, S.; Horányi, A.; Muñoz-Sabater, J.; Nicolas, J.; Peubey, C.; Radu, R.; Schepers, D.; et al. The ERA5 global reanalysis. Q. J. R. Meteorol. Soc. 2020, 146, 1999–2049. [Google Scholar] [CrossRef]
  62. Markowski, P.; Richardson, Y. Mesoscale Meteorology in Midlatitudes; Wiley-Blackwell: Hoboken, NJ, USA, 2010; p. 407. [Google Scholar]
  63. Kirsch, B.; Ament, F.; Hohenegger, C. Convective Cold Pools in Long-Term Boundary Layer Mast Observations. Mon. Weather Rev. 2021, 149, 811–820. [Google Scholar] [CrossRef]
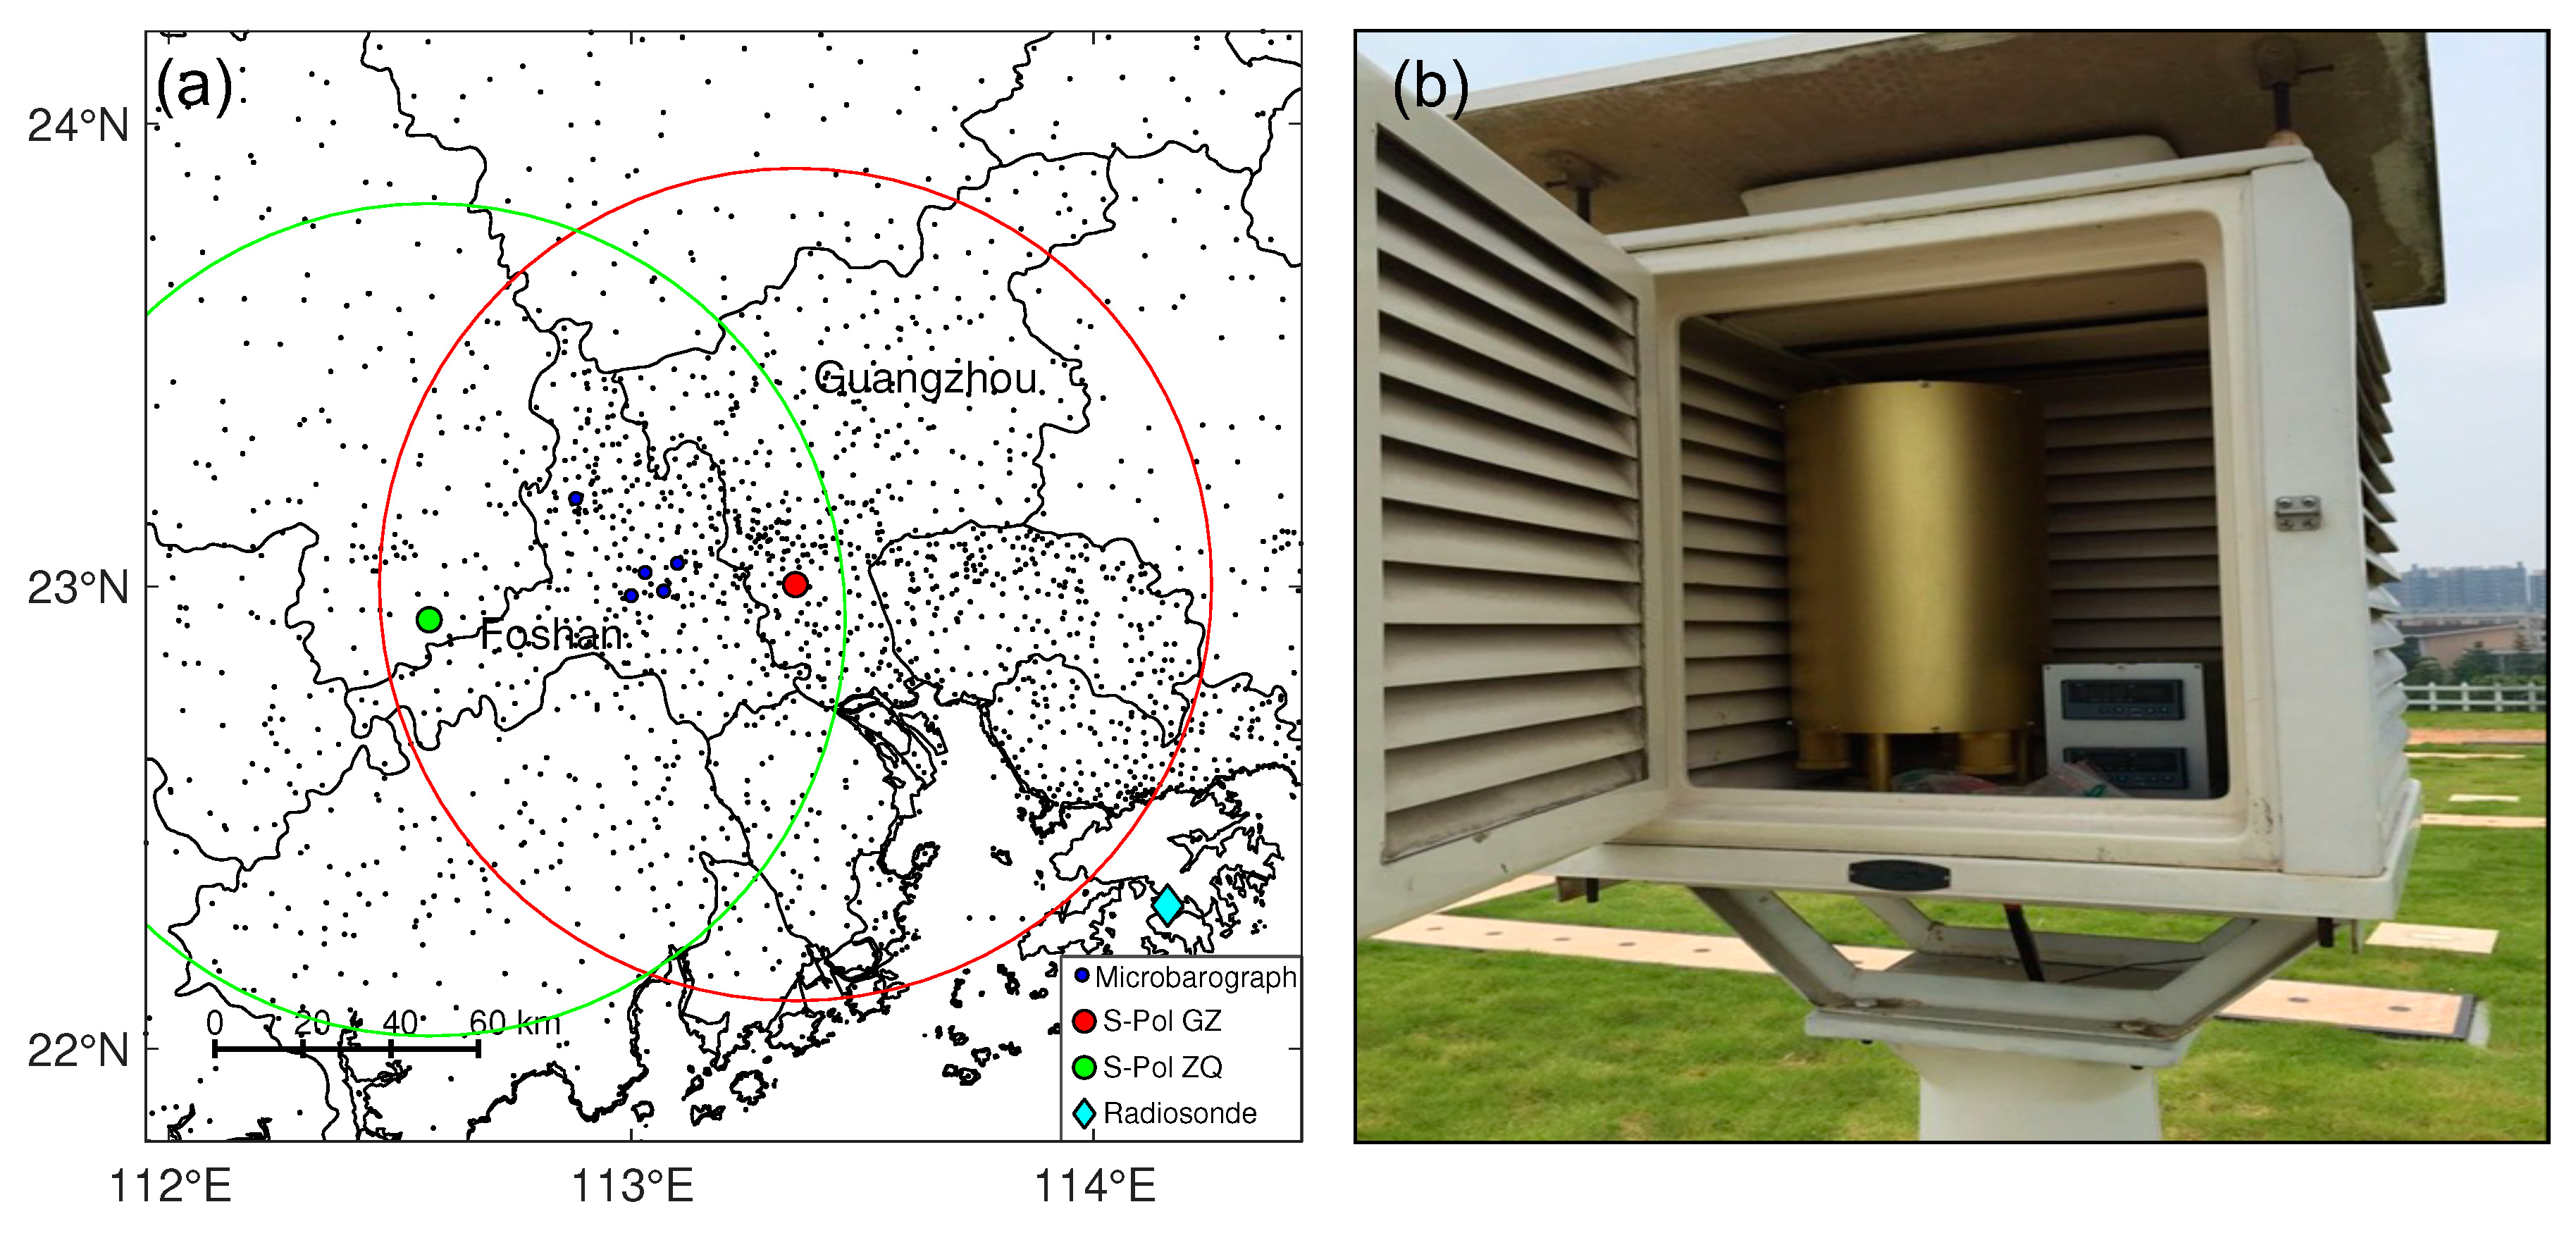
Figure 1. (a) Locations of the observational platforms that include in situ surface weather stations (gray dots), microbarographs (blue dots), Hong Kong radiosonde (cyan diamond), and the Guangzhou (S-Pol GZ, red dot) and Zhaoqing (S-Pol ZQ, green dot) S-band operational radars. The large circles in red and green represent the detection range of 100 km. (b) A photo of the microbarograph that is deployed inside a thermometer shelter. This station provides pressure data at a time interval of 1 s and other meteorological variables (temperature, wind speed and direction, rainfall amount, and relative humidity) every 5 min.
Remotesensing 16 00101 g001
Figure 2. (a) Geopotential heights (blue isopleths, units: gpm) and horizontal winds on 500 hPa overlaid with the surface-based CAPE (shaded). (b) Mean sea-level pressure (blue isopleths, units: hPa), 10-m horizontal winds, and 925-hPa equivalent potential temperature (shaded). (c) Geopotential heights (blue isopleths, units: gpm), horizontal winds, and divergence (shaded) on 300 hPa. (d) Bulk wind difference (shaded) between the 6 km and ground layers. The 500-hPa horizontal winds (vectors) are also plotted for reference. In all panels, the meteorological variables are calculated based on the ERA5 data at 1500 LST on 1 August 2021. Half and full barbs denote wind speeds of 2–4 and 4–6 m s−1, respectively. The triangle and diamond in cyan represent the region of interest and the location of the Hong Kong sounding, respectively. In (a), the gray and white rectangle represents the WRF domains of d02 and d03, respectively.
Remotesensing 16 00101 g002
Figure 3. Mosaic of composite reflectivity in South China at (a) 1500, (b) 1600, (c) 1700, and (d) 1800 LST on 1 August 2021. The blue ellipses and arrow denote the region and storms of interest, respectively.
Remotesensing 16 00101 g003
Figure 4. Reflectivity at different elevation angles from the S-Pol GZ at (a) 1648, (b) 1700, (c) 1712, and (d) 1748 LST on 1 August 2021. The yellow and cyan dots in (a) represent the locations of microbarographs and selected surface weather stations, respectively. The identified five radar fine lines (labeled GF1–GF5) with regular movements are marked through dashed curves in (a). The fine line GF5 was identified through the S-Pol ZQ.
Remotesensing 16 00101 g004
Figure 5. (a) Accumulated rainfall (mm) and (b) peak horizontal winds (m s−1) during 1720–1820 LST on 1 August 2021. The red and blue arrows point to the location of maximum values of rainfall and wind speed, respectively. Half and full barbs denote the wind speeds of 2–4 and 4–6 m s−1, respectively. The wind speeds of 12–16 m s−1, 16–20 m s−1, and greater than 20 m s−1 are colored in green, blue and orange, respectively.
Remotesensing 16 00101 g005
Figure 6. Skew T–logp diagrams of the (a) observed Hong Kong sounding (Figure 1a) at 0800 LST and (b) the WRF sounding at 1430 LST on 1 August 2021. (b) The extracted WRF sounding as described in the main text. The ambient temperature and dewpoint (both units °C) are represented through the solid black and green lines, respectively. The parcel that ascends undiluted from the surface is shown through the dashed red curve. Half and full barbs denote the wind speeds of 2–4 m s−1, 4–6 m s−1, respectively. The orange curve represents the parcel that ascends from the variables at 1400 LST observed by a station in the region of interest (surface temperature and relative humidity of 36.0 °C and 50%, respectively).
Remotesensing 16 00101 g006
Figure 7. Surface observations from the conventional surface weather stations at a time interval of 5 min during 1605–1855 LST for stations (a) A1 and (b) A2 (Figure 8), respectively. Half and full barbs denote 2–4 and 4–6 m s−1, respectively.
Remotesensing 16 00101 g007
Figure 8. Schematics showing the evolutions of gust fronts (colored curves) and the locations of focused storm initiation (red dots). The curves in green, yellow, and orange mark the rough positions of gust fronts identified from radar observations at 1642, 1700, and 1712 LST, respectively. The black dots, A1 and A2, denote the surface weather stations used in Figure 7.
Remotesensing 16 00101 g008
Figure 9. (a) Water vapor mixing ratio (g kg−1) observed at station M2. The dashed line marks the time of the gust front passage. (b) Surface pressure (blue; plotted every 1 s) detected through microbarograph M2 as shown in Figure 8 and the surface winds and air temperature (red) plotted every 5 min at the same station. Half and full barbs denote 2–4 and 4–6 m s−1, respectively. (c) Surface pressure anomalies obtained from the microbarographs by subtracting the 9-point running average during 1400–2000 LST. (d) Turbulent kinematic energy (TKE) of the detrended pressure as shown in (c). The data were selected during periods corresponding to the rectangle in (b). The blue line represents the K−5/3 inertial subrange slope. In (ac), the dashed lines are plotted for time reference.
Remotesensing 16 00101 g009
Figure 10. Surface pressure (blue; plotted every 1 s) detected through the microbarographs (a) M1, (b) M3, (c) M4, and (d) M5 as shown in Figure 8. The surface winds (wind barbs) and air temperature (red) are plotted every 5 min at the same station. Half and full barbs denote 2–4 and 4–6 m s−1, respectively. The dashed line in the vertical direction represents the time of gust front’s arrival.
Remotesensing 16 00101 g010
Figure 11. Simulated composite reflectivity (dBZ) at (a) 1500 LST and (b) 1540 LST on 1 August 2021. The dashed ellipses mark the storms of interest as described in the text.
Remotesensing 16 00101 g011
Figure 12. Simulated air temperature (shaded) and horizontal winds (vectors) at approximately 80 m AGL at 1450 LST. The dashed isopleth (30.5 °C) with steep temperature gradient marks the rough locations of the leading edges of cold outflows. The line BC marks the location of the vertical cross section as described in the main text. The location A was used in Figure 13.
Remotesensing 16 00101 g012
Figure 13. Simulated surface pressure (black) and surface air temperature (red) at the location A as shown in Figure 12.
Remotesensing 16 00101 g013
Figure 14. Vertical cross sections of (a) potential temperature, (b) vertical velocity, and (c) water mixing ratio along the line BC (Figure 12) valid at 1450 LST. The potential temperature is contoured from 302 K at an interval of 0.5 K. The black and green lines represent the level of free convection (LFC) and the lifting condensation level (LCL), respectively. The arrow in (b) marks the displacement of isentropic surface as discussed in the text.
Remotesensing 16 00101 g014
Figure 15. Time–height variations of the simulated (a) potential temperature anomalies, (b) vertical velocity anomalies, and (c) water vapor mixing ratio anomalies at location A as shown in Figure 12. Here, the anomaly was calculated through the difference between the meteorological variable and the mean value during 1400–1520 LST on the same altitude. The dashed line marks the time of the gust front’s arrival for reference.
Remotesensing 16 00101 g015
Figure 16. Profile of Brunt–Väisälä frequency calculated using the WRF sounding extracted at location A (Figure 12) at 1430 LST.
Remotesensing 16 00101 g016
Disclaimer/Publisher’s Note: The statements, opinions and data contained in all publications are solely those of the individual author(s) and contributor(s) and not of MDPI and/or the editor(s). MDPI and/or the editor(s) disclaim responsibility for any injury to people or property resulting from any ideas, methods, instructions or products referred to in the content.