Abstract
The interrelation between grassland vegetation greenness and hydrothermal conditions on the Tibetan Plateau demonstrates a significant correlation. However, understanding the spatial patterns and the degree of this correlation, especially in relation to minimum and maximum air temperatures across various vertical gradient zones of the Plateau, necessitates further examination. Utilizing the normalized difference phenology index (NDPI) and considering four distinct hydrothermal conditions (minimum, maximum, mean temperature, and precipitation) during the growing season, an analysis was conducted on the correlation of NDPI with hydrothermal conditions across plateau elevations from 2000 to 2021. Results indicate that the correlation between vegetation greenness and hydrothermal conditions on the Tibetan Plateau grasslands is spatially varied. There is a pronounced negative correlation of greenness to maximum temperature and precipitation in the northeastern plateau, while areas exhibit stronger positive correlations to mean temperature. Additionally, as elevation increases, the positive correlation and sensitivity of alpine grassland vegetation greenness to minimum temperature significantly intensify, contrary to the effects observed with maximum temperature. The correlations between greenness and mean temperature in relation to elevational changes primarily exhibit a unimodal pattern across the Tibetan Plateau. These findings emphasize that the correlation and sensitivity of grassland vegetation greenness to hydrothermal conditions are both elevation-dependent and spatially distinct.
1. Introduction
Alpine grasslands represent the predominant and distinct ecosystem of the Tibetan Plateau, crucial in CO2 sequestration and sustaining ecosystem equilibrium [1,2,3,4], with implications in global climate change mitigation [5,6]. Characterized by unique hydrothermal conditions (notably low temperatures and restricted precipitation), these grasslands inhabit sensitive eco-climatic zones with pronounced elevation gradients and minimal anthropogenic disturbances, making them one of the most pronounced indicators of warming and early warning systems on the Earth’s surface [7,8,9,10,11]. Concurrently, vegetation greenness serves as a robust marker for climate sensitivity within this ecosystem [12]. The dynamic alterations in greenness exhibit a pronounced correlation with hydrothermal conditions, with geographical terrain, particularly elevation gradients, exerting significant influence [11,13,14,15,16]. Thus, Alpine grasslands offer an optimal setting for investigating the interplay between vegetation greenness dynamics and hydrothermal conditions, modulated by elevation.
Remote sensing (RS) offers the benefits of efficiency, extensive coverage, and diverse information, establishing itself as the most effective tool for monitoring vegetation greenness dynamics at large range [6]. This technique provides a wealth of data for analyzing climatic responses and sensitivities [17]. The advancements in RS have enabled instruments such as the Moderate Resolution Imaging Spectroradiometer (MODIS) to offer more expansive coverage, superior temporal resolution, and cost-effective, freely available data. Moreover, MODIS provides a range of vegetation reflectances [6,12,18,19]. Over the past few decades, vegetation indices (VIs) derived from these reflectances have emerged as reliable markers of photosynthetic activity. They adeptly capture the responsiveness and sensitivity of vegetation greenness to climatic shifts [3,14,15,16,20]. Most VIs, including the widely recognized Normalized Difference Vegetation Index (NDVI), are formulated by integrating the red and near-infrared bands [21]. As a predominant indicator, NDVI exhibits high sensitivity to grassland growth conditions and has been effectively utilized to explore the implications of climate change on grassland ecosystems across diverse spatiotemporal frameworks [16,17,20,22].
The accuracy of NDVI is subject to scrutiny due to its tendency to saturate in areas of dense vegetation and its susceptibility to soil backgrounds, canopy brightness, and shadows when coverage falls below 50% [23,24]. Additionally, atmospheric disturbances, such as aerosols, frequently introduce noise into images generated from red and near-infrared bands [25]. It is important to note that grasslands typically exhibit lower vegetation coverage and smaller canopy dimensions, coupled with increased spatial heterogeneity. This often leads to satellite imagery comprising more bare soil pixels relative to other ecosystems [26]. Nevertheless, Wang et al. [18] have introduced the NDPI, an innovative vegetation index designed to discern the difference between green vegetation and soil backgrounds while attenuating this differentiation. Employing a weighted shortwave infrared (SWIR) band instead of the red band in NDVI, NDPI is sensitive to vegetation water content, enabling it to track variations in canopy water content [18]. Crucially, NDPI merges these two functionalities into a singular VI without compromising its sensitivity to vegetation greenness [18]. Xu et al. [27] demonstrated NDPI’s superior capability in estimating aboveground fresh biomass across expansive grassland regions with pronounced spatial heterogeneity, particularly in reducing the interference of soil background in Inner Mongolia grasslands. In conclusion, NDPI presents itself as a promising tool for assessing the greenness of Alpine grassland vegetation.
Numerous studies have investigated the response of vegetation greenness to climate change at both regional and global scales. For instance, Xu et al. [28] demonstrated that NDVI changes were significantly correlated with annual temperature (R = 0.52, p < 0.01) across China but not with annual precipitation (p > 0.1). Additionally, correlations between vegetation greenness changes and both temperature and precipitation were found to be significant at a regional scale (p < 0.001). However, many of these studies primarily focus on the annual mean temperature, neglecting the potential influences of minimum and maximum temperatures during the growing season. Previous research has also highlighted the significant impact of elevation on the variations in Alpine vegetation greenness in response to hydrothermal conditions on the Tibetan Plateau [11,14,15,16]. Specifically, An et al. [14] identified a pronounced elevation-dependent relationship between vegetation greenness and temperature during the growing season (May–September) from 2000 to 2016. Furthermore, Wang et al. [16] noted a mismatch between the elevational variation rate of NDVI and hydrothermal conditions. At altitudes above 2400 m, temperature predominantly influenced the elevational shifts of NDVI isolines, whereas precipitation was the dominant factor below 2400 m. Wang et al. [16] also observed that the drought response (SPI/SPEI) of the Enhanced Vegetation Index (EVI) significantly diminished with increasing elevation (p < 0.001). Despite these findings, the specific influence of elevation on the response and sensitivity of grassland vegetation greenness to minimum/maximum temperatures during the Tibetan Plateau’s growing season remains unexplored. This study seeks to address this gap.
This study addresses a current gap in the literature by (1) examining the sensitivity of vegetation greenness to hydrothermal conditions, encompassing minimum, maximum, and mean temperatures, as well as precipitation, on the Tibetan Plateau grasslands from 2000 to 2021, and (2) assessing the impact of hydrothermal factors on grassland vegetation greenness across various vertical gradient zones of the Plateau. A comprehensive understanding of how grassland vegetation greenness dynamics respond to hydrothermal conditions, modulated by elevation, is imperative. Such knowledge will offer valuable scientific insights for sustainable grassland management and precise restoration in ecologically vulnerable zones, particularly in regions characterized by significant elevational variations.
2. Materials and Methods
2.1. Study Region
The study region, spanning 26°00′12″–39°46′50″N and 73°18′52″–104°46′59″E (as shown in Figure 1a), is situated in southwestern China, predominantly characterized by Alpine grasslands, the most prevalent vegetation type in the area. Enveloped by towering mountains, the region displays an extensive vertical distribution, which results in a distinct nonzonal Alpine climate. This climate is typified by low temperatures, with the majority of the area registering a mean annual temperature of less than 0 °C, further intensifying with elevation and exhibiting pronounced susceptibility to warming [10]. Notably, a significant portion of the region experiences an arid or semiarid climate, with mean annual precipitation falling below 400 mm for over half the area. Rainfall predominantly occurs during the growing season, spanning May to September. The average elevation exceeds 4000 m (illustrated in Figure 1b), rendering the plateau both colder and more variable than other regions sharing the same latitude. Amidst the overarching theme of global climate change, recent decades in this area have seen discernable climatic shifts: a marked acceleration in warming, coupled with increased and variable precipitation patterns [29]. Given these unique characteristics, this region presents an optimal setting for examining the dynamics of grassland vegetation greenness and its responsiveness to climate fluctuations. As per the Chinese Grassland Classification System [30], the primary grassland categories found here include Alpine meadow, Alpine steppe, and Alpine desert (refer to Figure 1c).
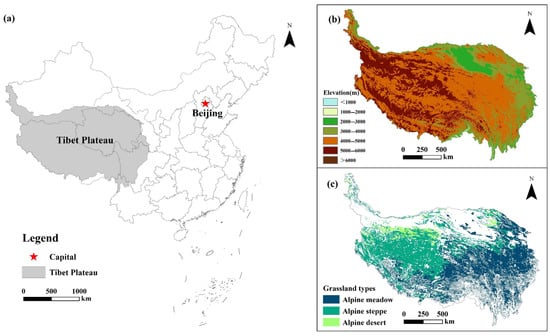
Figure 1.
Geographical location (a), elevation (b),grassland type (c) of the study area.
2.2. Dataset Processing
The NDPI is described by Equation (1). In this equation, RED, NIR, and SWIR represent the surface reflectance values in the red, near-infrared, and shortwave infrared bands (~1.6 μm), respectively. These reflectance data are derived from the MODIS surface reflectance product (MOD09A1 V006) with a 500 m spatial resolution, offering 8-day composite values of normalized reflectance. This product is sourced from the U.S. National Aeronautics and Space Administration (NASA) (accessible at http://earthdata.nasa.gov/, accessed on 2 March 2023). The MOD09A1 was selected to determine the vegetation dynamics across the study region, primarily due to its capability to filter out undesirable values, cloud contaminants, and other data artifacts during processing, ensuring data quality. For data management, the MODIS reprojection tool (MRT) software (version 41) facilitated the mosaicking of eight MODIS tiles every 8 days. This tool also projected the surface reflectance data for the entirety of the study area during the growing seasons (May to September) from 2000 to 2021, employing the Albers map projection (stored in Geo-Tiff format). Ultimately, the maximum-value compositing method was utilized to compile the 8-day NDPI data, resulting in a synthesized value for the entire growing season.
The minimum temperature (Tmin, °C), maximum temperature (Tmax, °C), mean temperature (Tmean, °C), and mean precipitation (GSAP, mm) during the growing season were acquired and processed using the A Big Earth Data Platform for Three Poles (http://poles.tpdc.ac.cn/zh-hans/, accessed on 3 March 2023) [31,32] and the National Tibetan Plateau/Third Pole Environment Data Center (https://data.tpdc.ac.cn/home, accessed on 3 March 2023) [33,34,35,36,37]. Data extraction was confined to our study area by utilizing the vector boundary of the Tibetan Plateau. This boundary dataset was sourced from the National Geomatics Center of China (http://ngcc.sbsm.gov.cn/, accessed on 3 March 2023).
The Digital Elevation Model (DEM) with a global resolution of 90 m was sourced from the Shuttle Radar Topography Mission (SRTM) images (available at http://srtm.csi.cgiar.org, accessed on 3 March 2023). These data were utilized to represent elevation characteristics across the Tibetan Plateau. To ensure consistency with other datasets, the DEM was resampled to a 500 m resolution. Additionally, the Albers Equal Area projection was selected for this analysis. Subsequently, these resampled grids were employed for the study.
2.3. Methods
The spatial distribution map representing the mean grassland NDPI during the peak of the growing season from 2000 to 2021 was generated by calculating the average value across the entire study area for each of the 22 years. The coefficient of variation (CV) of NDPI can serve as an indicator of stability [38]. The trend and significance of NDPI were discerned, using the Theil–Sen (TS) method combined with the non-parametric rank-based Mann–Kendall (MK) test [39,40].
To evaluate the interannual variations in the maximum greenness of grassland vegetation in response to Tmin during the growing season, partial correlation coefficients were computed between the NDPI and Tmin, considering Tmax, Tmean, and GSAP as control variables [12]. The apparent sensitivity of NDPI to Tmin was quantified by the coefficient derived from multiple linear regressions, where the NDPI was regressed against Tmin, Tmax, Tmean, and GSAP [12]. Similarly, the response and sensitivity of the NDPI to Tmax, Tmean, and GSAP were assessed.
3. Results
3.1. Spatial Patterns of Peak Season NDPI and Hydrothermal Factor Trends
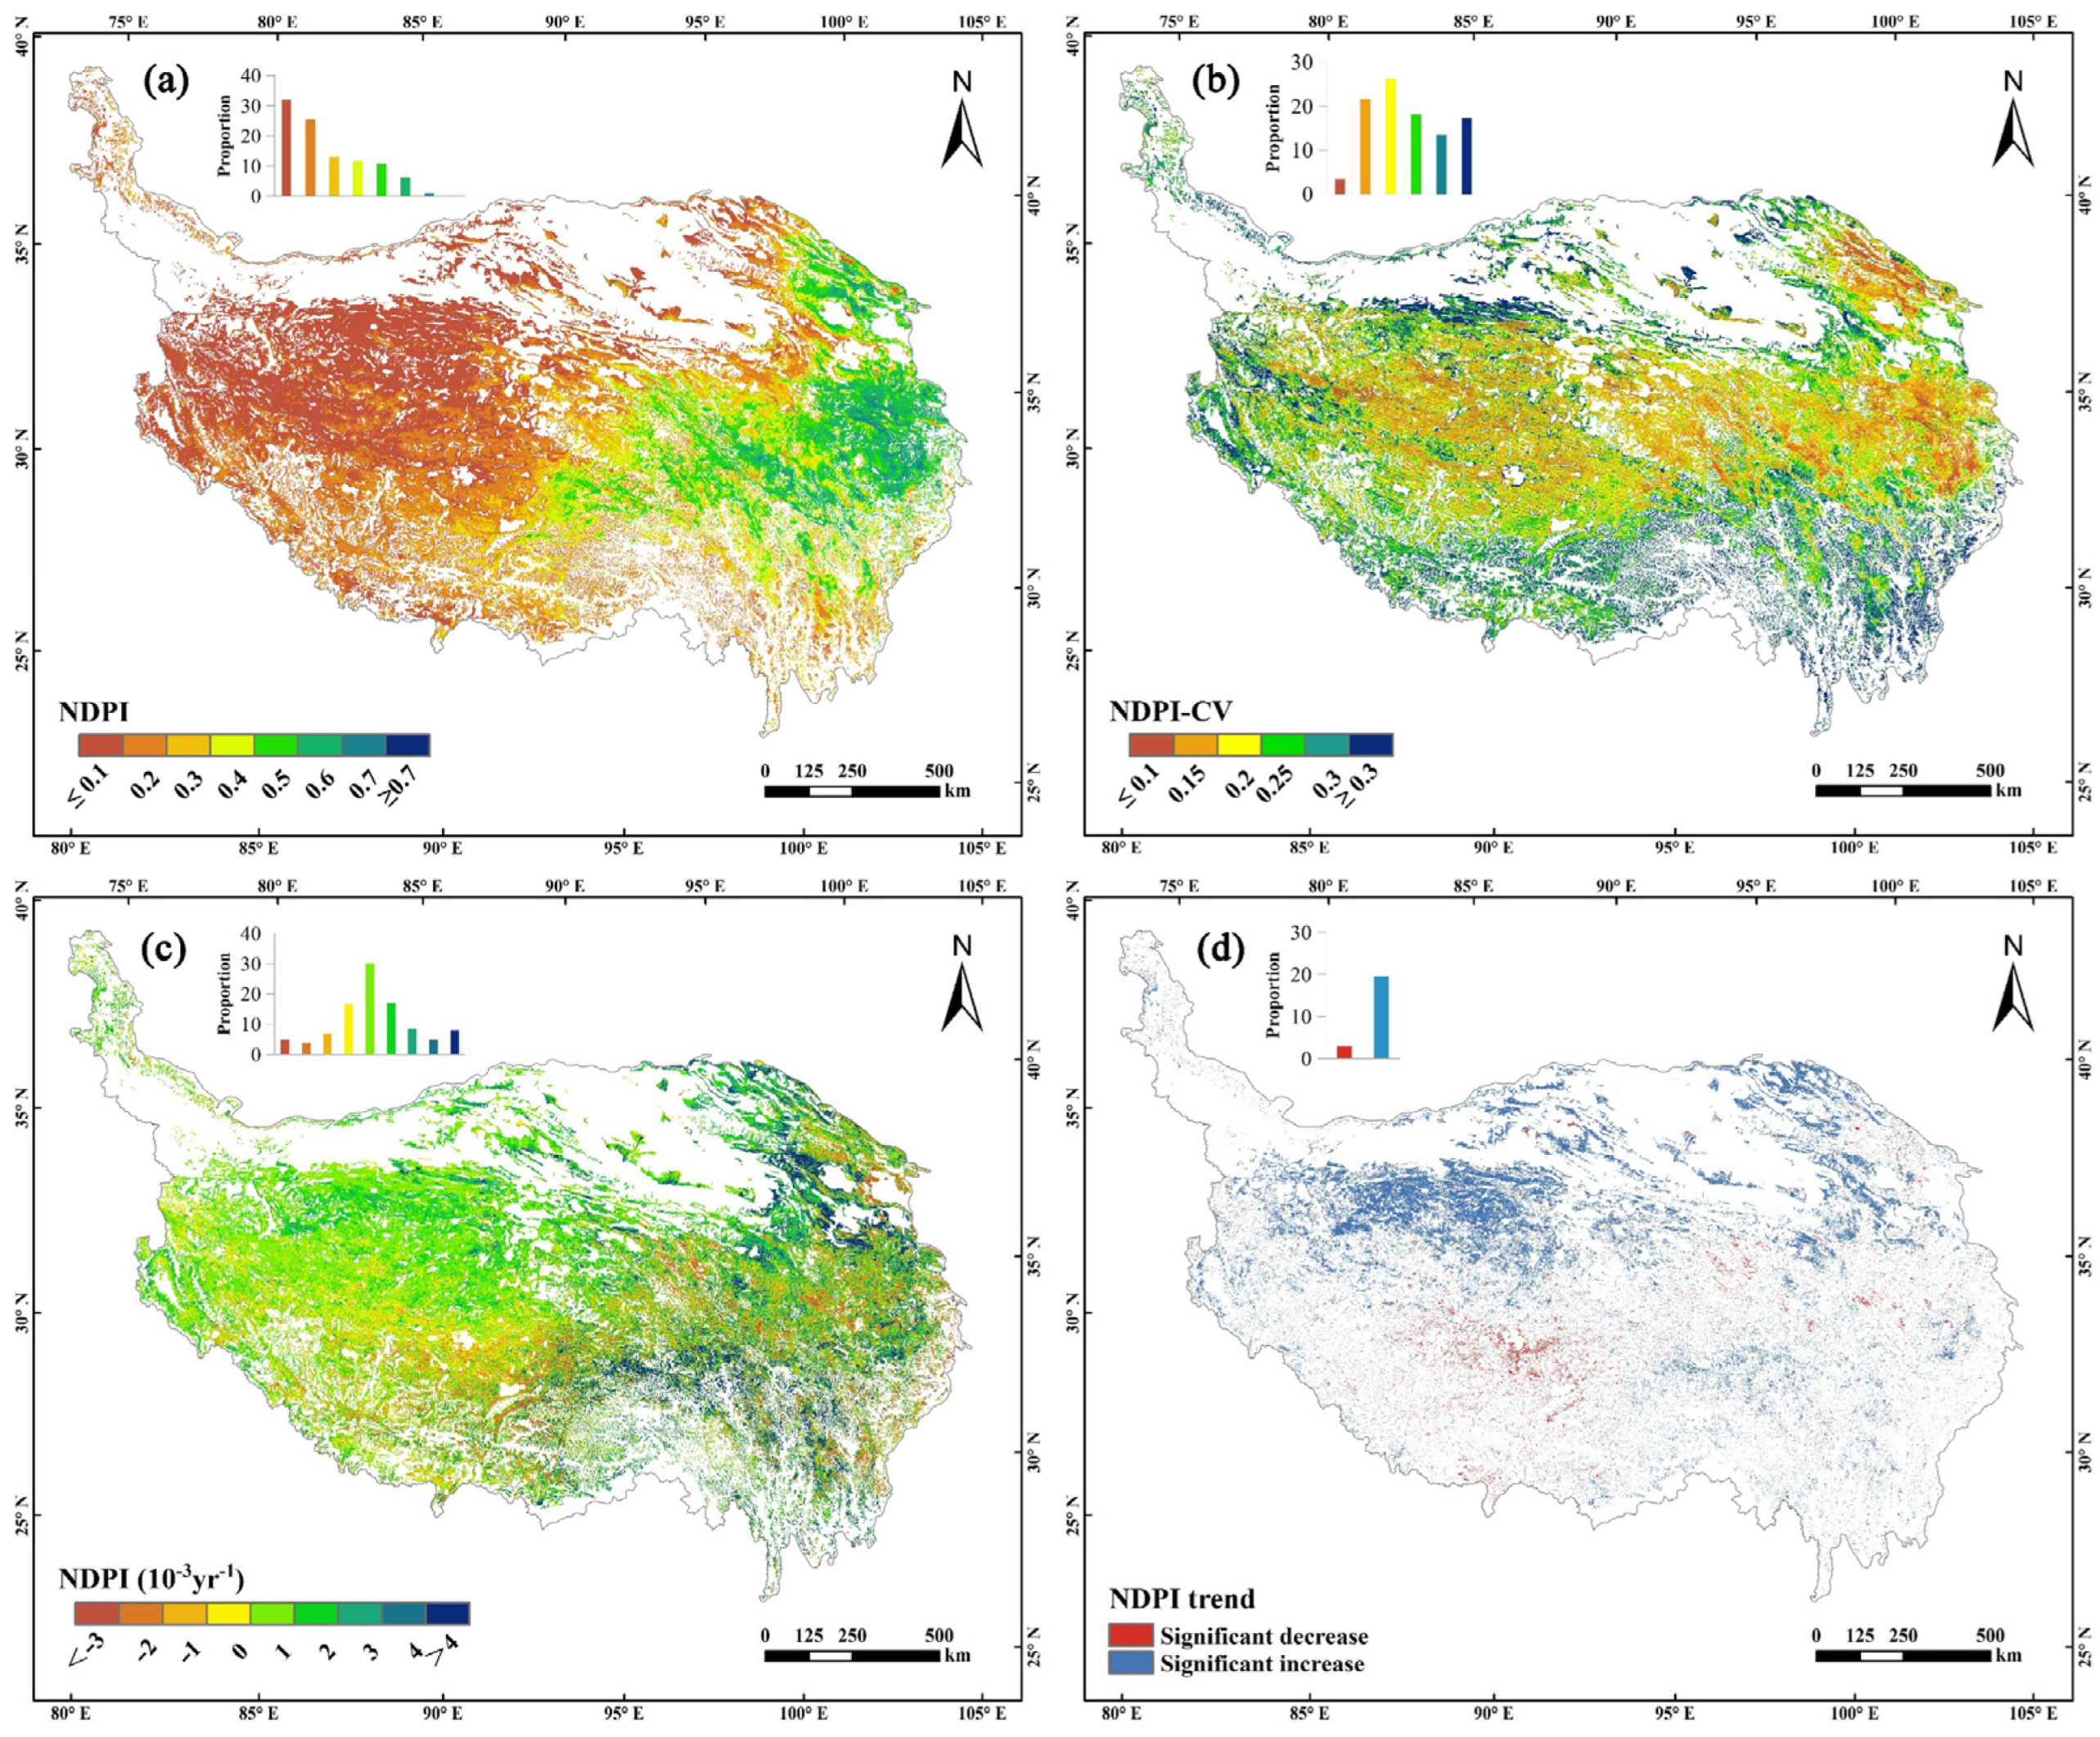
On a grid cell scale, marked heterogeneity is evident in the spatial patterns of the annual mean grassland NDPI during the peak season spanning 22 years from 2000 to 2021 within the study area (Figure 2a). The results indicate that the general spatial distribution of the annual mean NDPI exhibited an incremental trend from the northwestern to the southeastern regions of the study area. Notably, areas with the lowest values (mean NDPI < 0.3), indicating suboptimal vegetation photosynthetic activity, were predominantly located in the northwestern region of the plateau. Conversely, regions with higher NDPI values (mean NDPI > 0.6), signifying robust vegetation photosynthetic activity, were primarily concentrated in the eastern and northeastern regions of the plateau. The coefficient of variation (CV) highlights significant NDPI fluctuations in the southern region of the plateau from 2000 to 2021 (Figure 2b).
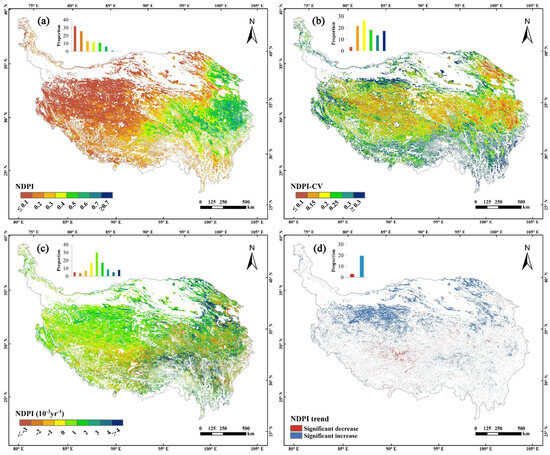
Figure 2.
Mean value (a), stability (b), trends (c) and significance of the trends (d) of NDPI in the peak season over the period 2000–2021.
Figure 2c reveals the spatial distribution of the overall trends in annual grassland NDPI within the study area during the peak season over the past 22 years. A statistical analysis of the grid cells indicates that 67.92% displayed an upward trend in annual grassland NDPI. Of these, 19.57% exhibited a significant increasing trend with p < 0.05 (Figure 2d and Table 1). These cells predominantly occur in the northern and northwestern regions of the Plateau, specifically in counties like Gêrzê and Nyima. In contrast, the remaining cells demonstrated a downward trend (slope < 0), with a mere 2.97% showing a significant decrease (p < 0.05). These are primarily dispersed across the southwestern regions of the plateau, including Shenzha and Baingoin counties. Over this 22-year period, trends varied across different grassland types. Alpine meadows, for instance, witnessed a higher percentage of vegetation greenness increases compared to Alpine steppes and deserts. Specifically, Alpine meadows comprised 52.79% and 34.53% of the grid cells with significant increases (p < 0.05) and minor increases (p > 0.05), respectively. This is followed by Alpine steppe (25.54% and 47.01%) and desert (11.79% and 50.68%) (Table 1).

Table 1.
The area percentage of the significance of NDPI trend for different grassland types.
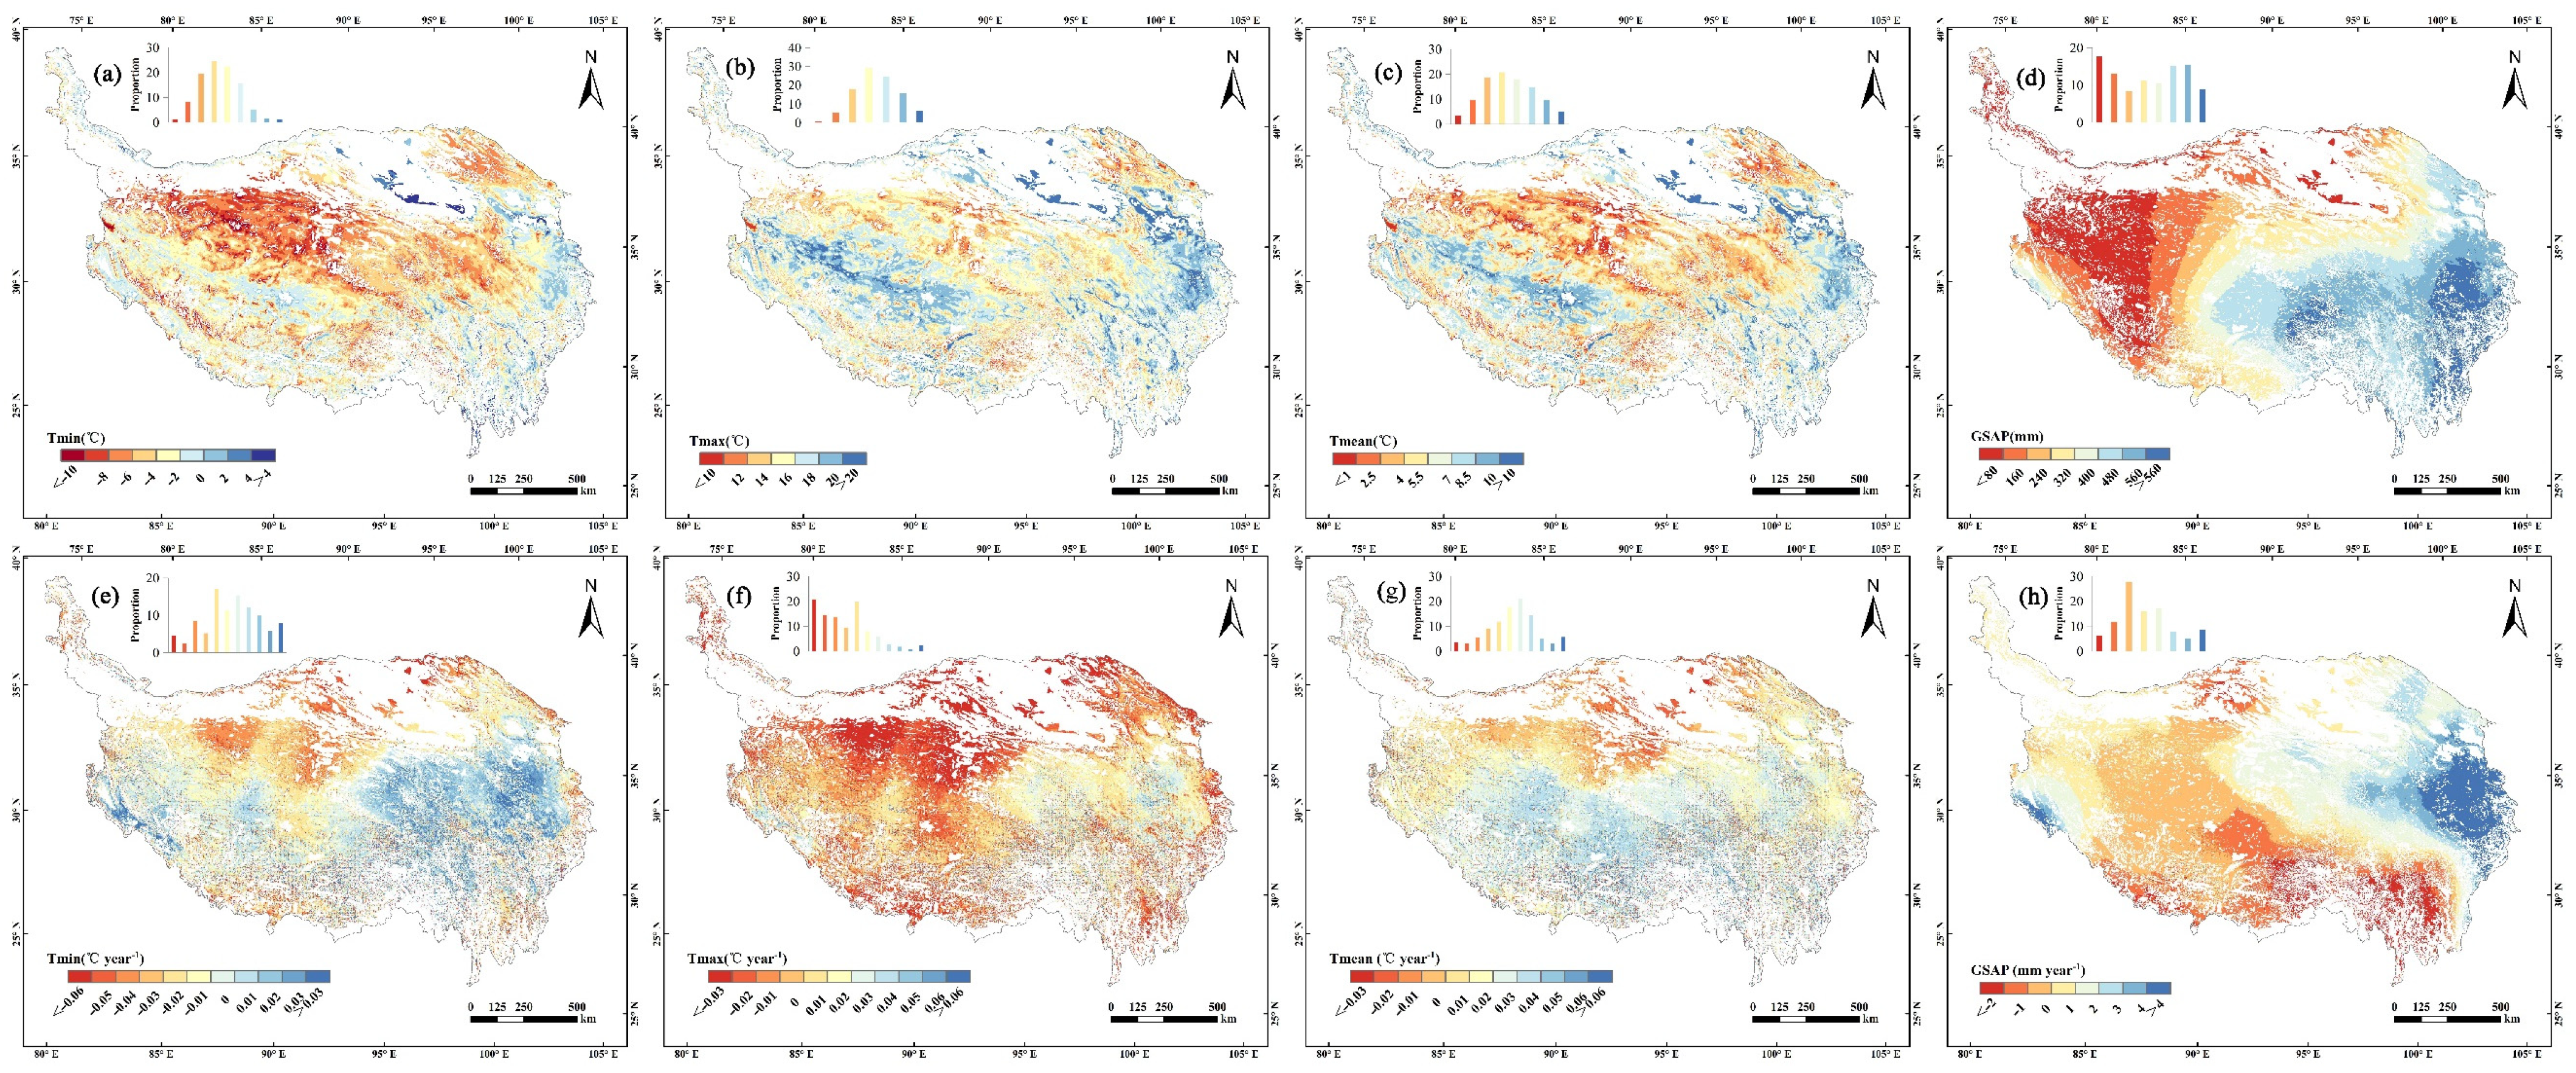
Figure 3 presents the spatial distribution and trends of Tmin, Tmax, Tmean, and GSAP. Overall, Tmin demonstrated an incremental trend from the northwestern to southeastern regions between 2000 and 2021. The northwestern plateau, particularly in the Ngari and Nagqu Prefecture, registered the lowest Tmin values. Conversely, the highest Tmin was observed in the northern region (Figure 3a). Both Tmax and Tmean depicted comparable spatial patterns, indicating a progressive rise from the center towards the periphery. The Golmud region recorded the lowest values for Tmax and Tmean (Figure 3b,c). GSAP displayed a decreasing pattern from southeast to northwest. Specifically, the Alpine desert in the northwestern plateau had GSAP values below 80 mm, whereas the southeastern edge exhibited values exceeding 560 mm (Figure 3d). A notable 64.38% of grid cells presented an annual declining trend, with a decrease rate in Tmin exceeding 0.03 °C/year, particularly in the northern and northwestern regions (Figure 3e). Contrarily, a pronounced increasing trend of Tmin, surpassing 0.03 °C/year, was evident in the plateau’s eastern region (Figure 3e). A significant 80.42% of grid cells demonstrated a decreasing trend annually, with Tmax decline rates surpassing 0.03 °C/year in the northwestern plateau (Figure 3f). Intriguingly, 78.64% of grid cells displayed an annual increase in Tmean, with a rate exceeding 0.06 °C/year in the southwestern region (Figure 3g). However, pronounced decreasing trends in Tmean, less than −0.03 °C/year, were observed in the northwestern plateau (Figure 3g). Over half the grid cells (54.43%) exhibited a decadal increasing trend, with the GSAP growth rate exceeding 4 mm/year in the eastern plateau (Figure 3h). Nonetheless, significant declining trends in GSAP, less than −2 mm/year, were identified on the southeastern frontier of the study area (Figure 3h).
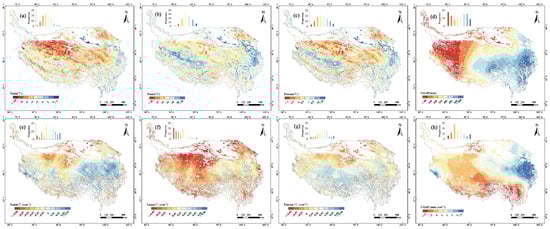
Figure 3.
Magnitude and trend in hydrothermal conditions on the Tibet plateau. The magnitude of Tmin (°C) (a) Tmax (°C) (b), Tmean (°C) (c) and GSAP (mm) (d) over the period 2000–2021; the trend of Tmin (°C year−1) (e), Tmax (°C year−1) (f) Tmean (°C year−1) (g) and GSAP (mm year−1) (h) over the period 2000–2021.
3.2. Hydrothermal Response and Sensitivity of NDPI
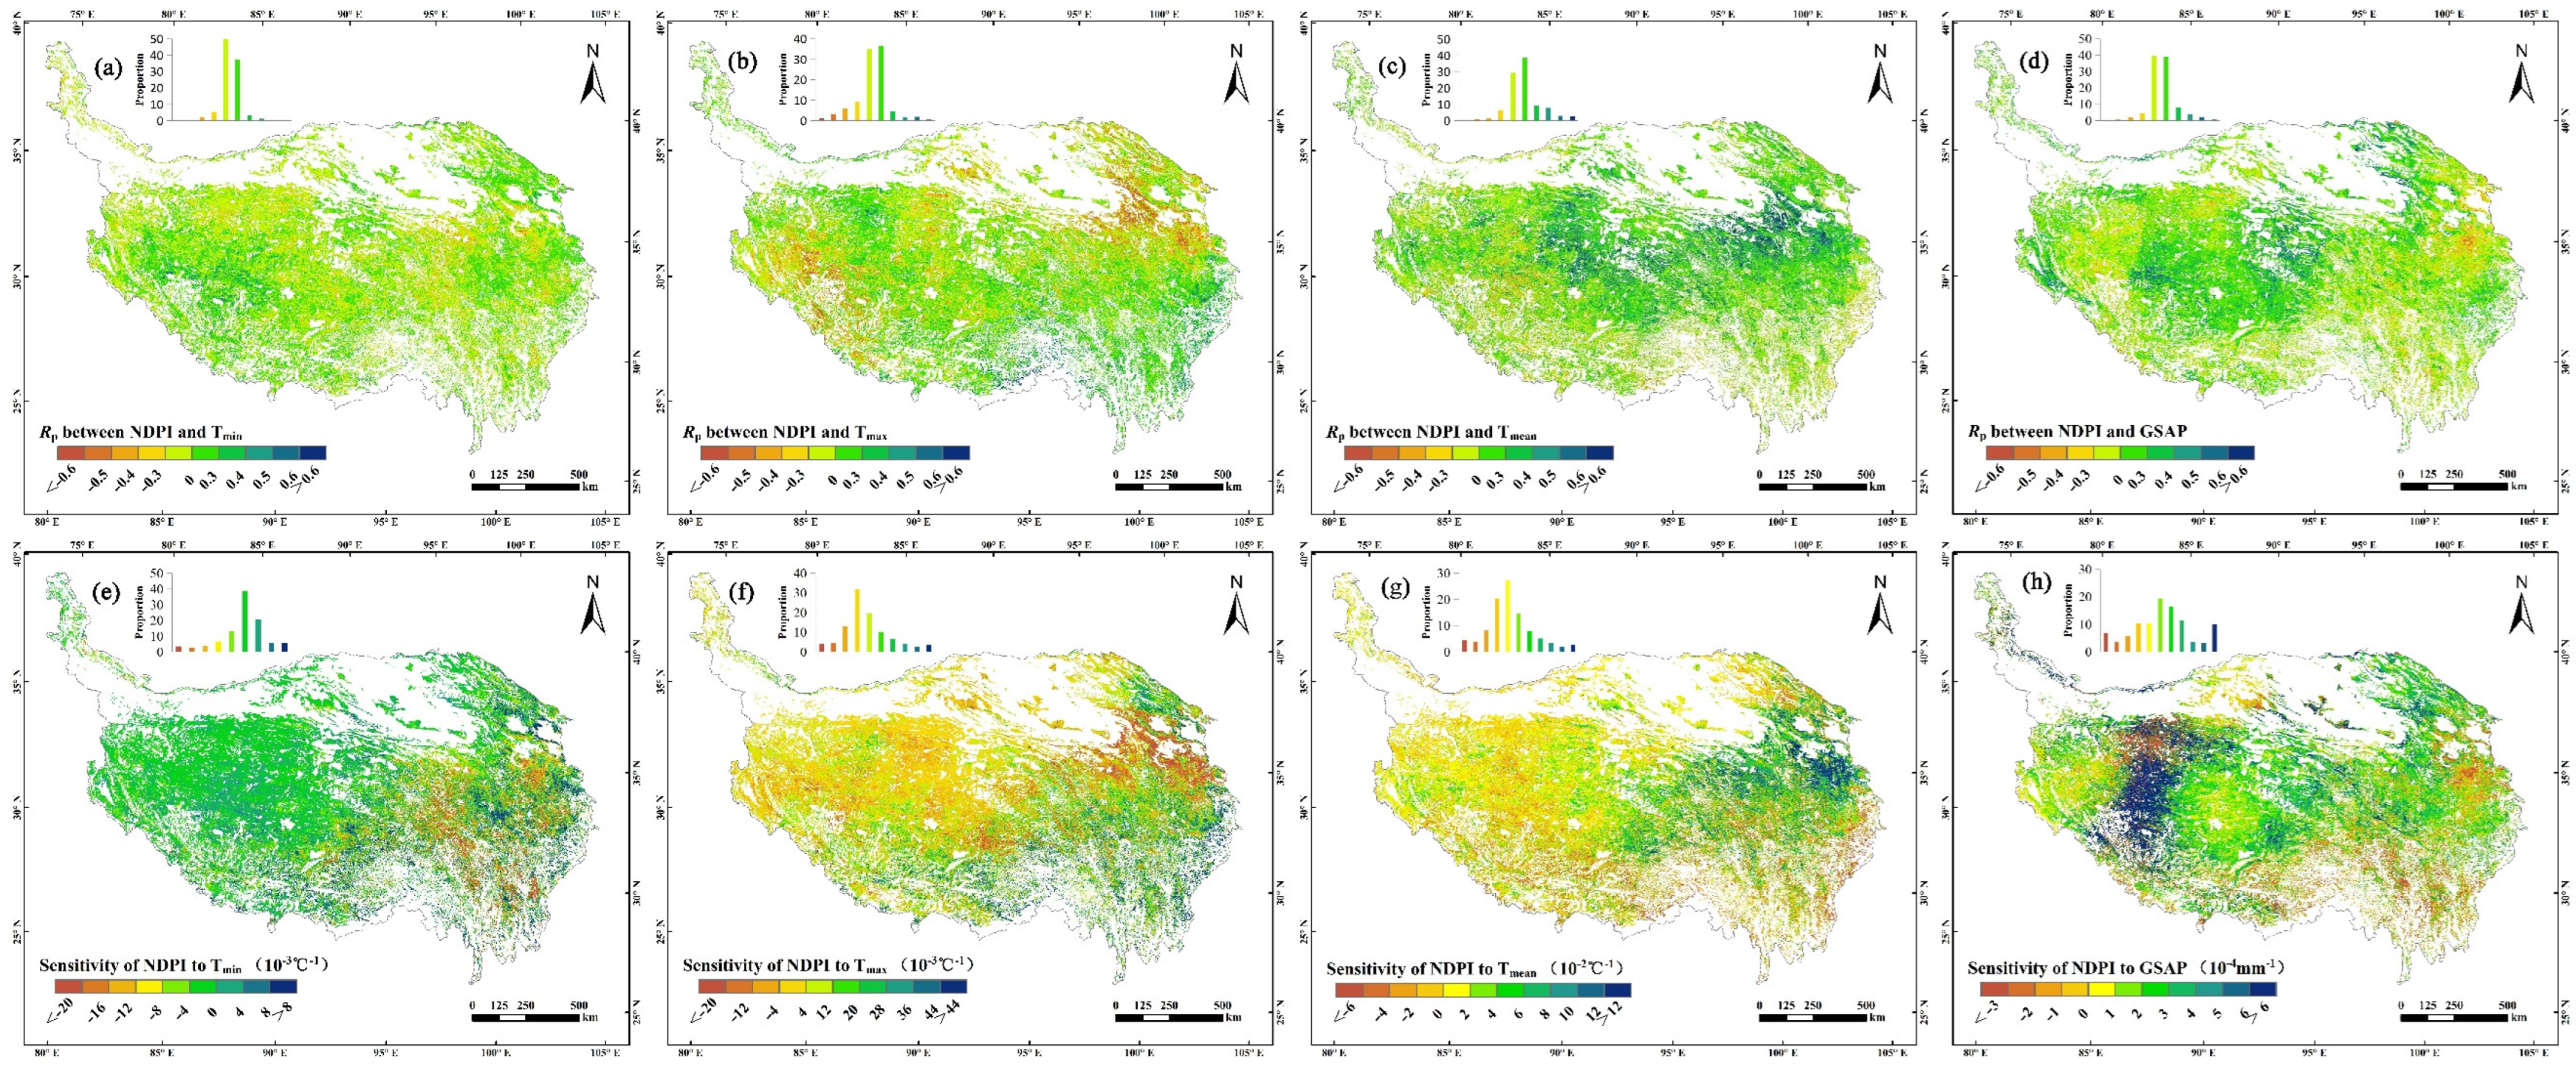
The analysis of partial correlations with hydrothermal conditions, specifically Tmin, Tmax, Tmean, and GSAP, spanned a period of 22 years on a pixel scale. The delineated spatial patterns emphasize functional discrepancies (Figure 4a,c,e,g). Over the past 22 years, a predominant negative correlation between NDPI and Tmin covered the majority of the plateau, accounting for 58.49% of all grid cells. However, only around 1.89% of these cells exhibited a marginally significant negative correlation at p < 0.05 (Figure 4a and Figure 5). Conversely, a positive correlation between NDPI and Tmin was statistically significant in nearly 1.35% of the grid cells from 2000 to 2021 (Figure 4a and Figure 5). Akin to Tmin, the NDPI negative response to Tmax was observed in 55.06% of grid cells over the 2000–2021 timeframe. Notably, these negative correlations primarily manifested in the northeastern and western sectors of the plateau, with 8.93% being significant at p < 0.05 (Figure 4b and Figure 5). For Tmean, a positive correlation was evident in 62.13% of the grid cells, primarily in the central and eastern regions. Of these, 11.27% were statistically significant at p < 0.05 (Figure 4c and Figure 5). In a pattern analogous to Tmean, the NDPI’s positive response to GSAP was evident in 58.25% of the grid cells, with the central plateau being the main region of observation. Here, 6.04% of the cells showcased significance at the p < 0.05 threshold (Figure 4d and Figure 5).
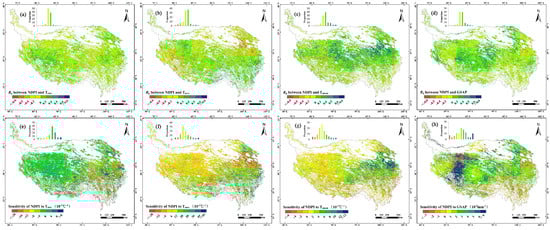
Figure 4.
The spatial patterns of the hydrothermal response and sensitivity of NDPI. The partial correlation between NDPI and Tmin (a), Tmax (b), Tmean (c) and GSAP (d), respectively; the sensitivity of NDPI to Tmin (e) and Tmax (f), Tmean (g) and GSAP (h), respectively.

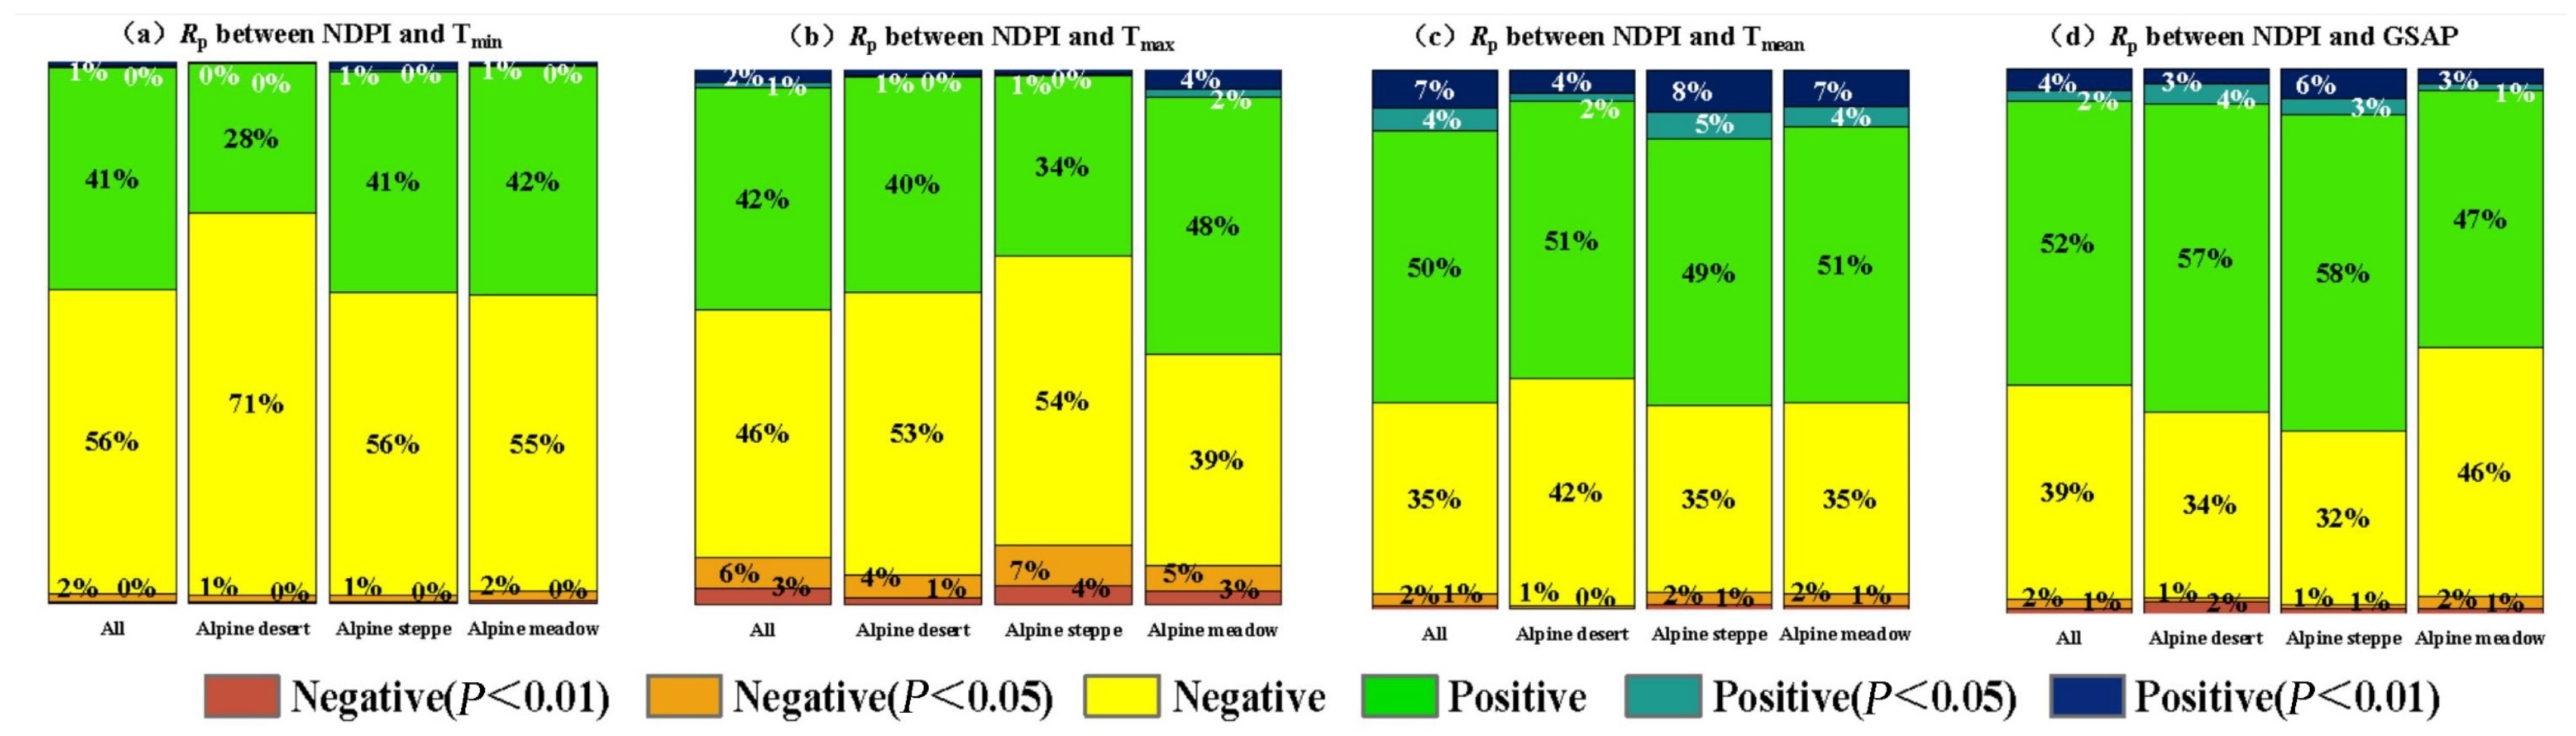
Figure 5.
Area proportion of the partial correlation between NDPI and hydrothermal conditions for different grassland types.
The partial correlations between NDPI and hydrothermal conditions were further assessed across various grassland types. Figure 5 depicts the percentage area of partial correlations between NDPI and Tmin, Tmax, Tmean, and GSAP for each of the three distinct grassland types. The data indicated that the Alpine desert had the highest percentage area showing a negative response of NDPI to Tmin (Rp < 0), succeeded by the Alpine steppe and Alpine meadow (Figure 5). For Tmax, the Alpine steppe exhibited the most significant negative response of NDPI (Rp < 0), with the Alpine desert and Alpine meadow following suit (Figure 5). Conversely, the Alpine steppe displayed the highest percentage area of a positive NDPI response to Tmean (Rp > 0), trailed by the Alpine meadow and Alpine desert (Figure 5). Comparatively, the Alpine steppe dominated in terms of the positive NDPI response to GSAP (p < 0.05), with subsequent rankings being the Alpine desert and Alpine meadow (Figure 5).
An in-depth assessment was conducted to determine the sensitivity of NDPI to hydrothermal factors across all grid cells on the plateau (Figure 4e–h). As anticipated, even though spatial patterns of sensitivity and correlation varied, they predominantly exhibited identical signs in the majority of grid cells. The eastern region of the plateau predominantly displayed a negative sensitivity of NDPI to Tmin, primarily falling below 12 × 10⁻3 °C⁻1 (Figure 4e). A significant portion, representing 63.66% of all grid cells, exhibited a positive sensitivity of NDPI to Tmax across the plateau, whereas the northeastern region demonstrated a more pronounced negative sensitivity, less than −24 × 10⁻3 °C⁻1 (Figure 4f). In opposition, the northeastern region manifested a robust positive sensitivity of NDPI to Tmean, exceeding 12 × 10⁻2 °C⁻1. Conversely, for other regions of the plateau, the sensitivity of NDPI to Tmean was notably subdued (Figure 4g). A substantial concentration of pixels, reflecting a high sensitivity greater than 6 × 10⁻4 mm⁻1 of NDPI to GSAP, was identified in the western region of the plateau. In contrast, other sections presented a relatively diminished sensitivity (Figure 4h).
3.3. Elevation-Dependent Differences in Hydrothermal Response and Sensitivity of NDPI
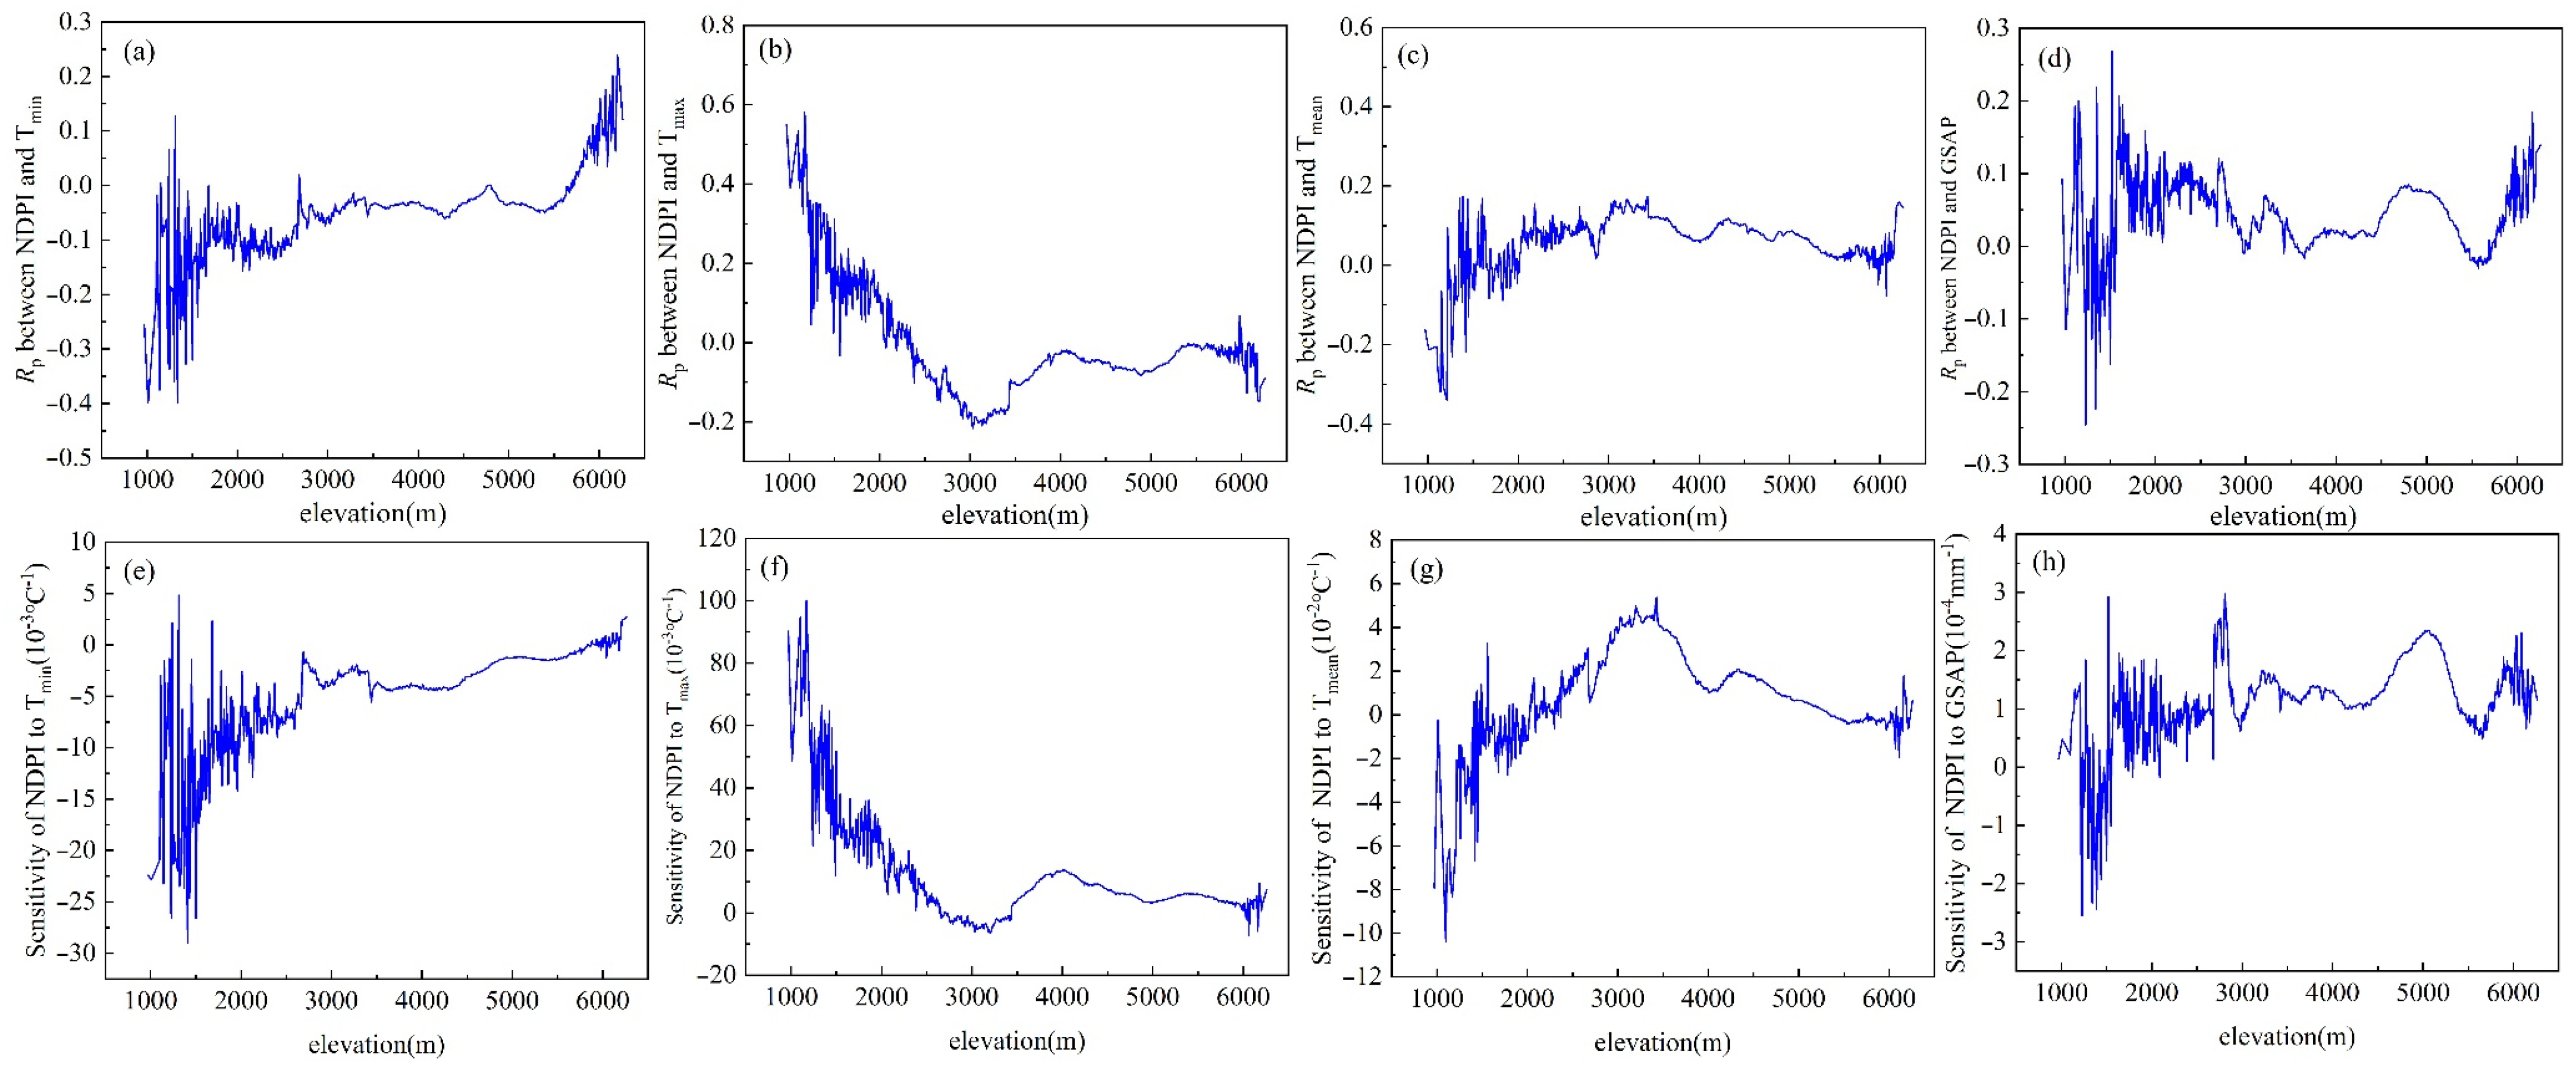
Our analysis highlights the pivotal role of elevation in modulating the response and sensitivity of grassland vegetation greenness to hydrothermal factors (Figure 6). This response and sensitivity of NDPI with respect to Tmin, Tmax, Tmean, and GSAP were elucidated at 10 m elevation intervals (Figure 6). Overall, the response and sensitivity of NDPI to hydrothermal factors distinctly fluctuated at elevations below 3000 m and above 5500 m. Notably, the partial correlation coefficient between NDPI and Tmin surged from −0.26 at an elevation of 970 m to a positive value (Rp = 0.12, p > 0.05) at 6260 m (R2 = 0.50, p < 0.05) (Figure 6a). Conversely, the coefficient for NDPI and Tmax declined from a pronounced positive value (Rp = 0.55, p < 0.05) at 970 m to −0.09 at 6260 m (Figure 6a). The positive partial correlation coefficient between NDPI and Tmean exhibited a unimodal trend across elevations, ranging from less than 2000 m to greater than 6000 m (Figure 6c). The correlation coefficient of NDPI with GSAP demonstrated a marginally declining trajectory (p > 0.05) (Figure 6d). As anticipated, although the sensitivity profile differed from correlation, they exhibited analogous trends, maintaining consistent signs with elevation in the majority of regions (Figure 6e–h).
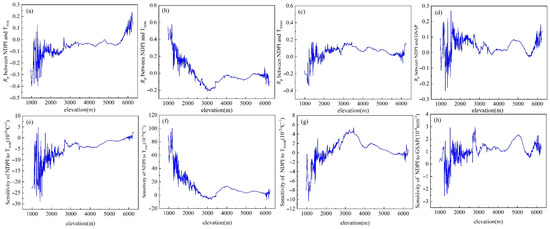
Figure 6.
The response and sensitivity of NDPI to hydrothermal conditions in the peak season along the elevational gradient (at 10 m interval bins). In (a–d) the method of the partial correlation coefficient was used; in (e–h) the method of the regression coefficient was used.
4. Discussion
4.1. Estimation of NDPI and Its Hydrothermal Factors
The NDPI exhibited a rising trend during the peak season (Figure 2c), suggesting a consistent improvement in vegetation photosynthetic activity over the past 22 years in this region. This observation aligns with other studies utilizing NDVI data [7,16,17,20,41,42]. The increase in NDPI can be attributed to enhanced hydrothermal conditions observed locally over the past 22 years (Figure 3) and the introduction of several protective measures, such as the Protection and Construction of the National Ecological Security Shelter Zone (PCNESSZ) and the Returning Rangeland to Grassland (RRG) program. Additionally, ecological restoration initiatives like the Ecological Subsidy and Award System (ESAS) have been rolled out by governments since 2000 [43]. Nevertheless, a noteworthy decrease in NDPI was observed in 2.97% of the regions (Figure 2c,d), primarily spanning the Alpine steppe and Alpine desert areas. This aligns with findings from studies using NDVI data [7,17,20,40,41]. This declining trend likely stems from water scarcity resulting from the warming–drying climate [17]. While increased precipitation was recorded in these regions, elevated evapotranspiration due to rising temperatures might exacerbate the limitations on vegetation photosynthesis imposed by drought stress [44]. Notably, when juxtaposed with the grasslands of the Tibet Plateau, the Alpine grasslands demonstrate a more marked greening, potentially attributable to snowmelt [45].
4.2. Importance of Quantifying Hydrothermal Response and Sensitivity of NDPI
This study revealed that grassland NDPI generally exhibited positive responses to Tmean and GSAP (Figure 4), implying that the greenness of Alpine grasslands could enhance if hydrothermal conditions trend towards being warmer and wetter. This finding aligns with previous reports [7,17,44]. In the eastern portion of the study area, NDPI primarily showed a positive response to Tmean (p < 0.05) because temperature primarily restricts Alpine meadow vegetation growth compared to precipitation [17,46]. However, since 2000, GSAP has negatively influenced NDPI, indicating that excessive precipitation adversely affects vegetation growth due to exacerbated soil erosion and diminished soil organic matter [17,47]. This heightened precipitation also leads to reduced temperature and radiation, consequently inhibiting plant photosynthesis. From 2000 to 2021, the interannual variation of NDPI displayed negative correlations with both Tmin and Tmax across the majority of the plateau, suggesting that an increase in both maximum and minimum temperatures could decrease the greenness of Alpine grasslands. One potential reason is that Tmin might impact seed germination and cause direct damage to vegetation cell structures [12,47,48]. The frozen soil water at Tmin temperatures could also restrict water uptake by plant roots [12,47]. Conversely, if Tmin rises, it could diminish freezing damage in plants, reduce seedling mortality, and enhance the photosynthetic capacity and growth rates, thereby extending the growing season [12]. Tmax, to a degree, might indirectly cause a reduction in vegetation greenness by augmenting evaporation and respiration, consequently limiting water availability [49]. This could also heighten the risk of chlorophyll degradation and plant mortality in arid areas [50]. On the contrary, an increased Tmax might alleviate the cold temperature constraints on vegetation growth in relatively moist and cool ecosystems [49]. Interestingly, compared to this study. Notably, Shen et al. [12] discovered that summer vegetation greenness (July to August) on the Tibetan Plateau was strongly positively correlated with summer Tmin and negatively with Tmax. This discrepancy arises because our study focuses on the growing season from May to September.
4.3. Vertical Functional Difference of Hydrothermal Factors on NDPI
A comparative analysis of hydrothermal factor effects on grassland vegetation greenness across various vertical gradient zones of the Plateau reveals distinct patterns in NDPI distribution’s response and sensitivity to Tmin, Tmax, Tmean, and GSAP depending on elevation. There is an increasing positive response and heightened sensitivity of Alpine grasslands NDPI to Tmin as elevation rises on the Plateau (p < 0.05). One rationale behind this trend is that an elevation in Tmin may stimulate enhanced photosynthetic activity within plant thermal budgets at higher elevations and colder zones [51]. Conversely, there’s a decreasing positive response and diminished sensitivity of NDPI to Tmax with increasing elevations (p < 0.05). This can primarily be attributed to the reduced water availability at higher elevations, potentially constraining or negating the favorable influence of Tmax on vegetation greening [16,42,44]. The findings demonstrate that NDPI’s response and sensitivity to Tmean across varying elevations largely depict unimodal patterns on the Tibetan Plateau, largely due to water availability constraints [42]. Both observations underscore that while temperature might offer optimal benefits, the effects of limited water availability could curtail vegetation growth. The data further reveal that NDPI’s response and sensitivity to GSAP, when viewed in relation to elevation, suggest a subtle declining trend, aligning with the decreased water availability at greater elevations on the Tibetan Plateau. An alternative perspective posits that vegetation might manifest transient greenness influenced by environmental conditions, but extended stability, potentially driven by other factors such as radiation, CO₂, and nitrogen deposition [44,52], could counterbalance the impacts of changing hydrothermal conditions [42,47].
4.4. Uncertainties, Limitations and Future Perspectives
This study possesses inherent uncertainties and limitations. The primary sources of uncertainties stem from the quality and sources of data (notably, the remote sensing and meteorological datasets), as well as the employed analysis methods. Several notable limitations are as follows: Firstly, GSAP may not accurately represent water availability on the Tibetan Plateau; thus, the sensitivity of Alpine grassland vegetation greenness to GSAP variability could potentially be underestimated. Secondly, the study did not consider the potential lag effects of hydrothermal factors on greenness (for instance, the influence of hydrothermal factors on grassland greenness prior to the growth season). Thirdly, due to the absence of such conditions during the study period, the impacts of hydrothermal extremes on grassland greenness and the greenness’s response and sensitivity to such extremes were not evaluated [53,54]. Lastly, given data constraints, the study did not delve into various dimensions such as the influence of radiation on greenness and hydrothermal conditions, human interventions like grazing, land use and socio-economic variables [7]. These will be incorporated in subsequent studies. Consequently, a more comprehensive study and profound analysis are required to address these uncertainties and limitations, thereby refining the findings. Additionally, attention should be directed towards the sensitivity of grassland greenness to extreme hydrothermal events, especially heat-waves and droughts [20,37,54], in forthcoming research. Notwithstanding these limitations, the findings from this study stand to aid governments in crafting early warning systems against Alpine grassland degradation.
5. Conclusions
This study presents a thorough examination of the response and sensitivity of grassland vegetation greenness to contemporary hydrothermal conditions on the Tibetan Plateau, and it broadens sensitivity assessments of greenness along the vertical dimension. For the growing season spanning 2000–2021, both the response and sensitivity exhibited spatial heterogeneity. With elevation, the positive response and sensitivity of Alpine grassland vegetation greenness to minimum temperature increase markedly. In contrast, the response to maximum temperature exhibits an inverse relationship. The positive response and sensitivity of greenness to mean temperature, with respect to elevations, display unimodal patterns across the Tibetan Plateau. These insights are instrumental for evaluating the ecological repercussions on the Tibetan Plateau due to global climate shifts, especially in elevationally diverse regions. They also provide guidance in formulating grassland management strategies, ensuring the preservation of these delicate eco-climatic zones.
Author Contributions
Conceptualization, Y.W., X.X. and X.L.; methodology, Y.W. and B.S.; software, Y.W., L.H. and S.C.; validation, Y.W. and J.Z.; formal analysis, Y.W. and Y.L.; resources, Y.W., C.S., D.X. and H.L.; data curation, Y.W. and L.M.; writing—original draft preparation, Y.W. and B.S.; writing—review and editing, Y.W., C.S., M.L., H.L. and D.X.; supervision, X.X. and X.L.; project administration, X.X.; funding acquisition, X.X. All authors have read and agreed to the published version of the manuscript.
Funding
This study was supported by the National Key Research and Development Program of China (2021YFD1300500, 2021YFF0703904); the National Natural Science Foundation of China (32130070, 31971769, 41771205, 42101372); Special Funding for the Modern Agricultural Technology System from the Chinese Ministry of Agriculture (CARS-34); the Fundamental Research Funds Central Non-profit Scientific Institution (1610132021016). The Institute of General and Experimental Biology SB RAS (121030900138-8).
Institutional Review Board Statement
Not applicable.
Informed Consent Statement
Not applicable.
Data Availability Statement
The data presented in this study are available on request from the corresponding author. The data are not publicly available due to intellectual property.
Acknowledgments
We are grateful to many colleagues with the Hulunber Grassland Ecosystem Observation and Research Station, Institute of Agricultural Resources and Regional Planning, Chinese Academy of Agricultural Sciences (CAAS). Acknowledgment is given for the data support from “A Big Earth Data Platform for Three Poles (http://poles.tpdc.ac.cn/zh-hans/, accessed on 4 March 2023) and National Tibetan Plateau/Third Pole Environment Data Center (https://data.tpdc.ac.cn/home, accessed on 4 March 2023)”.
Conflicts of Interest
Author Beibei Shen was employed by the company Aerospace Science and Industry (Beijing) Spatial Information Application Co., Ltd. The remaining authors declare that the research was conducted in the absence of any commercial or financial relationships that could be construed as a potential conflict of interest.
References
- Yang, Y.; Fang, J.Y.; Tang, Y.H.; Ji, C.J.; Zheng, C.Y.; He, J.S.; Zhu, B. Storage, patterns and controls of soil organic carbon in the Tibetan grasslands. Glob. Change Biol. 2008, 14, 1592–1599. [Google Scholar] [CrossRef]
- Zhuang, Q.; He, J.; Lu, Y.; Ji, L.; Xiao, J.; Luo, T. Carbon dynamics of terrestrial ecosystems on the Tibetan Plateau during the 20th century: An analysis with a process-based biogeochemical model. Glob. Ecol. Biogeogr. 2010, 19, 649–662. [Google Scholar] [CrossRef]
- Li, L.H.; Zhang, Y.L.; Wu, J.S.; Li, S.C.; Zhang, B.H.; Zu, J.X.; Zhang, H.M.; Ding, M.J.; Paudel, B. Increasing sensitivity of alpine grasslands to climate variability along an elevational gradient on the Qinghai-Tibet Plateau. Sci. Total Environ. 2019, 678, 21–29. [Google Scholar] [CrossRef] [PubMed]
- Li, M.; Wu, J.S.; He, Y.T.; Wu, L.; Niu, B.; Song, M.H.; Zhang, X.Z. Dimensionality of grassland stability shifts along with altitudes on the Tibetan Plateau. Agric. For. Meteorol. 2020, 291, 108080. [Google Scholar] [CrossRef]
- Zhong, L.; Ma, Y.M.; Salama, M.S.; Su, Z.B. Assessment of vegetation dynamics and their response to variations in precipitation and temperature in the Tibetan Plateau. Clim. Change 2010, 103, 519–535. [Google Scholar] [CrossRef]
- Camps-Valls, G.; Campos-Taberner, M.; Moreno-Martínez, Á.; Walther, S.; Duveiller, G.; Cescatti, A.; Mahecha, M.D.; Muñoz-Marí, J.; García-Haro, F.J.; Guanter, L.; et al. A unified vegetation index for quantifying the terrestrial biosphere. Sci. Adv. 2021, 7, eabc7447. [Google Scholar] [CrossRef]
- Chen, J.H.; Yan, F.; Lu, Q. Spatiotemporal variation of vegetation on the Qinghai–Tibet Plateau and the influence of climatic factors and human activities on vegetation trend (2000–2019). Remote Sens. 2020, 12, 3150. [Google Scholar] [CrossRef]
- Gao, Y.H.; Chen, F.; Lettenmaier, D.P.; Xu, J.W.; Xiao, L.H.; Li, X. Does elevation-dependent warming hold true above 5000 m elevation? Lessons from the Tibetan Plateau. NPJ Clim. Atmos. Sci. 2018, 1, 19. [Google Scholar] [CrossRef]
- Li, D.L.; Wu, S.Y.; Liu, L.B.; Zhang, Y.T.; Li, S.C. Vulnerability of the global terrestrial ecosystems to climate change. Glob. Change Biol. 2018, 24, 4095–4106. [Google Scholar] [CrossRef]
- You, Q.L.; Chen, D.L.; Wu, F.Y.; Pepin, N.; Cai, Z.Y.; Ahrens, B.; Jiang, Z.H.; Wu, Z.W.; Kang, S.C.; AghaKouchak, A. Elevation dependent warming over the Tibetan Plateau: Patterns, mechanisms and perspectives. Earth-Sci. Rev. 2020, 210, 103349. [Google Scholar] [CrossRef]
- Wang, Y.J.; Fu, B.J.; Liu, Y.X.; Li, Y.; Feng, X.M.; Wang, S. Response of vegetation to drought in the Tibetan Plateau: Elevation differentiation and the dominant factors. Agric. For. Meteorol. 2021, 306, 108468. [Google Scholar] [CrossRef]
- Shen, M.G.; Piao, S.L.; Chen, X.Q.; An, S.A.; Fu, Y.H.; Wang, S.P.; Cong, N.; Janssens, I.A. Strong impacts of daily minimum temperature on the green-up date and summer greenness of the Tibetan Plateau. Glob. Change Biol. 2016, 22, 3057–3066. [Google Scholar] [CrossRef] [PubMed]
- Piao, S.L.; Cui, M.D.; Chen, A.P.; Wang, X.H.; Ciais, P.; Liu, J.; Tang, Y.H. Altitude and temperature dependence of change in the spring vegetation green-up date from 1982 to 2006 in the Qinghai-Xizang Plateau. Agric. For. Meteorol. 2011, 151, 1599–1608. [Google Scholar] [CrossRef]
- An, S.; Zhu, X.L.; Shen, M.G.; Wang, Y.F.; Cao, R.Y.; Chen, X.H.; Yang, W.; Chen, J.; Tang, Y.H. Mismatch in elevational shifts between satellite observed vegetation greenness and temperature isolines during 2000–2016 on the Tibetan Plateau. Glob. Change Biol. 2018, 24, 5411–5425. [Google Scholar] [CrossRef] [PubMed]
- Li, P.L.; Zhu, D.; Wang, Y.L.; Liu, D. Elevation dependence of drought legacy effects on vegetation greenness over the Tibetan Plateau. Agric. For. Meteorol. 2020, 295, 108190. [Google Scholar] [CrossRef]
- Wang, Y.; Peng, D.L.; Shen, M.G.; Xu, X.Y.; Yang, X.H.; Huang, W.J.; Yu, L.; Liu, L.Y.; Li, C.J.; Li, X.W.; et al. Contrasting effects of temperature and precipitation on vegetation greenness along elevation gradients of the Tibetan Plateau. Remote Sens. 2020, 12, 2751. [Google Scholar] [CrossRef]
- Li, P.L.; Hu, Z.M.; Liu, Y.W. Shift in the trend of browning in Southwestern Tibetan Plateau in the past two decades. Agric. For. Meteorol. 2020, 287, 107950. [Google Scholar] [CrossRef]
- Wang, C.; Chen, J.; Wu, J.; Tang, Y.H.; Shi, P.J.; Black, T.A.; Zhu, K. A snow-free vegetation index for improved monitoring of vegetation spring green-up date in deciduous ecosystems. Remote Sens. Environ. 2017, 196, 1–12. [Google Scholar] [CrossRef]
- Ding, L.; Li, Z.W.; Shen, B.B.; Wang, X.; Xu, D.W.; Yan, R.R.; Yan, Y.C.; Xin, X.P.; Xiao, J.F.; Li, M.; et al. Spatial patterns and driving factors of aboveground and belowground biomass over the eastern Eurasian steppe. Sci. Total Environ. 2022, 803, 149700. [Google Scholar] [CrossRef]
- Wang, Z.Q.; Cui, G.L.; Liu, X.; Zheng, K.; Lu, Z.Y.; Li, H.L.; Wang, G.N.; An, Z.F. Greening of the Qinghai–Tibet plateau and its response to climate variations along elevation gradients. Remote Sens. 2021, 13, 3712. [Google Scholar] [CrossRef]
- Rouse, J.W.; Haas, R.H.; Schell, J.A.; Deering, D.W. Monitoring vegetation systems in the Great Plains with ERTS. NASA Spec. Publ. 1974, 351, 309. [Google Scholar]
- Peng, S.S.; Piao, S.L.; Ciais, P.; Myneni, R.B.; Chen, A.; Chevallier, F.; Dolman, A.J.; Janssens, I.A.; Penuelas, J.; Zhang, G.X.; et al. Asymmetric effects of daytime and night-time warming on Northern Hemisphere vegetation. Nature 2013, 501, 88–92. [Google Scholar] [CrossRef] [PubMed]
- Huete, A.R.; Jackson, R.D.; Post, D.F. Spectral response of a plant canopy with different soil backgrounds. Remote Sens. Environ. 1985, 17, 37–53. [Google Scholar] [CrossRef]
- Todd, S.W.; Hoffer, R.M. Responses of spectral indices to variations in vegetation cover and soil background. Photogramm. Eng. Remote Sens. 1998, 64, 915–921. [Google Scholar] [CrossRef]
- Holben, B.N. Characteristics of maximum-value composite images from temporal AVHRR data. Int. J. Remote Sens. 1986, 7, 1417–1434. [Google Scholar] [CrossRef]
- Purevdorj, T.S.; Tateishi, R.; Ishiyama, T.; Honda, Y. Relationships between percent vegetation cover and vegetation indices. Int. J. Remote Sens. 1998, 19, 3519–3535. [Google Scholar] [CrossRef]
- Xu, D.W.; Wang, C.; Chen, J.; Shen, M.G.; Shen, B.B.; Yan, R.R.; Li, Z.W.; Karnieli, A.; Chen, J.Q.; Yan, Y.C.; et al. The superiority of the normalized difference phenology index (NDPI) for estimating grassland aboveground fresh biomass. Remote Sens. Environ. 2021, 264, 112578. [Google Scholar] [CrossRef]
- Xu, G.; Zhang, H.F.; Chen, B.Z.; Zhang, H.R.; Innes, J.L.; Wang, G.Y.; Yan, J.W.; Zheng, Y.H.; Zhu, Z.C.; Myneni, R.B. Changes in Vegetation Growth Dynamics and Relations with Climate over China’s Landmass from 1982 to 2011. Remote Sens. 2014, 6, 3263–3283. [Google Scholar] [CrossRef]
- Yao, T.D.; Masson-Delmotte, V.; Gao, J.; Yu, W.S.; Yang, X.X.; Risi, C.; Sturm, C.; Werner, M.; Zhao, H.B.; He, Y.; et al. A review of climatic controls on δ18O in precipitation over the Tibetan Plateau: Observations and simulations. Rev. Geophys. 2013, 51, 525–548. [Google Scholar] [CrossRef]
- Fan, J.W.; Zhong, H.P.; Harris, W.; Yu, G.R.; Yue, Y.Z. Carbon storage in the grasslands of China based on field measurements of above-and below-ground biomass. Clim. Change 2008, 86, 375–396. [Google Scholar] [CrossRef]
- Peng, S.Z. 1-km monthly minimum temperature dataset for China (1901–2021). In A Big Earth Data Platform for Three Poles; National Tibetan Plateau/Third Pole Environment Data Center: Beijing, China, 2020. [Google Scholar] [CrossRef]
- Peng, S.Z. 1-km monthly precipitation dataset for China (1901–2022). In A Big Earth Data Platform for Three Poles; National Tibetan Plateau/Third Pole Environment Data Center: Beijing, China, 2020. [Google Scholar] [CrossRef]
- Peng, S.Z.; Ding, Y.X.; Wen, Z.M.; Chen, Y.M.; Cao, Y.; Ren, J.Y. Spatiotemporal change and trend analysis of potential evapotranspiration over the Loess Plateau of China during 2011–2100. Agric. For. Meteorol. 2017, 233, 183–194. [Google Scholar] [CrossRef]
- Peng, S.Z.; Gang, C.C.; Cao, Y.; Chen, Y.M. Assessment of climate change trends over the Loess Plateau in China from 1901 to 2100. Int. J. Climatol. 2018, 38, 2250–2264. [Google Scholar] [CrossRef]
- Peng, S.Z. 1-km monthly mean temperature dataset for China (1901–2022). In A Big Earth Data Platform for Three Poles; National Tibetan Plateau Data Center: Beijing, China, 2019. [Google Scholar] [CrossRef]
- Peng, S.Z.; Ding, Y.X.; Liu, W.Z.; Li, Z. 1 km monthly temperature and precipitation dataset for China from 1901 to 2017. Earth Syst. Sci. Data 2019, 11, 1931–1946. [Google Scholar] [CrossRef]
- Ding, Y.X.; Peng, S.Z. Spatiotemporal trends and attribution of drought across China from 1901–2100. Sustainability 2020, 12, 477. [Google Scholar] [CrossRef]
- Bedeian, A.G.; Mossholder, K.W. On the use of the coefficient of variation as a measure of diversity. Organ. Res. Methods 2000, 3, 285–297. [Google Scholar] [CrossRef]
- Mann, H.B. Nonparametric test against trend. Econometrica 1945, 13, 245–259. [Google Scholar] [CrossRef]
- Kendall, M.G. Rank correlation methods. Br. J. Psychol. 1990, 25, 86–91. [Google Scholar] [CrossRef]
- Li, L.H.; Zhang, Y.L.; Liu, L.S.; Wu, J.S.; Wang, Z.F.; Li, S.C.; Zhang, H.M.; Zu, J.X.; Ding, M.J.; Paudel, B. Spatiotemporal patterns of vegetation greenness change and associated climatic and anthropogenic drivers on the Tibetan Plateau during 2000–2015. Remote Sens. 2018, 10, 1525. [Google Scholar] [CrossRef]
- Liu, L.B.; Wang, Y.; Wang, Z.; Li, D.L.; Zhang, Y.T.; Qin, D.H.; Li, S.C. Elevation-dependent decline in vegetation greening rate driven by increasing dryness based on three satellite NDVI datasets on the Tibetan Plateau. Ecol. Indic. 2019, 107, 105569. [Google Scholar] [CrossRef]
- Cai, H.Y.; Yang, X.H.; Xu, X.L. Human-induced grassland degradation/restoration in the central Tibetan Plateau: The effects of ecological protection and restoration projects. Ecol. Eng. 2015, 83, 112–119. [Google Scholar] [CrossRef]
- Wang, S.H.; Zhang, Y.G.; Ju, W.M.; Chen, J.M.; Ciais, P.; Cescatti, A.; Sardans, J.; Janssens, I.A.; Wu, M.S.; Berry, J.A.; et al. Recent global decline of CO2 fertilization effects on vegetation photosynthesis. Science 2020, 370, 1295–1300. [Google Scholar] [CrossRef] [PubMed]
- Choler, P.; Bayle, A.; Carlson, B.Z.; Randin, C.; Filippa, G.; Cremonese, E. The tempo of greening in the European Alps: Spatial variations on a common theme. Glob. Change Biol. 2021, 27, 5614–5628. [Google Scholar] [CrossRef] [PubMed]
- Chen, X.Q.; An, S.; Inouye, D.W.; Schwartz, M.D. Temperature and snowfall trigger alpine vegetation green-up on the world’s roof. Glob. Change Biol. 2015, 21, 3635–3646. [Google Scholar] [CrossRef] [PubMed]
- An, S.; Chen, X.Q.; Zhang, X.Y.; Lang, W.G.; Ren, S.L.; Xu, L. Precipitation and minimum temperature are primary climatic controls of alpine grassland autumn phenology on the Qinghai-Tibet Plateau. Remote Sens. 2020, 12, 431. [Google Scholar] [CrossRef]
- Liu, Y.; Wu, C.Y.; Wang, X.Y.; Zhang, Y. Contrasting responses of peak vegetation growth to asymmetric warming: Evidences from FLUXNET and satellite observations. Glob. Change Biol. 2023, 29, 2363–2379. [Google Scholar] [CrossRef] [PubMed]
- Ganjurjav, H.; Gao, Q.Z.; Gornish, E.S.; Schwartz, M.W.; Liang, Y.; Cao, X.J.; Zhang, W.N.; Zhang, Y.; Li, W.H.; Wan, Y.F.; et al. Differential response of alpine steppe and alpine meadow to climate warming in the central Qinghai–Tibetan Plateau. Agric. For. Meteorol. 2016, 223, 233–240. [Google Scholar] [CrossRef]
- Yu, F.F.; Price, K.P.; Ellis, J.; Shi, P.J. Response of seasonal vegetation development to climatic variations in eastern central Asia. Remote Sens. Envion. 2003, 87, 42–54. [Google Scholar] [CrossRef]
- Palazzi, E.; Filippi, L.; von Hardenberg, J. Insights into elevation-dependent warming in the Tibetan Plateau-Himalayas from CMIP5 model simulations. Clim. Dyn. 2017, 48, 3991–4008. [Google Scholar] [CrossRef]
- Pastore, M.A.; Lee, T.D.; Hobbie, S.E.; Reich, P.B. Strong photosynthetic acclimation and enhanced water-use efficiency in grassland functional groups persist over 21 years of CO2 enrichment, independent of nitrogen supply. Glob. Change Biol. 2019, 25, 3031–3044. [Google Scholar] [CrossRef]
- You, Q.L.; Wu, F.Y.; Shen, L.C.; Pepin, N.; Jiang, Z.H.; Kang, S.C. Tibetan Plateau amplification of climate extremes under global warming of 1.5 °C, 2 °C and 3 °C. Glob. Planet. Change 2020, 192, 103261. [Google Scholar] [CrossRef]
- Deng, Y.; Wang, X.H.; Wang, K.; Ciais, P.; Tang, S.C.; Jin, L.; Li, L.L.; Piao, S.L. Responses of vegetation greenness and carbon cycle to extreme droughts in China. Agric. For. Meteorol. 2021, 298, 108307. [Google Scholar] [CrossRef]

Disclaimer/Publisher’s Note: The statements, opinions and data contained in all publications are solely those of the individual author(s) and contributor(s) and not of MDPI and/or the editor(s). MDPI and/or the editor(s) disclaim responsibility for any injury to people or property resulting from any ideas, methods, instructions or products referred to in the content. |
© 2024 by the authors. Licensee MDPI, Basel, Switzerland. This article is an open access article distributed under the terms and conditions of the Creative Commons Attribution (CC BY) license (https://creativecommons.org/licenses/by/4.0/).