Article

Twenty-Year Climatology of Solar UV and PAR in Cyprus: Integrating Satellite Earth Observations with Radiative Transfer Modeling

by
Konstantinos Fragkos
1,*,
Ilias Fountoulakis
2,3,
Georgia Charalampous
1,4,
Kyriakoula Papachristopoulou
2,
Argyro Nisantzi
1,4,
Diofantos Hadjimitsis
1,4 and
Stelios Kazadzis
5
1
Eratosthenes Centre of Excellence, Fragklinou Rousvelt 82, 3012 Limassol, Cyprus
2
Institute for Astronomy, Astrophysics, Space Applications and Remote Sensing, National Observatory of Athens (IAASARS/NOA), GR15236 Athens, Greece
3
Research Centre for Atmospheric Physics and Climatology, Academy of Athens, GR10679 Athens, Greece
4
Department of Civil Engineering & Geomatics, Cyprus University of Technology, 3036 Limassol, Cyprus
5
Physikalisch-Meteorologisches Observatorium Davos, World Radiation Center (PMOD/WRC), 7260 Davos, Switzerland
*
Author to whom correspondence should be addressed.
Remote Sens. 2024, 16(11), 1878; https://doi.org/10.3390/rs16111878
Submission received: 4 April 2024 / Revised: 20 May 2024 / Accepted: 21 May 2024 / Published: 24 May 2024
(This article belongs to the Section Atmospheric Remote Sensing)

Abstract

:
In this study, we present comprehensive climatologies of effective ultraviolet (UV) quantities and photosynthetically active radiation (PAR) over Cyprus for the period 2004 to 2023, leveraging the synergy of earth observation (EO) data and radiative transfer model simulations. The EO dataset, encompassing satellite and reanalysis data for aerosols, total ozone column, and water vapor, alongside cloud modification factors, captures the nuanced dynamics of Cyprus’s atmospheric conditions. With a temporal resolution of 15 min and a spatial of 0.05° × 0.05°, these climatologies undergo rigorous validation against established satellite datasets and are further evaluated through comparisons with ground-based global horizontal irradiance measurements provided by the Meteorological Office of Cyprus. This dual-method validation approach not only underscores the models’ accuracy but also highlights its proficiency in capturing intra-daily cloud coverage variations. Our analysis extends to investigating the long-term trends of these solar radiation quantities, examining their interplay with changes in cloud attenuation, aerosol optical depth (AOD), and total ozone column (TOC). Significant decreasing trends in the noon ultraviolet index (UVI), ranging from −2 to −4% per decade, have been found in autumn, especially marked in the island’s northeastern part, mainly originating from the (significant) positive trends in TOC. The significant decreasing trends in TOC, of −2 to −3% per decade, which were found in spring, do not result in correspondingly significant positive trends in the noon UVI since variations in cloudiness and aerosols also have a strong impact on the UVI in this season. The seasonal trends in the day light integral (DLI) were generally not significant. These insights provide a valuable foundation for further studies aimed at developing public health strategies and enhancing agricultural productivity, highlighting the critical importance of accurate and high-resolution climatological data.

1. Introduction

Sunlight is a crucial element for the development and sustainability of life on Earth. The sun emits radiation that closely resembles a blackbody with a temperature of approximately 5800 K. This radiation spans a wide spectral range, from about 2 nm (x-rays) to up to 10 m (radio waves), with its peak emission at approximately 550 nm. The Earth’s atmosphere acts as a protective shield, preventing highly energetic photons with wavelengths shorter than 290 nm from reaching the Earth’s surface. The solar spectrum can be divided into narrower regions, each of which has distinct effects on ecosystems and humans. Of particular significance for life on Earth are two key regions: the ultraviolet (UV) and the visible spectrum (VIS). About half of the total radiant energy emitted by the sun is in these two spectral regions [1].
Plants utilize radiation in the VIS region for photosynthesis, with photosynthetically active radiation (PAR) defined as radiation within the 400–700 nm spectral range [2,3,4]. Exposure to PAR (as well as UV radiation) significantly influences plant health and growth, and variations in PAR levels can impact both terrestrial and marine fauna [5,6,7]. These impacts have a direct impact on the functionality and health of ecosystems, as well as on the food production for humans. PAR controls biomass productivity through photosynthesis and plays a vital role in the carbon and water cycles (e.g., [8]). Consequently, is a key variable in global ecosystem and Earth system modeling (e.g., [9]). Nevertheless, ground-based PAR measurements are sparse, and thus PAR is commonly estimated either from measurements of the SSR using empirical equations (e.g., [10,11,12]) or from satellite observations (e.g., [8]).
Ultraviolet (UV) radiation includes wavelengths ranging from 100 to 400 nm. Based on its biological activity and the extent to which it can penetrate the human skin, UV radiation is further classified into three narrower bands: UV-C (100–280 nm), UV-B (280–315 nm), and UV-A (315–400 nm). Despite constituting only 9.3% of the emitted solar radiation [1] and an even smaller fraction of the surface solar radiation (SSR) [13,14], UV radiation carries significant biological implications (e.g., [15,16,17]). UV-C radiation is hazardous to living organisms but is effectively absorbed in the upper atmosphere by molecular oxygen and other atmospheric constituents, preventing its entry into the troposphere. Most UV-B radiation is also absorbed by molecular oxygen and stratospheric ozone, with only photons with wavelengths longer than 295 nm reaching the Earth’s surface. UV-A radiation, on the other hand, enters the troposphere, where it is strongly scattered by air molecules and aerosols.
Excessive exposure to UV radiation can lead to erythema and burns to the human skin [18]. Systematic overexposure to UV stands as a primary environmental risk factor for non-melanoma skin cancer and is among the key contributors to melanoma skin cancer along with eye cataract [19,20,21]. In contrast, moderate UV exposure is beneficial for humans, as it is essential for the production of vitamin D in the human skin [22,23,24]. Additionally, it contributes to the maintenance of good mental health and can aid in the treatment of certain diseases [25]. The UV index (UVI) [26] is a common metric used to quantify the potential of UV radiation to cause erythema on human skin. Another important metric is the effective dose for producing vitamin D (VID) [27], which measures the potential of solar UV radiation to stimulate vitamin D production in human skin [28]. While UV radiation is essential for various physiological processes, it can also damage DNA, which underscores the complex nature of its effects on human health [15]. However, it is essential to note that the positive and negative impacts of UV exposure relative to exposure time (for a given intensity), which also strongly depend on individual physiological factors, such as skin type [29].
Similarly, UV radiation has significant effects on plant life, influencing both growth and development. While moderate levels of UV-B radiation can stimulate certain beneficial responses in plant growth [PLG], such as enhanced production of secondary metabolites that can protect against pests and diseases [30], excessive UV exposure can cause plant damage [PLD], including DNA damage, the inhibition of photosynthesis, and impaired growth and development [31]. Plants have developed various adaptive mechanisms to cope with UV stress, including the production of UV-absorbing compounds and repair processes for UV-induced DNA damage [32].
Over the past few decades, there have been substantial variations in UV-B radiation levels, which, consequently, affect the UVI and VID, across densely populated mid-latitude regions. In the 1980s and early 1990s, several studies reported an increase in UV-B levels attributed to severe depletion of stratospheric ozone [33,34,35,36,37]. However, the implementation of the Montreal Protocol in 1987 resulted in a drastic reduction in emissions of anthropogenic ozone-depleting substances (ODSs), which were the primary contributors to this issue. Since the mid-1990s the upper stratospheric ozone has been recovering due to the decline in ODSs. Nevertheless, the lower stratospheric ozone has experienced a decline over the past two decades, possibly influenced by climatic changes [38]. A recent study [39] showed that the decreasing lower stratospheric ozone levels over Rome, Italy have led to negative trends in total ozone and have directly impacted UV-B radiation trends from 1996 to 2020. Furthermore, changes in aerosols and cloud cover have been identified as the primary drivers of fluctuations in UV radiation at specific mid-latitude locations [40,41,42,43,44]. These same factors also impact the SSR and, consequently, PAR. Statistically significant trends in SSR over the past two to four decades have been reported at various Mediterranean sites, primarily due to shifts in cloud cover and aerosol loading [45,46,47,48,49]. Anthropogenic climate changes are expected to further influence the key factors affecting PAR and UV, particularly in the Mediterranean basin, which is considered a climate change hotspot [50,51].
Changes in PAR and UV can affect human health and biodiversity [16,52,53] and can have a direct impact on key economic sectors in Cyprus, such as agriculture and tourism. Thus, high-quality information provided at high spatiotemporal resolution can be key, not only for scientific research in various fields but also to inform policy decisions, particularly in public health and urban planning. While a study [54] reported a statistically significant increase in SSR over Cyprus at a rate of approximately 2% per decade from 2004 to 2017, there is currently no comprehensive research documenting the corresponding changes in UV and PAR. Although changes in SSR can provide valuable insights into the direction of changes in PAR (though not necessarily UV), it is crucial to note that the magnitude of these changes can vary significantly due to differences in how VIS and UV photons interact with aerosols, clouds, and water vapor, relative to the interactions of the same factors with SSR, which primarily consists of near-infrared (NIR) radiation. Climatological data for PAR and the UVI are available at specific monitoring stations on the island [55,56,57,58]. However, these records are not continuous since 2004, and their applicability is limited due to Cyprus’s complex topography, which can result in regional variations. Based on state-of-the-art reanalysis and satellite information, we constructed a high spatial and temporal resolution climatology of the UVI, the VID, and other UV products related to plant health and the PAR for 2004–2023.
The primary advantage of our research approach is the use of spectral constructing look-up tables, which facilitate the production of various effective doses relevant to diverse economic sectors. This methodology enables a detailed and adaptable analysis of climatic impacts, enhancing the precision and applicability of our findings. To underscore the importance of the newly produced climatology, we explore spatial variations across the island, providing crucial insights into regional differences that are vital for sector-specific planning and policymaking. Moreover, we conduct a comprehensive trend analysis of these climatological quantities, assessing the influence of key factors such as aerosol levels, cloud cover, and total ozone column. This analysis not only fills a critical gap in the existing research by providing continuous, high-resolution data since 2004 but also offers actionable information that can directly inform strategies in health, tourism, and agriculture.
The paper is organized as follows. The first section introduces the subject matter, underscoring the significance of PAR and UV radiation in environmental and health contexts. Following this, the second section details the data sources utilized in this study and delineates the methodologies employed for their analysis. The third section is devoted to presenting the core results, accompanied by a thorough discussion of the insights they yield. This paper culminates with the fourth and final section, which encapsulates the summary of the research and distills the principal conclusions drawn from this study’s outcomes.

2. Materials and Methods

2.1. Data Processing

Radiometric quantities (UVI, VID, DNA, PLD, PLG, and PAR) were simulated for the time frame spanning from 2004 to 2020, covering the geographical region between 34°N–36°N and 32°E–36°E. These simulations were carried out with a temporal resolution of 15 min and a fine spatial resolution of 0.05° × 0.05°. Different Look-Up Tables (LUTs) were used to achieve the completion of the simulations of all quantities on such fine spatial and temporal resolutions. The parameterization of the LUT for the effective UV doses is not the same as the parameterization for PAR because there are parameters, such as total ozone Column (TOC) and the Columnar Water Vapor (TCWV), which significantly only affect UV (the former) or VIS (the latter) wavelengths. The range of parameters for which the LUTs were created is shown in Table 1.
The LUTs for the UVI, VID, DNA, PLG, and PLD were generated using a common LUT that encompassed global surface solar spectral irradiance within the wavelength range of 290–400 nm and a 0.5 nm increment. The solar spectra were multiplied with the effective spectra for erythema [59], the production of vitamin D in the human skin [27], the UV-induced DNA damage [19,60], plant growth [61], and plant damage [62], respectively, and, subsequently, they were integrated over the 290–400 nm interval. In contrast, the LUT for PAR was developed from a separate LUT that included spectra within the broader range of 280–3000 nm and a 1 nm increment. The irradiance within the range of 400–700 nm was integrated to obtain the PAR LUT. A correction for the variations of the extraterrestrial solar radiation due to the changes in Earth–Sun distance was also applied.
To create the spectral LUTs, the UVSPEC model from the libRadtran package [63,64] was employed. The foundational model settings were consistent for both spectral LUTs used in the calculations for the UVI, VID, and PAR, and these settings are detailed in Table 2.
Initially, clear sky radiometric quantities were computed at a spatial resolution of 0.4° × 0.4°. This computation was performed using linear interpolation across multiple dimensions of the Look-Up Tables (LUTs). The LUTs incorporated the following parameters as model inputs: aerosol optical depth at 550 nm (AOD550), Angstrom Exponent (AE), Single-Scattering Albedo (SSA), total ozone column (TOC), and Columnar Water Vapor (TCWV). Detailed information about these parameters, which serve as crucial inputs to our model, can be found in Table 3. Temporally, AOD550, AE, and TCWV are provided with a resolution of 3 h. TOC data are available daily, and SSA data are provided monthly. In cases where TOC data are unavailable for a specific day, climatological values are used as a substitute. Subsequently, the clear sky-derived irradiances were interpolated to a final resolution of 0.05° × 0.05°. This interpolation involved applying a correction for the altitude of the location, which affects solar radiation, and the cloud modification factor (CMF), to retrieve the quantities under all sky conditions. UV quantities were assumed to increase by 5% per kilometer, while PAR was assumed to increase by 2% per kilometer, similarly to previous studies [54,70]. The CMF was calculated in our study by dividing the all sky irradiance [71] with the clear sky irradiance [72], both of which were retrieved from the CAMS solar radiation service. This calculated CMF aligns with the clear sky index as output by the McCloud model, described in the study by Qu et al. [71]. The McCloud model, which describes the extinction of solar irradiance by clouds, utilizes data from the Meteosat Second-Generation (MSG) satellites. Then, the CMF for UV (UV_CMF) was calculated for each CMF and SZA using the methodology suggested by Staiger et al. [73], specifically employing Equation (2) from their manuscript. The equation used is as follows:
U V _ C M F ( S Z A , C M F ) = 1 ( 1 + p ( S Z A ) · C M F ) 0.27 1 ( 1 + p ( S Z A ) ) 0.27
where p S Z A = 7.02199 12.73738 · cos S Z A + 5.72619 · c o s ( S Z A ) 2 , as detailed in Equation (4) of their study. This formulation accounts for the influence of SZA on the CMF, integrating the variability of cloud impact with changes in solar position throughout the day.
The uncertainty in our radiative transfer simulations primarily hinges on the accuracy of the input parameters to the RTM. These parameters and their uncertainties have been thoroughly discussed in [54], to which we refer the reader for more insights on their derivation and impact on our results.
The PAR and the effective UV doses are expressed in units of watts per square meter (W/m2). PAR, which represents the integral of irradiance within the 400 to 700 nm wavelength range, is traditionally quantified in terms of the number of photons received by a surface over a specified duration, known as Photosynthetic Photon Flux Density (PPFD) [77]. PPFD is typically measured in units of micromoles per square meter per second (μmol⋅m−2⋅s−1). To convert PAR from W/m2 to PPFD, a commonly used conversion factor of 4.57 μmol m−2 s−1 is applied [78]. In the context of plant growth and morphology, characterizing light availability for plants is often performed through the concept of the daily light integral (DLI) [79]. The DLI represents the daily flux of photons per unit ground area and takes into account both diurnal variations in light intensity and variations in day length; hence, it provides a more comprehensive assessment of light exposure for plants throughout the day. To calculate the DLI, we integrated the PAR values from all simulations conducted throughout the day. The DLI is expressed in units of mol m−2 day−1. In this manuscript, the term DLI is used interchangeably with PAR.

2.2. Ground-Based and Satellite Datasets

For the evaluation of the model, output comparisons with satellite-derived products were performed.
Specifically, for PAR, we utilized the SARAH edition 3.0 dataset from the EUMETSAT Climate Monitoring Satellite Application Facility (CM-SAF) [80]. This dataset offers instantaneous values at 30 min intervals in a spatial resolution of 0.05° × 0.05°, expressed in μmol m−2 s−1. Day light integrals were computed using the described methodology, akin to that applied for the model outputs. The spectral information, crucial for accurate PAR assessment, is derived using the SPECMAGIC clear sky model with daily water vapor and ozone information from ERA-5, MODIS-based surface albedo, and MACC-based monthly climatological aerosol information. This model employs the irradiance values across the Kato bands, and what is visible is used for the PAR calculation under cloud-free conditions [81]. The effective cloud albedo, derived directly from MSG satellite data based on a modified Heliosat method, is used to account for the influence of clouds on surface irradiance. The efficacy of PAR estimations from the CM-SAF SARAH-3.0 dataset has been validated against ground-based measurements from various stations, exhibiting excellent correlation (R > 0.95) and an average mean error bias across all stations and weather conditions of less than 10% [8].
The Tropospheric Emission Monitoring Internet Service (TEMIS), operational since 2001 under the auspices of the European Space Agency (ESA) and the Royal Netherlands Meteorological Institute (KNMI), delivers near-real-time UV radiation data through its online platform (https://www.temis.nl/uvradiation/UVdose.php; version 2.0 [82], access on 28 March 2024). Tailored for environmental and public health research, TEMIS UV offerings include the clear sky noon UV index alongside daily doses for three key health-related UV products: erythemal UV, vitamin D synthesis, and generalized DNA damage. The UV-CMF, on which TEMIS UV processing is based, is determined from cloud observations by the MSG satellites. The data are provided on a 0.25° × 0.25° (longitude × latitude) grid, with each grid cell covering an area of approximately 28 km (north–south) × 17 km (east–west), both for clear sky and all sky conditions. The daily integrals are given in kJ/m2. Detailed methodologies behind these products are discussed in [70].
Ground-based measurements of global horizontal irradiance (GHI) were collected using high-precision pyranometers installed at meteorological stations located in Agros, Larnaka, and Athalassa. These stations are integral to the Cyprus Meteorological Service network. Specifically, CM21 pyranometers were utilized at Athalassa, and CM11 models at Larnaka and Agros, and all were sourced from Kipp and Zonen, who are renowned for their stability and accuracy in measuring broadband solar irradiance. The dataset from Athalassa spans from 2004 to 2021. For Larnaka and Agros, the data coverage extends from 2006 and 2010 to 2021, respectively. All the sensors are factory calibrated in accordance with the World Radiometric Reference (WRR). Additionally, global radiation instruments are calibrated outdoor against standard references at irregular time intervals during the study period [57].
In this study, since direct PAR or UV measurements were unavailable, GHI served as a proxy to evaluate the model’s proficiency in simulating diurnal cloud variations. We established two daily CMFs: one for GHI representative of the PAR spectrum and another specifically for the UV spectrum, utilizing GHI data. The PAR CMF was calculated based on the ratio of the integral of measured GHI to the daily integral of the clear sky GHI from the CAMS clear sky model. For the UV-CMF, the calculation was slightly more complex due to the nuanced cloud attenuation effects on UV radiation. Initially, the UV-CMF was derived at 15 min intervals using the CMF calculated from the ratio of the GHI measurements to the CAMS clear sky irradiance, employing the methodology described in [73]. These values were then multiplied by the modeled clear sky erythemal UV dose and were integrated to compute the daily UV dose under all sky conditions. The daily erythemal doses under clear sky conditions were obtained from the clear sky modeled erythemal UV doses. Finally, the impact of clouds on the daily erythemal doses, i.e., the daily UV-CMF, was determined by dividing the all sky by the clear sky daily UV doses.

2.3. Statistical Metrics

To assess the accuracy and reliability of the model, various statistical metrics were employed. These include the mean absolute error (MAE), which measures the average magnitude of the errors in a set of predictions; the median, representing the midpoint of the dataset’s error distribution; the root-mean-square error (RMSE), providing a measure of the differences between values predicted by the model and the values observed; the interquartile range (IQR), which evaluates the variability in the middle 50% of the dataset; and the standard deviation (STD), which quantifies the dispersion of the dataset from the mean. The mathematical expressions of these terms are given in Appendix A.
To ensure precision in our comparisons, we aligned our analysis periods based on data availability and relevance to our study objectives. The model–satellite comparison encompassing nearly two decades allows us to validate the model across varying climatic conditions and solar radiation patterns. Simultaneously, the comparison involving CMFs derived from ground-based measurements aligns closely with our goal to validate the model’s cloud simulation capabilities against direct observational data. These comparisons are integral to verifying the accuracy of the model’s algorithms in real-world scenarios and underpin our confidence in the derived simulated quantities.
The determination of trends within our dataset was performed using a straightforward linear regression model, which was applied on a seasonal basis to capture the temporal variations across different times of the year. To quantify these trends as percentages, we calculated the slope of the regression line for each season, multiplied it by 100, and then divided it by the mean overall seasonal value of the respective radiometric quantity (UVI or DLI). This approach allows us to express the trend as a percentage change relative to the average conditions for that season, providing a normalized measure of change that is easily interpretable. Since the CMF represents the ratio of the radiometric quantity under all sky conditions to that under cloudless conditions, any variation in the CMF directly translates to variations in the radiation. Therefore, in Section 3.2.2, we discuss how trends in the CMF reflect changes in radiation due to alterations in cloudiness. This approach provides a direct method to assess the impact of cloud cover variations on surface solar radiation, particularly the UVI, by examining the corresponding changes in the CMF over time. To ascertain the statistical significance of the observed trends, the p-value was calculated using the Wald Test with a t-distribution for the test statistic [83]. A p-value below a threshold of 0.05 indicated that the trend was statistically significant at a 95% confidence level, leading to the rejection of the null hypothesis that posits a slope of zero.

3. Results and Discussion

3.1. Comparison of the Model against Satellite and Ground-Based Measurements

In this section, we assess the model’s performance, conducting a comprehensive comparison with existing satellite datasets. For this analysis, we utilized all common days with available measurements spanning from 2004 to 2023. This extensive dataset ensures robust validation and allows us to scrutinize long-term trends and anomalies in model performance relative to satellite observations. Furthermore, the evaluation of CMFs, which are essential for understanding the model’s capability to simulate cloud impacts on solar irradiance, involved data from both ground-based measurements and outputs from the model and satellites. This CMF comparison specifically focused on common operational days from 2004 to 2021. Using CMFs as a comparative metric, we assess not just the absolute values of modeled irradiance but also how accurately models represent the relative change due to clouds, which is crucial for climate modeling and solar energy applications. This approach essentially compares model calculations with each other, emphasizing the importance of the quality and comparability of model inputs. In doing so, it highlights the relative strengths and weaknesses of each modeling approach in capturing dynamic atmospheric conditions. Since results were consistent across all stations (Larnaca, Agros, Athalassa), we focus on data from the Athalassa station for a detailed discussion in Section 3.1.1 and Section 3.1.2 due to its representative dataset and comprehensive instrumentation.

3.1.1. Evaluation of Effective UV Products

Figure 1 provides a comparative analysis of the modeled daily erythemal UV doses against the daily UV doses from TEMIS. The scatter plot reveals a robust linear relationship, as indicated by the high correlation coefficient (R2 = 0.96). This strong correlation demonstrates the good agreement between the TEMIS data and the model. The histogram on the right shows the differences between the model and TEMIS values. While the distribution centers around zero, there is a slight skew towards negative values (modeled erythemal UV daily doses are higher than the TEMIS one). The statistical measures provide more information about the differences. The mean difference is −0.07 kJ/m2, indicating that modeled values are slightly lower than TEMIS. The median, at 0.00 kJ/m2, aligns perfectly with zero, suggesting that for half of the dataset, the model values exactly match the TEMIS values. The IQR, which is 0.41 kJ/m2, points to the middle 50% of the data being tightly clustered around the median.
Figure 2 presents a comparative analysis of daily UV Cloud Modification Factors (UV-CMFs) from the model and those retrieved from TEMIS against the daily UV-CMF that has been calculated by ground-based GHI measurements. The UV-CMF is computed by dividing the integrated daily erythemal UV dose under all sky conditions by that under the same atmospheric conditions but without clouds [73]. The scatter plots in Figure 2a,b display a strong linear relationship between the measured UV-CMF and those estimated by both the model and TEMIS, with high correlation coefficients (R2 values of 0.89 and 0.90, respectively), indicating robust power in estimating daily erythemal UV dose and agreement with the ground-based measurements.
The bottom panels in Figure 2c,d display the frequency distributions of the differences between the measured and estimated UV-CMF values for the model and TEMIS, respectively. Alhthough the distributions are centered near zero, indicating good overall agreement, there is a slight bias towards positive differences, suggesting a minor overestimation of cloudiness by both sources. Notably, TEMIS exhibits a slightly higher mean difference (panel Figure 2d: mean = 0.04) compared to the model (panel Figure 2c: mean = 0.03), which implies that TEMIS may perceive less cloud cover than actually measured. This could be attributed to differences in the satellite’s detection capabilities or the algorithms used to infer cloudiness. The similar shapes and spreads of the distributions, as reflected by the standard deviation and interquartile range, further confirm the consistency of the estimations across different data sources. This comparative assessment underlines the efficacy of the model in capturing the variability of UV exposure due to cloud cover and provides insights into the subtle distinctions between model and satellite-based observations.

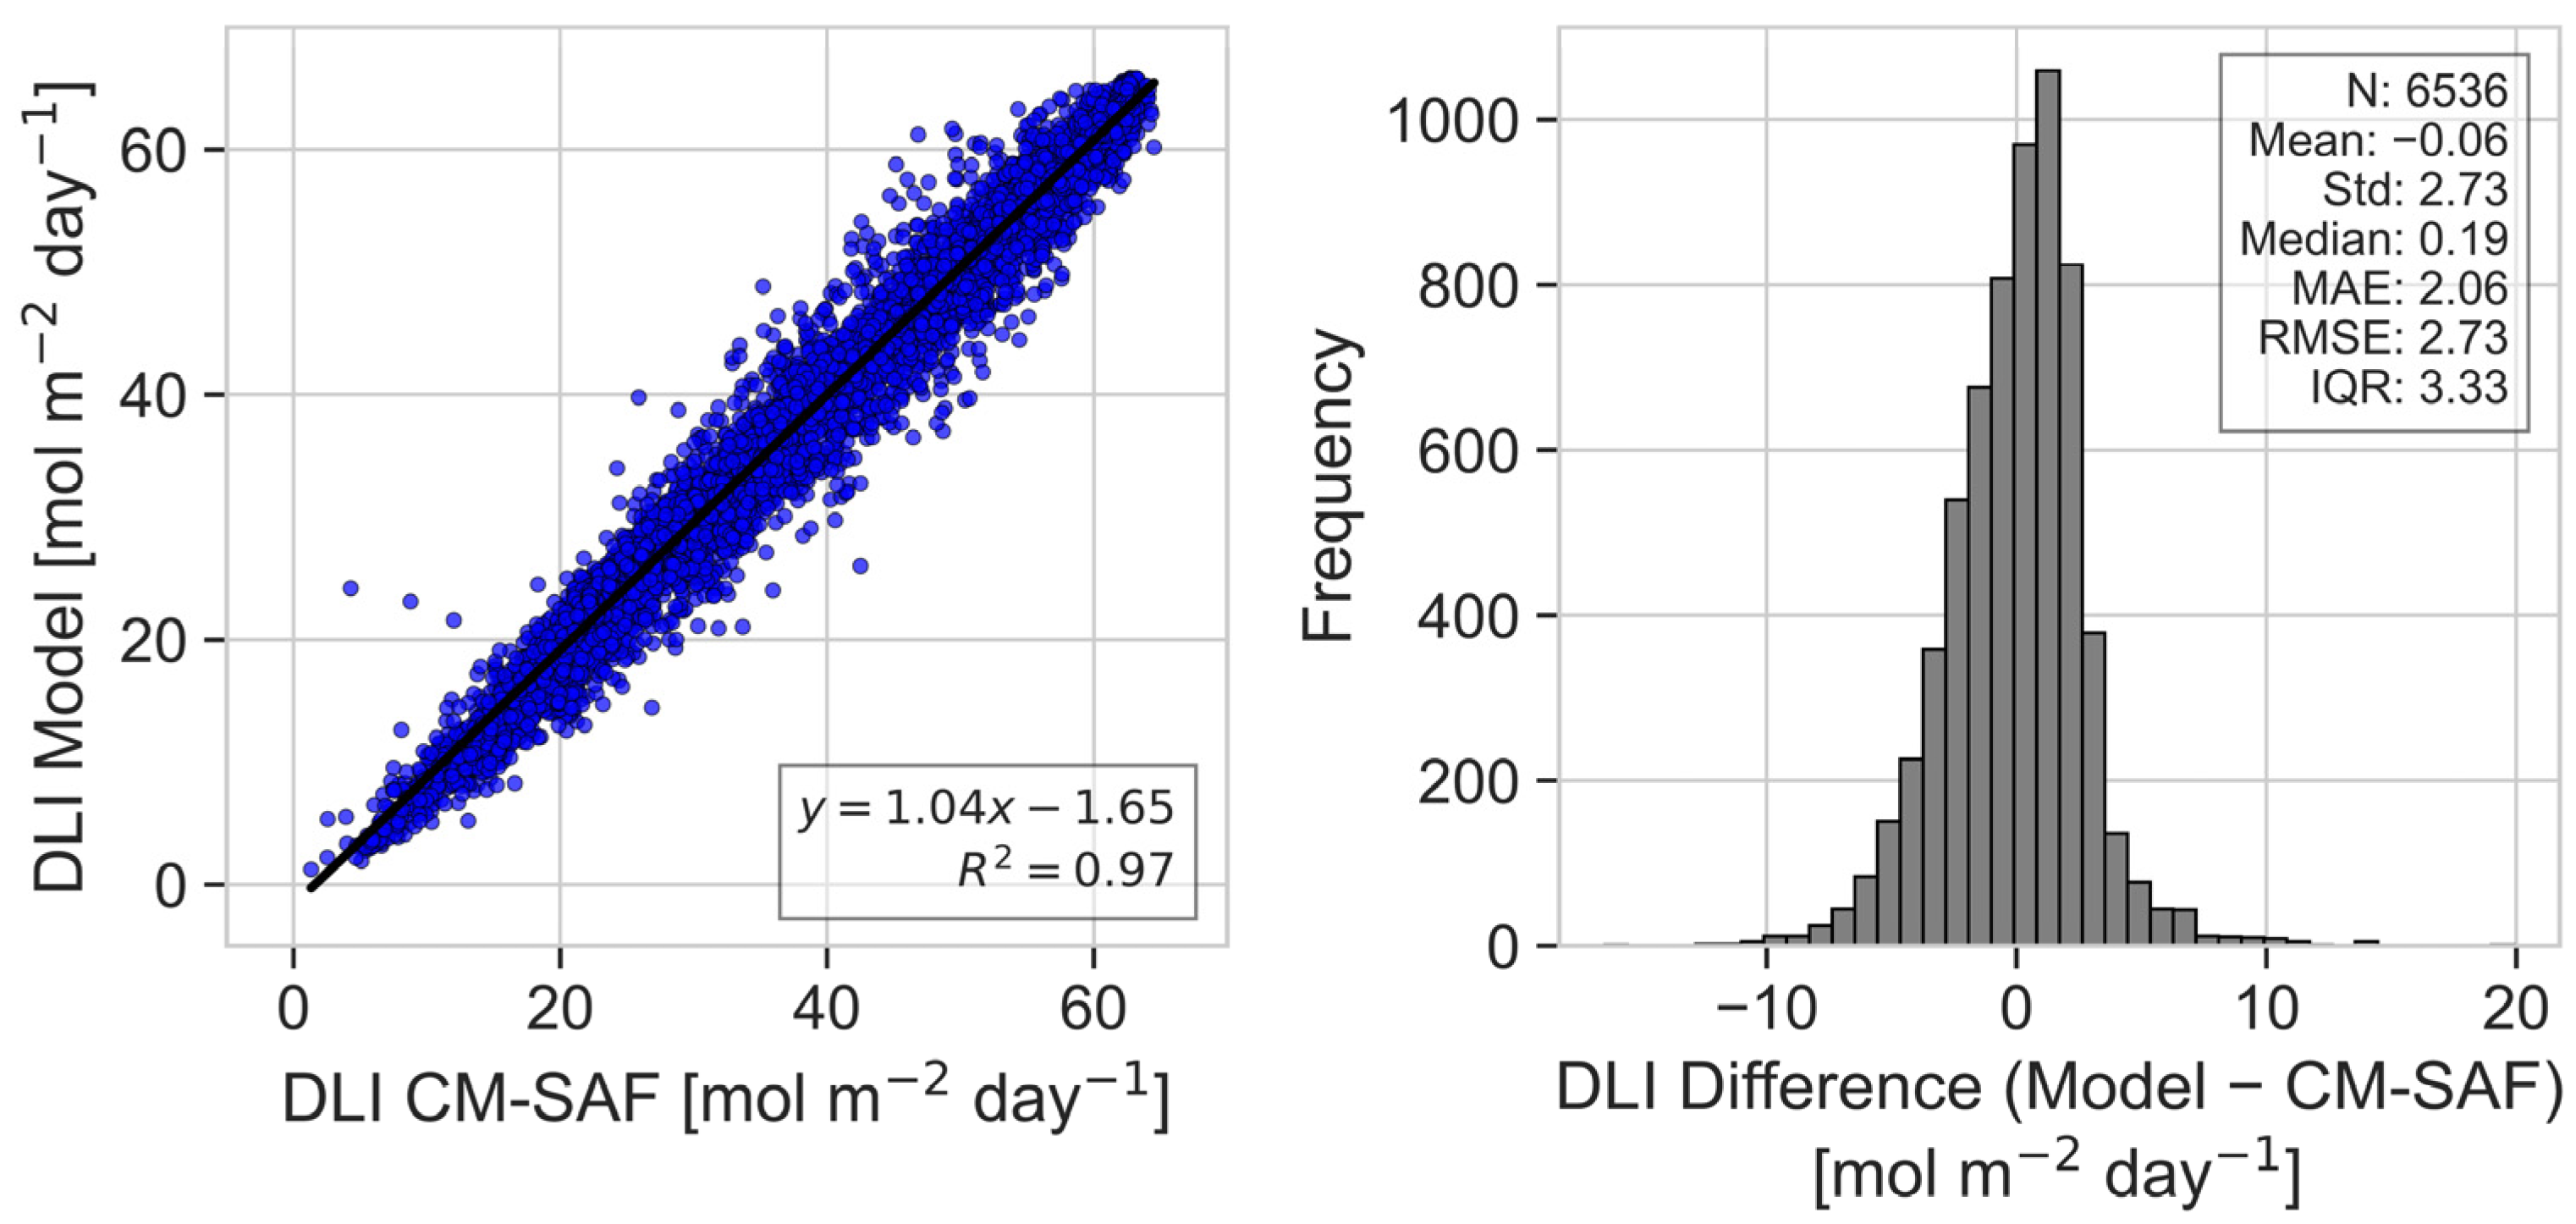
3.1.2. Evaluation of PAR

Figure 3 provides a comparison of the DLI obtained from a model against the DLI from the CM-SAF SARAH-3 dataset. The strong linear relationship in the scatter plot is evidenced by a high coefficient of determination (R2 = 0.97), indicating excellent agreement between the two datasets. The histogram on the right details the distribution of differences between the model’s DLI and CM-SAF’s DLI, centered very close to zero with a mean of −0.06 mol m−2 day−1, suggesting a negligible systematic bias. The spread of the differences, reflected in the standard deviation of 2.73 mol m−2 day−1, and interquartile range (IQR) of 3.33 mol m−2 day−1, indicate the variability in the data comparison.
This comparison demonstrates the model’s robustness in estimating the DLI, capturing the essence of day-to-day variability with a high degree of precision.
Figure 4 presents a side-by-side comparison of the Photosynthetically Active Radiation Cloud Modification Factor (PAR CMF) estimates from the model and the CM-SAF dataset against measured values. The daily PAR CMFs for the model and CM-SAF datasets were calculated from the daily integrals divided with the corresponding clear sky integrals obtained from the model. Figure 4a,b depict scatter plots showing the linear regressions of model-estimated and the CM-SAF PAR CMF against the measured values, with corresponding R2 values of 0.88 and 0.77, respectively, with the model demonstrating a stronger correlation with the measured data. Some outliers are observed in the scatter plots comparing both the model and the CMF-SAF data with ground-based measurements. These outliers are primarily attributed to fundamental discrepancies in spatial resolution and the timing of data acquisition between the different measurement systems. Satellite sensors, such as those utilized by the MSG, capture data at a pixel resolution of 5 × 5 km2. This coarse resolution can lead to significant discrepancies when compared with more localized ground-based measurements, which are continuous and capture detailed fluctuations in cloud cover. Furthermore, the temporal resolution CM-SAF data updates every half hour. In contrast, ground-based measurements are continuous, allowing for a more dynamic reflection of transient and rapidly changing cloud conditions. These timing differences further contribute to the discrepancies observed. Moreover, the impact of these variations is somewhat moderated in the modeled data, as the frequency of cloud coverage updates in our model occurs every 15 min. This higher update frequency allows for closer tracking of the rapid changes in cloud cover, better aligning with the dynamics captured by ground-based measurements. This more frequent updating schedule helps reduce the prevalence of outliers in model vs. ground data comparisons, providing a more accurate reflection of actual atmospheric conditions.
The histograms in Figure 4c,d display the distributions of the differences between the model/CM-SAF estimates and the measured values. Both distributions are centered around zero, with the model having a slight skew towards positive values. However, the model exhibits a tighter distribution with a standard deviation and interquartile range (IQR) of 0.07 compared to the CM-SAF’s 0.08, reflecting slightly higher precision in the model’s estimates. The mean absolute error (MAE) and root-mean-square error (RMSE) further corroborate this, and they lower for the model’s estimates (0.04 and 0.06, respectively) than for CM-SAF’s (0.05 and 0.07, respectively).

3.2. PAR and UV Climatology and Trends
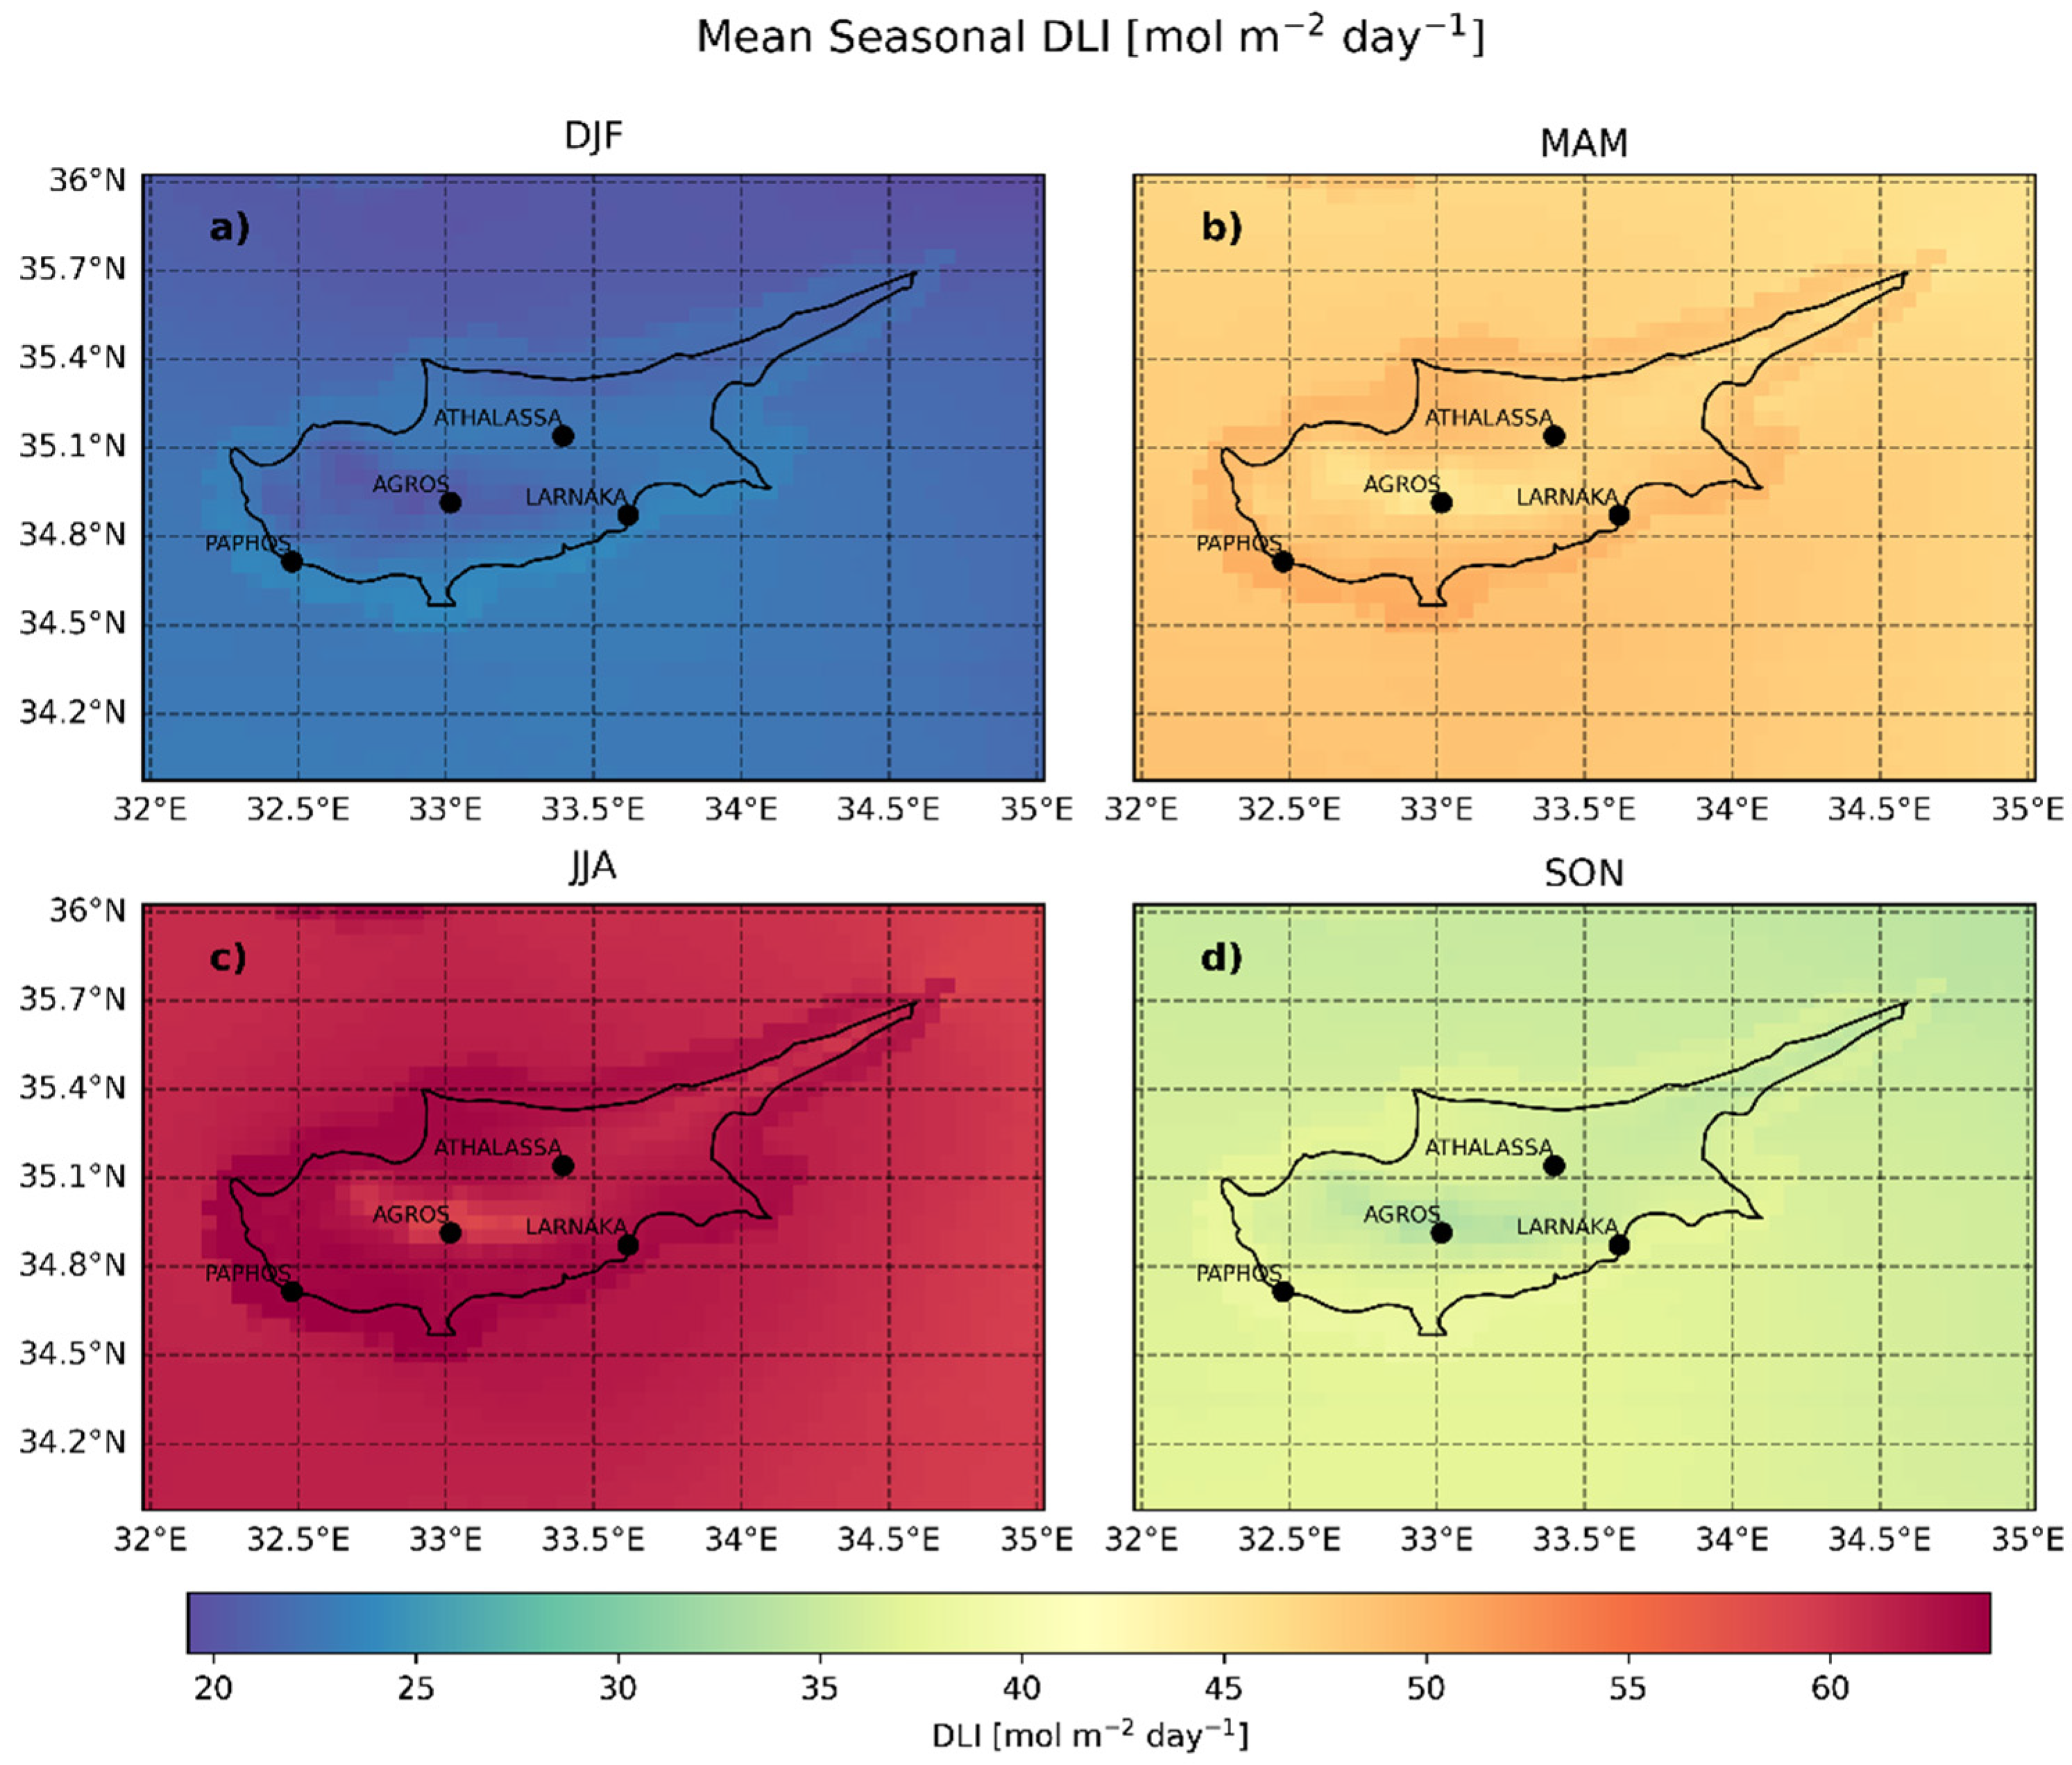
In Section 3.2.1, we delve into the seasonal climatologies and the annual cycles of the DLI and noon UVI, providing a detailed examination of their variations and impacts across different times of the year. This analysis is crucial for understanding the temporal dynamics of solar radiation and its effects on both ecological systems and human health. The comprehensive discussions in this section are complemented by graphical representations, which elucidate the patterns and trends observed in our data. For additional insights into the effects of UV solar radiation, including the dose of vitamin D, DNA damage potential, and plant growth and damage, we have included detailed figures in Appendix B. These figures extend our analysis to encompass a broader spectrum of solar radiation impacts, offering a complete overview of its multifaceted roles.
In Section 3.2.2, we conduct a trend analysis focused on the DLI and noon UVI. Given that the trends observed in the noon UVI are representative of the patterns seen in the other effective UV quantities (vitamin D dose, DNA damage, plant growth, and plant damage), we have chosen to concentrate our discussion on the DLI and UVI.

3.2.1. Climatology

The mean seasonal noon UVI across Cyprus is shown in Appendix B in Figure A1. UVI values are represented through a color-coded scale, indicating intensities from low to high, with blue representing lower values and red representing higher values. As the aggregate mean values across all locations and the entire study period (referred to as “the overall means”) do not allow us to discern any spatial variations, we further analyze these aspects by discussing the relative spatial variations from the overall seasonal mean, as detailed in Table 4. This approach allows for a nuanced examination of how the UVI varies across different regions of Cyprus, highlighting areas with a notably higher or lower UVI compared to the seasonal average.
Figure 5 provides a detailed representation of the relative spatial UVI anomalies across Cyprus, reflecting the deviations from the seasonal mean in percentage terms. The latitudinal pattern observed, with northern areas exhibiting lower UVI values and southern areas higher, aligns with expectations given the variations in solar elevation angle throughout the seasons.
Winter displays the more pronounced latitudinal gradient. During winter, the solar elevation is at its lowest, enhancing the latitudinal effect. This is evidenced by the larger standard deviation of the mean UVI values, which indicates a wider spread in the data. In contrast, during summer, the high solar elevation reduces the latitudinal impact on UVI deviations, coinciding with the least variability in UVI values.
The transitional seasons of spring and autumn provide insightful transitions in UVI variability. During spring, the increasing solar elevation begins to lessen the latitudinal gradient observed in winter, while autumn sees a return to greater variability as the solar elevation decreases. These seasons may also see the influence of changing weather patterns, such as the development or recession of the Mediterranean Sea breeze, which can differentially impact coastal and inland regions.
Apart from the clear latitudinal influence, topographical features play a significant role in shaping UVI distribution. The anomalies over coastal regions show higher values compared to the biggest part of the inland, showing that there are different changes in different regions.
The UVI anomalies are not only a reflection of latitudinal and topographical influences but also of atmospheric conditions such as aerosol load, cloud cover, and ozone concentration. For instance, areas with increased aerosol presence can experience a reduced UVI due to the scattering and absorption of UV radiation. Similarly, local cloudiness conditions, which vary between coastal and inland areas, critically impact the spatial distribution of the UVI. A previous study [54] has highlighted that while the spatial variability of cloud effects on surface solar irradiance is generally modest, it reaches its maximum over the Troodos Mountains and in certain northern coastal regions of the island. Further analysis in the context of this study showed that over the coastal sites, such as Limassol and Larnaka, there is no clear diurnal pattern in cloudiness; particularly, during the summer months, the sky remains cloudless for most of the day (i.e., CMF~1). In contrast, over the mountainous site of Agros, during the summer, clouds that affect the surface solar radiation (SSR) form frequently at noon. During the rest of the year, clouds tend to enhance the SSR stronger in the evening compared to the morning hours. This is possibly due to the formation of orographic clouds over the island’s mountains during the day. The influence of such atmospheric components may help explain some of the spatial variations observed, particularly in areas where the deviations from the mean are not readily explained by latitude or topology alone.
To further examine these factors, we analyze the annual cycle of noon ultraviolet index (UVI) values for three distinct locations within Cyprus, each representing different environmental conditions: Agros (inland, high altitude), Athalassa (inland, middle altitude), and Larnaka (coastal, low altitude). Figure 6 illustrates the mean UVI values over the months alongside the standard deviation, which indicates the variability in these values. From the annual cycle graph, we observe that all three sites follow the typical bell-shaped curve expected with seasonal solar elevation changes. However, the nuances in the data reveal the influence of topography and altitude. Agros, with its high altitude, experiences the most intense UVI, particularly during the months when solar elevation is the highest. This observation confirms the well-established principle that UV radiation increases with altitude due to the thinner atmospheric layer filtering the UV rays.
The standard deviation graph shows a pronounced spike in the spring months across all sites, with the most considerable variability occurring at Agros. This variability can be attributed to transient weather patterns that include fluctuating cloud cover and the intrinsic variability in total ozone concentration during spring. Additionally, spring is characterized by intense dust events originating either from North Africa or the Middle East [84,85], which also contributes to the observed variability. Total ozone column values are also maximum during spring, as this season has the highest day-to-day variability. The higher total ozone values in spring also justify why, for example, the average noon UVI in May is lower than the average noon UVI in August despite the larger SZAs in May. May and the summer months are noteworthy for reaching very high to extreme (10+) UVI values, accentuated at higher altitudes, as seen at the Agros site. Despite the high altitude of Agros providing slightly higher UVI readings, the overall differences among the sites remain minimal. This can be seen in both Figure 5 and Figure 6, suggesting a relative uniformity in UVI exposure across Cyprus. This uniformity across diverse topographical and geographical regions emphasizes the pervasive nature of UV radiation and the importance of sun safety measures regardless of a specific location within the region.
The seasonally averaged daily DLI is shown in Figure A2 in the Appendix A, and the seasonal mean values can be seen in Table 4. Figure 7 presents the relative DLI spatial anomalies from the overall mean for each season. Throughout the year, the DLI is generally lower over higher altitudes relative to lower altitude areas, which can primarily be attributed to the increased cloud attenuation experiences at higher elevations. The spatial variability observed in the DLI is more pronounced relative to the one seen in the UVI, mainly for three reasons: (1) altitudinal effects on UV are more significant compared to visible solar radiation (i.e., UV increases faster with altitude relative to the PAR), (2) clouds have a more substantial impact on PAR than UV radiation, (3) and the DLI is the cumulative measure of PAR over the course of a day, thereby encompassing all variations in cloud cover during daylight hours. In contrast, the UVI is presented around local noon, reflecting cloud presence at that specific time. This is due to the model’s 15 min temporal resolution, which does not always coincide precisely with the exact moment of local noon. As a result, the reported UVI is an approximation, typically captured within a ±15 min window surrounding local noon. This temporal aspect means that the DLI captures a broader scope of cloudiness, whereas the UVI is not sensitive to changes in cloud cover outside of midday. Therefore, the contrasting effects of increased UV levels due to higher altitudes and decreased UV levels due to more frequent cloud cover tend to counterbalance each other for the UVI. Seasonally, the average DLI varies considerably, with values ranging from ~20 mol m−2 day−1 in the winter months to ~60 mol m−2 day−1 during the summer.
Contrary to the UV outcomes, we observe that the DLI is generally lower over Agros, a higher-altitude site, compared to the two lower-altitude locations (Larnaka and Athalassa) (Figure 8). As explained above, this is mainly due to the prevalence of clouds, which have a more pronounced effect on the DLI than the effect of altitude. The DLI at Agros ranges from 20 mol m−2 day−1 in the cloudier months of December and January to ~65 mol m−2 day−1 during the clearer skies of June and July (Figure 8). Notably, Larnaka, which is a coastal city, exhibits the highest DLI values in June, while Agros and Athalassa, being further inland, reach their peak DLIs in July. The coastal influence likely mitigates cloud cover in June at Larnaka, whereas inland areas, like Agros and Athalassa, experience a delayed peak in the DLI due to more significant cloud effects during this period. Despite higher SZAs and longer days in June, it is the reduced cloudiness in July that results in the maximum DLI observed at the inland sites.
The effect of clouds on the monthly average noon UVI (left) and DLI (right) are presented in Figure 9. It demonstrates that during winter, cloud attenuation is more pronounced on the DLI by about 5–10%, with a reduction of 18–30%, compared to a 15–25% reduction in the UVI. Conversely, in summer, the attenuation on both the DLI and UVI is comparable and generally low (less than 10%). This reduced impact in summer is due to the typical clearer skies observed in that period of the year over Cyprus. As expected, the higher altitude location of Agros consistently experiences greater cloud-induced attenuation.

3.2.2. Trends

In this section, we examine the long-term variations in the noon UVI (Figure 10) and DLI (Figure 11), focusing on the changes observed in the factors that influence these quantities such as cloudiness (Figure 12 and Figure 13), AOD (Figure 14), and TOC (Figure 15). This sequence is designed to logically flow from a general discussion of UVI and DLI trends to a more detailed analysis of the specific atmospheric conditions affecting them. We also discuss how these factors differentially impact the noon UVI and DLI, such as how the noon UVI is predominantly influenced by cloud conditions at noon, whereas the DLI is affected by cloudiness throughout the entire day and is less sensitive to changes in TOC.
Figure 10 illustrates the seasonal trends in the noon UVI across Cyprus for the years 2004 to 2023 based on the same modeled dataset that was used for the previous climatological analysis. These trends are primarily influenced by variations in cloud cover, aerosol concentrations, and ozone levels. Analysis of the impact of cloud attenuation on the seasonal noon UVI, detailed in Figure 12, indicates a marginal yet statistically nonsignificant rise in the UVI during most seasons, except for winter (DJF). This increase becomes statistically significant in the summer (JJA) over maritime regions, while changes over terrestrial areas are minimal. It is clear that while cloud cover is influential in determining the overall direction of the noon UVI trends, still they cannot fully explain the UVI trends; thus, changes in AOD and TOC also play substantial roles in the observed variations.
AOD trends, depicted in Figure 14, generally exhibit a downward trend across all seasons, except for autumn (SON), which shows positive trends. Nonetheless, these variations do not achieve statistical significance. On the other hand, Figure 15 reveals significant declines in TOC during winter and spring (MAM), no notable changes in summer, and significant increases in autumn. Winter reveals notable spatial variability in UVI trends, with certain areas, especially in the south and west, showing slight positive trends, in contrast to the negative trends observed in the north and northeast. Despite this spatial diversity, the trends remain statistically insignificant. The transition seasons, spring and autumn, show complex patterns. Spring is characterized by positive, though statistically insignificant, UVI trends, while autumn sees significant negative trends in the north and east of the island. This autumnal decrease is mainly attributed to significant positive TOC trends of 2–3% shown in Figure 15 and the nonsignificant positive trends in AOD depicted in Figure 14. Summer showcases a uniformity in UVI levels, indicating a stable pattern of UV exposure during these months, unaffected significantly by changes in clouds or TOC. In summary, the observed shifts in the UVI throughout the year suggest a nuanced interplay between cloud cover, aerosols, and ozone levels, with each factor contributing differently across seasons and regions. The significant seasonal and spatial variations underscore the importance of considering multiple atmospheric factors when assessing UVI trends.
Figure 11 shows the seasonal trends in the DLI across Cyprus. These trends exhibit some correspondence with UVI patterns, yet they manifest with subtler intensity, underscoring the differential sensitivity of the DLI to atmospheric conditions. Considering that ozone selectively absorbs ultraviolet light with minimal impact on the visible spectrum, the fluctuations in the DLI are primarily governed by cloud cover and aerosols rather than ozone alterations.
In the winter, the DLI exhibits a mosaic of trends, reflecting a nuanced interplay with cloud attenuation patterns (Figure 13) observed alongside UVI trends. The variation in the DLI, especially in the magnitude of change, could be attributed to two principal factors: (a) the negligible influence of ozone on visible light and (b) the comprehensive temporal scope of DLI measurements encompassing the entire daylight period as opposed to the singular midday UVI recordings. This disparity suggests that cloud cover, or its optical properties, may fluctuate differently throughout the day, creating distinct signatures in UVI and DLI datasets.
During spring, DLI trends are influenced by the decline in AOD levels, with cloud cover likely playing a more localized and varied role. The modestly positive DLI trends in the summer across mainland regions, bordering on the neutral, include isolated areas exhibiting minor decreases and suggest stable yet spatially and temporally heterogeneous cloud and aerosol conditions, which introduce slight alterations to the visible light spectrum.
Autumn reveals a complex pattern for the DLI, contrasting with the more uniform and statistically significant negative trends noted in UVI trends for the same season. DLI trends are almost neutral, with pockets of negative trends dispersed across the region. This contrast underscores the distinct influences that atmospheric components exert on the UVI versus DLI. The marginal impact of ozone on the DLI underscores this distinction, positing that while significant increases in ozone can modulate ultraviolet radiation, it does not exert a parallel effect on visible light illuminance.
While this study reveals intricate seasonal dynamics influencing UVI and DLI levels, such as cloud cover, aerosol presence, and TOC, the statistical significance of these factors is not uniformly observed across the seasons. This highlights the complexity of environmental interactions that govern solar ultraviolet and visible radiation reception at the Earth’s surface.

4. Summary and Conclusions

This study has presented a high-temporal (15 min) and -spatial resolution (0.05° × 0.05°) climatology for Cyprus, integrating satellite and reanalysis products into a radiative transfer model to generate agriculture and health-related outputs, like PAR, erythemal UV, vitamin D, DNA damage, plant growth, and damage-effective UV doses, from 2004 to 2023. The new products were found to be consistent with other satellite-based climatological datasets, while ground-based observations have been utilized to further assess the model’s fidelity in capturing daily cloud dynamics. More specifically, the UV-modeled quantities exhibited a strong correlation with TEMIS data for daily erythemal UV doses and the DLI with CMSAF SARAH-3, denoted by correlation coefficients (R2) of 0.96 and 0.97, respectively.
Analyzing the seasonal spatial variability of the UVI, a consistent latitudinal gradient was observed in its distribution across Cyprus, highlighting a stronger influence of solar elevation angles on UVI variability during the winter and autumn seasons. Despite significant seasonal fluctuations driven by solar elevation and atmospheric conditions, differences in the UVI among various topographical regions remained remarkably minimal. This finding suggests a relative uniformity in UVI exposure across the region, reinforcing the importance of universal sun safety measures.
This study further revealed that DLI variability is more pronounced than that of the UVI, primarily due to its cumulative nature and heightened sensitivity to cloud cover throughout the day. A marked decrease in the DLI was noted over higher altitudes, attributed to increased cloud attenuation. This pronounced effect of clouds on the DLI, as opposed to the UVI, calls attention to the distinct roles of atmospheric constituents in modulating different components of solar radiation. However, it is important to clarify that changes in the daily DLI are not directly comparable to changes in the UVI. The UVI specifically refers to conditions at local noon and does not reflect variations in factors that may occur at other times of the day.
This study’s trend analysis elucidated nonsignificant spatial variability in UVI trends during winter and non-uniform trends in other seasons, indicating localized environmental impacts. The presence of significant positive trends in TOC during autumn was noted, which corresponds to a decrease in UVI levels. Increased TOC results in more effective absorption of ultraviolet radiation, thereby reducing the UVI that reaches the surface. In contrast, DLI trends showed more substantial seasonal sensitivity, dictated by the interplay of atmospheric factors, with a particular emphasis on cloud influence.
The findings of this study align well with other recent research examining variability in SSR across the Eastern Mediterranean. Obregon et al. [86] observed a potential increase of approximately 0.2% per decade in GHI over Cyprus from 2000 to 2018, attributing this to a decreasing aerosol load. Alexandri et al. [87] noted an increase in GHI over Greece from 2005 to 2019, which they primarily linked to reductions in aerosol optical depth and liquid cloud fraction. Fountoulakis et al. [54] also reported an overall increase of 2% in GHI over Cyprus for the period 2004–2017, primarily due to changes in cloudiness. These findings corroborate the significant summer increase in the DLI over the sea observed in our study, which we also attribute predominantly to changes in cloudiness. However, in contrast, increased cloudiness over the mountains has led to reduced DLI levels. We were not able to find recent studies (i.e., published in the last 10 years) reporting trends in surface solar UV radiation over Cyprus or the broader Eastern Mediterranean.
Studies reporting on UV trends in Greece and Italy over the last two decades [39,40,41,88] highlight the significant role of changes in aerosols and clouds, as well as the impact of variations in lower stratospheric ozone, which can counterbalance the recovery of the upper stratospheric ozone and occasionally result in decreased ozone over these regions. Unlike the aforementioned studies, which only report significant positive UV trends during certain months of the year, our findings indicate positive UV trends in spring and negative trends in autumn. The latter were mainly attributed to the increasing AOD and TOC.
These findings show the complex interplay between geographic, topographical, and atmospheric factors in shaping solar radiation patterns across Cyprus, addressing our initial research objectives to understand and document how these factors influence key radiative components over time. They highlight the necessity for comprehensive, region-specific assessments of solar radiation for public health advisories and ecological monitoring. Moving forward, this study paves the way for future research to assess the consistency of these patterns over extended periods, factoring in the potential implications of climate change, and to further explore the localized influences of atmospheric dynamics on solar radiation. Additionally, there is a notable opportunity for interdisciplinary studies that explore the impact of changing solar radiation patterns on public health and agricultural productivity in Cyprus. For example, follow-up studies could investigate the relationship between UV exposure and skin cancer rates in different regions of Cyprus or examine how shifts in PAR affect crop yields and plant phenology. These studies could involve collaborations between climatologists, medical researchers, and agricultural scientists, ensuring a holistic approach to understanding and mitigating the impacts of solar radiation changes.

Author Contributions

Conceptualization, K.F., I.F. and S.K.; methodology, K.F., I.F. and K.P.; software, K.F., I.F. and G.C.; validation, K.F., G.C. and I.F.; formal analysis, K.F.; investigation, K.F., I.F.; resources, I.F., K.P., K.F., A.N. and G.C.; data curation, K.F., G.C. and I.F.; writing—original draft preparation, K.F. and I.F.; writing—review and editing, K.F, I.F. and S.K.; visualization, K.F.; supervision, S.K. and D.H.; project administration, S.K.; funding acquisition, D.H. All authors have read and agreed to the published version of the manuscript.

Funding

This research was funded by the “EXCELSIOR”: ERATOSTHENES: Excellence Research Centre for Earth Surveillance and Space-Based Monitoring of the Environment H2020 Widespread Teaming project (www.excelsior2020.eu, accessed on 28 March 2024). The “EXCELSIOR” project has received funding from the European Union’s Horizon 2020 research and innovation program under grant agreement No. 857510 from the Government of the Republic of Cyprus through the Directorate General for the European Programmes, Coordination, and Development and the Cyprus University of Technology.

Data Availability Statement

The climatologies for health-related effective quantities (erythemal UV, DNA damage, and vitamin D production) are accessible on Zenodo: https://doi.org/10.5281/zenodo.10925634 (accessed on 28 March 2024). The agricultural-related quantities (photosynthetically active radiation [PAR], plant growth, and plant damage) are available on Zenodo: https://doi.org/10.5281/zenodo.10925857 (accessed on 28 March 2024). CAMS global reanalysis (EAC4) and CAMS solar radiation data can be accessed through the Copernicus Atmosphere Monitoring Service (CAMS) atmosphere data store: https://ads.atmosphere.copernicus.eu/cdsapp#!/search?type=dataset (accessed on 28 March 2024). The MACv3 aerosol climatology (2022) is available for download at ftp://ftp-projects.zmaw.de/aerocom/climatology/MACv3_2022. OMI Aura Ozone Level 3 data (OMDOAO3e) can be found through the NASA Earthdata Portal: https://search.earthdata.nasa.gov/search?q=OMDOAO3e_003 (accessed on 28 March 2024). The Surface Radiation Data Set–Heliosat (SARAH)–Edition 3 is available through the Satellite Application Facility on Climate Monitoring (CM SAF): https://wui.cmsaf.eu/safira/action/viewProduktSearch (accessed on 28 March 2024). The TEMIS UV index and UV Dose Operational Data Products are hosted on the TEMIS website: https://www.temis.nl/uvradiation/UVarchive/uvncfiles.php (accessed on 28 March 2024). All other files are available upon request from the corresponding author.

Acknowledgments

The authors would like to thank the two anonymous reviewers for their valuable comments and suggestions, which have significantly improved the quality of our manuscript. The authors would like to thank the personnel and technicians of the Department of Meteorology of Cyprus for maintaining the stations and providing the data on global horizontal irradiance. We also express our appreciation to EUMETSAT’s Satellite Application Facility on Climate Monitoring (CM SAF) for the provision of the SARAH-3 photosynthetically active radiation (PAR) data. Our thanks go to the UV index and UV dose team at the Tropospheric Emission Monitoring Internet Service for providing free access to UV data.

Conflicts of Interest

The authors declare no conflict of interest.

Appendix A

The mathematical expressions of the statistical metrics used for the accuracy and reliability of the model are as follows.
  • Mean of the Differences:
    M e a n = i = 1 n m o d e l l e d i x i n
  • Mean Absolute Error (MAE):
    M A E = i = 1 n m o d e l l e d i x i n
  • Root-Mean-Square Error (RMSE):
    R M S E = i = 1 n m o d e l l e d i x i 2 n
  • Interquartile Range (IQR):
    I Q R = Q 3 Q 1
    where Q3 and Q1 are the third and first quartiles, respectively.
  • Standard Deviation of the Differences:
    S T D = i = 1 n m o d e l l e d i x i M e a n 2 n
Here, modelledi represents the values obtained from the model, and xi is the observed values, which could be either satellite estimates or ground-based measurements.

Appendix B

Figure A1. Mean noon UV index over Cyprus during the period 2004–2023 for the (a) winter, (b) spring, (c) summer, and (d) autumn months.
Remotesensing 16 01878 g0a1
Figure A2. Same as A1 for the DLI.
Remotesensing 16 01878 g0a2
Figure A3. Same as A1 for vitamin D doses.
Remotesensing 16 01878 g0a3
Figure A4. Monthly average vitamin D dose for the period 2004–2023 for Agros, Athalassa, and Larnaka (left panel), and the corresponding standard deviation (right panel).
Remotesensing 16 01878 g0a4
Figure A5. Same as A1 for DNA damage.
Remotesensing 16 01878 g0a5
Figure A6. Same as A4 for DNA damage.
Remotesensing 16 01878 g0a6
Figure A7. Same as B1 for plant growth.
Remotesensing 16 01878 g0a7
Figure A8. Same as A4 for plant growth.
Remotesensing 16 01878 g0a8
Figure A9. Same as A1 for plant damage.
Remotesensing 16 01878 g0a9
Figure A10. Same as A4 for plant damage.
Remotesensing 16 01878 g0a10

References

  1. Liou, K.-N. An Introduction to Atmospheric Radiation; Elsevier: Amsterdam, The Netherlands, 2002; Volume 84. [Google Scholar]
  2. McCree, K.J. Photosynthetically Active Radiation. In Physiological Plant Ecology I: Responses to the Physical Environment; Lange, O.L., Nobel, P.S., Osmond, C.B., Ziegler, H., Eds.; Springer: Berlin/Heidelberg, Germany, 1981; pp. 41–55. ISBN 978-3-642-68090-8. [Google Scholar]
  3. McCree, K.J. Test of Current Definitions of Photosynthetically Active Radiation against Leaf Photosynthesis Data. Agric. Meteorol. 1972, 10, 443–453. [Google Scholar] [CrossRef]
  4. Alados, I.; Foyo-Moreno, I.; Alados-Arboledas, L. Photosynthetically Active Radiation: Measurements and Modelling. Agric For. Meteorol. 1996, 78, 121–131. [Google Scholar] [CrossRef]
  5. Fu, F.X.; Tatters, A.O.; Hutchins, D.A. Global Change and the Future of Harmful Algal Blooms in the Ocean. Mar. Ecol. Prog. Ser. 2012, 470, 207–233. [Google Scholar] [CrossRef]
  6. Lesser, M.P.; Farrell, J.H. Exposure to Solar Radiation Increases Damage to Both Host Tissues and Algal Symbionts of Corals during Thermal Stress. Coral Reefs 2004, 23, 367–377. [Google Scholar] [CrossRef]
  7. Chukwujindu Nwokolo, S.; Ogbulezie, J.C.; Umunnakwe Obiwulu, A. Impacts of Climate Change and Meteo-Solar Parameters on Photosynthetically Active Radiation Prediction Using Hybrid Machine Learning with Physics-Based Models. Adv. Space Res. 2022, 70, 3614–3637. [Google Scholar] [CrossRef]
  8. Thomas, C.; Wandji Nyamsi, W.; Arola, A.; Pfeifroth, U.; Trentmann, J.; Dorling, S.; Laguarda, A.; Fischer, M.; Aculinin, A. Smart Approaches for Evaluating Photosynthetically Active Radiation at Various Stations Based on MSG Prime Satellite Imagery. Atmosphere 2023, 14, 1259. [Google Scholar] [CrossRef]
  9. Aguiar, L.J.G.; Fischer, G.R.; Ladle, R.J.; Malhado, A.C.M.; Justino, F.B.; Aguiar, R.G.; da Costa, J.M.N. Modeling the Photosynthetically Active Radiation in South West Amazonia under All Sky Conditions. Theor. Appl. Climatol. 2012, 108, 631–640. [Google Scholar] [CrossRef]
  10. Zempila, M.-M.; Taylor, M.; Bais, A.; Kazadzis, S. Modeling the Relationship between Photosynthetically Active Radiation and Global Horizontal Irradiance Using Singular Spectrum Analysis. J. Quant. Spectrosc. Radiat. Transf. 2016, 182, 240–263. [Google Scholar] [CrossRef]
  11. Sun, Z.; Liang, H.; Liu, J.; Shi, G. Estimation of Photosynthetically Active Radiation Using Solar Radiation in the UV-Visible Spectral Band. Sol. Energy 2017, 153, 611–622. [Google Scholar] [CrossRef]
  12. De Blas, M.; García-Rodríguez, A.; García, I.; Torres, J.L. Validation and Calibration of Models to Estimate Photosynthetically Active Radiation Considering Different Time Scales and Sky Conditions. Adv. Space Res. 2022, 70, 1737–1760. [Google Scholar] [CrossRef]
  13. Brasseur, G.; Simon, P.C. Stratospheric Chemical and Thermal Response to Long-Term Variability in Solar UV Irradiance. J. Geophys. Res. 1981, 86, 7343–7362. [Google Scholar] [CrossRef]
  14. Brasseur, G.; De Rudder, A.; Keating, G.M.; Pitts, M.C. Response of Middle Atmosphere to Short-Term Ultraviolet Variations: 2. Theory. J. Geophys. Res. 1987, 92, 903–914. [Google Scholar] [CrossRef]
  15. Lucas, R.M.; Yazar, S.; Young, A.R.; Norval, M.; De Gruijl, F.R.; Takizawa, Y.; Rhodes, L.E.; Sinclair, C.A.; Neale, R.E. Human Health in Relation to Exposure to Solar Ultraviolet Radiation under Changing Stratospheric Ozone and Climate. Photochem. Photobiol. Sci. 2019, 18, 641–680. [Google Scholar] [CrossRef] [PubMed]
  16. Zerefos, C.; Fountoulakis, I.; Eleftheratos, K.; Kazantzidis, A. Long-Term Variability of Human Health-Related Solar Ultraviolet-B Radiation Doses from the 1980s to the End of the 21st Century. Physiol. Rev. 2023, 103, 1789–1826. [Google Scholar] [CrossRef] [PubMed]
  17. Diffey, B.L. Solar Ultraviolet Radiation Effects on Biological Systems. Phys. Med. Biol. 1991, 36, 299–328. [Google Scholar] [CrossRef] [PubMed]
  18. McKinlay, A.F. Reference action Spectrum for ultraviolet induced erythema in human skin. CIE-J. 1987, 6, 17–22. [Google Scholar]
  19. Setlow, R.B. The Wavelengths in Sunlight Effective in Producing Skin Cancer: A Theoretical Analysis. Proc. Natl. Acad. Sci. USA 1974, 71, 3363–3366. [Google Scholar] [CrossRef] [PubMed]
  20. WHO Health and Environmental Effects of Ultraviolet Radiation. A Scientific Summary of Environmental Health Criteria 160 Ultraviolet Radiation (WHO/EHG/95.16); World Health Organization: Geneva, Switzerland, 1994. [Google Scholar]
  21. Taylor, H.R.; West, S.K.; Rosenthal, F.S.; Muñoz, B.; Newland, H.S.; Abbey, H.; Emmett, E.A. Effect of Ultraviolet Radiation on Cataract Formation. New Engl. J. Med. 1988, 319, 1429–1433. [Google Scholar] [CrossRef] [PubMed]
  22. Jablonski, N.G.; Chaplin, G. The Evolution of Human Skin Coloration. J. Hum. Evol. 2000, 39, 57–106. [Google Scholar] [CrossRef] [PubMed]
  23. Juzeniene, A.; Brekke, P.; Dahlback, A.; Andersson-Engels, S.; Reichrath, J.; Moan, K.; Holick, M.F.; Grant, W.B.; Moan, J. Solar Radiation and Human Health. Rep. Prog. Phys. 2011, 74, 066701. [Google Scholar] [CrossRef]
  24. Holick, M.F. High Prevalence of Vitamin D Inadequacy and Implications for Health. Mayo Clin. Proc. 2006, 81, 353–373. [Google Scholar] [CrossRef] [PubMed]
  25. Juzeniene, A.; Moan, J. Beneficial Effects of UV Radiation Other than via Vitamin D Production. Dermato Endocrinol. 2012, 4, 109–117. [Google Scholar] [CrossRef] [PubMed]
  26. Vanicek, K.; Frei, T. UV-Index for the Public; European Communities: Brussels, Belgium, 2005. [Google Scholar]
  27. CIE. Action Spectrum for the Production of Previtamin D3 in Human Skin; CIE Publication: Vienna, Austria, 2006; Volume 174, ISBN 3-901-906-50-9. [Google Scholar]
  28. Kazantzidis, A.; Bais, A.F.; Zempila, M.M.; Kazadzis, S.; Den Outer, P.N.; Koskela, T.; Slaper, H. Calculations of the Human Vitamin D Exposure from UV Spectral Measurements at Three European Stations. Photochem. Photobiol. Sci. 2009, 8, 45–51. [Google Scholar] [CrossRef] [PubMed]
  29. Webb, A.R.; Kazantzidis, A.; Kift, R.C.; Farrar, M.D.; Wilkinson, J.; Rhodes, L.E. Colour Counts: Sunlight and Skin Type as Drivers of Vitamin D Deficiency at UK Latitudes. Nutrients 2018, 10, 457. [Google Scholar] [CrossRef] [PubMed]
  30. Schreiner, M.; Mewis, I.; Huyskens-Keil, S.; Jansen, M.A.K.; Zrenner, R.; Winkler, J.B.; O’Brien, N.; Krumbein, A. UV-B-Induced Secondary Plant Metabolites—Potential Benefits for Plant and Human Health. CRC Crit Rev Plant Sci 2012, 31, 229–240. [Google Scholar] [CrossRef]
  31. Kataria, S.; Jajoo, A.; Guruprasad, K.N. Impact of Increasing Ultraviolet-B (UV-B) Radiation on Photosynthetic Processes. J. Photochem. Photobiol. B 2014, 137, 55–66. [Google Scholar] [CrossRef] [PubMed]
  32. Frohnmeyer, H.; Staiger, D. Ultraviolet-B Radiation-Mediated Responses in Plants. Balancing Damage and Protection. Plant Physiol. 2003, 133, 1420–1428. [Google Scholar] [CrossRef] [PubMed]
  33. Zerefos, C.S.; Bais, A.F.; Meleti, C.; Ziomas, I.C. A Note on the Recent Increase of Solar UV-B Radiation over Northern Middle Latitudes. Geophys. Res. Lett. 1995, 22, 1245–1247. [Google Scholar] [CrossRef]
  34. Kerr, J.B.; McElroy, C.T. Evidence for Large Upward Trends of Ultraviolet-B Radiation Linked to Ozone Depletion. Science 1993, 262, 1032–1034. [Google Scholar] [CrossRef] [PubMed]
  35. Lubin, D.; Jensen, E.H. Effects of Clouds and Stratospheric Ozone Depletion on Ultraviolet Radiation Trends. Nature 1995, 377, 710–713. [Google Scholar] [CrossRef]
  36. Madronich, S.; McKenzie, R.L.; Björn, L.O.; Caldwell, M.M. Changes in Biologically Active Ultraviolet Radiation Reaching the Earth’s Surface. J. Photochem. Photobiol. B 1998, 46, 5–19. [Google Scholar] [CrossRef]
  37. Madronich, S. Implications of Recent Total Atmospheric Ozone Measurements for Biologically Active Ultraviolet Radiation Reaching the Earth’s Surface. Geophys. Res. Lett. 1992, 19, 37–40. [Google Scholar] [CrossRef]
  38. Godin-Beekmann, S.; Azouz, N.; Sofieva, V.F.; Hubert, D.; Petropavlovskikh, I.; Effertz, P.; Ancellet, G.; Degenstein, D.A.; Zawada, D.; Froidevaux, L.; et al. Updated Trends of the Stratospheric Ozone Vertical Distribution in the 60° S–60° N Latitude Range Based on the LOTUS Regression Model. Atmos. Chem. Phys. 2022, 22, 11657–11673. [Google Scholar] [CrossRef]
  39. Fountoulakis, I.; Diémoz, H.; Siani, A.M.; Di Sarra, A.; Meloni, D.; Sferlazzo, D.M. Variability and Trends in Surface Solar Spectral Ultraviolet Irradiance in Italy: On the Influence of Geopotential Height and Lower-Stratospheric Ozone. Atmos Chem. Phys. 2021, 21, 18689–18705. [Google Scholar] [CrossRef]
  40. Fountoulakis, I.; Bais, A.F.; Fragkos, K.; Meleti, C.; Tourpali, K.; Maria Zempila, M. Short- and Long-Term Variability of Spectral Solar UV Irradiance at Thessaloniki, Greece: Effects of Changes in Aerosols, Total Ozone and Clouds. Atmos. Chem. Phys. 2016, 16, 2493–2505. [Google Scholar] [CrossRef]
  41. Fountoulakis, I.; Diémoz, H.; Siani, A.M.; Laschewski, G.; Filippa, G.; Arola, A.; Bais, A.F.; De Backer, H.; Lakkala, K.; Webb, A.R.; et al. Solar UV Irradiance in a Changing Climate: Trends in Europe and the Significance of Spectral Monitoring in Italy. Environments 2020, 7, 1. [Google Scholar] [CrossRef]
  42. Meleti, C.; Bais, A.F.; Kouremeti, N.; Garane, K.; Kazadzis, S.; Zerefos, C. Factors Affecting Solar Ultraviolet Irradiance Measured since 1990 at Thessaloniki, Greece. Int. J. Remote Sens. 2009, 30, 4167–4179. [Google Scholar] [CrossRef]
  43. Zerefos, C.S.; Tourpali, K.; Eleftheratos, K.; Kazadzis, S.; Meleti, C.; Feister, U.; Koskela, T.; Heikkilä, A. Evidence of a Possible Turning Point in Solar UV-B over Canada, Europe and Japan. Atmos. Chem. Phys. 2012, 12, 2469–2477. [Google Scholar] [CrossRef]
  44. De Bock, V.; De Backer, H.; Van Malderen, R.; Mangold, A.; Delcloo, A. Relations between Erythemal UV Dose, Global Solar Radiation, Total Ozone Column and Aerosol Optical Depth at Uccle, Belgium. Atmos. Chem. Phys. 2014, 14, 12251–12270. [Google Scholar] [CrossRef]
  45. Kambezidis, H.D. The Solar Radiation Climate of Athens: Variations and Tendencies in the Period 1992–2017, the Brightening Era. Sol. Energy 2018, 173, 328–347. [Google Scholar] [CrossRef]
  46. Wild, M.; Wacker, S.; Yang, S.; Sanchez-Lorenzo, A. Evidence for Clear-Sky Dimming and Brightening in Central Europe. Geophys. Res. Lett. 2021, 48, e2020GL092216. [Google Scholar] [CrossRef]
  47. Manara, V.; Bassi, M.; Brunetti, M.; Cagnazzi, B.; Maugeri, M. 1990–2016 Surface Solar Radiation Variability and Trend over the Piedmont Region (Northwest Italy). Theor. Appl. Climatol. 2019, 136, 849–862. [Google Scholar] [CrossRef]
  48. Papachristopoulou, K.; Fountoulakis, I.; Gkikas, A.; Kosmopoulos, P.G.; Nastos, P.T.; Hatzaki, M.; Kazadzis, S. 15-Year Analysis of Direct Effects of Total and Dust Aerosols in Solar Radiation/Energy over the Mediterranean Basin. Remote Sens. 2022, 14, 1535. [Google Scholar] [CrossRef]
  49. Kazadzis, S.; Founda, D.; Psiloglou, B.E.; Kambezidis, H.; Mihalopoulos, N.; Sanchez-Lorenzo, A.; Meleti, C.; Raptis, P.I.; Pierros, F.; Nabat, P. Long-Term Series and Trends in Surface Solar Radiation in Athens, Greece. Atmos. Chem. Phys. 2018, 18, 2395–2411. [Google Scholar] [CrossRef]
  50. Cos, J.; Doblas-Reyes, F.; Jury, M.; Marcos, R.; Bretonnière, P.A.; Samsó, M. The Mediterranean Climate Change Hotspot in the CMIP5 and CMIP6 Projections. Earth Syst. Dyn. 2022, 13, 321–340. [Google Scholar] [CrossRef]
  51. Tuel, A.; Eltahir, E.A.B. Why Is the Mediterranean a Climate Change Hot Spot? J. Clim. 2020, 33, 5829–5843. [Google Scholar] [CrossRef]
  52. Williamson, C.E.; Neale, P.J.; Hylander, S.; Rose, K.C.; Figueroa, F.L.; Robinson, S.A.; Häder, D.P.; Wängberg, S.; Worrest, R.C. The Interactive Effects of Stratospheric Ozone Depletion, UV Radiation, and Climate Change on Aquatic Ecosystems. Photochem. Photobiol. Sci. 2019, 18, 717–746. [Google Scholar] [CrossRef] [PubMed]
  53. Barnes, P.W.; Robson, T.M.; Zepp, R.G.; Bornman, J.F.; Jansen, M.A.K.; Ossola, R.; Wang, Q.W.; Robinson, S.A.; Foereid, B.; Klekociuk, A.R.; et al. Interactive Effects of Changes in UV Radiation and Climate on Terrestrial Ecosystems, Biogeochemical Cycles, and Feedbacks to the Climate System. Photochem. Photobiol. Sci. 2023, 22, 1049–1091. [Google Scholar] [CrossRef] [PubMed]
  54. Fountoulakis, I.; Kosmopoulos, P.; Papachristopoulou, K.; Raptis, I.-P.; Mamouri, R.-E.; Nisantzi, A.; Gkikas, A.; Witthuhn, J.; Bley, S.; Moustaka, A.; et al. Effects of Aerosols and Clouds on the Levels of Surface Solar Radiation and Solar Energy in Cyprus. Remote Sens. 2021, 13, 2319. [Google Scholar] [CrossRef]
  55. Jacovides, C.P.; Tymvios, F.S.; Asimakopoulos, D.N.; Theofilou, K.M.; Pashiardes, S. Global Photosynthetically Active Radiation and Its Relationship with Global Solar Radiation in the Eastern Mediterranean Basin. Theor. Appl. Climatol. 2003, 74, 227–233. [Google Scholar] [CrossRef]
  56. Kalogirou, S.A.; Pashiardis, S.; Pashiardi, A. Statistical Analysis and Inter-Comparison of Erythemal Solar Radiation for Athalassa and Larnaca, Cyprus. Renew Energy 2017, 111, 580–597. [Google Scholar] [CrossRef]
  57. Kalogirou, S.A.; Pashiardis, S.; Pashiardi, A. Statistical Analysis and Inter-Comparison of the Global Solar Radiation at Two Sites in Cyprus. Renew Energy 2017, 101, 1102–1123. [Google Scholar] [CrossRef]
  58. Pashiardis, S.; Kalogirou, S.A.; Pelengaris, A. Statistical Analysis for the Characterization of Solar Energy Utilization and Inter-Comparison of Solar Radiation at Two Sites in Cyprus. Appl. Energy 2017, 190, 1138–1158. [Google Scholar] [CrossRef]
  59. Webb, A.R.; Slaper, H.; Koepke, P.; Schmalwieser, A.W. Know Your Standard: Clarifying the CIE Erythema Action Spectrum. Photochem. Photobiol. 2011, 87, 483–486. [Google Scholar] [CrossRef] [PubMed]
  60. Bernhard, G.; Mayer, B.; Seckmeyer, G.; Moise, A. Measurements of Spectral Solar UV Irradiance in Tropical Australia. J. Geophys. Res. Atmos. 1997, 102, 8719–8730. [Google Scholar] [CrossRef]
  61. Caldwell, M.M. Plant Response to Solar Ultraviolet Radiation. In Physiological Plant Ecology I; Springer: Berlin/Heidelberg, Germany, 1981. [Google Scholar]
  62. Caldwell, M.M. Plant Life and Ultraviolet Radiation: Some Perspective in the History of the Earth’s UV Climate. Bioscience 1979, 29, 520–525. [Google Scholar] [CrossRef]
  63. Emde, C.; Buras-Schnell, R.; Kylling, A.; Mayer, B.; Gasteiger, J.; Hamann, U.; Kylling, J.; Richter, B.; Pause, C.; Dowling, T.; et al. The LibRadtran Software Package for Radiative Transfer Calculations (Version 2.0.1). Geosci. Model Dev. 2016, 9, 1647–1672. [Google Scholar] [CrossRef]
  64. Mayer, B.; Kylling, A. Technical Note: The LibRadtran Software Package for Radiative Transfer Calculations—Description and Examples of Use. Atmos. Chem. Phys. 2005, 5, 1855–1877. [Google Scholar] [CrossRef]
  65. Buras, R.; Dowling, T.; Emde, C. New Secondary-Scattering Correction in DISORT with Increased Efficiency for Forward Scattering. J. Quant. Spectrosc. Radiat. Transf. 2011, 112, 2028–2034. [Google Scholar] [CrossRef]
  66. Gasteiger, J.; Emde, C.; Mayer, B.; Buras, R.; Buehler, S.A.; Lemke, O. Representative Wavelengths Absorption Parameterization Applied to Satellite Channels and Spectral Bands. J. Quant. Spectrosc. Radiat. Transf. 2014, 148, 99–115. [Google Scholar] [CrossRef]
  67. Anderson, G.; Clough, S.A.; Kneizys, F.X.; Chetwynd, J.H.; Shettle, E.P. AFGL (Air Force Geophysical Laboratory) Atmospheric Constituent Profiles (0. 120km); >Environmental Research Papers; AFGL: Glendale, CA, USA, 1986. [Google Scholar]
  68. Kurucz, R.L. Synthetic Infrared Spectra. Symp.-Int. Astron. Union 1994, 154, 523–531. [Google Scholar] [CrossRef]
  69. Pfeifroth, U.; Drücke, J.; Kothe, S.; Trentmann, J.; Schröder, M.; Hollmann, R. SARAH-3—Satellite-based climate data records of surface solar radiation. Earth Systr. Sci. Data Discuss. 2024; in review. [Google Scholar]
  70. Zempila, M.M.; Van Geffen, J.H.G.M.; Taylor, M.; Fountoulakis, I.; Koukouli, M.E.; Van Weele, M.; Van Der, A.R.J.; Bais, A.; Meleti, C.; Balis, D. TEMIS UV Product Validation Using NILU-UV Ground-Based Measurements in Thessaloniki, Greece. Atmos. Chem. Phys. 2017, 17, 7157–7174. [Google Scholar] [CrossRef]
  71. Qu, Z.; Oumbe, A.; Blanc, P.; Espinar, B.; Gesell, G.; Gschwind, B.; Klüser, L.; Lefèvre, M.; Saboret, L.; Schroedter-Homscheidt, M.; et al. Fast Radiative Transfer Parameterisation for Assessing the Surface Solar Irradiance: The Heliosat-4 Method. Meteorol. Z. 2017, 26, 33–57. [Google Scholar] [CrossRef]
  72. Lefèvre, M.; Oumbe, A.; Blanc, P.; Espinar, B.; Gschwind, B.; Qu, Z.; Wald, L.; Schroedter-Homscheidt, M.; Hoyer-Klick, C.; Arola, A.; et al. McClear: A New Model Estimating Downwelling Solar Radiation at Ground Level in Clear-Sky Conditions. Atmos. Meas. Tech. 2013, 6, 2403–2418. [Google Scholar] [CrossRef]
  73. Staiger, H.; Den Outer, P.N.; Bais, A.F.; Feister, U.; Johnsen, B.; Vuilleumier, L. Hourly Resolved Cloud Modification Factors in the Ultraviolet. Atmos. Chem. Phys. 2008, 8, 2493–2508. [Google Scholar] [CrossRef]
  74. Inness, A.; Ades, M.; Agustí-Panareda, A.; Barr, J.; Benedictow, A.; Blechschmidt, A.M.; Jose Dominguez, J.; Engelen, R.; Eskes, H.; Flemming, J.; et al. The CAMS Reanalysis of Atmospheric Composition. Atmos. Chem. Phys. 2019, 19, 3515–3556. [Google Scholar] [CrossRef]
  75. Kinne, S. The MACv2 Aerosol Climatology. Tellus B Chem. Phys. Meteorol. 2019, 71, 1623639. [Google Scholar] [CrossRef]
  76. Veefkind, J.P.; de Haan, J.F.; Brinksma, E.J.; Kroon, M.; Levelt, P.F. Total Ozone from the Ozone Monitoring Instrument (OMI) Using the DOAS Technique. IEEE Trans. Geosci. Remote Sens. 2006, 44, 1239–1244. [Google Scholar] [CrossRef]
  77. McCree, K.J. The Action Spectrum, Absorptance and Quantum Yield of Photosynthesis in Crop Plants. Agric. Meteorol. 1971, 9, 191–216. [Google Scholar] [CrossRef]
  78. Thimijan, R.W.; Heins, R.D. Photometric, Radiometric, and Quantum Light Units of Measure: A Review of Procedures for Interconversion. HortScience 1983, 18, 818–822. [Google Scholar] [CrossRef]
  79. Korczynski, P.C.; Logan, J.; Faust, J.E. Mapping Monthly Distribution of Daily Light Integrals across the Contiguous United States. Horttechnology 2002, 12, 12–16. [Google Scholar] [CrossRef]
  80. Pfeifroth, U.; Kothe, S.; Drücke, J.; Trentmann, J.; Schröder, M.; Selbach, N.; Hollmann, R. Surface Radiation Data Set—Heliosat (SARAH)—Edition 3. Earth Syst. Sci. Data Discuss. 2023; in review. [Google Scholar] [CrossRef]
  81. Mueller, R.; Behrendt, T.; Hammer, A.; Kemper, A. A New Algorithm for the Satellite-Based Retrieval of Solar Surface Irradiance in Spectral Bands. Remote Sens. 2012, 4, 622–647. [Google Scholar] [CrossRef]
  82. Van Geffen, J.; Van Weele, M.; Allaart, M.; Van der, A.R. Dataset: TEMIS UV Index and UV Dose Operational Data Products, Version 2; Royal Netherlands Meteorological Institute: De Bilt, The Netherlands, 2017. [Google Scholar]
  83. Greene, W.H. Econometric Analysis, 7th ed.; Prentice Hall: Hoboken, NJ, USA, 2012; Volume 97. [Google Scholar]
  84. Nisantzi, A.; Mamouri, R.E.; Ansmann, A.; Schuster, G.L.; Hadjimitsis, D.G. Middle East versus Saharan Dust Extinction-to-Backscatter Ratios. Atmos Chem. Phys. 2015, 15, 7071–7084. [Google Scholar] [CrossRef]
  85. Achilleos, S.; Mouzourides, P.; Kalivitis, N.; Katra, I.; Kloog, I.; Kouis, P.; Middleton, N.; Mihalopoulos, N.; Neophytou, M.; Panayiotou, A.; et al. Spatio-Temporal Variability of Desert Dust Storms in Eastern Mediterranean (Crete, Cyprus, Israel) between 2006 and 2017 Using a Uniform Methodology. Sci. Total Environ. 2020, 714, 136693. [Google Scholar] [CrossRef]
  86. Obregón, M.A.; Costa, M.J.; Silva, A.M.; Serrano, A. Spatial and Temporal Variation of Aerosol and Water Vapour Effects on Solar Radiation in the Mediterranean Basin during the Last Two Decades. Remote Sens. 2020, 12, 1316. [Google Scholar] [CrossRef]
  87. Alexandri, G.; Georgoulias, A.K.; Balis, D. Effect of Aerosols, Tropospheric NO2 and Clouds on Surface Solar Radiation over the Eastern Mediterranean (Greece). Remote Sens. 2021, 13, 2587. [Google Scholar] [CrossRef]
  88. Fountoulakis, I.; Zerefos, C.S.; Bais, A.F.; Kapsomenakis, J.; Koukouli, M.E.; Ohkawara, N.; Fioletov, V.; De Backer, H.; Lakkala, K.; Karppinen, T.; et al. Twenty-Five Years of Spectral UV-B Measurements over Canada, Europe and Japan: Trends and Effects from Changes in Ozone, Aerosols, Clouds, and Surface Reflectivity. Comptes Rendus-Geosci. 2018, 350, 393–402. [Google Scholar] [CrossRef]
Figure 1. Scatter plot between the daily erythemal UV doses from the model and TEMIS (left panel) for Athalassa during the period 2004–2023. Distribution of the absolute differences between daily erythemal doses from the model and TEMIS (right panel).
Remotesensing 16 01878 g001
Figure 2. Scatter plot between (a) the daily erythemal UV CMF from the model and the ground-based measurements, (b) the daily erythemal UV CMF from TEMIS and the ground-based measurements. Distribution of the absolute differences between (c) the erythemal UV CMF from the model and measurements and (d) TEMIS and measurements. The comparisons are for Athalassa station and encompass the period 2004–2021.
Remotesensing 16 01878 g002
Figure 3. Scatter plot between the DLI from the model and CM-SAF SARAH-3 (left panel) for Athalassa during 2004–2023. Distribution of the absolute differences between the DLI from the model and CM-SAF SARAH-3 (right panel).
Remotesensing 16 01878 g003
Figure 4. Scatter plot between (a) the daily PAR CMF from the model and the ground-based measurements, (b) the daily PAR CMF from CM-SAF and the ground-based measurements. Distribution of the absolute differences between (c) the PAR CMF from the model and measurements and (d) the CM-SAF and measurements. The comparisons are for Athalassa station and encompass the period 2004–2021.
Remotesensing 16 01878 g004
Figure 5. Relative seasonal noon UVI anomalies over Cyprus for (a) winter, (b) spring, (c) summer and (d) autumn.
Remotesensing 16 01878 g005
Figure 6. Monthly average noon UVI for the period 2004–2023 for Agros, Athalassa, and Larnaka (left panel), and the corresponding standard deviation (right panel).
Remotesensing 16 01878 g006
Figure 7. Relative seasonal DLI anomalies over Cyprus for (a) winter, (b) spring, (c) summer and (d) autumn.
Remotesensing 16 01878 g007
Figure 8. Same as Figure 6 for the monthly average daily DLI.
Remotesensing 16 01878 g008
Figure 9. Monthly average attenuation of the daily average UVI (left) and daily PAR (right) for the period 2004–2023 for Agros, Athalassa, and Larnaka. Shaded areas represent the standard deviation range (1σ).
Remotesensing 16 01878 g009
Figure 10. Trends in the seasonal average noon UVI for the period 2004–2023. Statistically significant trends are marked with an x.
Remotesensing 16 01878 g010
Figure 11. Trends in the seasonal average daily DLI for the period 2004–2023. Statistically significant trends are marked with an x.
Remotesensing 16 01878 g011
Figure 12. Trends in the seasonal noon UVI (in %) due to attenuation by clouds for the period 2004–2023. Statistically significant trends are marked with an x.
Remotesensing 16 01878 g012
Figure 13. Same as Figure 12 but for the DLI.
Remotesensing 16 01878 g013
Figure 14. Trends in the seasonal AOD level for the period 2004–2023. Statistically significant trends are marked with an x.
Remotesensing 16 01878 g014
Figure 15. Trends in the seasonal TOC levels for the period 2004–2023. Statistically significant trends are marked with an x.
Remotesensing 16 01878 g015
Table 1. Range of parameters for which the two LUTs were created.
ParameterRange for UVI, VID, DNA, PLG, PLDRange for PAR
Aerosol Optical Depth (AOD) at 550 nm0–2, step = 0.1 0–2, step = 0.05
Angstrom Exponent (AE)0.4–2, step = 0.40.4–2, step = 0.4
Single-Scattering Albedo (SSA)0.6–1, step = 0.10.6–1, step = 0.1
Solar Zenith Angle (SZA)1°–89°, step = 2°1°–89°, step = 1°
Total Ozone Column (TOC)200–600 DU, step = 10 DU200–500 DU, step = 100 DU
Columnar Water Vapor (TCWV)2 cm0.5–3 cm, step = 0.5 cm
Surface Albedo0.050.2
Table 2. UVSPEC settings for the creation of the LUTs.
ParameterlibRadtran Settings
Number of streams6
Solversdisort [65]
Molecular absorption parameterizationreptran coarse [66]
Atmospheric profileStandard US atmosphere [67]
Extraterrestrial solar spectrumKurucz [68]
Aerosol profileSettle (1990) [69]
Table 3. Parameters utilized for constructing the climatology of radiometric quantities.
ParameterSourceSpatial ResolutionTemporal ResolutionMain Reference
AOD550, AE, TCWVCAMS global reanalysis (EAC4)0.75 × 0.75 degrees3 h[74]
SSAMACv3 aerosol climatology0.4 × 0.4 degreesMonthly[75]
TOCOMI AURA Level 30.25 × 0.25Daily[76]
CMFCAMS solar radiation0.05 × 0.0515 min[71]
Table 4. Overall mean seasonal noon UVI and DLI along with their respective standard deviations.
SeasonMean Noon UVIStandard Deviation of Mean Noon UVIMean DLI (mol m−2 day−1)Standard Deviation of Mean DLI (mol m−2 day−1)
Winter2.60.1821.91.02
Spring7.00.2447.80.98
Summer9.50.2461.41.12
Autumn5.00.2136.10.95
Disclaimer/Publisher’s Note: The statements, opinions and data contained in all publications are solely those of the individual author(s) and contributor(s) and not of MDPI and/or the editor(s). MDPI and/or the editor(s) disclaim responsibility for any injury to people or property resulting from any ideas, methods, instructions or products referred to in the content.

