Article

Measurement Refinements of Ground-Based Radar Interferometry in Bridge Load Test Monitoring: Comprehensive Analysis on a Multi-Span Cable-Stayed Bridge

1
School of Earth Sciences and Engineering, Hohai University, Nanjing 211100, China
2
State Key Laboratory of Geodesy and Earth’s Dynamics, Innovation Academy for Precision Measurement Science and Technology, Chinese Academy of Sciences, Wuhan 430077, China
3
College of Earth and Planet Science, Chengdu University of Technology, Chengdu 610059, China
4
Zhejiang Huadong Mapping and Engineering Safety Technology Co., Ltd., Hangzhou 310014, China
5
University of Chinese Academy of Sciences, Beijing 100049, China
*
Author to whom correspondence should be addressed.
Remote Sens. 2024, 16(11), 1882; https://doi.org/10.3390/rs16111882
Submission received: 13 April 2024 / Revised: 19 May 2024 / Accepted: 21 May 2024 / Published: 24 May 2024

Abstract

:
This paper presents three refinements in ground-based radar interferometer (GB-radar) measurement for bridge load testing: (1) GB-radar phase jumps were detected for the first time on bridge tower displacement monitoring, and a recovery method is presented to obtain the correct unwrapped value; (2) a precise displacement projection method considering target deformation was exploited, and a case study of the Fifth Nanjing Yangtze River Bridge (FNYRB) GB-radar campaign shows that a centimeter-level compensation can be achieved; (3) a post-construction settlement phenomenon was found during the FNYRB static load tests, characterized by 0.31 mm/min, which accumulated up to 25 mm. In addition, the dynamic monitoring capabilities of GB-radar for the bridge tower and girder were verified, highlighting its potential for bridge structural health monitoring (SHM). The insights gained from this study offer valuable recommendations for future GB-radar bridge displacement monitoring.

1. Introduction

The displacement monitoring of a bridge during load tests provides key information for bridge structural response assessment and integrity determination [1,2], while the displacement monitoring of an entire bridge continuously, precisely, and even dynamically is still a challenge for traditional sensors. For example, a set of accelerometers mounted on a bridge can provide bridge vibration information with high reliability [3], while the achieved accuracy significantly decreases with their accumulative numerical errors; in addition, instrument installation and cabling remain problematic [4]. A linear variable differential transformer (LVDT) combines good accuracy with low cost [5], but it requires a stationary platform as a reference datum, which is difficult to locate in an area of a bridge over water. Precision spirit leveling is an established geodetic measurement, but the survey process is time-consuming and labor-intensive; tens of minutes are required to gather an entire bridge’s displacement information [6]. As for total stations and Global Navigation Satellite Systems (GNSSs), prisms or antennas need to be mounted directly on the bridge, and the sampling frequency is relatively low [7,8].
Recently, a non-contact displacement monitoring instrument, named a ground-based radar interferometer (GB-radar), has gained popularity in civil structure monitoring scenarios such as chimneys [9,10], high-rise buildings [11,12], and bridges [13,14]. The instrument features high sampling frequency (e.g., 200 Hz), high measurement accuracy (0.1 mm), and simultaneous multi-point monitoring capability, all independent of weather conditions and sunlight illumination [15,16].
Despite the above-mentioned advantages, the precision of GB-radar is highly dependent on removing signal disturbance and projecting displacement geometrics. The most common cause of disturbances is objects moving through the same radar resolution cell as the target [17], which makes the GB-radar unable to distinguish moving objects from the monitoring target, and eventually causing a phase unwrapping error called a phase jump [18]. To provide correctly unwrapped displacements for analysis, a method to detect and recover phase jumps is proposed and validated using collected GB-radar data.
Another limitation of GB-radar is that it can only measure line-of-sight (LOS) displacements; hence, geometric projection must be applied to convert GB-radar LOS measurements into a structure’s true displacement directions, e.g., a bridge’s vertical or/and horizontal displacements [19]. Existing projection methods [19,20,21] are all based on the original GB-radar monitoring geometry, a fixed geometry where the dynamics of the structure covering the measurement are neglected; hence, the displacements are not optimally estimated, especially in the case of measuring giant structures with large deformation.
In this study, a GB-radar system, named IBIS-S, as used to measure the displacement of the Fifth Nanjing Yangtze River Bridge (FNYRB) throughout its load-testing procedures. The FNYRB is the first lightweight steel–concrete composite cable-stayed bridge in the world, with two spans of 600 m. This paper presents a precise geometric projection considering bridge deformation, and a phase jump detection and recovery method is proposed. Furthermore, several valuable findings are presented through carefully investigating the measured phase information and the dynamic measuring geometry.

2. Materials and Test Setting

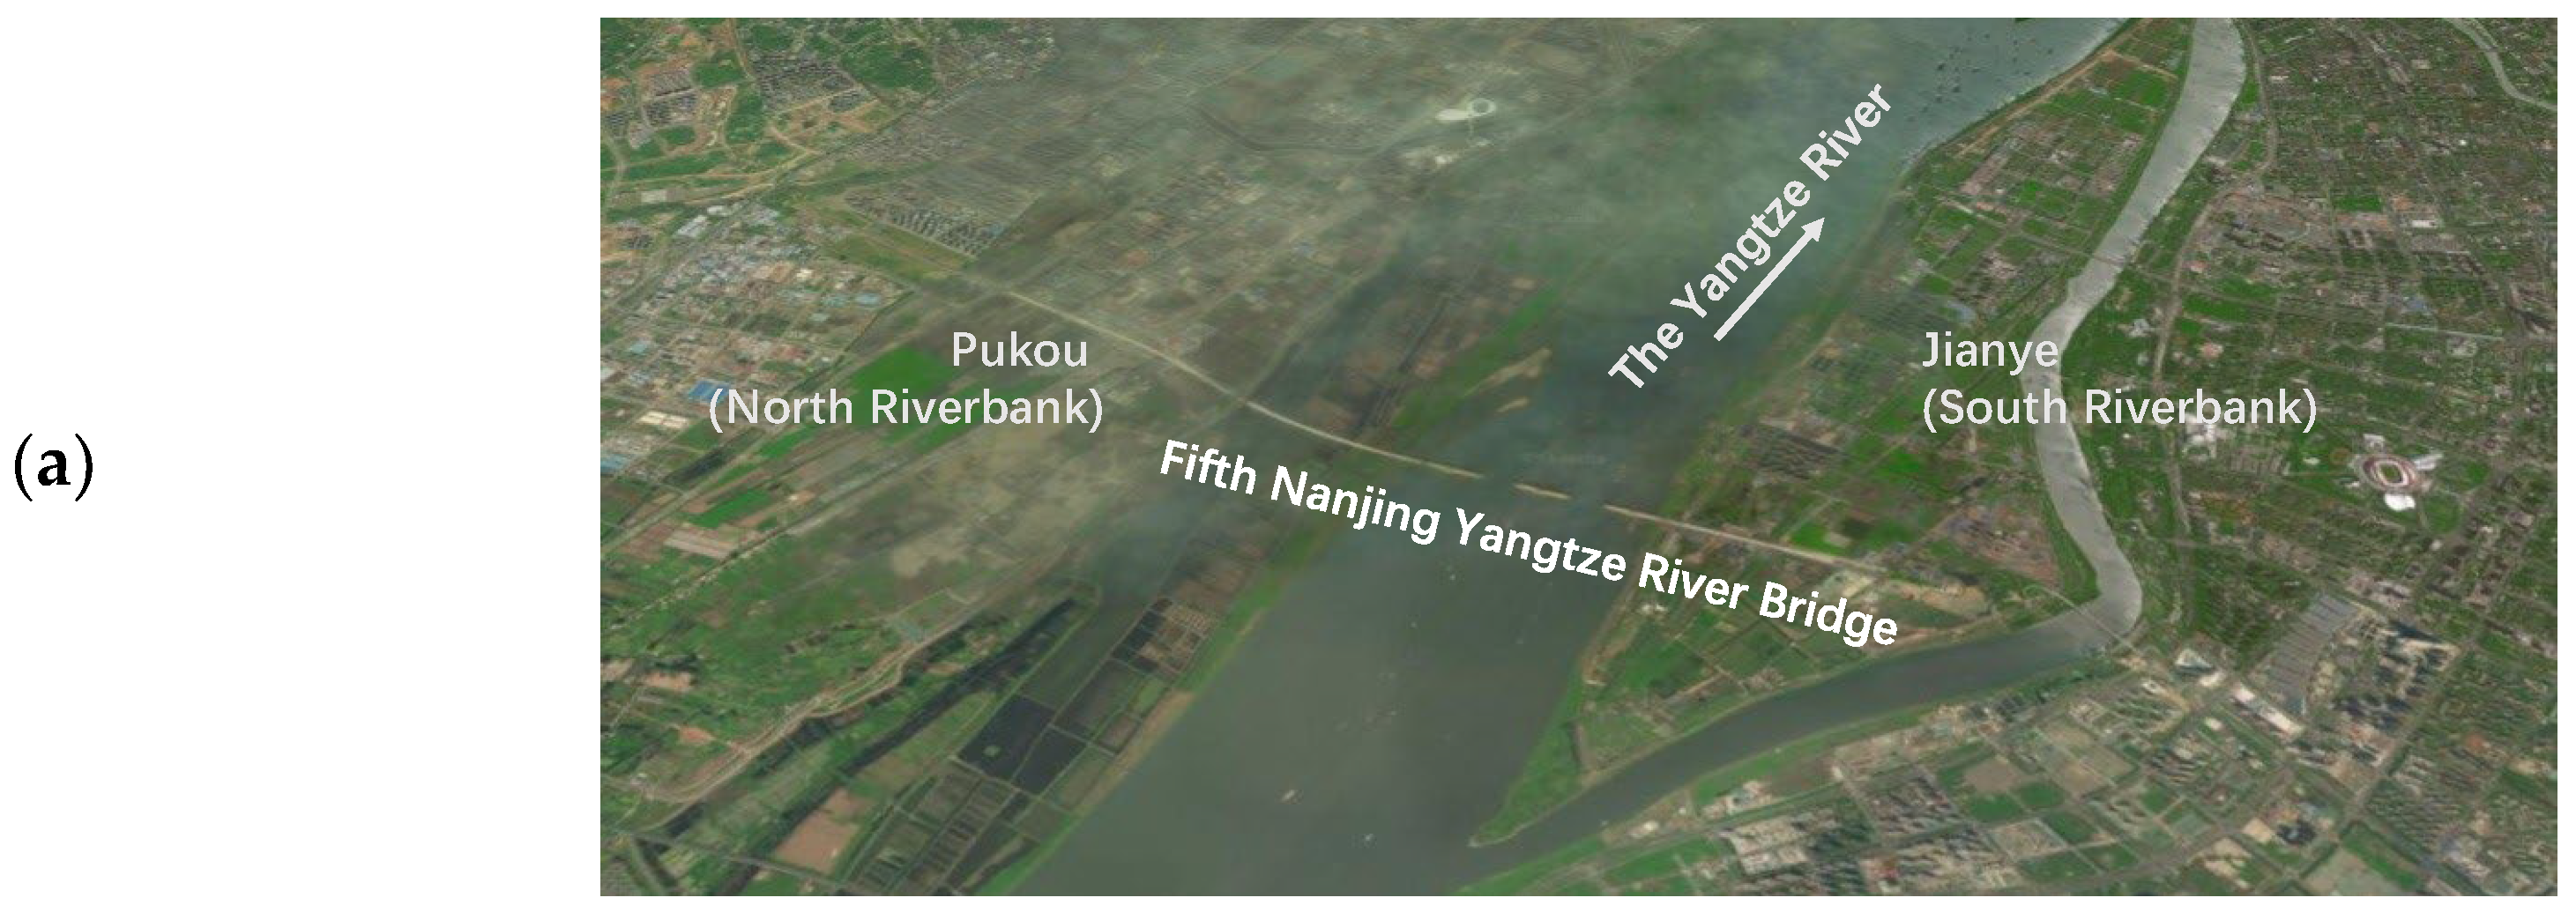
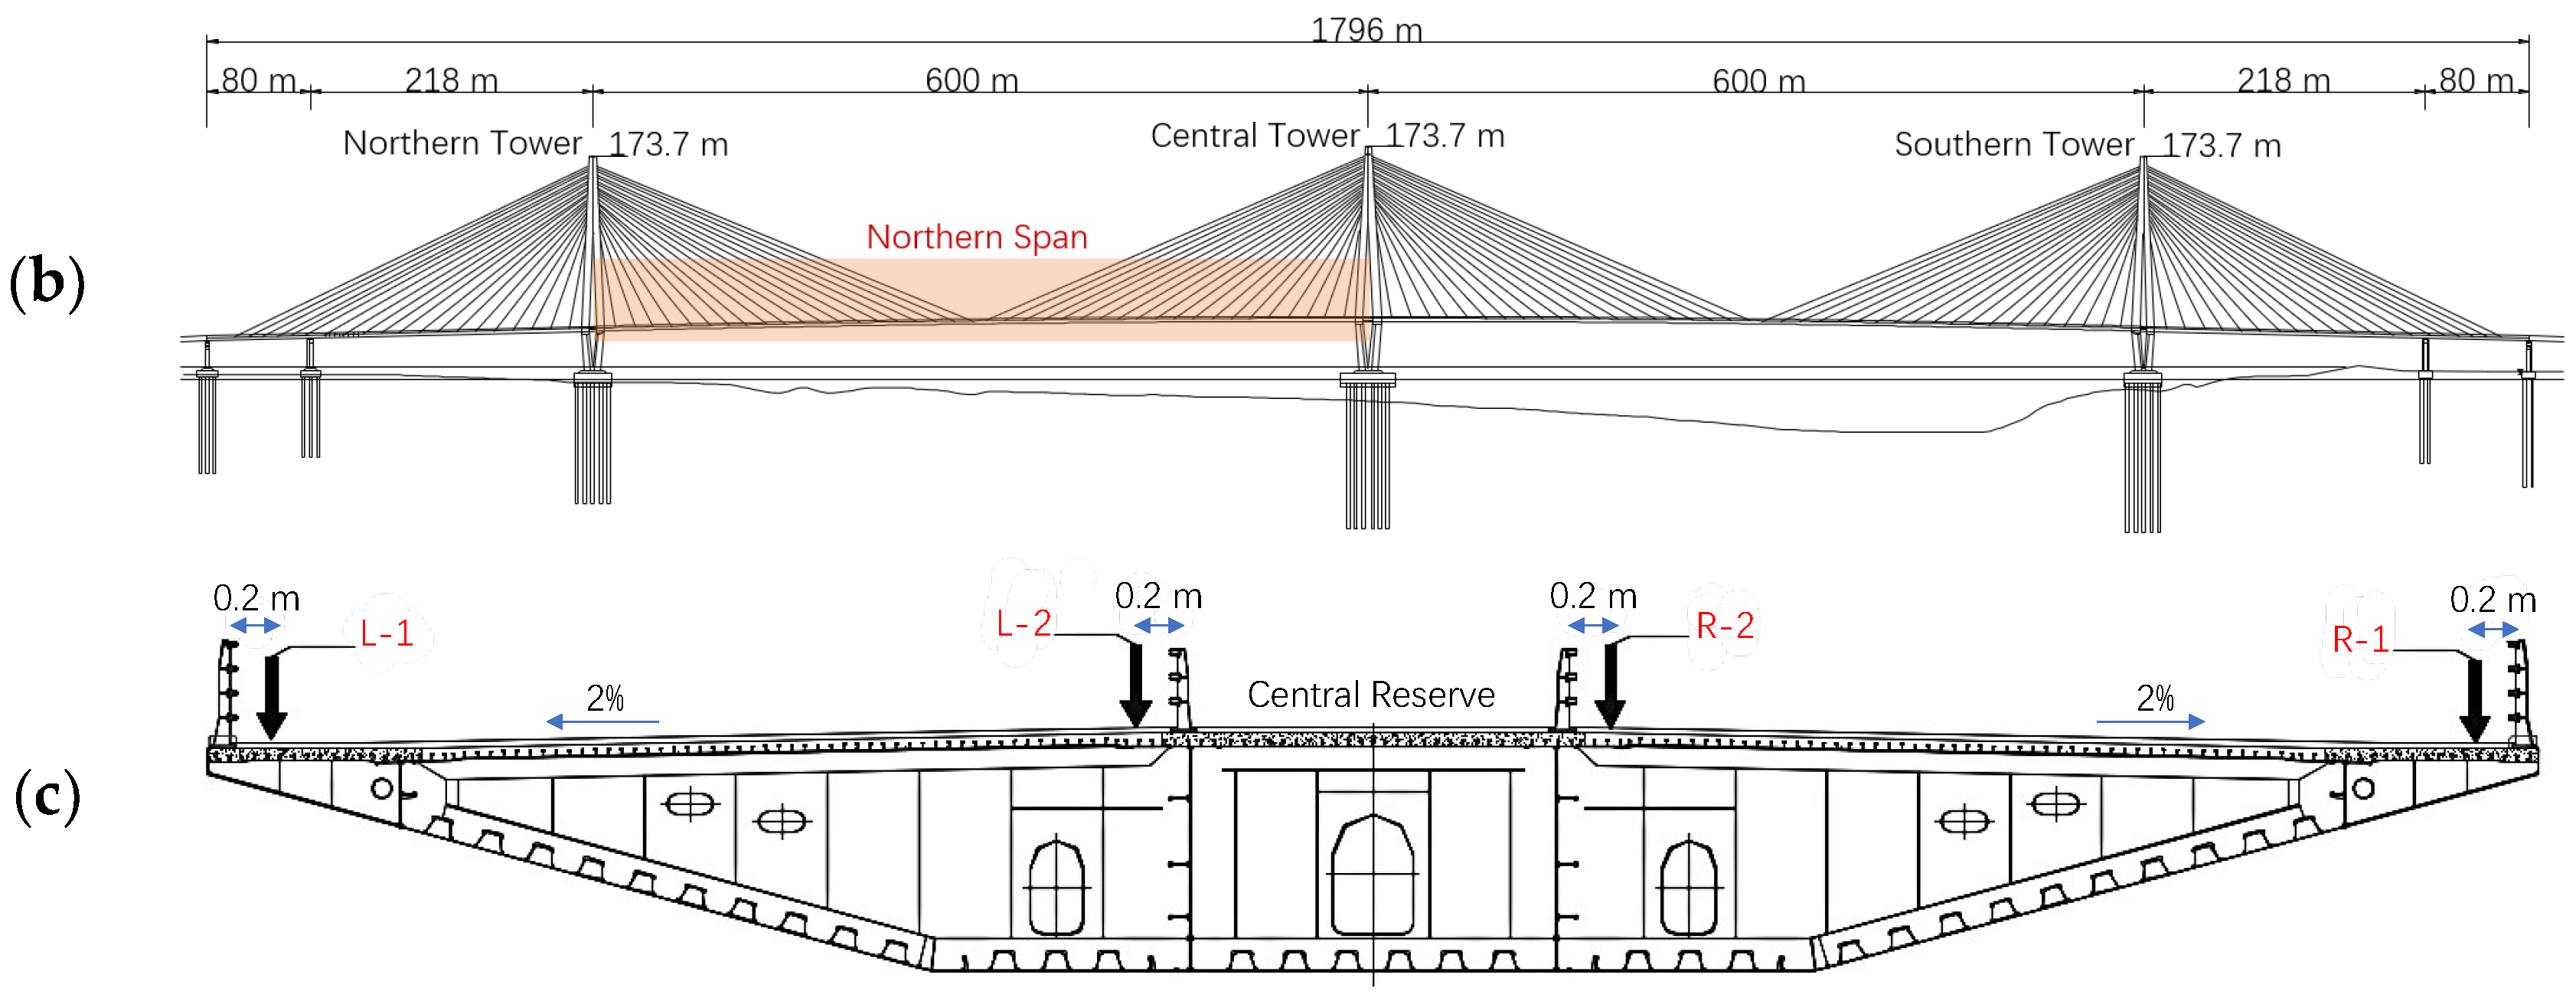
2.1. Bridge Description

The FNYRB is located in Nanjing, a major city in East China. It connects two main sections, Pukou and Jianye, over the Yangtze River, and plays an important role in the city transportation system. The FNYRB is a semi-floating cable-stayed bridge, with a symmetrical span configuration of 80 m + 218 m + 2 × 600 m + 218 m + 80 m = 1796 m [22], it is the first lightweight steel-concrete composite cable-stayed bridge ever built in the world [23]. As shown in Figure 1, the three towers of the FNYRB are located along the central line, and the flat box girders are suspended by cables which are anchored in the central reserve between the roadways [24].

2.2. Load Test Setting

Considering the symmetrical configuration of the bridge, only the northern span was chosen for investigation in GB-radar measurements. A total of 36 trucks with 4 axles were used during the load test. Each truck weighted 400 kN, and the weight distribution on the axles was 1:1:1.6:1.8, a configuration of 74.1 kN + 74.1 kN + 118.5 kN + 133.3 kN to be exact. The wheelbases were 1.85 m, 2.6 m, and 1.35 m from front to rear.

2.2.1. Static Load Test Setting

The static load test started on 2 October 2020 at 10:57:33 PM and concluded on 3 October 2020 at 1:41:27 AM. The testing setting is summarized in Table 1 and the on-deck configuration is illustrated in Figure 2. There were 4 test lanes on the bridge represented with letters A to D from downstream to upstream. A total of 36 trucks were organized in 4 convoys with a configuration of 9 trucks. The convoys were numbered from A1~A9 to D1~D9. During each loading case, convoys drove onto the bridge from Pukou and eventually parked in the middle of the northern span (the weakest section in the structure).

2.2.2. Dynamic Load Test Setting

The dynamic load test was conducted through the night of 4 to 5 October 2020. The test setting is illustrated in Table 2. The dynamic load test was carried out with two situations: with and without obstacles. In the first situation, two trucks were designed to move parallel on the bridge, while in the second section, speed bump-shaped obstacles were placed on the deck to simulate a deteriorating bridge deck (see Figure 3).

3. Methodology

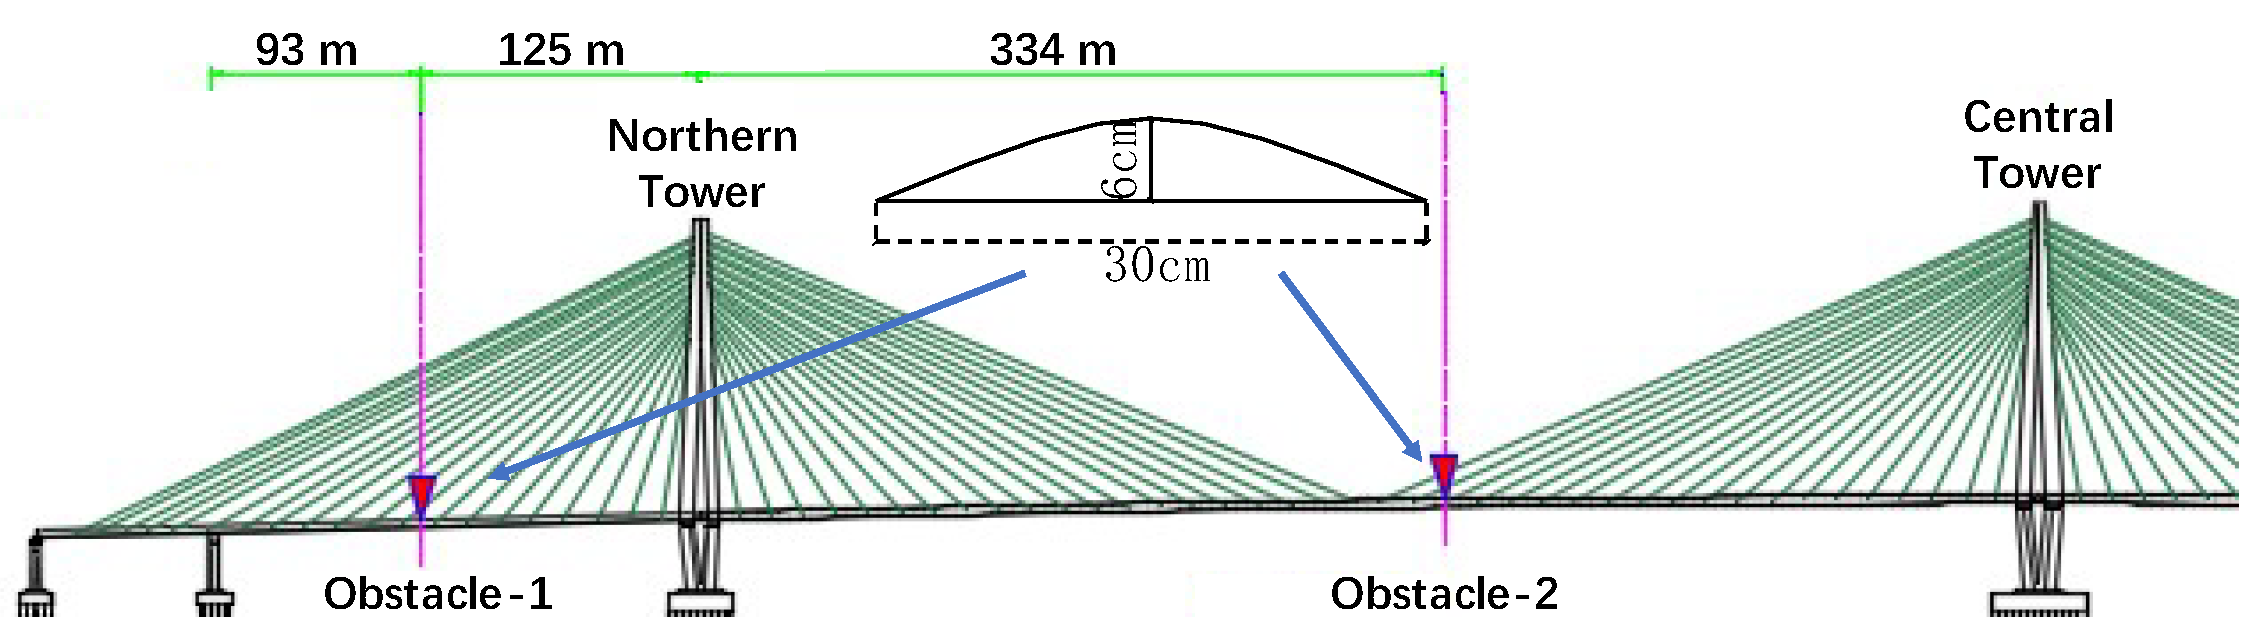
3.1. Ground-Based Radar Interferometry for Displacement Measurement

A radar interferometer can measure the differential phase with a sensitivity that is a small fraction of its wavelength, and sub-millimeter displacements can be measured by radar interferometry [21,25]. One critical aspect of this measurement process is the range resolution δ R [26], which is a key parameter to separate targets along the range direction. The formula for calculating the range resolution is given by
δ R = c 2 B
where Equation (1) defines δ R as the range resolution, B represents the frequency modulation bandwidth, and c stands for the constant speed of light.
To evaluate the quality of the reflected radar signal, one must consider the quality of the detected phase. This quality is quantifiable through the phase standard deviation, denoted as σ r [20], and its relationship with other variables is articulated as
σ r = λ 4 π 1 S N R
where σ r refers to the phase standard deviation, λ is the wavelength of the emitted radar signal, and SNR is the acronym for Signal-to-Noise Ratio, which reflects the balance between the desired signal and the background noise within the system. As the SNR increases, the value of σ r decreases, suggesting that a higher SNR directly correlates with enhanced measurement accuracy.
The hardware composition of the IBIS-S (IDS, Pisa, Italy) GB-radar system is shown in Figure 4a and the basic parameters are listed in Table 3. Figure 4b illustrates the strength of backscattered signals at different range bins.
Since the data collecting is usually carried out in several minutes, the atmospheric phase screen error can be seen as homogeneous along the LOS direction, and it can be ignored in bridge displacement monitoring. In short, the position change d of the target between two acquisitions is derived from the differential phase φ through the following Equation (3) [27].
d = λ 4 π φ

3.2. Phase Jump Detecting and Recovering

GB-radar is capable of measuring the fraction part (− π , + π ) of the phase; hence, when large displacement is measured, phase changes over ± π must be detected and recovered, which is called phase unwrapping in radar interferometry. However, when encountering signal disturbances, rapid changes or discontinuities occur in phase measurements. These disturbed phase data cannot be correctly unwrapped and result in a phenomenon called a phase jump.
To overcome this problem, the median window threshold method [17] is usually undertaken. Nevertheless, the windowing process rigorously compresses the displacements into mean values, thus reducing both temporal resolution and displacement details.
Instead of median windowing the displacement time series, we propose a phase jump detection and recovery method using the raw phase time series (see Figure 5). The phase anomalies are first identified as outliers using the moving mean detection method, for the reason that they induce obvious rapid changes in time series. After the outliers are removed, the vacancies in phase time series are recovered via the Akima interpolation algorithm [28]. Finally, the displacement data are derived via one-dimensional phase unwrapping. When the phase jumps are correctly recovered, a moving average filter can be applied to the displacement time series for smoothing.

3.3. Geometric Projection Considering Bridge Deformation

The traditional geometric projection method assumes that the geometry remains unchanged during the observation. However, for long-span bridge load tests where the maximum deformation is in decimeters or even larger, such a geometry change makes the traditional projection distortion not negligible. Hence, we considered distortion, and an improved method was performed for precise geometric projection. The traditional and precise geometric projection methods are expressed as Equations (4) and (5).
d V = R h · d L O S = csc θ · d L O S
R d L O S 2 h d V 2 = R 2 h 2
where d V and d L O S denote displacements along the vertical and the LOS direction obtained by the GB-radar, respectively. R and h represent LOS and vertical distances between the radar antennas and the target. θ stands for the intersection angle between the centerline of antennas and the horizontal plane. The horizontal displacement can be assumed to be zero for the reason that the displacement investigation is located in the middle of a bridge span. The projection geometries of both methods are illustrated in Figure 6.
The distortion simulation of two methods is illustrated in Figure 7. The simulation was with a geometry setting of 300 m in R and 30 m in h . Note the distortion increases as the LOS displacement increases, and the distortion reaches 165.51 mm at a LOS displacement of 300 mm.

4. Results

4.1. Recovery of Phase Jumps

In Case S6, the GB-radar was set up at the edge of the northern bridge approach and the GB-radar LOS was in line with the bridge’s longitudinal direction to monitor the northern tower. The sampling rate was set to 125 Hz in dynamic mode. As Figure 8 shows, the range bin Rb665 was located the top of the northern tower, and its data were utilized for tower deformation analysis. When the trucks moved through the target range bin, radar signals scattered by the trucks were added to the phase measurement, which finally resulted in phase jumps.
Figure 9 shows the phase disturbance detection using phase outlier removal and recovery using interpolation. Figure 10 presents a comparison of the disturbed and recovered displacement results, and the details show that the proposed method successfully removed the phase jumps as well as other disturbances. The recovered LOS displacement data were then converted into horizontal displacements using precise geometric projection. The result shows that the northern tower eventually deflected by 4.2 mm. Interestingly, the result with the disturbed signal aligns with the refined one after t = 180 s, which is a coincidence because the phase jump sums to zero after the disturbances, which agrees with the configuration that the target loading section is located at the southern span where the middle and southern towers burden most of the test load.

4.2. Static Monitoring

During Case S1 to S5 of the static load test (Table 1), the GB-radar was set to static mode, with a data acquisition interval of 10.83 s and a range resolution of 0.75 m.
As Figure 11 shows, the GB-radar system was set up at the northern construction platform where the radar beam could cover the northern span of the bridge and form an angle with the bridge’s longitudinal direction, in the hope that stronger signal backscatter could be achieved. Trimble Dini03 leveling results were used for validation. Each leveling survey of a loading stage was conducted when the vehicles were in the setting position.
As shown in Figure 12, range bin Rb442 was located in the mid-span (334 m away the northern tower, the structurally weakest point due to the design), and the two high-backscatter-power areas in the range profile contained two steel maintenance vehicles under the bridge deck.
The GB-radar Rb442- and levelling-measured vertical displacement results of the static load test are listed in Table 4. Clear discrepancies among different points’ leveling results can be found in Case S1 and Case S3. This unbalanced situation was caused by the unsymmetrical patterns of the two loading cases in different lanes.
Figure 13a shows a four-stage loading process (Case S1~S4) and an offloading process (Case S5) carried out at Rb442, although there are missing data for Case S1 at the very beginning. Since the radar was placed on the upstream side of the bridge, which means the leveling data of point R-1 are the closest to the GB-radar data, the difference in Table 4 agrees with the observation setting.
The distortion of geometric projections was investigated using the static data of Case S4 (see Figure 13b). With a difference of 10 mm, the traditional geometric projection exaggerated the actual vertical displacements, thus resulting in a larger difference with the leveling result.
The GB-radar displacement of Case S4 also reveals a continuous deformation that lasted for over 50 min and accumulated to 14 mm until the offloading. This extra displacement is too large to ignore and, therefore, needs further discussion.

4.3. Dynamic Monitoring

During the dynamic load test, the GB-radar system was set to dynamic mode, in which the range resolution was 0.5 m. The sampling rate was set to 200 Hz, and the maximum range was set to 200 m. The GB-radar system was placed at the far end of the northern construction platform in order to increase the intersection angle between the radar LOS direction and the bridge alignment (see Figure 14). Since the range bin Rb194 had a significantly high quality of backscattering (SNR ≥ 70 dB), its data were used to analyze the dynamic response.
The dynamic displacement results are presented in Figure 15. The results show that the maximum displacements of Cases D1~D3 (two trucks) had no significant difference (−16.5 mm, −17.2 mm, and −16.8 mm) and the maximum displacement in Case D4 (one truck) was much smaller (−10.3 mm). This is in accordance with the rule that the maximum displacement does not increase with the increase in vehicle velocity [29,30] and that the maximum displacement is determined by the load of the vehicles.
From Figure 16, we can see that the GB-radar measurement succeeded in positioning the on-deck obstacles in Case D5. Excessive accelerations occurred at t = 105 s and 230 s, which correspond to the obstacle positions.

4.4. Ambient Frequencies

Table 5 shows the bridge ambient frequencies achieved using three calculation methods: theoretical calculation via finite element analysis, accelerometer measurement, and GB-radar measurement estimation. GB-radar frequencies were derived via Fast Fourier Transform (FFT). The results show that the GB-radar successfully detected most vertical modes of ambient vibrations, including several lateral modes. This is because the radar LOS direction and the bridge alignment formed a non-neglectable intersection angle, which made the bridge’s lateral displacement measurable. The results also show that the GB-radar frequencies are slightly higher than the theoretical frequencies, indicating that the FNYRB is more rigid than its model of design. There were also several low frequencies estimated by the GB-radar, as shown in Figure 17. This may have been caused by the platform waving, as the platform was built on steel pillars which are disturbed by river waves or the wind.

5. Discussion

5.1. Implications of Continuous Deformation Observations

The assumption of stable displacement during each loading stage in prior research [1,31] was contradicted by our continuous deformation monitoring using GB-radar. Figure 18 details a systematic trend in Cases S2, S3, and S4 (S1 is too short to analyze); the continuous deformation velocities were −0.28 mm/min, −0.26 mm/min, and −0.31 mm/min, respectively.
The necessity for an extended observation time is thus underscored, moving away from prematurely concluding that a stable state has been achieved. This finding calls into question the standard practices and advocates for a dynamic observational approach to accurately capture static loading displacement. Furthermore, it indicates the need for a comprehensive review of the factors influencing continuous displacement, including the influence of bridge design, pier settlement, and the atmospheric phase screen (APS).

5.2. Potential and Limitations of GB-Radar SHM

Research [32,33] has demonstrated the potential for integrating structural health monitoring (SHM) with periodic measurements. The GB-radar system has the potential to function as an alternative for expensive SHM systems thanks to its ability to obtain vibration and displacement data simultaneously and remotely.
While our results support the GB-radar system’s high temporal resolution and easy-to-use setup compared to traditional SHM systems, it is vital to consider its vulnerabilities, such as its sensitivity to APS and limitation to LOS measurements. It is suggested that future assessments of GB-radar SHM are integrated with a broader discourse on the practical constraints and compatibility of GB-radar with existing SHM instruments. The translation of its theoretical potential into practical utility necessitates addressing these limitations, stimulating advancements in the technology and its implementation procedures.

6. Conclusions

In this paper, a GB-radar (IBIS-S) was used in a load test for the displacement monitoring of a multi-span cable-stayed bridge. A comprehensive analysis was carried out on both static and dynamic load tests, and some new findings or improvements for GB-radar bridge load test monitoring are recommended for future researchers.
The presence of extraneous objects within the same range bin as the observation target significantly disturbs GB-radar phase unwrapping; such disturbances should be carefully removed via the proposed phase jump detection and recovery method.
Furthermore, we underscore the necessity for precise geometric projection that accommodates bridge deformation during long-span-bridge load test monitoring. Neglecting this may result in a substantial misjudgment of displacement, potentially exceeding 10 mm.
A continuous displacement phenomenon was found during the FNYRB static load tests of 0.31 mm/min, which accumulated to 25 mm, demonstrating that more time should be used to capture this systematic trend, which may otherwise be disregarded.

Author Contributions

Conceptualization, Q.H.; methodology, Y.C. and Q.H.; investigation, Q.H.; resources, Q.H. and M.Z.; writing—original draft preparation, Y.C.; writing—review and editing, Q.H., T.Z., and L.J.; funding acquisition, Q.H. and L.J. All authors have read and agreed to the published version of the manuscript.

Funding

This work was supported by the National Natural Science Foundation of China under Grant No. 42274038 and by the Key Program of the National Natural Science Foundation of Hubei province under Grant No. 2021CFA028.

Data Availability Statement

Restrictions apply to the availability of these data.

Conflicts of Interest

The authors declare no conflicts of interest.

References

  1. Cai, H.; Abudayyeh, O.; Abdel-Qader, I.; Attanayake, U.; Barbera, J.; Almaita, E. Bridge Deck Load Testing Using Sensors and Optical Survey Equipment. Adv. Civ. Eng. 2012, 2012, 493983. [Google Scholar] [CrossRef]
  2. Lantsoght, E.O.L.; Veen, C.v.d.; Boer, A.d.; Hordijk, D.A. State-of-the-art on load testing of concrete bridges. Eng. Struct. 2017, 150, 231–241. [Google Scholar] [CrossRef]
  3. Sabato, A.; Niezrecki, C.; Fortino, G. Wireless MEMS-Based Accelerometer Sensor Boards for Structural Vibration Monitoring: A Review. IEEE Sens. J. 2017, 17, 226–235. [Google Scholar] [CrossRef]
  4. Fukuda, Y.; Feng, M.Q.; Narita, Y.; Kaneko, S.i.; Tanaka, T. Vision-Based Displacement Sensor for Monitoring Dynamic Response Using Robust Object Search Algorithm. IEEE Sens. J. 2013, 13, 4725–4732. [Google Scholar] [CrossRef]
  5. Drumea, A.; Vasile, A.; Comes, M.; Blejan, M. System on Chip Signal Conditioner for LVDT Sensors. In Proceedings of the 2006 1st Electronic Systemintegration Technology Conference, Dresden, Germany, 5–7 September 2006; pp. 629–634. [Google Scholar]
  6. Colesanti, C.; Ferretti, A.; Prati, C.; Rocca, F. Comparing GPS, optical leveling and permanent scatterers. In Proceedings of the IGARSS 2001. Scanning the Present and Resolving the Future. Proceedings. IEEE 2001 International Geoscience and Remote Sensing Symposium (Cat. No.01CH37217), Sydney, NSW, Australia, 9–13 July 2001; Volume 2626, pp. 2622–2624. [Google Scholar]
  7. Ribeiro, D.; Calçada, R.; Ferreira, J.; Martins, T. Non-contact measurement of the dynamic displacement of railway bridges using an advanced video-based system. Eng. Struct. 2014, 75, 164–180. [Google Scholar] [CrossRef]
  8. Shen, N.; Wang, B.; Gao, G.; Chen, L.; Chen, R. 3-D Displacement Detection Based on Enhanced Clustering From GNSS Positioning in a Kinematic Mode for Deformation Monitoring. IEEE Trans. Instrum. Meas. 2023, 72, 6500810. [Google Scholar] [CrossRef]
  9. Rödelsperger, S.; Läufer, G.; Gerstenecker, C.; Becker, M. Monitoring of displacements with ground-based microwave interferometry: IBIS-S and IBIS-L. J. Appl. Geod. 2010, 4, 41–54. [Google Scholar] [CrossRef]
  10. Gikas, V. Ambient vibration monitoring of slender structures by microwave interferometer remote sensing. J. Appl. Geod. 2012, 6, 167–176. [Google Scholar] [CrossRef]
  11. Sofi, M.; Lumantarna, E.; Zhong, A.; Mendis, P.A.; Duffield, C.; Barnes, R. Determining dynamic characteristics of high rise buildings using interferometric radar system. Eng. Struct. 2018, 164, 230–242. [Google Scholar] [CrossRef]
  12. Zhou, L.; Guo, J.; Wen, X.; Ma, J.; Yang, F.; Wang, C.; Zhang, D. Monitoring and Analysis of Dynamic Characteristics of Super High-rise Buildings using GB-RAR: A Case Study of the WGC under Construction, China. Appl. Sci. 2020, 10, 808. [Google Scholar] [CrossRef]
  13. Farrar, C.R.; Darling, T.W.; Migliori, A.; Baker, W.E. Microwave interferometers for non-contact vibration measurements on large structures. Mech. Syst. Signal Process. 1999, 13, 241–253. [Google Scholar] [CrossRef]
  14. Pramudita, A.A.; Lin, D.B.; Dhiyani, A.A.; Ryanu, H.H.; Adiprabowo, T.; Yudha, E.A. FMCW Radar for Noncontact Bridge Structure Displacement Estimation. IEEE Trans. Instrum. Meas. 2023, 72, 8504914. [Google Scholar] [CrossRef]
  15. Strozzi, T.; Werner, C.; Wiesmann, A.; Wegmuller, U. Topography Mapping with a Portable Real-Aperture Radar Interferometer. IEEE Geosci. Remote Sens. Lett. 2012, 9, 277–281. [Google Scholar] [CrossRef]
  16. Jiang, L. Ground-Based Radar. In International Encyclopedia of Geography: People, the Earth, Environment and Technology; Wiley-Blackwell: Hoboken, NJ, USA, 2017; pp. 1–4. [Google Scholar]
  17. Michel, C.; Keller, S. Advancing Ground-Based Radar Processing for Bridge Infrastructure Monitoring. Sensors 2021, 21, 2172. [Google Scholar] [CrossRef] [PubMed]
  18. Felguera-Martín, D.; González-Partida, J.-T.; Almorox-González, P.; Burgos-García, M.; Dorta-Naranjo, B.-P. Interferometric inverse synthetic aperture radar experiment using an interferometric linear frequency modulated continuous wave millimetre-wave radar. IET Radar Sonar Navig. 2011, 5, 39–47. [Google Scholar] [CrossRef]
  19. Pieraccini, M.; Fratini, M.; Parrini, F.; Atzeni, C. Dynamic Monitoring of Bridges Using a High-Speed Coherent Radar. IEEE Trans. Geosci. Remote Sens. 2006, 44, 3284–3288. [Google Scholar] [CrossRef]
  20. Coppi, F.; Gentile, C.; Paolo Ricci, P.; Tomasini, E.P. A Software Tool for Processing the Displacement Time Series Extracted from Raw Radar Data. AIP Conf. Proc. 2010, 1253, 190–201. [Google Scholar] [CrossRef]
  21. Huang, Q.; Wang, Y.; Luzi, G.; Crosetto, M.; Monserrat, O.; Jiang, J.; Zhao, H.; Ding, Y. Ground-Based Radar Interferometry for Monitoring the Dynamic Performance of a Multitrack Steel Truss High-Speed Railway Bridge. Remote Sens. 2020, 12, 2594. [Google Scholar] [CrossRef]
  22. Lyu, L.; Cui, B.; Zhong, H.; Gu, Y.; Guo, Z. Study on Nonlinear Stability of Structure for Main Bridge of Fifth Changjiang River Bridge in Nanjing. Bridge Constr. 2019, 49, 40–45. [Google Scholar]
  23. New Bridge over Yangtze Opens to Traffic in East China. Xinhua 2020. Available online: http://www.xinhuanet.com/english/2020-12/24/c_139616135.htm (accessed on 21 April 2023).
  24. Jian, B.; Li, M.; Li, M.; Su, Y. Influence of wind yaw angle and pylon interference on the buffeting responses of cable-stayed bridges during construction. Struct. Infrastruct. Eng. 2021, 18, 1350–1364. [Google Scholar] [CrossRef]
  25. Kampes, B.M. Radar Interferometry; Springer Dordrecht: Dordrecht, The Netherlands, 2006. [Google Scholar]
  26. Gentile, C.; Bernardini, G. Radar-based measurement of deflections on bridges and large structures. Eur. J. Environ. Civ. Eng. 2010, 14, 495–516. [Google Scholar] [CrossRef]
  27. Moreira, A.; Prats-Iraola, P.; Younis, M.; Krieger, G.; Hajnsek, I.; Papathanassiou, K.P. A tutorial on synthetic aperture radar. IEEE Geosci. Remote Sens. Mag. 2013, 1, 6–43. [Google Scholar] [CrossRef]
  28. Akima, H. A New Method of Interpolation and Smooth Curve Fitting Based on Local Procedures. J. ACM 1970, 17, 589–602. [Google Scholar] [CrossRef]
  29. Senne, J.H.; Smith, T.K. Dynamics of Highway Bridges; HR-67; Iowa Engineering Experiment Station: Ames, IA, USA, 1961. [Google Scholar]
  30. Swannell, P.; Miller, C. Theoretical and experimental studies of a bridge-vehicle system. Proc. Inst. Civ. Eng. 1987, 83, 613–635. [Google Scholar] [CrossRef]
  31. Zhang, G.; Wu, Y.; Zhao, W.; Zhang, J. Radar-based multipoint displacement measurements of a 1200-m-long suspension bridge. ISPRS J. Photogramm. Remote Sens. 2020, 167, 71–84. [Google Scholar] [CrossRef]
  32. Sanayei, M.; Phelps, J.E.; Sipple, J.D.; Bell, E.S.; Brenner, B.R. Instrumentation, nondestructive testing, and finite-element model updating for bridge evaluation using strain measurements. J. Bridge Eng. 2012, 17, 130–138. [Google Scholar] [CrossRef]
  33. Li, J.; He, H.; He, H.; Li, L.; Xiang, Y. An End-to-End Framework With Multisource Monitoring Data for Bridge Health Anomaly Identification. IEEE Trans. Instrum. Meas. 2021, 70, 99. [Google Scholar] [CrossRef]
Figure 1. (a) Aerial view of the FNYRB; (b) general layout of FNYRB; (c) cross-section of the girder at the middle of the northern span. L-1, L-2, R-2, and R-1 are leveling measurement points.
Remotesensing 16 01882 g001aRemotesensing 16 01882 g001b
Figure 2. Loading configuration on deck. The deck has 4 lanes: A, B, C, and D. Four truck convoys parking in lanes are labeled with numbers ranging from A1 to D9. The 4 blue squares represent 4 leveling measurement points located in the middle of the northern span.
Remotesensing 16 01882 g002
Figure 3. Dimensions and layout of the obstacles in Case D4.
Remotesensing 16 01882 g003
Figure 4. (a) Components of IBIS-S GB-radar system; (b) GB-radar target range measuring.
Remotesensing 16 01882 g004
Figure 5. Flowchart of the proposed phase jump detection and recovery method.
Remotesensing 16 01882 g005
Figure 6. Projection geometry of (a) traditional and (b) precise geometric projection.
Remotesensing 16 01882 g006
Figure 7. Projection distortion simulation: (a) geometry setting and (b) results.
Remotesensing 16 01882 g007
Figure 8. GB-radar setup and range profile during Case S6. Range bin Rb665 was selected for tower deformation analysis. Please note the truck approaching northern tower: A strong signal disturbance occurred when it passed Rb665.
Remotesensing 16 01882 g008
Figure 9. Disturbance detection and recovery using phase outlier removal and interpolation. The passages of 7 trucks are depicted below, and they correspond to the detected phase discontinuities.
Remotesensing 16 01882 g009
Figure 10. A comparison between the disturbed and recovered displacement results.
Remotesensing 16 01882 g010
Figure 11. (a) Layout of the GB-radar; (b) GB-radar layout parameters; (c) photograph of GB-radar measurement, with two maintenance vehicles in sight; and (d) leveling during Cases S1~S5.
Remotesensing 16 01882 g011
Figure 12. Range profile of the static load test and the range bin selected for analyzing during Cases S1~S5.
Remotesensing 16 01882 g012
Figure 13. Results of the static load test: (a) displacement results and (b) a comparison of the results from traditional and precise geometric projections for Case S4. A continuous deformation can be seen in Case S4.
Remotesensing 16 01882 g013
Figure 14. (a) Layout of the GB-radar on the northern construction platform; (b) range profile of the dynamic load test.
Remotesensing 16 01882 g014
Figure 15. Dynamic displacement results of (a) Cases D1, (b) Cases D2, (c) Cases D3, and (d) Cases D4. The orange line and the green line indicate the trucks passing through the central tower and the northern tower, respectively.
Remotesensing 16 01882 g015
Figure 16. (a) Dynamic displacement and (b) acceleration results of Case D5 (with obstacles).
Remotesensing 16 01882 g016
Figure 17. Spectrum of GB-radar dynamic monitoring.
Remotesensing 16 01882 g017
Figure 18. Continuous deformation details and linear regression results of (a) Case S2, (b) Case S3, and (c) Case S4.
Remotesensing 16 01882 g018
Table 1. Static load test setting.
CaseLoading ConditionsNum. of VehiclesNo. of
Vehicles
DurationLoading
Section
Target
Location
GB-Radar
Location
S11st Stage
Loading
9B1–B95 minMiddle of the Northern Main SpanMiddle of the Northern Main SpanNorthern
Construction
Platform
S22nd Stage
Loading
18B1–B9
C1–C9
30 min
S33rd Stage
Loading
27A1–A9
B1–B9
C1–C9
30 min
S44th Stage
Loading
36A1–A9
B1–B9
C1–C9
D1–D9
50 min
S5Unloading
Process
0/40 min
S6Loading
Process
7B1–B7462 sMiddle of the Southern Side SpanTop of
the Northern Pylon
Northern
Bridge
Approach
Table 2. Dynamic load test setting.
CaseVelocity (km/h)Presence of ObstaclesNum. of TrucksGB-radar
Location
D120No2Northern
Construction
Platform
D2402
D3602
D4801
D520Yes1
Table 3. Basic parameters of IBIS-S.
IBIS-S Parameters
Central Frequency17.2 GHz
Maximum Operation Range1000 m
Maximum Range Resolution0.5 m *
Maximum Acquisition Frequency200 Hz
Nominal Displacement Accuracy0.02 mm
Operating Temperature Range−20 °C to +55 °C
Antenna Gain19 dBi
Antenna Field of ViewHorizontal 17° Vertical 15°
* 0.5 m in dynamic mode and 0.75 m in static mode.
Table 4. Static displacement results at 1/2 northern span.
PointStart
(mm)
S1
(mm)
S2
(mm)
S3
(mm)
S4
(mm)
S5
(mm)
L-10.0−272.3−402.8−719.8−832.4−10.3
L-20.0−211.5−402.8−629.1−831.0−12.4
R-20.0−179.9−401.2−585.8−831.3−11.4
R-10.0−117.5−402.5−504.1−840.2−10.3
Rb442/−116.1−392.3−518.2−845.1−10.5
Difference */1.410.2−14.1−4.9−0.2
* The displacement difference between R-1 and Rb442.
Table 5. Frequency results.
Mode *Frequency (Hz)
TheoreticalAccelerometerIBIS-S
V-A-10.1590.191/
L-A-10.2070.211
V-S-10.2460.2810.28247
L-S-10.2660.3060.30601
V-A-20.2710.3090.30993
V-S-20.3590.3970.39624
V-A-30.4060.4740.47471
V-S-30.4590.5110.51001
V-A-40.5140.572/
V-S-40.5230.593/
V-A-50.5800.6340.63556
V-S-50.5930.652/
* L = lateral; V = vertical; S = symmetric; A = antisymmetric.
Disclaimer/Publisher’s Note: The statements, opinions and data contained in all publications are solely those of the individual author(s) and contributor(s) and not of MDPI and/or the editor(s). MDPI and/or the editor(s) disclaim responsibility for any injury to people or property resulting from any ideas, methods, instructions or products referred to in the content.

