Abstract
Net-pen aquaculture, one of the primary forms of aquaculture in shallow lakes, has generated substantial economic benefits but has also triggered eutrophication and ecological degradation. Therefore, the accurate and scientific dynamic monitoring of aquaculture areas is of the utmost importance. However, existing studies have predominantly employed annual monitoring, failing to fully exploit the unique advantage of synthetic aperture radar (SAR) imagery for seasonal, monthly or more frequent time scale monitoring. This study aimed to develop an approach for monitoring the monthly dynamics of net-pen aquaculture using Sentinel-1 time series images. We integrated threshold segmentation and temporal consistency checking to extract spatial data on the net-pen aquaculture from eight typical shallow lakes in Jiangsu Province, one of the eastern coastal provinces of China, from 2016 to 2021. This study yielded the following results: (1) The VV polarization image offers a particularly noticeable contrast between net-pen aquaculture structures and their surroundings and checking for temporal consistency can help alleviate the problem of distinguishing between changes in error caused by misclassification and actual changes that occurred. The overall accuracy of the net-pen aquaculture extraction results was over 85%. (2) This approach not only enables the analysis of changes in the aquaculture area and fence length but can also identify key time points. For instance, the net-pen aquaculture area in Gehu Lake experienced a rapid decline from May to November 2018, the decrease in while Eastern Taihu Lake occurred from September 2018 to June 2019. (3) The removal of net-pen aquaculture in lakes within the Jiangsu Province is primarily attributed to policy responses. In response to the ecological river and lake action plan implemented in Jiangsu Province, a decrease was observed in both the aquaculture areas and fence lengths across most lakes from 2016 to 2021. These results can provide a reference for lake management and ensuring the effective implementation of related policies.
1. Introduction
According to the Food and Agriculture Organization of the United Nations (FAO) Global Fisheries Statistics Yearbook 2021, China’s proportion of inland fisheries production exceeds 60% of the global inland fisheries output, making it the largest producer of inland fisheries in the world [1]. Among these practices, net-pen aquaculture, with its high production yield and strong reproductive capacity [2], has become one of the primary forms of aquaculture in shallow lakes. However, the rapid expansion of aquaculture has also resulted in a series of environmental issues [3,4]. The increasing scale of net-pen aquaculture has inevitably led to the influx of large amounts of nutrients [5,6], triggering eutrophication and ecological degradation. In response, the Chinese government has implemented a series of measures [7], such as implementing fishing bans and dismantling aquaculture ponds and net-pens. In 2016, the State Council fully implemented a policy decision on the Yangtze River system, focusing on lakes and rivers. As a province with a long history of aquaculture in China, Jiangsu Province issued the Ecological Rivers and Lakes Action Plan in 2017. In 2018, the Jiangsu Province Lakes Protection Regulations further detailed the responsibilities of river and lake management and promoted the return of fisheries to lakes. Therefore, the accurate and scientific dynamic monitoring of farming areas is of the utmost importance and can provide strategic support for adjusting relevant fishery policies.
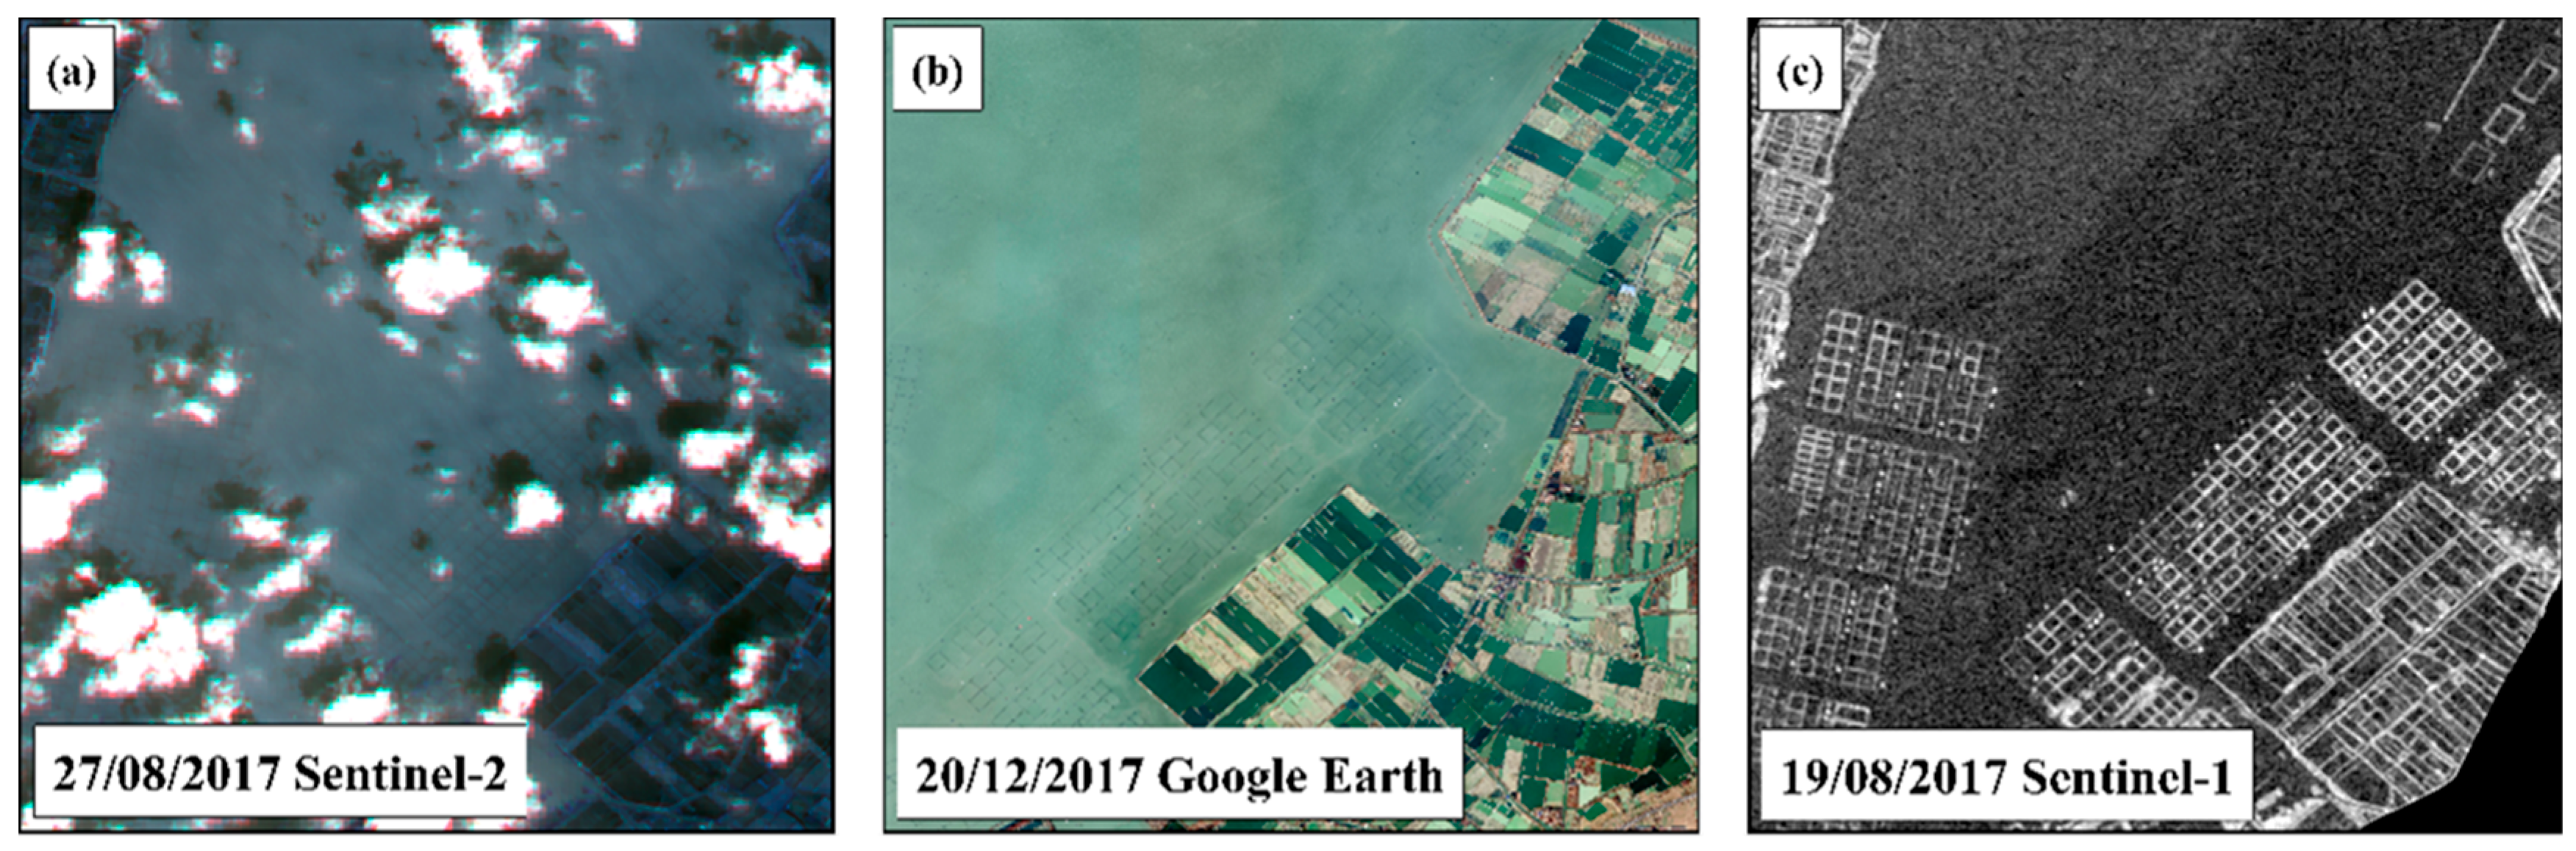
Traditional statistical methods relied on manual surveys or vessel-based global positioning system (GPS) measurements [8]. This method is feasible and offers high accuracy for small-scale aquaculture areas. However, when dealing with large-scale aquaculture lakes or coastal farming regions, acquiring accurate and reliable results becomes challenging [1]. Moreover, these methods lack the capability to trace the historical records of aquaculture activities. With the rapid development of remote sensing techniques, the cost-effectiveness and high efficiency of satellite remote sensing have rendered it particularly valuable for monitoring aquaculture facilities. Amid growing concerns about the environmental impact of aquaculture, a variety of optical satellite data sources, such as Landsat5/8, Sentinel-2, and China’s satellites ZiYuan-3 and Gaofen-1, have been employed to map aquaculture facilities [9,10,11]. However, as shown in Figure 1a, optical remote sensing data are affected by factors such as cloud cover, lighting conditions, and atmospheric interference, limiting monitoring capability to monthly or more frequent time scales. Additionally, net-pen aquaculture structure is often below the resolution of these optical images, making it difficult to directly extract from these images. Although higher-resolution images may potentially overcome this limitation (see Figure 1b), they are still generally expensive or difficult to acquire. Compared to optical images, net-pen aquaculture structures are clearly visible in SAR images even in cloudy or rainy weather (see Figure 1c). As more SAR data become available, using SAR data for more effective and high-frequency monitoring of the net-pen aquaculture dynamics becomes possible.
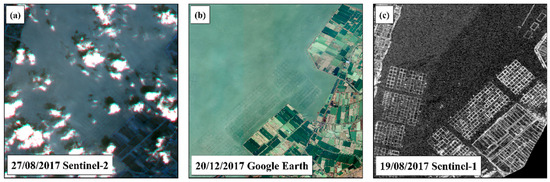
Figure 1.
Satellite observations of net-pen aquaculture. (a) Optical images of Gehu Lake with cloud cover; (b) shows a Google Earth high resolution image (1.2 m). (c) SAR images of Gehu Lake.
In recent years, several studies have exploring SAR data utilization for monitoring aquaculture activities. For instance, Ottinger et al. (2017) [12] employed time-series Sentinel-1 SAR images and integrated object-oriented and texture features using a connected component segmentation algorithm to extract nearshore aquaculture ponds. Liu et al. (2022) [13] developed a multi-feature-based, object-oriented method to extract aquaculture ponds data using fully polarimetric GF-3 SAR data. Han et al. (2023) [14] introduced a novel method that utilizes Sentinel-1 and Sentinel-2 data to classify aquaculture, non-aquaculture water, and non-water areas. They also analyzed the spatial distribution and change in the aquaculture industry in Jianghan Plain, China. However, utilizing SAR data for aquaculture monitoring has predominantly concentrated on land-based aquaculture, with limited attention paid to the net-pen aquaculture of shallow lakes. Dai et al. (2019) [15] conducted an analysis of the distribution and long-term changes in enclosure fences within 17 large lakes throughout the Yangtze Plain, China, using SAR images. Nevertheless, existing studies have predominantly employed annual monitoring, failing to fully exploit the unique advantage of SAR imagery for seasonal, monthly or more frequent monitoring. To effectively monitor the intra-annual dynamics of net-pen aquaculture in shallow lakes, a suitable method that detects the monthly changes in net-pen aquaculture over a large area is needed.
In this study, our objective is to map and characterize the distribution and changes in the net-pen aquaculture in shallow lakes on a monthly basis using SAR data. We specifically aimed: (1) to develop an automatic approach for monitoring the monthly dynamics of net-pen aquaculture by integrating threshold segmentation and temporal consistency checking; (2) to describe the spatio-temporal pattern of aquaculture changes in eight typical shallow lakes located in Jiangsu Province, the eastern coastal provinces of China, from 2016 to 2021; (3) and to assess the effectiveness of government measures for controlling net-pen aquaculture activities.
2. Data and Study Area
2.1. Study Area
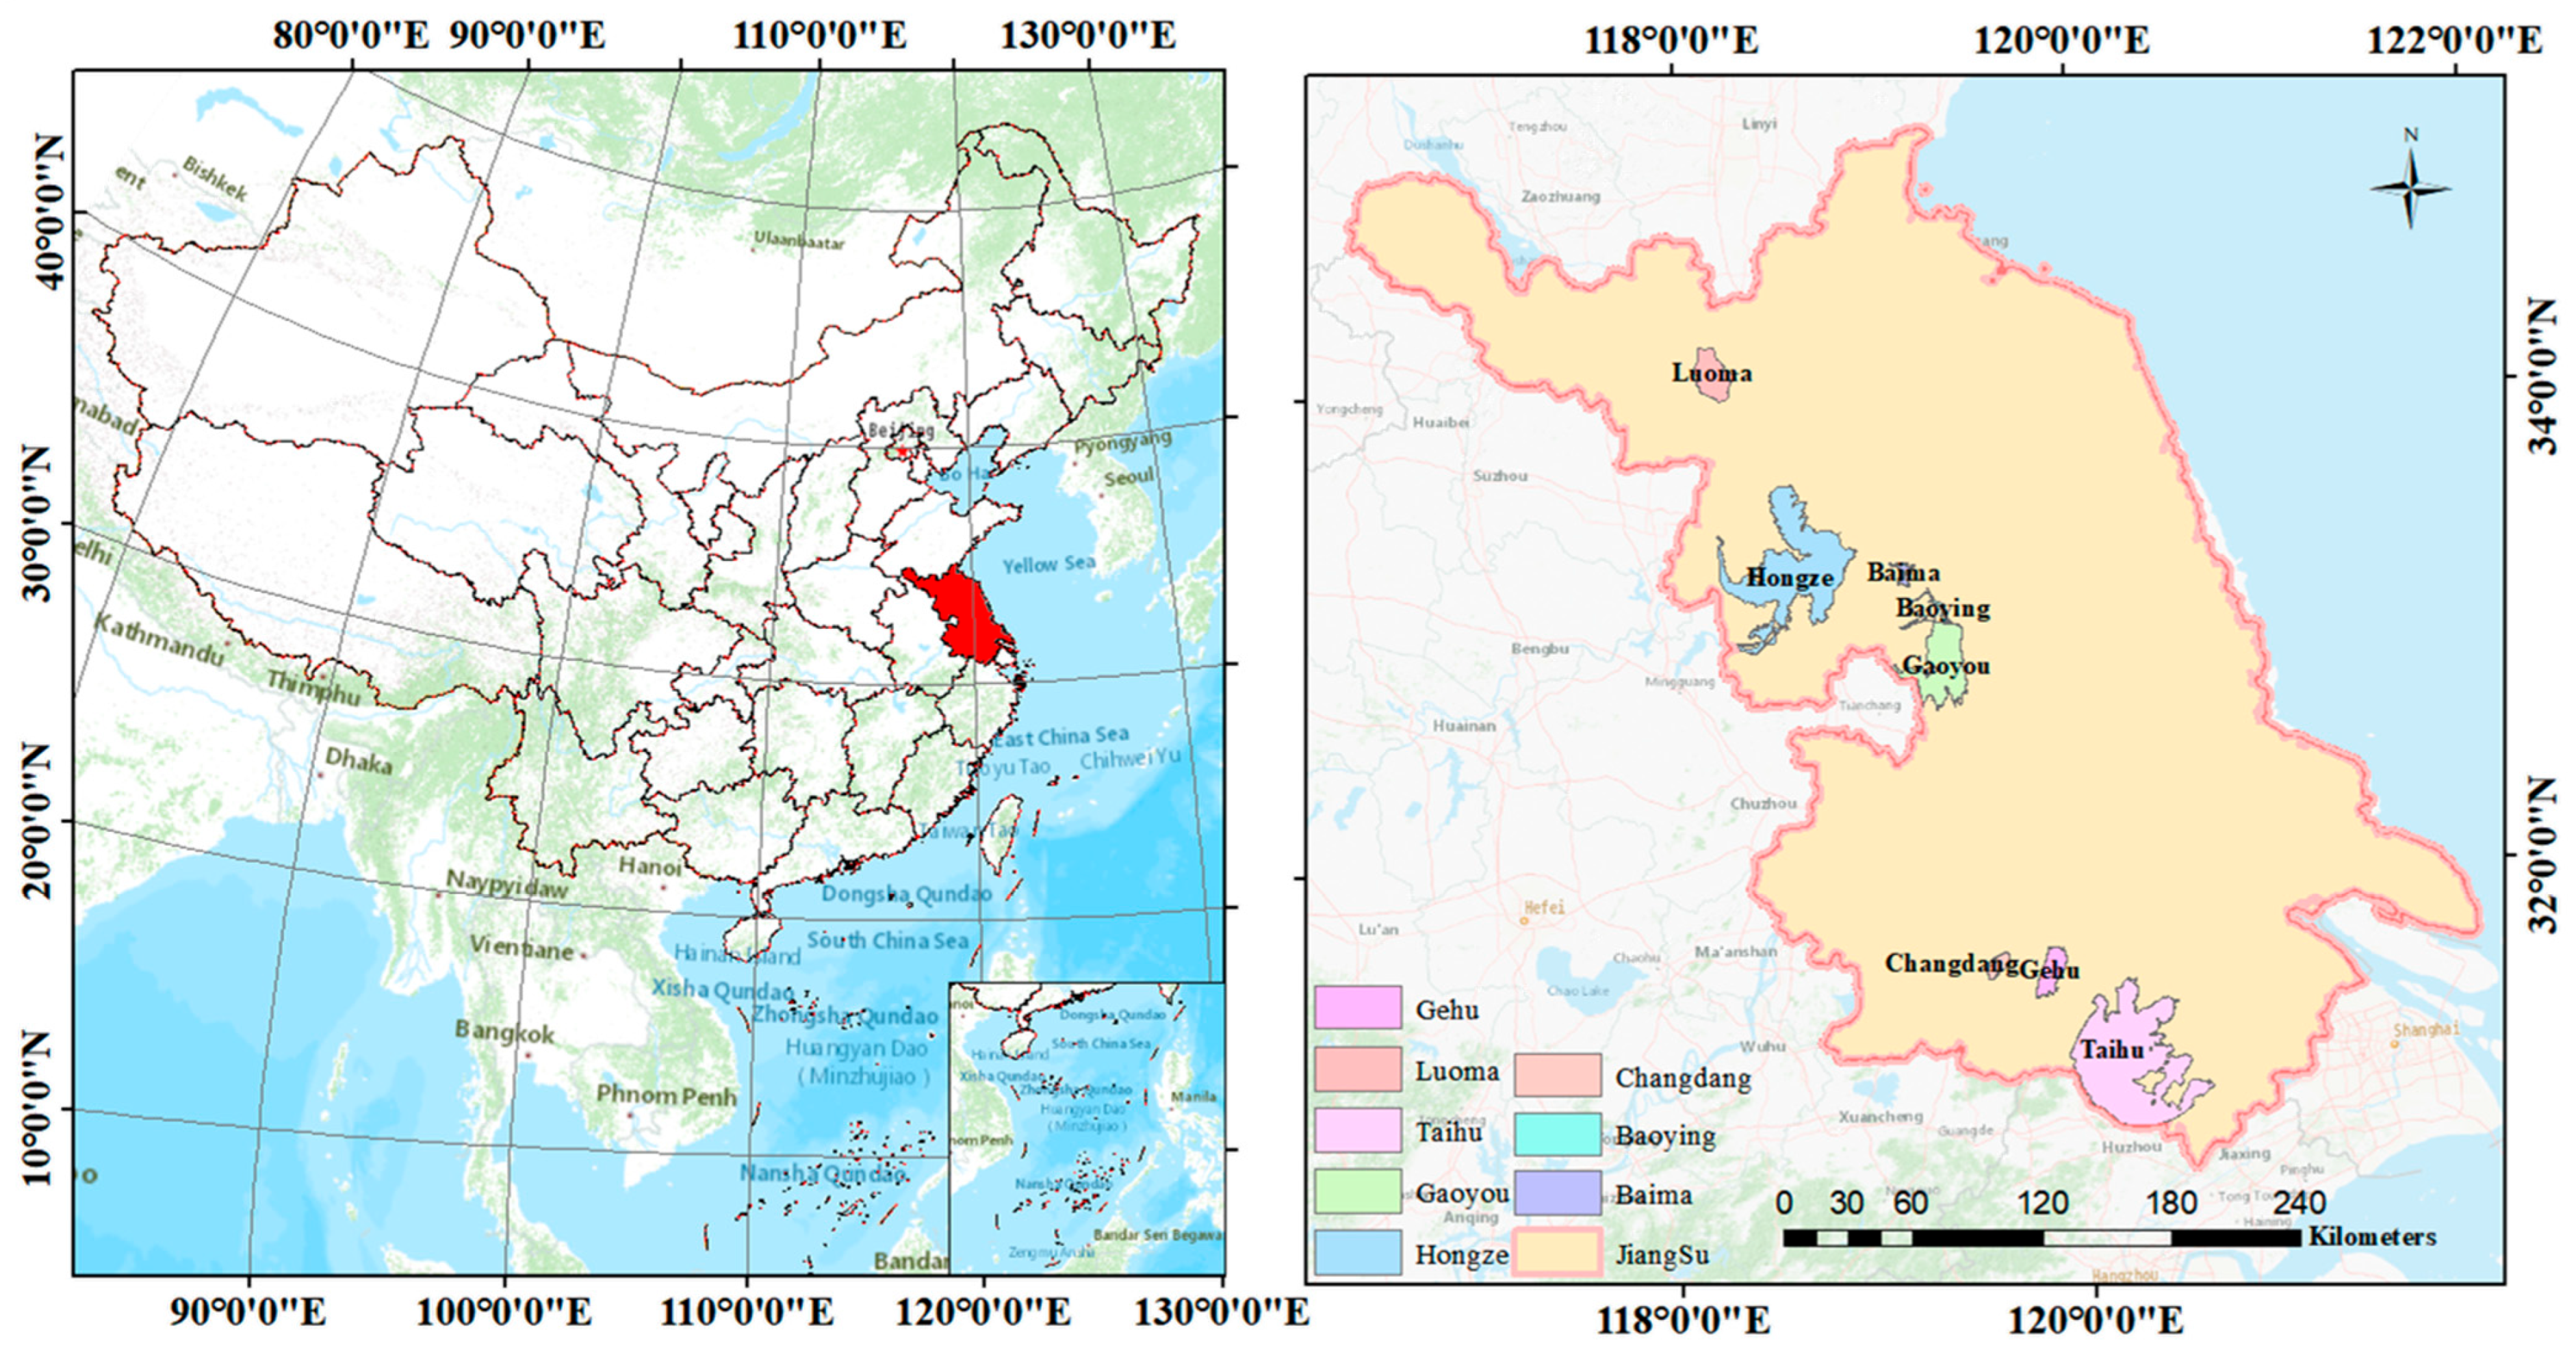
Our research was focused on Jiangsu Province, which is one of the provinces with the highest concentration of shallow lakes in China. Since the 1980s, driven by economic interests, large-scale aquaculture activities have emerged in the shallow lakes of Jiangsu Province. The continuous expansion of aquaculture area has led to a rapid increase in aquaculture density, which peaked in the early 21st century. This poses a severe challenge to the restoration of lake ecosystem functions, with water quality issues becoming increasingly prominent. In 2018, under the call of China’s “river and lake chief system” policy, Jiangsu Province put forward the “Jiangsu Provincial Lake Protection Regulations”, dividing 13 lakes under provincial management. Taking into full consideration of multiple factors such as policy influence, geographic location, area size and distribution of water systems of lakes in Jiangsu Province, China, as shown in Figure 2 we selected eight lakes as typical lakes, namely, Luoma Lake, Hung-tse Lake, Gehu Lake, Gaoyou Lake, Taihu Lake, Changdang Lake, Baoying Lake and Baima Lake, to study the changes of net-pen aquaculture in shallow lakes in Jiangsu Province.
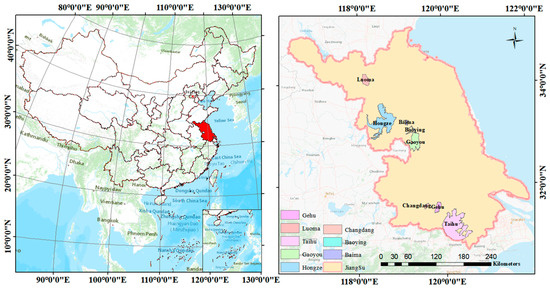
Figure 2.
Distribution map of study lakes.
2.2. Data
2.2.1. Sentinel-1 Data
Sentinel-1 is a satellite mission developed by the European Space Agency (ESA) as an integral part of the Copernicus program. It is dual-polarized with synthetic aperture radar (SAR) data. We used both VV and VH polarizations in our study. It consists of a constellation of two polar-orbiting satellites designed to operate day and night. These satellites utilize C-band synthetic aperture radar imaging, allowing them to acquire imagery regardless of weather conditions [16]. The Sentinel-1 data were downloaded from the European Space Agency (ESA) through Google Earth Engine and processed on local servers. For each lake, we obtained all accessible Interferometric Wide (IW) and Ground Range Detection (GRD) mode data with a 10 m resolution from Sentinel-1A and Sentinel-1B, spanning from January 2016 to December 2021. Due to the short revisit time, a total of 1823 images covered the study area over the span of six years. In this study, a median fusion algorithm was employed to synthesize the data for each month into a single scene. It could mitigate abnormal variations caused by noise or other external factors, contributing to the stability and consistency of the extracted net-pen structures.
2.2.2. HydroLAKES Database
The HydroLAKES dataset is a global lake database project collected and compiled relevant data for over 1.4 million lakes globally. Given that HydroLAKES is one of the most comprehensive and widely used datasets for static lake polygons, we utilized the lake vector data to define the initial scope of the study area.
Owing to the presence of numerous aquaculture ponds along the shores of shallow lakes in Jiangsu, China, the lake polygons offered by the HydroLAKES database usually incorporate some aquaculture ponds. This leads to the polygons encompassing a larger area than the actual lake surface required for our study. In our study, we utilized the HydroLAKES lake database to locate the lakes in the study area and subsequently performed lake surface extraction, excluding the aquaculture ponds sections from the lake area.
2.2.3. Gaofen-2 Data
Gaofen-2 (GF-2) is the first civilian optical remote sensing satellite with a spatial resolution of better than 1 m developed independently by China, which was successfully launched on 19 August 2014, and started imaging and downlinking data for the first time on 21 August. It carries two high-resolution 1 m panchromatic and 4 m multispectral cameras with sub-meter spatial resolution, high positioning accuracy and fast attitude maneuvering capability. Due to the lack of measured datasets on net-pen aquaculture in shallow inland lakes in China. In order to verify the accuracy and reliability of the SAR data extraction results, we used the 27-view GF-2 satellite imagery data as a reference to map a sample of the net-pen farming extent of each lake.
3. Method
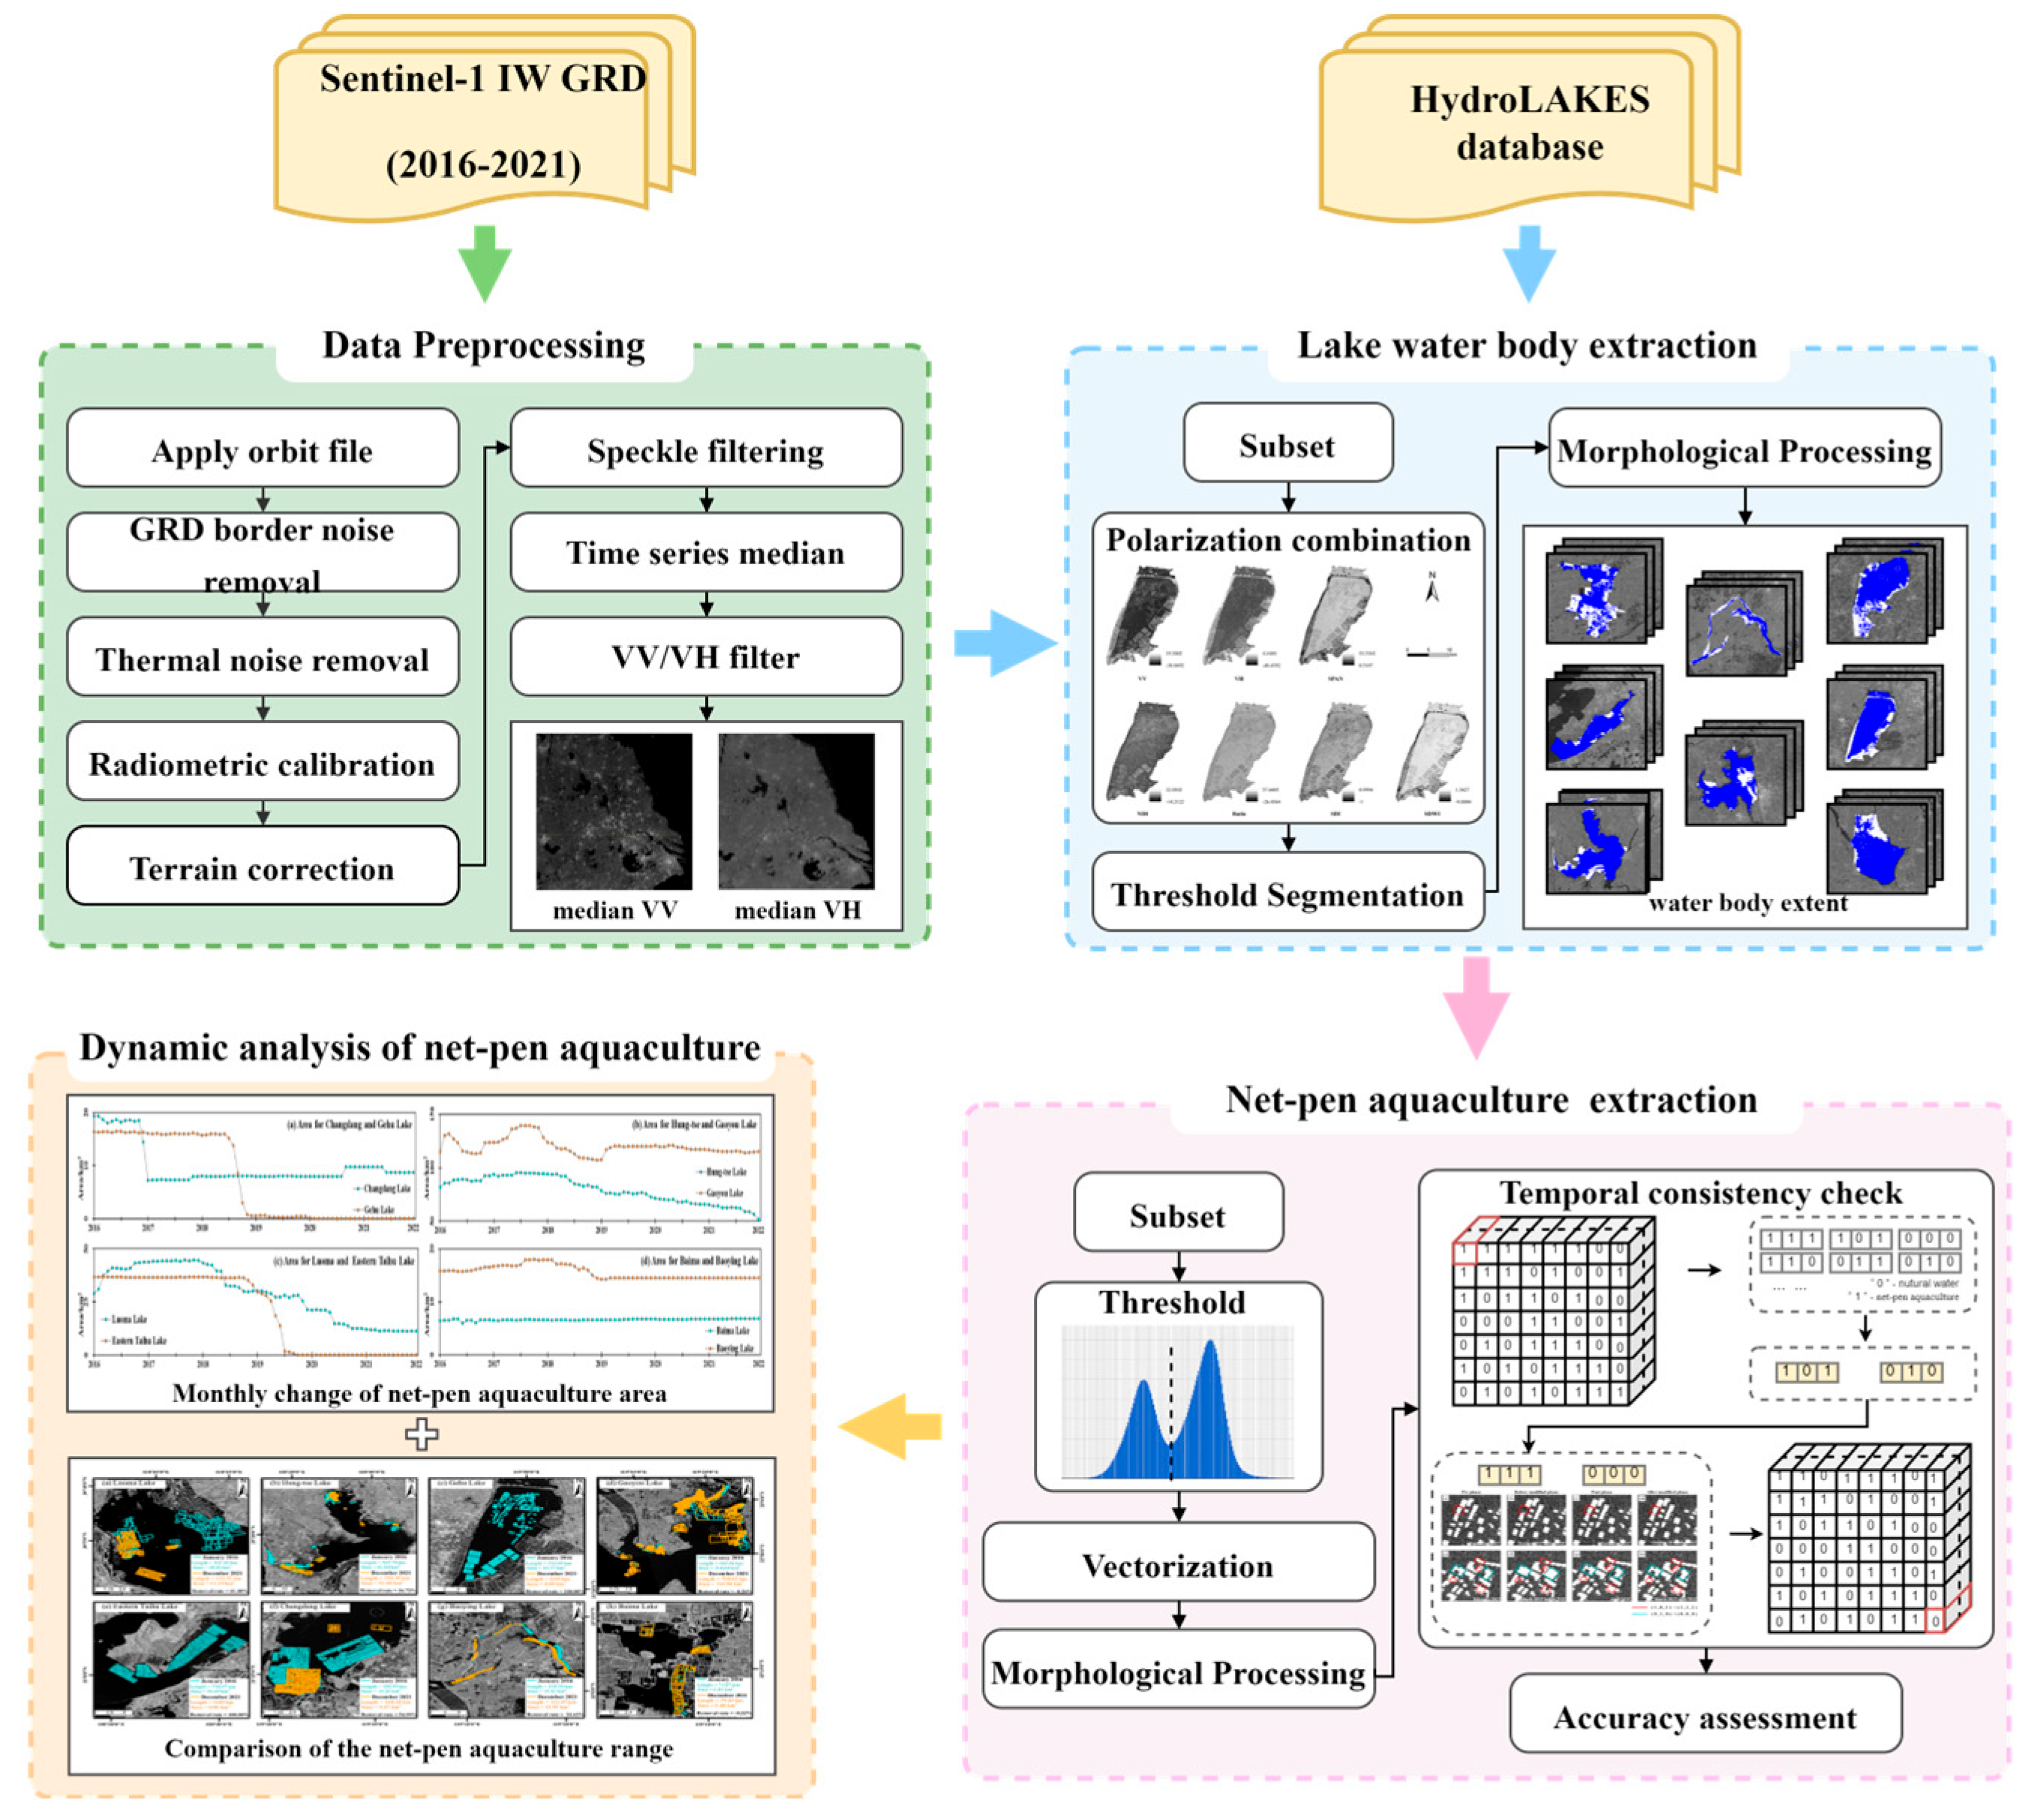
The workflow of our study is shown in Figure 3 and elaborated upon in the following sections. It consists of four main steps: (1) data preprocessing; (2) lake water body extraction; (3) net-pen aquaculture extraction; (4) dynamic analysis of net-pen aquaculture.
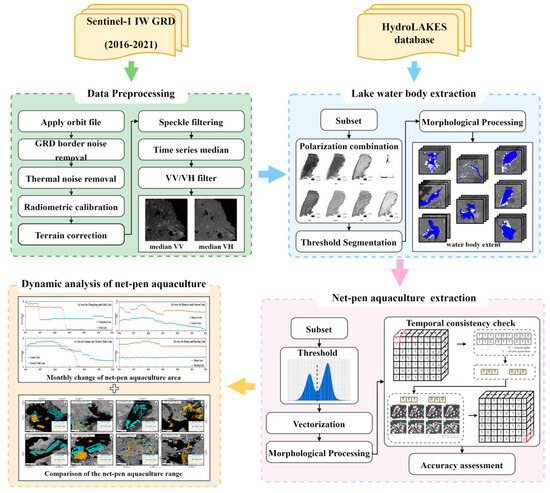
Figure 3.
Flowchart of net–pen aquaculture extraction.
To further explain the workflow, an example of Gehu Lake was provided to demonstrate the extraction process.
3.1. Data Preprocessing
To enhance data quality and improve the accuracy of processing results, pre-processing operations such as radiometric calibration are commonly applied to Sentinel-1 data. In this study, given the need for a large volume of Sentinel-1 data, the Google Earth Engine (GEE) platform was chosen for preliminary data acquisition and pre-processing. The HydroLAKES dataset was employed within the GEE platform to geographically locate lakes in the study area, facilitating the selection of suitable Sentinel-1 datasets. The Sentinel-1 data available on the GEE platform has undergone built-in pre-processing steps, including the application of orbit files, removal of GRD border noise, thermal noise removal, radiometric calibration, and terrain correction.
Additionally, Refined Lee filtering is applied to the images for speckle noise reduction. A median fusion algorithm was employed to synthesize monthly data into a single scene. Subsequently, the buffered lake vectors obtained from the HydroLAKES database were used to clip the scenes, preliminarily delineating the lake extents.
3.2. Lake Water Body Extraction
Preprocessed SAR images of lake extents include not only target lake water bodies with enclosed aquaculture structures but also sections occupied by aquaculture ponds. Therefore, it is imperative to further extract the lake water body extents and delineate water boundaries accurately. Synthetic aperture radar (SAR) images exhibit four common polarizations: HH, HV, VH, and VV [16]. While each polarization can be utilized for object extraction, it is important to note that the backscatter characteristics of radar signals vary with polarization, which can influence the accuracy of lake water body extraction. In this study, the dual-polarization (VV and VH) data were collected from the Sentinel-1 C-band sensors. To achieve the objective of eliminating aquaculture ponds around lakes in this step, a variety of feature parameters as shown in Table 1 were calculated to determine which polarization or combination of polarizations is most suitable for distinguishing between aquaculture ponds and lakes.

Table 1.
Feature sets extracted from the Sentinle-1 satellite [17].
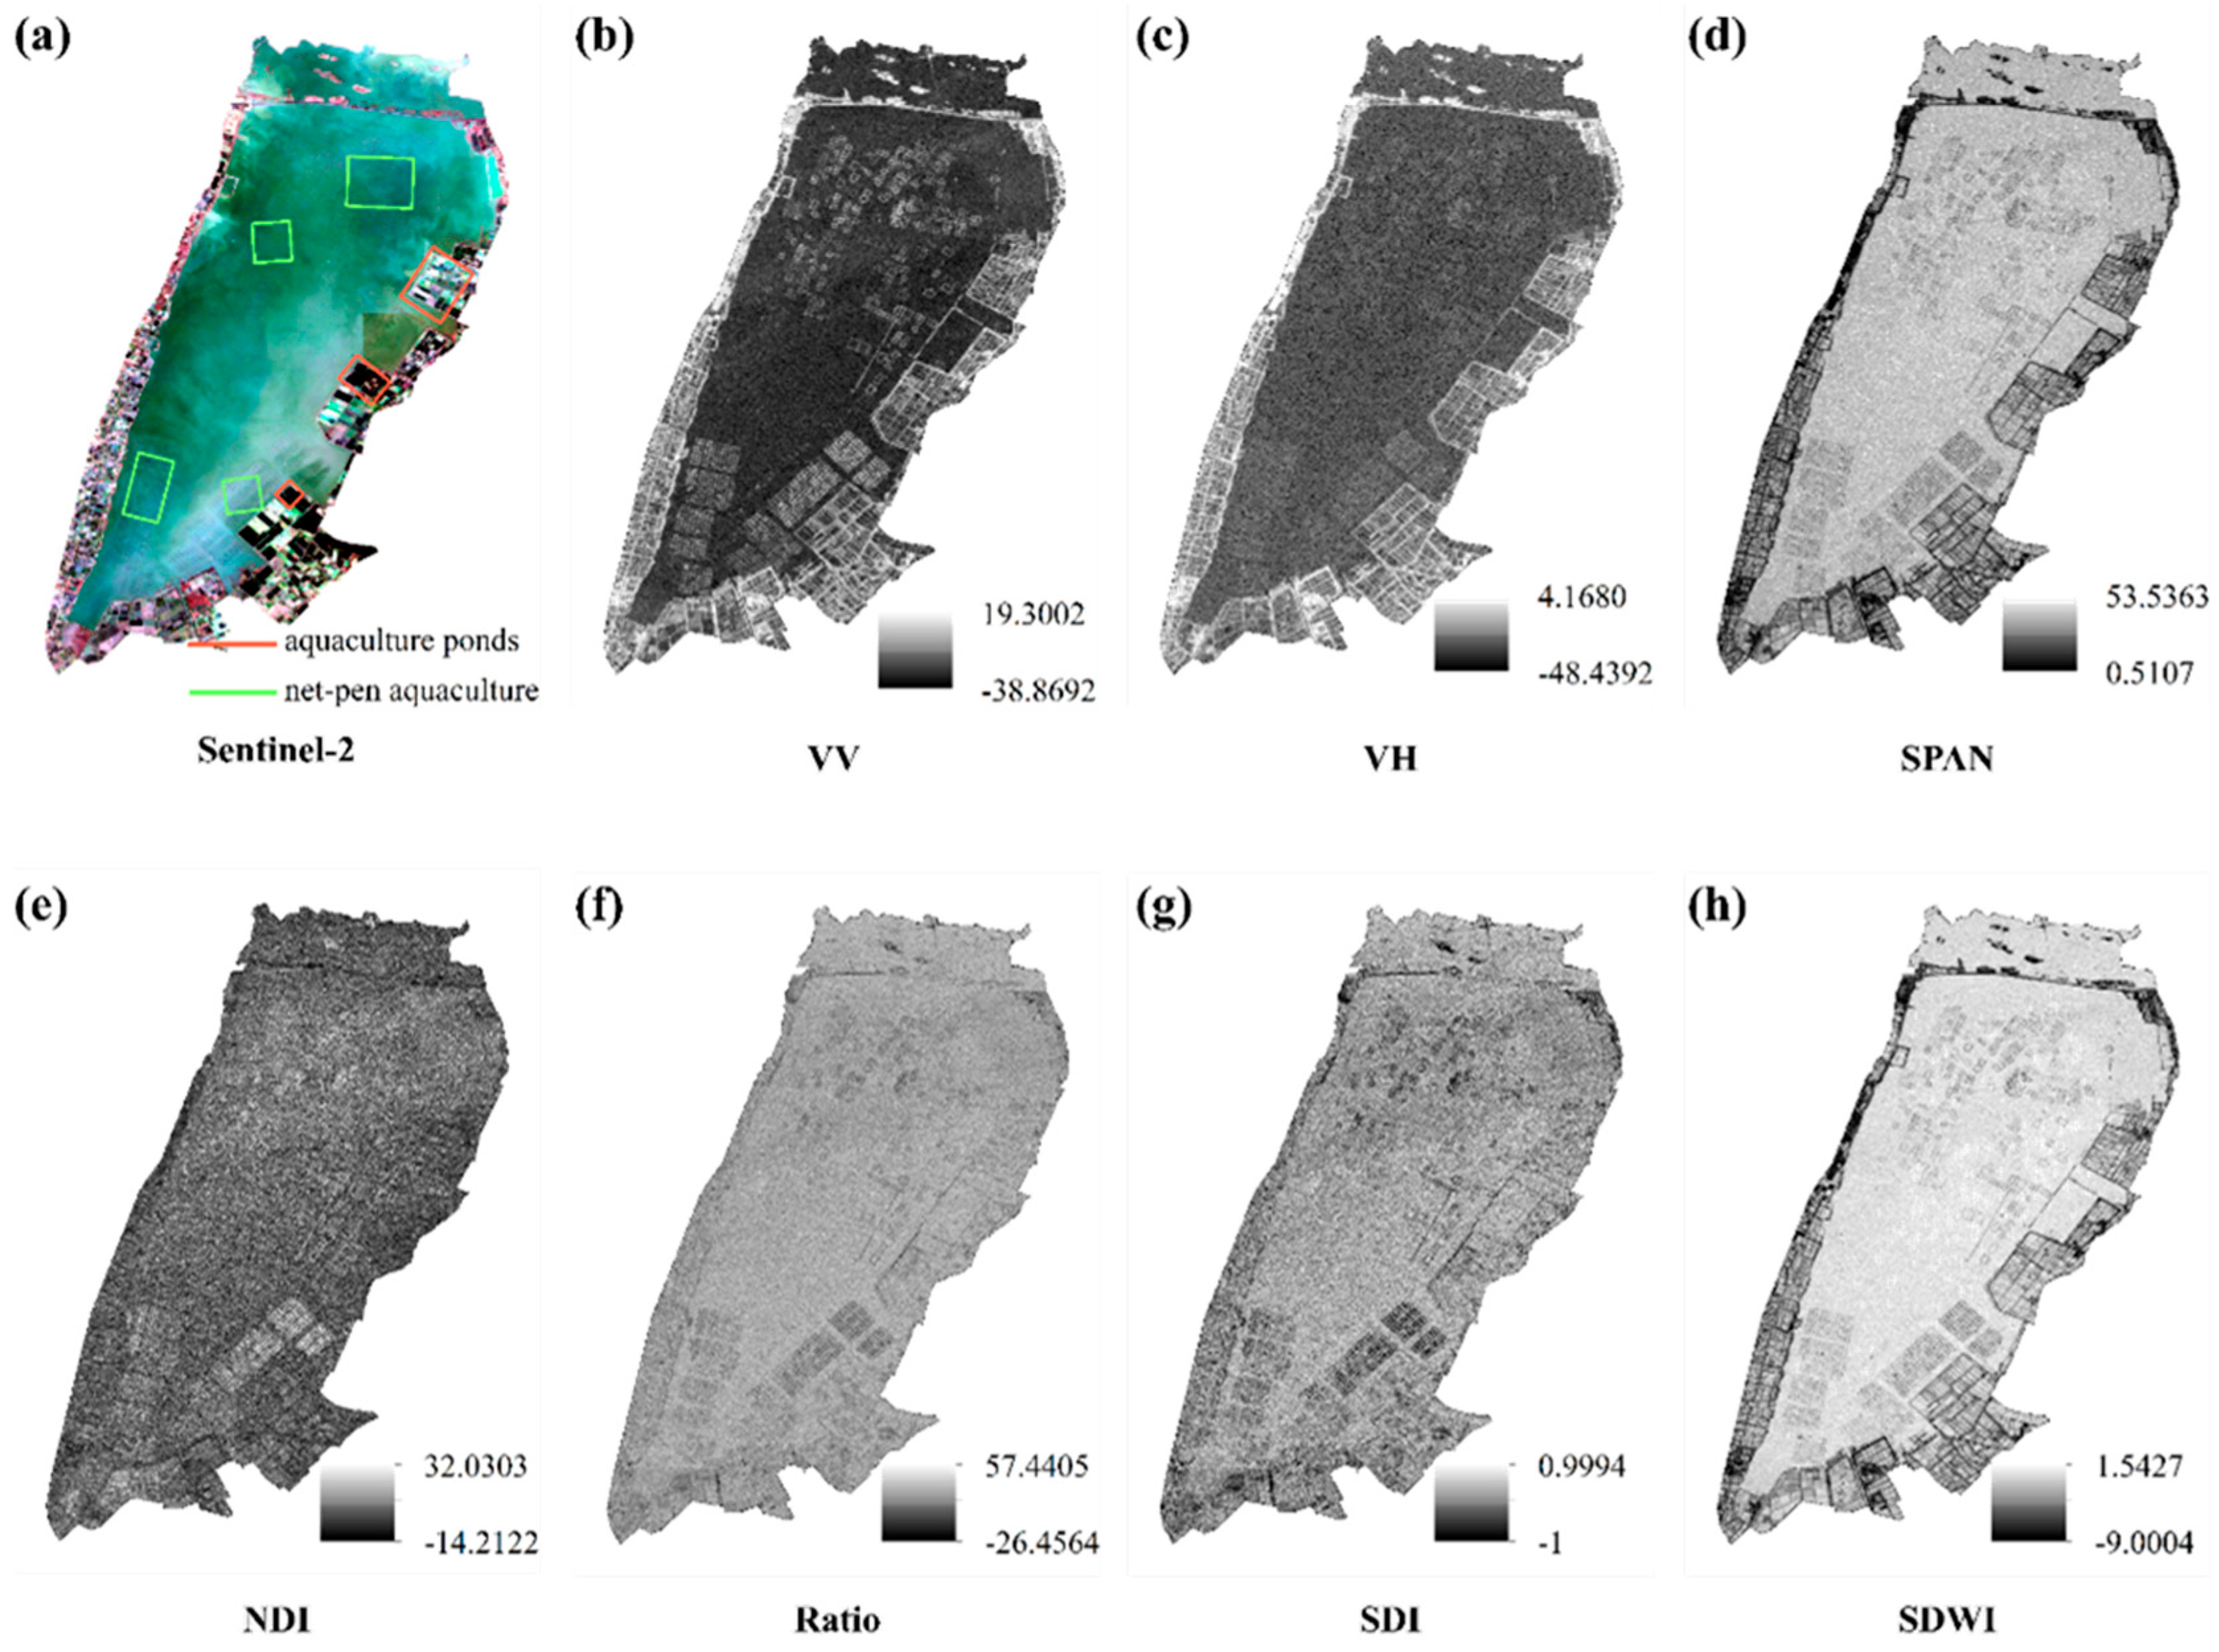
The visual map of all features was shown using image gray mode with a ground range pixel resolution of 10 m. As shown in Figure 4, it can be observed that for the original backscatter characteristics, VV values tend to be greater than VH values. However, it is also noted that aquaculture ponds around the lake and net-pen aquaculture structures on the lake exhibit similar backscatter characteristics in VV polarization images. Regarding the five radar indices, NDI, ratio, and SDI show weaker discriminative ability between water and non-water areas. While SPAN and SDWI display more prominent image contrast between water and non-water areas, it is important to acknowledge that aquaculture ponds around the lake and net-pen aquaculture structures on the lake might still present similar backscatter characteristics in these two feature images. Therefore, the VH polarization image is a suitable choice for achieving the objective of eliminating aquaculture ponds around lakes while preserving comprehensive water surface information, including net-pen aquaculture structures on the lake surface. This feature’s ability to effectively differentiate between water bodies and non-water areas facilitates the accurate delineation of lake extents, ensuring the integrity of the study area in this step.

Figure 4.
Visual map of different features; (a) represents an optical satellite image from Sentinel-2, where the green square highlights the characteristic representation of net pen aquaculture structures in optical imagery, and the red square encloses parts of the aquaculture ponds along the lake’s coast; (b–h) display visualizations resulting from various index-based processing applied to Sentinel-1 data.
The Maximum Inter-Class Variance method [18] was employed in this study to achieve optimal threshold segmentation of image information, thereby obtaining accurate lake water extraction results. Although noise filtering was performed during the image preprocessing, inherent speckle noise in SAR images persisted, and various factors like human facilities might also exist in the target lake water area. Consequently, binary images obtained by threshold segmentation often contain many holes, especially when the target areas encompass narrow embankments for closed lake water aquaculture. This may lead to issues such as lake water edge breakpoints and adhesion. Therefore, morphological processing is required to obtain relatively complete lake water bodies. Among these operations, we primarily utilized dilation and erosion for the separation and connection of binary images.
3.3. Net-Pen Aquaculture Extraction
In order to extract net-pen aquaculture structures on lake surfaces effectively, a scheme was devised by combining threshold segmentation with temporal consistency checking. A temporal consistency checking method was introduced to ensure the stability and continuity of these features across multiple time points, enhancing the robustness of the extraction process over time.
3.3.1. Threshold Segmentation
Net-pen aquaculture structures are usually difficult to distinguish from the water body in optical images due to the influence of resolution and land reflection characteristics, whereas clear linear structures can be observed in SAR images. The dihedral structure formed by fishing nets and the lake surface can cause a phenomenon known as the double-bounce backscattering effect, which apparently enables net-pen aquaculture structures to be easily distinguished from the surrounding lake water in SAR images. From Figure 4, it is evident that the VV polarization image offers a particularly noticeable contrast between net-pen aquaculture structures and their surroundings.
In this study, the Otsu threshold segmentation method was employed to extract original net-pen aquaculture area from lake water. Then, pixel morphology processing was performed to connect disconnected linear features and sharpen the width of the linear features. To address the issue of block adhesion resulting from data resolution limitations, post-processing was employed to ensure the completeness of the net-pen aquaculture structures.
3.3.2. Temporal Consistency Checking
In long-term change monitoring, it is crucial to distinguish between changes in error caused by misclassification and actual changes that occurred. Therefore, after generating a series of monthly classification maps of net-pen aquaculture/water bodies in the study area, a temporal consistency checking (TCC) algorithm [19] was employed to remove the noise (or misclassification) caused in individual classifications.
Typically, once policy-guided net-pen aquaculture removal is completed, it is not rebuilt again in the short term. Based on this assumption, the extraction results were vectorized in temporal order, with net-pen aquaculture extraction results labeled as 1 and non-net-pen aquaculture results labeled as 0. We denoted the labeled binary image as X and took the net-pen aquaculture extraction results of three adjacent months as a group (. For each pixel point in the binary image, we calculate the sum of the values for each month to conduct a logical consistency check. The sum of the values for each pixel point in three adjacent months was calculated using Formula (1).
In this formula, represents the extraction result from the previous month, represents the extraction result from the current month, represents the extraction result from the following month, and n represents the length of the time series.
As shown in Table 2, the sum D can take four values: 0, 1, 2, or 3, and there are eight possible combinations of monthly vectors. When the value of D is 0 or 3, the adjacent monthly vectors can be expressed as (0, 0, 0) or (1, 1, 1). It indicates that the aquaculture condition remains unchanged for three consecutive months, thus requiring no modification. When the value of D is 1 or 2, it indicates that the aquaculture condition has changed. There are only two combinations that are irrational and need to be corrected: (1) If the value of D and are both 1, the adjacent monthly vectors can be expressed as (0, 1, 0), which is irrational and needs to be corrected to (0, 0, 0). (2) If the value of D is 2 and the value of is 0, the adjacent monthly vectors can be expressed as (1, 0, 1), which is irrational and needs to be corrected to (1, 1, 1).
Table 2.
Temporal vector correction for net-pen aquaculture extraction results.
In this manner, we rechecked whether mapped net-pen aquaculture sequences were reasonable in a spatio-temporal context. The TCC algorithm ensures that changes in the net-pen aquaculture structures in the study area are correctly classified over time, enhancing the temporal consistency of the classification results.
3.4. Dynamic Analysis of Net-Pen Aquaculture
For the lakes within the study area, we implemented the aforementioned processing workflow on monthly data from 2016 to 2021. Following this, we performed a monthly dynamic analysis of net-pen aquaculture within the lakes.
Firstly, the total length of line features was utilized to calculate the boundary of net-pen aquaculture in the lakes, where the area of net-pen aquaculture was depicted by the total polygon area derived from these line features. Additionally, two parameters were used to further examine the dynamics of net-pen aquaculture in the lakes. One is fence density (FD) [18], which quantifies the ratio between the length of enclosure fences and the size of the lake. This parameter serves as an indicator of the intensity of purse net-pen aquaculture activities within the lake, aiding in the assessment of the structural health of fish culture in the lake. The other is the area percentage of enclosure culture (APEC) [18], which represents the ratio of net-pen aquaculture area to the overall lake water area. It provides insights into the spatial scale and density of net-pen aquaculture activities within the lakes.
3.5. Accuracy Assessment
To quantitatively describe the accuracy of the extraction results, this experiment uses “overall accuracy” as the metric for accuracy assessment, which is the most intuitive performance metric indicating the ratio of the number of correctly predicted pixels to the total number of pixels. The calculation formula is:
where denotes the number of classes containing the background, represents the number of samples of class that are predicted to be class , and N represents the total number of pixels in the image.
In our study, a sample map of the extent of net-pen aquaculture in each lake was developed using 27 views of GF-2 imagery data as a reference. The sample dataset was used as a real ground data input for calculating the overall accuracy.
Optical images are affected by cloudy, rainy, and foggy days—as well as the limitations of the revisit period of the GF-2 images—in assessing the accuracy of each extraction result. Therefore, only one month per lake was selected for accuracy assessment as the accuracy of the extraction results of the net-pen culture structure in that lake. Data with good weather quality were prioritized. Since it is impossible for lakes to be covered from the same viewpoint, data from the same date were selected for the same lake to maintain the consistency of the net-pen aquaculture situation. For each lake, the month of the net pen aquaculture extraction results used for accuracy assessment should be consistent with the corresponding pair of GF-2 data.
4. Results
4.1. Lake Water Body Extraction Results
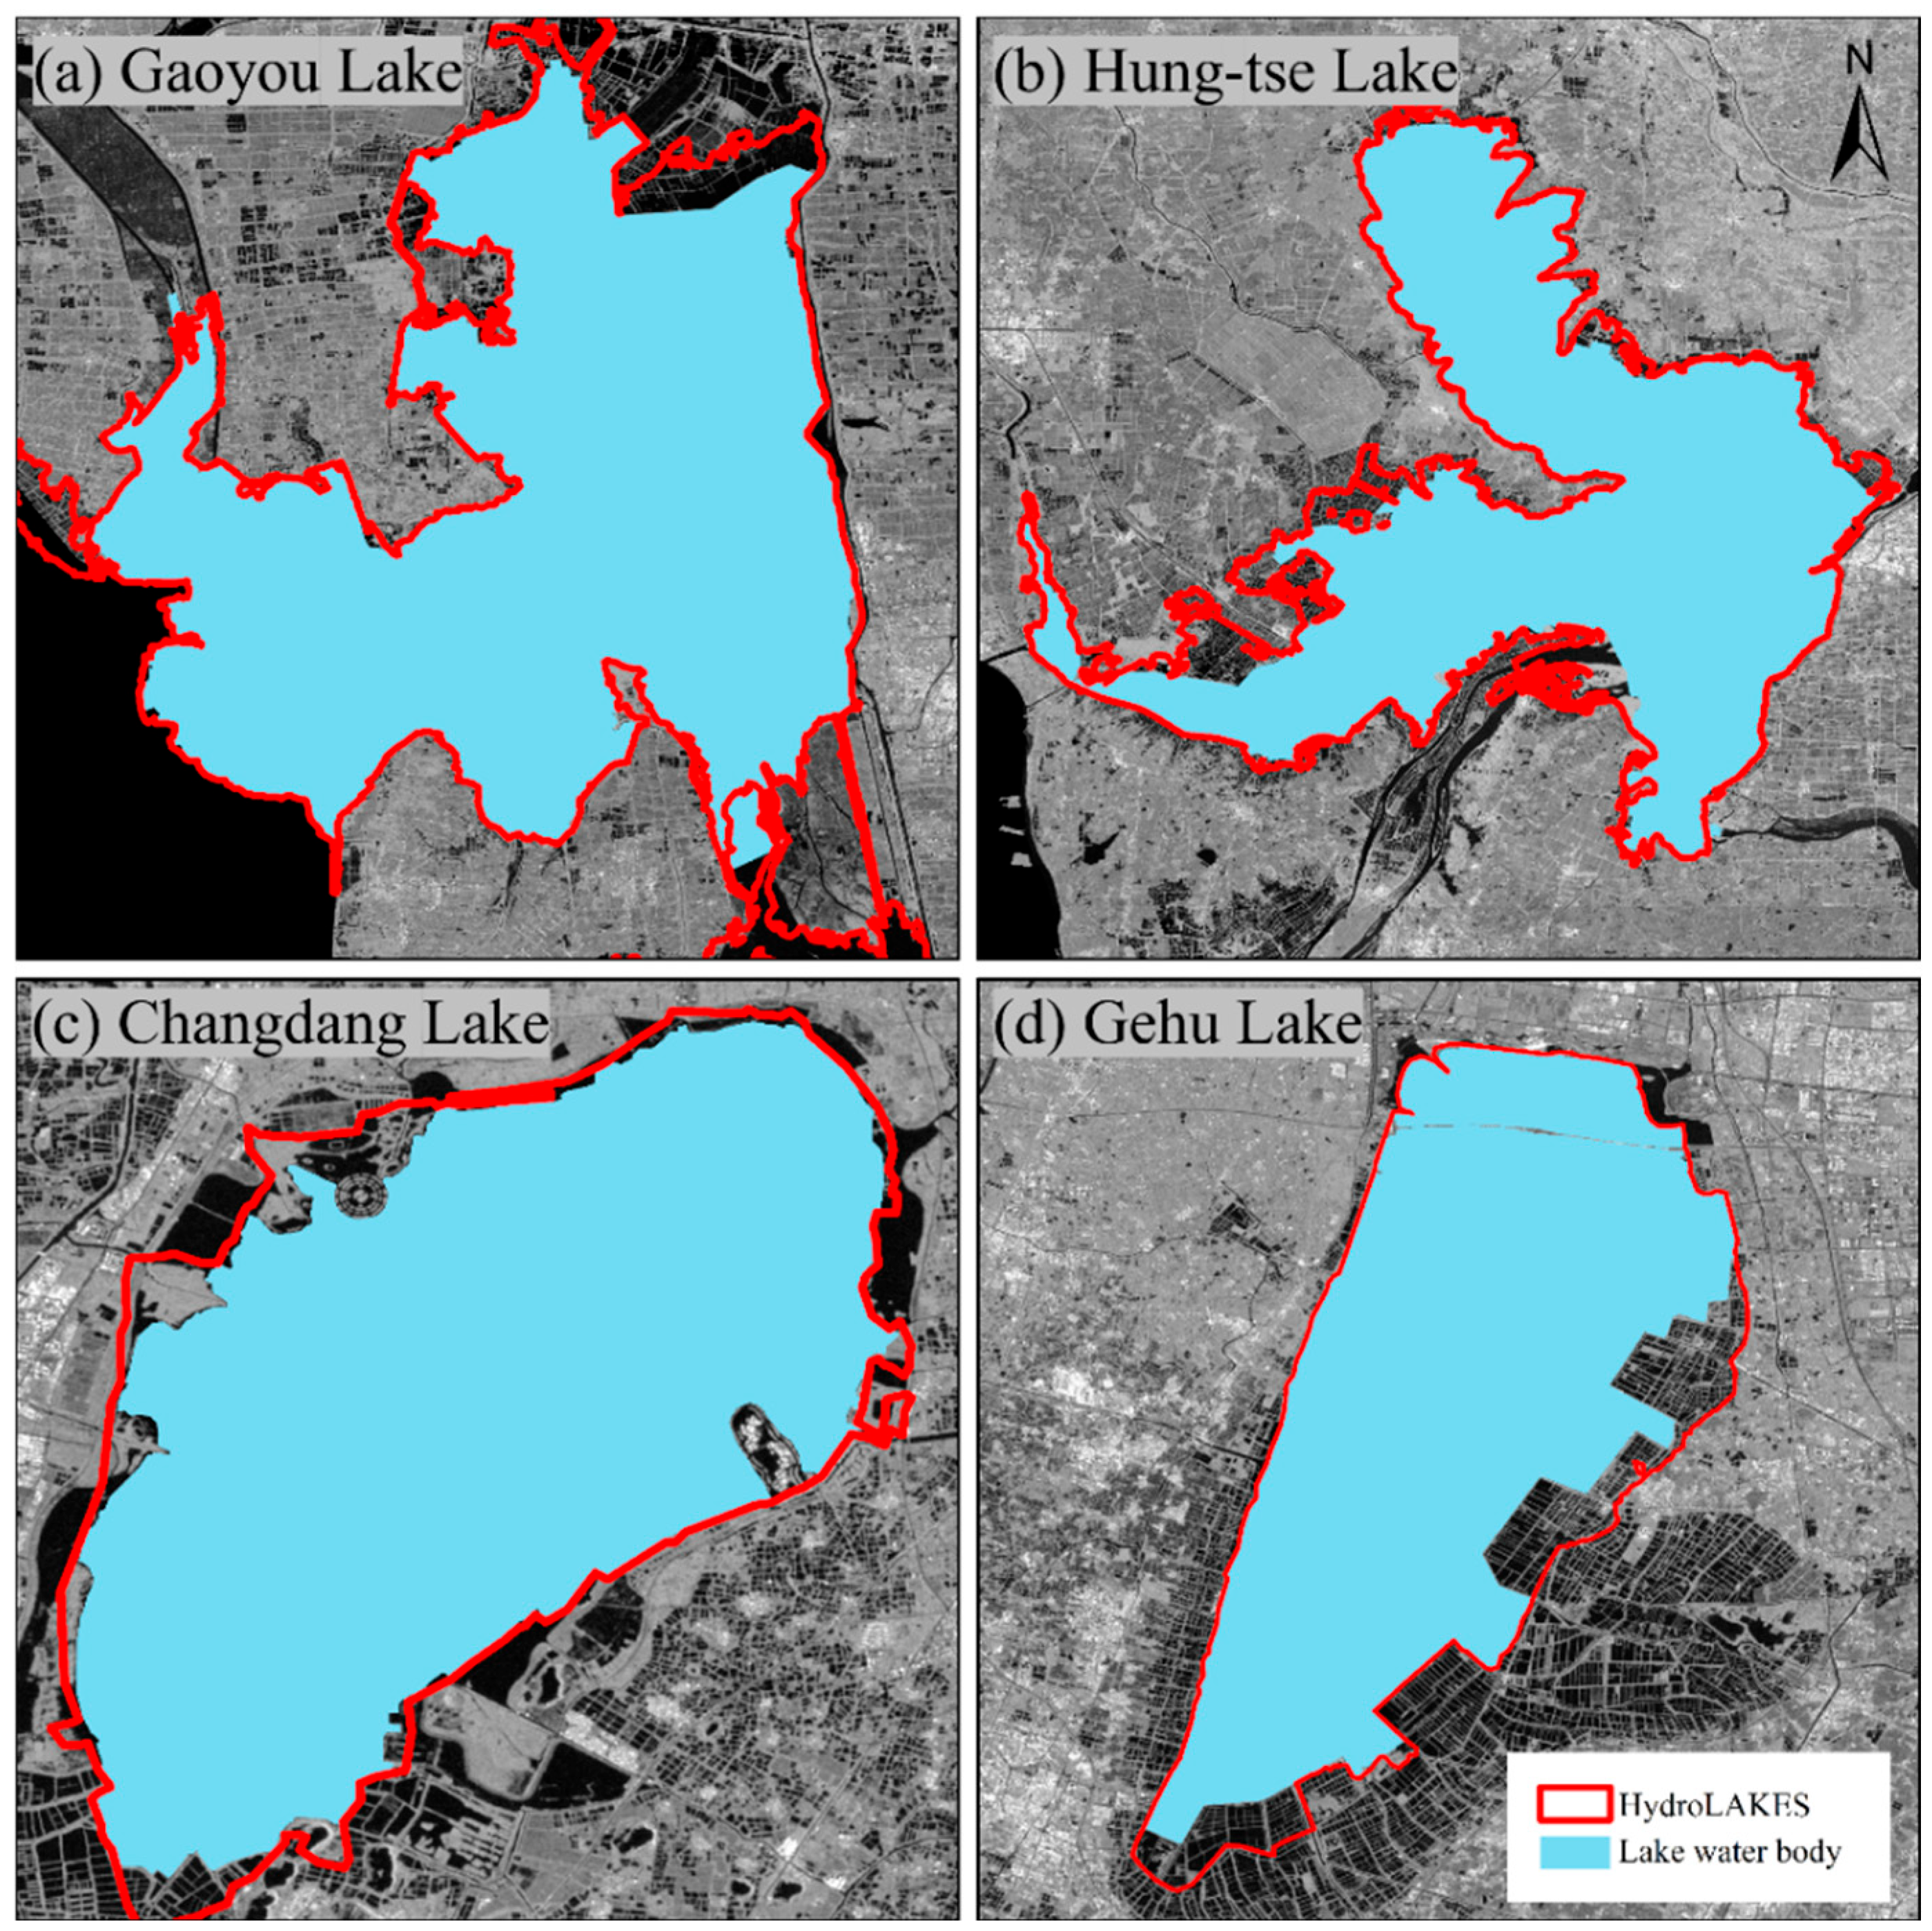
In this step, our objective is to eliminate aquaculture ponds around lakes and accurately extract the extents of the lake water bodies. As shown in Figure 5, a comparison is made between the original lake extent delineated according to the buffered lake vectors obtained from the HydroLAKES database and the lake extraction results obtained in this study. It is evident that our method successfully eliminates aquaculture ponds around lakes while ensuring the integrity of lake extents.
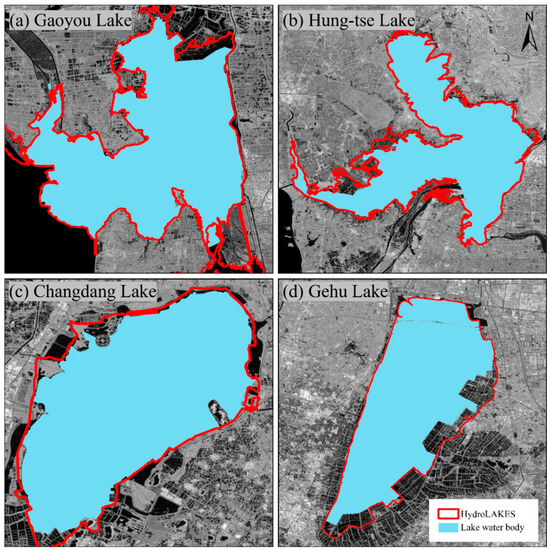
Figure 5.
Comparison of lake boundaries: HydroLAKES Database versus extracted boundaries.
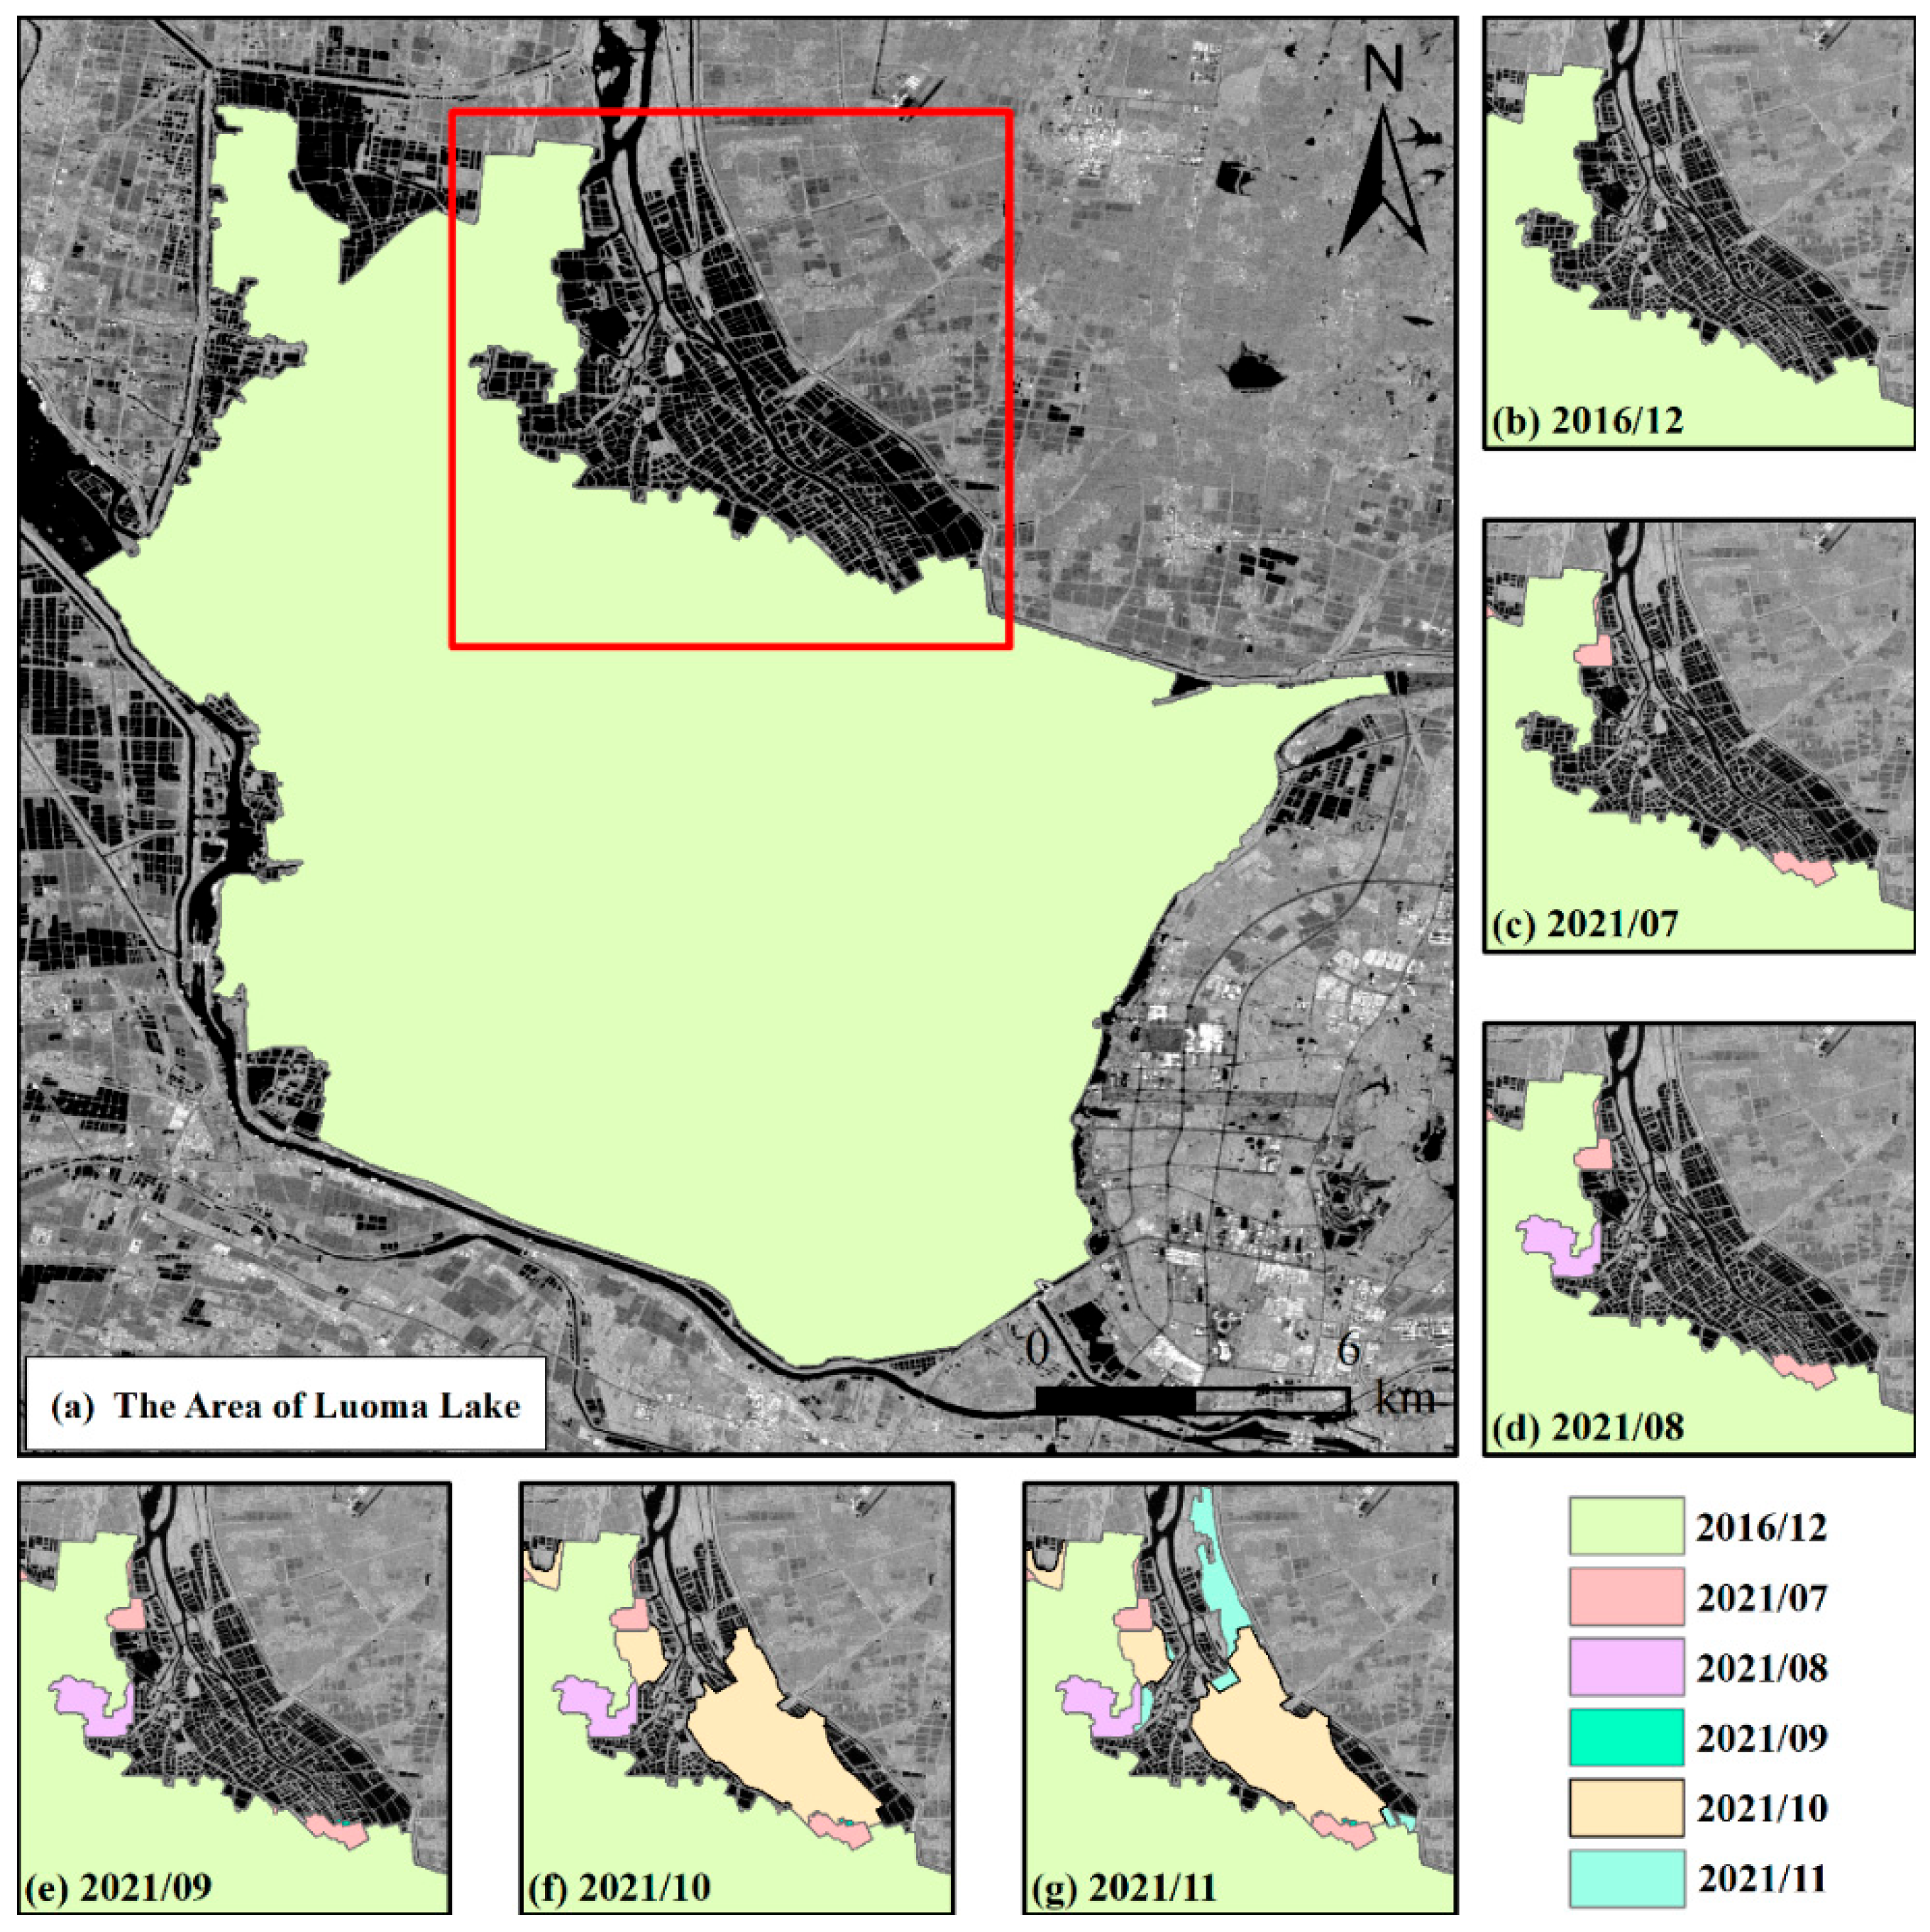
Among the lakes, Luoma Lake shows a slight increase in lake water area. As illustrated in Figure 6, this increase is primarily attributed to the recovery of the previously diminished northeastern parts of the lake. In contrast, no significant inter-annual changes are observed in other lake areas within the study region, and they have remained relatively stable. However, to accurately calculate the intra-annual changes in APEC (area percentage of enclosure culture), the lake area data are updated monthly.
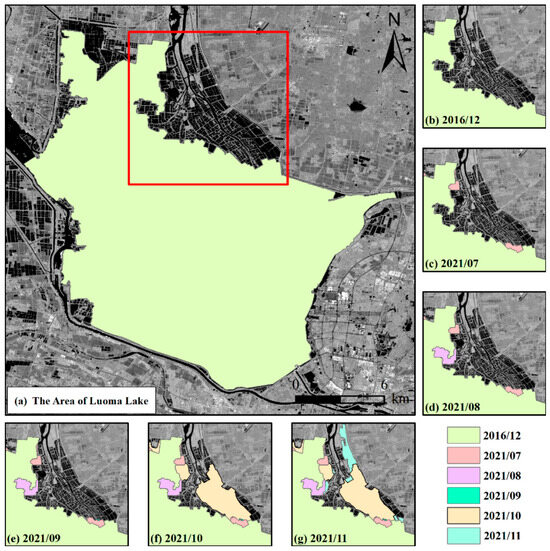
Figure 6.
Illustration of Luoma Lake’s area change: (a) highlights recent alterations in the lake, and (b–g) depicts months with significant area changes from 2017 to 2021.
4.2. Net-Pen Aquaculture Extraction Results
Our method was applied to the SAR images from 2016 to 2021 to monitor changes in net-pen aquaculture area of eight typical shallow lakes located in Jiangsu Province, China. Table 3 provides an overview of net-pen aquaculture extraction results in the study area. “Lake Area” represents the total area of each lake, and the table only displays lake area for January 2016. “Aquaculture Area” indicates the area covered by net-pen aquaculture in each lake and “Removal rate” denotes the ratio of area change to initial area of net-pen aquaculture.
Table 3.
Extraction results of net-pen aquaculture in the research area.
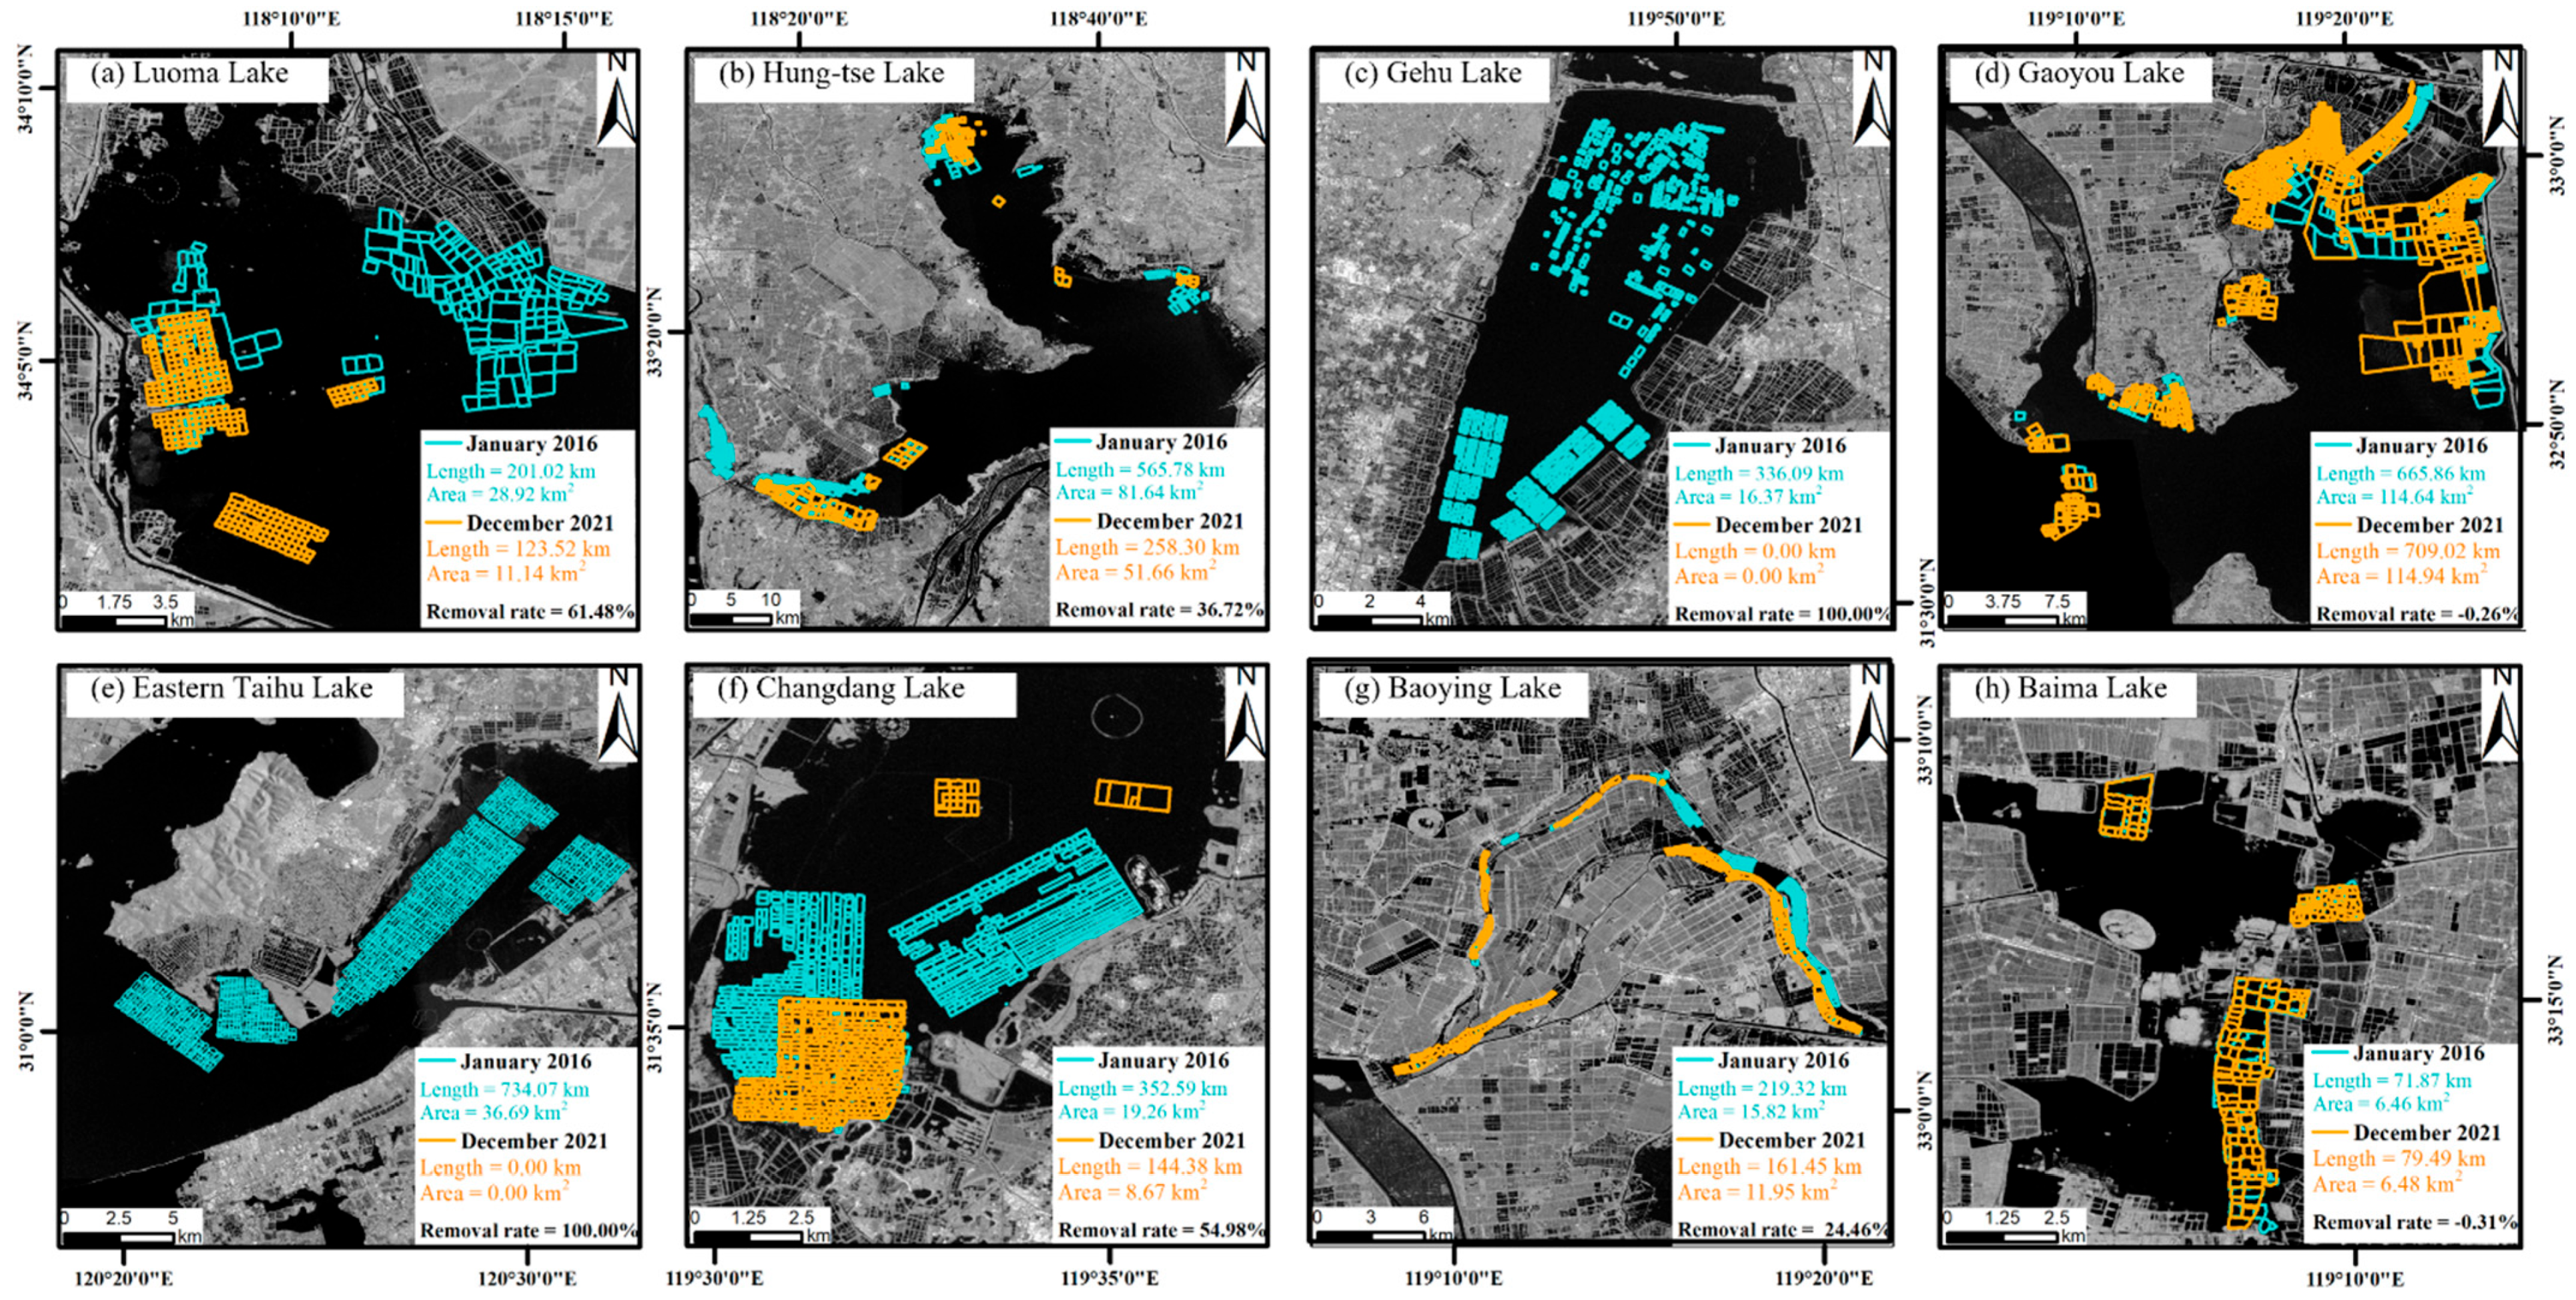
The spatial distribution changes of net-pen aquaculture range of the studied lakes between January 2016 and December 2021 are depicted in Figure 7. It can be observed that all the net-pen aquaculture has been removed from both Gehu Lake and Eastern Taihu Lake. Substantial changes were also found for Changdang Lake, Luoma Lake, Hung-tse Lake and Baoying Lake. Taking Luoma Lake for example, in January 2016, the total net-pen aquaculture area and fence length were 28.92 km2 and 201.02 km, respectively. These values decreased to 11.14 km2 and 123.52 km, respectively, in December 2021. And from Figure 7a, we can see that more than half of the net-pen aquaculture has been removed, especially in the east of the lake. However, no observable changes were noted in the distribution of net-pen aquaculture in Gaoyou Lake and Baima Lake between 2016 and 2021.
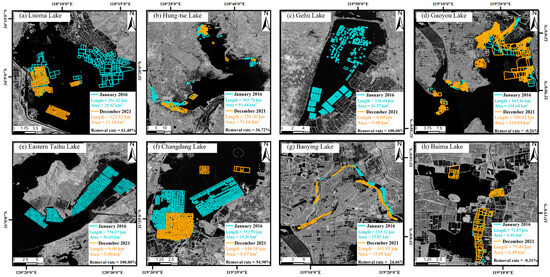
Figure 7.
Comparison of the net–pen aquaculture range of the studied lakes between January 2016 and December 2021.
4.3. Dynamic Analysis of Net-Pen Aquaculture
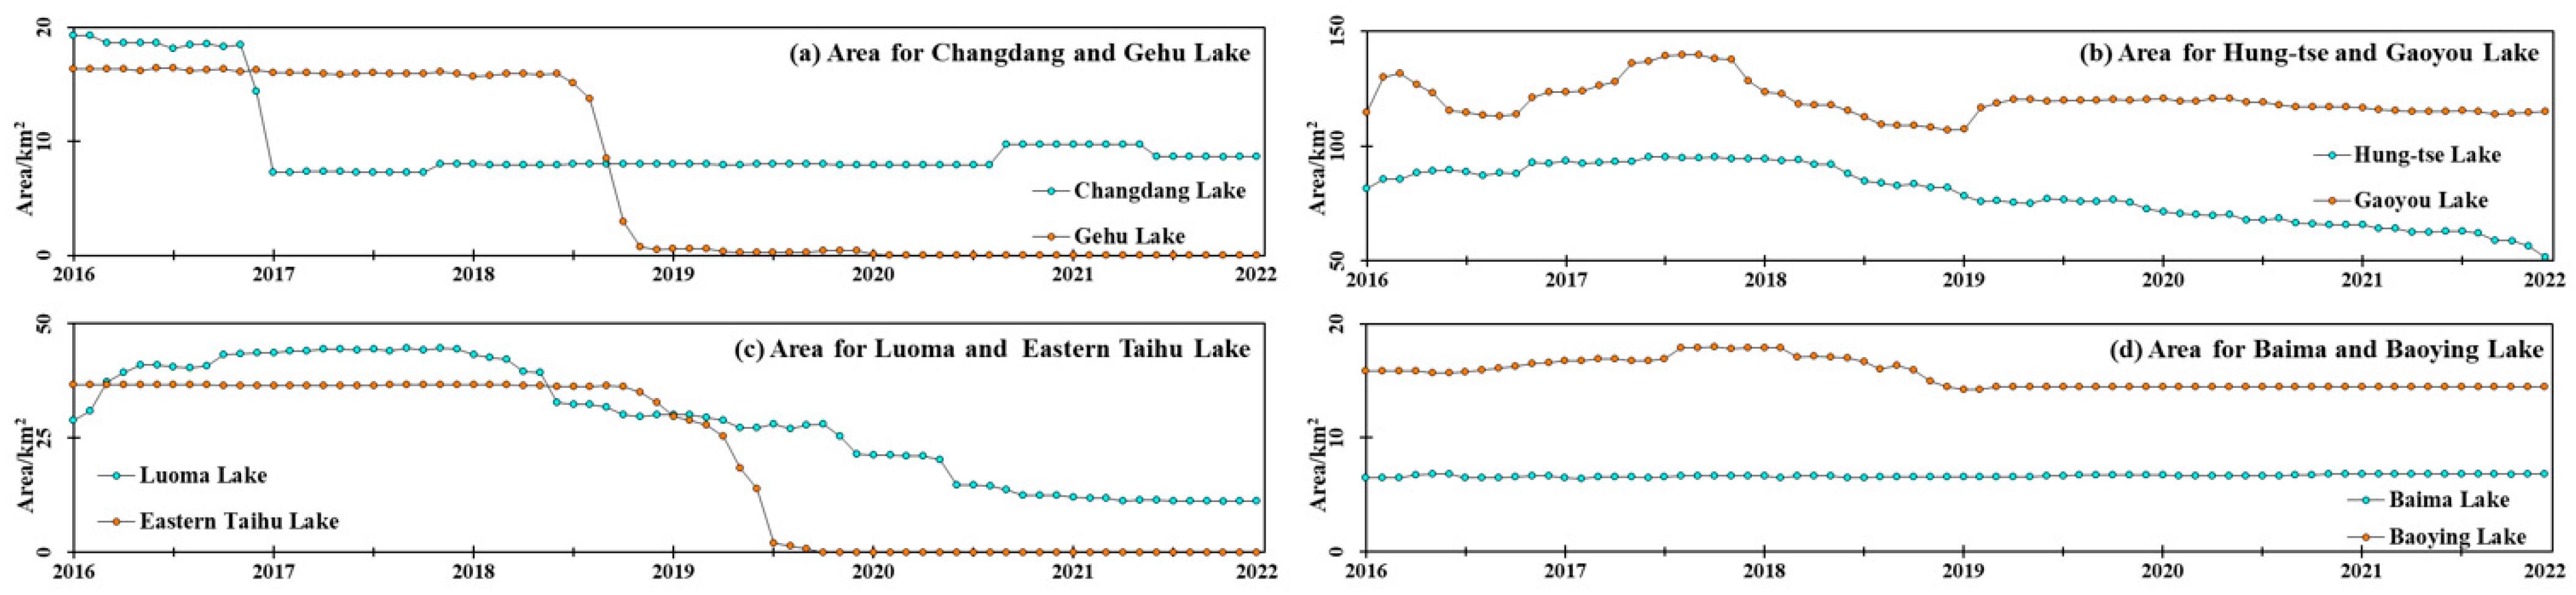
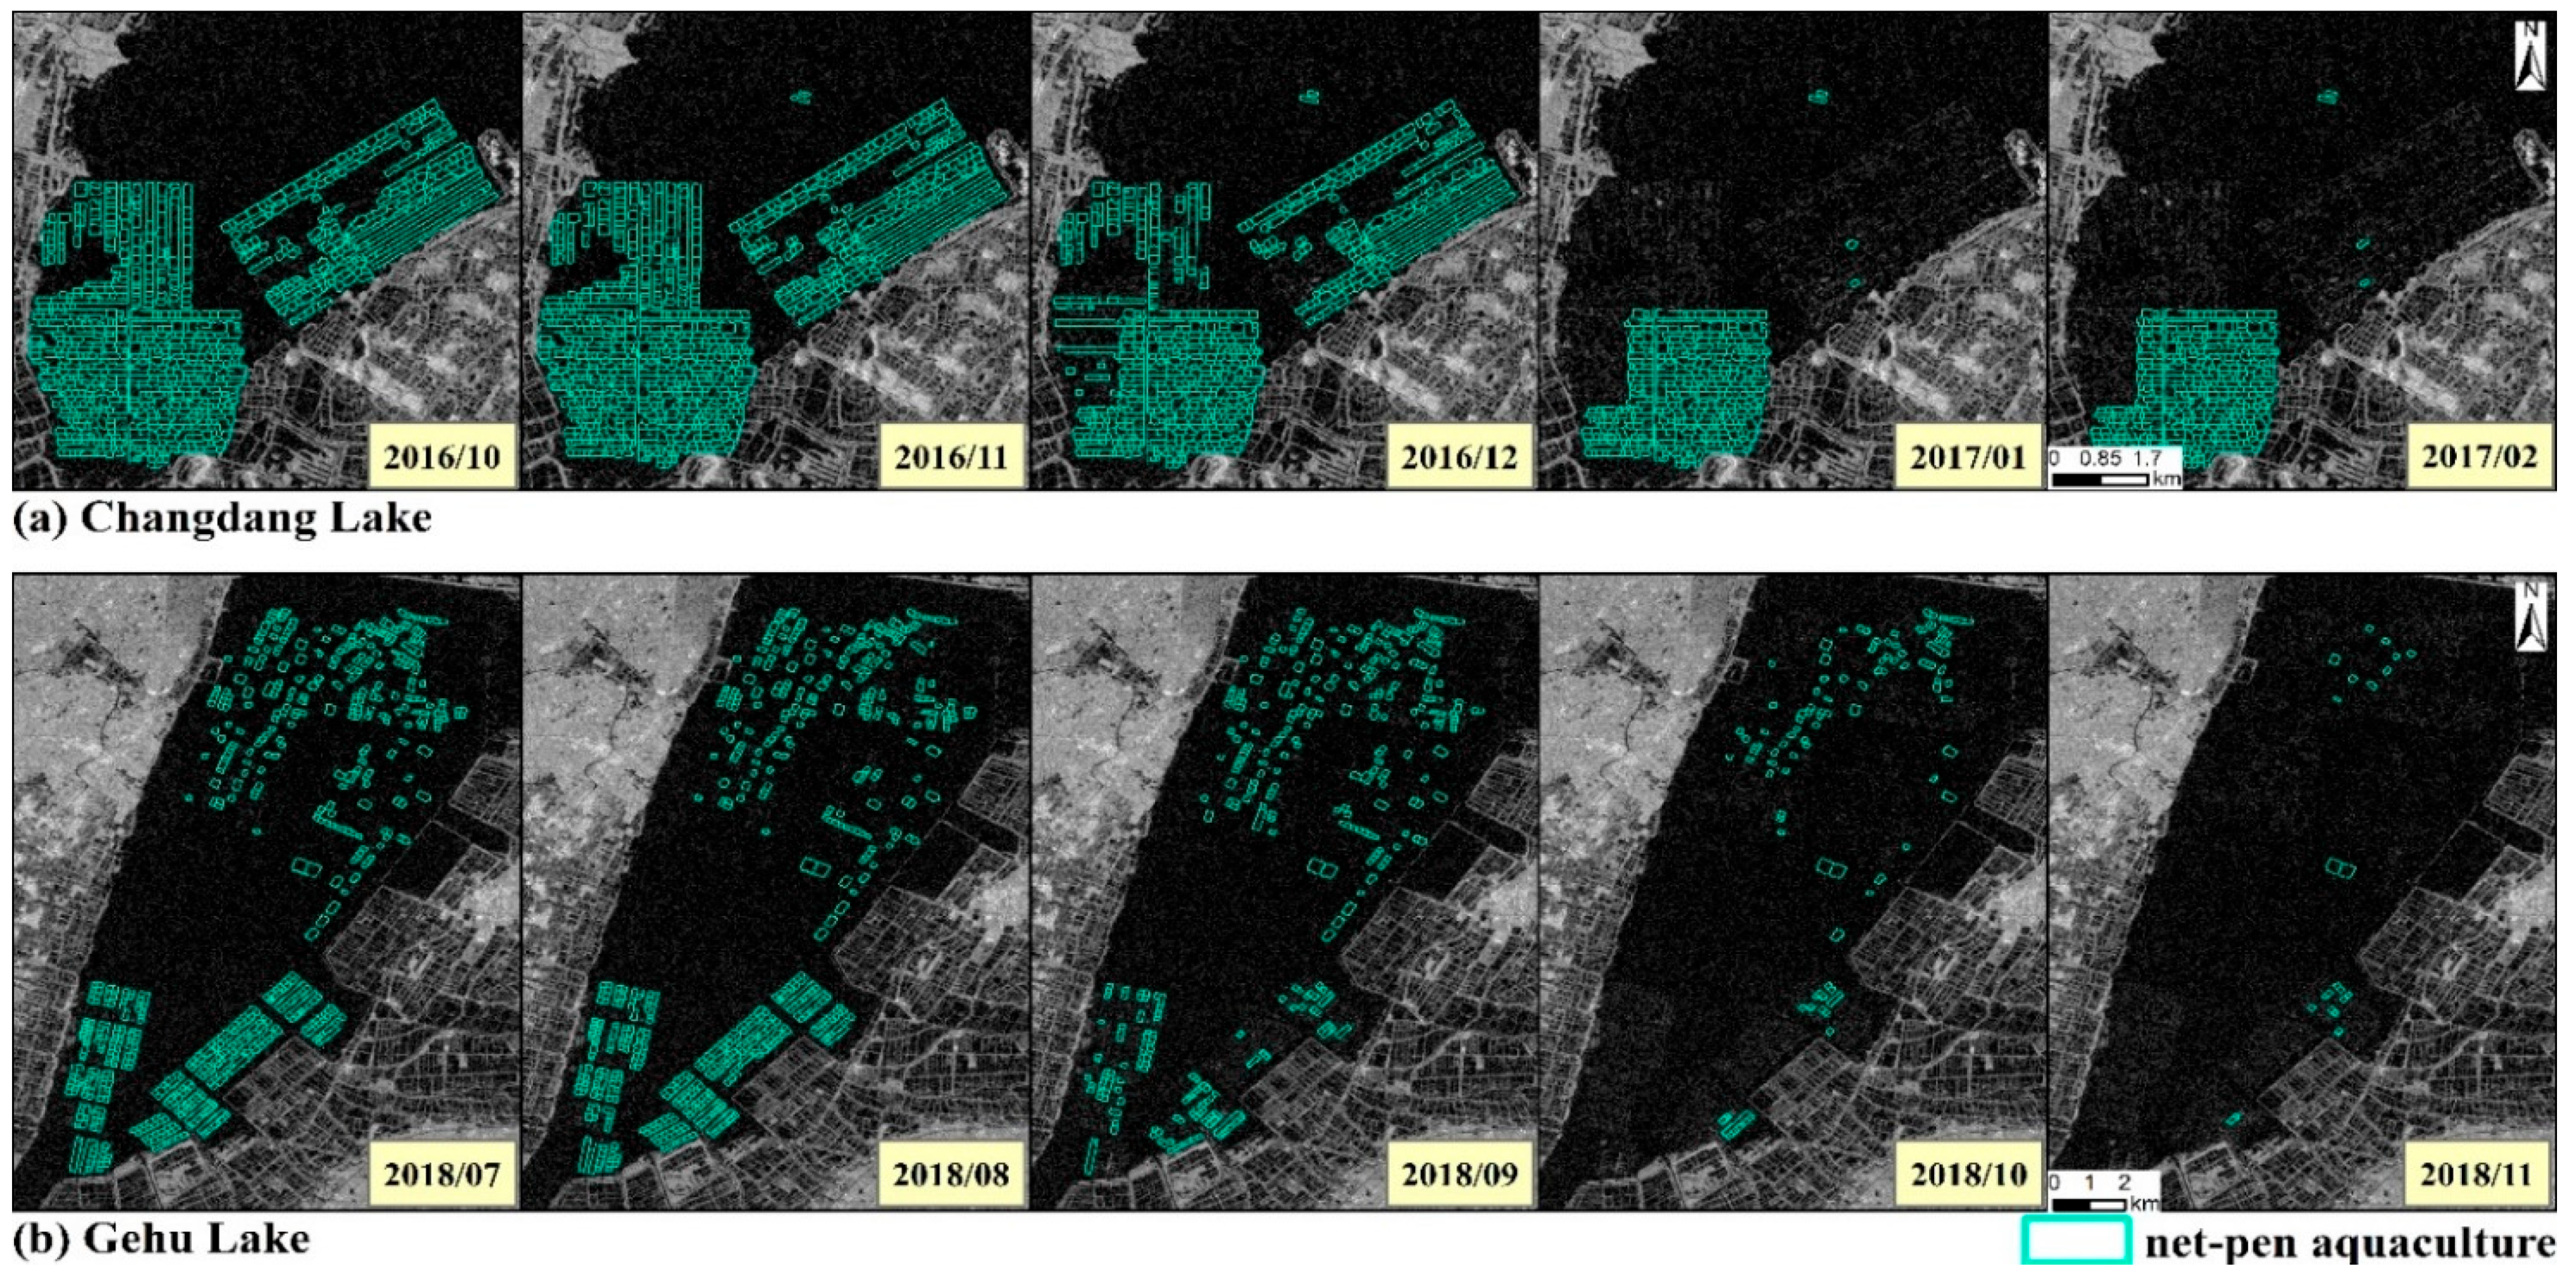
To delineate the spatio-temporal pattern of aquaculture changes in eight typical shallow lakes, we calculated the area of net-pen aquaculture in each lake at a monthly frequency. In addition, we compared the initial, maximum and recent values of FD and APEC indices and removal rate to assess changes in net-pen aquaculture across eight lakes. Figure 8 illustrates the distinct area change patterns of net-pen aquaculture in each lake. And the curves shown in Figure 8 facilitate the identification of key time points indicating changes in the area of net-pen aquaculture. Taking Changdang Lake and Gehu Lake as an example, Figure 9 illustrates the key points in time when the structure of net-pen aquaculture changed in the two lakes. Changdang Lake net-pen aquaculture began a rapid decline in November 2016, with the removal of fence structures in the eastern part of the lake and most of the net-pen aquaculture facilities in the southern part of the lake. Gehu Lake gradually removed the lake’s seine facilities over a five-month period beginning in July 2018. Figure 10 illustrates the changes in FD and APEC of different lakes.
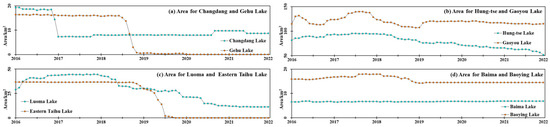
Figure 8.
Monthly dynamic change analysis of the net-pen aquaculture area of the study lake: (a) is area for Changdang Lake and Gehu Lake; (b) is area for Hung-tse Lake and Gaoyou Lake; (c) is area for Luoma Lake and Eastern Taihu Lake; (d) is area for Baima Lake and Baoying Lake.
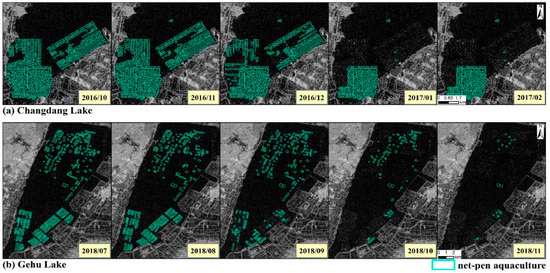
Figure 9.
The key temporal snapshots of the dismantling process of net-pen aquaculture in the shallow lakes of Jiangsu, China. (a) Changdang Lake; (b) Gehu Lake.
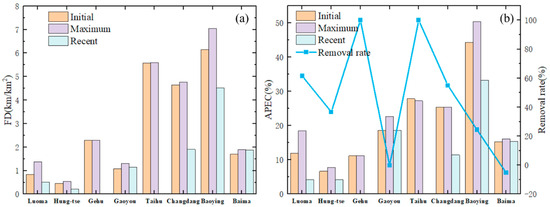
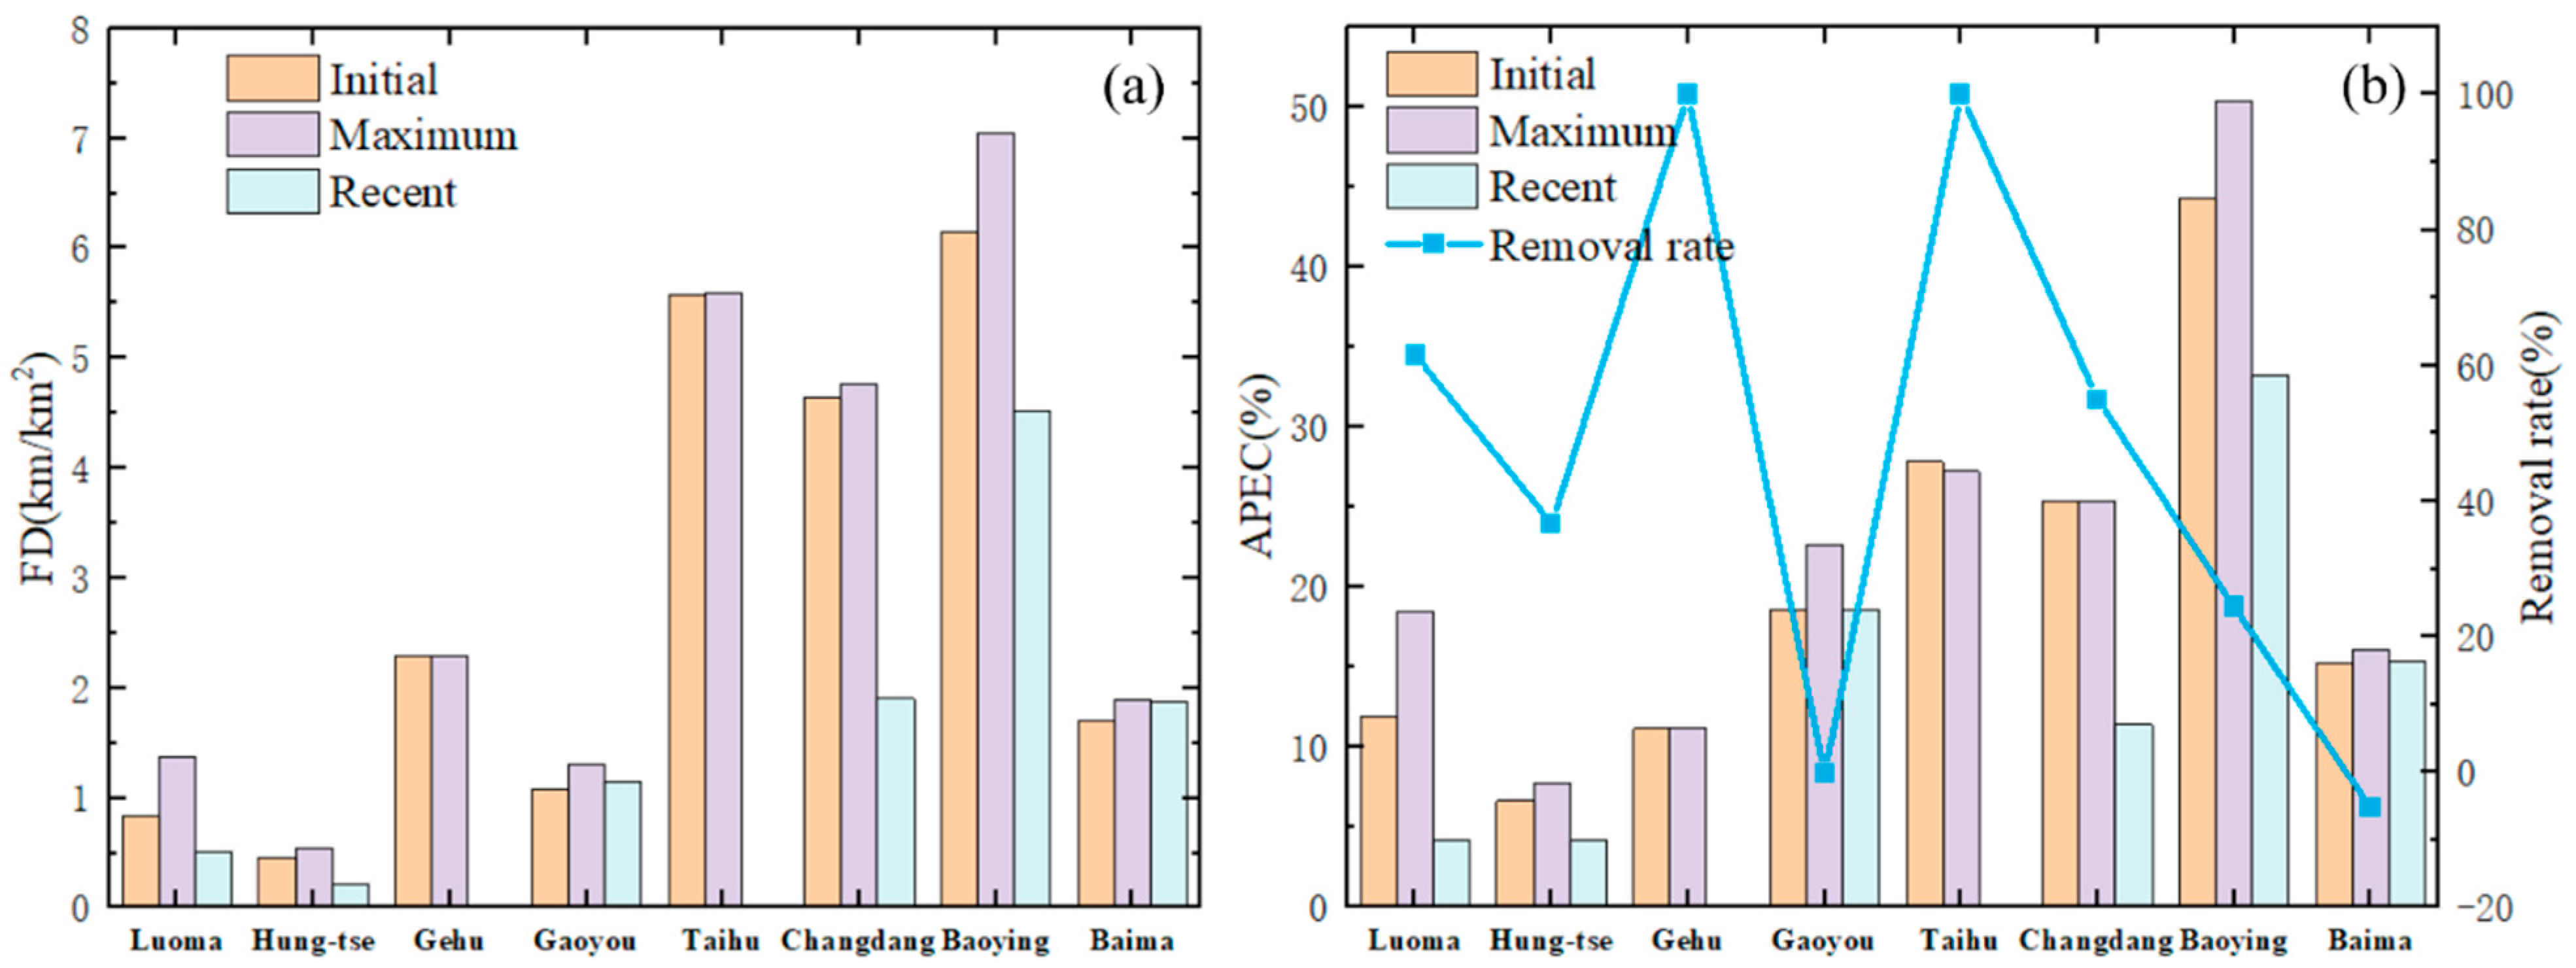
Figure 10.
The initial, maximum, and recent values of the lake net–pen aquaculture in the research sequence of FD and APEC coefficients. The line graph represents the removal rate of each lake; (a) displays the initial, maximum, and recent FD values for various lakes; (b) on the primary vertical axis shows the initial, maximum, and recent APEC values for the lakes, and the secondary vertical axis indicates the removal rate of net–pen aquaculture.
It can be observed that the area of net-pen aquaculture in Changdang Lake decreased rapidly from November 2016 to January 2017 and then stabilized over subsequent years. The FD value decreased from an initial 4.64 km/km2 to 1.90 km/km2, while the APEC value dropped from 25.35% to 11.41%. Similarly, a notable and rapid decline was observed in Gehu Lake and Eastern Taihu Lake. The area of net-pen aquaculture in Gehu Lake decreased rapidly from May to Novermber 2018. Its FD value decreased from an initial 2.29 km/km2 to 0, while the APEC value dropped from 11.17% to 0. The area of net-pen aquaculture in Eastern Taihu Lake decreased rapidly from September 2018 to September 2019. Its FD value decreased from an initial 5.57 km/km2 to 0, while the APEC value dropped from 27.84% to 0.
The areas of net-pen aquaculture in Luoma Lake, Hung-tse Lake and Baoying Lake exhibited a gentle upward trend before 2017, followed by a gradual decline after 2018. The FD value of Luoma Lake decreased from an initial 0.81 km/km2 to 0.51 km/km2, while the APEC value dropped from 11.94% to 4.21%. The FD value of Hung-tse Lake decreased from an initial 0.46 km/km2 to 0.21 km/km2, while the APEC value dropped from 6.64% to 4.20%. The FD value of Baoying Lake decreased from an initial 0.46 km/km2 to 0.21 km/km2, while the APEC value dropped from 44.29% to 33.27%.
In contrast, Gaoyou Lake and Baima Lake demonstrated different changes in their net-pen aquaculture activities, with no observable decreases of aquaculture area found in recent years. Both the FD and APEC value of these two lakes had a small increase. The FD value of Gaoyou Lake increased from an initial 1.08 km/km2 to 1.15 km/km2, while the FD value of Baima Lake rose from 1.70 km/km2 to 1.88 km/km2. This indicates that between 2016 and 2021, the net-pen structures in Baima Lake and Gaoyou Lake slowly became denser.
5. Discussion
5.1. Response of Net-Pen Aquaculture Activities to the Policy
By utilizing a dense time series of SAR images, we observed a decrease in both the aquaculture areas and fence lengths for most lakes over these years. However, the crucial time points indicating changes in the net-pen aquaculture area varied among them. The enclosure fence removal appears to be in response to the relevant river and lake management policies. In 2015, China’s State Council introduced the Plan for Promoting the Reform of the Ecological Civilization System, aimed at mitigating the environmental impact of human activities and preserving ecological balance. Focusing on lakes and rivers, the State Council fully implemented the Long River System policy decisions in 2016. This framework emphasized the necessity of dismantling illegal fisheries and net-pen aquaculture operations in the province’s lakes to mitigate eutrophication and restore their original ecological structure. In 2017, Jiangsu Province issued the Ecological River and Lake Action Plan, which mentioned reducing the aquaculture area of rivers and lakes throughout the province to effectively improve the ecological quality of rivers and lakes. In 2018, Jiangsu Province put forward the “Jiangsu Provincial Lake Protection Regulations. The research results suggest that the effectiveness of enforcing these regulations varied noticeably between the eight lakes, as evidenced with the removal rate and critical time points.
As demonstrated in the removal rates of the net-pen aquaculture in the eight lakes by the end of 2021 (see Table 3), the policy implementation in the different lakes was site-specific. Using Landsat data, the removal rates in Gehu Lake and Eastern Taihu Lake reached 100%, and the years in which they reached 100% were consistent with the results of Yin et al. [20]. However, they only calculated the annual changes in the area of polders, paddocks, and free water surfaces, and could not derive the key time points and net-pen aquaculture changes in the lakes. In particular, the net-pen aquaculture area in Gehu Lake was reduced from 16.37 km2 to 0.72 km2 in 5 months (see Figure 9b), with a rapid reduction rate of 3.13 km2/m. The net-pen aquaculture area in the Eastern Taihu Lake decreased from 36.69 km2 to 0 km2 in one year, at a rate of 3.06 km2/m.
The removal rate was over 50% in Luoma Lake and Changdang Lake. Among them, the net-pen aquaculture in Luoma Lake declined from 28.92 km2 to 11.14 km2 after first rising and then falling over a period of 6 years, with a decline rate of 0.25 km2/m and a removal rate of 61.48%. The removal rates from the net-pen aquaculture in Changdang Lake increased sharply at the end of 2016 and reached a peak value in the following year (see Figure 9a). The net-pen aquaculture area decreased from 18.44 km2 in November 2016 to 7.24 km2 in January 2017, with a reduction rate of approximately 5.60 km2/km. As of December 2021, the removal rate reached 54.98%. It can be noted that the net-pen culture area in Changdang Lake increased in November 2017 compared to the previous month and then remained stable in 2018 (see Figure 8). Dai et al. [15] similarly found an increase in the enclosure fisheries area in Changdang Lake in 2018 compared to 2017 using Sentinel-1. However, setting the time range only to years for describing these changes fails to capitalize on the advantages of Sentinel-1’s short revisit period and its independence from weather. Yin et al. [20] et al. found that Changdang Lake had a removal rate of over 60% in 2022, suggesting that Changdang Lake is still responding to the national policy of the further removal and standardization of the net-pen aquaculture after 2021.
In comparison, the removal rates of Hung-tse Lake and Baoying Lake were 36.72% and 24.46 respectively, with Hung-tse Lake showing a silght upward trend, with the net-pen aquaculture increasing from 81.64 km2 to 95.22 km2 and then decreasing to 51.66 km2 from mid-2017 to the end of 2021. In 2022, Du et al. [21] used Landsat data to construct a remote sensing estimation model of TSM (total suspended matter) concentration and measured the annual TSM change pattern in Hung-tse Lake. The turning point of TSM concentration coincided with the year of reduced net-pen aquaculture, which could be correlated with each other to a certain extent [22,23,24]. Similarly, Baoying Lake experienced a rise and then a fall before stabilizing, with the net-pen culture area decreasing from 15.82 km2 to 11.95 km2.
As an important lake crab aquaculture base in China, Gaoyou Lake’s net-pen aquaculture activity exhibits a more complex pattern. It initially experienced a rapid increase, followed by a fluctuating decrease, and then a gradual climb back to peak levels. From December 2017 to December 2018, the removal of the unreasonable net-pen aquaculture facilities from the lake surface led to a noticeable decline in the aquaculture area. Since then, there has been a moderate resumption of standardized net-pen aquaculture activities, and the net-pen aquaculture area on the lake’s water surface has been maintained. Additionally, there was no observable change in the aquaculture area in Baima Lake from 2016 to 2021.
In addition to removal rates, the response times varied among the eight lakes (see Figure 8). Changdang Lake was the first lake to respond to the national and provincial policiies. The lake was able to meet the local rectification needs and expectations outlined after the national policy, leading to the standardization and regulation of the scope of lake net-pen aquaculture. Gehu Lake (see Figure 9b) and Eastern Taihu Lake experienced a rapid decline in aquaculture areas from middle of 2018 to early 2019. As required by local policy, these two lakes quickly standardized and regulated net-pen aquaculture facilities, ultimately achieving the complete removal of such facilities from the lakes [25].
In contrast, Hung-tse Lake, Luoma Lake, and Baoying Lake responded relatively slowly to the policy due to their significant role and long history of aquaculture. Net-pen aquaculture facilities were gradually removed from these three lakes starting in 2018, but some still remained. There have been some delays in responding to the policy at Gaoyou Lake and Baima Lake; as of the year 2021, there has not been a response to the policy at either lake.
5.2. Prospects and Limitations of This Study
In this study, we employed Sentinel-1 SAR images to analyze the spatial distribution and changes in the net-pen aquaculture in representative shallow lakes in Jiangsu Province on a monthly basis. The results of this study validate the possibility of using SAR for extracting net-pen aquaculture structures in lakes include a dataset on the distribution and dynamics of net-pen aquaculture areas in shallow lakes of different sizes in Jiangsu Province, China and provide valuable lessons for other inland lakes experiencing aquaculture development and net-pen aquaculture in shallow lakes in the coastal areas. With the availability of radar satellites with higher temporal and spatial resolutions, the dynamic monitoring of net-pen aquaculture structures in shallow inland lakes over denser time series can be realized with the framework extracted in this paper. The extraction and production of datasets through a larger scale of the extent of purse seine aquaculture in shallow lakes can provide data support for policy development.
Ideally, ground truth data should be used to verify the accuracy of the extracted net-pen aquaculture results. However, obtaining sufficient field data is often impractical. Specifically, measuring the length or area of net-pen aquaculture is challenging due to these structures being situated on the lake surface. Therefore, to validate the accuracy and reliability of the SAR data extraction results, we utilized high-resolution satellite imagery data, which demonstrated excellent accuracy (see Table 3). Furthermore, agreements between dynamic changes of net-pen aquaculture and national or regional policies and regulations further demonstrated the validity of the results.
However, in some lakes, the stakes associated with net-pen aquaculture might not be removed in time when the aquaculture activities are discontinued, potentially delaying the identification of key time points indicating changes in the area of net-pen aquaculture, but this delay is typically limited to a month or two. Monitoring net-pen aquaculture dynamics of shallow lakes using satellite data is indeed more convenient than conducting manual surveys or relying on vessel-based Global Positioning System (GPS) measurements. The dynamic analysis results will be valuable for lake management and ensuring the effective implementation of related policies.
6. Conclusions
In this study, we focused on eight representative shallow lakes in Jiangsu Province as the research area and analyzed the distributions and dynamics of net-pen aquaculture using Sentinel-1 time-series images from 2016 to 2021. By integrating threshold segmentation and temporal consistency checks, an automated method for monthly monitoring of net-pen aquaculture dynamics has been developed. The following conclusions have been drawn:
- (1)
- The VH polarization image is effective in separating the lake water surface from surrounding aquaculture ponds, while the VV polarization image is suitable for net-pen aquaculture extraction. Temporal consistency checking can help alleviate the problem of distinguishing between changes in errors caused by misclassification and actual changes that have occurred. A monthly dataset spanning from 2016 to 2021 regarding the net-pen aquaculture structure was obtained using the proposed method. The overall accuracy of the net-pen aquaculture extraction results was over 85%.
- (2)
- The spatio-temporal pattern of aquaculture changes in eight typical shallow lakes located in Jiangsu Province was accurately described utilizing multi-temporal SAR imagery, thereby overcoming optical imagery limitations. This approach not only enables the analysis of changes in the aquaculture area and fence length but can also identify key time points.
- (3)
- The removal of net-pen aquaculture in lakes within the Jiangsu Province is primarily attributed to policy responses. In response to the ecological river and lake action plan implemented in Jiangsu Province, a decrease was observed in both the aquaculture areas and fence lengths across most lakes from 2016 to 2021.
Author Contributions
H.D.: conceptualization, investigation, data curation, validation, writing—original draft. K.X.: conceptualization, funding acquisition, supervision, writing—review and editing. C.L.: supervision, writing—review and editing. J.Y.: supervision, writing—review and editing. All authors have read and agreed to the published version of the manuscript.
Funding
This research was funded by Key Laboratory of Land Satellite Remote Sensing Application, Ministry of Natural Resources of the People’s Republic of China (Grant No. KLSMNR-K202209), the Fundamental Research Funds for the Central Universities (Grant No. B220202052), and Jiangsu Agricultural Science and Technology Innovation Fund (Grant No. CX (22)2001).
Data Availability Statement
Data openly available in a public repository.
Acknowledgments
We gratefully acknowledge the funders of this study.
Conflicts of Interest
The authors declare no conflicts of interest.
References
- Food and Agriculture Organization (FAO). Fishery and Aquaculture Statistics 2019; FAO: Roma, Italy, 2021. [Google Scholar]
- Edwards, P. Aquaculture environment interactions: Past, present and likely future trends. Aquaculture 2015, 447, 2–14. [Google Scholar] [CrossRef]
- Kang, B.; Huang, X.; Li, J.; Liu, M.; Guo, L.; Han, C.-C. Inland Fisheries in China: Past, Present, and Future. Rev. Fish. Sci. Aquac. 2017, 25, 270–285. [Google Scholar] [CrossRef]
- Wang, R.; Zhang, Y.; Xia, W.; Qu, X.; Xin, W.; Guo, C.; Bowker, J.; Chen, Y. Effects of Aquaculture on Lakes in the Central Yangtze River Basin, China, I. Water Quality. N. Am. J. Aquac. 2018, 80, 322–333. [Google Scholar] [CrossRef]
- Veenstra, J.; Nolen, S.; Carroll, J.; Ruiz, C. Impact of net pen aquaculture on lake water quality. Water Sci. Technol. 2003, 47, 293–300. [Google Scholar] [CrossRef] [PubMed]
- Zang, C.; Huang, S.; Wu, M.; Du, S.; Scholz, M.; Gao, F.; Lin, C.; Guo, Y.; Dong, Y. Comparison of Relationships Between pH, Dissolved Oxygen and Chlorophyll a for Aquaculture and Non-aquaculture Waters. Water Air Soil Pollut. 2011, 219, 157–174. [Google Scholar] [CrossRef]
- Zhang, H.; Kang, M.; Shen, L.; Wu, J.; Li, J.; Du, H.; Wang, C.; Yang, H.; Zhou, Q.; Liu, Z.; et al. Rapid change in Yangtze fisheries and its implications for global freshwater ecosystem management. Fish Fish. 2020, 21, 601–620. [Google Scholar] [CrossRef]
- Alexandridis, T.K.; Topaloglou, C.A.; Lazaridou, E.; Zalidis, G.C. The performance of satellite images in mapping aquacultures. Ocean Coast. Manag. 2008, 51, 638–644. [Google Scholar] [CrossRef]
- Gusmawati, N.; Soulard, B.; Selmaoui-Folcher, N.; Proisy, C.; Mustafa, A.; Le Gendre, R.; Laugier, T.; Lemonnier, H. Surveying shrimp aquaculture pond activity using multitemporal VHSR satellite images–case study from the Perancak estuary, Bali, Indonesia. Mar. Pollut. Bull. 2018, 131, 49–60. [Google Scholar] [CrossRef]
- Peng, Y.; Sengupta, D.; Duan, Y.; Chen, C.; Tian, B. Accurate mapping of Chinese coastal aquaculture ponds using biophysical parameters based on Sentinel-2 time series images. Mar. Pollut. Bull. 2022, 181, 113901. [Google Scholar] [CrossRef]
- Jiang, Y.-H.; Zhang, G.; Tang, X.-M.; Li, D.; Huang, W.-C.; Pan, H.-B. Geometric Calibration and Accuracy Assessment of ZiYuan-3 Multispectral Images. IEEE Trans. Geosci. Remote Sens. 2014, 52, 4161–4172. [Google Scholar] [CrossRef]
- Ottinger, M.; Clauss, K.; Kuenzer, C. Large-Scale Assessment of Coastal Aquaculture Ponds with Sentinel-1 Time Series Data. Remote Sens. 2017, 9, 440. [Google Scholar] [CrossRef]
- Liu, C.; Xu, J.; Wang, D.; Yu, J. Extracting aquaculture pond using multi-feature optimization of GF-3 PolSAR Imagery. Trans. Chin. Soc. Agric. Eng. 2022, 38, 206–214. [Google Scholar] [CrossRef]
- Han, Y.; Huang, J.; Ling, F.; Qiu, J.; Liu, Z.; Li, X.; Chang, C.; Chi, H. Dynamic Mapping of Inland Freshwater Aquaculture Areas in Jianghan Plain, China. IEEE J. Sel. Top. Appl. Earth Obs. Remote Sens. 2023, 16, 4349–4361. [Google Scholar] [CrossRef]
- Dai, Y.; Feng, L.; Hou, X.; Choi, C.Y.; Liu, J.; Cai, X.; Shi, L.; Zhang, Y.; Gibson, L. Policy-driven changes in enclosure fisheries of large lakes in the Yangtze Plain: Evidence from satellite imagery. Sci. Total Environ. 2019, 688, 1286–1297. [Google Scholar] [CrossRef] [PubMed]
- Torres, R.; Snoeij, P.; Geudtner, D.; Bibby, D.; Davidson, M.; Attema, E.; Potin, P.; Rommen, B.; Floury, N.; Brown, M.; et al. GMES Sentinel-1 mission. Remote Sens. Environ. 2012, 120, 9–24. [Google Scholar] [CrossRef]
- Zhang, Q.; Li, L.; Sun, R.; Zhu, D.; Zhang, C.; Chen, Q. Retrieval of the Soil Salinity from Sentinel-1 Dual-Polarized SAR Data Based on Deep Neural Network Regression. IEEE Geosci. Remote Sens. Lett. 2022, 19, 1–5. [Google Scholar] [CrossRef]
- Otsu, N. A threshold selection method from gray-level histogram. IEEE Trans. Syst. Man Cybern. 1979, 9, 62–66. [Google Scholar] [CrossRef]
- Li, X.; Gong, P.; Liang, L. A 30-year (1984–2013) record of annual urban dynamics of Beijing City derived from Landsat data. Remote Sens. Environ. 2015, 166, 78–90. [Google Scholar] [CrossRef]
- Yin, Y.; Gao, M.; Cao, X.; Wei, J.; Zhong, X.; Li, S.; Peng, K.; Gao, J.; Gong, Z.; Cai, Y. Restore polder and aquaculture enclosure to the lake: Balancing environmental protection and economic growth for sustainable development. Sci. Total Environ. 2024, 933, 173036. [Google Scholar] [CrossRef]
- Du, C.; Li, Y.; Lyu, H.; Shi, K.; Liu, N.; Yan, C.; Pan, J.; Guo, Y.; Li, Y. Characteristics of the Total Suspended Matter Concentration in the Hongze Lake during 1984–2019 Based on Landsat Data. Remote Sens. 2022, 14, 2919. [Google Scholar] [CrossRef]
- Jiang, Z.; Liao, Y.; Liu, J.; Shou, L.; Chen, Q.; Yan, X.; Zhu, G.; Zeng, J. Effects of fish farming on phytoplankton community under the thermal stress caused by a power plant in a eutrophic, semi-enclosed bay: Induce toxic dinoflagellate (Prorocentrum minimum) blooms in cold seasons. Mar. Pollut. Bull. 2013, 76, 315–324. [Google Scholar] [CrossRef]
- Alongi, D.M.; McKinnon, A.D.; Brinkman, R.; Trott, L.A.; Undu, M.C. The fate of organic matter derived from small-scale fish cage aquaculture in coastal waters of Sulawesi and Sumatra, Indonesia. Aquaculture 2009, 295, 60–75. [Google Scholar] [CrossRef]
- Pan, X.; Wang, Z.; Ullah, H.; Chen, C.; Wang, X.; Li, X.; Li, H.; Zhuang, Q.; Xue, B.; Yu, Y. Evaluation of Eutrophication in Jiaozhou Bay via Water Color Parameters Determination with UAV-Borne Hyperspectral Imagery. Atmosphere 2023, 14, 387. [Google Scholar] [CrossRef]
- Wang, Y.W.; Xu, J.; Li, J.Y.; Liu, J.E. Changes of Aquatic Vegetation and Water Quality after removal of Pen Aquaculture in Lake East Taihu. J. Ecol. Rural Environ. 2022, 38, 104–111. (In Chinese) [Google Scholar] [CrossRef]
Disclaimer/Publisher’s Note: The statements, opinions and data contained in all publications are solely those of the individual author(s) and contributor(s) and not of MDPI and/or the editor(s). MDPI and/or the editor(s) disclaim responsibility for any injury to people or property resulting from any ideas, methods, instructions or products referred to in the content. |
© 2024 by the authors. Licensee MDPI, Basel, Switzerland. This article is an open access article distributed under the terms and conditions of the Creative Commons Attribution (CC BY) license (https://creativecommons.org/licenses/by/4.0/).