Abstract
Quantifying evapotranspiration (ET) is crucial for a valid understanding of the global water cycle and for the precise management of the resource. However, accurately estimating ET, especially at large scales, has always been a challenge. Over the past five decades, remote sensing has emerged as a cost-effective solution for estimating ET at regional and global scales. Numerous models have been developed, offering valuable insights into ET dynamics, allowing for large-scale, accurate, and continuous monitoring while presenting varying degrees of complexity. They mainly belong to two categories despite the variability of their empirical or physical components: temperature and conductance-based models. This comprehensive review synthesizes the fundamental theories and development history of the most used temperature-based models. It focuses on this specific category to maintain conciseness and prevent extended work. It describes the approaches used and presents the chronology of the modifications made and suggested by researchers. Moreover, it highlights the validation studies and the models’ advantages and drawbacks. The review addresses the long-standing challenge of accurately quantifying evapotranspiration at different scales, offers a retrospective comparative analysis spanning a 15-year period, and supports practitioners in selecting the most appropriate model for a specific set of conditions. Moreover, it discusses advancements in satellite missions, such as the Copernicus Space Component and Landsat Next, and their impact on enhancing ET estimation models.
1. Introduction
Evapotranspiration (ET), the combined process of evaporation and transpiration, is an essential component of the water cycle [1]. Therefore, an accurate estimation of ET is crucial to achieving efficient and sustainable water resource management [2,3]. ET refers to the process by which water changes from a liquid to a gaseous state from different surfaces, including plants, soil, and open water bodies. Transpiration, on the other hand, refers to the water released mainly by the plant leaves after being extracted by roots [4,5]. However, according to [6], quantification of ET has always been difficult due to an imperceptible process exclusively in an ecosystem or a watershed spatial scale with the desired level of accuracy.
Estimating evapotranspiration involves direct and indirect methods. The most accurate methods are the direct or on-site measurements (i.e., lysimeter, eddy covariance, sap flow) [7]. For large-scale areas, hence, over a non-homogeneous area, a variety of surface accessory measurements are needed. On-site measurements are expensive and are mainly used to calibrate other ET estimation methods [8]. Remote sensing (RS) is recognized as the only reliable, cost-effective, and practical technology for mapping regional and mesoscale ET using surface radiances and surface energy balance components [9,10]. The significant advantages of this technology compared to conventional methods can be summarized in three main points: (1) vast and continuous spatial coverage, (2) cost-effectiveness, and (3) monitoring where man-made measurements are difficult or unavailable [11].
Relying on RS, many models were developed for ET estimation. They range from simple models requiring data about the average temperature of air, length of the day, and development stage of the crop to complex models requiring more data such as daily radiation, temperature, vapor pressure, wind velocity, etc. There is not a distinctive model that can be used in all the conditions and not all of them are similarly reliable and accurate for different regions, thus, different climatological conditions.
Solar radiation plays a key role in the field of remote sensing. It consists of various components, and understanding these components is important for accurately estimating the energy inputs that drive evapotranspiration. The partitioning of net solar radiation at the land surface includes sensible, latent, and ground heat fluxes (H, LE, and G, respectively). The ET process involving phase changing of water from liquid or solid to vapor, absorbs energy and cools the land surface. The accompanying energy to this process in known as latent heat. It is important to mention that conventional techniques like eddy covariance (EC) have often been used to measure the ecosystem–atmosphere exchange of water vapor and sensible heat, but they do not offer spatial distribution on a regional scale and are primarily employed for validation purposes [12,13,14].
Remote sensing models for ET estimation are varied. Classifying them enables us to address their complexity and diversity and consequently select the most suitable for the specific environmental conditions, considering the data availability. Classification also supports the comparative analysis of the models, allows for the evaluation of their performance, identifies advantages and drawbacks, promotes advanced research in specific categories, simplifies communication, and enhances understanding among a broader audience. However, it remains a challenging task, as the complexity is determined by the interplay of their empirical and physical components [15]. This study considers two main categories of models: temperature-based and conductance-based models. Temperature-based ET models use land surface temperature (LST) from thermal remote sensing to calculate the sensible heat flux and estimate the latent heat flux as a residual of the surface energy balance from which ET is derived. Alternatively, LST can be used to estimate the evaporative fraction, which is then used to derive ET [16]. On the other hand, conductance-based ET models typically employ the Penman–Monteith (P–M) equation, utilizing shortwave remote sensing data [17]. A crucial aspect of these models is the canopy conductance to water vapor, which is influenced by factors such as canopy structure and leaf stomatal conductance. Canopy structural parameters are determined using shortwave remote sensing data, and stomatal conductance can be estimated through various methods. By linking the carbon and water cycles, the stomatal conductance can be consistently derived from the plant’s photosynthesis rate [18].
Within the temperature-based category, three subclasses can be identified: one-source, two-sources, and contexture-based models. One-source models integrate soil and vegetation components into a unified component to estimate ET, while two-source models separately consider soil and vegetation inputs. Contexture-based models were designed to leverage the information derived from LST across areas with varying vegetation fractions (fv) through a vegetation index such as the Normalized Difference Vegetation Index (NDVI).
Recent contributions in the field of ET estimation have included comprehensive reviews that consolidate and analyze existing knowledge and methods. These reviews provide valuable insights into the strengths, limitations, and advancements in the field, helping to guide future research and application. Notable contributions include the works of [5,9,16,17,19].
Future Earth Observation missions show the technological advancement that is destined to come in the near future that will lead to more accurate results in the field of remote sensing related to ET estimation.
The paper starts by discussing the surface energy balance as a cornerstone in understanding variables related to ET and RS, focusing on components such as the sensible heat flux, ground heat flux, and latent heat flux. It then progresses to explore temperature-based ET models, including single-source and two-source surface energy balance and contexture-based ET models, detailing their advantages, drawbacks, and the evolution of research in this area. Subsequently, it delves into the intercomparison of these models through the related studies that were performed during the last fifteen years. Following, emerging earth observation missions and advancements in the field are discussed.
By contributing to the consolidation of core theories and tracing the evolution of temperature-based evapotranspiration (ET) estimation methods, this study delves into the concept of surface energy balance. It underscores the significance of validation studies and enhancements conducted by researchers. Through a comparative analysis of the strengths and limitations of these methods, this effort aims to provide a solid foundation for future progress in the field.
2. The Surface Energy Balance: A Cornerstone in Understanding ET and RS Derived Variables
Enhancing the comprehension of the connections between ET and remotely sensed derived variables entails providing a concise overview of the energy balance.
It is important to note that this overview does not cover extensively all aspects, as it specifically focuses on commonly utilized models. For a more comprehensive understanding of specific concepts, readers can refer to exhaustive overviews [9,16].
The surface energy balance equation is a fundamental concept in studying the exchange of energy at the Earth’s surface. Accounting for four components, the equation can be expressed as follows:
where
- is the net radiation represented as the sum of net downward and upward shortwave and longwave radiation ();
- H refers to the sensible heat flux representing the transfer of heat between the surface and the atmosphere ();
- G is the ground or soil heat flux, which represents the transfer of heat into or out of the ground ()
- LE represents the latent heat flux, which accounts for the energy used during evapotranspiration processes ()
- () accounts for the heat storage in biomass and canopy air space that is often neglected in calculations [9].
2.1. The Net Radiation ()
is the total heat energy resulting from the combination of net downward shortwave radiation and net longwave radiation that represent, respectively, the balance between incoming and outgoing short-wave and long-wave radiations. is expressed as follows:
where α is the surface shortwave albedo, that is, the fraction of incoming shortwave radiation reflected by the surface. , often referred to as insolation, measures the amount of solar radiation received by a specific surface area. It encompasses the incident solar radiation, which can be either the photosynthetically active radiation within the visible spectrum or the total shortwave radiation. (W·m−2). and are, respectively, the atmospheric and the surface emissivity. σ is the Stefan-Boltzmann constant (W·m−2·K−4). and are, respectively, the air and surface temperature (K).
2.2. The Sensible Heat Flux (H)
The sensible heat flux refers to the rate at which heat is transferred to the air through convection and conduction, resulting from the difference between the air and the surface temperature. The magnitude of H relies heavily on both the temperature difference between the surface and the air, and the resistance of the surface to heat transfer. Unlike one-source, two-source surface energy balance models consider the separate contributions of soil and canopy to the overall heat flux. Early studies played an important role in the development of these models. Notable examples of the initial two-source surface energy balance models include the Two-Source Model introduced by [20].
In the case of the single source approach, the calculation of H implies considering one source resistance resulting from both the soil and the canopy. The formula for calculating H under these circumstances is expressed as follows:
where is the air density (kg·m−3), is the specific heat of the air (J·kg−1·K−1), is the aerodynamic surface temperature (K) and is the aerodynamic convective resistance to heat (s/m).
In two source models, H is often computed as the sum of canopy sensible heat and soil sensible heat that are estimated as follows [20].
where and are, respectively, the canopy and non-vegetated soil temperatures, is the air temperature in the canopy air layer. and are the soil resistance and the boundary layer resistance associated with the canopy, respectively. Both single and two source models’ concept is illustrated in Figure 1.
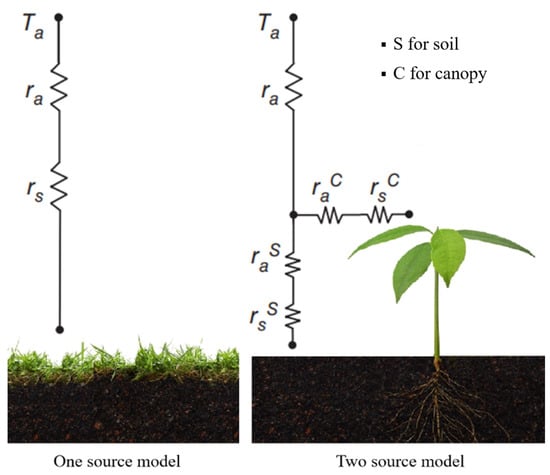
Figure 1.
Surface and aerodynamic resistance for one-source and two-source surface energy balance models.
2.3. The Ground Heat Flux
The computation of soil heat flux involves analyzing the change in soil temperature and the soil heat capacity within the profile. Generally, the transfer of heat within the soil is minimal in planar directions and is primarily significant in the vertical direction [21]. Therefore, it is practical to focus on the vertical heat transfer. The calculation of G can be performed using the following equation:
Knowing that refer to the rate of soil temperature change, and are the soil’s density (kg·m−3) and specific heat (J·kg−1·K−1), respectively. The specific heat of soil is significantly influenced by various soil properties, particularly its composition materials and the soil water content.
2.4. The Latent Heat Flux (LE)
The energy required for the ET process is commonly referred to as the latent heat flux. It represents the rate at which heat is lost from the surface due to evapotranspiration. LE is typically obtained as a residual from the surface energy balance equation and is linearly related to the ET rate. It can be calculated using the formula provided in [22].
The value of λ, representing the latent heat of vaporization of water, is temperature-dependent and is usually assumed to be 2.45 × 10⁶ J/kg at a temperature of 20 °C [5].
3. Temperature-Based ET Models: Advantages, Drawbacks, and Evolution of Research
These models use thermal remote sensing data provided as LST to estimate H and derive LE as a residual of the surface energy balance equation. This latter is then used to estimate ET. Temperature-based ET models are of different complexity levels and might be categorized as either single-source or two-source models, depending on how the contributions of soil and canopy to the overall heat flux were considered. Additionally, simplified methods were introduced. These methods involve defining a geometric shape, typically a triangle or trapezoid, formed using LST and a vegetation index (VI) or vegetation fraction. By determining the evaporative fraction within this space, ET can be estimated. These methods provide a simplified yet practical way to estimate ET without the need for complex models. However, they may have limitations in capturing the full complexity of ET processes compared to more advanced models. Figure 2 illustrates the chronological development of the listed models.
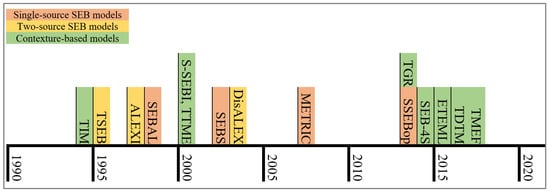
Figure 2.
Chronological Development of the most known temperature-based ET Models.
3.1. Single-Source Surface Energy Balance Models
Single-source surface energy balance models are based on the principle of focusing on a predominant surface type when estimating H. In this context, the term “single source” implies assuming relative homogeneity in surface properties, enabling simplified calculations. Despite the complexity of the actual environment with its diverse land cover types, employing a single-source approach offers a practical and manageable method for estimating ET. This Section provides a list of the well-known single-source surface energy balance models and the advancements and updates made over time.
3.1.1. The Surface Energy Balance System (SEBS)
The Surface Energy Balance System (SEBS) was proposed for estimating atmospheric turbulent fluxes and evaporative fraction using satellite and meteorological data, and various parameterizations. It incorporates a new kB−1 parameterization that considers canopy structure, adaptability to climate, and land cover variations [23]. In 2003, a modified version of SEBS incorporated radiometric data from the Along Track Scanning Radiometer (ATSR-2) to estimate atmospheric water vapor and aerosol optical depth. Sensible heat flux estimates from the modified SEBS were validated against measurements from large aperture scintillometers (LAS) in Spain [24]. SEBS was further evaluated using data from the Coordinated Enhanced Observing Period (CEOP), showing reasonable agreement at the tower scale but decreased accuracy with remotely sensed data and the Global Land Data Assimilation System (GLDAS) [25].
In 2009, Kwast et al. 2009 evaluated SEBS for evapotranspiration estimation on a landscape scale, observing underestimation in dry, sparsely vegetated areas [26]. Chen et al. 2013 identified biases in SEBS related to the parameterization of bare soil’s resistance to heat transfer and proposed a revised parameter to improve performance [27].
Chen et al. 2019, calibrated key parameters in the SEBS model using thermal remote sensing data, resulting in improved accuracy for evapotranspiration calculations [28]. In 2021, Hu et al. compared different approaches for accurate evapotranspiration estimation, with data-driven models outperforming SEBS [29]. Net radiation was crucial for all models, while temperature and humidity played a significant role in SEBS and a hybrid model.
Furthermore, Njuki et al. (2023) addressed the underestimation of sensible heat flux in tall forest canopies by proposing a revised parameterization that considered the effect of turbulence on canopy heat transfer [30]. Evaluation using flux tower sites showed a significant reduction in underestimation, making the revised parameterization suitable for mapping surface heat fluxes in tall forest canopies.
SEBS is often used for mapping surface turbulent heat fluxes due to its simplicity. Nevertheless, a common issue is the uncertainty in the parameter kB−1 that accounts for differences in heat sources and momentum sinks in representing aerodynamic resistance. SEBS uses a constant value for the foliage heat transfer coefficient in its parameterization of kB−1, which means that the impact of turbulence on canopy heat transfer is not considered. Consequently, the sensible heat flux in tall forest canopies where turbulence plays a crucial role in heat transfer is significantly underestimated. Hence, it is imperative to introduce a refined parametrization for kB−1 to enhance the precision of sensible heat flux estimations, particularly in ecosystems characterized by tall forest canopies, where an accurate representation of turbulence-induced effects on heat exchange is crucial.
3.1.2. The Simplified Surface Energy Balance (SSEB)
The SSEB model and its variations have undergone significant development and evaluation for estimating evapotranspiration in different regions. Initially applied in Afghanistan, the SSEB model successfully estimated ET in irrigated areas over multiple years, demonstrating good agreement with field reports and other models [31]. Further evaluations in the Southern High Plains and Texas showcased the accuracy of the SSEB approach in estimating ET, capturing a substantial portion of the measured ET variability while requiring minimal data [32,33].
The model was refined and assessed by leveraging the METRIC (the Mapping Evapotranspiration at High Resolution with Internalized Calibration) model as a reference. A comparative analysis of the evaporative fraction estimated by both models was conducted [34]. In regions characterized by relatively uncomplicated topography, the improved SSEB model demonstrated a robust agreement with the METRIC model, as indicated by a superior R2.
SSEB stands out as one of the most straightforward methods found in the literature for regional-scale mapping of ET. In an overall assessment, the performance of its approach exhibited levels of accuracy that are on par with other data-intensive techniques, such as SEBAL, as reported by Gowda et al. (2008) [33]. Nevertheless, the reliance of SSEB on ancillary data is minimal, and its proficiency in estimating ET in dryland regions is notable. However, in topographically intricate mountainous areas, where the variability in evaporative fractions is more pronounced, emerge the inherent challenges of adequately representing the intricate interplay of radiation and heat transfer processes on steep, irregular slopes using a simplified index model. This underscores the imperative for further extensive research endeavors in such environments.
3.1.3. The Simplified Surface Energy Balance Operational Application (SSEBop)
Building upon the SSEB model, SSEBop was developed by incorporating elevation and latitude effects on surface temperature. It has been parameterized for operational applications and utilized in estimating ET in the Colorado River Basin, showing promising outcomes [35,36,37].
Further assessments demonstrated SSEBop reliability for large-scale ET estimation, showcasing an R2 of 0.86 between estimated and measured ET with acceptable uncertainties [38]. The model’s performance was further enhanced by combining long-term ET estimates with SSEBop products, resulting in improved accuracy, especially in non-irrigated areas [39]. SSEBop was also successfully applied in estimating ET for irrigated wheat in the Cerrado region of Brazil, showing reliable results compared to the Bowen ratio method [40].
In China, SSEBop accuracy was validated, showing reliable estimations at different scales (site and basin) compared to eddy covariance data from ChinaFLUX stations. Moreover, the models performed well in simulating the spatiotemporal variation [41].
Utilizing Landsat thermal imagery and SSEBop in Google Earth Engine, ET was estimated and mapped over the conterminous United States (CONUS). The model demonstrated mixed performance in accuracy evaluation over two woody savanna sites, with a stronger correlation over well-vegetated areas [42]. Later, SSEBop was enhanced by relying on the Forcing and Normalizing Operation (FANO) algorithm, which improved parameterization and reduced biases in grassland and cropland ET estimations. The implementation on the two computing platforms, Google Earth Engine and Earth Resources Observation and Science Center, further improved the model accuracy, expanding its coverage for ET modeling [43].
The SSEBop analysis revealed more sensitivity to specific input variables, notably LST and ET0, as well as specific parameters, including differential temperature (dT) and maximum ET scalar (K-max) [38]. To further enhance the precision of SSEBop model estimates, it is crucial to address inaccuracies associated with these input variables and parameter refinement.
3.1.4. The Surface Energy Balance Algorithm for Land (SEBAL)
SEBAL, an approach based on the relationship between visible and thermal infrared (TIR) spectral radiances, estimates hydro-meteorological parameters empirically, demonstrating accurate surface flux ratios compared to instrumental inaccuracies. It operates independently of land cover and can handle TIR images at various resolutions [44]. Validation studies conducted in Spain, Niger, and China confirm SEBAL’s performance in diverse regions [44]. The method was further calibrated and validated in the Low–Middle Sao Francisco River basin, providing improved coefficients for local conditions and accurate daily ET estimates for mixed agricultural and natural ecosystems [45].
Sensitivity analysis reveals the importance of considering input variables, domain size, and sensor resolution in SEBAL’s estimation of H for large heterogeneous areas [46]. Moreover, a modified SEBAL model demonstrates applicability in the humid south-eastern United States, providing accurate estimates of consumptive water use using remote sensing methods [47]. Understanding the impact of changes in SEBAL, such as incorporating realistic heat transfer resistance, further refines ET estimation for different hydrological regimes [48].
Several studies have focused on enhancing the SEBAL model for improved ET estimation in various regions and conditions. A study introduced SEBAL-Advection (SEBAL-A), incorporating a component to account for advective conditions affecting ET. SEBAL-A demonstrated improved performance compared to the original model, particularly in arid and semi-arid regions [49]. In South Korea, a modified SEBAL model was calibrated using measured ET data from flux towers, showing a correlation between SEBAL and flux tower ET values with higher accuracy in rice paddy areas [50].
To automate the calibration process, an exhaustive search algorithm was introduced, enabling the identification of endmember pixels in SEBAL. The automated approach outperformed manual methods, reducing the time required for SEBAL application and allowing for wider usage [51]. Additionally, a SEBAL and Backtracking Search Algorithm-based model (SEBAL-BSA) addressed challenges with Landsat-8 data and hot-wet pixel selection, demonstrating high accuracy in mapping ET [52]. Moreover, some studies focused on specific aspects of SEBAL, such as incorporating soil moisture as an additional parameter for anchor pixel selection, which significantly improved ET estimation accuracy [53].
Overall, these studies collectively contribute to the refinement and applicability of the SEBAL model for accurate ET estimation in diverse regions and conditions. Modifications to the model, such as SEBAL-A, have improved ET estimation under advective conditions, making it particularly valuable in arid and semi-arid regions. Furthermore, SEBAL-A’s ability to account for advection using minimal weather data enhances its utility in such areas, even when hourly weather data are lacking. The model has also benefited from optimization techniques like the exhaustive search algorithm (ESA), which automates the selection of endmember pixels based on land surface temperature and vegetation index histograms. Compared to existing automated approaches, the ESA-based method demonstrates superior performance, offering full automation of SEBAL/METIC models and reducing potential bias in ET estimates for inexperienced users. However, it is essential to adapt SEBAL to changes in satellite image characteristics in current systems.
3.1.5. Mapping Evapotranspiration at High Resolution with Internalized Calibration (METRIC)
METRIC is a model that estimates ET based on the surface energy balance. It uses short-wave and long-wave data from satellite images, digital elevation models, and ground-based weather data, eliminating the need for precise surface temperature measurements. METRIC internally calibrates the surface energy balance using ground-based reference ET, aligning with traditional ET methods and reducing computational biases. The model is flexible, does not require knowledge of crop types or growth stages, and can detect reduced ET due to water scarcity. METRIC’s calibration compensates for regional advection effects, making it suitable for arid and semi-arid regions [54].
Recent research validates METRIC’s accuracy based on lysimeter measurements, achieving 10% daily ET estimation on a sub-field scale, particularly in semi-arid regions. Sensitivity analysis identifies influential parameters, suggesting the need to refine equations related to these variables for enhanced accuracy [55].
The calibration of satellite-based energy-balance algorithms for ET estimation is challenging, and the CIMEC process, standing for calibration using inverse modeling at extreme conditions, addresses this by utilizing extreme conditions for calibration. A statistics-based procedure simplifies the calibration process by using the relationship between vegetation amount and surface temperature. This approach improves accuracy, especially for inexperienced operators [56].
Comparing 8-bit and 12-bit resolution imagery from Landsat-8, it is found that using 8-bit thermal data does not significantly affect ET retrievals in METRIC. Differences in signal-to-noise ratio and scaling between images from different missions have minimal impact on ET determination. Recalibration of Landsat-8 thermal data does not affect the accuracy of ET retrievals in METRIC due to the model’s compensation for biases [57].
To simplify the model and reduce computational requirements, a simplified version of METRIC called S-METRIC was proposed by [58]. S-METRIC offers a faster and simpler approach with comparable performance to METRIC in estimating monthly ET values using relatively limited input data.
SWH-METRIC was introduced by [59] as a combined model that facilitates the challenging task of continuous daily ET estimation at a fine spatiotemporal scale. The results demonstrated a noteworthy alignment between the estimations by the SWH—METRIC model and the measurements through the eddy covariance technique. Moving towards hybrid models might have the potential to bridge existing gaps and enhance the overall accuracy of ET estimation.
3.2. Two-Source Surface Energy Balance Models
The fundamental aspect of the two-source surface energy model revolves around dividing the sensible heat flux between the canopy and soil layers. Hereafter are described the most used models.
3.2.1. The Two-Source Energy Balance Model (TSEB)
A two-source model Energy Balance model, standing for TSEB, incorporating directional radiometric surface temperature was developed and validated using field measurements. It showed promise in predicting soil, sensible, and latent heat flux, with an acceptable agreement for most observations [20].
The TSEB model was tested in Italy (Sicily), and the results were compared with the outputs of the agro-hydrological SWAP model. SWAP and TSEB showed slightly good agreement in some fields, with further investigations planned [60]. A study compared the accuracy of the TSEB and METRIC models in detecting crop water needs through ET. Both models performed similarly at fine and moderate scales, with METRIC exhibiting greater sensitivity in early growth and TSEB showing slightly greater sensitivity at maturity. Time integration of flux estimates improved daily ET estimates [61].
The TSEB model was refined by incorporating ground measurements in irrigated maize and cotton fields, resulting in the TSEB-A model (considering the advective conditions). TSEB-A demonstrated improved agreement between observed and modeled soil and vegetation temperatures, accurately estimating ET in arid/semi-arid climates [62].
For monitoring ET and aiding in irrigation planning, the TSEB model was compared to the FAO-56 dual approach. Both models performed well, with TSEB demonstrating smoother performance and potential for detecting water stress. TSEB was recommended for mapping ET on a large scale and supporting irrigation scheduling decisions [63]. In semiarid and arid regions, TSEB is suitable for estimating surface fluxes but tends to underestimate sensible heat flux and overestimate latent heat flux. A study introduced a new soil resistance formulation in TSEB, which showed improved accuracy in flux estimation without calibration or parameter tuning [64].
To address complex tree–grass ecosystems (TGEs), the TSEB model was modified into the TSEB-2S model, considering phenological dynamics and dominant vegetation for different seasons. The adapted model significantly reduced errors in latent heat measurements compared to the default TSEB model [65]. For accurate ET modeling in TGEs, the impact of pixel heterogeneity was examined. The TSEB model performed well at <5 m resolution but had increased uncertainty at >10 m resolution. Incorporating landscape roughness or using a seasonally changing TSEB model improved performance for mixed pixels [66].
Incorporating the original TSEB model with near-surface soil moisture, the TSEB-SM model improved the agreement with observed fluxes and showed advantages over TSEB, especially when the ratio of evapotranspiration was lower. It provided valuable insights into the global water cycle and showed potential as an alternative to complex Global Climate Models [67]. In another study, to estimate ET and plant transpiration (T), the TSEB-SIF model utilized sun-induced chlorophyll fluorescence (SIF) data. It outperformed the TSEB model in estimating ET, accurately partitioning T from ET under water deficit conditions [68].
ET estimation using the TSEB model has demonstrated its effectiveness in yielding favorable outcomes when compared to field measurements. Nevertheless, recommendations for enhancing the precision of the soil heat flux formulations have been proposed. Several investigations have attested to the preference for TSEB in scenarios when data are plenty available. Moreover, it is important to use TSEB, bearing in mind its temporal sensitivities, which exhibit seasonally dependent variations.
3.2.2. The Atmosphere-Land EXchange Inverse (ALEXI)
ALEXI is an operational two-source model for evaluating surface energy balance using measurements of the rate of change in radiometric surface temperature. It eliminates the need for ancillary measurements of near-surface air temperature and accurately decomposes surface radiometric temperature into soil and vegetation components. It predicts angular dependence from a single view angle and has been evaluated against field experiment data with comparable uncertainties to models requiring air temperature inputs. A strategy for applying the ALEXI model on a larger scale is briefly outlined by [69]. Among many studies reporting on model validation, Anderson et al. compared its outputs to ground-based observations [69].
In 2007, further improvements were made to the ALEXI model, including an algorithm for estimating fluxes during cloudy periods [70]. This allowed for the estimation of surface fluxes across the entire US in near real-time, highlighting the model’s practical applicability. Moreover, in the same year, the ALEXI model was recognized for its value in monitoring droughts, utilizing thermal infrared imagery and vegetation data [71]. The model’s evaporative stress index (ESI) correlated well with the Palmer drought index, providing accurate results and indicating its potential as a reliable drought monitoring tool. In 2011, [72] stated that the ALEXI model’s physically-based interpretation of land-surface temperature and vegetation data allowed for daily flux mapping at large scales.
The practical application of the ALEXI model for optimizing irrigation management in California’s Central Valley was demonstrated in 2019 [73]. The model accurately reflected irrigation practices, offering valuable insights into water use and crop stress, thereby contributing to operational irrigation management.
Recently, a study focused on calibrating the SWAT model using remotely sensed hydrologic variables and ALEXI ET, MODIS ET, and SMERGE soil moisture, in addition to streamflow data. Results show that incorporating remotely sensed ET and soil moisture affects sensitive model parameters but may not improve model performance. Using only remotely sensed ET or soil moisture data leads to worse performance compared to using streamflow alone. Different combinations of streamflow, ET, and soil moisture data affect simulated hydrologic processes. Comparisons with the SWAT-Carbon model reveal significant performance differences. The study suggests evaluating multiple remote sensing options for calibration and considering different model structures for robust hydrologic modeling [74].
Using the TSEB concept, ALEXI introduced an additional element that leverages the accumulated thermal energy within the planetary boundary layer over time. This element serves to refine the estimation of regional sensible heat flux and to enhance the accuracy of ET estimation. Moreover, recent advancements in technology have ushered in sophisticated instruments that offer significant potential in addressing the challenging gaps that exist within the realm of remote sensing. An important example is the use by [75] of passive microwave sensors, capable of penetrating non-precipitating cloud cover, thereby enabling observations. The obtained information can derive LST, which is not possible to estimate from thermal RS in the presence of clouds. This capability remains relevant, even when dealing with datasets characterized by relatively coarse spatial resolutions.
3.2.3. The Disaggregated Atmosphere-Land EXchange Inverse (DisALEXI)
DisALEXI model combines low- and high-resolution remote sensing data to estimate surface energy fluxes. It uses surface brightness-temperature-change measurements from the Geostationary Operational Environmental Satellite (GOES) to estimate average fluxes over a 5 km scale (ALEXI algorithm). These estimates are then disaggregated using high-resolution images of vegetation index and surface temperature, and the model was named DisALEXI. This approach shows potential for estimating field-scale fluxes without local observations and allows for scaling to a surface flux-tower footprint [76].
Subsequent research explored the effectiveness of the DisALEXI model in downscaling regional-scale flux estimates to micrometeorological scales. Thermal imagery from GOES and Landsat was used, and the accuracy of the approach was evaluated, showing good agreement with observed fluxes at 30 m resolution. Disaggregation validated regional-scale flux predictions over heterogeneous landscapes while thermal sharpening enhanced visual information content and model convergence rate [69].
The DisALEXI model proved to be capable of integrating data from multiple geostationary meteorological satellite systems for global applications. Ongoing work involves evaluating multi-scale ALEXI implementations across different continents with geostationary satellite coverage [72]. Further studies have demonstrated the application of the ALEXI/DisALEXI model in optimizing irrigation strategies in vineyards, providing high-resolution and daily ET estimates. The model aligns well with flux tower observations and offers valuable information about water use variability within and around the vineyards, aiding in water conservation efforts [77].
The evaluation of the Ecosystem Spaceborne Thermal Radiometer Experiment on the International Space Station (ECOSTRESS) mission’s capability in monitoring ET, particularly using the PT-JPL and DisALEXI algorithms, was lacking. Comparisons between the two products revealed the higher accuracy of DisALEXI in capturing ET patterns, magnitude, and seasonal variability. The study also emphasized the importance of accurately representing local conditions in ET models, given the heterogeneity of ET values in small-scale agroecosystems [78].
A study performed by Knipper et al. (2023) focused on evaluating partitioned evaporation (E), and transpiration (T) estimates using two formulations of DisALEXI: DisALEXI-PM (Penman–Monteith) and DisALEXI-PT (Priestley–Taylor) [79]. Knowing that Priestley–Taylor is a method that was introduced in 1972 to solve the data availability issue [80]. It requires less information for the ET estimation. Priestley–Taylor is considered the most precise among the simplified methods with reduced parameters [81].
Knipper et al. 2023 conducted the validation against partitioned fluxes derived from the conditional eddy covariance approach in vineyards and almond orchards. The results showed that DisALEXI-PT overestimated E and slightly underestimated T, while DisALEXI-PM agreed better with E but overestimated T under non-advective conditions. DisALEXI-PM estimated cooler canopy temperatures and warmer soil temperatures compared to DisALEXI-PT, resulting in differences in E and T. The evaluation highlighted the iterative process of DisALEXI and its potential for improving specific soil and canopy water use information for better irrigation and water use efficiencies in water-limited systems.
3.3. Contexture-Based ET Models
The application of thermal remotely sensed data has demonstrated its significance in examining the biophysical characteristics and predicting ecological dynamics, as emphasized by [82]. The data embedded within the visible, near-infrared, and thermal infrared spectral bands can be harnessed to extract valuable information such as LST and vegetation indices (VIs) like the NDVI and Enhanced Vegetation Index (EVI). Figure 3 illustrates this concept presenting both the triangle and trapezoidal methods, which will be explained in detail in bellow. The concept of contexture-based models was initially introduced by [83]. The surface temperature over areas of different vegetation fractions has been extensively employed in various research studies, including investigations related to soil water content, surface resistance, land use and land cover change, drought monitoring, and regional ET [84,85,86,87].
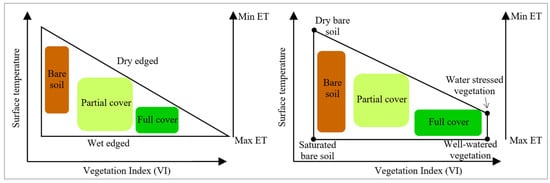
Figure 3.
Schematic of LST–VIs models (triangle and trapezoid frameworks).
The origin of the application of this approach can be attributed to the pioneering work conducted by [83]. In this study, the researchers examined the statistical correlation between thermal emissions and reflected spectral radiance within a heterogeneous vegetated region. The results revealed a robust connection between thermal emissions and the quantity of vegetation, as evidenced by a multispectral index. Conversely, no significant relationship was observed with albedo. This observation can be rationalized by the heightened latent heat flux associated with actively transpiring vegetation.
Upon these findings, Price in 1990 developed a method to estimate evapotranspiration by relating variations in LST and a vegetation index [88]. This approach required independent estimates of evapotranspiration for fully vegetated and non-vegetated areas. In the same study, it was also identified a property that helped discriminate cirrus clouds from areas with varying soil moisture.
Building on previous studies, ref. [89] proposed a modification of the “Simplified Method” for estimating daily ET by combining the Penman–Monteith equation with the energy balance equation and using linear interpolations between surface temperature values computed for full-cover vegetation and bare soil conditions. Testing the method with ground-based measurements and Landsat Thematic Mapper (TM) images, good agreement with surface evaporation rate measurements was obtained. This modified method provided a way to estimate ET in partially vegetated fields without prior knowledge of percent vegetation cover and canopy resistance. To validate the modified method, [90] used ground-based measurements and Landsat TM images in southeast Arizona. The approach accurately estimated surface evaporation rates based on surface reflectance, temperature, and spectral vegetation index. By applying this method to different environments, regional estimates of evaporation rates for the grassland biome could be produced.
Price 1990 and Jiang et al. 1999 mainly addressed the contradictions in the conservation equations of dual-source vegetation models and proposed schemes to estimate surface evaporation over large areas [88,91]. These studies aimed to enhance the understanding of land surface heat fluxes and provide reliable and easily applicable methods for operational estimation of evapotranspiration.
Nishida et al. 2003 introduced an algorithm that estimates evaporation fraction (EF) as a combination of EF of bare soil and EF of vegetation that itself estimated using the LST–VI diagram [92]. Additionally, the complementary relationship of the actual and the potential ET was used for the formulation of EF. Using NOAA/AVHRR data, estimated EF values were validated with actual observations of EF at AmeriFlux stations, and the algorithm showed promising results. Moran et al. 1996 used the Integral NOAA-imagery processing Chain (iNOAA-Chain) to quantify ET at a regional scale [90]. The approach incorporated visible and thermal satellite information to provide instantaneous spatial distribution of ET validated together with the employed EF, G, and instantaneous Rn against EUROFLUX site data (March to October 1997).
To compare different sensors, Batra et al. 2006 conducted an extensive inter-comparison of ET estimates derived from MODIS and AVHRR sensors [93]. The comparison covered as well NDVI, Ts, EF and Rn. Despite differences in response functions and overpass times, the contextual space of the LST–NDVI diagram yielded comparable estimates of EF.
Sobrino et al. 2007 presented a methodology based on the EF concept for retrieving ET from low spatial resolution remote sensing data [94]. Comparison with high-resolution ET estimation showed good agreement, capturing the seasonal evolution of daily ET based on LST and VI.
The MSG-SEVIRI high temporal resolution of the 15-minute acquisition intervals enables accurate estimation of the diurnal increase in LST during the morning, serving as a reliable proxy for overall daytime H. Using that, the improvement of the triangle method by [95] helped in estimating EF and thus the ET. By considering the diurnal change in LST and interpreting the LST–VI space, authors provided regional estimates of ET and the validation against field observations demonstrated low biases and good agreement.
Zhang et al. 2008 aimed to improve the prediction of land surface heat fluxes and made two enhancements to an operational two-layer model [96]. The first improvement employed a SEB method to determine theoretical boundary lines in the scatter plot for surface temperature versus fractional vegetation cover (fc) in mixed pixels. The second improvement introduced the assumption that the slope of temperature–vegetation cover curves is mainly controlled by soil water content. Validation against in situ measurements demonstrated the model’s accuracy in predicting latent heat flux. Furthermore, Tang et al. 2010 applied the LST–VI triangle method to estimate regional evapotranspiration in arid and semi-arid regions [97]. An algorithm was developed to quantitatively determine the dry and wet edges of the triangle space. Applying this algorithm to MODIS/TERRA datasets, good agreement was achieved between retrieved H and those measured by a Large Aperture Scintillometer (LAS).
The Two-source Trapezoid Model for Evapotranspiration (TTME) was developed by Long and Singh in 2012 by incorporating the fc–Trad space (Trad representing radiative surface temperature) and the concept of soil surface moisture availability isopleths [98]. TTME accurately estimated LE with a mean absolute percentage difference of around 10% and demonstrated comparable accuracy to the TSEB model. It required fewer inputs, avoided resistance network computations, and reduced overestimation of vegetation transpiration compared to the Priestley–Taylor equation. Sensitivity analysis revealed that TTME was most sensitive to Trad and Ta while being less sensitive to other meteorological observations, variables, and derived parameters.
In a different context, Yang et al., 2013 developed the Temperature and Greenness Rectangle (TGR) model to estimate terrestrial ecosystem gross primary production (GPP) using MODIS satellite imagery [99]. The TGR model demonstrated good agreement with tower based GPP measurements, particularly for most vegetation types, except evergreen broadleaf forests. This model outperforms other models, providing superior GPP estimates, especially under dry climate conditions. It incorporates three significant advantages: (1) it adheres closely to the principles of the light use efficiency model while ensuring that each parameter possesses a tangible physical interpretation; (2) it mitigates the reliance on meteorological data obtained from ground-based sources; and (3) it prevents redundancy in information stemming from interrelated explanatory variables.
With the aim of characterizing the energy exchanges within agricultural fields, encompassing four distinct surface components: bare soil, healthy green vegetation, non-transpiring green vegetation, and mature senescent vegetation, ref. [100] presented the SEB-4S model (standing for Four-Sources Surface Energy Balance). The SEB-4S representation is attained through a unified physical interpretation of both the edges and vertices of two distinct polygons. The first one is created by plotting surface temperature against fractional green vegetation, while the second is generated by plotting T as a function of surface albedo.
Yang et al., 2015 proposed an Enhanced Two-source Evapotranspiration Model for Land (ETEML) that utilizes the concept of a trapezoid area of the vegetation fractional cover (VFC) and LST space, enabling spatially distributed estimation of ET [101]. ETEML employs a pixel-wise mixed surface temperature decomposition and the crop water stress index (CWSI) concept to separate soil evaporation and vegetation transpiration. These enhancements overcome the limitations typically associated with a simpler trapezoid interpolation model, expanding its applicability. The evaluation of the model in central Iowa (USA) demonstrated accuracy in the estimation of LE and surpassed simpler trapezoid models, reducing subjectivity and uncertainties. ETEML holds promise for evapotranspiration modeling in diverse landscapes.
The Time-Domain Triangle Method (TDTM) was introduced in 2016 by Minacapilli et al. for estimating regional ET [102]. The TDTM enhances the parameterization of the Priestley-Taylor coefficient by focusing on the temporal dynamics of LST–VI pairs derived from MODIS and MSG-SEVIRI sensors. Validated in Sicily, the TDTM accurately predicts daily ET rates, making it a practical tool for estimating spatial and temporal changes in ET, vital for water resource management, agriculture, ecology, and climate change research.
Existing models based on trapezoidal approaches have limitations in accurately determining the wet edge. To address this, a novel Two-source Model for estimating EF (TMEF) was developed by [103], incorporating a two-stage trapezoidal framework and an extended Priestly–Taylor formula. A comparison analysis was performed and the TMEF model outperforms TTME and OTEF (One-source Trapezoid model for EF), demonstrating improved accuracy in simulating and partitioning EF using MODIS products and field observations.
4. Intercomparison of ET Estimation among the Temperature-Based Models
Numerous studies have compared the different models that estimate ET with the primary objective of assessing their performance, accuracy, and reliability. Evaluating these models helps to identify the most suitable ones for specific environmental conditions and data availability, allowing for a more precise and consistent ET estimation. Additionally, intercomparisons allow for the refinement and enhancement of the existing models, facilitating advancements and further developments.
This work focuses on the studies conducted over the past 15 years, and following a chronological order of development, it provides an up-to-date perspective on the subject.
The two models, TSEB and SEBAL, were compared in many studies. Research conducted by Timmermans et al. (2007) showed reasonable agreement of both models with flux tower observations, whereas significant discrepancies were found in the estimation of H, particularly related to different land cover types [104]. TSEB performed better in areas of bare soil and sparse vegetation, while modifications to SEBAL inputs improved results for certain land cover classes but worsened discrepancies for others. The study highlighted the limitations of SEBAL’s simplifying assumptions and identified key inputs that affect the models’ performance.
In 2008, Gao et al. compared four models that estimate daily ET, more precisely two single source models (SEBAL and SEBS) and two double source models (P-TSEB and S-TSEB), to assess their utility and constraints across diverse land covers and meteorological conditions [105]. S-TSEB outperformed the other models; however, SEBAL and SEBS performed well in areas with higher vegetation cover and soil moisture availability. The two single-source models showed high sensitivity to the KB−1 parameter, resulting in significant variations in ET estimations due to distinct approaches in handling the roughness length for heat transfer.
SSEB was compared to METRIC by Senay et al. in 2008, and both models produced comparable spatial and temporal variability. However, SSEB tended to overestimate ET over water bodies, which could be improved by incorporating a correction coefficient but proved useful for large-scale agro-hydrologic applications, enabling the monitoring and assessment of crop performance and regional water balance dynamics [106].
In 2009, a study evaluated three models, TSEB, METRIC, and TIM, for estimating surface energy balance over an agricultural landscape. TSEB and METRIC performed reasonably well, while TIM exhibited larger errors. Spatial comparisons of the models’ outputs revealed significant differences in modeled heat flux patterns associated with varying vegetation densities. Adjusting certain parameters in the METRIC model reduced bias in one variable but increased it in another. The study suggested that further comparisons across different landscapes are needed to improve remote sensing surface energy balance models and develop a hybrid modeling system [107].
In Yucheng, China, a study was conducted to compare three ET models using MODIS/TERRA products and ground measurements. The models under evaluation were SEBS, TSEB, and TVT (for Triangular Vegetation Temperature). TSEB showed the closest agreement with measured heat fluxes, indicating its accuracy in estimating ET. SEBS also performed reasonably well, although it was more sensitive to input errors as compared to TSEB. However, TVT exhibited poor performance due to difficulties in selecting the dry edge, especially in humid regions. This highlights the challenge of accurately estimating ET in such environments using the TVT model [108].
Senay et al., 2011, compared SSEB with the METRIC model, both used for estimating ET from satellite data. The enhanced SSEB model demonstrated good agreement with METRIC when analyzing Landsat images from the 2003 growing season in south-central Idaho. In areas with less complex topography, SSEB exhibited an improved correlation as compared to METRIC. However, in more complex mountainous areas, both models faced challenges in capturing radiation and heat transfer on steep slopes. However, the SSEB model displayed temporal consistency [34].
In 2014, a study compared two versions of the TSEB model, TSEB-PT and TSEB-PM. The purpose was to better account for varying vapor pressure deficits in advective, semiarid climates. The comparison was conducted using measurements from irrigated cotton fields in Texas. The study found that the TSEB-PM model provided improved accuracy in estimating evaporation and transpiration compared to the TSEB-PT model. The 15-minute interval calculations showed better agreement with measurements compared to time scaling methods. The study concluded that the choice of radiometric surface temperature measurement time did not significantly affect the results [109]. In the same year, the developed model called SEB-4S represented the energy fluxes of different surface components in agricultural fields. The study tested SEB-4S against two benchmark models and found that SEB-4S provided significantly more accurate and robust estimates of evapotranspiration. The model showed potential for operational use in irrigated agricultural areas using high-resolution remote sensing data [100].
In 2015, a study proposed ETEML based on a trapezoid framework. The study evaluated the model’s performance using Landsat data and found that ETEML accurately estimated latent heat flux compared to tower observations. The model reduced subjectivity and uncertainties compared to simpler trapezoid interpolation models. The study suggested that ETEML had the potential to expand the application of trapezoid framework-based ET modeling approaches [101].
Moreover, the four commonly used models, METRIC, SEBAL, SEBS, and SSEBop, were compared for estimating ET in the Midwestern United States. The models were validated for three cropland sites, and all four models reasonably captured the variation of ET. METRIC and SSEBop performed well with low errors, while SEBAL and SEBS showed some bias in daily ET estimation. The study emphasized the strengths and limitations of these models for water resource management [110].
In a valuable work conducted by [111], SEBAL, METRIC, S-SEBI, SEBS, and SSEBop were evaluated for their accuracy in estimating ET in the humid southeastern United States. They compared the measured ET data from four sites with the predictions from the models using Landsat images from 2000 to 2010. The results revealed that SEBS performed the best overall, exhibiting the lowest root mean squared error (RMSE) of 0.74 mm/day. On the other hand, SSEBop consistently overestimated ET with an RMSE of 1.67 mm/day. The other models, SEBAL, METRIC, and S-SEBI, fell between SSEBop and SEBS in terms of performance. However, for short grass conditions, SEBAL, METRIC, and S-SEBI showed better accuracy than SEBS. In conclusion, SEBS appears to be the most suitable model for humid regions, but it may require modifications to enhance performance over short vegetation. Moving on to the study conducted by [112], three remote models were evaluated, METRIC, LST–VI triangle, and SSEB for estimating regional ET in an oasis-desert region during a growing season. The researchers assessed the models’ performance by comparing them with surface flux data from five eddy covariance flux towers at a pixel level for different land-cover types. The results showed that METRIC and SSEB exhibited good correlations (R2 > 0.90) with the measured latent heat flux, while the LST–VI triangle model tended to overestimate available energy. Specifically, the LST–VI triangle model had the highest consistency with METRIC in farmland with an R2 of 0.98 and an RMSE of 13.69 W m−2. Overall, METRIC outperformed the other models, while the LST–VI triangle model tended to overestimate and SSEB underestimated higher LE values. Sensitivity analysis revealed that the SSEB and LST-VI triangle models were more sensitive to estimated surface temperature and available energy compared to METRIC.
Similarly to the study mentioned here above, ref. [113] evaluated the performance of SEBAL, METRIC, SEBS, S-SEBI, and SSEBop in estimating ET in a high biomass sorghum field. The researchers compared the models against measurements from an eddy covariance system. The findings indicated that S-SEBI, SEBAL, and SEBS performed reasonably well overall, while METRIC and SSEBop had a poorer performance. All SEB models tended to overestimate ET during extremely dry conditions and underestimated sensible heat flux. METRIC, SEBAL, and SEBS consistently overestimated ET regardless of wet or dry periods, while S-SEBI and SSEBop significantly underestimated ET under wet conditions. The study highlighted the importance of incorporating soil moisture or plant water stress components into SEB models to improve their performance, particularly in extremely dry or wet environments.
Lu et al. conducted a study in 2017 aiming to estimate ET in an arid region for effective water resource management [114]. They compared METRIC and TTME for estimating LE in a specific sub-region of the Heihe River Basin in northwest China. The models were applied to Landsat-8 and Landsat-7 data during the crop growth stage from April to September 2013. The researchers evaluated the derived LE values from METRIC and TTME by comparing them with observed LE data. The results indicated that the spatial distributions of LE from both models were similar, with relative deviation values within 7%. This suggests that both METRIC and TTME models are suitable for retrieving LE in the study area. However, the precision of LE retrieval was influenced by land use/cover types. METRIC provided slightly higher accuracy than TTME in desert areas, while TTME achieved notably higher precision than METRIC in farmland/wetland areas.
In a data-limited region in the Kilombero Valley river basin, three SEB models, SEBAL, SSEBop, and S-SEBI, were compared. SEBAL and SSEBop showed high and low ET, respectively, while S-SEBI had similar ET to the ensemble mean of all models. The models provided statistically comparable ET estimates among different land cover classes and spatial scales [115]. In the same year, a study addressed the uncertainty and weight determination issues in ET estimation by adopting the Bayesian model averaging (BMA) method. Four SEB models, SEBAL, SSEB, S-SEBI, and SEBS, were combined using Landsat-8 images. BMA methods provided more accurate and reliable results compared to individual models [116]. Similarly, BMA was used by Yang et al. in 2021 to improve daily ET estimation. Eight models, including SEBS, SEBAL, and machine learning algorithms, were combined, resulting in a more reliable estimate of ET [117]. The BMA method, incorporating machine learning, significantly enhanced daily ET accuracy and reduced uncertainties among models.
In more recent work, the performance of the new mission ECOSTRESS thermal radiometer experiment was assessed. The PT-JPL algorithm captured the diurnal ET pattern but tended to overestimate instantaneous ET in the morning; on the other hand, the DisALEXI algorithm demonstrated higher accuracy [78].
In 2022, Kamyab et al. compared two algorithms, SEBAL and METRIC/Earth Engine Evapotranspiration Flux (EEFLux), using Landsat-8 images during the maize growth period. The results showed that ET values varied throughout the season due to temperature changes and variations in maize cover. The EEFLux algorithm outperformed SEBAL in terms of accuracy, providing closer estimations to measured ET values with higher correlation and lower standard deviation [118].
One of the latest studies compared the SEBS and SEBAL algorithms for estimating daily wheat evapotranspiration in central Khuzestan province. Both algorithms showed high compatibility with lysimeter data, outperforming other methods and suggesting their suitability for accurate evapotranspiration estimation in the region [119]. In another study [120], under the arid and semi-arid environment of the Northern part of Saudi Arabia, the SEBAL and METRIC models were compared for estimating ET.SEBAL was deemed superior in estimating ET compared to METRIC.
In conclusion, the comparison of various ET estimation models reveals distinct assets and limitations inherent to each. TSEB demonstrates superior performance in environments with bare soil and sparse vegetation, particularly in advective, semi-arid climates, whereas SEBAL emerges as a reliable choice for humid regions and arid/semi-arid environments. SEBS exhibits versatility across different contexts but may require adjustments for optimal performance over short vegetation. METRIC stands out in arid regions, especially in desert areas, while SSEB showcases reliability in areas with less complex topography but may overestimate ET in extremely dry conditions. S-SEBI offers consistent estimates across different land cover classes and spatial scales, showcasing potential when integrated into Bayesian model averaging methods.
However, it is important to note that no single model is superior, underlining the necessity of considering specific environmental characteristics when selecting an appropriate ET estimation model. The choice must account for factors such as land cover types, climate conditions, data availability, and inherent model limitations.
The advantages and drawbacks of the RS models are summarized in Table 1 below:

Table 1.
Advantages and disadvantages of the above detailed ET models.
5. Earth Observation Emerging Missions and Advancements
The advancement in spatial and spectral resolutions in new missions can significantly impact the accuracy of Evapotranspiration (ET) estimation models, providing enhanced insights into the water cycle dynamics and agricultural productivity.
The Copernicus Space Component (CSC) is expected to undergo evolution in the mid-2020s. This evolution aims to fulfill key user demands that are currently not met by the present infrastructure. Additionally, it aims to enhance services by improving monitoring capabilities in the thematic areas of agriculture/forestry, CO2, and polar regions. This progression will be synergistic with the improved continuity of services for the upcoming generation of CSC.
Specifically, the Copernicus program will enhance its existing capabilities via the addition of six new satellite missions. One of the missions will involve the Copernicus Land Surface Temperature Monitoring (LSTM), which will deploy a thermal infrared sensor with a high spatial-temporal resolution to gather data on land-surface temperature. The mission addresses the urgent needs of the agricultural user community to enhance sustainable agricultural production at the field level, considering the growing challenges of water shortage and unpredictability. Land-surface temperature measurements and the resulting evapotranspiration are crucial factors for comprehending and adapting to climate fluctuations, overseeing water resources for agricultural purposes, forecasting droughts, and addressing concerns related to land degradation, natural disasters like fires and volcanoes, coastal and inland water management, and urban heat island problems. In more detail, by monitoring high-resolution thermal signatures, it is possible to assess the status of crop water and overall water stress. This helps in managing irrigation and optimizing the use of limited water resources for crop production. Additionally, it allows for the derivation of essential soil parameters that cannot be obtained in the VNIR/SWIR spectral range. This promotes the use of resilient agricultural techniques, which aim to preserve ecosystems and gradually enhance the quality of land, soil, and water. As a result, it contributes to the development of more sustainable agricultural practices. High-resolution thermal imaging with precise spatio-temporal data can be used to immediately identify water conservation practices or determine if they are necessary. Unauthorized water abstractions can be identified and tracked by comparing evapotranspiration maps with water rights.
Moreover, the Landsat mission will add to its constellation the Landsat Next. At present, 30-m resolution imagery of the Earth is provided by the Landsat-7 and 8 missions, with a 16-day return period per satellite. Landsat-7 was launched in April 1999 and is now in a deteriorating orbit. It also displays a scan line artifact that decreases its coverage. Landsat 8 was introduced in February 2013. Compared to Landsat-7, it has smaller spectral bands, better calibration and signal-to-noise ratios, increased 12-bit radiometric resolution, and more accurate geolocation. The Landsat-9 satellite was launched in September 2021 and closely resembles Landsat-8. These Landsat missions ensure a consistent supply of multispectral images [122]. To this constellation Landsat Next will be added in late 2030. The next Landsat mission will not only guarantee the uninterrupted continuation of the longest space-based documentation of Earth’s land surface, but it will also significantly enhance the range and quality of practical information that will be freely accessible to end users. Landsat Next will enhance the existing Landsat program by offering higher resolution in temporal, spatial, and spectral resolution. This will enable better observation, management, and adaptation to Earth’s changes. Additionally, it will provide enhanced capabilities to facilitate the development of new applications in land, water, and climate research.
Landsat Next signifies a significant advancement in the ability to measure and gather data. The improved temporal and spatial resolution of the upcoming 26-band super spectral Landsat Next constellation will strengthen current Landsat applications and enable new applications that aid in evaluating water quality and aquatic health, optimizing crop production and soil conservation, managing and monitoring forests, and mapping minerals using thermal emissivity. In addition, Landsat Next will acquire phenological signatures to classify vegetation and model crop development, health, and yields. It will also detect periodic disturbances caused by harvesting, as well as episodic insect and disease agents. Furthermore, it will assess near-continuous water use and evapotranspiration. Additionally, it will offer early warnings regarding the initiation of fires and harmful algal blooms. Moreover, it will monitor public health during heat wave seasons and track the dynamics of snow and ice on both land and sea.
Additionally, more of the future Copernicus missions may contribute added value to the estimation of evapotranspiration via crop monitoring and soil moisture. One of these missions is CHIME (Copernicus Hyperspectral Imaging Mission), which starts in 2028 and is expected to complement Copernicus Sentinel-2 for applications such as land-cover mapping, providing routine hyperspectral observations to increase the capabilities, accuracy, and spatial resolution of current products. The CHIME mission will consist of two satellites (CHIME-A and CHIME-B) providing systematic hyperspectral images to map changes in land cover and aid sustainable agricultural practices; it will be launched in 2028. The satellite will operate with Visible (VIS), Near Infrared (NIR), and Short-Wave Infrared (SWIR) spectrum at a spectral bandwidth of less than 10 nm, with a spatial resolution of 30 m with a revisit time of 10–12.5 days. Compared to multi-spectral missions, both satellites will have more (narrow) spectral bands in the visible-to-shortwave infrared range, allowing for more accurate determination of biochemical and biophysical variables. In addition, the availability of a continuous spectrum makes algorithms more effective in a variety of agricultural applications to support sustainable management [123]. The spatial resolution obtained from these satellites will also be beneficial to capture the fine spatial features typical of inland and coastal waters and, thus, to improve the land use and cover (LU/LC) maps for flood risk assessments.
Furthermore, slated for launch in 2028, the Radar Observing System for Europe in L-band (ROSE-L) represents an Earth-observing synthetic aperture radar (SAR) mission under development by the European Space Agency (ESA). The main goal of ROSE-L is to streamline geohazard monitoring, monitor alterations in land use, agriculture, and forestry, and provide detailed soil moisture data.
The mission’s objective is to utilize the ROSE-L SAR instrument, which operates in the L-band, to function as a high-resolution, versatile, and all-weather imager. This will enhance the capabilities of the current Copernicus C-band SAR systems. The L-band radio, with its longer wavelength, has the distinct ability to penetrate dense vegetation, greatly improving imaging capabilities in these situations. The primary objective of the L-band SAR mission is to systematically observe and assess soil moisture levels beneath the vegetation canopy across different types of vegetated land cover during the whole period of plant growth. The L-band SAR has a longer wavelength, which allows it to penetrate the soil more deeply compared to higher-frequency bands, such as C-band. This enables a closer and more detailed observation of the root zone. Ref. [124] emphasized the importance of L-band SAR, showing that it is more sensitive to soil moisture for areas with no vegetation and moderate plant cover densities compared to C-band radar signals. The ability of ROSE-L to infiltrate plant cover and directly assess soil moisture beneath the canopy possesses significant promise for augmenting our comprehension of soil moisture dynamics across diverse land cover categories. This feature is especially beneficial for agricultural management since it allows for accurate monitoring of soil moisture, which is essential for optimizing irrigation techniques and guaranteeing optimal water utilization in different agricultural activities.
To summarize, the upcoming ROSE-L mission, equipped with its advanced L-band SAR technology, offers a substantial enhancement to our ability to observe soil moisture beneath vegetation, thereby contributing to the improvement of agricultural practices, more effective land management, and enhanced monitoring of geohazards in various landscapes.
6. Summary and Conclusions
This paper presents a comprehensive overview of temperature-based models used for estimating evapotranspiration (ET). The discussion begins by introducing the surface energy balance concept and key variables, including sensible heat flux, ground heat flux, and latent heat flux. Subsequently, various temperature-based ET models are explored, emphasizing their strengths, weaknesses, and historical evolution. Over a retrospective analysis spanning 15 years, modifications proposed by researchers, validation studies, and intercomparisons among these models are synthesized. Additionally, the article investigates the impact of advancements in satellite missions on improving ET estimation models, highlighting the significance of emerging earth observation missions. The review of the existing work in the field of remote sensing related to ET estimation is a cornerstone for progress. The comprehensive examination of RS models allows for their deep understanding, for identifying their strengths and limitations, and for developing more robust and reliable ET estimation models.
The performance of these models varies across different regions and environmental conditions. As such, classification and cross-comparison of these models are of substantial importance. This approach enables practitioners to select the most appropriate model for a specific set of conditions, enhancing the accuracy of ET estimates. It is important to acknowledge that no single ET estimation model is universally perfect. Different models excel under different scenarios and environmental conditions. Expanding on prior research efforts, this work provides support for the selection of models based on the specific requirements of a study area or application. The intercomparison between the ET models did not involve identical models, as the studies in question primarily employed different models. Nevertheless, it is essential to recognize that these studies were distinct in their objectives and methods. Despite this diversity, the overall crosscutting comparison can yield valuable insights and serve as a robust foundation for future investigations.
One of the most promising aspects of the development of ET estimation models is using the most recent technologies and employing hybrid approaches. Emerging technologies, such as machine learning and advanced remote sensing techniques, can enhance the precision and accuracy of ET estimates. Hybrid models that combine the strengths of multiple approaches can harness the advantages of each method, leading to more robust and adaptable ET estimation tools.
The emerging missions and advancements in the field of remote sensing will radically enhance the accuracy of the developed ET estimation models. More specifically, the new missions are equipped with technologically advanced optical and radar sensors with improved spatial and temporal resolutions and hold promising prospects for upgrading the precision and reliability of ET estimations.
Funding
This research was carried out as part of the EO Africa Explorers project, funded by the European Space Agency (ESA) under Contract No 4000139810/22/I-DT (EO AFRICA Water Resources Management project). The project reference is Ref. ESA-CIP-POE-DT-sp-LE-2021-882, and it falls under Budget Line E/A105-01-EarthScience Block 4.
Data Availability Statement
Not applicable.
Conflicts of Interest
Theophilos Valsamidis was employed by Planetek Hellas, Vito De Pasquale and Anna Maria Deflorio were employed by Planetek Italia. The remaining authors declare that the research was conducted in the absence of any commercial or financial relationships that could be construed as a potential conflict of interest.
References
- Zhang, H.; Wang, L. Analysis of the variation in potential evapotranspiration and surface wet conditions in the Hancang River Basin, China. Sci. Rep. 2021, 11, 8607. [Google Scholar] [CrossRef]
- Reyes-Gonzalez, A. Using Remote Sensing to Estimate Crop Water Use to Improve Irrigation Water Management; South Dakota State University: Brookings, SD, USA, 2017. [Google Scholar]
- Zheng, Q.; Hao, L.; Huang, X.; Sun, L.; Sun, G. Effects of urbanization on watershed evapotranspiration and its components in southern China. Water 2020, 12, 645. [Google Scholar] [CrossRef]
- Sharma, S.; Regulwar, D.G. Prediction of evapotranspiration by artificial neural network and conventional methods. Int. J. Eng. Res. 2016, 5, 184–187. [Google Scholar]
- García-Santos, V.; Sánchez, J.M.; Cuxart, J. Evapotranspiration Acquired with Remote Sensing Thermal-Based Algorithms: A State-of-the-Art Review. Remote Sens. 2022, 14, 3440. [Google Scholar] [CrossRef]
- Zhao, L.; Xia, J.; Xu, C.; Wang, Z.; Sobkowiak, L.; Long, C. Evapotranspiration estimation methods in hydrological models. J. Geogr. Sci. 2013, 23, 359–369. [Google Scholar] [CrossRef]
- Maliva, R.G. Groundwater Recharge and Aquifer Water Budgets. In Anthropogenic Aquifer Recharge; Springer: Berlin/Heidelberg, Germany, 2020; pp. 63–102. [Google Scholar] [CrossRef]
- Subedi, A.; Chávez, J.L. Crop Evapotranspiration (ET) Estimation Models: A Review and Discussion of the Applicability and Limitations of ET Methods. J. Agric. Sci. 2015, 7, 50. [Google Scholar] [CrossRef]
- Zhang, K.; Kimball, J.S.; Running, S.W. A review of remote sensing based actual evapotranspiration estimation. Wiley Interdiscip. Rev. Water 2016, 3, 834–853. [Google Scholar] [CrossRef]
- Aryalekshmi, B.N.; Biradar, R.C.; Chandrasekar, K.; Ahamed, J.M. Analysis of various surface energy balance models for evapotranspiration estimation using satellite data. Egypt. J. Remote Sens. Space Sci. 2021, 24, 1119–1126. [Google Scholar] [CrossRef]
- Kumar, L.; Sinha, P.; Taylor, S.; Alqurashi, A.F. Review of the use of remote sensing for biomass estimation to support renewable energy generation. J. Appl. Remote Sens. 2015, 9, 97696. [Google Scholar] [CrossRef]
- Fisher, J.B.; Hook, S.; Allen, R.; Anderson, M.; French, A.; Hain, C.; Hulley, G.; Wood, E. ECOSTRESS: NASA’s next generation mission to measure evapotranspiration from the international space station. Water Resour. Res. 2020, 56, e2019WR026058. [Google Scholar] [CrossRef]
- Maltese, A.; Awada, H.; Capodici, F.; Ciraolo, G.; La Loggia, G.; Rallo, G. On the use of the eddy covariance latent heat flux and sap flow transpiration for the validation of a surface energy balance model. Remote Sens. 2018, 10, 195. [Google Scholar] [CrossRef]
- French, A.N.; Hunsaker, D.J.; Sanchez, C.A.; Saber, M.; Gonzalez, J.R.; Anderson, R. Satellite-based NDVI crop coefficients and evapotranspiration with eddy covariance validation for multiple durum wheat fields in the US Southwest. Agric. Water Manag. 2020, 239, 106266. [Google Scholar] [CrossRef]
- Courault, D.; Seguin, B.; Olioso, A. Review on estimation of evapotranspiration from remote sensing data: From empirical to numerical modeling approaches. Irrig. Drain. Syst. 2005, 19, 223–249. [Google Scholar]
- Liou, Y.-A.; Kar, S.K. Evapotranspiration estimation with remote sensing and various surface energy balance algorithms—A review. Energies 2014, 7, 2821–2849. [Google Scholar] [CrossRef]
- Chen, J.M.; Liu, J. Evolution of evapotranspiration models using thermal and shortwave remote sensing data. Remote Sens. Environ. 2020, 237, 111594. [Google Scholar] [CrossRef]
- Medlyn, B.E.; Duursma, R.A.; Eamus, D.; Ellsworth, D.S.; Prentice, I.C.; Barton, C.V.M.; Crous, K.Y.; DE Angelis, P.; Freeman, M.; Wingate, L. Reconciling the optimal and empirical approaches to modelling stomatal conductance. Glob. Change Biol. 2011, 17, 2134–2144. [Google Scholar] [CrossRef]
- Sello, L.; Maqhubela, A.; Mahed, G. Remote sensing-based evapotranspiration determination: A review of single-source energy balance models. S. Afr. J. Geomat. 2022, 11, 262–273. [Google Scholar] [CrossRef]
- Norman, J.M.; Kustas, W.P.; Humes, K.S. Source approach for estimating soil and vegetation energy fluxes in observations of directional radiometric surface temperature. Agric. For. Meteorol. 1995, 77, 263–293. [Google Scholar] [CrossRef]
- Qin, Z.; Berliner, P.; Karnieli, A. Numerical solution of a complete surface energy balance model for simulation of heat fluxes and surface temperature under bare soil environment. Appl. Math. Comput. 2002, 130, 171–200. [Google Scholar] [CrossRef]
- TSchmugge, J.; Becker, F. Remote Sensing Observations for the Monitoring of Land-Surface Fluxes and Water Budgets. In Land Surface Evaporation; Springer: Berlin/Heidelberg, Germany, 1991; pp. 337–347. [Google Scholar] [CrossRef]
- Su, Z. The Surface Energy Balance System (SEBS) for estimation of turbulent heat fluxes. Hydrol. Earth Syst. Sci. 2002, 6, 85–100. [Google Scholar] [CrossRef]
- Jia, L.; Su, Z.; Hurk, B.v.D.; Menenti, M.; Moene, A.; De Bruin, H.A.; Yrisarry, J.B.; Ibanez, M.; Cuesta, A. Estimation of sensible heat flux using the Surface Energy Balance System (SEBS) and ATSR measurements. Phys. Chem. Earth Parts A/B/C 2003, 28, 75–88. [Google Scholar] [CrossRef]
- Su, H.; Wood, E.F.; McCabe, M.F.; Su, Z. Evaluation of remotely sensed evapotranspiration over the CEOP EOP-1 reference sites. J. Meteorol. Soc. Jpn. Ser. II 2007, 85, 439–459. [Google Scholar] [CrossRef]
- Van der Kwast, J.; Timmermans, W.; Gieske, A.; Su, Z.; Olioso, A.; Jia, L.; Elbers, J.; Karssenberg, D.; de Jong, S. Evaluation of the Surface Energy Balance System (SEBS) applied to ASTER imagery with flux-measurements at the SPARC 2004 site (Barrax, Spain). Hydrol. Earth Syst. Sci. 2009, 13, 1337–1347. [Google Scholar] [CrossRef]
- Chen, X.; Su, Z.; Ma, Y.; Yang, K.; Wen, J.; Zhang, Y. An improvement of roughness height parameterization of the Surface Energy Balance System (SEBS) over the Tibetan Plateau. J. Appl. Meteorol. Clim. 2013, 52, 607–622. [Google Scholar] [CrossRef]
- Chen, X.; Su, Z.; Ma, Y.; Middleton, E.M. Optimization of a remote sensing energy balance method over different canopy applied at global scale. Agric. For. Meteorol. 2019, 279, 107633. [Google Scholar] [CrossRef]
- Hu, X.; Shi, L.; Lin, G.; Lin, L. Comparison of physical-based, data-driven and hybrid modeling approaches for evapotranspiration estimation. J. Hydrol. 2021, 601, 126592. [Google Scholar] [CrossRef]
- Njuki, S.M.; Mannaerts, C.M.; Su, Z. Accounting for Turbulence-Induced Canopy Heat Transfer in the Simulation of Sensible Heat Flux in SEBS Model. Remote Sens. 2023, 15, 1578. [Google Scholar] [CrossRef]
- Senay, G.B.; Budde, M.; Verdin, J.P.; Melesse, A.M. A coupled remote sensing and simplified surface energy balance approach to estimate actual evapotranspiration from irrigated fields. Sensors 2007, 7, 979–1000. [Google Scholar] [CrossRef]
- Gowda, P.H.; Senay, G.B.; Howell, T.A.; Marek, T.H. Lysimetric evaluation of Simplified Surface Energy Balance approach in the Texas high plains. Appl. Eng. Agric. 2009, 25, 665–669. [Google Scholar] [CrossRef]
- Gowda, P.H.; Chávez, J.L.; Howell, T.A.; Marek, T.H.; New, L.L. Surface energy balance based evapotranspiration mapping in the Texas High Plains. Sensors 2008, 8, 5186–5201. [Google Scholar] [CrossRef]
- Senay, G.B.; Budde, M.E.; Verdin, J.P. Enhancing the Simplified Surface Energy Balance (SSEB) approach for estimating landscape ET: Validation with the METRIC model. Agric. Water Manag. 2011, 98, 606–618. [Google Scholar] [CrossRef]
- Senay, G.B.; Leake, S.; Nagler, P.L.; Artan, G.; Dickinson, J.; Cordova, J.T.; Glenn, E.P. Estimating basin scale evapotranspiration (ET) by water balance and remote sensing methods. Hydrol. Process. 2011, 25, 4037–4049. [Google Scholar] [CrossRef]
- Senay, G.B.; Bohms, S.; Singh, R.K.; Gowda, P.H.; Velpuri, N.M.; Alemu, H.; Verdin, J.P. Operational evapotranspiration mapping using remote sensing and weather datasets: A new parameterization for the SSEB approach. JAWRA J. Am. Water Resour. Assoc. 2013, 49, 577–591. [Google Scholar] [CrossRef]
- Singh, R.K.; Senay, G.B.; Velpuri, N.M.; Bohms, S.; Scott, R.L.; Verdin, J.P. Actual evapotranspiration (water use) assessment of the Colorado River Basin at the Landsat resolution using the operational simplified surface energy balance model. Remote Sens. 2013, 6, 233–256. [Google Scholar] [CrossRef]
- Chen, M.; Senay, G.B.; Singh, R.K.; Verdin, J.P. Uncertainty analysis of the Operational Simplified Surface Energy Balance (SSEBop) model at multiple flux tower sites. J. Hydrol. 2016, 536, 384–399. [Google Scholar] [CrossRef]
- Reitz, M.; Senay, G.B.; Sanford, W.E. Combining remote sensing and water-balance evapotranspiration estimates for the conterminous United States. Remote Sens. 2017, 9, 1181. [Google Scholar] [CrossRef]
- Lopes, J.D.; Rodrigues, L.N.; Imbuzeiro, H.M.A.; Pruski, F.F. Performance of SSEBop model for estimating wheat actual evapotranspiration in the Brazilian Savannah region. Int. J. Remote Sens. 2019, 40, 6930–6947. [Google Scholar] [CrossRef]
- Li, J.; He, Q. Validation of the operational simplified surface energy balance products and spatiotemporal changes in evapotranspiration in China from 2003 to 2016. J. Appl. Remote Sens. 2020, 14, 038502. [Google Scholar] [CrossRef]
- Senay, G.B.; Friedrichs, M.; Morton, C.; Parrish, G.E.; Schauer, M.; Khand, K.; Kagone, S.; Boiko, O.; Huntington, J. Mapping actual evapotranspiration using Landsat for the conterminous United States: Google Earth Engine implementation and assessment of the SSEBop model. Remote Sens. Environ. 2022, 275, 113011. [Google Scholar] [CrossRef]
- Senay, G.B.; Parrish, G.E.L.; Schauer, M.; Friedrichs, M.; Khand, K.; Boiko, O.; Kagone, S.; Dittmeier, R.; Arab, S.; Ji, L. Improving the Operational Simplified Surface Energy Balance Evapotranspiration Model Using the Forcing and Normalizing Operation. Remote Sens. 2023, 15, 260. [Google Scholar] [CrossRef]
- Bastiaanssen, W.G.M.; Menenti, M.; Feddes, R.A.; Holtslag, A.A.M. A remote sensing surface energy balance algorithm for land (SEBAL): 1. Formulation. J. Hydrol. 1998, 212–213, 198–212. [Google Scholar] [CrossRef]
- De Teixeira, A.H.; Bastiaanssen, W.G.; Ahmad, M.U.D.; Bos, M.G. Reviewing SEBAL input parameters for assessing evapotranspiration and water productivity for the Low-Middle Sao Francisco River basin, Brazil: Part A: Calibration and validation. Agric. For. Meteorol. 2009, 149, 462–476. [Google Scholar] [CrossRef]
- Long, D.; Singh, V.P.; Li, Z.L. How sensitive is SEBAL to changes in input variables, domain size and satellite sensor? J. Geophys. Res. Atmos. 2011, 116, D21107. [Google Scholar] [CrossRef]
- Bhattarai, N.; Dougherty, M.; Marzen, L.J.; Kalin, L. Validation of evaporation estimates from a modified surface energy balance algorithm for land (SEBAL) model in the south-eastern United States. Remote Sens. Lett. 2011, 3, 511–519. [Google Scholar] [CrossRef]
- Paul, G.; Gowda, P.H.; Prasad, P.V.V.; Howell, T.A.; Aiken, R.M.; Neale, C.M.U. Investigating the influence of roughness length for heat transport (zoh) on the performance of SEBAL in semi-arid irrigated and dryland agricultural systems. J. Hydrol. 2014, 509, 231–244. [Google Scholar] [CrossRef]
- Mkhwanazi, M.; Chávez, J.L.; Andales, A.A. SEBAL-A: A remote sensing ET algorithm that accounts for advection with limited data. Part I: Development and validation. Remote Sens. 2015, 7, 15046–15067. [Google Scholar] [CrossRef]
- Lee, Y.; Kim, S. The modified SEBAL for mapping daily spatial evapotranspiration of South Korea using three flux towers and terra MODIS data. Remote Sens. 2016, 8, 983. [Google Scholar] [CrossRef]
- Bhattarai, N.; Quackenbush, L.J.; Im, J.; Shaw, S.B. A new optimized algorithm for automating endmember pixel selection in the SEBAL and METRIC models. Remote Sens. Environ. 2017, 196, 178–192. [Google Scholar] [CrossRef]
- Atasever, U.H.; Ozkan, C. A New SEBAL Approach Modified with Backtracking Search Algorithm for Actual Evapotranspiration Mapping and On-Site Application. J. Indian Soc. Remote Sens. 2018, 46, 1213–1222. [Google Scholar] [CrossRef]
- Mohan, M.M.P.; Rajitha, K.; Varma, M.R.R. Integration of soil moisture as an auxiliary parameter for the anchor pixel selection process in SEBAL using Landsat 8 and Sentinel-1A images. Int. J. Remote Sens. 2020, 41, 1214–1231. [Google Scholar] [CrossRef]
- Allen, R.G.; Tasumi, M.; Trezza, R. Satellite-Based Energy Balance for Mapping Evapotranspiration with Internalized Calibration (METRIC)—Model. J. Irrig. Drain. Eng. 2007, 133, 380–394. [Google Scholar] [CrossRef]
- Mokhtari, M.H.; Ahmad, B.; Hoveidi, H.; Busu, I. Sensitivity analysis of METRIC–based evapotranspiration algorithm. Int. J. Environ. Res. 2013, 7, 407–422. [Google Scholar]
- Allen, R.G.; Burnett, B.; Kramber, W.; Huntington, J.; Kjaersgaard, J.; Kilic, A.; Kelly, C.; Trezza, R. Automated calibration of the METRIC-Landsat evapotranspiration process. J. Am. Water Resour. Assoc. 2013, 49, 563–576. [Google Scholar] [CrossRef]
- Kilic, A.; Allen, R.; Trezza, R.; Ratcliffe, I.; Kamble, B.; Robison, C.; Ozturk, D. Sensitivity of evapotranspiration retrievals from the METRIC processing algorithm to improved radiometric resolution of Landsat 8 thermal data and to calibration bias in Landsat 7 and 8 surface temperature. Remote Sens. Environ. 2016, 185, 198–209. [Google Scholar] [CrossRef]
- Rezaei, M.; Ghasemieh, H.; Abdollahi, K. Simplified Version of the METRIC Model for Estimation of Actual Evapotranspiration. Int. J. Remote Sens. 2021, 42, 5568–5599. [Google Scholar] [CrossRef]
- Zhao, J.; Li, C.; Yang, T.; Tang, Y.; Yin, Y.; Luan, X.; Sun, S. Estimation of high spatiotemporal resolution actual evapotranspiration by combining the SWH model with the METRIC model. J. Hydrol. 2020, 586, 124883. [Google Scholar] [CrossRef]
- Minacapilli, M.; Agnese, C.; Blanda, F.; Cammalleri, C.; Ciraolo, G.; D’Urso, G.; Iovino, M.; Pumo, D.; Provenzano, G.; Rallo, G. Estimation of actual evapotranspiration of Mediterranean perennial crops by means of remote-sensing based surface energy balance models. Hydrol. Earth Syst. Sci. 2009, 13, 1061–1074. [Google Scholar] [CrossRef]
- French, A.N.; Hunsaker, D.J.; Thorp, K.R. Remote sensing of evapotranspiration over cotton using the TSEB and METRIC energy balance models. Remote Sens. Environ. 2015, 158, 281–294. [Google Scholar] [CrossRef]
- Song, L.; Kustas, W.P.; Liu, S.; Colaizzi, P.D.; Nieto, H.; Xu, Z.; Ma, Y.; Li, M.; Xu, T.; Agam, N.; et al. Applications of a thermal-based two-source energy balance model using Priestley-Taylor approach for surface temperature partitioning under advective conditions. J. Hydrol. 2016, 540, 574–587. [Google Scholar] [CrossRef]
- Diarra, A.; Jarlan, L.; Er-Raki, S.; Le Page, M.; Aouade, G.; Tavernier, A.; Boulet, G.; Ezzahar, J.; Merlin, O.; Khabba, S. Performance of the two-source energy budget (TSEB) model for the monitoring of evapotranspiration over irrigated annual crops in North Africa. Agric. Water Manag. 2017, 193, 71–88. [Google Scholar] [CrossRef]
- Li, Y.; Kustas, W.P.; Huang, C.; Nieto, H.; Haghighi, E.; Anderson, M.C.; Domingo, F.; Garcia, M.; Scott, R.L. Evaluating Soil Resistance Formulations in Thermal-Based Two-Source Energy Balance (TSEB) Model: Implications for Heterogeneous Semiarid and Arid Regions. Water Resour. Res. 2019, 55, 1059–1078. [Google Scholar] [CrossRef]
- Burchard-Levine, V.; Nieto, H.; Riaño, D.; Migliavacca, M.; El-Madany, T.S.; Perez-Priego, O.; Carrara, A.; Martín, M.P. Seasonal adaptation of the thermal-based two-source energy balance model for estimating evapotranspiration in a semiarid tree-grass ecosystem. Remote Sens. 2020, 12, 904. [Google Scholar] [CrossRef]
- Burchard-Levine, V.; Nieto, H.; Riaño, D.; Migliavacca, M.; El-Madany, T.S.; Guzinski, R.; Carrara, A.; Martín, M.P. The effect of pixel heterogeneity for remote sensing based retrievals of evapotranspiration in a semi-arid tree-grass ecosystem. Remote Sens. Environ. 2021, 260, 112440. [Google Scholar] [CrossRef]
- Xue, K.; Song, L.; Xu, Y.; Liu, S.; Zhao, G.; Tao, S.; Magliulo, E.; Manco, A.; Liddell, M.; Wohlfahrt, G.; et al. Estimating ecosystem evaporation and transpiration using a soil moisture coupled two-source energy balance model across FLUXNET sites. Agric. For. Meteorol. 2023, 337, 109513. [Google Scholar] [CrossRef]
- Song, L.; Ding, Z.; Kustas, W.P.; Hua, W.; Liu, X.; Liu, L.; Liu, S.; Ma, M.; Bai, Y.; Xu, Z. Applications of a Thermal-Based Two-Source Energy Balance Model Coupling the Sun-Induced Chlorophyll Fluorescence Data. IEEE Geosci. Remote Sens. Lett. 2023, 20, 1–5. [Google Scholar] [CrossRef]
- Anderson, M.C.; Norman, J.M.; Mecikalski, J.R.; Torn, R.D.; Kustas, W.P.; Basara, J.B. A multiscale remote sensing model for disaggregating regional fluxes to micrometeorological scales. J. Hydrometeorol. 2004, 5, 343–363. [Google Scholar] [CrossRef]
- Anderson, M.C.; Norman, J.M.; Mecikalski, J.R.; Otkin, J.A.; Kustas, W.P. A climatological study of evapotranspiration and moisture stress across the continental United States based on thermal remote sensing: 1. Model formulation. J. Geophys. Res. Atmos. 2007, 112. [Google Scholar] [CrossRef]
- Anderson, M.C.; Norman, J.M.; Mecikalski, J.R.; Otkin, J.A.; Kustas, W.P. A climatological study of evapotranspiration and moisture stress across the continental United States based on thermal remote sensing: 2. Surface moisture climatology. J. Geophys. Res. Atmos. 2007, 112. [Google Scholar] [CrossRef]
- Anderson, M.C.; Kustas, W.P.; Norman, J.M.; Hain, C.R.; Mecikalski, J.R.; Schultz, L.; González-Dugo, M.P.; Cammalleri, C.; D’Urso, G.; Pimstein, A.; et al. Mapping daily evapotranspiration at field to continental scales using geostationary and polar orbiting satellite imagery. Hydrol. Earth Syst. Sci. 2011, 15, 223–239. [Google Scholar] [CrossRef]
- Knipper, K.R.; Kustas, W.P.; Anderson, M.C.; Alfieri, J.G.; Prueger, J.H.; Hain, C.R.; Gao, F.; Yang, Y.; McKee, L.G.; Nieto, H.; et al. Evapotranspiration estimates derived using thermal-based satellite remote sensing and data fusion for irrigation management in California vineyards. Irrig. Sci. 2019, 37, 431–449. [Google Scholar] [CrossRef]
- Dangol, S.; Zhang, X.; Liang, X.-Z.; Anderson, M.; Crow, W.; Lee, S.; Moglen, G.E.; McCarty, G.W. Multivariate Calibration of the SWAT Model Using Remotely Sensed Datasets. Remote Sens. 2023, 15, 2417. [Google Scholar] [CrossRef]
- Sun, D.; Li, Y.; Zhan, X.; Houser, P.; Yang, C.; Chiu, L.; Yang, R. Land surface temperature derivation under all sky conditions through integrating AMSR-E/AMSR-2 and MODIS/GOES observations. Remote Sens. 2019, 11, 1704. [Google Scholar] [CrossRef]
- Norman, J.M.; Anderson, M.C.; Kustas, W.P.; French, A.N.; Mecikalski, J.; Torn, R.; Diak, G.R.; Schmugge, T.J.; Tanner, B.C.W. Remote sensing of surface energy fluxes at 101-m pixel resolutions. Water Resour. Res. 2003, 39. [Google Scholar] [CrossRef]
- Knipper, K.; Kustas, W.; Anderson, M.; Nieto, H.; Alfieri, J.; Prueger, J.; Hain, C.; Gao, F.; McKee, L.; Alsina, M.M.; et al. Using high-spatiotemporal thermal satellite ET retrievals to monitor water use over California vineyards of different climate, vine variety and trellis design. Agric. Water Manag. 2020, 241, 106361. [Google Scholar] [CrossRef]
- Wu, J.; Feng, Y.; Liang, L.; He, X.; Zeng, Z. Assessing evapotranspiration observed from ECOSTRESS using flux measurements in agroecosystems. Agric. Water Manag. 2022, 269, 107706. [Google Scholar] [CrossRef]
- Knipper, K.; Anderson, M.; Bambach, N.; Kustas, W.; Gao, F.; Zahn, E.; Hain, C.; McElrone, A.; Belfiore, O.R.; Castro, S.; et al. Evaluation of Partitioned Evaporation and Transpiration Estimates within the DisALEXI Modeling Framework over Irrigated Crops in California. Remote Sens. 2023, 15, 68. [Google Scholar] [CrossRef]
- Priestley, C.H.B.; Taylor, R.J. On the assessment of surface heat flux and evaporation using large-scale parameters. Mon. Weather. Rev. 1972, 100, 81–92. [Google Scholar] [CrossRef]
- Aschonitis, V.G.; Papamichail, D.; Demertzi, K.; Colombani, N.; Mastrocicco, M.; Ghirardini, A.; Castaldelli, G.; Fano, E.-A. High-resolution global grids of revised Priestley–Taylor and Hargreaves–Samani coefficients for assessing ASCE-standardized reference crop evapotranspiration and solar radiation. Earth Syst. Sci. Data 2017, 9, 615–638. [Google Scholar] [CrossRef]
- Lambin, E.F.; Ehrlich, D. The surface temperature-vegetation index space for land cover and land-cover change analysis. Int. J. Remote Sens. 2007, 17, 463–487. [Google Scholar] [CrossRef]
- Goward, S.N.; Cruickshanks, G.D.; Hope, A.S. Observed relation between thermal emission and reflected spectral radiance of a complex vegetated landscape. Remote Sens. Environ. 1985, 18, 137–146. [Google Scholar] [CrossRef]
- Hassan, Q.K.; Bourque, C.P.A.; Meng, F.R.; Cox, R.M. A wetness index using terrain-corrected surface temperature and normalized difference vegetation index derived from standard MODIS products: An evaluation of its use in a humid forest-dominated region of eastern Canada. Sensors 2007, 7, 2028–2048. [Google Scholar] [CrossRef] [PubMed]
- Jiang, L.; Islam, S. An intercomparison of regional latent heat flux estimation using remote sensing data. Int. J. Remote Sens. 2003, 24, 2221–2236. [Google Scholar] [CrossRef]
- Wei, J.; Zhu, W. An operational parameterization scheme of surface temperature-vegetation index contextual model for large-scale temporally continuous evapotranspiration estimation: The case study of contiguous United States. J. Hydrol. 2021, 602, 126805. [Google Scholar] [CrossRef]
- Huang, J.J.; Chen, H.; Li, T.; McBean, E.; Singh, V.P. A modified trapezoid framework model for partitioning regional evapotranspiration. Hydrol. Process. 2020, 34, 5026–5042. [Google Scholar] [CrossRef]
- Price, J.C. U sing Spatial Context in Satellite Data to Infer Regional Scale Evapotranspiration. IEEE Trans. Geosci. Remote Sens. 1990, 28, 940–948. [Google Scholar] [CrossRef]
- Carlson, T.N.; Capehart, W.J.; Gillies, R.R. A new look at the simplified method for remote sensing of daily evapotranspiration. Remote Sens. Environ. 1995, 54, 161–167. [Google Scholar] [CrossRef]
- Moran, M.S.; Rahman, A.F.; Washburne, J.C.; Goodrich, D.C.; Weltz, M.A.; Kustas, W.P. Combining the Penman-Monteith equation with measurements of surface temperature and reflectance to estimate evaporation rates of semiarid grassland. Agric. For. Meteorol. 1996, 80, 87–109. [Google Scholar] [CrossRef]
- Jiang, L.; Islam, S. A methodology for estimation of surface evapotranspiration over large areas using remote sensing observations. Geophys. Res. Lett. 1999, 26, 2773–2776. [Google Scholar] [CrossRef]
- Nishida, K.; Nemani, R.R.; Running, S.W.; Glassy, J.M. An operational remote sensing algorithm of land surface evaporation. J. Geophys. Res. Atmos. 2003, 108, 4270. [Google Scholar] [CrossRef]
- Batra, N.; Islam, S.; Venturini, V.; Bisht, G.; Jiang, L. Estimation and comparison of evapotranspiration from MODIS and AVHRR sensors for clear sky days over the Southern Great Plains. Remote Sens. Environ. 2006, 103, 1–15. [Google Scholar] [CrossRef]
- Sobrino, J.A.; Gómez, M.; Jiménez-Muñoz, J.C.; Olioso, A. Application of a simple algorithm to estimate daily evapotranspiration from NOAA–AVHRR images for the Iberian Peninsula. Remote Sens. Environ. 2007, 110, 139–148. [Google Scholar] [CrossRef]
- Stisen, S.; Sandholt, I.; Nørgaard, A.; Fensholt, R.; Jensen, K.H. Combining the triangle method with thermal inertia to estimate regional evapotranspiration—Applied to MSG-SEVIRI data in the Senegal River basin. Remote Sens. Environ. 2008, 112, 1242–1255. [Google Scholar] [CrossRef]
- Zhang, R.; Tian, J.; Su, H.; Sun, X.; Chen, S.; Xia, J. Two Improvements of an Operational Two-Layer Model for Terrestrial Surface Heat Flux Retrieval. Sensors 2008, 8, 6165–6187. [Google Scholar] [CrossRef] [PubMed]
- Tang, R.; Li, Z.L.; Tang, B. An application of the Ts–VI triangle method with enhanced edges determination for evapotranspiration estimation from MODIS data in arid and semi-arid regions: Implementation and validation. Remote Sens. Environ. 2010, 114, 540–551. [Google Scholar] [CrossRef]
- Long, D.; Singh, V.P. A two-source trapezoid model for evapotranspiration (TTME) from satellite imagery. Remote Sens. Environ. 2012, 121, 370–388. [Google Scholar] [CrossRef]
- Yang, Y.; Shang, S.; Guan, H.; Jiang, L. A novel algorithm to assess gross primary production for terrestrial ecosystems from MODIS imagery. J. Geophys. Res. Biogeosci. 2013, 118, 590–605. [Google Scholar] [CrossRef]
- Merlin, O.; Chirouze, J.; Olioso, A.; Jarlan, L.; Chehbouni, G.; Boulet, G. An image-based four-source surface energy balance model to estimate crop evapotranspiration from solar reflectance/thermal emission data (SEB-4S). Agric. For. Meteorol. 2014, 184, 188–203. [Google Scholar] [CrossRef]
- Yang, Y.; Su, H.; Zhang, R.; Tian, J.; Li, L. An enhanced two-source evapotranspiration model for land (ETEML): Algorithm and evaluation. Remote Sens. Environ. 2015, 168, 54–65. [Google Scholar] [CrossRef]
- Minacapilli, M.; Consoli, S.; Vanella, D.; Ciraolo, G.; Motisi, A. A time domain triangle method approach to estimate actual evapotranspiration: Application in a Mediterranean region using MODIS and MSG-SEVIRI products. Remote Sens. Environ. 2016, 174, 10–23. [Google Scholar] [CrossRef]
- Sun, H. A two-source model for estimating evaporative fraction (TMEF) coupling Priestley-Taylor formula and two-stage trapezoid. Remote Sens. 2016, 8, 248. [Google Scholar] [CrossRef]
- Timmermans, W.J.; Kustas, W.P.; Anderson, M.C.; French, A.N. An intercomparison of the Surface Energy Balance Algorithm for Land (SEBAL) and the Two-Source Energy Balance (TSEB) modeling schemes. Remote Sens. Environ. 2007, 108, 369–384. [Google Scholar] [CrossRef]
- Gao, Y.; Long, D. Intercomparison of remote sensing-based models for estimation of evapotranspiration and accuracy assessment based on SWAT. Hydrol. Process. 2008, 22, 4850–4869. [Google Scholar] [CrossRef]
- Senay, G.B.; Budde, M.E.; Allen, R.G.; Verdin, J.P. Evaluating ET estimates from the Simplified Surface Energy Balance (SSEB) model using METRIC model output. In AGU Fall Meeting Abstracts; AGU: Washington, DC, USA, 2008; p. H43G-1098. [Google Scholar]
- Choi, M.; Kustas, W.P.; Anderson, M.C.; Allen, R.G.; Li, F.; Kjaersgaard, J.H. An intercomparison of three remote sensing-based surface energy balance algorithms over a corn and soybean production region (Iowa, U.S.) during SMACEX. Agric. For. Meteorol. 2009, 149, 2082–2097. [Google Scholar] [CrossRef]
- Tang, R.; Li, Z.-L.; Jia, Y.; Li, C.; Sun, X.; Kustas, W.P.; Anderson, M.C. An intercomparison of three remote sensing-based energy balance models using Large Aperture Scintillometer measurements over a wheat–corn production region. Remote Sens. Environ. 2011, 115, 3187–3202. [Google Scholar] [CrossRef]
- Colaizzi, P.D.; Agam, N.; Tolk, J.A.; Evett, S.R.; Howell, T.A.; Gowda, P.H.; O’Shaughnessy, S.A.; Kustas, W.P.; Anderson, M.C. Two-source energy balance model to calculate E, T, and ET: Comparison of Priestley-Taylor and Penman-Monteith formulations and two time scaling methods. Trans. ASABE 2014, 57, 479–498. [Google Scholar]
- Singh, R.K.; Senay, G.B. Comparison of four different energy balance models for estimating evapotranspiration in the Midwestern United States. Water 2015, 8, 9. [Google Scholar] [CrossRef]
- Bhattarai, N.; Shaw, S.B.; Quackenbush, L.J.; Im, J.; Niraula, R. Evaluating five remote sensing based single-source surface energy balance models for estimating daily evapotranspiration in a humid subtropical climate. Int. J. Appl. Earth Obs. Geoinf. 2016, 49, 75–86. [Google Scholar] [CrossRef]
- Lian, J.; Huang, M. Comparison of three remote sensing based models to estimate evapotranspiration in an oasis-desert region. Agric. Water Manag. 2016, 165, 153–162. [Google Scholar] [CrossRef]
- Wagle, P.; Bhattarai, N.; Gowda, P.H.; Kakani, V.G. Performance of five surface energy balance models for estimating daily evapotranspiration in high biomass sorghum. ISPRS J. Photogramm. Remote Sens. 2017, 128, 192–203. [Google Scholar] [CrossRef]
- Lu, L.; Huang, Y.; Ni, W.; Di, L. Estimation of evapotranspiration based on METRIC and TTME models from Landsat data over heterogeneous land surfaces in arid region of China. In Proceedings of the 2017 6th International Conference on Agro-Geoinformatics, Fairfax, VA, USA, 7–10 August 2017; IEEE: Piscataway, NJ, USA, 2017; pp. 1–6. [Google Scholar]
- Senkondo, W.; Munishi, S.E.; Tumbo, M.; Nobert, J.; Lyon, S.W. Comparing remotely-sensed surface energy balance evapotranspiration estimates in heterogeneous and data-limited regions: A case study of Tanzania’s Kilombero Valley. Remote Sens. 2019, 11, 1289. [Google Scholar] [CrossRef]
- Sun, H.; Yang, Y.; Wu, R.; Gui, D.; Xue, J.; Liu, Y.; Yan, D. Improving Estimation of Cropland Evapotranspiration by the Bayesian Model Averaging Method with Surface Energy Balance Models. Atmosphere 2019, 10, 188. [Google Scholar] [CrossRef]
- Yang, Y.; Sun, H.; Xue, J.; Liu, Y.; Liu, L.; Yan, D.; Gui, D. Estimating evapotranspiration by coupling Bayesian model averaging methods with machine learning algorithms. Environ. Monit. Assess. 2021, 193, 156. [Google Scholar] [CrossRef] [PubMed]
- Kamyab, A.D.; Mokhtari, S.; Jafarinia, R. A comparative study in quantification of maize evapotranspiration for Iranian maize farm using SEBAL and METRIC-1 EEFLux algorithms. Acta Geophys. 2022, 70, 319–332. [Google Scholar] [CrossRef]
- Zoratipour, E.; Mohammadi, A.S.; Zoratipour, A. Evaluation of SEBS and SEBAL algorithms for estimating wheat evapotranspiration (case study: Central areas of Khuzestan province). Appl. Water Sci. 2023, 13, 137. [Google Scholar] [CrossRef]
- Adem, E.; Boteva, S.; Zhang, L.; Elhag, M. Estimation of evapotranspiration based on METRIC and SEBAL model using remote sensing, near Al-Jouf, Saudi Arabia. Desalination Water Treat. 2023, 290, 94–103. [Google Scholar] [CrossRef]
- Taheri, M.; Mohammadian, A.; Ganji, F.; Bigdeli, M.; Nasseri, M. Energy-based approaches in estimating actual evapotranspiration focusing on land surface temperature: A review of methods, concepts, and challenges. Energies 2022, 15, 1264. [Google Scholar] [CrossRef]
- Hively, W.D.; Lamb, B.T.; Daughtry, C.S.; Serbin, G.; Dennison, P.; Kokaly, R.F.; Masek, J.G. Evaluation of SWIR crop residue bands for the Landsat Next mission. Remote Sens. 2021, 13, 3718. [Google Scholar] [CrossRef]
- Pascual-Venteo, A.B.; Portalés, E.; Berger, K.; Tagliabue, G.; Garcia, J.L.; Pérez-Suay, A.; Verrelst, J. Prototyping crop traits retrieval models for CHIME: Dimensionality reduction strategies applied to PRISMA data. Remote Sens. 2022, 14, 2448. [Google Scholar] [CrossRef]
- El Hajj, M.; Baghdadi, N.; Bazzi, H.; Zribi, M. Penetration Analysis of SAR Signals in the C and L Bands for Wheat, Maize, and Grasslands. Remote Sens. 2018, 11, 31. [Google Scholar] [CrossRef]
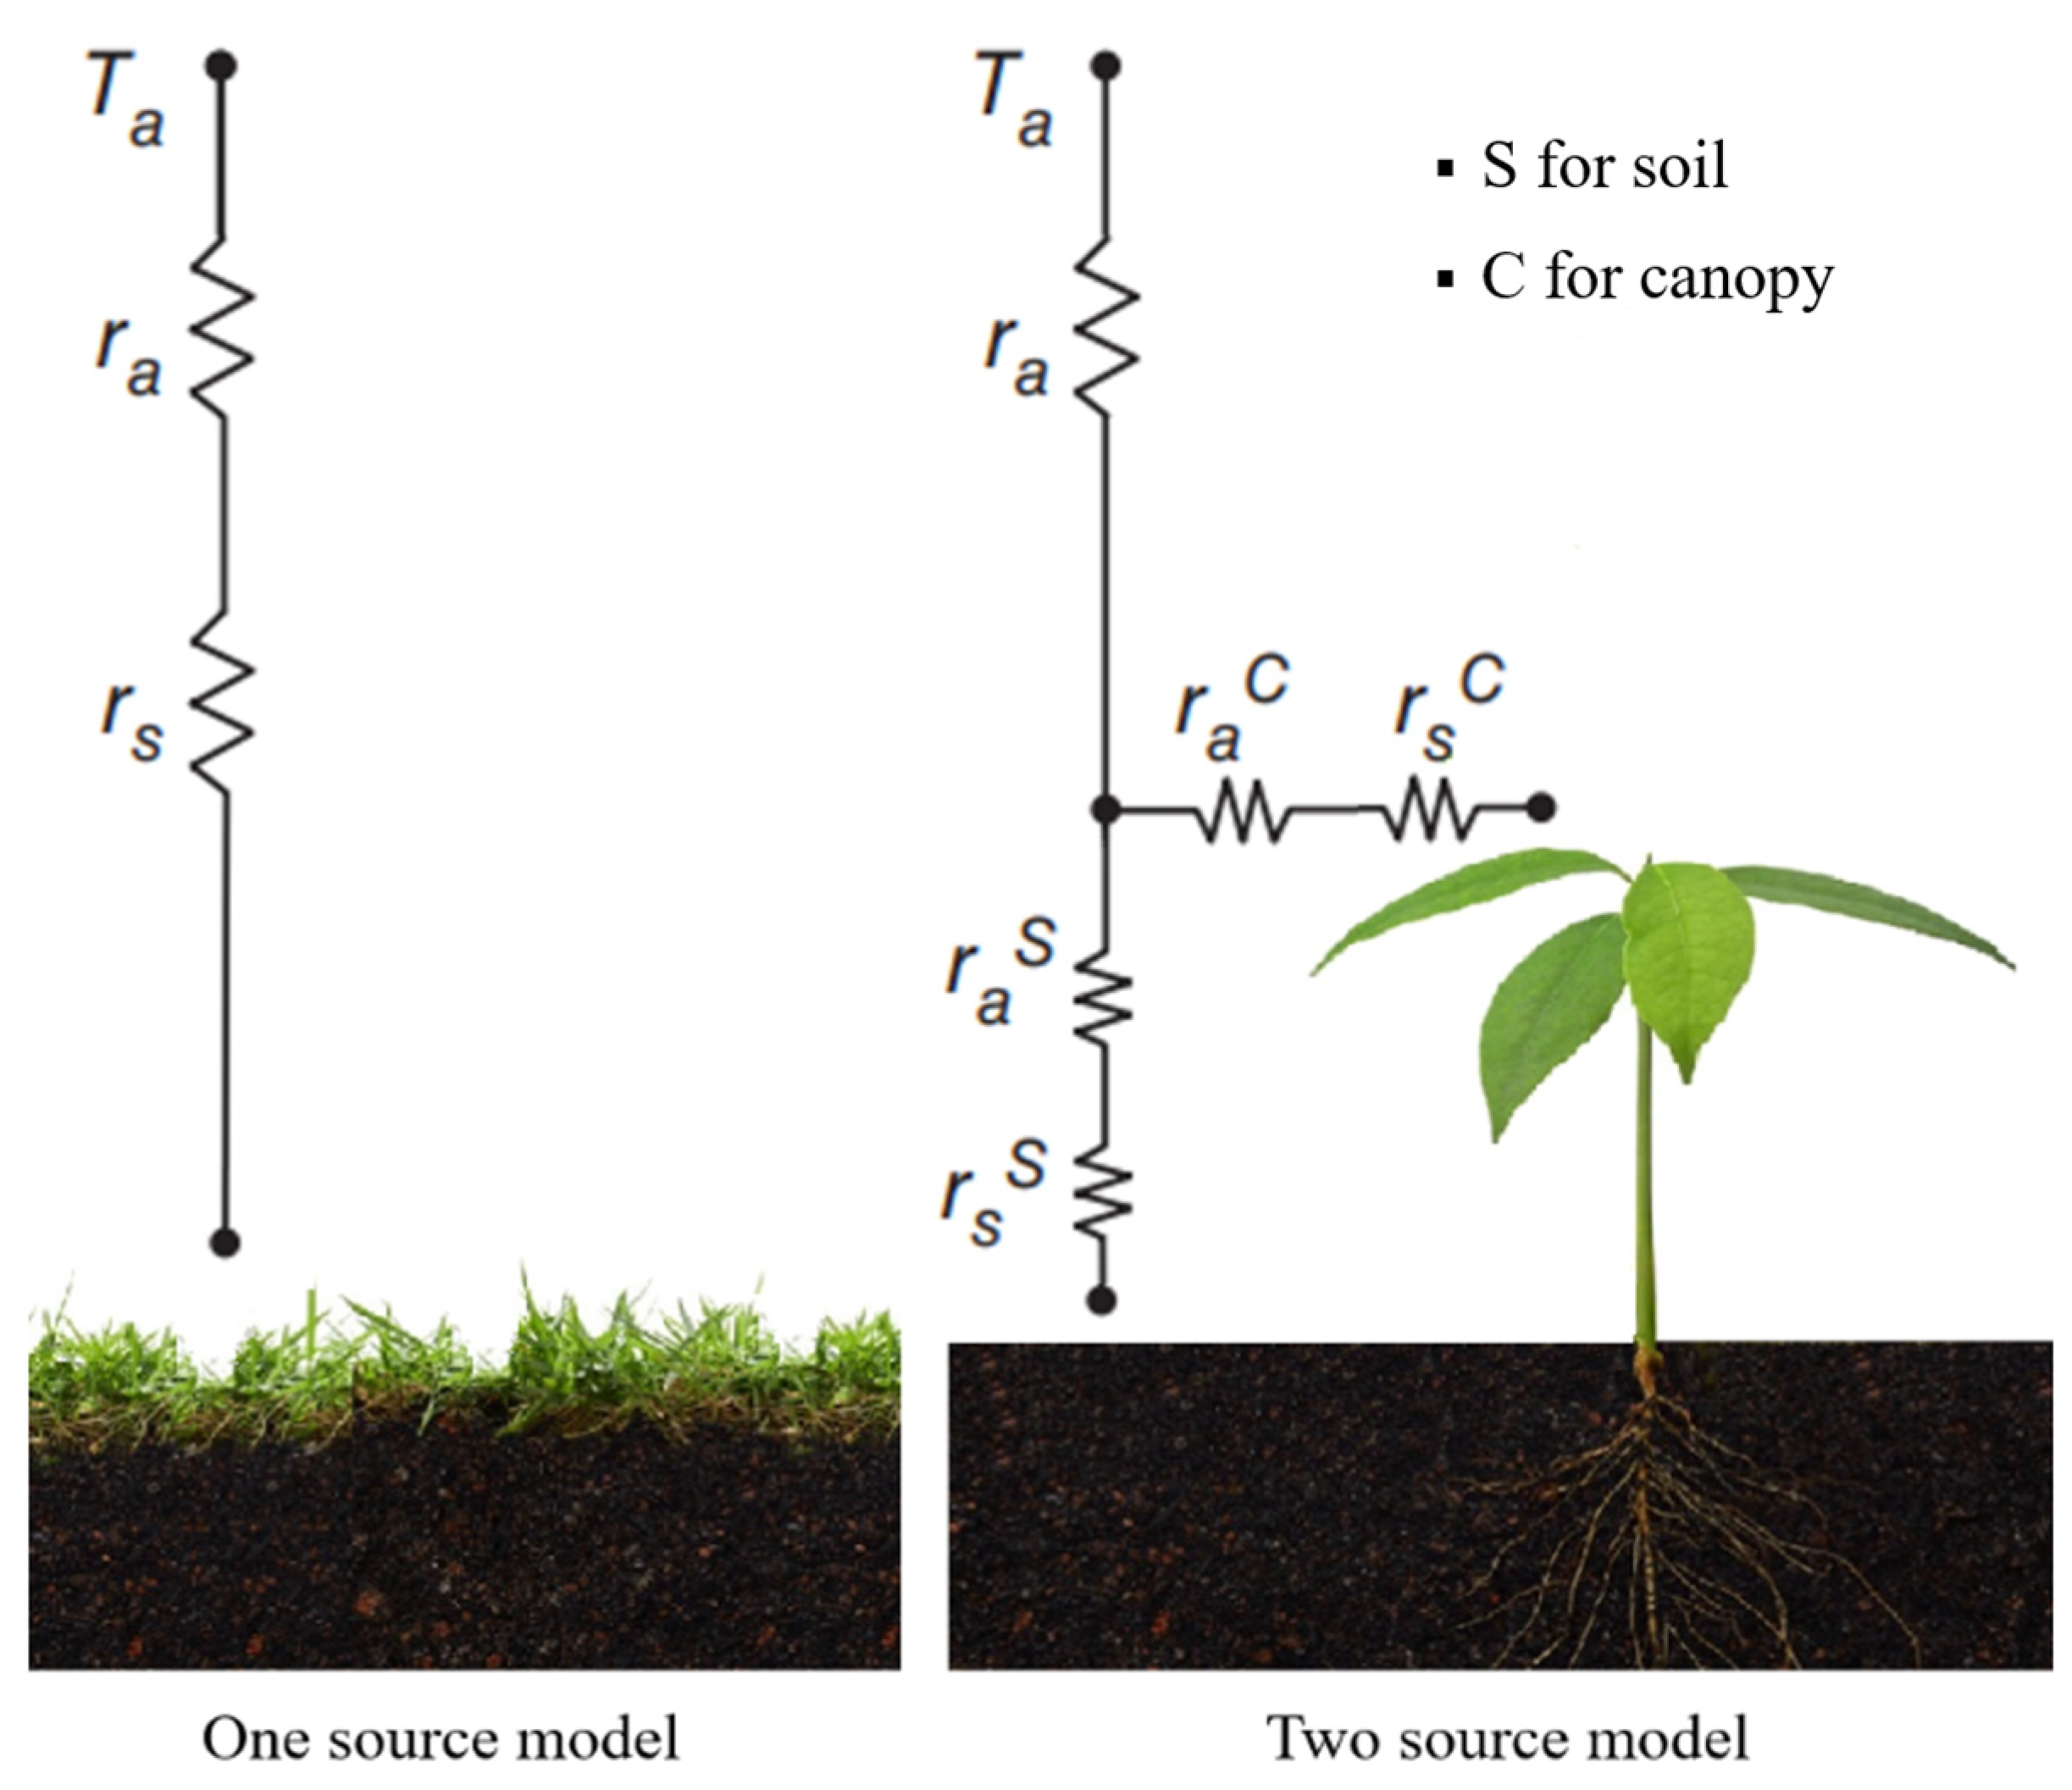
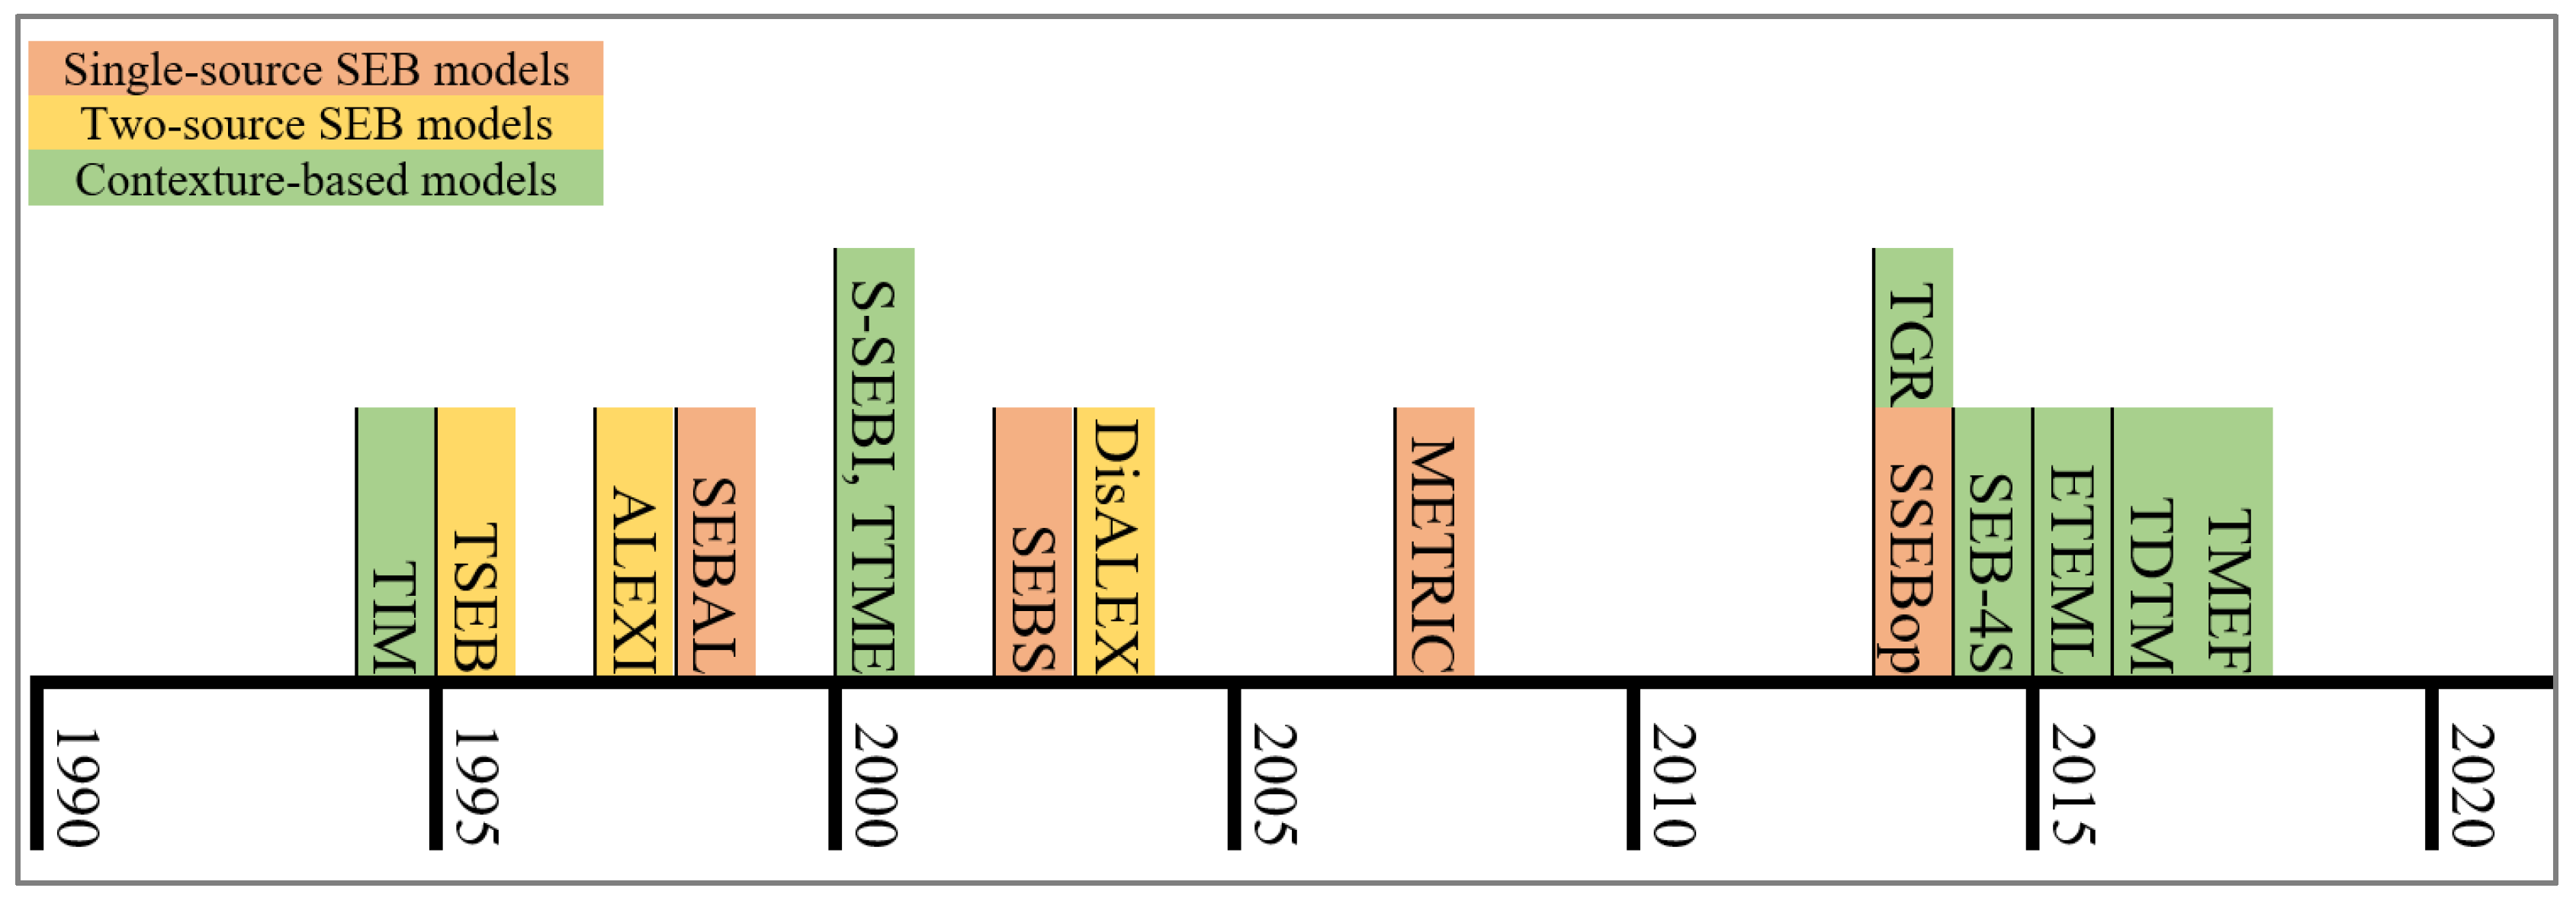
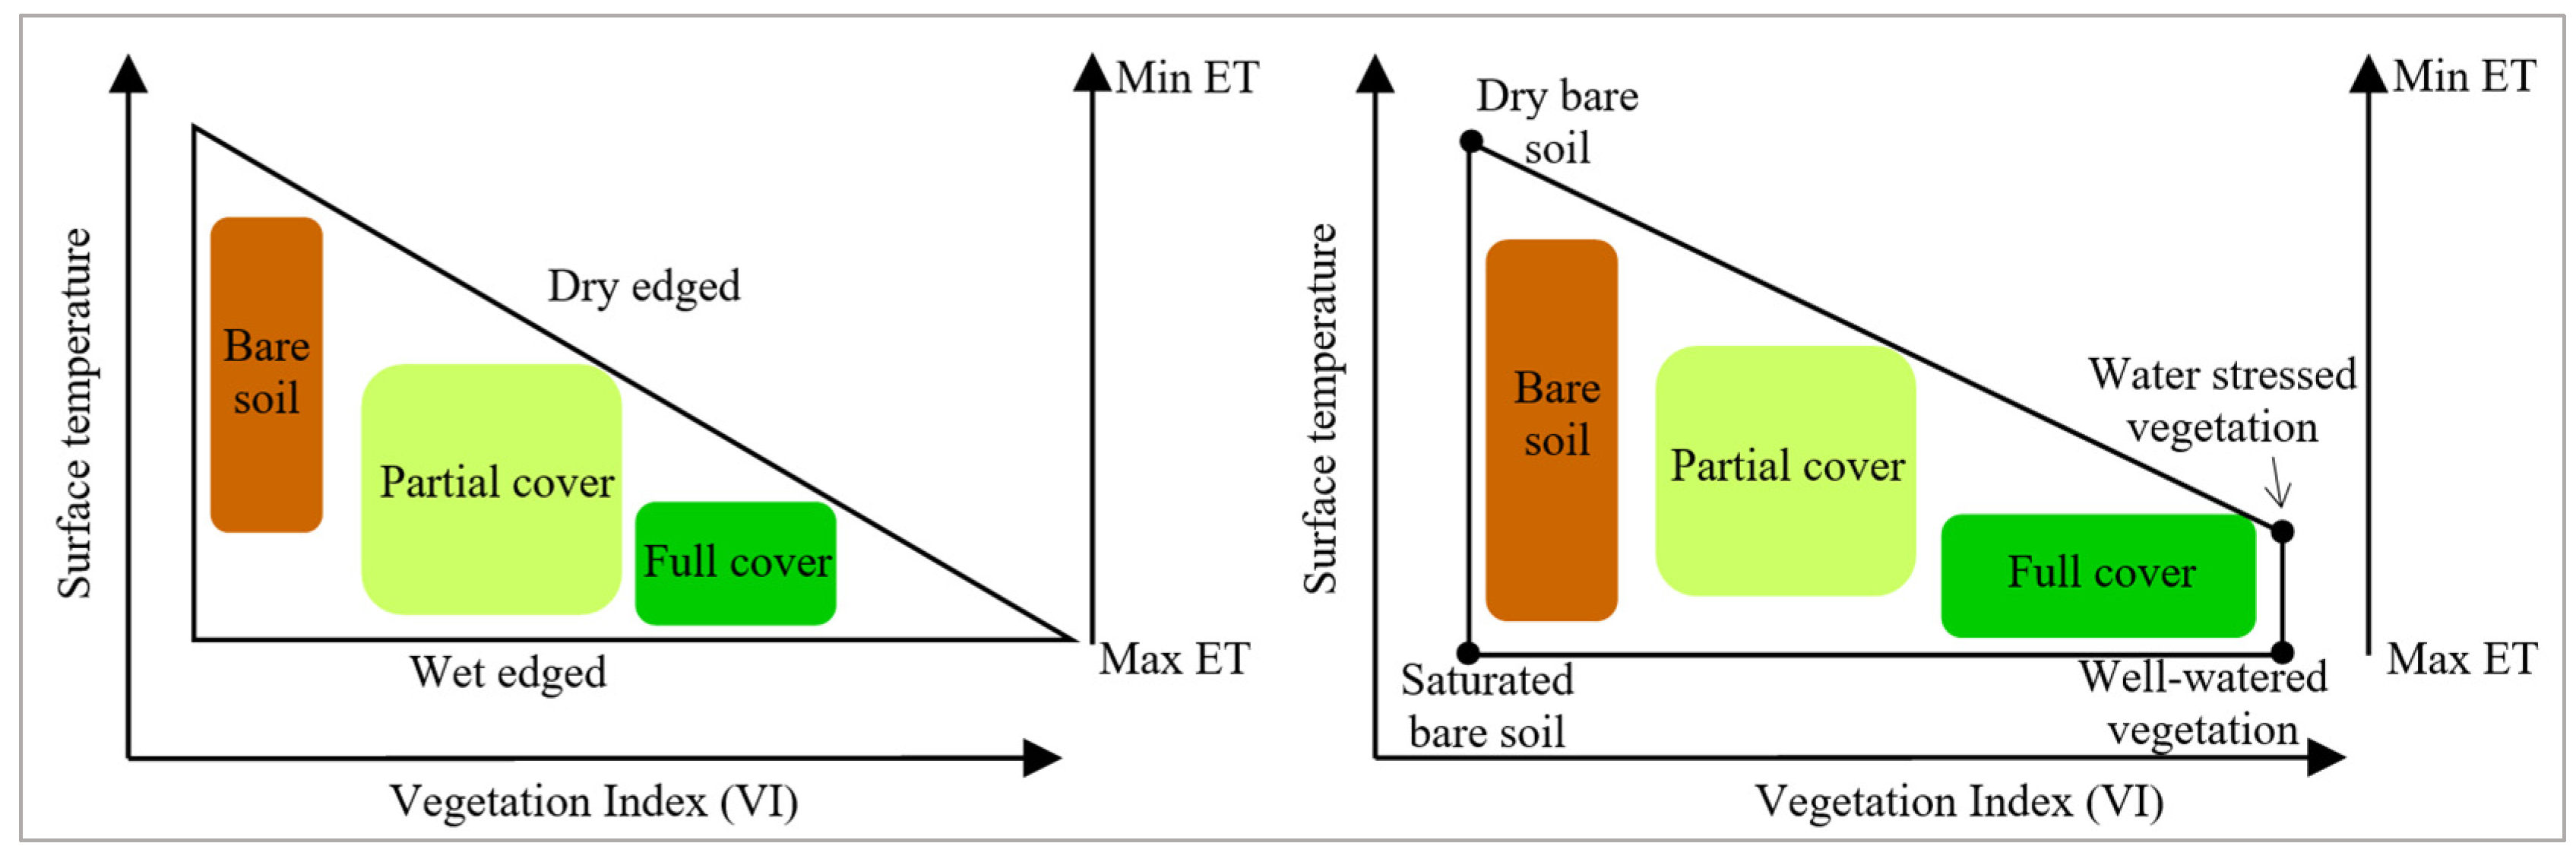
Disclaimer/Publisher’s Note: The statements, opinions and data contained in all publications are solely those of the individual author(s) and contributor(s) and not of MDPI and/or the editor(s). MDPI and/or the editor(s) disclaim responsibility for any injury to people or property resulting from any ideas, methods, instructions or products referred to in the content. |
© 2024 by the authors. Licensee MDPI, Basel, Switzerland. This article is an open access article distributed under the terms and conditions of the Creative Commons Attribution (CC BY) license (https://creativecommons.org/licenses/by/4.0/).