Abstract
Forests are vital for terrestrial ecosystems, providing crucial functions like carbon sequestration and water conservation. In the Yellow River Basin, where 70% of forest coverage is concentrated in the middle reaches encompassing Sichuan, Shaanxi, and Shanxi provinces, there exists significant potential for coal production, with nine planned coal bases. This study centered on Jincheng City, Shanxi Province, a representative coal mining area in the Yellow River Basin, and combined the MSPA analysis method and MCR model to generate the five-period forest ecological network of Jincheng City from 1985 to 2022 under the background of coal mining and calculate the degree centrality, closeness centrality, betweenness centrality, and eigenvector centrality; the correlation between the four centralities and carbon sequestration ability is further explored. Simultaneously, employing the RAND-ESU algorithm for motif identification within forest ecological networks, this study integrates the ecological policies of the research area with the specific conditions of the coal mining region to optimize the forest ecological network in Jincheng City. Findings reveal the following. (1) Forest ecological spatial networks: Forest ecological networks exhibit robust overall ecological connectivity in the study area, with potential ecological corridors spanning the region. However, certain areas with high ecological resistance hinder connectivity between key forest ecological nodes under the background of coal mining. (2) Correlation between topological indices and carbon sequestration ecological services: From 1985 to 2022, the carbon sequestration capacity of Jincheng City’s forest source areas increased year by year, and significant positive correlations were observed between degree centrality, betweenness centrality, eigenvector centrality with carbon sequestration ecological services, indicating a strengthening trend over time. (3) Motif Recognition and Ecological Network Optimization: During the study, four types of motifs were identified in the forest ecological network of Jincheng City based on the number of nodes and their connections using the RAND-ESU network motif algorithm. These motifs are 3a, 4a, 4b, and 4d (where the number represents the number of nodes and the letter represents the connection type). Among these, motifs 3a and 4b play a crucial role. Based on these motifs and practical considerations, network optimization was performed on the existing ecological source areas to enhance the robustness of the forest ecological network.
1. Introduction
Since the advent of the Industrial Revolution, characterized by the relentless progression of economic and societal development alongside advancements in industrialization, there has been an unprecedented reliance on fossil fuel resources such as coal in human production and livelihoods [1]. Extensive coal mining has led to significant emissions of CO2 and other greenhouse gases, contributing significantly to environmental pressures and burdens such as land subsidence and water pollution [2]. Forests, as primary ecosystems [3], play a crucial role in sequestering atmospheric CO2, thereby serving as the largest carbon reservoirs within ecosystems. In the face of climate change induced by CO2 emissions, forest carbon sequestration emerges as a critical component in mitigating environmental impacts [4,5].
Within the global context of carbon sink trading, the imperative to harmonize the objective necessity of coal mining activities with the imperative for ecological conservation in coal mining regions becomes a pressing ecological concern [6,7]. Ecological networks, as a fundamental concept and method in ecology, represent a focal point in landscape ecology research [8,9,10,11]. They offer a pivotal approach to integrating landscape structure, ecological processes, and functions [12,13]. Originating from Little’s definition of “greenways” in the 1990s [14], which delineated protected linear corridors aimed at enhancing environmental quality and providing recreational spaces, the concept has evolved into ecological corridors [15]. These corridors, based on complex network theory, serve as integral components in ecological network research, facilitating the identification of ecological source areas, construction of ecological resistance surfaces, and extraction of vital ecological corridors [16].
The MSPA method was introduced into the ecological field and utilizes mathematical morphology algorithms to derive seven distinct landscape types from binary land-use maps [17,18]. This method is instrumental in identifying ecological source areas and rectifying the subjectivity inherent in traditional assessments [19]. In recent years, some researchers have applied the MSPA method to the study of mining ecology. Li et al. adopted the MSPA method combined with ecological risk assessment to extract core regions and optimize the ecological security pattern of coal mining in semi-arid areas in northern China [20]. Zhang et al. extracted ecological source areas based on the MSPA method to study the evolution and optimization of ecological networks in Hexi Corridor, a typical coal mining area [21]. Coupled with the MCR model proposed by KNAAPEN et al. [22], ecological corridors are constructed and evaluated based on comprehensive factors such as terrain, landforms, vegetation indices, and water bodies [23,24]. This integrated approach, combining MSPA and MCR, has found application across various landscape types and ecological issues, including lakes, mines, rivers, and wetlands [21,25]. In addition to their ecological significance, ecological networks exhibit properties akin to other networks [26]. Song’s characterization of complex networks underscores their self-similarity [27]. Of particular importance is the network motif, initially proposed by R. Milo in 2002, which has found widespread application in diverse fields such as bioinformatics, social sciences, and aviation networks [28,29,30]. Meanwhile, algorithms for motif recognition have been continuously evolving [31]. Holland and Leinhardt pioneered the concept of a triad census of networks, laying the groundwork for the study of network motifs [32,33]. Weinicke introduced an algorithm called RAND-ESU, which can be applied to directed or undirected networks. It enables effective sampling in networks using unbiased nodes, resulting in more precise identification outcomes [34].
The Yellow River Basin, characterized by a concentration of 70% of its forest cover in the middle reaches, faces the dual challenges of extensive coal reserves and significant coal production potential [35]. Research has indicated that coal mining activities have completely destroyed the primary forests (broadleaf forests) in certain regions of the Yellow River Basin, causing irreversible damage to the ecosystem [36,37]. Currently, with the continuous implementation of ecological policies, the primary driving factor for land use changes in the Yellow River Basin is the increase in forest cover due to afforestation efforts. Although the ecological environment has improved to some extent, the impact of coal mining remains significant and cannot be overlooked [38].
Jincheng City is situated within the Jindong National Coal Base, a critical coal production hub in the mid-lower reaches of the Yellow River Basin [39]. This area is notably rich in coal deposits and features the typical loess gully topography, which constitutes over 80% of the region. The climatic conditions of Jincheng City are analogous to those prevalent in much of the Yellow River Basin, thereby providing a representative case study for the region. This study, focusing on Jincheng City, Shanxi Province, within the Yellow River Basin, applies the MSPA method to pinpoint forest ecological source areas and analyze their distribution patterns across five periods from 1985 to 2022. Subsequent utilization of the MCR model facilitates the construction of forest ecological networks, enabling the assessment of key topological characteristics and their implications for carbon sequestration. Furthermore, leveraging motif recognition based on RAND-ESU, this study pioneers an analysis of ecological networks, providing suggestions for local ecological development.
2. Materials and Methods
2.1. Study Aera
The Yellow River Basin refers to the geographical and ecological area influenced by the Yellow River system from its source to its estuary, covering a drainage area of 752,443 square kilometers [38]. It is a major ecological region in China. Additionally, nine of China’s major coal production bases, including Shanbei, Jinbei, Jinzhong, Jindong, Huanglong, Shendong, Ningdong, Henan, and Luxi, are concentrated in the Yellow River Basin. These bases account for approximately 70% of the country’s total coal production [40]. Jincheng City (111°5′–113°7′E, 35°11′–36°04′N) is situated in the southeastern region of Shanxi Province, China, in the Yellow River basin of the national planning coal base named Jindong [39]. Spanning an area of approximately 9490 square kilometers, its administrative jurisdiction comprises six counties (or districts), namely Chengqu, Zezhou, Gaoping, Yangcheng, Lingchuan, and Qinshui. The prevailing climate in the area is characterized by a warm temperate semi-humid monsoon climate, presenting mild and agreeable conditions. The annual mean temperature stands at 13.2 °C, with an average yearly precipitation of about 578.8 mm and an estimated annual sunshine duration of around 2547.6 h. The region enjoys a frost-free period lasting roughly 200 days annually, which facilitates favorable conditions for the proliferation of vegetation, particularly forest growth. Geographically, the terrain predominantly comprises mountainous and hilly landscapes, with mountains covering 58.6% and hills covering 28.5% of the area [41]. The eastern, western, and southern sectors are typified by contiguous mountain ranges, whereas the northern and central regions are marked by undulating hills interspersed with basin formations. Altitude differentials are notable, with the highest peak exceeding 2300 m and the lowest point registering less than 300 m, resulting in a substantial relative elevation variance of approximately 2000 m. The majority of the terrain resides at elevations surpassing 800 m. Refer to Figure 1 and Figure 2 for a visual representation.

Figure 1.
Schematic diagram of the study area.
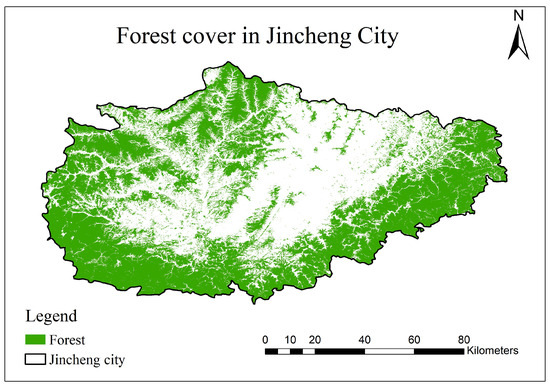
Figure 2.
Forest cover map of Jincheng City.
In addition, Jincheng City boasts abundant coal reserves, with an anticipated total coal deposit of 80.81 billion tons, of which 27.33 billion tons have been ascertained. Notably, the anthracite coal reserves represent over 25% of the national total [42]. Presently, Jincheng City hosts 124 coal mines, predominantly clustered within its central district, spanning a collective area of 1820.3 square kilometers. The coal mining industry contributes to over 80% of the city’s total mining output, thus characterizing it as a quintessential resource-dependent urban center (Figure 3). Objectively, the coal sector serves as the linchpin of the local economy, with a per capita GDP reaching USD 15,659 in 2022. Nevertheless, the protracted and large-scale coal extraction has engendered considerable adverse ecological consequences, including land subsidence, groundwater depletion, and exacerbated air quality, persistently afflicting the region. Consequently, striking a harmonious equilibrium between forest ecosystem preservation and coal mining activities stands as an imperative issue warranting substantive resolution.
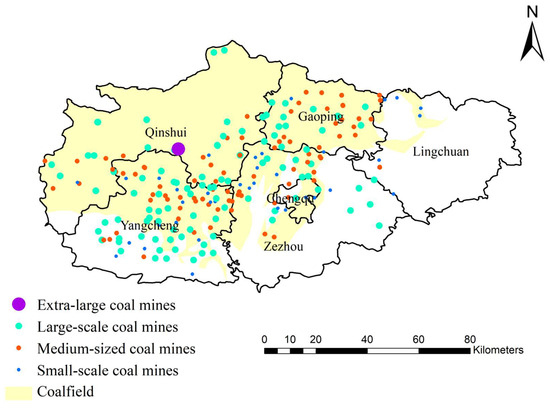
Figure 3.
Basic distribution map of coal mines in the study area.
2.2. Data Sources and Processing
The DEM data of Jincheng City in this study were acquired from the SRTM dataset (https://earthexplorer.usgs.gov/, accessed on 31 May 2024). Surface reflectance data from Landsat 5/8 were processed using Google Earth Engine (GEE) (https://earthengine.google.com/, accessed on 31 May 2024) to compute the Normalized Difference Vegetation Index (NDVI) and Modified Normalized Difference Water Index (MNDWI). Land use data originated from the China 30 m Annual Land Cover Dataset and its Dynamic Changes (1985–2022) dataset (https://zenodo.org/, accessed on 31 May 2024). Slope data were extracted from the DEM data using ArcGIS 10.2. The distribution data of coal mines in Jincheng City were obtained from the National Mineral Database (http://ngac.org.cn/Kuangchandi/index.html, accessed on 31 May 2024). The boundary data of Jincheng City were downloaded from the Resource and Environment Science and Data Center of the Chinese Academy of Sciences (https://www.resdc.cn/, accessed on 31 May 2024) and Shanxi Natural Resources Department (https://zrzyt.shanxi.gov.cn/zwgk/bzdt/ztdt/jjjs/202112/t20211221_4178635.shtml, accessed on 31 May 2024). NPP data were sourced from the Global Change Science Research Data Publishing System (https://geodoi.ac.cn/WebCn/Default.aspx, accessed on 31 May 2024) and MODIS satellite data (https://lpdaac.usgs.gov/products/mod17a3hgfv061/, accessed on 31 May 2024). The data processing and analysis were conducted using Google Earth Engine, ArcGIS 10.2, Graphab 10, Gephi 0.10.1, Fanmod 7.2, and other platforms and software. The above data set is presented in Figure S1.
2.3. Flow Chart
The following is the flow chart of this study (Figure 4).

Figure 4.
The data processing procedures and thinking.
2.4. Ecological Remote Sensing Indices
2.4.1. Normalized Difference Vegetation Index (NDVI)
The Normalized Difference Vegetation Index (NDVI) is a commonly employed metric in remote sensing, particularly satellite imagery analysis, to assess the vegetative health and vigor of target areas [43]. This index relies on variations in reflectance between vegetation in the red and near-infrared spectral bands. The formula for NDVI computation is as follows:
where and represent the reflectance values in the near-infrared and red spectral bands, respectively. The resulting values range from −1 to 1, with higher values indicating denser vegetation cover and greater photosynthetic activity [44]. This article uses the annual average of NDVI calculated based on the 16-day period number.
2.4.2. Modified Normalized Difference Water Index (MNDWI)
The Modified Normalized Difference Water Index (MNDWI), proposed by Xu in 2005, is an enhancement of traditional water indices for improved water body detection using remote sensing data [45]. MNDWI capitalizes on the distinct spectral properties of water bodies, particularly their high absorption in the shortwave infrared (SWIR) and low absorption in the green spectral bands [46]. The formula for MNDWI calculation is as follows:
where and represent the reflectance values in the green and shortwave infrared spectral bands, respectively. values range from −1 to 1, with higher values indicative of higher water content, making it valuable for applications such as water body mapping, hydrological analysis, and environmental monitoring. This article uses the annual average of MNDWI calculated based on the 16-day period number.
2.5. Construction of Ecological Network
2.5.1. Identification of Ecological Sources Using MSPA Approach
Ecological source areas refer to regions that provide materials and energy to adjacent ecosystems, concentrating most ecosystem service functions and promoting material exchange and energy flow within the ecosystem [47,48]. Forests represent an indispensable component of ecosystems, characterized by their pivotal roles in carbon sequestration, water retention, and the preservation of genetic diversity; thus, they are crucial for maintaining ecological equilibrium [49]. The dynamics of forest ecosystems are intimately linked with fluctuations in the ecological milieu, warranting the prioritization of forest land cover types in the selection of ecological source areas. The MSPA method epitomizes a spatial analytical technique founded on morphological algorithms [50]. Employing binary maps, this method rigorously examines and categorizes intrinsic spatial relationships at the pixel level, thereby precisely delineating and classifying landscape covers. The method discerns seven landscape elements: core zones, bridging areas, islands, peripheries, lacunae, branches, and loops. It is extensively applied in landscape ecology classification to identify the most critical patches within a landscape. In the study of ecological networks, this approach is utilized to extract sources of high importance, thereby refining the scientific rigor in the selection of ecological source areas and corridors. [51]. In this investigation, land cover type maps spanning 1985, 1995, 2005, 2015, and 2022 were employed. Forested regions were assigned a foreground value of 2, while farmlands, shrublands, water bodies, barren lands, and urbanized zones were designated as background with a value of 1. These datasets were subsequently imported into Guidos 2.8 software for analysis (Figure 5). The core zones identified through MSPA analysis were initially designated as ecological source areas. To refine this selection, patch area was utilized as a criterion, as larger patches typically exhibit more robust ecosystem service functions and enhanced material and energy flux. A screening threshold of 50 hm2 was established, with patches exceeding this size classified as the final ecological source areas. This process of identifying and selecting forest ecological source areas underpins the subsequent development of the ecological network in Jincheng City.
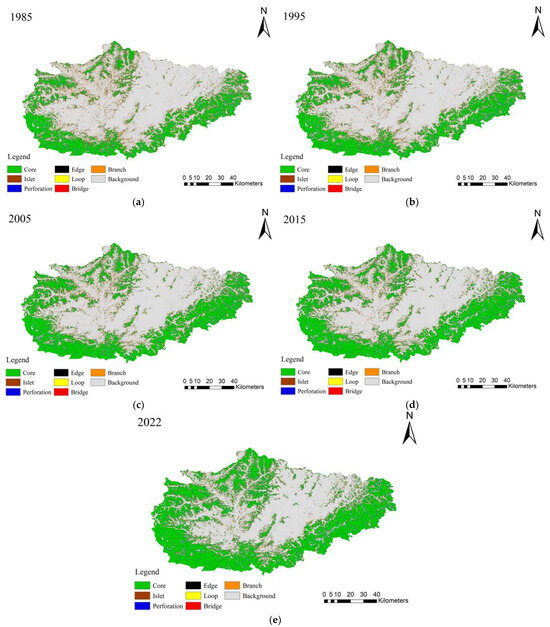
Figure 5.
Analysis results of MSPA landscape patterns. (a) Result in 1985, (b) result in 1995, (c) result in 2005, (d) result in 2015, (e) result in 2022.
2.5.2. Ecological Network Resistance Surfaces
Ecological network resistance surfaces represent spatial amalgamations within ecological networks that hinder the exchange of matter and the flow of energy between source areas [52], and it is one of the essential conditions for the construction of ecological network. The amalgamation of anthropogenic and natural elements in these surfaces facilitates an evaluation of the extent to which ecological service functionalities are impeded within the ecological network. This investigation delineated five key ecological factors: the Normalized Difference Vegetation Index (NDVI), Modified Normalized Difference Water Index (MNDWI), land cover classification, Digital Elevation Model (DEM), and slope. Employing ArcGIS 10.2, a natural break method was applied to reclassify these ecological factors, with resistance values assigned based on foundational ecological principles and previous empirical studies spanning a range from 1 to 9. Additionally, raster analysis was conducted using a grid calculator to overlay these ecological factors. Higher resistance values signify heightened impediments to ecological service functionalities, resulting in diminished efficiency in material exchange and energy flow. Conversely, lower resistance values indicate reduced hindrances to ecological service functionalities, thereby enhancing the efficiency of material exchange and energy flow within the ecological system. The setting of the resistance values of each ecological factor in 2022 is shown in Table 1. The resistance values of ecological resistance factors in 1995, 2005, and 2015 are set in Tables S1–S3.

Table 1.
Setting of resistance values of ecological impact factors in 2022.
2.5.3. Extraction of Potential Ecological Corridors Based on MCR
The Minimum Cumulative Resistance (MCR) model constitutes an approach for optimizing solutions within a system. Its fundamental tenet involves the reduction of interference or resistance to the system to the maximum extent feasible under specified constraints, thereby achieving optimization objectives [53]. Initially proposed by Knaapen et al. in 1992 for the study of species migration. Scholars have subsequently modified it, utilizing its characteristics of permeability and accessibility to extensively compute potential ecological corridors within ecological resistance surfaces [54]. Ecological corridors, being the paths of least resistance between source areas within ecological resistance surfaces, facilitate the establishment of ecological networks [55]. The fundamental formula is as follows:
In the equation, denotes the Minimum Cumulative Resistance value, represents an unspecified positive function, signifies a positive association between the Minimum Cumulative Resistance and ecosystem service functionalities, stands for the spatial distance from target unit to ecological source site , denotes the resistance coefficient of target unit to ecological processes [56]. Additionally, denotes the quantity of source sites, while indicates the count of resistance surface grids.
Ecological corridors are crucial ecological structures that play a key role in facilitating the movement of plants and animals within landscapes, thereby maintaining biodiversity and ecosystem health [57]. They are particularly important in fragmented landscapes susceptible to human activities such as urbanization, agricultural expansion, or infrastructure development. In this study, Graphab 2.6.1 software was employed to calculate ecological networks in different periods of Jincheng City, Shanxi Province, using ecological source areas and ecological network resistance surfaces as initial data based on the MCR model. This allowed for the determination of ecological corridors between different source areas to form forest ecological networks combined with ecological areas.
2.6. Computation of Topological Features in Ecological Networks
This study, grounded in complex network theory [58], computed four topological metrics of forest ecological networks: degree centrality, closeness centrality, betweenness centrality, and eigenvector centrality. These analyses illuminate the evolving trends in the topological characteristics of forest ecological networks over a span of 37 years, thereby providing a foundational framework for correlational analyses between topological structures and carbon sequestration capacity.
2.6.1. Degree Centrality
Degree centrality serves as a quantitative measure to assess the significance of nodes within a network [59]. Degree centrality in ecological networks indicates a node’s pivotal role in material exchange and network stability. The formula for computing degree centrality is articulated as follows:
where represents the degree centrality of a node, represents the number of edges connected by node , that is, the degree of node v, and is the total number of nodes in the ecological network [60].
2.6.2. Closeness Centrality
Closeness centrality, vital in network analysis, gauges a node’s spatial significance by considering its proximity to all others. It is calculated as the reciprocal of the average distance from the node to all others [61]. Thus, nodes characterized by higher closeness centrality exhibit shorter average distances to neighboring nodes, signifying their closer proximity to the network’s central locus. This centrality metric is frequently employed to gauge node influence and the efficacy of energy flow within the network. The formula for calculating closeness centrality is expressed as follows:
where represents the proximity of a node, represents the total number of nodes in the ecological network, and represents the shortest path length from node to node [62].
2.6.3. Betweenness Centrality
Betweenness centrality stands as a metric in network analysis employed to quantify a node’s role in bridging disparate segments of the network [63]. It measures a node’s capacity to act as an intermediary in connecting other nodes within the network. A heightened betweenness centrality of a node suggests its substantial involvement in facilitating the shortest paths between pairs of nodes in the network [64]. Precisely, a node’s betweenness centrality is computed by assessing the frequency with which it resides along the shortest paths between all pairs of nodes in the network. The formula for betweenness centrality computation is elucidated as follows:
where represents the betweenness centrality of a node; represents the number of shortest paths from node s to node ; represents the number of paths through node in the shortest path from node to node ; represents the number of nodes in the network [65].
2.6.4. Eigenvector Centrality
Eigenvector centrality stands out as a prevalent metric in network analysis utilized to evaluate the significance or impact of nodes within a network [66]. It derives from the connectivity patterns of nodes, accentuating connections with other pivotal nodes. Within a network, a node boasting connections to numerous other influential nodes garners high eigenvector centrality. This metric takes into account the centrality of neighboring nodes and the strength of their connections [67]. Consequently, even nodes with low degrees (i.e., few connections) may exhibit high eigenvector centrality if they are linked to other highly central nodes. The formula for calculating eigenvector centrality is articulated as follows:
where signifies the feature vector centrality of node ; corresponds to the -th row and -th column element in the adjacency matrix, indicating the presence or absence of a connection between node and node ; stands for the maximum eigenvalue of the feature vector centrality, denoting the velocity of information dissemination throughout the network. The determination of feature vector centrality involves an iterative procedure, typically accomplished by solving for the eigenvalues and eigenvectors of the matrix.
2.7. Pearson Analysis of Carbon Sequestration Capacity and Topological Structure
Net Primary Productivity (NPP) denotes the rate at which plants convert solar energy into organic compounds through photosynthesis within an ecosystem, subtracting the portion consumed by plant respiration [68]. NPP stands as a primary indicator of vegetation growth within ecosystems and serves as a pivotal driver of energy flux and material cycling within ecological systems. In the realm of carbon sequestration, NPP emerges as pivotal. It signifies the fixed carbon quantity within an ecosystem, wherein absorbed carbon dioxide undergoes conversion into organic carbon via photosynthesis. Augmenting NPP leads to an escalation in the carbon reservoir within ecosystems, thereby curtailing atmospheric carbon dioxide concentrations and ameliorating global climate change impacts. Consequently, the NPP of ecosystems is recognized as a carbon sink—a locale adept at absorbing and retaining atmospheric carbon. Thus, NPP serves as a metric to evaluate the vegetation’s carbon sequestration prowess [69].
This study adopts Pearson correlation analysis between NPP data and four topological centrality indices of the forest ecological network in Jincheng City, aiming to demonstrate the correlation between topological features in the ecological network and carbon sequestration capacity.
2.8. Ecological Network Optimization Based on Motif Recognition and Robustness Evaluation
2.8.1. Network Motif Identification Based on the RAND-ESU Algorithm
Network motifs, recurring identical subgraphs within complex networks, possess distinct interaction patterns, distinguishing them from random network structures [70]. The RAND-ESU algorithm, widely applied in network analysis and graph mining, effectively detects such substructures or motifs within networks [71]. Leveraging the RAND-ESU algorithm for motif identification facilitates the discovery of pivotal structural patterns like community structures and subgraphs within intricate networks. This research employs Fanmod software to discern 3- and 4-node motifs within Jincheng City’s forest ecological network, elucidating the significance of diverse motif types within this ecological context and providing objective reference for ecological network optimization. This study defines motif structures as shown in Figure 6.

Figure 6.
Motif classification.
Meanwhile, there are three basic statistical features, namely frequency, -value, and p-value. Frequency is the frequency at which a specific subgraph with nodes in a real network appears in all subgraphs with nodes, with the following formula:
where represents the frequency of motif with nodes, represents the number of occurrences of motif in the actual network, and represents the total number of occurrences of all subgraphs with nodes.
-value is used to measure the importance of the module. The more important the module in the network, the larger its -value. The formula is as follows:
where represents the -value of the motif, represents the number of occurrences of the U motif in the real network, represents the number of occurrences of the motif in the random network, the mean value of is denoted as , and the standard deviation is [72];
The p-value represents the probability that the number of occurrences in a random network is greater than the number of occurrences in the actual network. The smaller the p-value, the more important the motif is in the network [73].
2.8.2. Ecological Stepping Stones
Ecological stepping stones, a construct in landscape ecology, denote a series of minor patches situated amidst large ecological patches, forging pathways for biological migration. These stepping stones assume a pivotal role within ecological networks by augmenting the connectivity between source habitats. Through judicious placement of ecological stepping stones amidst ecological source habitats, the efficacy of ecological energy flux can be optimized, thereby fostering enhanced ecological connectivity [69,74]. This study delves into the significance of network motifs within ecological networks and optimizes the forest ecological network within Jincheng City by identifying patches exceeding 30 hm2 between existing ecological source regions, which may potentially form vital network motifs as ecological stepping stones.
2.8.3. Network Robustness
Network robustness is a critical metric utilized for assessing the efficacy of ecological network optimization, serving to simulate the resilience of ecological systems in the face of perturbations such as attacks or failures [75]. Typically, network robustness is bifurcated into two principal categories based on attack modes: stochastic attack robustness and deliberate attack robustness. Moreover, it can be delineated into three distinct classes contingent upon the focal point of investigation: connectivity robustness, edge recovery robustness, and node recovery robustness.
In this investigation, we focus on the assessment of connectivity robustness, edge recovery robustness, and node recovery robustness within networks subjected to both stochastic and deliberate attack modes [76]. We also evaluate the effectiveness of the network optimization method based on the recognition of forest ecological network modules in Jincheng City using three robustness indicators. Moreover, we assess the changes in robustness before and after optimization to validate the utility of this optimization method. The formulations for these metrics are as follows:
Connectivity robustness:
where represents the network’s connectivity robustness, signifies the quantity of nodes within the largest connected subgraph of the network subsequent to the removal of specified nodes, denotes the initial number of nodes in the network, and denotes the count of nodes removed due to attacks.
Node recovery robustness:
where denotes the node recovery robustness, signifies the total number of nodes within the network, denotes the number of nodes removed, and signifies the count of nodes recovered subsequent to removal.
Edge recovery robustness:
where represents the edge recovery robustness, denotes the total number of edges within the network, denotes the count of edges removed, and denotes the count of edges recovered subsequent to removal.
3. Results
3.1. Ecological Source Identification
The delineation of ecological source areas, as depicted in Figure 7, is predicated upon an amalgamation of patch size and land cover typologies. Over the temporal span from 1985 to 2022, the spatial distribution pattern of these habitats has exhibited a consistent configuration, manifesting a horseshoe-shaped disposition. Predominantly, these ecological source areas coalesce within the northwest, southeast, and southwest quadrants of Jincheng City while displaying a comparatively diminished presence within the central and northeastern sectors. Administrative delineations reveal a concentrated prevalence of these habitats along the peripheries of Yangcheng County, Qinshui County, Lingchuan County, and Zezhou County, characterized by heightened levels of spatial aggregation. Conversely, the habitats within Gaoping City and urban locales evince a dispersed distribution, accompanied by heightened levels of landscape fragmentation, counterpoising the spatial distribution of coal mines within Jincheng City. Geospatially, these habitats tend to occupy elevated terrain or proximal locales to water sources, thus mitigating external perturbations and sustaining their inherent ecological integrity and serviceability. Furthermore, the evolutionary trajectory of ecological habitat distribution delineates a discernible trend of preservation and expansion towards the urban center, alongside incremental augmentations in the central and northeastern sectors. This paradigmatic shift underscores Jincheng City’s emergent cognizance of the imperative of ecological preservation amid protracted coal extraction endeavors, corroborating the efficacy of policy interventions such as eco-friendly mining practices and urban greenization initiatives.
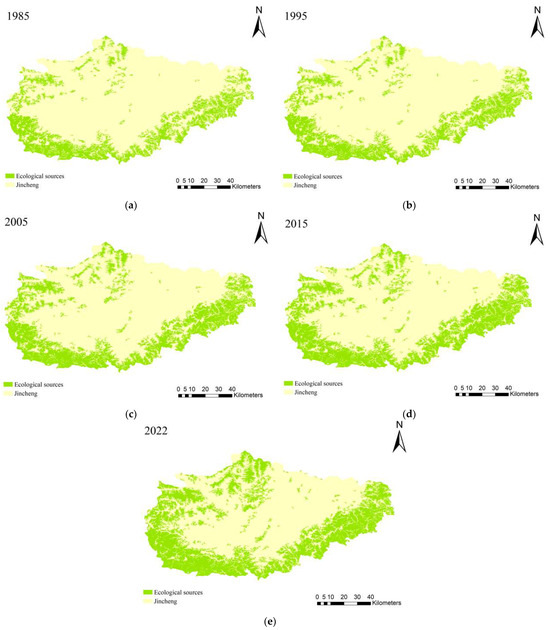
Figure 7.
Identification results of ecological sources. (a) Ecological sources in 1985, (b) ecological sources in 1995, (c) ecological sources in 2005, (d) ecological sources in 2015, (e) ecological sources in 2022.
Based on the analysis of Table 2 and Figure 8 it is evident that the ecological landscape of Jincheng City has undergone dynamic changes from 1985 to 2022. Primarily, the quantity of ecological source patches has exhibited an overall increasing trend, characterized by a phase of gradual decline followed by rapid expansion. Notably, the period from 2005 to 2015 witnessed a substantial surge in the number of patches, from 172 to 198, marking a noteworthy increment of 26 patches. This interval represents the sole period of growth within the studied timeline. Regarding the average area of ecological source patches, a consistent upward trajectory is observed from 1985 to 2022, with the most pronounced increase observed between 1995 and 2005. Similarly, the total area of ecological source patches has demonstrated a continuous expansion throughout the examined period, with the most significant surge occurring between 2015 and 2022. Overall, these findings indicate a positive trend in the development of Jincheng City’s ecological landscape. Despite a declining trend in the number of source patches between 1985 and 2015, there has been a concurrent improvement in both the average size and total area of these patches, suggesting a qualitative enhancement of forest ecological source areas. This improvement is attributed to concerted efforts aimed at bolstering the conservation and enlargement of existing source areas, mitigating fragmentation, and fostering the aggregation of adjacent patches to promote habitat restoration and development. Of particular note is the accelerated urban greening initiatives undertaken by Jincheng City since 2015. This period has witnessed substantial increases in both the number and total area of ecological source patches, alongside a modest growth in average patch size. This shift underscores a strategic realignment towards multifaceted ecological governance, emphasizing not only the safeguarding of peri-urban source areas but also the augmentation of micro-scale green spaces within urban cores through innovative measures such as green infill and the enhancement of green mining practices. Such endeavors aim to fortify ecological barriers effectively while advancing the city’s eco-modernization agenda.
Table 2.
Identification results of ecological sources.
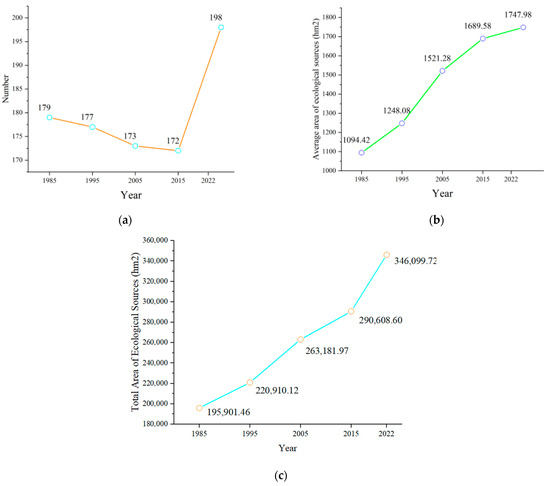
Figure 8.
Changes in ecological sources from 1985 to 2022. (a) Changes in the number of ecological sources, (b) changes in the average area of ecological sources, (c) changes in the total area of ecological sources.
3.2. Analysis of Ecological Resistance
The synthesis of integrated ecological network resistance surfaces involved the raster overlay of land cover types, Digital Elevation Model (DEM) data, slope data, Normalized Difference Vegetation Index (NDVI), and Modified Normalized Difference Water Index (MNDWI) for various years. Notably, due to the unavailability of Landsat remote sensing imagery data for Jincheng City in 1985, NDVI and MNDWI indices were rendered incalculable for that year, prompting a focused analysis on the years 1995, 2005, 2015, and 2022.
Based on the analysis of Figure 9, it is evident that from 1995 to 2022, the ecological resistance distribution within Jincheng City exhibited a consistent spatial pattern. Predominantly, the southwestern and northeastern regions manifest the highest resistance values, followed by the northwest, while the southeastern sector depicts the least resistance. Over the past three decades, discernible alterations have occurred in the overall ecological resistance landscape. Notably, there has been a marginal contraction in resistance scope in the southwest and southeast, accompanied by a transition from expansive to localized high-resistance areas. Concurrently, the central region has experienced an expansion in resistance range due to the progressive urbanization process, coupled with an uptick in resistance values. Conversely, the northwest and southeast sectors have witnessed a further reduction in resistance values. The period from 1995 to 2005 delineated significant shifts in resistance dynamics, particularly notable in the northwest quadrant, where high-resistance zones contracted markedly. Remarkably, 2005 emerged as the epoch characterized by minimal ecological network resistance and the most restricted resistance range observed between 1995 and 2022. Post-2005, there has been a nuanced decline in both the range and values of ecological resistance across Jincheng City, albeit with minor fluctuations and a general trend towards stability, all of which surpassing levels recorded in 2005. Given Jincheng City’s status as a prototypical resource-centric urban center, its developmental trajectory has historically been intertwined with coal mining activities, notably during the “golden decade” post-2002. This correlation significantly underpins the observed expansion in ecological resistance and heightened resistance values post-2005. However, concurrently, the city has evinced a burgeoning cognizance towards ecological preservation amidst its urbanization and economic advancement endeavors. Particularly noteworthy are the years 2015 and 2022, characterized by pronounced segmentation within ecological resistance areas, featuring numerous diminutive, low-resistance zones in the urban epicenter, indicative of robust ecological service functionality. These circumstances furnish an empirical foundation for Jincheng City’s strategic imperatives aimed at augmenting ecological revitalization within its “urban center patches”.
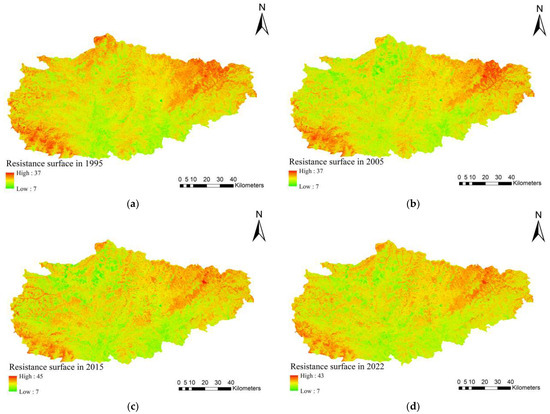
Figure 9.
Ecological resistance surface from 1995 to 2022. (a) Ecological resistance surface in 1995, (b) ecological resistance surface in 2005, (c) ecological resistance surface in 2015, (d) ecological resistance surface in 2022.
3.3. Construction of Ecological Networks
Ecological source areas and comprehensive ecological resistance surfaces were utilized as inputs for Graphab, employing the MRC model to compute the forest ecological networks for the years 1995, 2005, 2015, and 2022. Furthermore, leveraging a comparative deletion approach between the forest source areas of 1985 and 1995, the forest ecological network of 1985 was derived from the baseline of the 1995 forest ecological network, as delineated in Figure 10.

Figure 10.
Ecological networks in Jincheng from 1985 to 2022. (a) Ecological network in 1985, (b) ecological network in 1995, (c) ecological network in 2005, (d) ecological network in 2015, (e) ecological network in 2022.
Jincheng City’s forest ecological network quantity exhibits a distinct pattern, which initially rises before stabilizing, experiencing minor fluctuations and eventually sharply escalating. This trajectory aligns with the inherent dynamics of ecological networks and is consistent with pertinent economic and ecological policies of Jincheng City. Specifically, in 1985, the forest ecological network comprised 254 ecological corridors connecting 163 ecological nodes. Subsequently, by 1995, this network expanded to encompass 310 corridors linking 183 nodes. However, by 2005, the network contracted slightly to 292 corridors, interlinking 175 nodes. Nevertheless, from 2015 to 2022, a significant expansion occurred, with the network comprising 314 corridors connecting 179 nodes in 2015 and escalating to 361 corridors interconnecting 202 nodes by 2022. The pronounced changes observed between 2015 and 2022 can be largely attributed to the substantial increase in ecological source areas resulting from post-2015 ecological policies. Notably, the spatial coverage of the forest ecological network closely corresponds to the administrative boundaries of Jincheng City, indicating a marked enhancement in network integrity. The augmentation of ecological corridors and nodes primarily stems from the addition of small, forested areas within the central urban zone, which function as ecological stepping stones, augmenting network connectivity. Spatial analysis delineates a trend wherein the northeastern sector of Jincheng City witnesses gradual refinement and expansion of the network while other regions experience increased network density. Notably, the ecological network predominantly concentrates in the central belt, excluding the northeast and southwest regions, exhibiting an inverse relationship with the distribution of coal mines in Jincheng City. The heightened density of coal mines in the northeast and southwest imposes significant impediments to energy and material flow within the forest ecosystem. Despite the presence of coal mining activities, reforestation efforts encounter fewer challenges in the flat terrain of the northeastern region, located in the southern Upward Party Basin. Consequently, owing to ecological policies promoting the proliferation of small urban green spaces, the ecological network in the northeast has witnessed notable refinement and expansion. Conversely, although the southwestern forest ecological network exhibited considerable improvement by 2005 compared to preceding decades, the intensified impact of coal mining rendered the network ineffectual by 2015 and 2022, resulting in conspicuous network lacunae. Additionally, the rugged terrain and limited water sources in the southwestern region, coupled with extensive farmland and grassland, present obstacles to substantial forestation efforts. Thus, while there have been marginal enhancements in the southwestern forest ecological network, the scarcity of ecologically significant source areas impedes substantive improvements in network connectivity, thereby diminishing overall network stability.
3.4. Topological Characteristics of Complex Forest Ecological Networks
3.4.1. Degree Centrality
Degree centrality serves to delineate the significance of a node within the entirety of an ecological network. Typically, a higher degree of centrality of an ecological node indicates its more pivotal role within the ecological source area. As depicted in Figure 11, the degree centrality ranges from 0 to 0.10 in 1985, 1995, and 2005; extends to 0.14 in 2005; and reaches 0.20 in 2015 and 0.18 in 2022. Over the years 1985, 1995, 2005, 2015, and 2022, the average degree centrality of forest ecological networks remains at 0.019, except for a slight decline to 0.018 by 2022, signifying a stable to marginally decreasing trend. In the spatial domain, areas with high-degree centrality values have shifted within the span of 37 years, exhibiting a migration from north to south. In 1985 and 1995, the distribution of high-degree centrality areas closely resembled each other, predominantly situated in the northeastern regions. Conversely, from 2005 to 2022, areas with high-degree centrality predominantly shifted towards the south. Notably, the peripheral source areas in Yangcheng County have emerged as the nucleus of the entire ecological network, boasting considerable area and ecological service value, thereby maintaining the highest and most stable degree centrality. However, this phenomenon poses a concern as peripheral source areas generally exhibit higher-degree centrality than central source areas, indicating weaker and more susceptible roles for central source areas, potentially leading to decreased network stability. Nevertheless, a gradual increase in the degree centrality of small-area source areas within the city center has been observed over time, gradually assuming the role of network hubs. The period from 2015 to 2022 is noteworthy, wherein the sudden increase in small ecological source areas has led to a slight decline in the average degree centrality, signifying a dilution of the significance of marginal source areas in the ecological network. This, in turn, promotes the stability and resilience of the network.

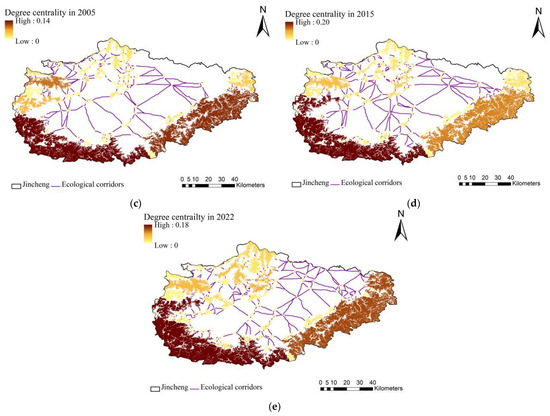
Figure 11.
Spatial distribution of degree centrality in (a) 1985, (b) 1995, (c) 2005, (d) 2015, and (e) 2022.
The prevalent pattern of centrality degree being generally higher in the south and lower in the north is primarily attributed to the concentration of coalfields in the northern region of Jincheng City, where the terrain is flat and conducive to easy exploitation but with relatively poor ecological conditions characterized by small forest patches and limited ecological service value. Subsequently, Jincheng City has consistently emphasized the construction of urban forests and urban gardens. In areas with higher degrees of urbanization in the central and northern parts, small source areas have been established. The increase in centrality degree in the southern source areas is attributed to the increase in small source areas in the central and northern parts, allowing the southern source areas to connect with more small source areas. In contrast, the northern source areas experience relatively minor changes in centrality degree due to the greater ecological resistance, preventing the formation of potential ecological corridors. Consequently, the centrality degree in the northern areas remains relatively stable, while it continues to increase in the southern areas.
3.4.2. Closeness Centrality
Closeness centrality serves as a metric reflecting the degree to which an ecological node occupies a central position within the ecological network. Higher closeness centrality values indicate a tighter connection with other nodes. As depicted in Figure 12, ranging from 0.12 to 0.21 in 1985, 0.12 to 0.22 in 1995, 0.11 to 0.24 in 2005, 0.13 to 0.28 in 2015, and 0.14 to 0.32 in 2022, the average closeness centrality values for the respective years are 0.153, 0.159, 0.174, 0.198, and 0.212, demonstrating a consistent upward trend. Spatially, a predominant pattern of higher closeness centrality values in the south and lower values in the north is observed, with high closeness centrality areas concentrated in Qinshui County, Lingchuan County, and Yangcheng County. From 1985 to 1995, there is minimal variation in the high-value areas of closeness centrality. However, from 1995 to 2005, there is a significant increase in closeness centrality in the southern marginal source areas, leading to a pronounced southward shift of the ecological network center. This is attributed to the absorption and merging of surrounding small-source areas by larger ecological patches in the south, resulting in reduced fragmentation and increased ecological service value. From 2005 to 2015, a relative increase in the values of closeness centrality is observed in certain central source areas, potentially due to intensified coal mining activities, resulting in a northward migration of the ecological network center. Between 2015 and 2022, despite the expansion of ecological source areas, mainly within the central region, their limited size and the challenges they face within the urban core have led to a decline in the proportion of centrality within the central area. Additionally, the restoration and expansion of marginal ecological source areas maintain their leading position in closeness centrality, further indicating a southward shift of the ecological source area center.
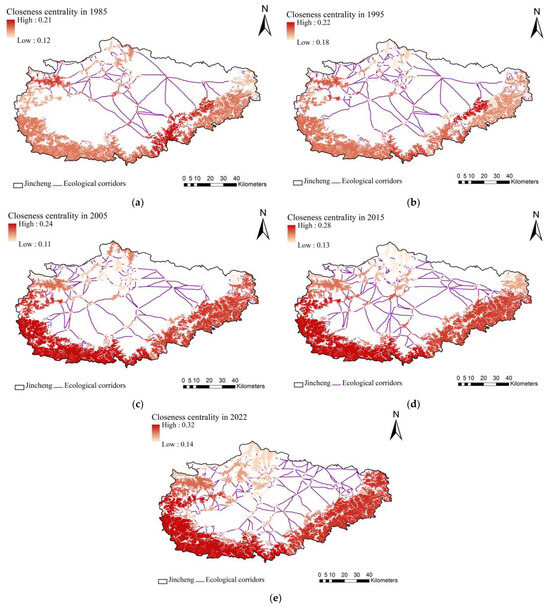
Figure 12.
Spatial distribution of closeness centrality in (a) 1985, (b) 1995, (c) 2005, (d) 2015, and (e) 2022.
Overall, from 1985 to 2022, the forest ecological network in Jincheng City exhibits a discernible trend towards southern migration. The significant shift in this trend can largely be attributed to the cessation of all natural forest logging operations since 1998 within the state-owned forest farms of Yangcheng County, located in the southern region of Jincheng City. This area represents one of the last remaining extensive stands of natural Chinese juniper forests in North China. Over the past two decades, there has been a consistent increase in both the density and quantity of forests in the southern part of the region. Consequently, the centrality of this forest source area within the broader ecological network has been steadily rising, accompanied by an increasing interconnectedness with surrounding source areas. Thus, it has firmly established itself at the core of the network.
3.4.3. Betweenness Centrality
Betweenness centrality serves as a measure reflecting the pivotal intermediary role of ecological nodes within an ecological network. A heightened betweenness centrality of an ecological node signifies its increased prominence as a hub within the broader ecological network. Illustrated in Figure 13, the betweenness centrality range for the years 1985, 1995, 2005, 2015, and 2022 spanned from 0 to 0.37, 0 to 0.34, 0 to 0.46, 0 to 0.46, and 0 to 0.55, respectively. The mean betweenness centrality values for these respective years were 0.034, 0.030, 0.028, 0.024, and 0.019, indicative of a declining trend over time. Notably, due to temporal variations, discrepancies exist in the distribution of betweenness centrality. A comparative analysis between 1985 and 1995 reveals the concentration of high-value regions of betweenness centrality within the northwestern and southeastern sectors of the ecological network. However, a notable shift occurred from 1985 to 1995, wherein the high-value region of betweenness centrality in the southeastern ecological source areas migrated towards the northeast. This migration is attributed to the augmentation of ecological source areas in the southwest, fostering heightened connectivity and consequently diluting the centrality of previously prominent areas. Post-1995, the distribution of betweenness centrality within the ecological network exhibits remarkable uniformity. Notably, source areas at the southwestern periphery command a preeminent position in terms of betweenness centrality. This prominence can be chiefly ascribed to intensified coal mining activities exacerbating ecological resistance in the southwest, thereby engendering fragmentation and the autonomous existence of source areas. Moreover, the vast expanse and consequential high ecological service value of southwestern ecological source areas, juxtaposed with the diminutive size of surrounding areas, naturally bolster connectivity and, consequently, the degree centrality. This compounded effect further enhances betweenness centrality.
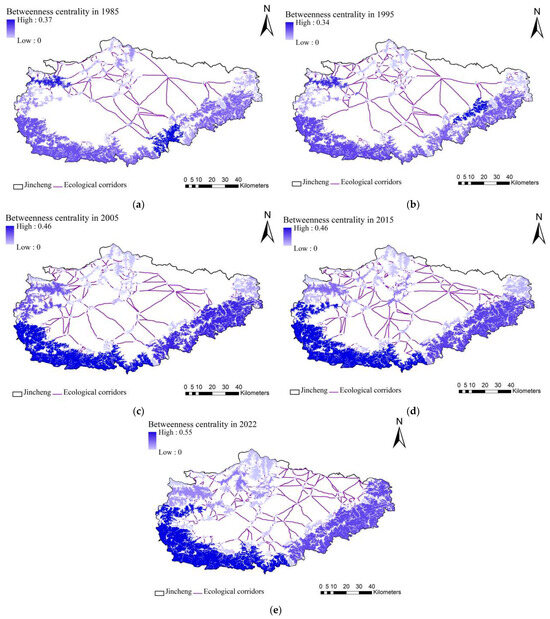
Figure 13.
Spatial distribution of betweenness centrality in (a) 1985, (b) 1995, (c) 2005, (d) 2015, and (e) 2022.
Over the 37-year span from 1985 to 2022, the declining mean betweenness centrality of Jincheng City’s forest ecological network underscores the limited hub role played by newly incorporated ecological source areas. Consequently, it is imperative to judiciously integrate small-sized source areas from peripheral regions into the ecological network, thereby mitigating the impact of large-scale source areas on smaller counterparts.
3.4.4. Eigenvector Centrality
Eigenvector centrality clarifies the importance of adjacent nodes relative to ecological nodes in an ecological network. A heightened eigenvector centrality of a node denotes the heightened importance of its proximal nodes, thereby signifying the node’s increased importance. Depicted in Figure 14, the eigenvector centrality ranges for the years 1985, 1995, 2005, 2015, and 2022 spanned from 0.0176 to 1, 0.0142 to 1, 0.0200 to 1, 0.0040 to 1, and 0.0081 to 1, respectively. The mean eigenvector centrality values for these respective years were 0.179, 0.173, 0.135, 0.095, and 0.097, revealing an initial downward trend followed by a slight resurgence, albeit with an overall diminishing trend. The eigenvector centrality of an ecological node is principally influenced by two factors: the quantity of connecting nodes and the significance of these connecting nodes. Despite individual connected nodes potentially lacking significant importance, their cumulative effect is consequential. Spatially, ecological source areas in the south exhibit relatively elevated eigenvector centrality values, surpassing those in the north. This phenomenon is attributable to the heightened degree centrality of large-sized source areas at the southern periphery, complemented by the connectivity of surrounding smaller areas, thereby bolstering eigenvector centrality. Furthermore, the interconnectedness of large source areas with several smaller counterparts synergistically elevates the eigenvector centrality of large source areas.
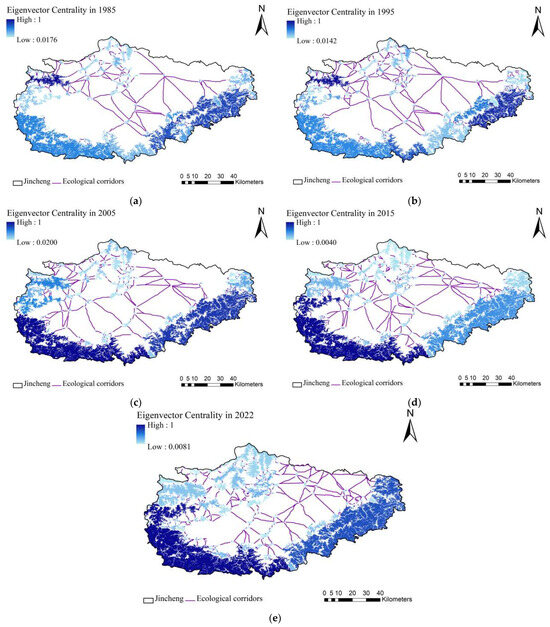
Figure 14.
Spatial distribution of eigenvector centrality in (a) 1985, (b) 1995, (c) 2005, (d) 2015, and (e) 2022.
The forests in the south are playing an increasingly important role under the policy of mountain closure and afforestation and the increasing trend of small source areas in the central part, constituting the leading position of Jincheng City’s forest ecological source areas. The pronounced interaction between large- and small-sized source areas at the southern periphery intensifies from 1985 to 2022, contributing to sluggish growth in the eigenvector centrality of northern source areas. Additionally, the proliferation of small-sized source areas in the north, characterized by minimal eigenvector centrality, exacerbates the overall downward trajectory of eigenvector centrality.
3.5. Correlation between Network Topological Characteristics and Forest Carbon Sequestration Capacity
3.5.1. Spatiotemporal Variation of Forest Ecological Node Carbon Sequestration Capacity
The carbon sequestration capacity of ecological networks is assessed using the annual total Net Primary Productivity (NPP) of individual ecological nodes. As depicted in Figure 15, Jincheng City exhibits marked spatial heterogeneity in the carbon sequestration capacity of its forest ecological nodes. Notably, the nodes exhibiting superior carbon sequestration capabilities are predominantly situated along the peripheries of Yangcheng County, Qinshui County, and Lingchuan County. This spatial distribution trend arises from various factors. One key factor is the expansion of forest nodes in the southern peripheries of the source region, leading to increased carbon sequestration capacity. However, this expansion occurs at a slower rate in the northern regions. Particularly noteworthy is the significant growth observed in the southwestern forest ecological source areas, with the annual total carbon sequestration increasing from 183,805 gc in 1985 to 638,401 gc in 2022, representing a nearly threefold rise. The average annual carbon sequestration of forest ecological nodes was observed to be 2986.33 gc, 2931.19 gc, 4962.28 gc, 5818.30 gc, and 8196.15 gc for the years 1985, 1995, 2005, 2015, and 2022, respectively, which displays an overall ascending trajectory, with the period from 2015 to 2022 witnessing the highest growth rate at 40.87%. This surge underscores the significant impact of post-2015 ecological policies, particularly the introduction of small-scale forest patches, on the carbon sequestration capacity of forest network nodes within Jincheng City.
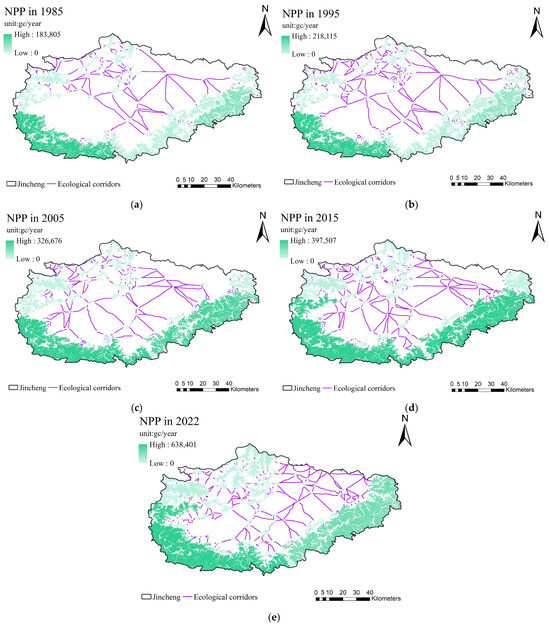
Figure 15.
NPP values of ecological network nodes in in (a) 1985, (b) 1995, (c) 2005, (d) 2015, and (e) 2022.
The pronounced increase in carbon sequestration capacity observed in the southeastern source areas post-1995 is noteworthy, attributed to the implementation of local ecological restoration initiatives such as the Yellow River Basin Shelterbelt Program and the Taihang Mountains Ecological Restoration Project. In summary, the carbon sequestration capacity of forest nodes in Jincheng City shows a positive developmental trend.
3.5.2. Correlation Analysis
The Pearson correlation analysis was employed to investigate the relationship between various topological features and Net Primary Productivity (NPP) within forest ecological networks across the years 1985, 1995, 2005, 2015, and 2022, as depicted in Figure 16.

Figure 16.
Correlation analysis of carbon-sequestration function and topology.
Degree centrality has emerged as the most robust among the examined topological indicators. It depicts a significant positive relationship between the connectivity of forest ecological nodes and their carbon sequestration capacity. This underscores the importance of understanding node connectivity in maximizing carbon sequestration in forests. Notably, this analysis overlooked the spatial positioning of forest ecological nodes within the network and additional pertinent characteristics. The positive correlation between degree centrality and carbon sequestration capacity implies heightened connectivity between forest nodes and other network components.
Closeness centrality, while displaying a weak positive correlation with carbon sequestration capacity post-1985, primarily measures the average distance of forest ecological nodes from others within the network. However, the intricacies of carbon sequestration efficacy, influenced by multifarious factors like terrain, climate, and forest dynamics, may not consistently align with the relative positions of forest nodes in the ecological network.
Betweenness centrality exhibited a significant positive correlation with carbon sequestration capacity, highlighting its pivotal role as a bridge within ecological networks. Forest nodes with elevated carbon sequestration capacity contribute substantially to ecosystem service values and enhance network connectivity by facilitating interconnections among previously disparate forest nodes.
Eigenvector centrality also demonstrated a significant positive correlation with carbon sequestration capacity, indicating the importance of a node based on the significance of its neighboring nodes. The observed self-organizing aggregation of ecological source areas post-1995 led to the heightened importance of larger forest nodes. Consequently, interactions with smaller nodes surrounding larger ones resulted in a positive correlation between eigenvector centrality and carbon sequestration capacity.
Results indicate a pronounced and steadily increasing positive correlation between degree centrality, betweenness centrality, eigenvector centrality, and the carbon sequestration capacity of forest ecological nodes. Conversely, closeness centrality exhibited less significant correlations with carbon sequestration capacity in 1985 and 1995, with a gradual increase in correlation strength post-2005. The eigenvector centrality is the lowest among the four centralities in terms of its correlation with carbon sequestration capacity. This is attributed to the complexity of changes in eigenvector centrality in forest ecosystem source areas due to historical logging activities before 1995 and reforestation efforts after 1998 in the southern forests of Jincheng City. However, due to the significant volume of the southern forests, their carbon sequestration capacity far exceeds that of other regions, resulting in a positive correlation overall.
In summary, these findings underscore the significance of forest ecological network topology in understanding carbon sequestration dynamics, emphasizing the intricate interplay between network structure and ecosystem functioning.
3.6. Motif-Based Ecological Network Optimization and Evaluation
3.6.1. Motif Detection Based on RAND-ESU Algorithm
Network motifs are defined as subgraphs whose occurrence frequency in a real network surpasses that in a random network, with screening criteria based on a z-value above 0 and a p-value below 0.01. As evidenced by Table 3 and Figure 17, motifs identified in the Jincheng City forest ecological network are indeed manifest in the real network. Specifically, four motifs were detected, namely 3a, 4a, 4b, and 4d, comprising one motif with three nodes and three motifs with four nodes. An analysis of motif frequency fluctuations revealed that while 3a, 4a, and 4b motifs displayed relatively stable changes over five years, with no significant deviations, there was an overall decreasing trend. In contrast, motif 4d exhibited pronounced variability, characterized by an initial decrease, subsequent increase, and final decrease, indicating its less stable presence in the ecological network. Regarding z-values, prior to 2005, motif 3a held the highest importance among the four motifs, followed by motif 4a, with motif 4d ranking lowest. Post-2005, however, motif 4a experienced a remarkable surge in importance, surpassing motif 3a, peaking at 664.93 in 2022. While the rankings of motifs 4b and 4d remained unchanged, their importance slightly increased compared to 1985 and 1995. These findings underscore the stability of motifs like 3a, 4a, and 4b, which are founded on triangular structures or contain them, indicating their greater significance in the ecological network. Conversely, motifs lacking triangular elements, such as 4d, exhibited more volatile changes but lower network importance. Motif 4d’s transformation into more stable and ecologically significant motifs 4a and 4b through edge optimization offers novel avenues for enhancing the Jincheng City forest ecological network and identifying ecological catalysts for future endeavors.
Table 3.
Network motif identification results.
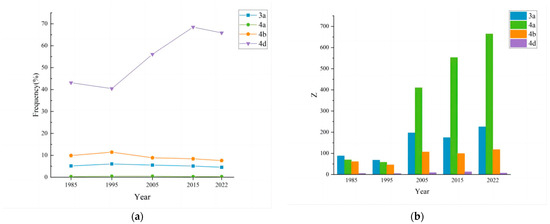
Figure 17.
Changes of (a) frequency and (b) z-value on modify from 1985 to 2022.
3.6.2. Ecological Network Optimization Based on Motif Theory
Based on the historical construction outcomes of the forest ecological network in Jincheng City, it is evident that regions in the northeast and southwest face substantial resistance factors such as coal mining density, elevated terrain, and lower ecological node values. Consequently, these regions exhibit less cohesive adjacency, resulting in the formation of polygonal topological structures like quadrilaterals and pentagons. Such configurations typically signify an ecologically unstable network with limited resilience to perturbations. In light of this, the 3a and 4a topological configurations emerge as pivotal elements in Jincheng City’s ecological network. However, the 4d structure manifests with a higher frequency. Hence, a strategic approach is proposed to enhance the network’s stability by optimizing the 4d structure through edge augmentation to transform it into the desired 3a and 4a configurations.
Building upon the core ecological source areas identified through Multi-Source Potential Analysis (MSPA), this strategy involves selecting small-area source sites within polygonal regions where forest ecological nodes exhibit inadequate connectivity. These sites act as ecological stepping stones, enhancing the connectivity and resilience of Jincheng City’s forest ecological network.
Figure 18 illustrates the construction of a forest-optimized ecological network based on topological theories, incorporating 12 selected ecological stepping stones. Leveraging the ecological resistance framework of 2022, an ecological network comprising 214 nodes connected by 408 corridors was derived. Notably, areas previously characterized by sparse connectivity now demonstrate a more cohesive network, primarily adopting triangular topological patterns.
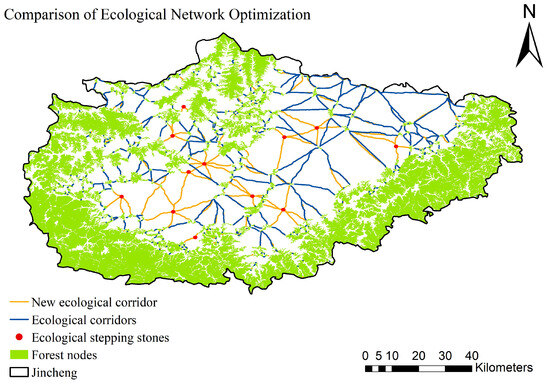
Figure 18.
Optimization results of forest ecological network in Jincheng city.
Table 4 presents the identification of network topological structures before and after optimization. Post-optimization, there is a notable increase in the frequency of 3a, 4a, and 4b structures, accompanied by a decrease in the frequency of 4d structures. Despite these changes, the ranking of structural importance remains consistent. Moreover, a marginal enhancement in the significance of the 3a structure post-optimization signifies an overall improvement in both frequency and structural value within Jincheng’s forest ecological network. The optimization strategy based on topological structures has effectively realized its intended objectives, aligning with anticipated outcomes and contributing to the enhanced connectivity and stability of Jincheng City’s forest ecological network.
Table 4.
Comparison of the sequential modification of ecological network optimization.
3.6.3. Robustness Analysis and Evaluation
Robustness assessment serves to evaluate the stability of network models, characterized by their resistance to perturbations primarily influenced by network topology rather than minor fluctuations. This analysis is instrumental in gauging the ability of ecological spatial networks to sustain their functional and structural integrity under specific threats. To conduct robustness analysis, two adjacency matrices representing ecological networks before and after optimization are imported. Utilizing simulation code for random and deliberate attacks, three facets of robustness are examined: node and edge recovery robustness, alongside connectivity robustness. This is as delineated in Figure 19.
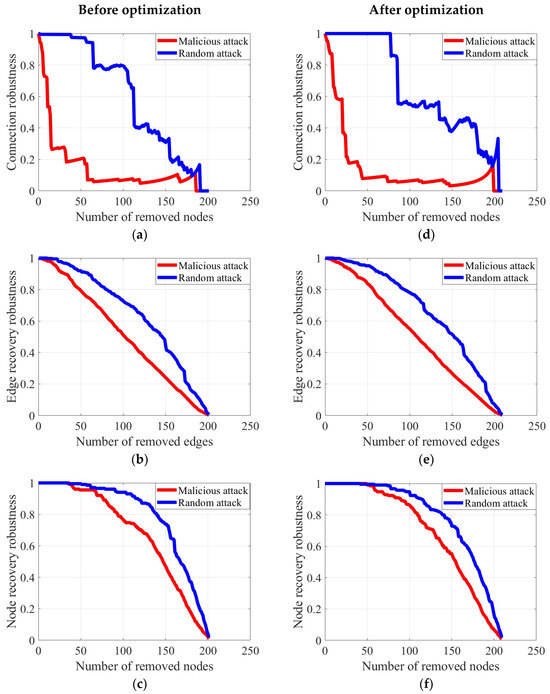
Figure 19.
Comparison of the robustness of the ecological network: (a) connection robustness, (b) edge recovery robustness and (c) node recovery robustness before optimization, (d) connection robustness, (e) edge recovery robustness and (f) node recovery robustness after optimization.
Both pre-optimized and post-optimized forest ecological networks exhibit a connection robustness of 1. Following random attacks on the forest ecological network, distinctly segmented declines are observed in pre- and post-optimization scenarios. Notably, the post-optimized network demonstrates superior resilience in the initial phases, maintaining a robustness value of 1 even after 74 nodes are attacked, while the pre-optimized network’s robustness declines to 0.80. Subsequently, the post-optimized network’s robustness declines rapidly, reaching a connectivity robustness of 0.25 after 190 nodes are attacked, whereas the pre-optimized network only recovers to 0.17. Under deliberate attacks, connectivity robustness diminishes rapidly for both networks, albeit with a slower initial decline in the post-optimized network. At 198 attacked nodes, the pre-optimized network recovers to 0.17, while the post-optimized network achieves 0.12. Initial edge recovery robustness for both networks stands at 1. Following random attacks on 10 nodes, the edge recovery robustness of the pre-optimized network declines, while the post-optimized network remains resilient even when the same number of nodes are attacked. Ultimately, both networks experience a decline to below 0.1 at 191 and 196 attacked nodes, respectively, indicating near-collapse. Deliberate attacks expedite the decline in edge recovery robustness for the pre-optimized network, yet the overall trend remains similar. Edge recovery robustness drops below 0.1 at 171 and 185 attacked nodes for pre- and post-optimized networks, respectively. Initial node recovery robustness is 1 for both networks. However, under random attacks, the pre-optimized network’s node recovery robustness starts declining at the 34th node, while the post-optimized network maintains a robustness of 1 initially. Ultimately, both networks experience declining robustness, dropping below 0.1 at 197 and 205 attacked nodes, respectively. Deliberate attacks similarly accelerate the decline, with the post-optimized network exhibiting a slower rate. Both networks maintain a robustness of 1 before declining below 0.1 at 34 and 15 attacked nodes, respectively, and eventually dropping to 0.1 at 188 and 196 attacked nodes. Consequently, the post-optimized network demonstrates a slower decline in node recovery robustness under both random and deliberate attacks, indicating a notable improvement over the pre-optimized network.
Based on the above analysis, it can be concluded that the optimization based on morphological modeling significantly enhances the robustness of the forest ecological network in Jincheng City against both random and intentional attacks. This suggests a positive effect of the optimization method on the ecological network. Specifically, there is a notable improvement in the connectivity robustness, indicating a substantial enhancement in the network’s connectivity. Consequently, the security of the forest ecosystem is greatly enhanced. Jincheng City is unique due to its significant number of forests and coal mines. Furthermore, it is actively pursuing high-quality development in response to the Yellow River Basin, promoting the Green Mining Area policy. This policy involves afforestation and grass planting in coal mining areas and abandoned mine areas to achieve a balance between coal mining and green development. Optimizing the forest ecological network based on the location of morphological elements and coal mines can contribute to the implementation of the Green Mining Area policy by reducing unnecessary resource utilization. This approach enables a significant improvement in the stability of the forest ecosystem with relatively small costs.
4. Discussion
4.1. Ecological Network Construction and Network Motif Recognition
Traditionally, ecological studies within the Yellow River Basin have predominantly focused on post-2000 research due to data limitations, resulting in relatively short study periods [77,78,79]. Moreover, there is a scarcity of researchers in the field of ecological networks, with most concentrating on ecological value services and risk assessments. This study focuses on Jincheng, a typical coal mining resource-based city located within a basin. It utilizes various data sets, including the Digital Elevation Model (DEM), slope, land cover, Normalized Difference Vegetation Index (NDVI), and Modified Normalized Difference Water Index (MNDWI). The research employs the Minimum Spanning Tree Patch Analysis (MSPA) method to identify forest source areas and the Minimum Cumulative Resistance (MCR) model to extract potential ecological corridors. By implementing these methodologies, the aim is to reduce redundancy in the analysis process and enhance the efficiency and accuracy of the results. This approach constructs a 37-year temporal sequence (1985–2022) of Jincheng’s forest ecological network, revealing the evolutionary patterns of its topological structure.
Network motifs, defined as significantly prevalent patterns of interconnections within complex networks, have been underutilized in ecological network studies. Drawing upon complex network theory and methods from bioinformatics [80], social relations [81], and aviation traffic studies [82], this study pioneers the application of network motifs to ecological networks. Utilizing the RAND-ESU motif identification algorithm, it detects motif types within Jincheng’s forest ecological network, shedding light on their distribution and significance.
4.2. Ecological Network Optimization Based on Motifs
Common optimization methods for ecological networks involve the simulation of four edge-increasing strategies: random edge addition, low-degree prioritization, low-betweenness node prioritization, and maximum betweenness node incrementation [60,83,84]. However, these strategies, derived from abstracted ecological concepts, may not fully account for real-world complexities. Many researchers are no longer relying solely on rigid network optimization methods but are instead integrating them with the practicalities of their research domains. Wang et al. combined habitat quality with investment models to select crucial nodes for optimizing networks [11]. Similarly, Fan et al. developed an ecological network optimization strategy based on gradient partitioning [85], enhancing the robustness of ecological networks by optimizing the composition and spatial distribution of elements in peri-urban areas. Network optimization based on motif research often occurs in aviation, transportation, and other fields [30,86]. It is clarified that the number of motifs in the network is conserved, and the increase in one motif represents the decrease in another motif [87]. In terms of ecology, network optimization based on motifs is almost a blank. This study integrates motif identification theory with ecological network optimization, considering the impact of local coal mining areas on ecology. By selecting ecological stepping stones based on the real distribution of forest vegetation, particularly in high-density mining areas where the network topology pattern deviates from triangles, this approach balances realism with scientific rigor. Nonetheless, it is imperative to recognize that regardless of the methodology employed to optimize ecological networks, ecological corridors are not inherently tangible but rather latent constructs. Thus, enhancing the precision of simulations necessitates the exploration of diverse methodologies, albeit without achieving complete verisimilitude to real-world conditions.
4.3. Correlation Analysis between Network Topological Characteristics and Carbon Sequestration Capacity
This study investigates how ecological network metrics relate to carbon sequestration in forest nodes in mining areas of the Yellow River Basin, showing the forest carbon sequestration capacity of Jincheng City is gradually increasing, especially in the south and east. Four metrics (degree centrality, betweenness centrality, closeness centrality, and eigenvector centrality) are analyzed for their correlation with Net Primary Productivity (NPP), a measure of carbon sequestration. The study finds temporal changes in network structure and spatial differences in metric distributions. Notably, while closeness centrality shows a weak positive correlation, other metrics exhibit a significant positive correlation with carbon sequestration. In terms of carbon sequestration capacity, research by Fang et al. and Yang et al. demonstrates that the carbon sequestration capacity of terrestrial vegetation systems in China exhibits an increasing trend on a national scale [88,89]. At the scale of the Yellow River Basin, Cao et al.’s study reveals a continuous increase in carbon sequestration capacity, with notably higher efficiency in the middle and lower reaches and forests showing superior carbon sequestration capabilities [90]. At the scale of Jincheng City, Yang et al.’s findings indicate that economically more developed areas, such as Gaoping County, Chengqu County, and Zezhou County, exhibit relatively lower carbon sequestration capacities [91], aligning with the results of this study. In the realm of vegetation carbon sequestration within coal mining areas, research conducted by India’s Central Coalfields Limited (CCL) has revealed a progressive annual increase in carbon sequestration capacity, attributed to enhanced ecosystem diversity post-mining [92]. Similarly, investigations into the carbon sequestration potential in the South Appalachian forest region of the United States have demonstrated significant carbon sequestration capabilities of vegetation following the reclamation of mined areas [93]. These findings, in conjunction with the results of the present study, underscore the substantial development in carbon sequestration capacity within coal mining regions. Further research is warranted to elucidate the specific mechanisms driving this phenomenon.
4.4. Study Limitations and Future Directions
This study acknowledges several limitations warranting future improvement: (1) Due to data constraints, correlation analysis between multiple forest ecological network topological characteristics and ecological functionalities, such as windbreak, sand fixation, and erosion prevention, was not conducted. (2) Limited to certain topological indicators, the analysis of metrics such as clustering coefficient, modularity, and community detection was not explored. (3) With a restricted sample size, motif identification lacked the qualitative and quantitative analysis of robustness between motifs and ecological networks. Future endeavors could employ machine learning approaches to investigate the intrinsic relationship between motif concentration and ecological networks.
5. Conclusions
This study focuses on Jin City in Shanxi Province, a representative coal mining area in the Yellow River Basin. By employing the MSPA (Morphological Spatial Pattern Analysis) method and the MCR (Minimum Cumulative Resistance) model, forest ecological networks for Jin City from 1985 to 2022 were generated under the backdrop of coal mining activities. The study calculated degree centrality, closeness centrality, betweenness centrality, and eigenvector centrality, further exploring the correlation between these four centrality measures and carbon sequestration capacity. Additionally, the RAND-ESU algorithm was utilized for motif recognition within the forest ecological network. By integrating ecological policies specific to the study area and the conditions of the coal mining region, the forest ecological network of Jin City was optimized. Findings from the analysis are summarized as follows:
- (1)
- Construction of Forest Ecological Networks: The ecological connectivity across the study area appears strong, characterized by potential corridors that span the region. However, certain areas exhibit higher ecological resistance under the background of coal mining, hindering connectivity between key forest nodes in the southwest and central regions.
- (2)
- Correlation between Topological Indices and Carbon Sequestration Ecosystem Services: From 1985 to 2022, the carbon sequestration capacity of forest ecosystems in Jincheng City exhibited an overall upward trend, with the southeastern region being the most notable. Besides the marginally significant positive correlation with closeness centrality, other indicators such as degree centrality, betweenness centrality, and eigenvector centrality all showed significant and statistically meaningful positive correlations (p < 0.01), demonstrating an increasing trend.
- (3)
- Motif Recognition and Optimization of Ecological Networks: During the investigation, motif identification results within the forest ecological network of Jincheng City revealed four distinct motifs: 3a, 4b, 4c, and 4d. Among these, motifs 3a and 4b were found to play a more pivotal role in the network’s structure and function. In response to the current mining environment, the introduction of 12 ecological stepping stones facilitated the conversion of 4d motifs into 3a and 4b motifs, thereby optimizing the ecological network based on pre-established source regions. Consequently, the robustness of the optimized forest ecological network in Jincheng City demonstrated significant improvements across three robustness metrics.
This study addresses a significant gap in the research on urban ecological spatial networks and carbon sequestration driven by resource development in Jincheng City. It examines the correlation between the topological characteristics of forest spatial networks and forest carbon sequestration functions in the context of mining activities within the study area. Additionally, this study optimizes Jincheng City’s forest ecological network based on the innovative method of modular identification. Given that the high-quality development of the Yellow River Basin has been elevated to the status of a national strategy, and Jincheng City has been promoting green mining policies and the ecological restoration of abandoned mines in recent years, this research can provide valuable insights into the siting of afforestation efforts in coal mines, thereby reducing unnecessary ecological waste. Furthermore, it offers a reference for ecological restoration policies in other resource-based cities within the Yellow River Basin.
Supplementary Materials
The following supporting information can be downloaded at: https://www.mdpi.com/article/10.3390/rs16111986/s1, Figure S1: Dataset used to construct the ecospatial network; Table S1: Setting of resistance values of ecological impact factors in 1995; Table S2. Setting of resistance values of ecological impact factors in 2005; Table S3. Setting of resistance values of ecological impact factors in 2015.
Author Contributions
M.L. conducted data processing and wrote research papers; C.X., J.Z., Y.Z., Y.W. and Y.L. contributed to the discussion of the results; Q.Y. contributed some ideas and revised the paper; and all authors edited the paper. All authors have read and agreed to the published version of the manuscript.
Funding
The study was supported by the National Key Research and Development Program of China “Remote Sensing Monitoring Method and Cumulative Effect Evaluation of Forest Carbon Storage in Coal Mining Area in Middle Yellow River Basin” (2022YFEO127700-2), the 5·5 Engineering Research & Innovation Team Project of Beijing Forestry University (BLRC2023B06) and Chinese College Students’ Innovative Entrepreneurial Training Plan Program (202410022006).
Data Availability Statement
The DEM data are accessible from the SRTM dataset (https://earthexplorer.usgs.gov/, accessed on 12 January 2024). Landsat data are accessible from Google Earth Engine (GEE) (https://earthengine.google.com/, accessed on 8 January 2024). Landuse data are accessible from the China 30 m Annual Land Cover Dataset and its Dynamic Changes (1985–2022) dataset (https://zenodo.org/, accessed on 14 January 2024). The distribution data of coal mines in Jincheng City is accessible from the National Mineral Database (http://ngac.org.cn/Kuangchandi/index.htm, accessed on 31 May 2024). The boundary data of Jincheng City is accessible from the Resource and Environment Science and Data Center of the Chinese Academy of Sciences (https://www.resdc.cn/, accessed on 14 January 2024). NPP data are accessible from the Global Change Science Research Data Publishing System (https://geodoi.ac.cn/WebCn/Default.aspx, accessed on 18 January 2024) and MODIS satellite data (https://lpdaac.usgs.gov/products/mod17a3hgfv061/, accessed on 18 January 2024).
Acknowledgments
We would like to thank Google Earth Engine (https://developers.google.cn/earth-engine/, accessed 31 May 2024), which provided data for Landsat 5 and Landsat 8. We also thank NASA and the Global Change Science Research Data Publishing System for their support in providing net primary data and digital elevation data. We also sincerely thank the experts for their valuable suggestions and the anonymous reviewers of this manuscript.
Conflicts of Interest
The authors declare no conflicts of interest.
References
- Reash, R.J. Energy and the environment: Striking a balance. Common Market Law Rev. 2021, 17, 899–900. [Google Scholar] [CrossRef]
- Zhengfu, B.; Inyang, H.I.; Daniels, J.L.; Frank, O.; Struthers, S. Environmental issues from coal mining and their solutions. Min. Sci. Technol. 2010, 20, 215–223. [Google Scholar]
- Grammatikopoulou, I.; Vačkářová, D. The value of forest ecosystem services: A meta-analysis at the European scale and application to national ecosystem accounting. Ecosyst. Serv. 2021, 48, 101262. [Google Scholar] [CrossRef]
- Toochi, E.C. Carbon sequestration: How much can forestry sequester CO2. For. Res. Eng. Int. J. 2018, 2, 148–150. [Google Scholar] [CrossRef]
- Ke, S.; Zhang, Z.; Wang, Y. China’s forest carbon sinks and mitigation potential from carbon sequestration trading perspective. Ecol. Indic. 2023, 148, 110054. [Google Scholar] [CrossRef]
- Liu, D.; Shang, Z.; Lin, T.; Yue, S. Balancing law, sustainability, and the economy in China’s responsible mineral resource extraction path. Resour. Policy 2024, 90, 104783. [Google Scholar] [CrossRef]
- Wang, Y.; Qamruzzaman, M.; Kor, S. Greening the future: Harnessing ICT, innovation, eco-taxes, and clean energy for sustainable ecology—Insights from dynamic seemingly unrelated regression, continuously updated fully modified, and continuously updated bias-corrected models. Sustainability 2023, 15, 16417. [Google Scholar] [CrossRef]
- Fath, B.D.; Scharler, U.M.; Ulanowicz, R.E.; Hannon, B. Ecological network analysis: Network construction. Ecol. Model. 2007, 208, 49–55. [Google Scholar] [CrossRef]
- An, Y.; Liu, S.; Sun, Y.; Shi, F.; Beazley, R. Construction and optimization of an ecological network based on morphological spatial pattern analysis and circuit theory. Landsc. Ecol. 2021, 36, 2059–2076. [Google Scholar] [CrossRef]
- Shuai, N.; Hu, Y.; Gao, M.; Guo, Z.; Bai, Y. Construction and optimization of ecological networks in karst regions based on multi-scale nesting: A case study in Guangxi Hechi, China. Ecol. Inform. 2023, 74, 101963. [Google Scholar] [CrossRef]
- Wang, F.; Yu, Q.; Qiu, S.; Xu, C.; Ma, J.; Liu, H. Study on the relationship between topological characteristics of ecological spatial network and soil conservation function in southeastern Tibet, China. Ecol. Indic. 2023, 146, 109791. [Google Scholar] [CrossRef]
- Zeng, Y.; Yu, Q.; Wang, X.; Ma, J.; Xu, C.; Qiu, S.; Liu, W.; Wang, F. Research on the Relationship between the Structure of Forest and Grass Ecological Spaces and Ecological Service Capacity: A Case Study of the Wuding River Basin. Remote Sens. 2023, 15, 2456. [Google Scholar] [CrossRef]
- Guo, H.; Yu, Q.; Pei, Y.; Wang, G.; Yue, D. Optimization of landscape spatial structure aiming at achieving carbon neutrality in desert and mining areas. J. Clean. Prod. 2021, 322, 129156. [Google Scholar] [CrossRef]
- Little, C.E. Greenways for America; JHU Press: Baltimore, MD, USA, 1995. [Google Scholar]
- Peng, J.; Zhao, H.; Liu, Y. Urban ecological corridors construction: A review. Acta Ecol. Sin. 2017, 37, 23–30. [Google Scholar] [CrossRef]
- Hartig, F.; Abrego, N.; Bush, A.; Chase, J.M.; Guillera-Arroita, G.; Leibold, M.A.; Ovaskainen, O.; Pellissier, L.; Pichler, M.; Poggiato, G. Novel community data in ecology-properties and prospects. Trends Ecol. Evol. 2024. [Google Scholar] [CrossRef]
- Ye, H.; Yang, Z.; Xu, X. Ecological corridors analysis based on MSPA and MCR model—A case study of the Tomur World Natural Heritage Region. Sustainability 2020, 12, 959. [Google Scholar] [CrossRef]
- Saura, S.; Vogt, P.; Velázquez, J.; Hernando, A.; Tejera, R. Key structural forest connectors can be identified by combining landscape spatial pattern and network analyses. For. Ecol. Manag. 2011, 262, 150–160. [Google Scholar] [CrossRef]
- Pascual-Hortal, L.; Saura, S. Comparison and development of new graph-based landscape connectivity indices: Towards the priorization of habitat patches and corridors for conservation. Landsc. Ecol. 2006, 21, 959–967. [Google Scholar] [CrossRef]
- Li, S.; Xiao, W.; Zhao, Y.; Lv, X. Incorporating ecological risk index in the multi-process MCRE model to optimize the ecological security pattern in a semi-arid area with intensive coal mining: A case study in northern China. J. Clean. Prod. 2020, 247, 119143. [Google Scholar] [CrossRef]
- Zhang, X.; Cui, X.; Liang, S. Evolution and Optimization of an Ecological Network in an Arid Region Based on MSPA-MCR: A Case Study of the Hexi Corridor. Sustainability 2024, 16, 1704. [Google Scholar] [CrossRef]
- Knaapen, J.P.; Scheffer, M.; Harms, B. Estimating habitat isolation in landscape planning. Landsc. Urban Plan. 1992, 23, 1–16. [Google Scholar] [CrossRef]
- Yi, S.; Zhou, Y.; Li, Q. A New Perspective for Urban Development Boundary Delineation Based on the MCR Model and CA-Markov Model. Land 2022, 11, 401. [Google Scholar] [CrossRef]
- Yang, C.; Guo, H.; Huang, X.; Wang, Y.; Li, X.; Cui, X. Ecological network construction of a national park based on MSPA and MCR models: An example of the proposed national parks of “Ailaoshan-Wuliangshan” in China. Land 2022, 11, 1913. [Google Scholar] [CrossRef]
- Zhang, F.; Jia, Y.; Liu, X.; Li, T.; Gao, Q. Application of MSPA-MCR models to construct ecological security pattern in the basin: A case study of Dawen River basin. Ecol. Indic. 2024, 160, 111887. [Google Scholar] [CrossRef]
- Strogatz, S.H. Exploring complex networks. Nature 2001, 410, 268–276. [Google Scholar] [CrossRef] [PubMed]
- Song, C.; Havlin, S.; Makse, H.A. Self-similarity of complex networks. Nature 2005, 433, 392–395. [Google Scholar] [CrossRef] [PubMed]
- Milo, R.; Shen-Orr, S.; Itzkovitz, S.; Kashtan, N.; Chklovskii, D.; Alon, U. Network motifs: Simple building blocks of complex networks. Science 2002, 298, 824–827. [Google Scholar] [CrossRef]
- Hulse, B.K.; Haberkern, H.; Franconville, R.; Turner-Evans, D.B.; Takemura, S.-y.; Wolff, T.; Noorman, M.; Dreher, M.; Dan, C.; Parekh, R. A connectome of the Drosophila central complex reveals network motifs suitable for flexible navigation and context-dependent action selection. Elife 2021, 10, 66039. [Google Scholar] [CrossRef]
- Shi, Z.; Zhang, H.; Li, Y.; Zhou, J. Air Traffic Sector Network: Motif Identification and Resilience Evaluation Based on Subgraphs. Sustainability 2023, 15, 13423. [Google Scholar] [CrossRef]
- Schreiber, F.; Schwöbbermeyer, H. Frequency concepts and pattern detection for the analysis of motifs in networks. In Transactions on Computational Systems Biology III; Springer: Berlin/Heidelberg, Germany, 2005; pp. 89–104. [Google Scholar]
- Holland, P.W.; Leinhardt, S. The Statistical Analysis of Local Structure in Social Networks; National Bureau of Economic Research, Inc.: Cambridge, MA, USA, 1974. [Google Scholar]
- Holland, P.W.; Leinhardt, S. Local structure in social networks. Sociol. Methodol. 1976, 7, 1–45. [Google Scholar] [CrossRef]
- Wernicke, S. A faster algorithm for detecting network motifs. In Proceedings of the International Workshop on Algorithms in Bioinformatics, Mallorca, Spain, 3–6 October 2005; pp. 165–177. [Google Scholar]
- Zhang, X.; Qi, Y.; Li, H.; Wang, X.; Yin, Q. Assessing the response of non-point source nitrogen pollution to land use change based on SWAT model. Ecol. Indic. 2024, 158, 111391. [Google Scholar] [CrossRef]
- Yan, M.; Cui, F.; Liu, Y.; Zhang, Z.; Zhang, J.; Ren, H.; Li, Z. Vegetation type and plant diversity affected soil carbon accumulation in a postmining area in Shanxi Province, China. Land Degrad. Dev. 2020, 31, 181–189. [Google Scholar] [CrossRef]
- Yan, M.; Fan, L.; Wang, L. Restoration of soil carbon with different tree species in a post-mining land in eastern Loess Plateau, China. Ecol. Eng. 2020, 158, 106025. [Google Scholar] [CrossRef]
- Wohlfart, C.; Mack, B.; Liu, G.; Kuenzer, C. Multi-faceted land cover and land use change analyses in the Yellow River Basin based on dense Landsat time series: Exemplary analysis in mining, agriculture, forest, and urban areas. Appl. Geogr. 2017, 85, 73–88. [Google Scholar] [CrossRef]
- Li, X.; Hou, X.; Wang, Z.; Zhang, C.; Ma, J.; Gao, M.; Fu, C.; Bai, Z.; Gui, C.; Zuo, X. Karst hydrogeological characteristics of Jindong large coal basin, northern China. Environ. Earth Sci. 2023, 82, 203. [Google Scholar] [CrossRef]
- Zhang, F.; Zhang, Z. Influence of Coal Mining on Water Environment and Ecology in the Yellow River Basin; IMWA: Lakewood, CO, USA, 2021. [Google Scholar]
- Tu, W.; Zhang, L.; Zhou, Z.; Liu, X.; Fu, Z. The development of renewable energy in resource-rich region: A case in China. Renew. Sustain. Energy Rev. 2011, 15, 856–860. [Google Scholar] [CrossRef]
- Quan, Z.-J.; Cheng, H.; Yu, Y.-J.; Zou, X.-Y. Assessment of subsidence impact on vegetation landscape in coal mining area—A case study of Dongda mine in Jincheng City, Shanxi Province. Chin. J. Plant Ecol. 2006, 30, 414. [Google Scholar]
- Pettorelli, N.; Vik, J.O.; Mysterud, A.; Gaillard, J.-M.; Tucker, C.J.; Stenseth, N.C. Using the satellite-derived NDVI to assess ecological responses to environmental change. Trends Ecol. Evol. 2005, 20, 503–510. [Google Scholar] [CrossRef] [PubMed]
- Huang, S.; Tang, L.; Hupy, J.P.; Wang, Y.; Shao, G. A commentary review on the use of normalized difference vegetation index (NDVI) in the era of popular remote sensing. J. For. Res. 2021, 32, 1–6. [Google Scholar] [CrossRef]
- Xu, H. Modification of normalised difference water index (NDWI) to enhance open water features in remotely sensed imagery. Int. J. Remote Sens. 2006, 27, 3025–3033. [Google Scholar] [CrossRef]
- Du, Y.; Zhang, Y.; Ling, F.; Wang, Q.; Li, W.; Li, X. Water bodies’ mapping from Sentinel-2 imagery with modified normalized difference water index at 10-m spatial resolution produced by sharpening the SWIR band. Remote Sens. 2016, 8, 354. [Google Scholar] [CrossRef]
- Peng, J.; Yang, Y.; Liu, Y.; Du, Y.; Meersmans, J.; Qiu, S. Linking ecosystem services and circuit theory to identify ecological security patterns. Sci. Total Environ. 2018, 644, 781–790. [Google Scholar] [CrossRef] [PubMed]
- Zhou, D.; Lin, Z.; Ma, S.; Qi, J.; Yan, T. Assessing an ecological security network for a rapid urbanization region in Eastern China. Land Degrad. Dev. 2021, 32, 2642–2660. [Google Scholar] [CrossRef]
- Brockerhoff, E.G.; Barbaro, L.; Castagneyrol, B.; Forrester, D.I.; Gardiner, B.; González-Olabarria, J.R.; Lyver, P.O.B.; Meurisse, N.; Oxbrough, A.; Taki, H. Forest biodiversity, ecosystem functioning and the provision of ecosystem services. Biodivers. Conserv. 2017, 26, 3005–3035. [Google Scholar] [CrossRef]
- Tang, F.; Zhou, X.; Wang, L.; Zhang, Y.; Fu, M.; Zhang, P. Linking ecosystem service and MSPA to construct landscape ecological network of the Huaiyang Section of the Grand Canal. Land 2021, 10, 919. [Google Scholar] [CrossRef]
- Zhai, T.; Huang, L. Linking MSPA and circuit theory to identify the spatial range of ecological networks and its priority areas for conservation and restoration in urban agglomeration. Front. Ecol. Evol. 2022, 10, 828979. [Google Scholar] [CrossRef]
- Chen, C.; Shi, L.; Lu, Y.; Yang, S.; Liu, S. The optimization of urban ecological network planning based on the minimum cumulative resistance model and granularity reverse method: A case study of Haikou, China. IEEE Access 2020, 8, 43592–43605. [Google Scholar] [CrossRef]
- Guo, R.; Wu, T.; Liu, M.; Huang, M.; Stendardo, L.; Zhang, Y. The construction and optimization of ecological security pattern in the Harbin-Changchun urban agglomeration, China. Int. J. Environ. Res. Public Health 2019, 16, 1190. [Google Scholar] [CrossRef] [PubMed]
- Dong, R.; Zhang, X.; Li, H. Constructing the ecological security pattern for sponge city: A case study in zhengzhou, china. Water 2019, 11, 284. [Google Scholar] [CrossRef]
- Bennett, G.; Mulongoy, K.J. Review of experience with ecological networks, corridors and buffer zones. In Secretariat of the Convention on Biological Diversity, Montreal, Technical Series; Secretariat of the Convention on Biological Diversity: Montreal, QC, Canada, 2006; p. 100. [Google Scholar]
- Ma, J.; Yu, Q.; Wang, H.; Yang, L.; Wang, R.; Fang, M. Construction and optimization of wetland landscape ecological network in Dongying City, China. Land 2022, 11, 1226. [Google Scholar] [CrossRef]
- Cui, X.; Li, H.; Wang, T. Structural Evolution and Stability Simulation of Wetland Ecological Network: A Case Study of Wuhan City, China. Wetlands 2022, 42, 73. [Google Scholar] [CrossRef]
- Estrada, E. The Structure of Complex Networks: Theory and Applications; American Chemical Society: Washington, DC, USA, 2012. [Google Scholar]
- Bloch, F.; Jackson, M.O.; Tebaldi, P. Centrality measures in networks. Soc. Choice Welf. 2023, 61, 413–453. [Google Scholar] [CrossRef]
- Song, S.; Xu, D.; Hu, S.; Shi, M. Ecological network optimization in urban central district based on complex network theory: A case study with the urban central district of Harbin. Int. J. Environ. Res. Public Health 2021, 18, 1427. [Google Scholar] [CrossRef] [PubMed]
- Zhao, J.; Yu, Q.; Xu, C.; Ma, J.; Liu, W.; Sun, W.; Miao, Y.; Nawaz, T. Integrated approach for ecological restoration and ecological spatial network optimization with multiple ecosystem functions in mining areas. Ecol. Indic. 2023, 156, 111141. [Google Scholar] [CrossRef]
- Qin, J.; Xue, K.; Li, J.; Sun, Q.; Lu, J. Service prioritization in information centric networking with heterogeneous content providers. IEEE Trans. Netw. Serv. Manag. 2021, 18, 4476–4488. [Google Scholar] [CrossRef]
- Zhang, J.; Luo, Y. Degree centrality, betweenness centrality, and closeness centrality in social network. In Proceedings of the 2017 2nd International Conference on Modelling, Simulation and Applied Mathematics (MSAM2017), Bangkok, Thailand, 26–27 March 2017; pp. 300–303. [Google Scholar]
- Verbavatz, V.; Barthelemy, M. Betweenness centrality in dense spatial networks. Phys. Rev. E 2022, 105, 054303. [Google Scholar] [CrossRef] [PubMed]
- Duan, J.; Jiao, J.; Xia, C.; Yao, S.; Li, X. Descriptive model of peer-to-peer Botnet structures. In Proceedings of the 2010 International Conference on Educational and Information Technology, Chongqing, China, 17–19 September 2010; pp. V3-153–V153-157. [Google Scholar]
- Pradhan, P.; Angeliya, C.; Jalan, S. Principal eigenvector localization and centrality in networks: Revisited. Phys. A Stat. Mech. Its Appl. 2020, 554, 124169. [Google Scholar] [CrossRef]
- Solá, L.; Romance, M.; Criado, R.; Flores, J.; García del Amo, A.; Boccaletti, S. Eigenvector centrality of nodes in multiplex networks. Chaos Interdiscip. J. Nonlinear Sci. 2013, 23, 033131. [Google Scholar] [CrossRef] [PubMed]
- Lauenroth, W.K.; Burke, I.C. Ecology of the Shortgrass Steppe: A Long-Term Perspective; Oxford University Press: Oxford, UK, 2008; 270p. [Google Scholar]
- Wang, G.; Peng, W.; Zhang, L.; Zhang, J. Quantifying the impacts of natural and human factors on changes in NPP using an optimal parameters-based geographical detector. Ecol. Indic. 2023, 155, 111018. [Google Scholar] [CrossRef]
- Zhong, L.; Zhang, Q.; Yang, D.; Chen, G.; Yu, S. Analysing Motifs in Multilayer Networks. arXiv 2019, arXiv:1903.01722. [Google Scholar]
- Wernicke, S. Efficient detection of network motifs. IEEE/ACM Trans. Comput. Biol. Bioinform. 2006, 3, 347–359. [Google Scholar] [CrossRef] [PubMed]
- Anceaume, E.; Busnel, Y.; Gambs, S. Ankle: Detecting attacks in large scale systems via information divergence. In Proceedings of the 2012 Ninth European Dependable Computing Conference, Washington, DC, USA, 8–11 May 2012; pp. 114–125. [Google Scholar]
- Cui, D.; Ou, C.; Lu, X. Evolution of the global terrorist organizational cooperation network. PLoS ONE 2024, 19, e0281615. [Google Scholar] [CrossRef] [PubMed]
- Lynch, A.J. Creating effective urban greenways and stepping-stones: Four critical gaps in habitat connectivity planning research. J. Plan. Lit. 2019, 34, 131–155. [Google Scholar] [CrossRef]
- Wang, T.; Huang, Y.; Cheng, J.; Xiong, H.; Ying, Y.; Feng, Y.; Wang, J. Construction and optimization of watershed-scale ecological network based on complex network method: A case study of Erhai Lake Basin in China. Ecol. Indic. 2024, 160, 111794. [Google Scholar] [CrossRef]
- Chang, S.; Su, K.; Jiang, X.; You, Y.; Li, C.; Wang, L. Impacts and Predictions of Urban Expansion on Habitat Connectivity Networks: A Multi-Scenario Simulation Approach. Forests 2023, 14, 2187. [Google Scholar] [CrossRef]
- Jiang, W.; Yuan, L.; Wang, W.; Cao, R.; Zhang, Y.; Shen, W. Spatio-temporal analysis of vegetation variation in the Yellow River Basin. Ecol. Indic. 2015, 51, 117–126. [Google Scholar] [CrossRef]
- Liu, L.; Yang, Y.; Liu, S.; Gong, X.; Zhao, Y.; Jin, R.; Duan, H.; Jiang, P. A comparative study of green growth efficiency in Yangtze River Economic Belt and Yellow River Basin between 2010 and 2020. Ecol. Indic. 2023, 150, 110214. [Google Scholar] [CrossRef]
- Zuo, D.; Chen, G.; Wang, G.; Xu, Z.; Han, Y.; Peng, D.; Pang, B.; Abbaspour, K.C.; Yang, H. Assessment of changes in water conservation capacity under land degradation neutrality effects in a typical watershed of Yellow River Basin, China. Ecol. Indic. 2023, 148, 110145. [Google Scholar] [CrossRef]
- Mangan, S.; Alon, U. Structure and function of the feed-forward loop network motif. Proc. Natl. Acad. Sci. USA 2003, 100, 11980–11985. [Google Scholar] [CrossRef]
- Duma, A.; Topirceanu, A. A network motif based approach for classifying online social networks. In Proceedings of the 2014 IEEE 9th IEEE International Symposium on Applied Computational Intelligence and Informatics (SACI), Timisoara, Romania, 15–17 May 2014; pp. 311–315. [Google Scholar]
- Xie, Z.; En-yuan, X.; Hong-zhi, L.; Yi-fei, Z.; Meng-qi, W. Fluctuation Characteristics of Arrival Flight Flow Based on Limited Penetrable Visibility Graph. J. Transp. Syst. Eng. Inf. Technol. 2022, 22, 244. [Google Scholar]
- Jiang, C.; Chen, Y.; Ren, Y.; Liu, K.R. Maximizing network capacity with optimal source selection: A network science perspective. IEEE Signal Process. Lett. 2014, 22, 938–942. [Google Scholar] [CrossRef]
- Wang, D.; Liu, E.; Liu, D.; Qu, X.; Ma, R.; Wang, P.; Liu, X. RSH: A link-addition strategy for capacity enhancement in scale-free networks. IEEE Commun. Lett. 2015, 19, 2110–2113. [Google Scholar] [CrossRef]
- Fan, J.; Wang, Q.; Ji, M.; Sun, Y.; Feng, Y.; Yang, F.; Zhang, Z. Ecological network construction and gradient zoning optimization strategy in urban-rural fringe: A case study of Licheng District, Jinan City, China. Ecol. Indic. 2023, 150, 110251. [Google Scholar] [CrossRef]
- Wei, Y.; Jin, Y.; Ma, D.; Xiu, C. Impact of colored motif characteristics on the survivability of passenger airline networks in China. Phys. A Stat. Mech. Appl. 2021, 566, 125658. [Google Scholar] [CrossRef]
- Jin, Y.; Wei, Y.; Xiu, C.; Song, W.; Yang, K. Study on structural characteristics of China’s passenger airline network based on network motifs analysis. Sustainability 2019, 11, 2484. [Google Scholar] [CrossRef]
- Fang, J.; Guo, Z.; Piao, S.; Chen, A. Terrestrial vegetation carbon sinks in China, 1981–2000. Sci. China Ser. D Earth Sci. 2007, 50, 1341–1350. [Google Scholar] [CrossRef]
- Yang, Y.; Ma, Y.; Jiang, H.; Zhu, Q.; Liu, J.; Peng, C. Evaluating the carbon budget pattern of Chinese terrestrial ecosystem from 1960 to 2006 using Integrated Biosphere Simulator. Acta Ecol. Sin. 2016, 36, 3911–3922. [Google Scholar]
- Cao, Y.; Sun, Y.; Jiang, Y.; Wan, J. Analysis on temporal-spatial variations and driving factors of net ecosystem productivity in the Yellow River Basin. Ecol. Environ. 2022, 31, 2101. [Google Scholar]
- Yang, X.; Bai, B.; Bai, Z. Research on spatiotemporal changes in carbon footprint and vegetation carbon carrying capacity in Shanxi Province. Forests 2023, 14, 1295. [Google Scholar] [CrossRef]
- Ahirwal, J.; Kumar, A.; Pietrzykowski, M.; Maiti, S.K. Reclamation of coal mine spoil and its effect on Technosol quality and carbon sequestration: A case study from India. Environ. Sci. Pollut. Res. 2018, 25, 27992–28003. [Google Scholar] [CrossRef]
- Fox, J.F.; Campbell, J.E.; Acton, P.M. Carbon sequestration by reforesting legacy grasslands on coal mining sites. Energies 2020, 13, 6340. [Google Scholar] [CrossRef]
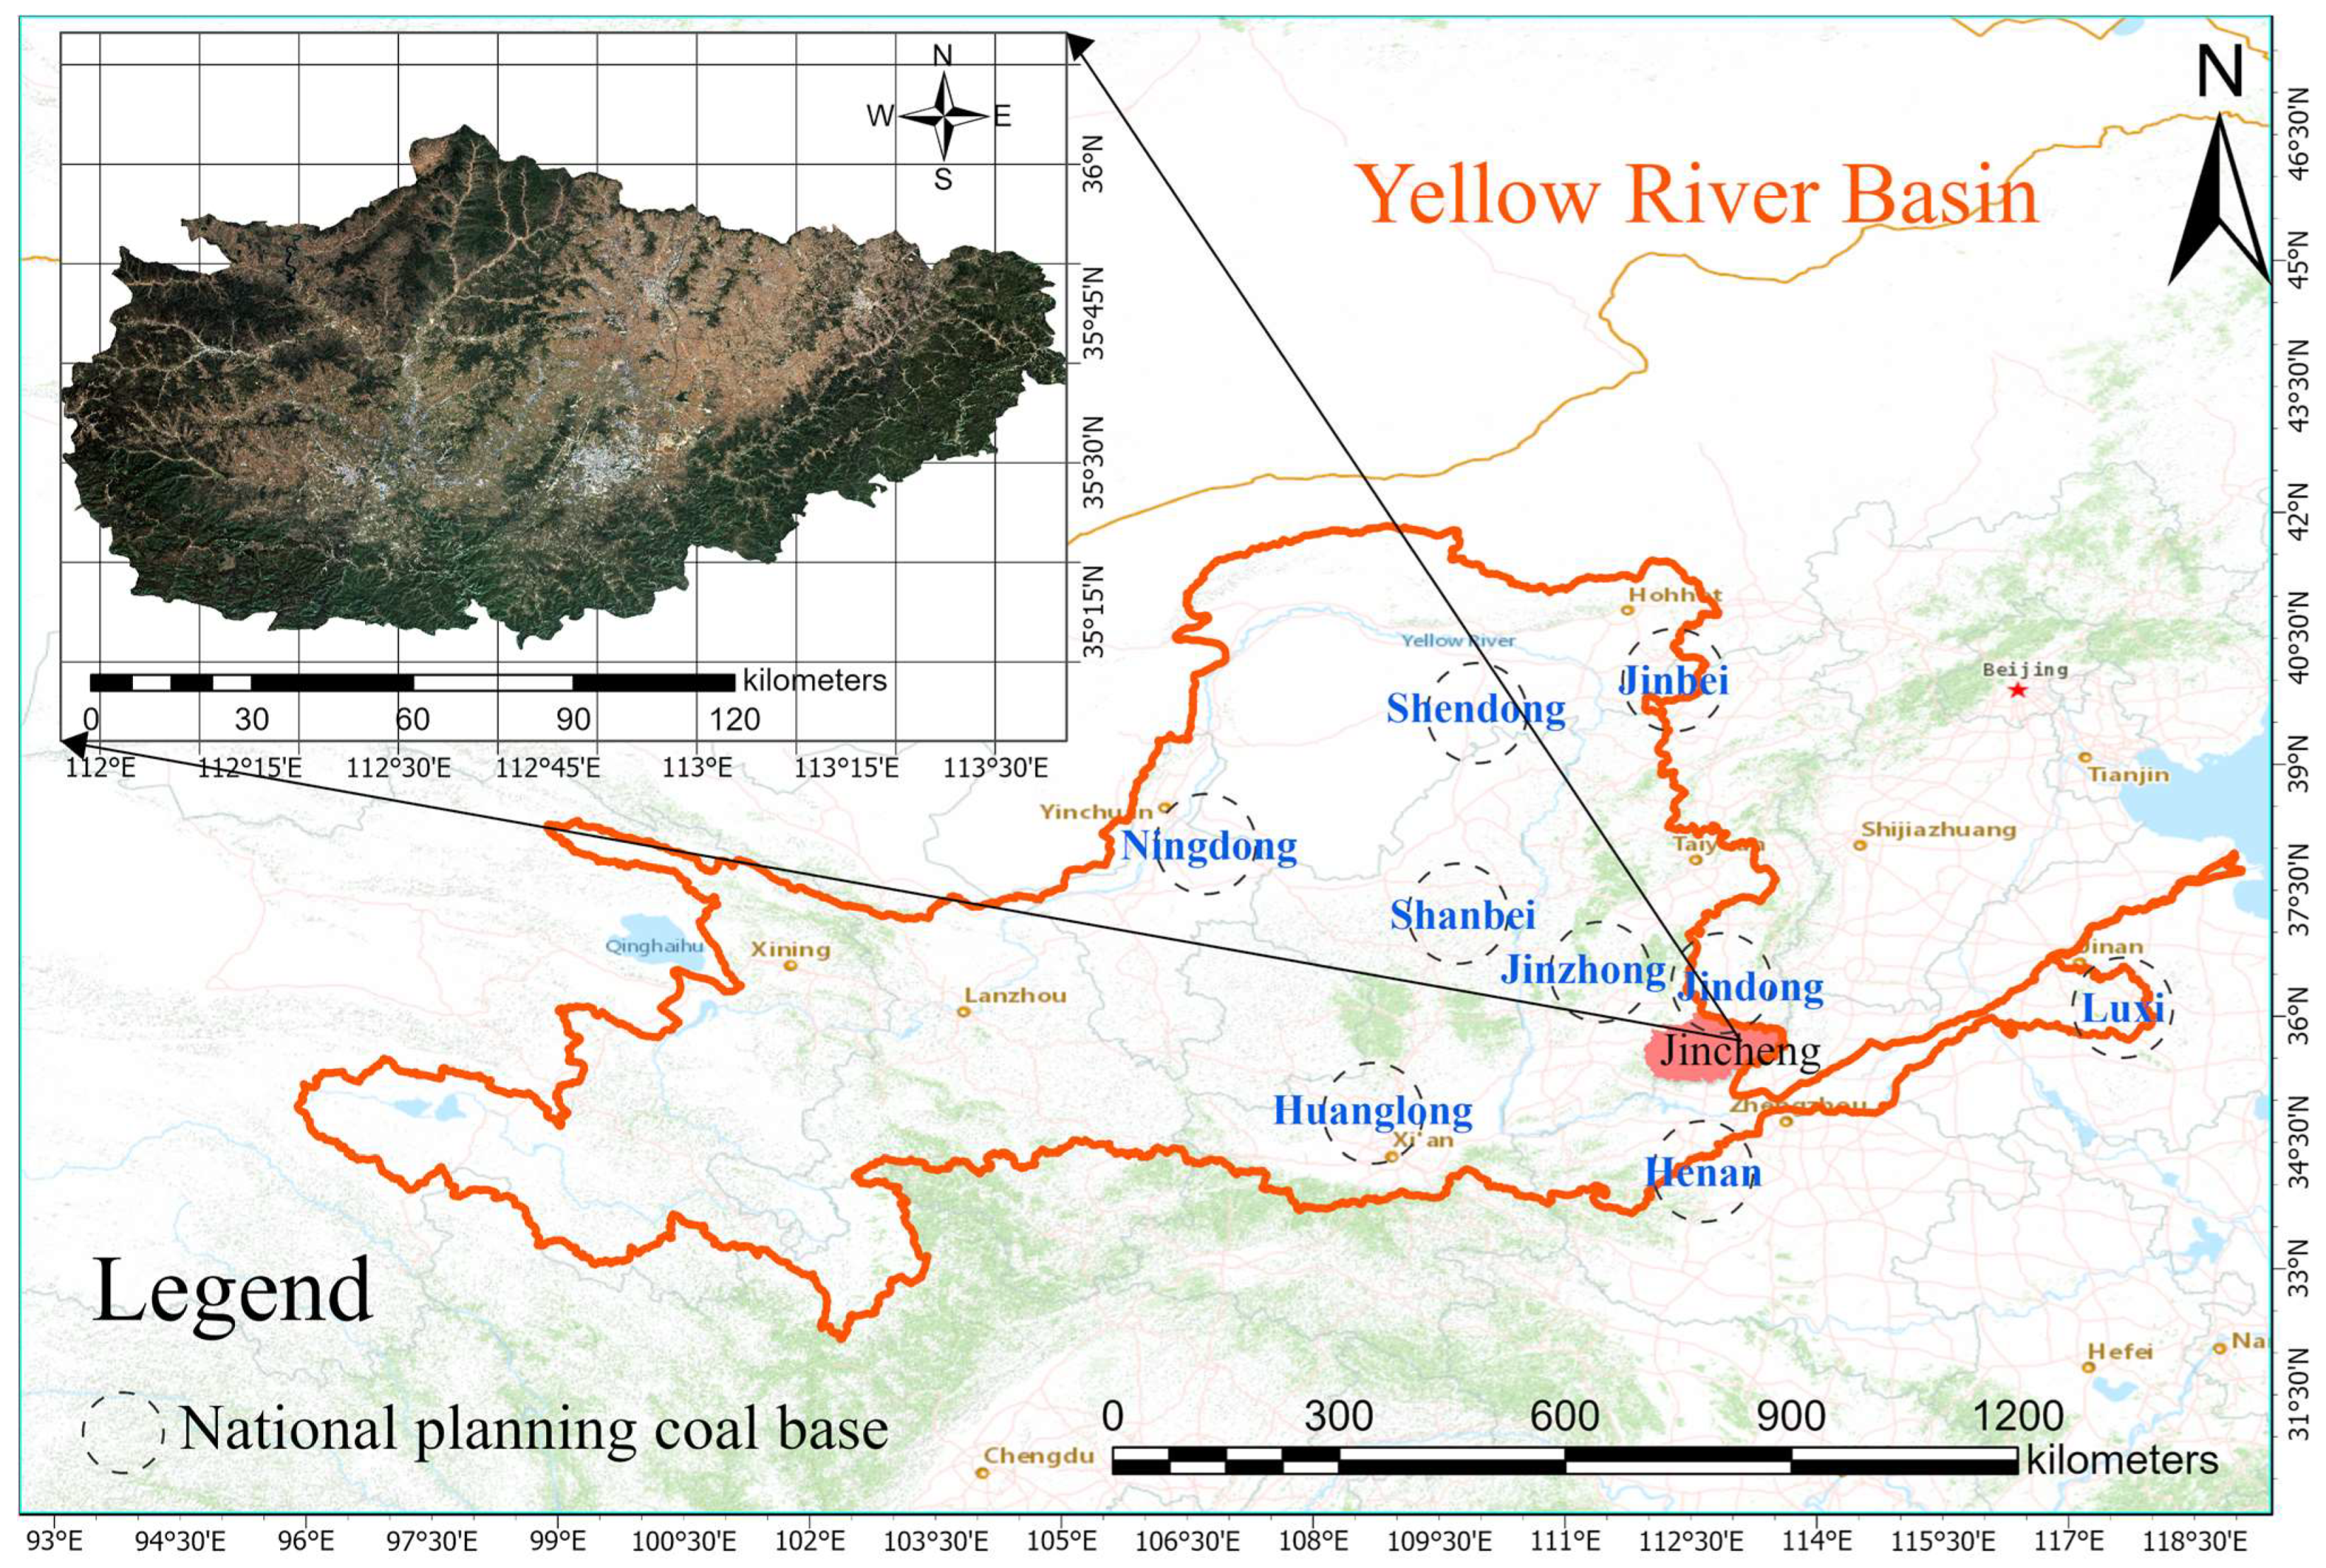


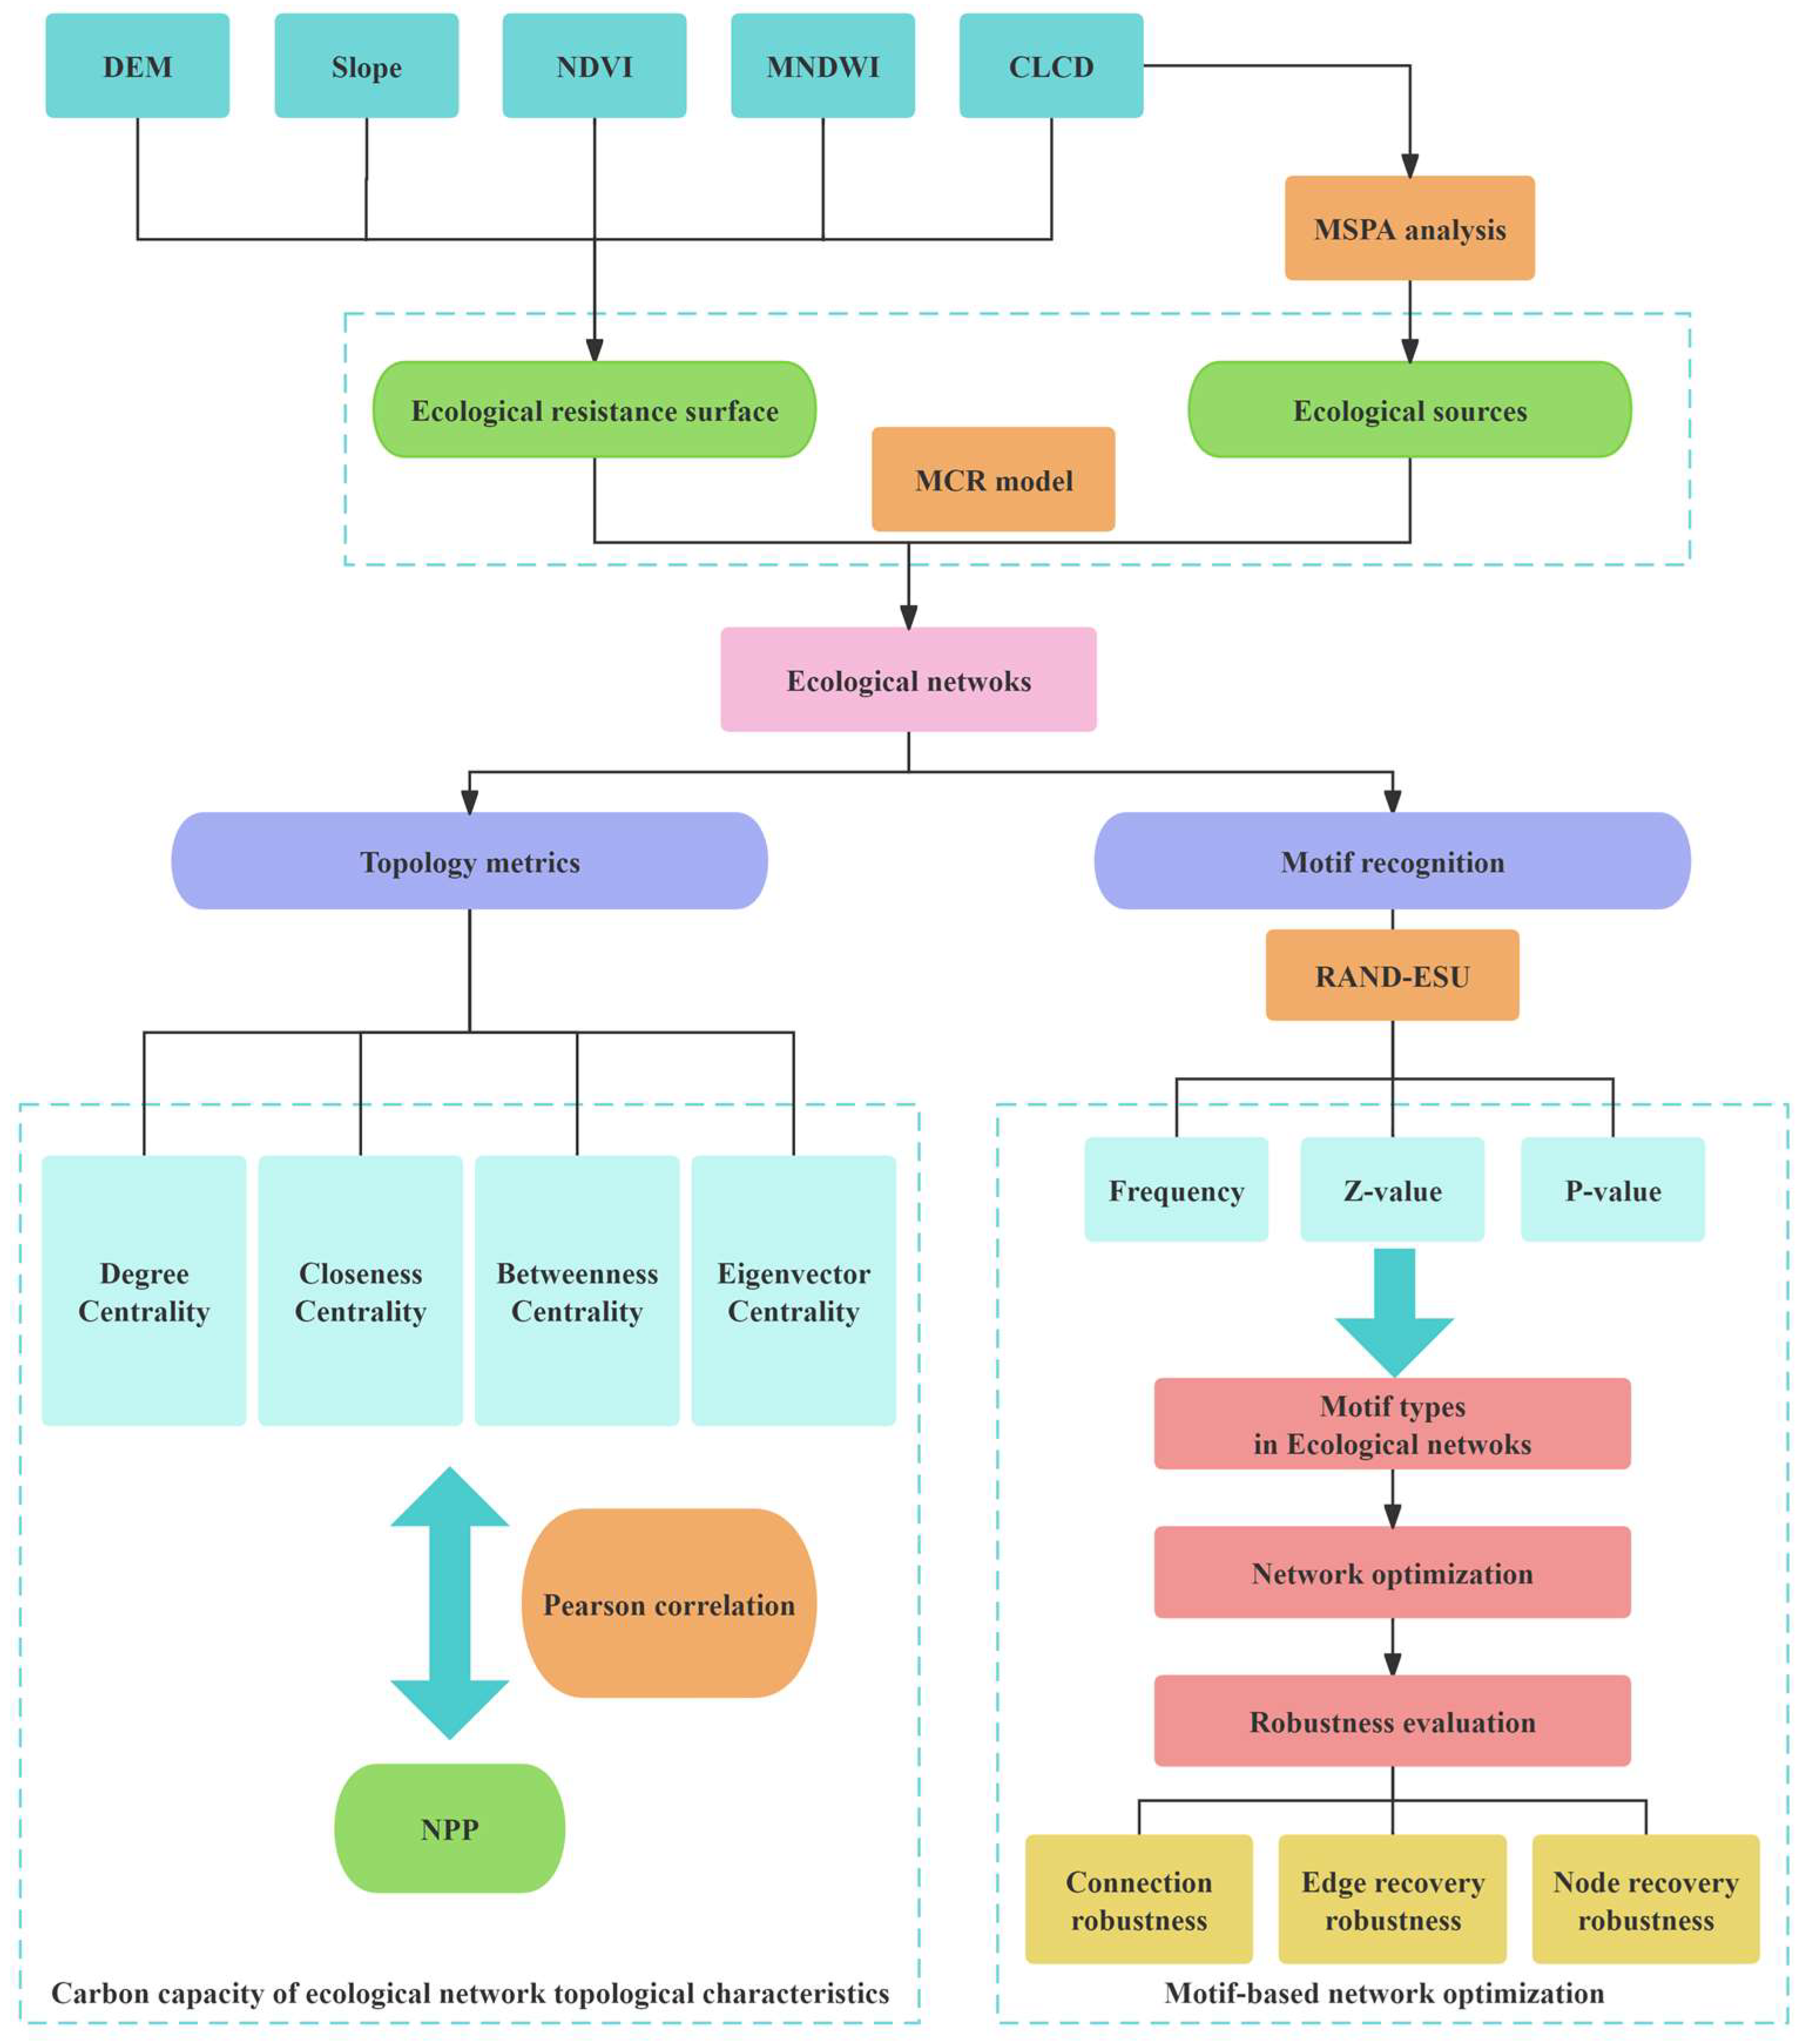

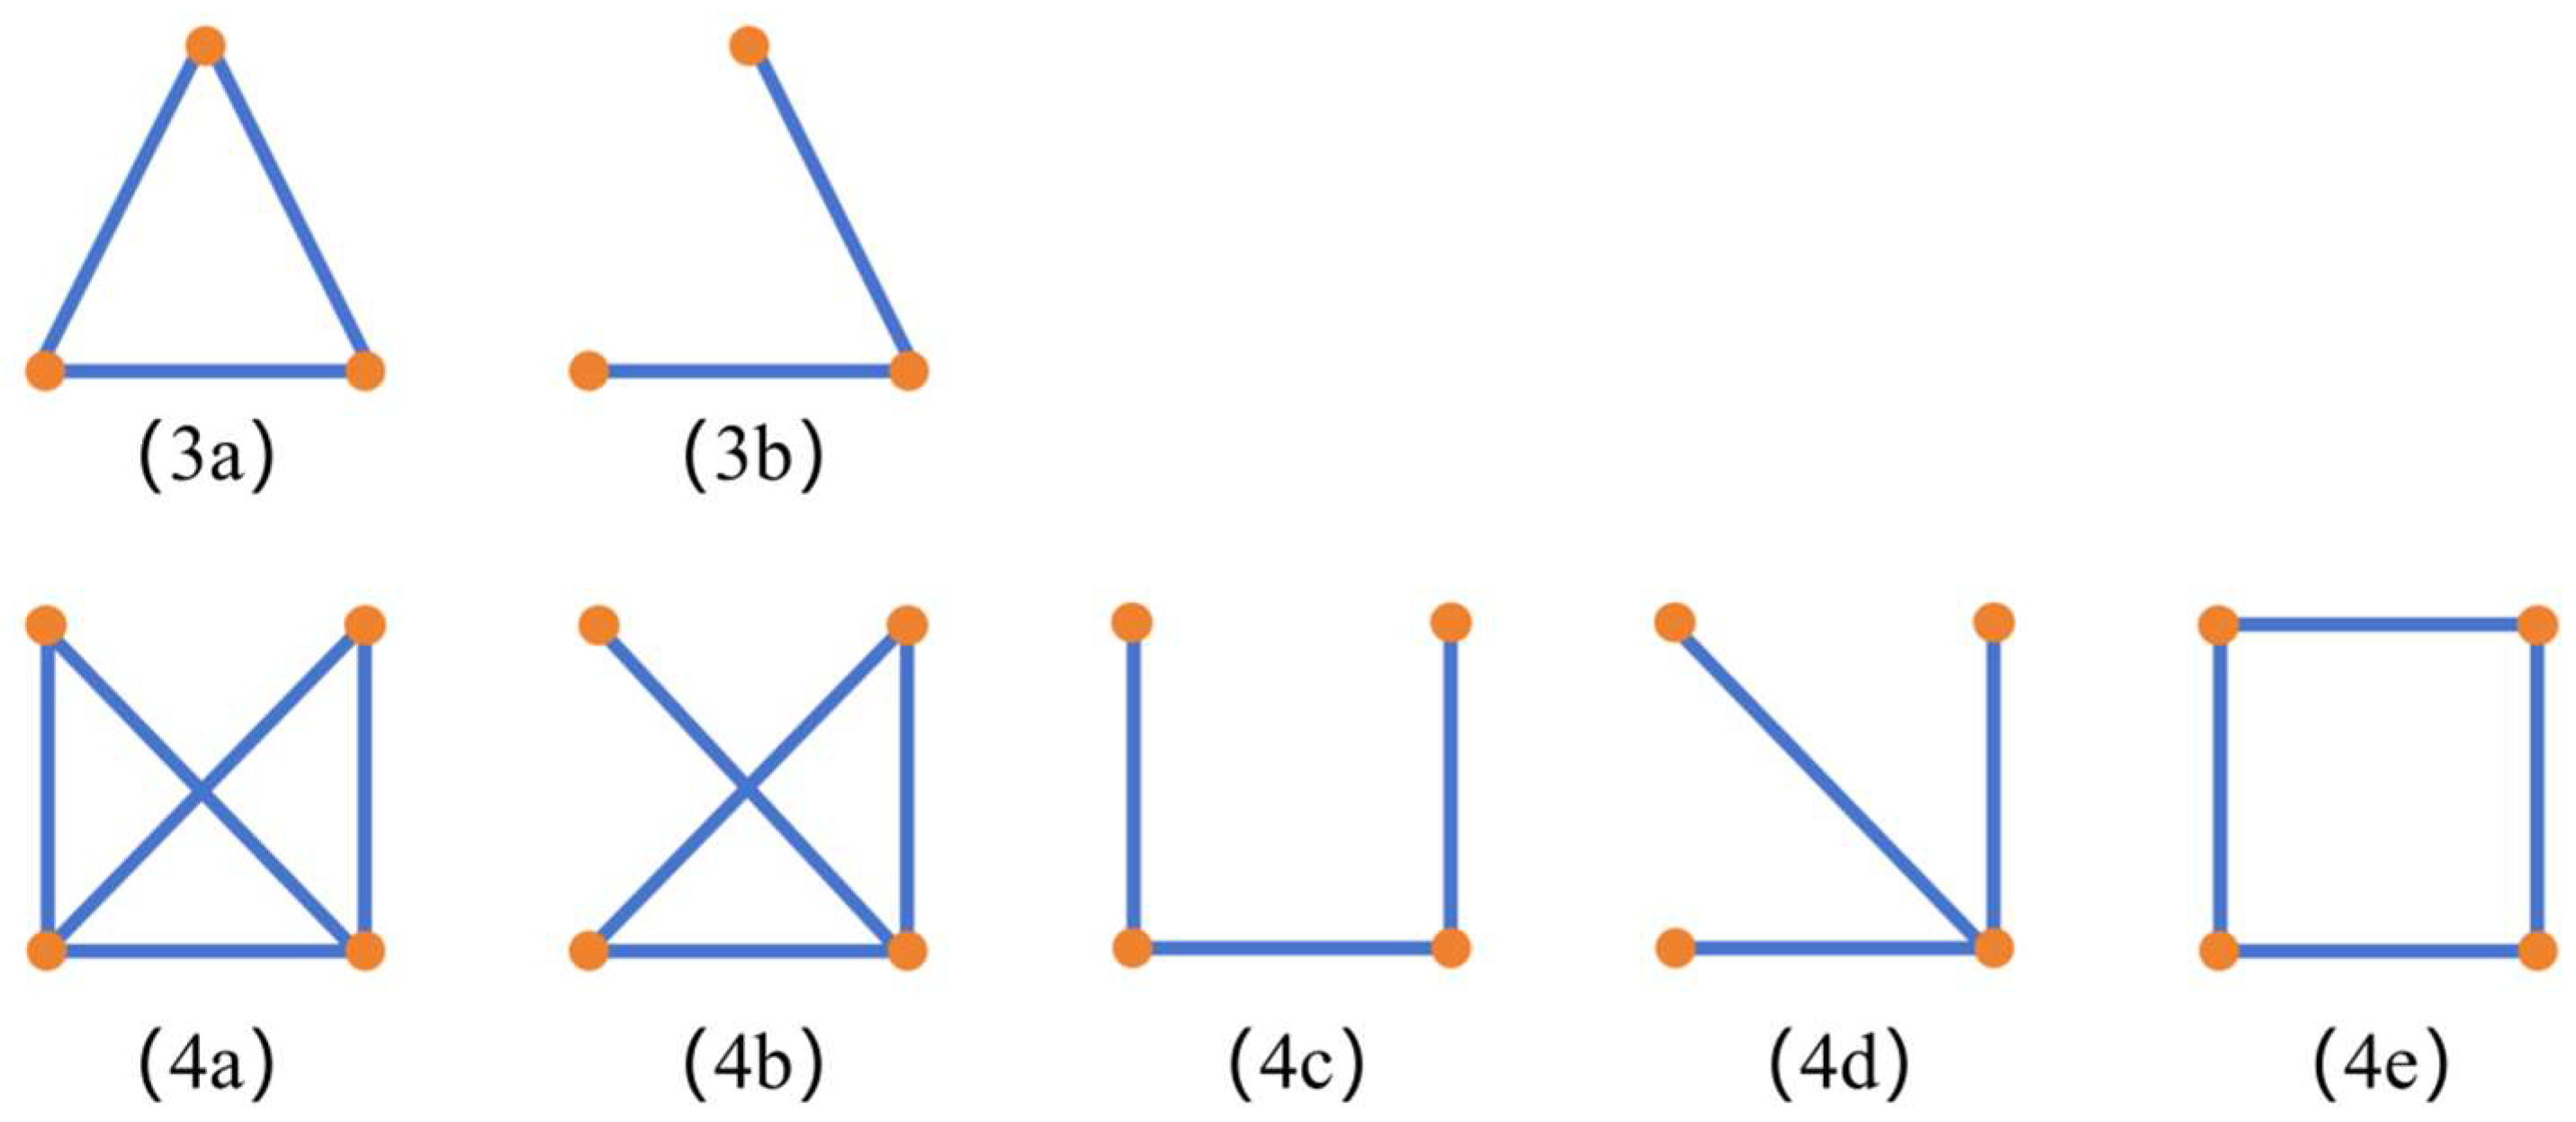
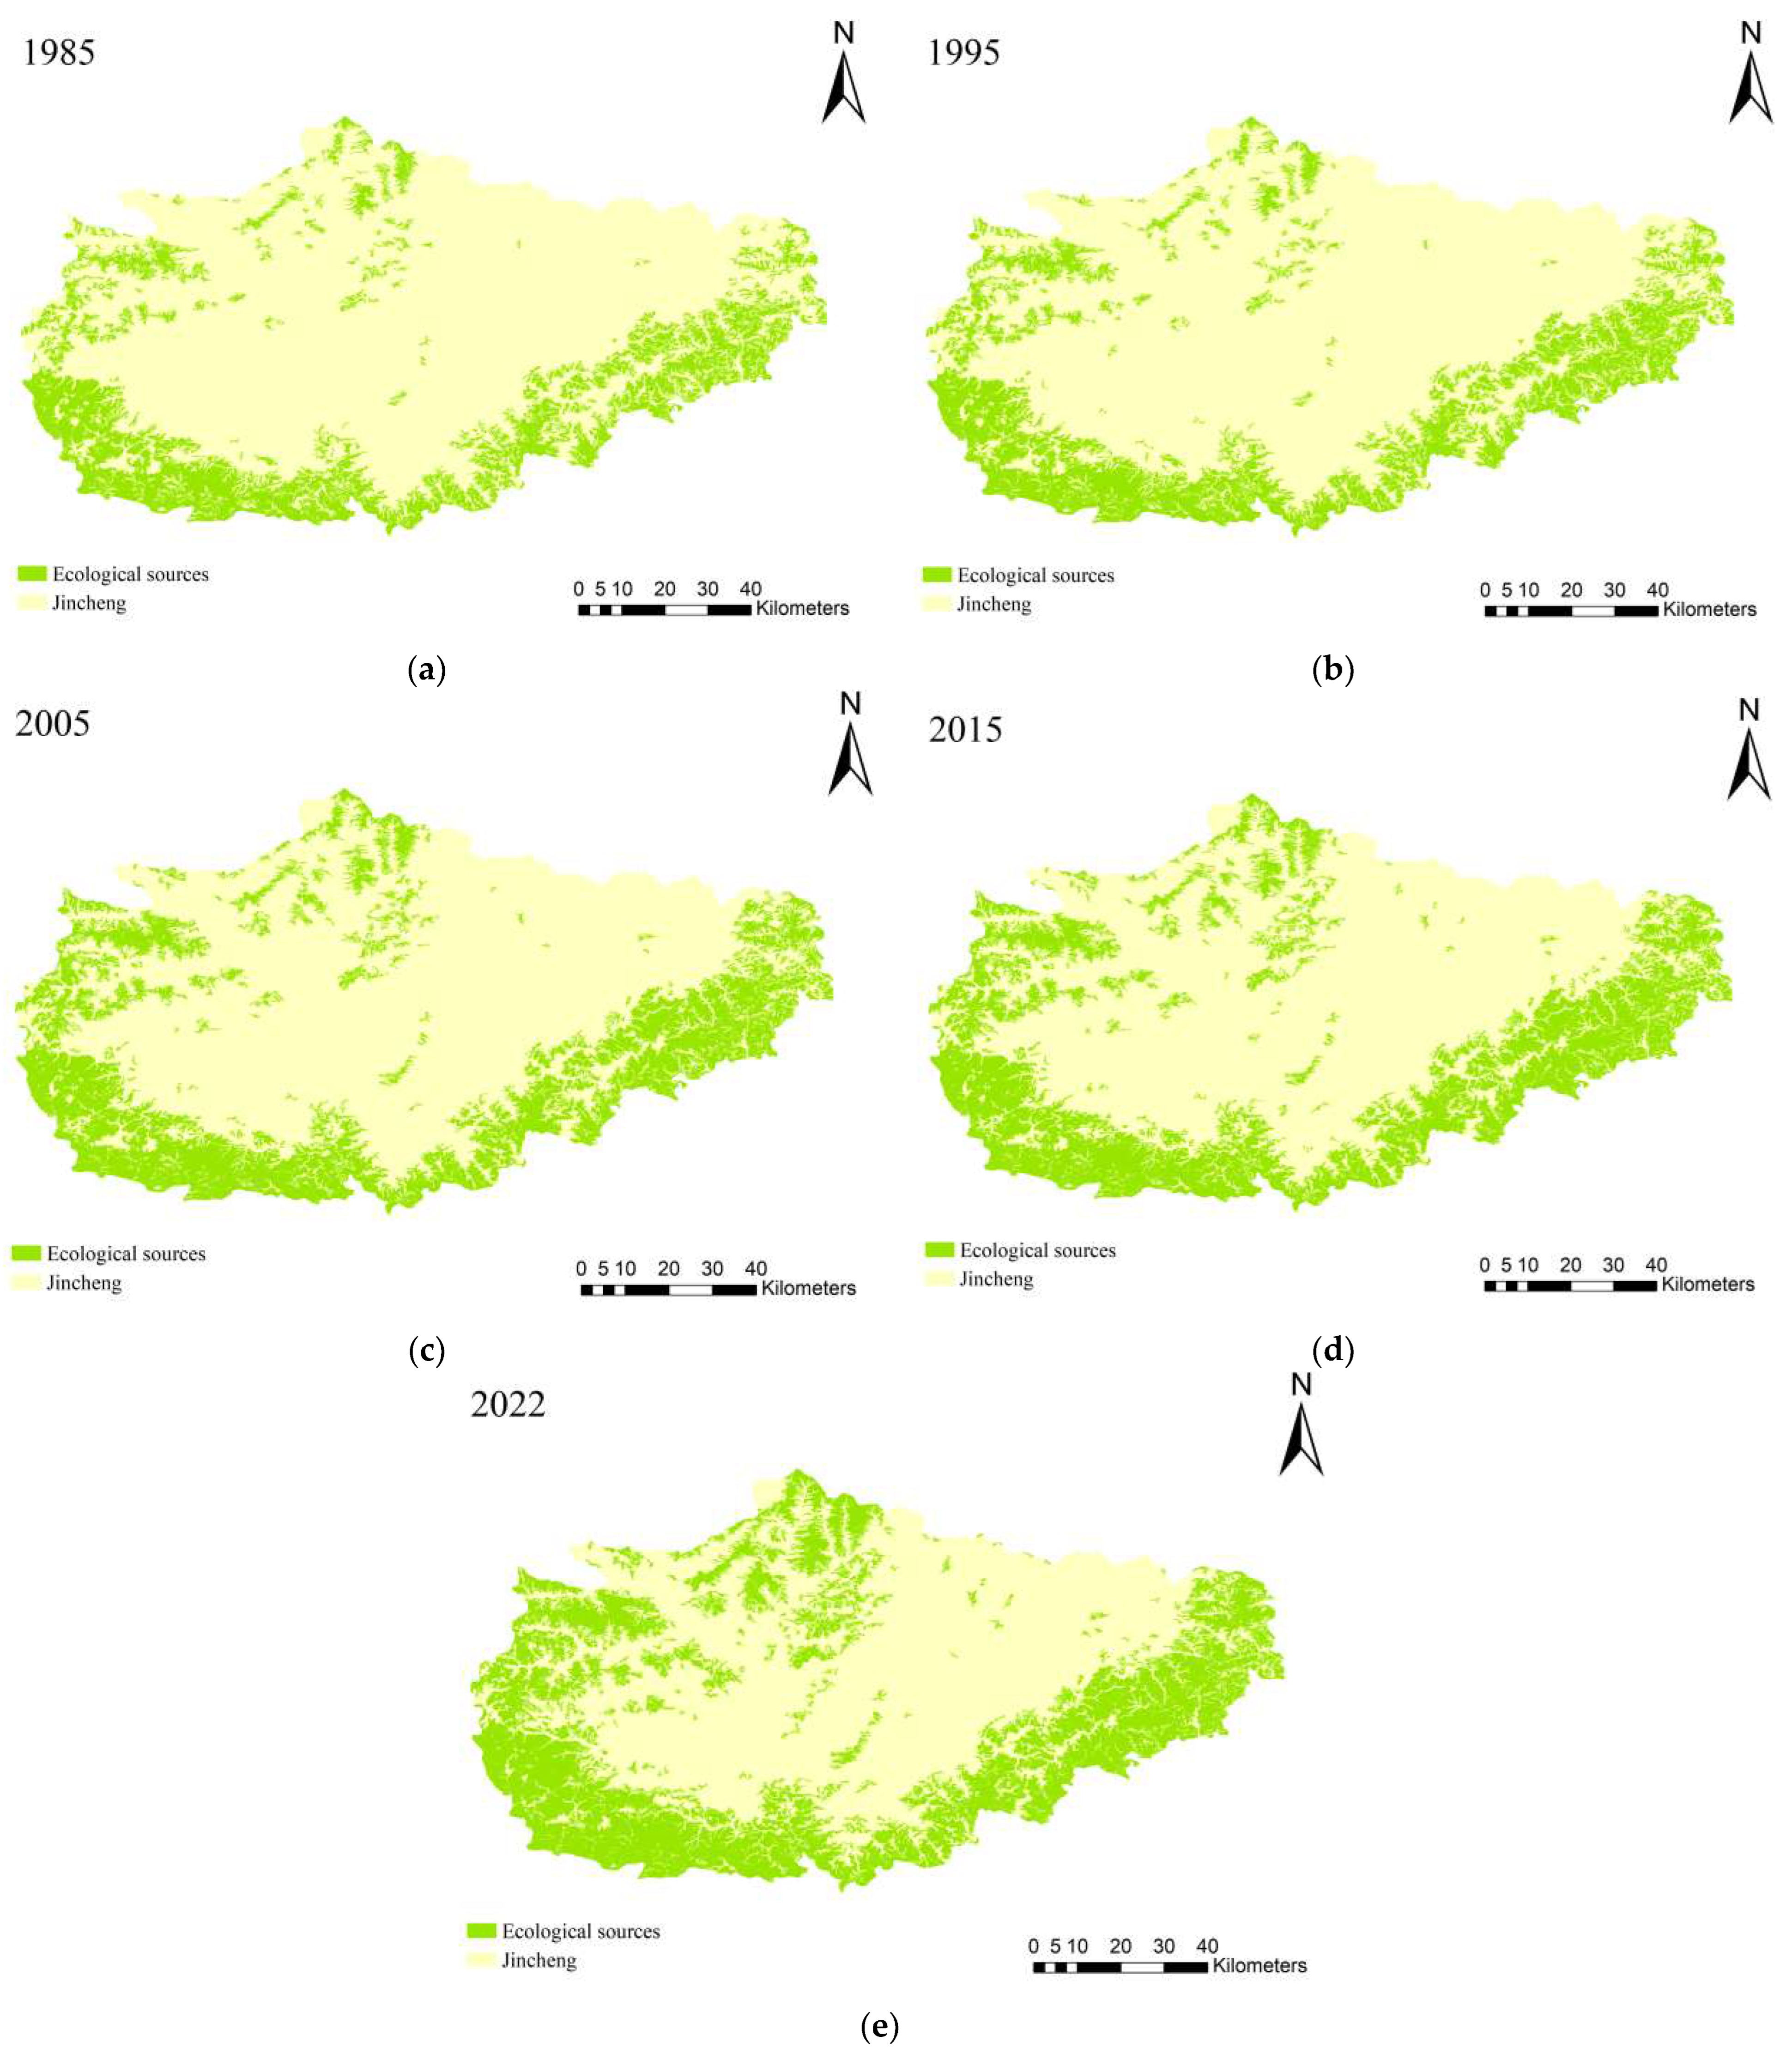
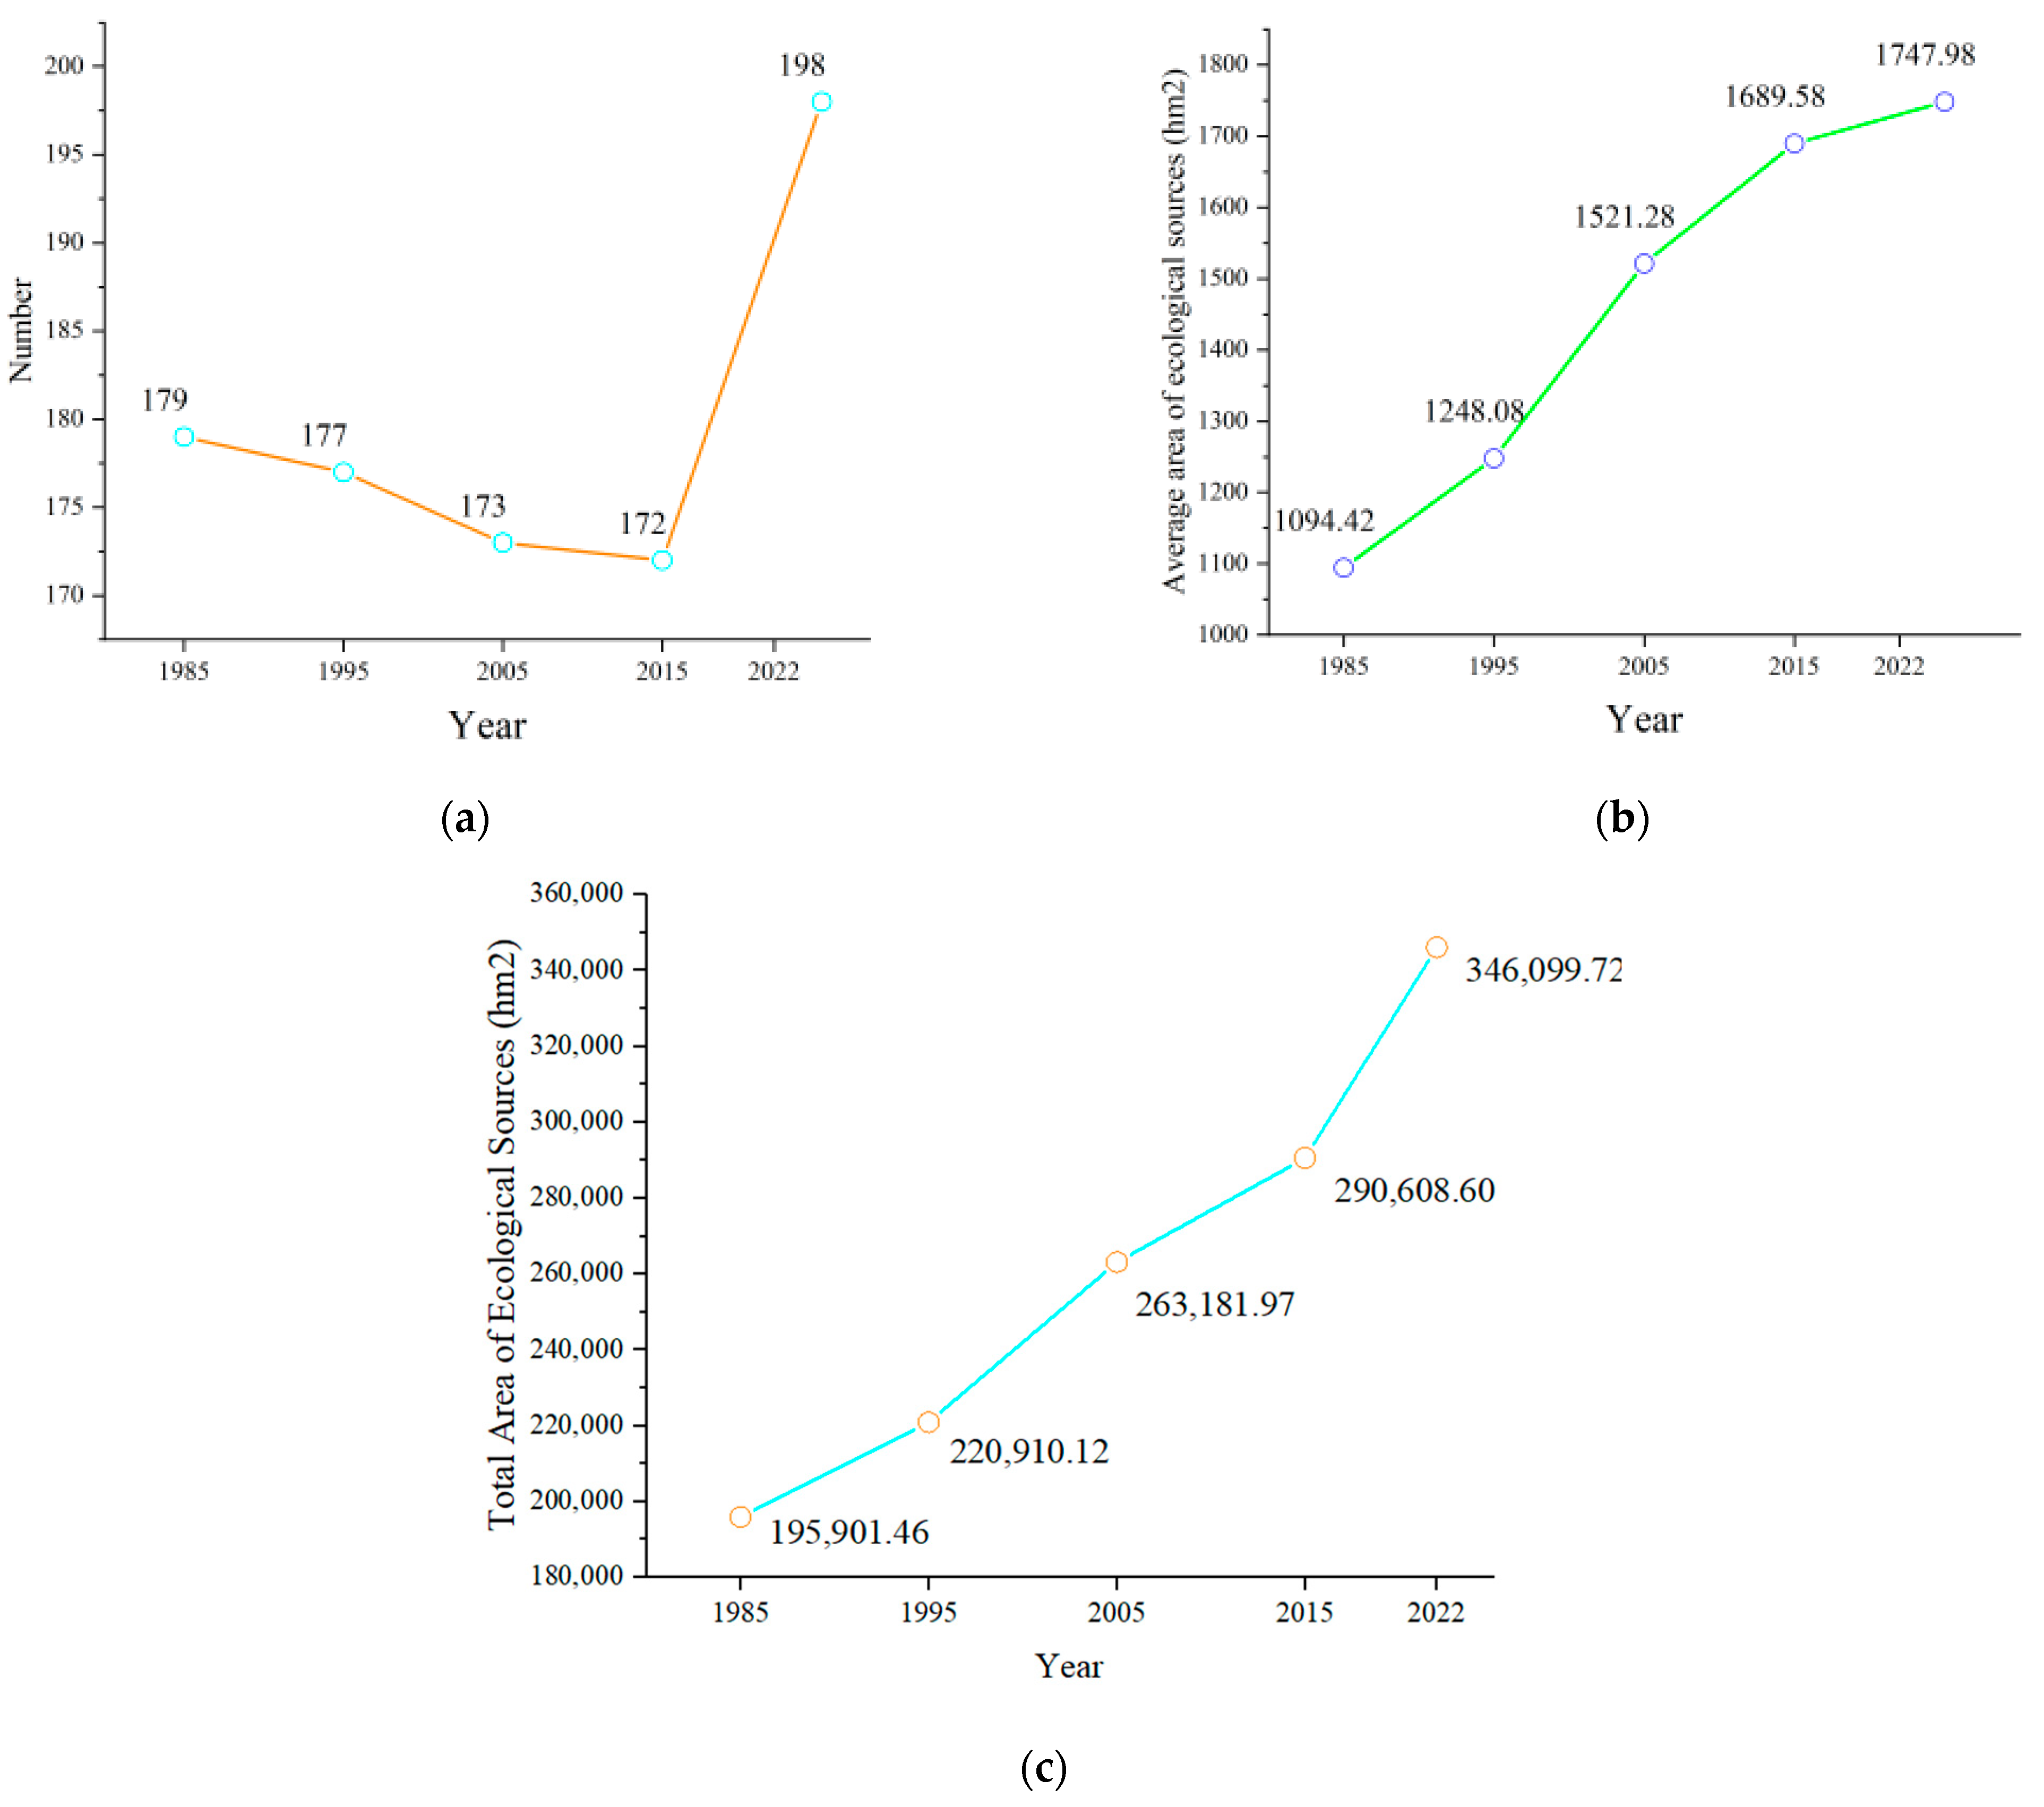
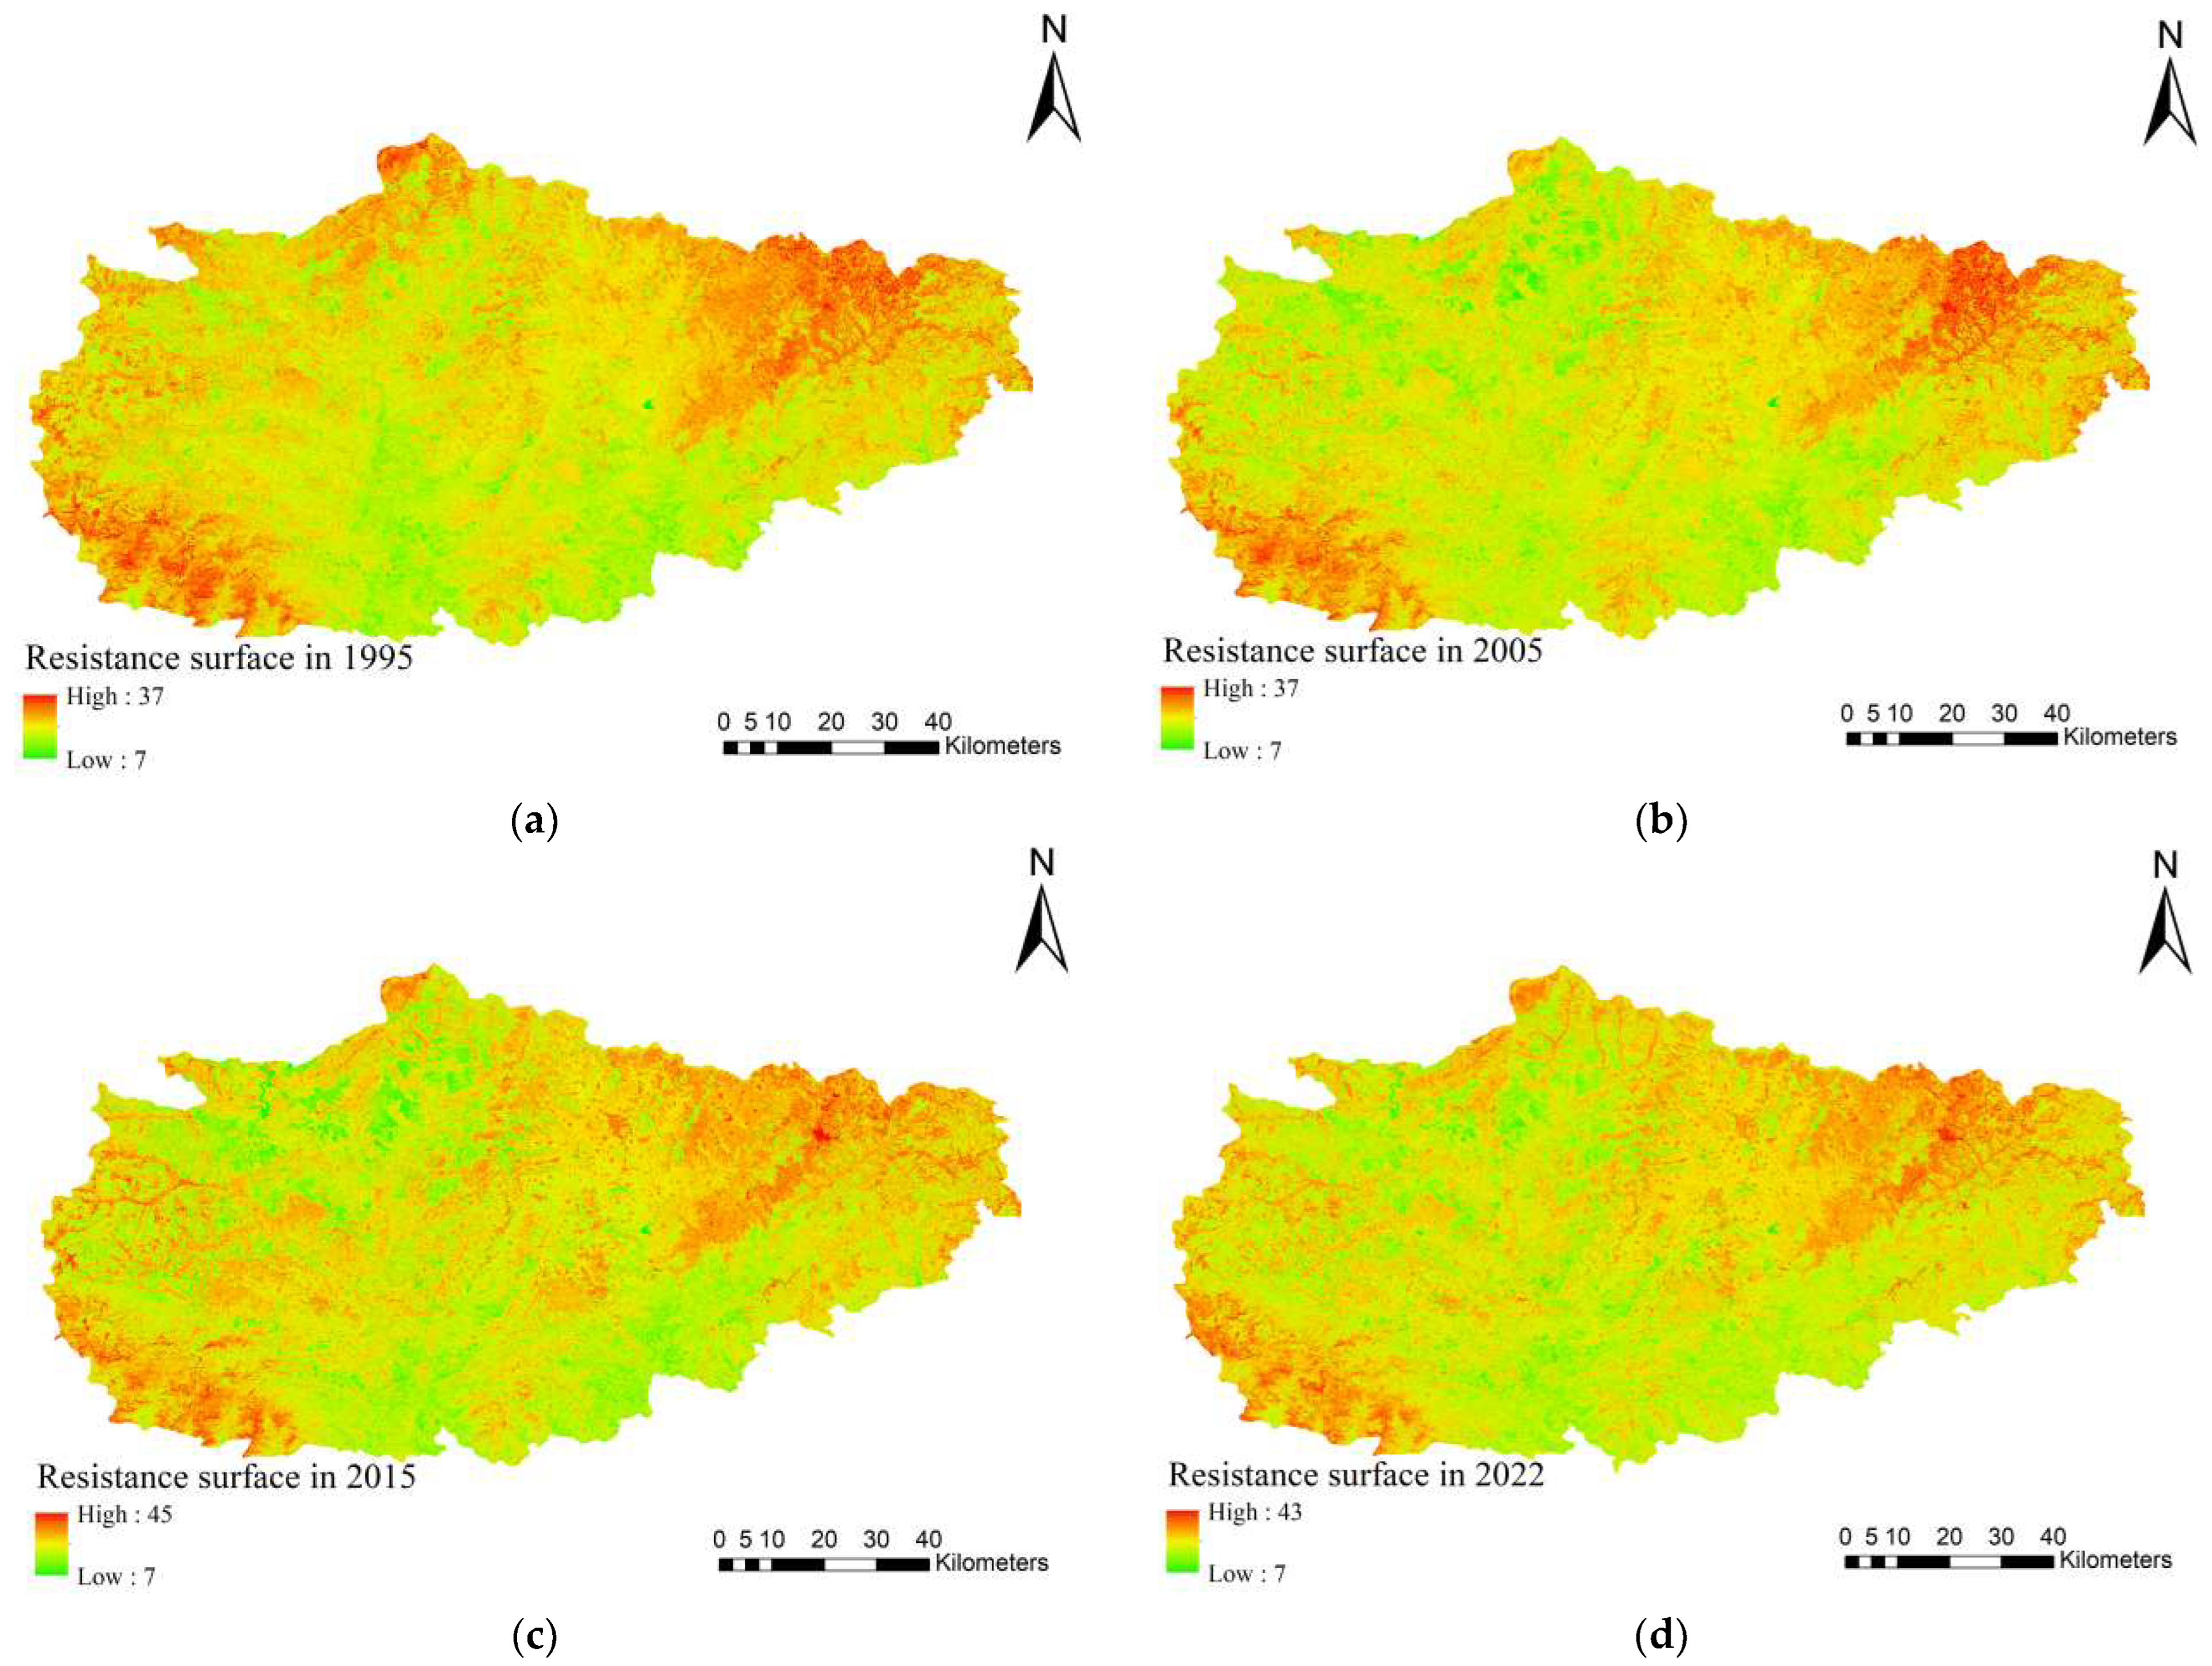
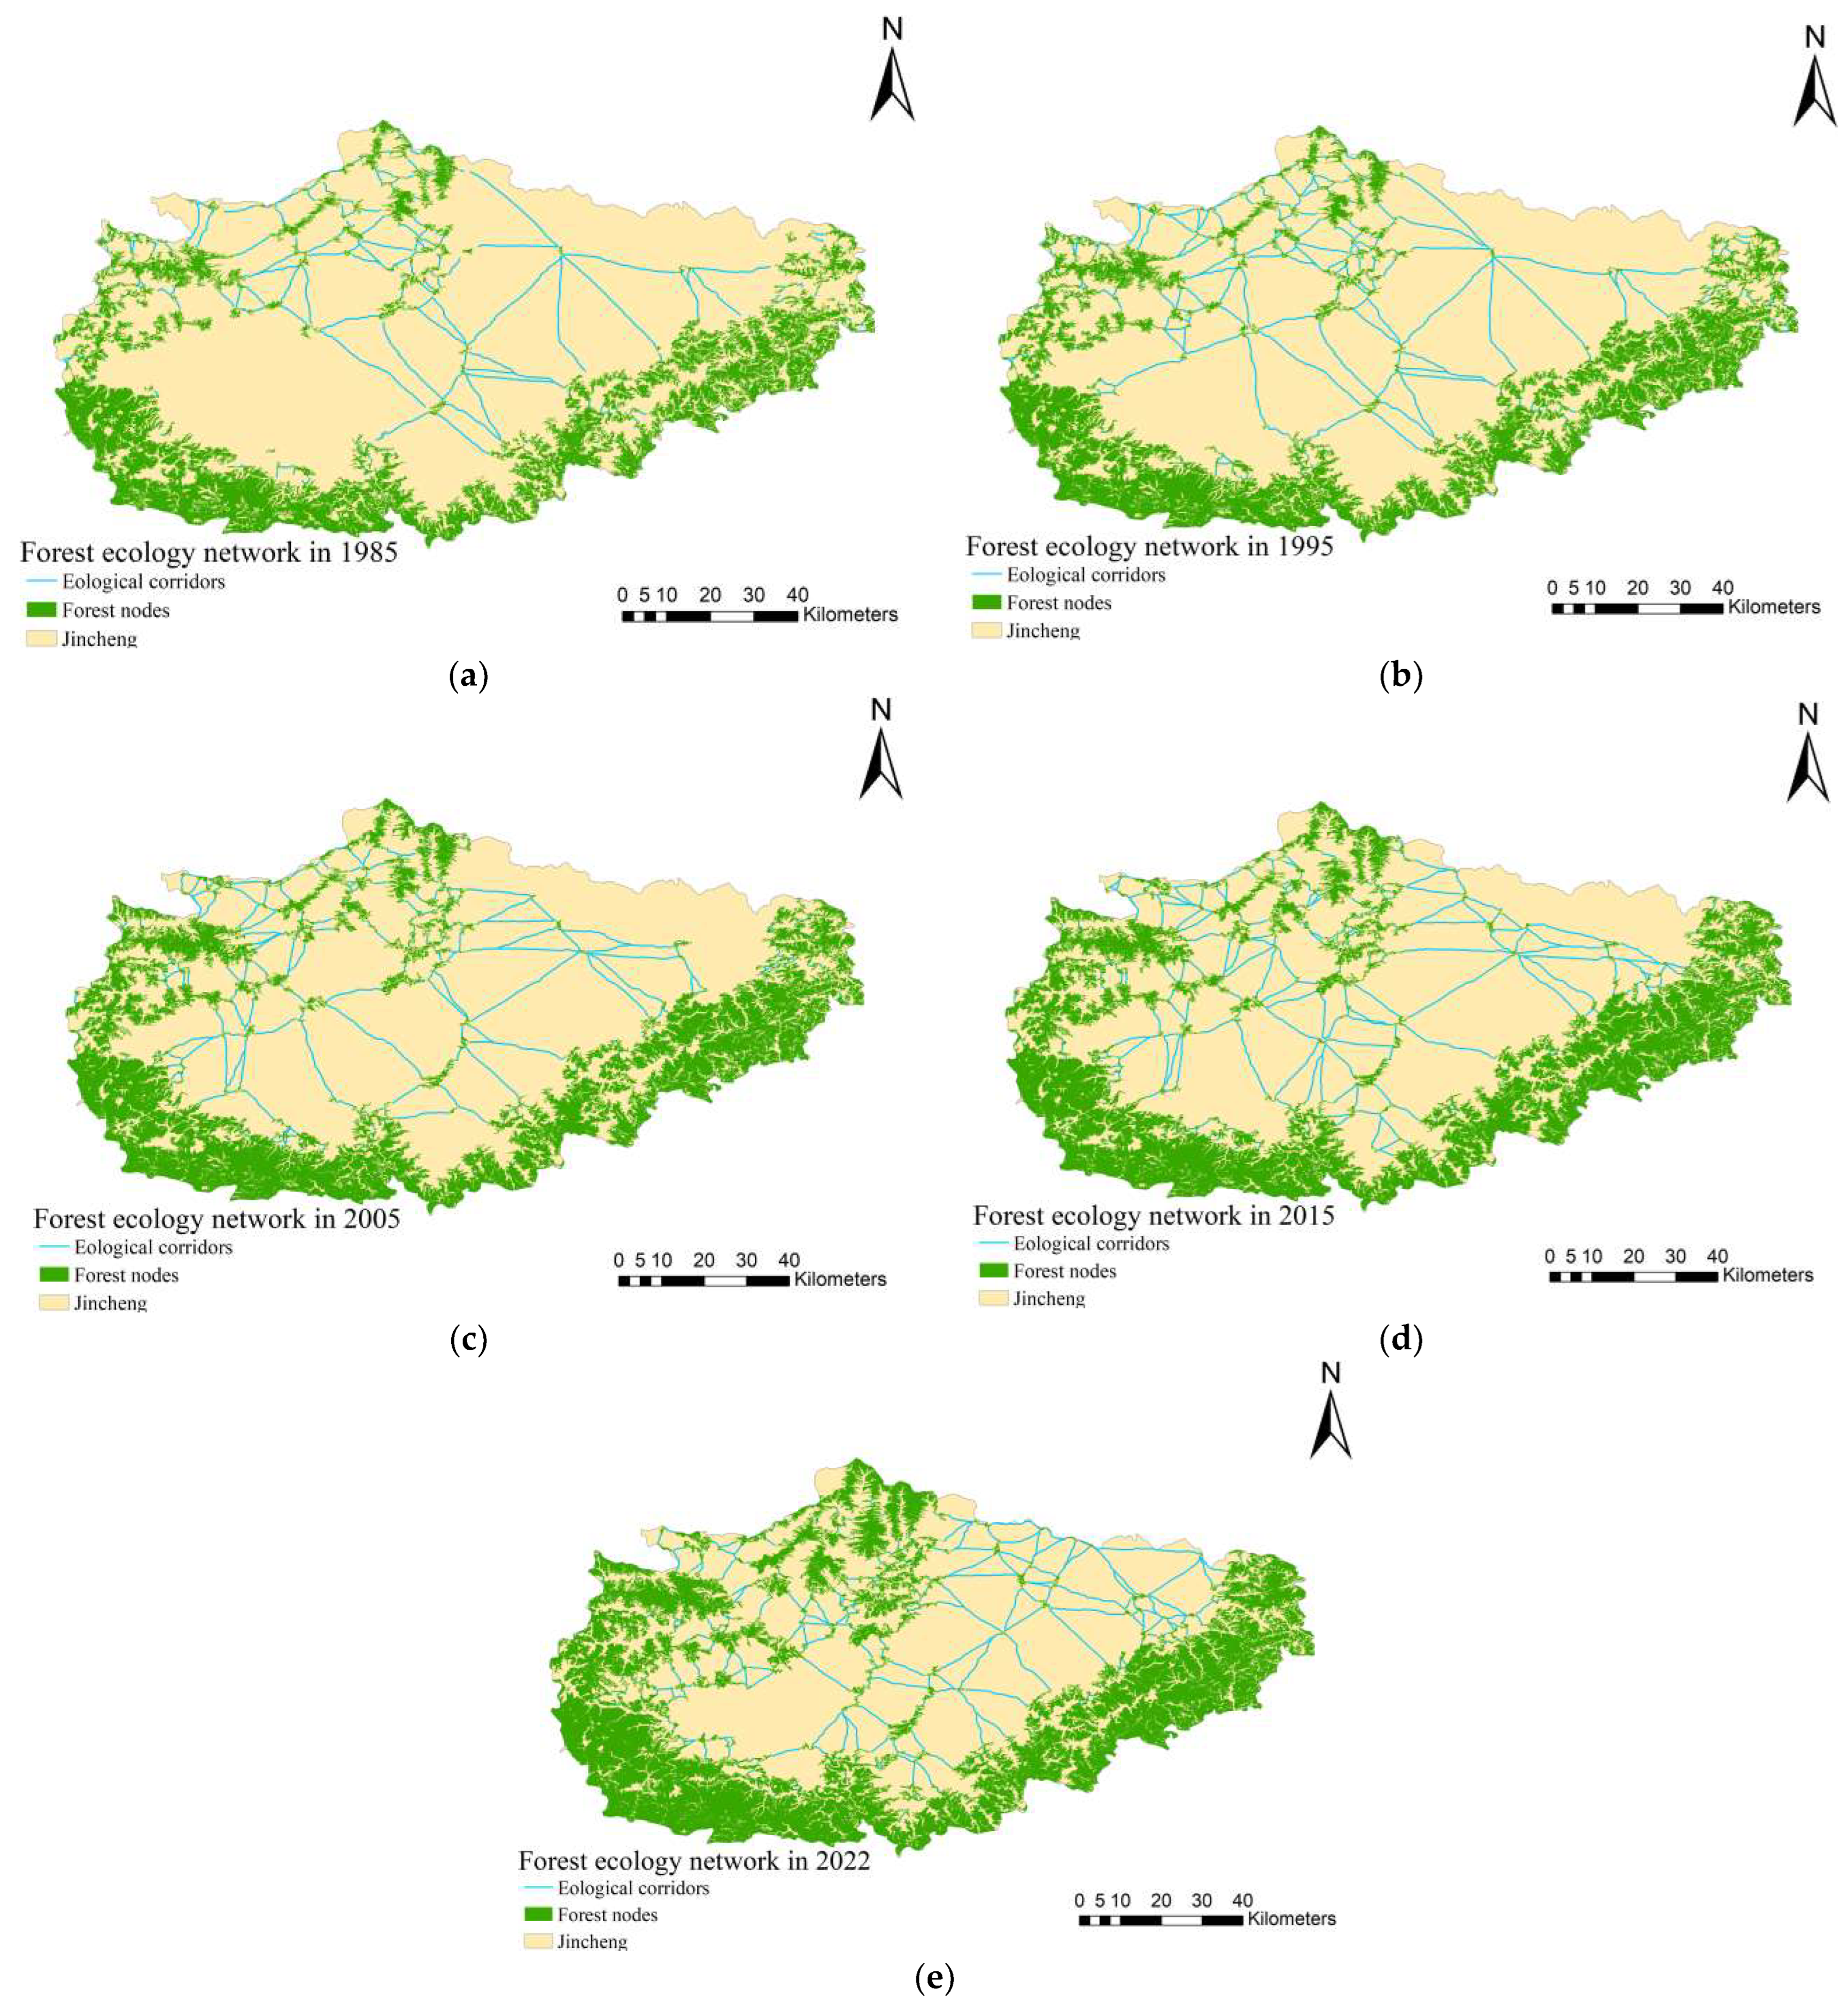
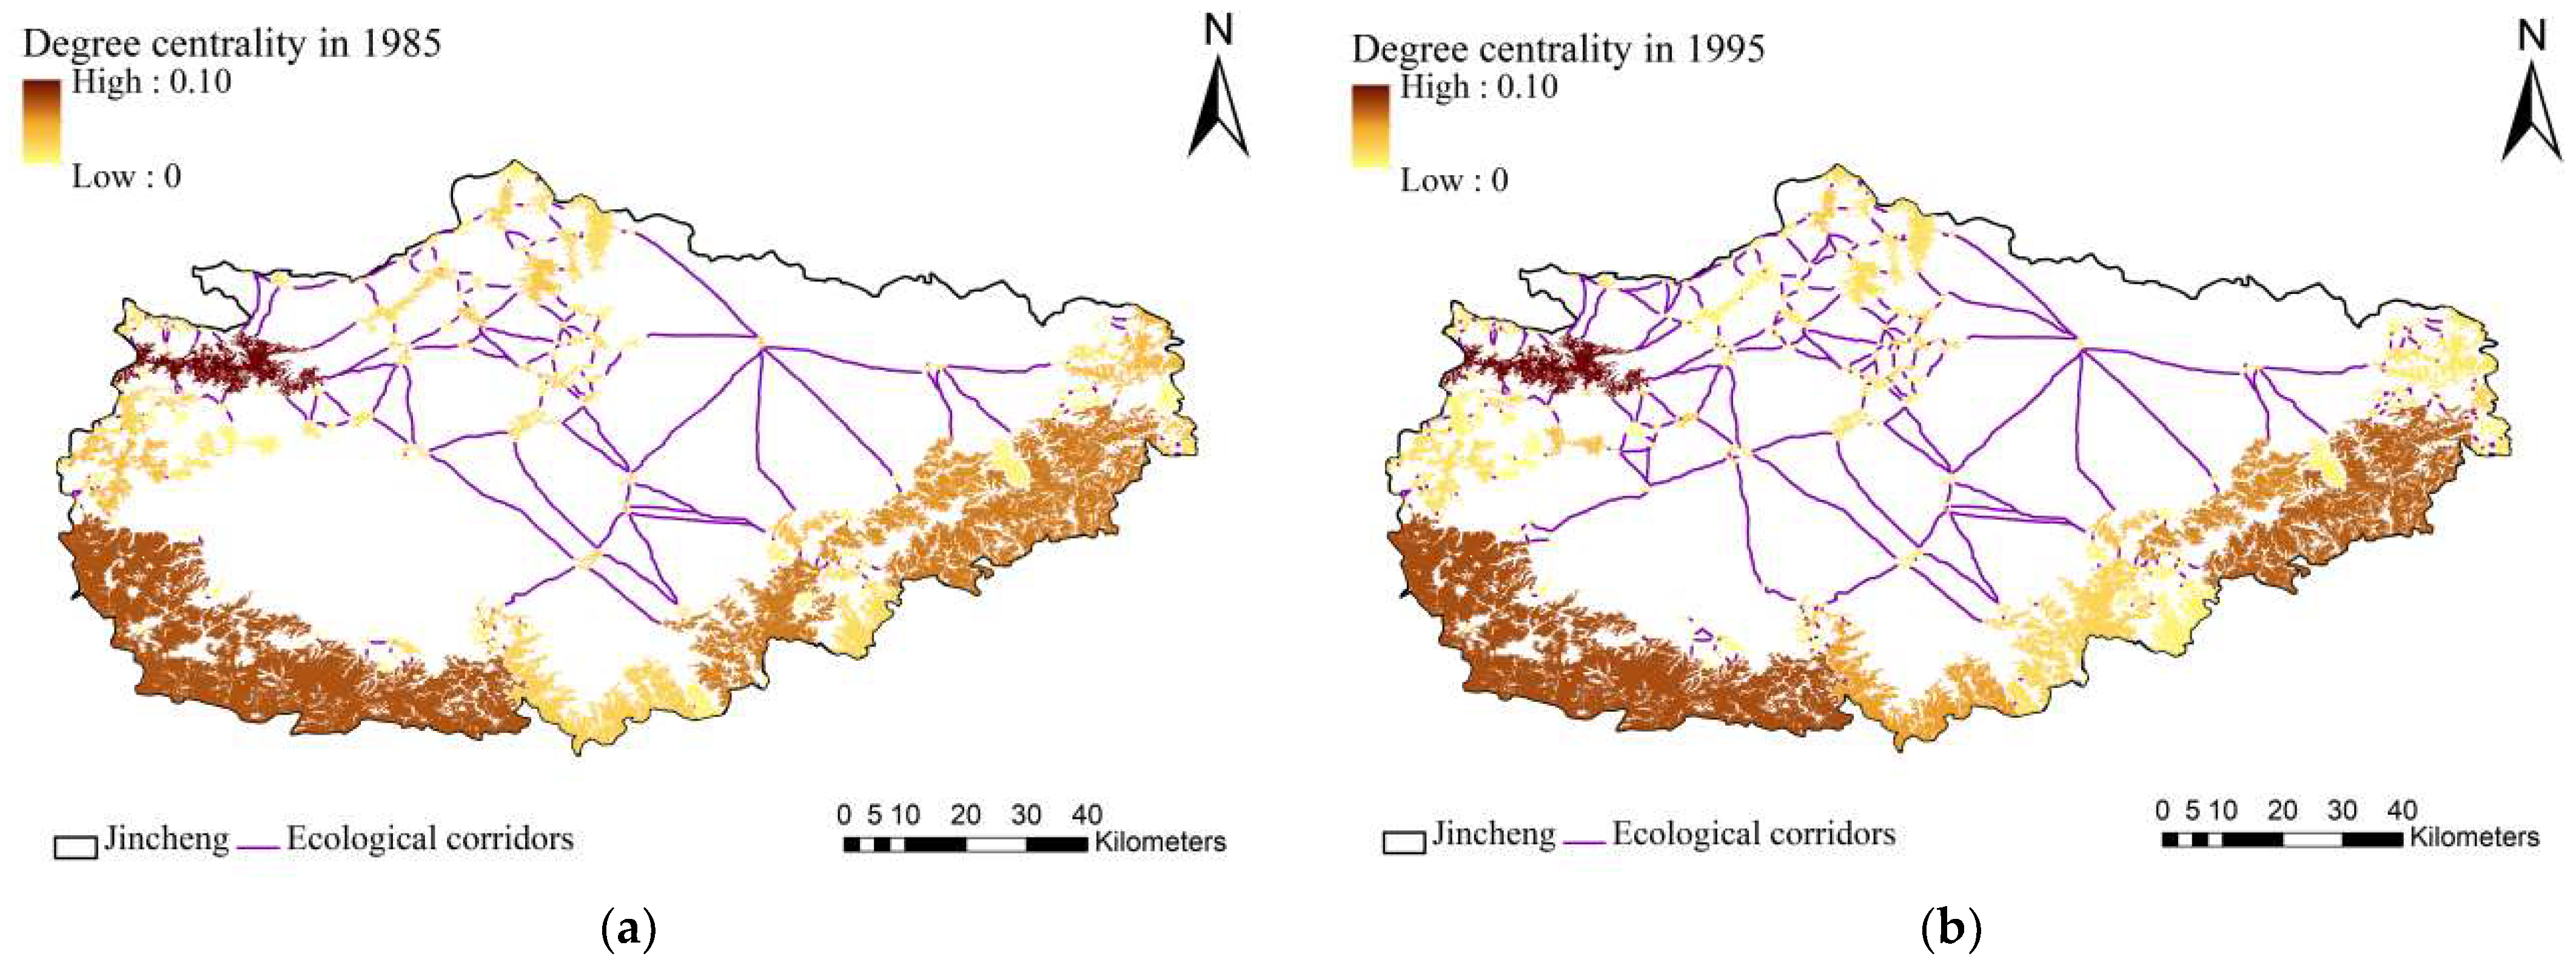

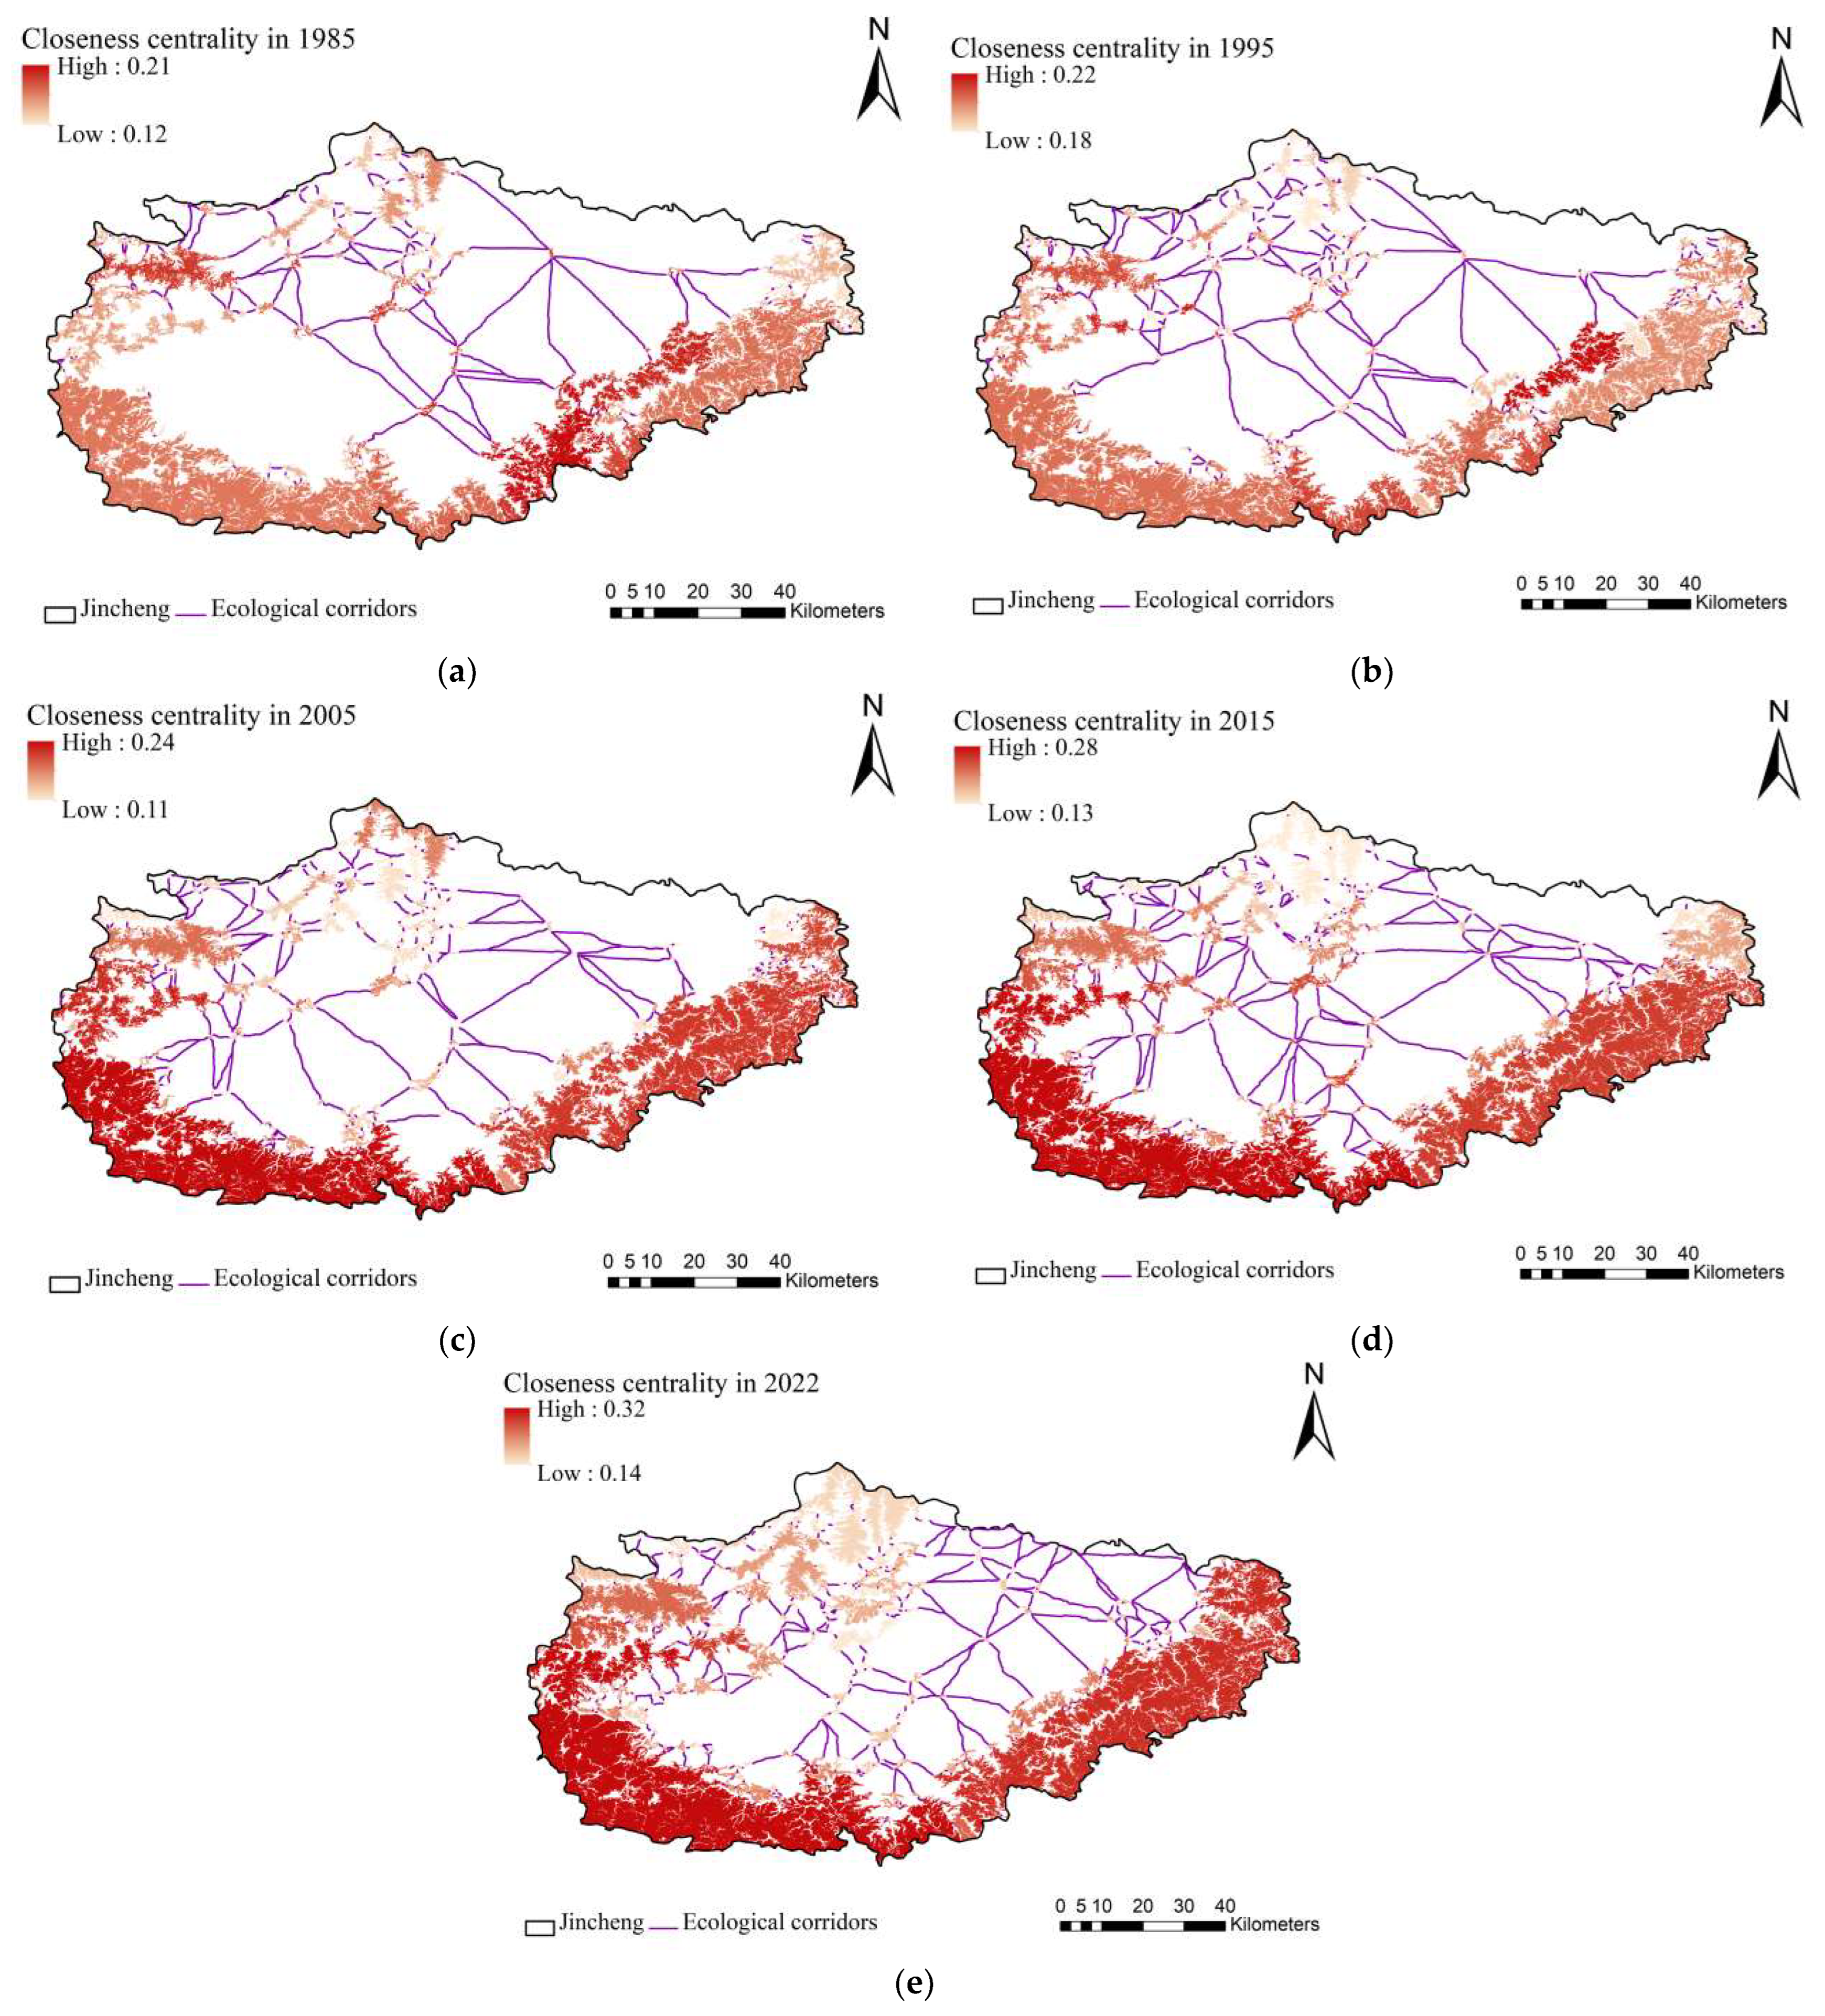


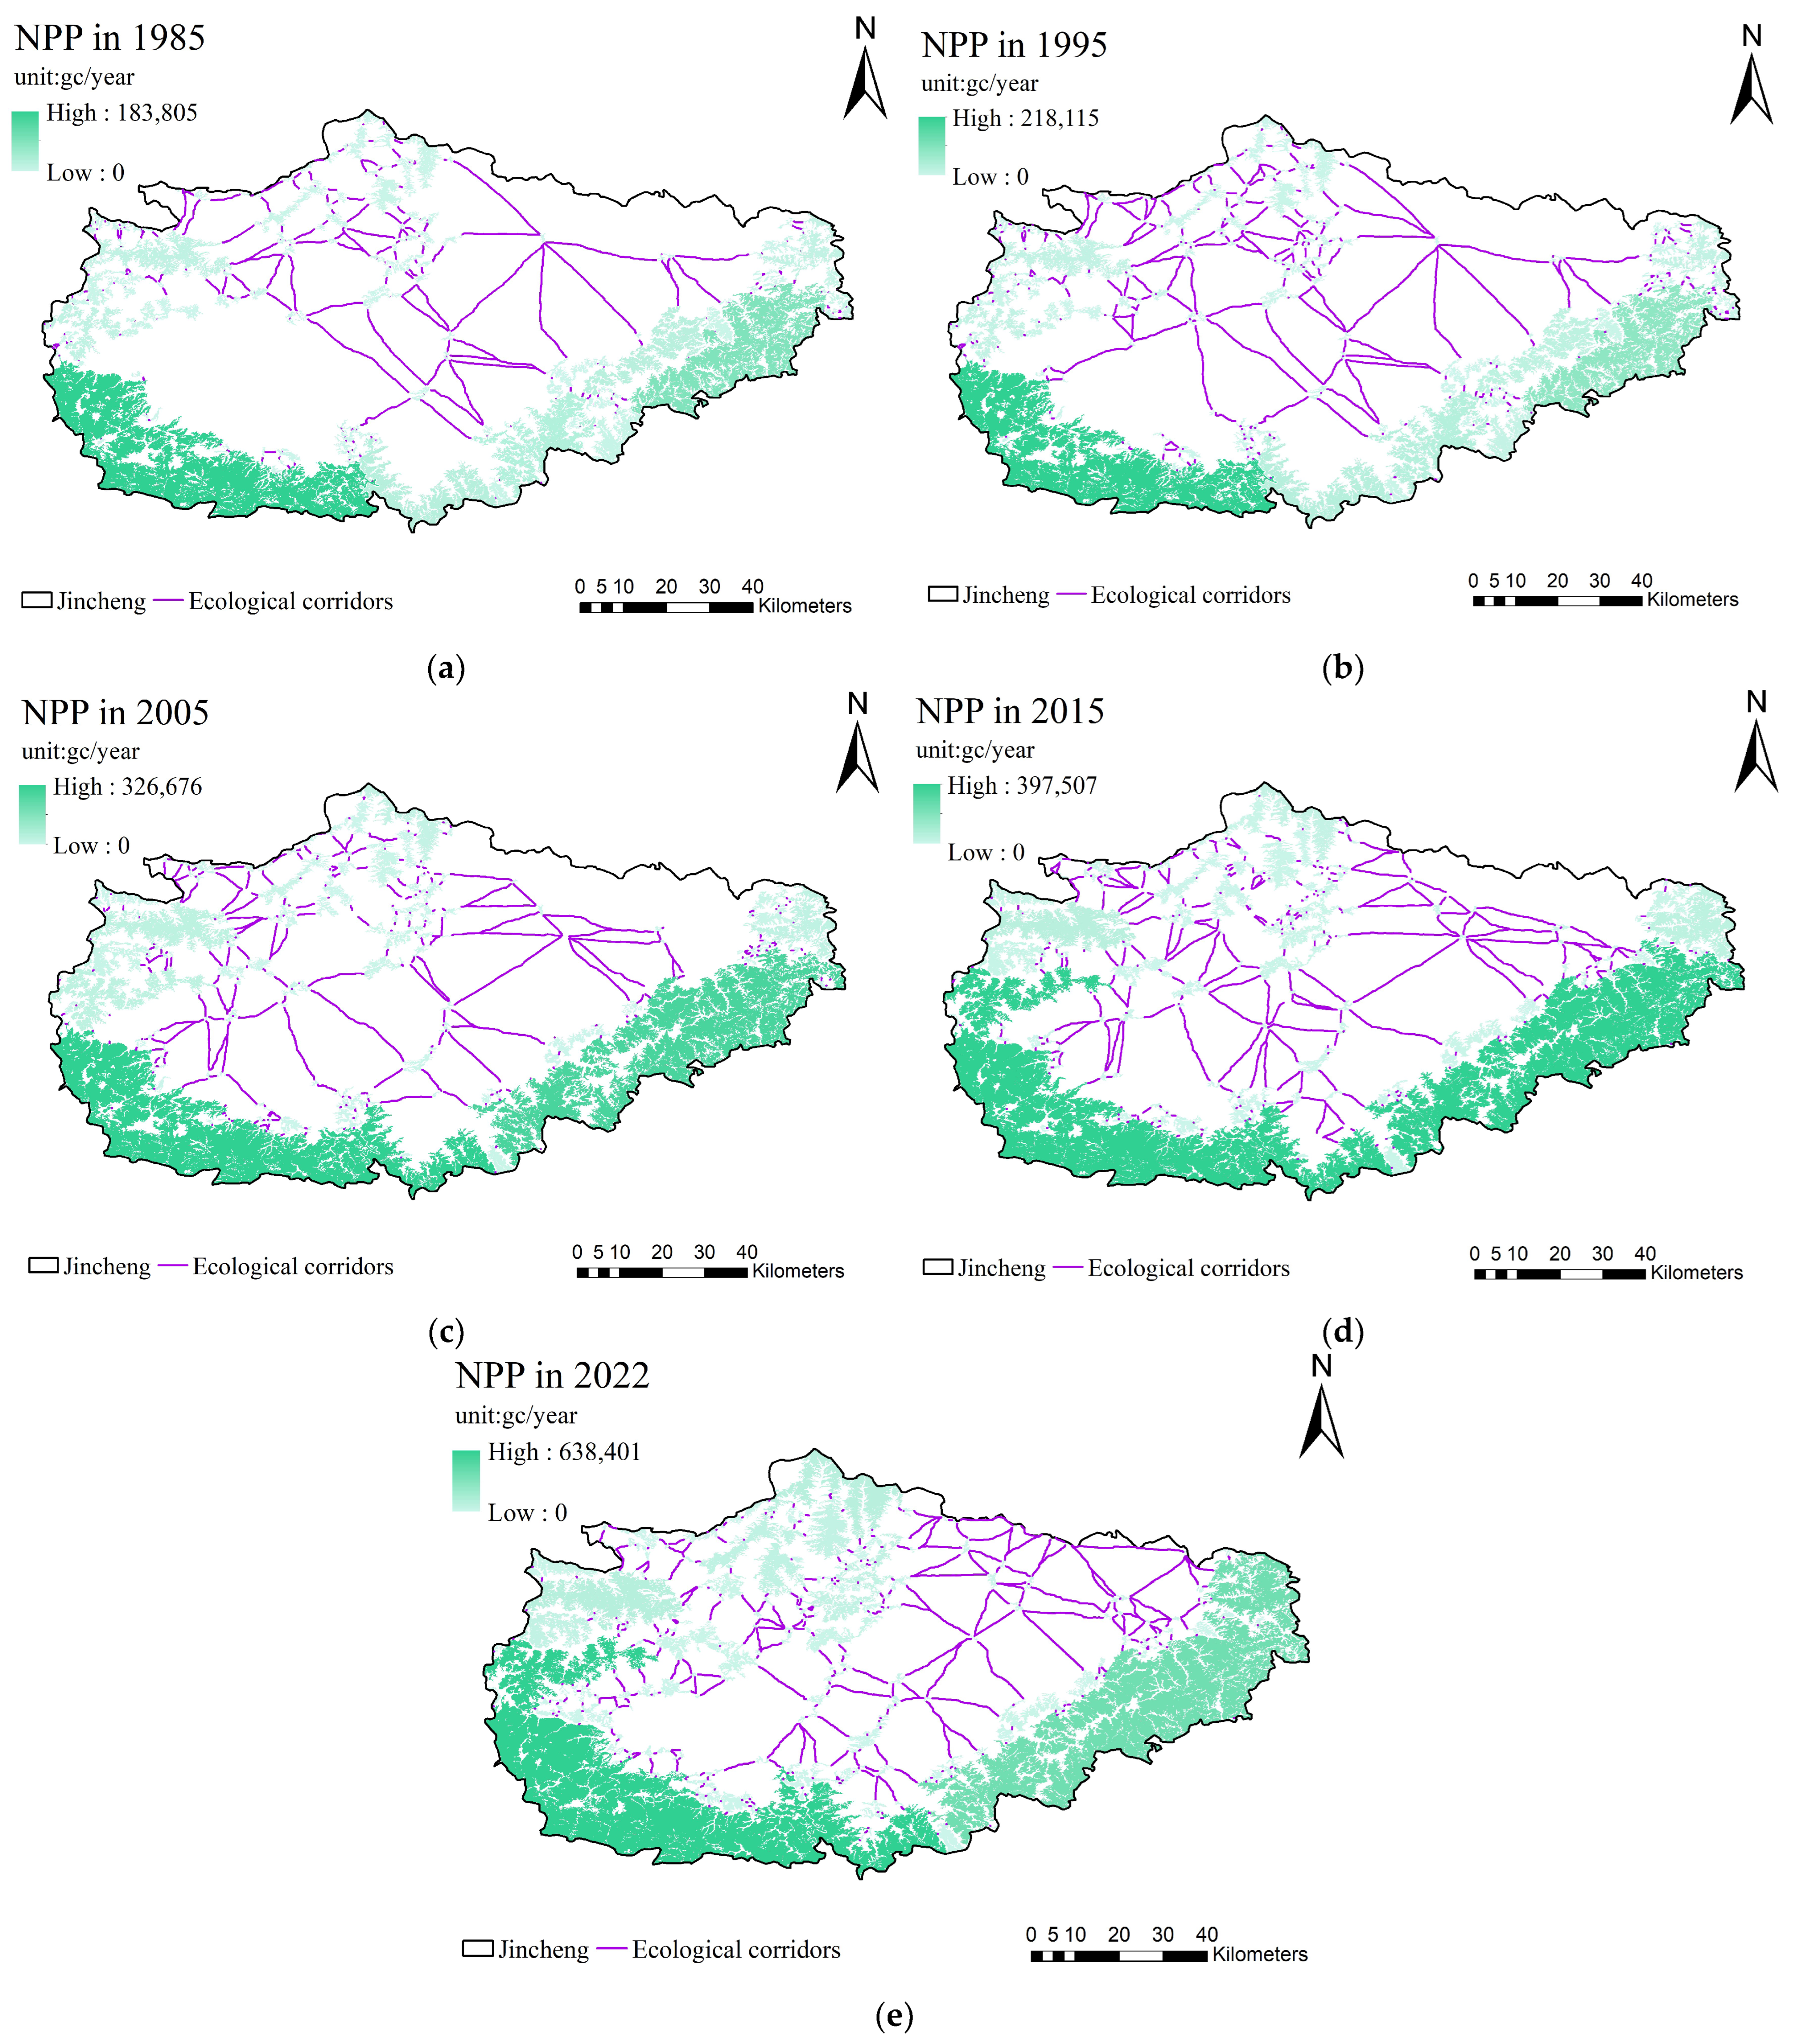
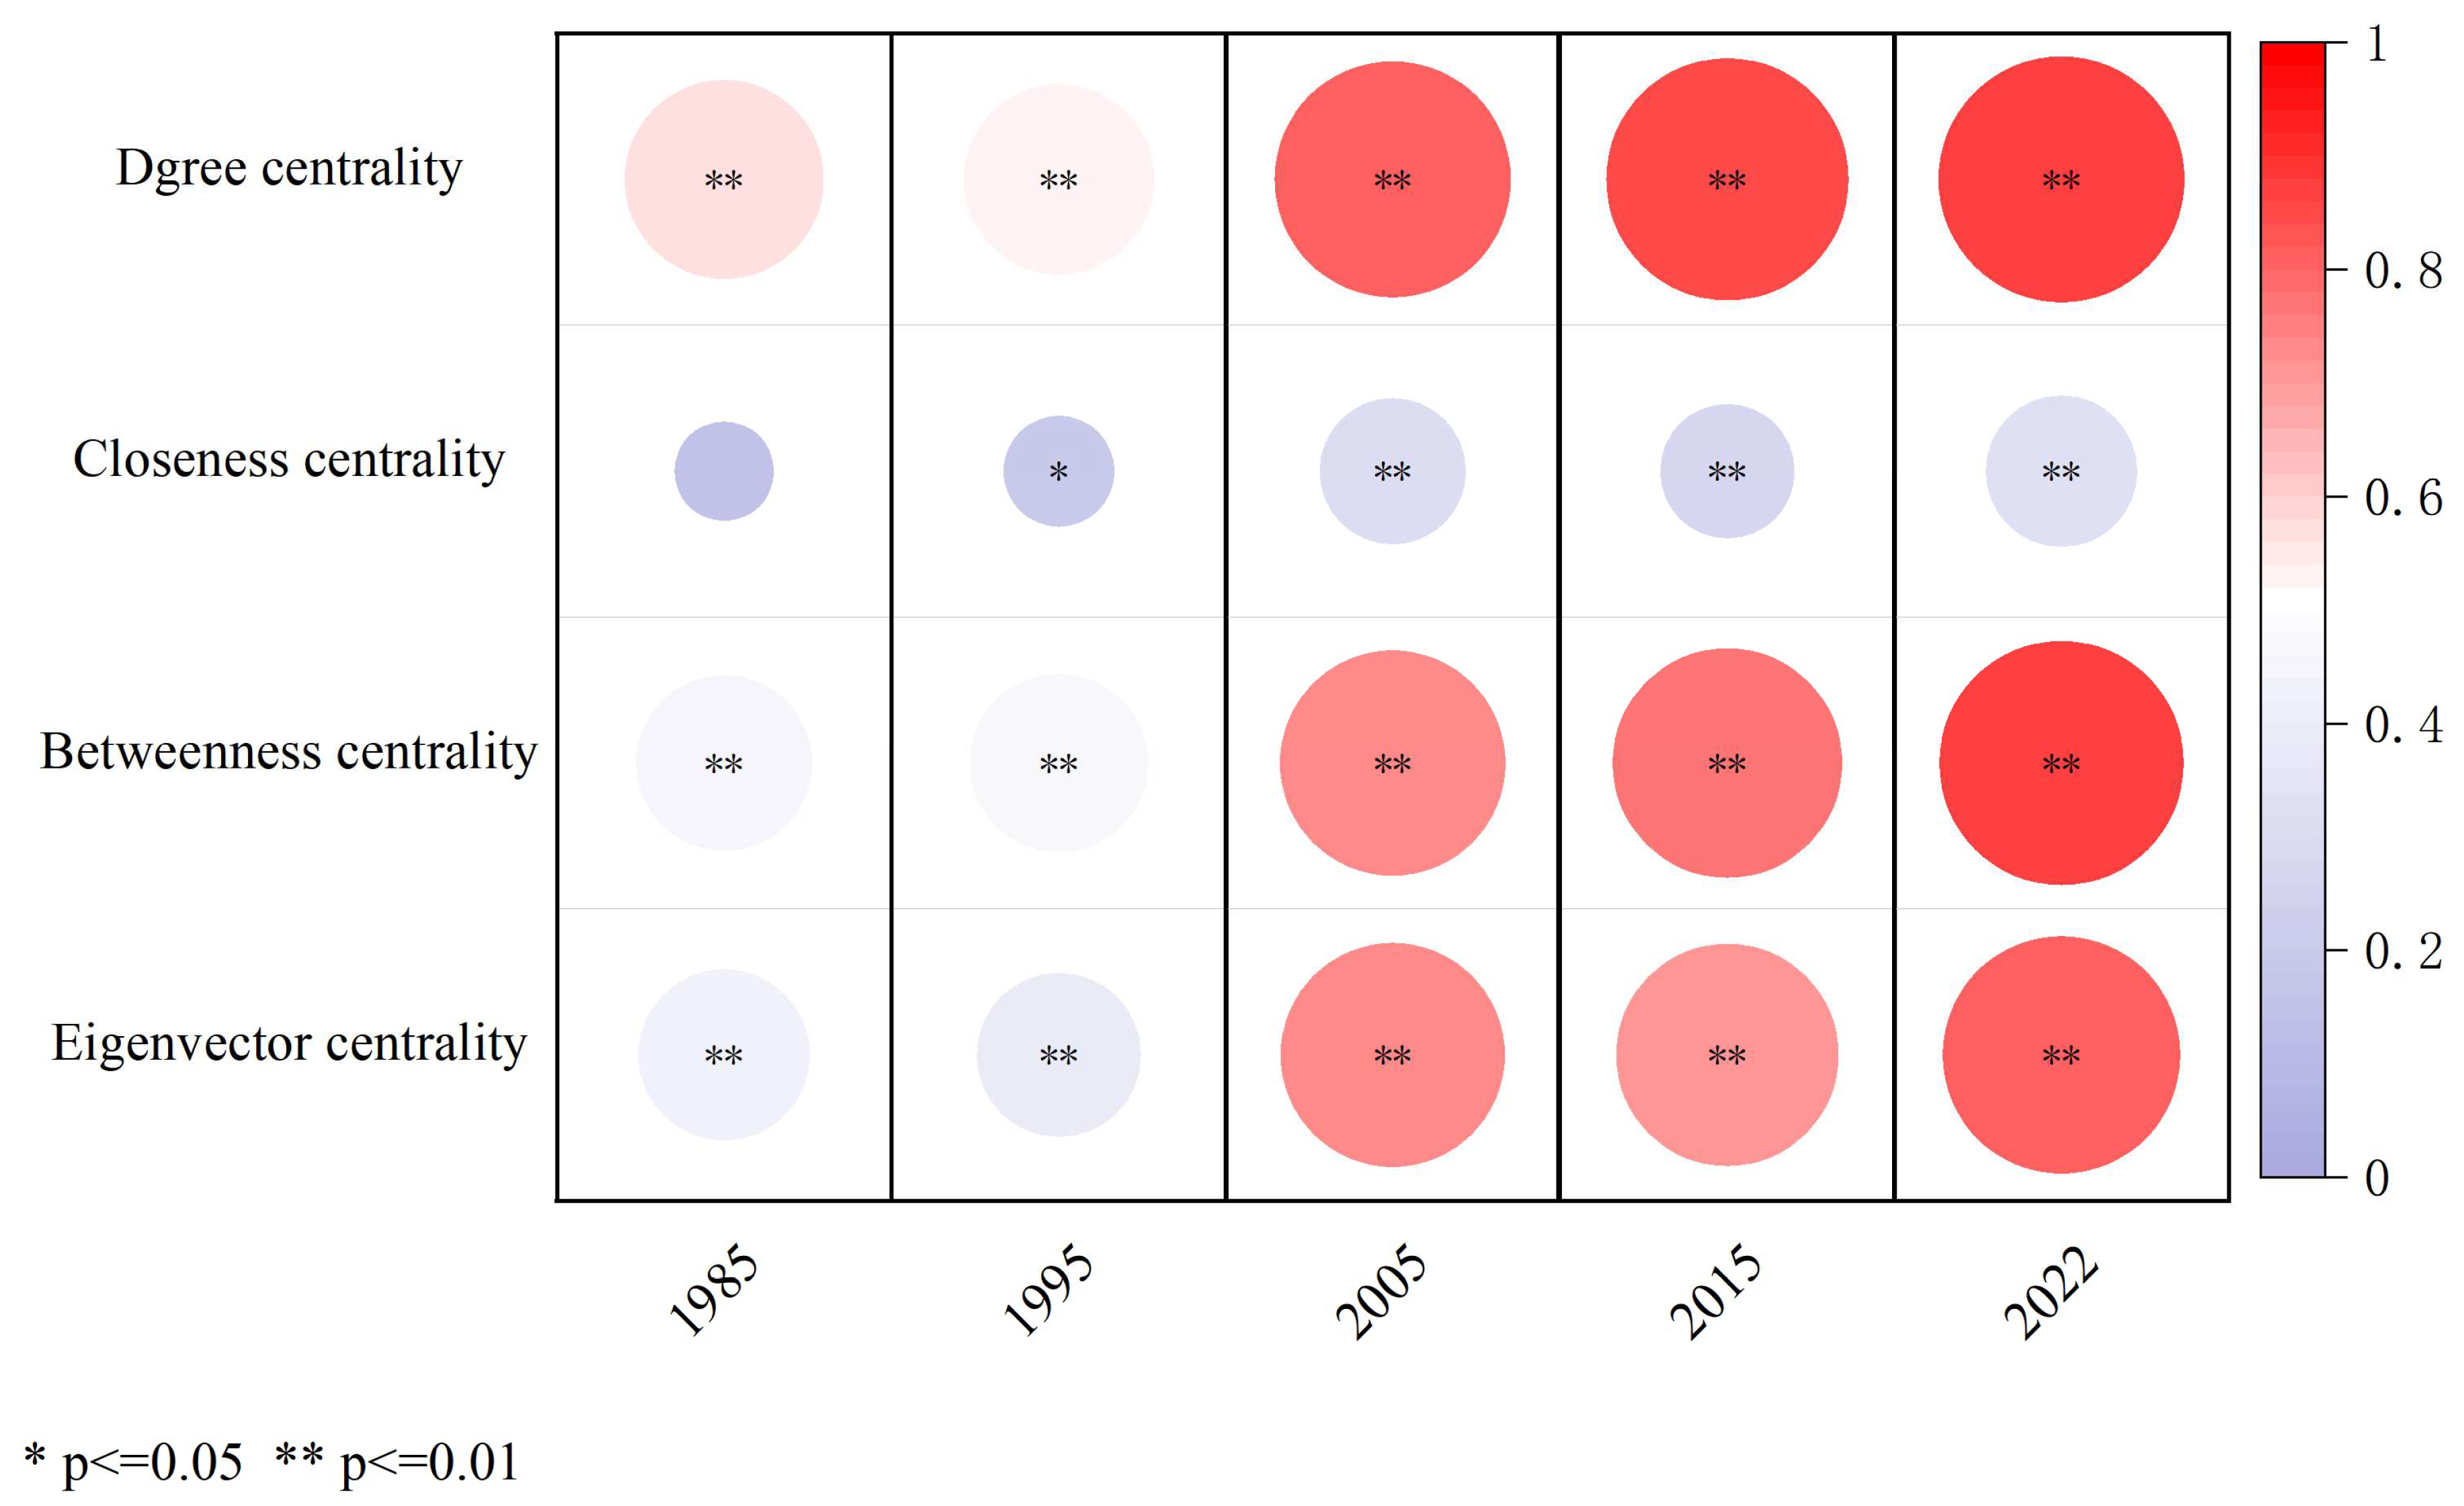
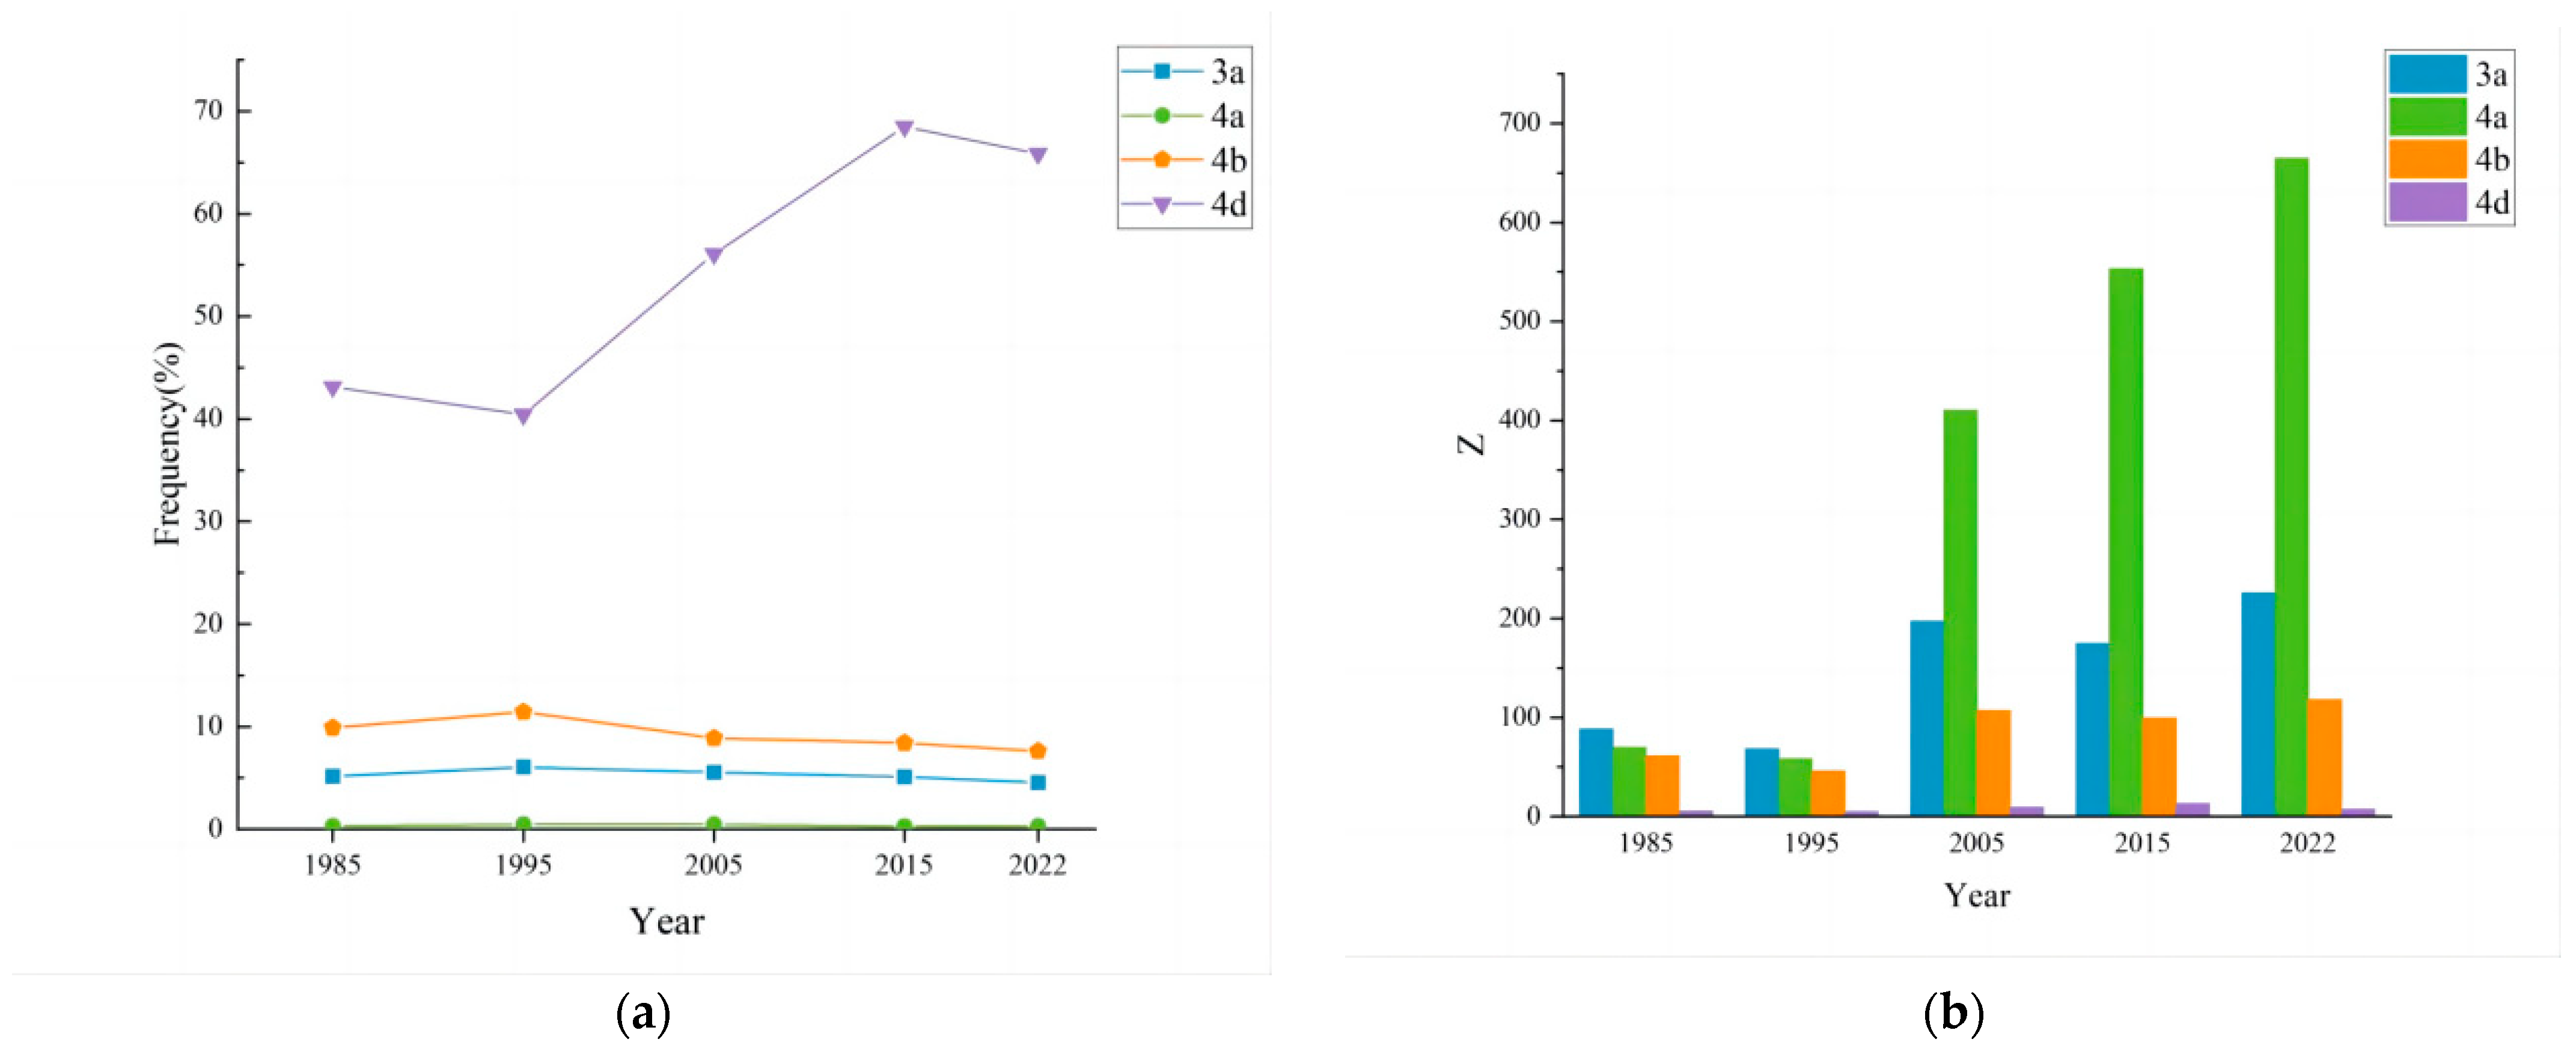

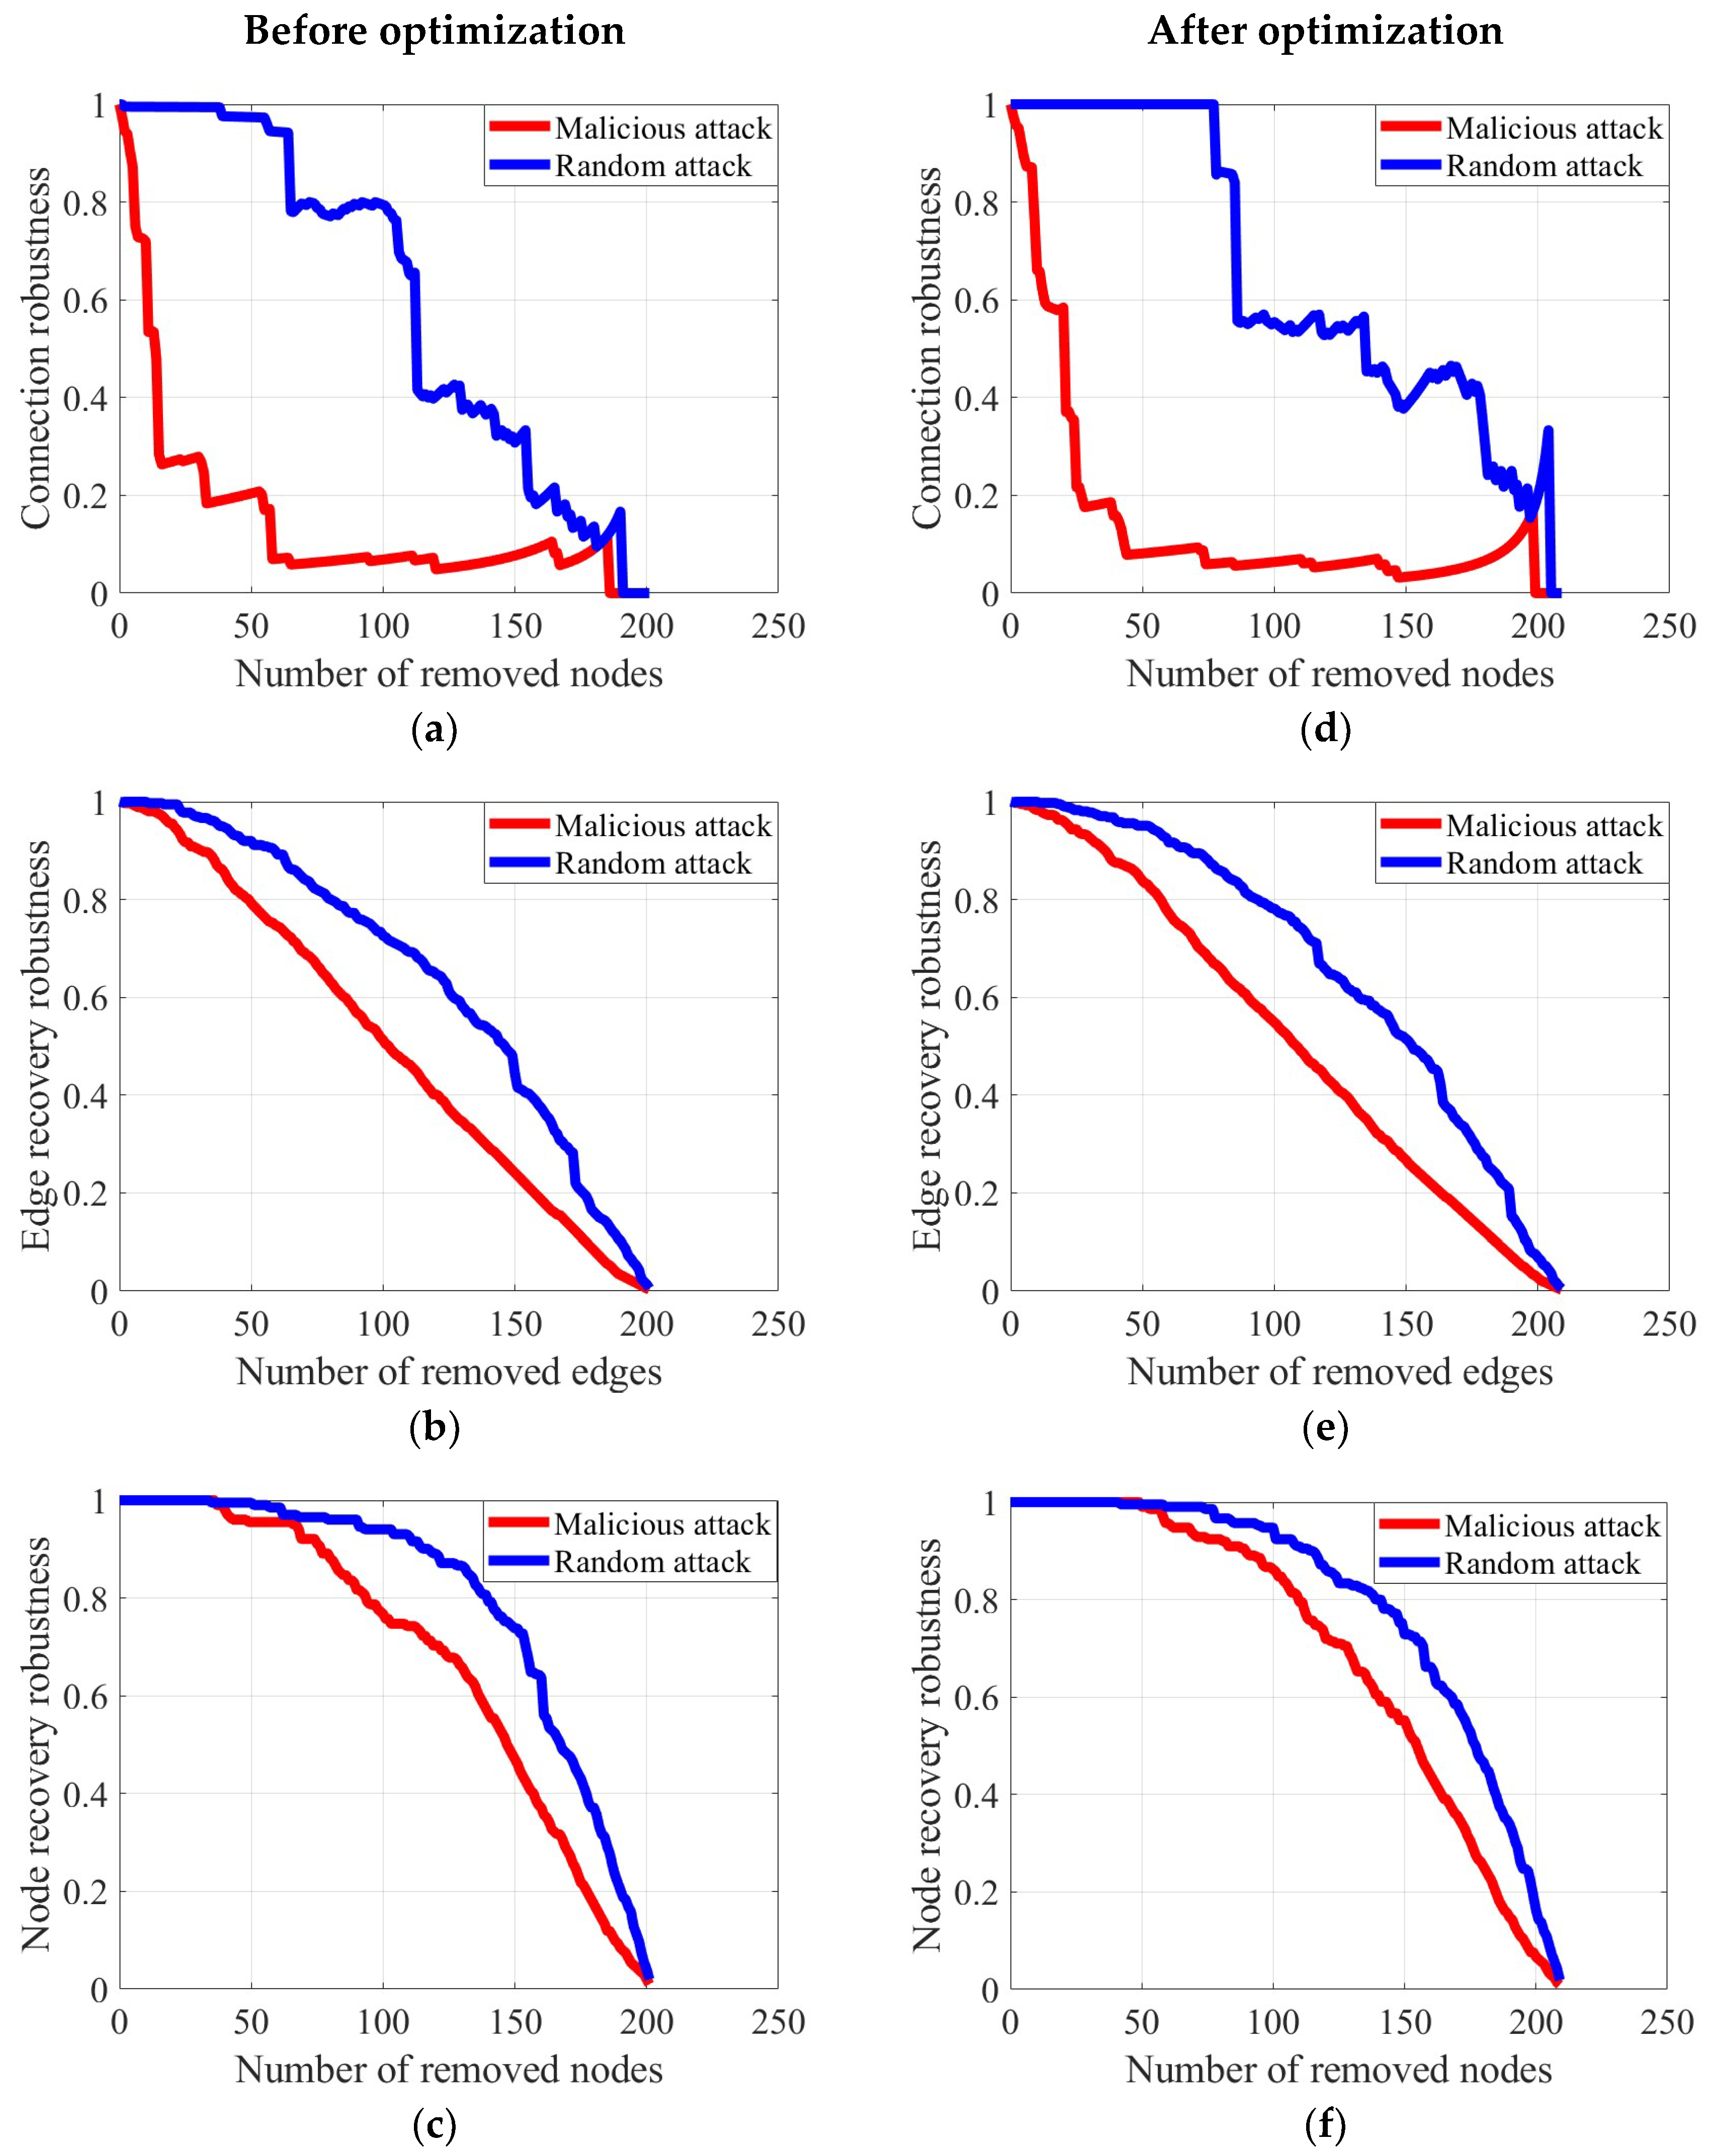


Disclaimer/Publisher’s Note: The statements, opinions and data contained in all publications are solely those of the individual author(s) and contributor(s) and not of MDPI and/or the editor(s). MDPI and/or the editor(s) disclaim responsibility for any injury to people or property resulting from any ideas, methods, instructions or products referred to in the content. |
© 2024 by the authors. Licensee MDPI, Basel, Switzerland. This article is an open access article distributed under the terms and conditions of the Creative Commons Attribution (CC BY) license (https://creativecommons.org/licenses/by/4.0/).