
Application of Multi-Temporal and Multisource Satellite Imagery in the Study of Irrigated Landscapes in Arid Climates


Abstract
:1. Introduction
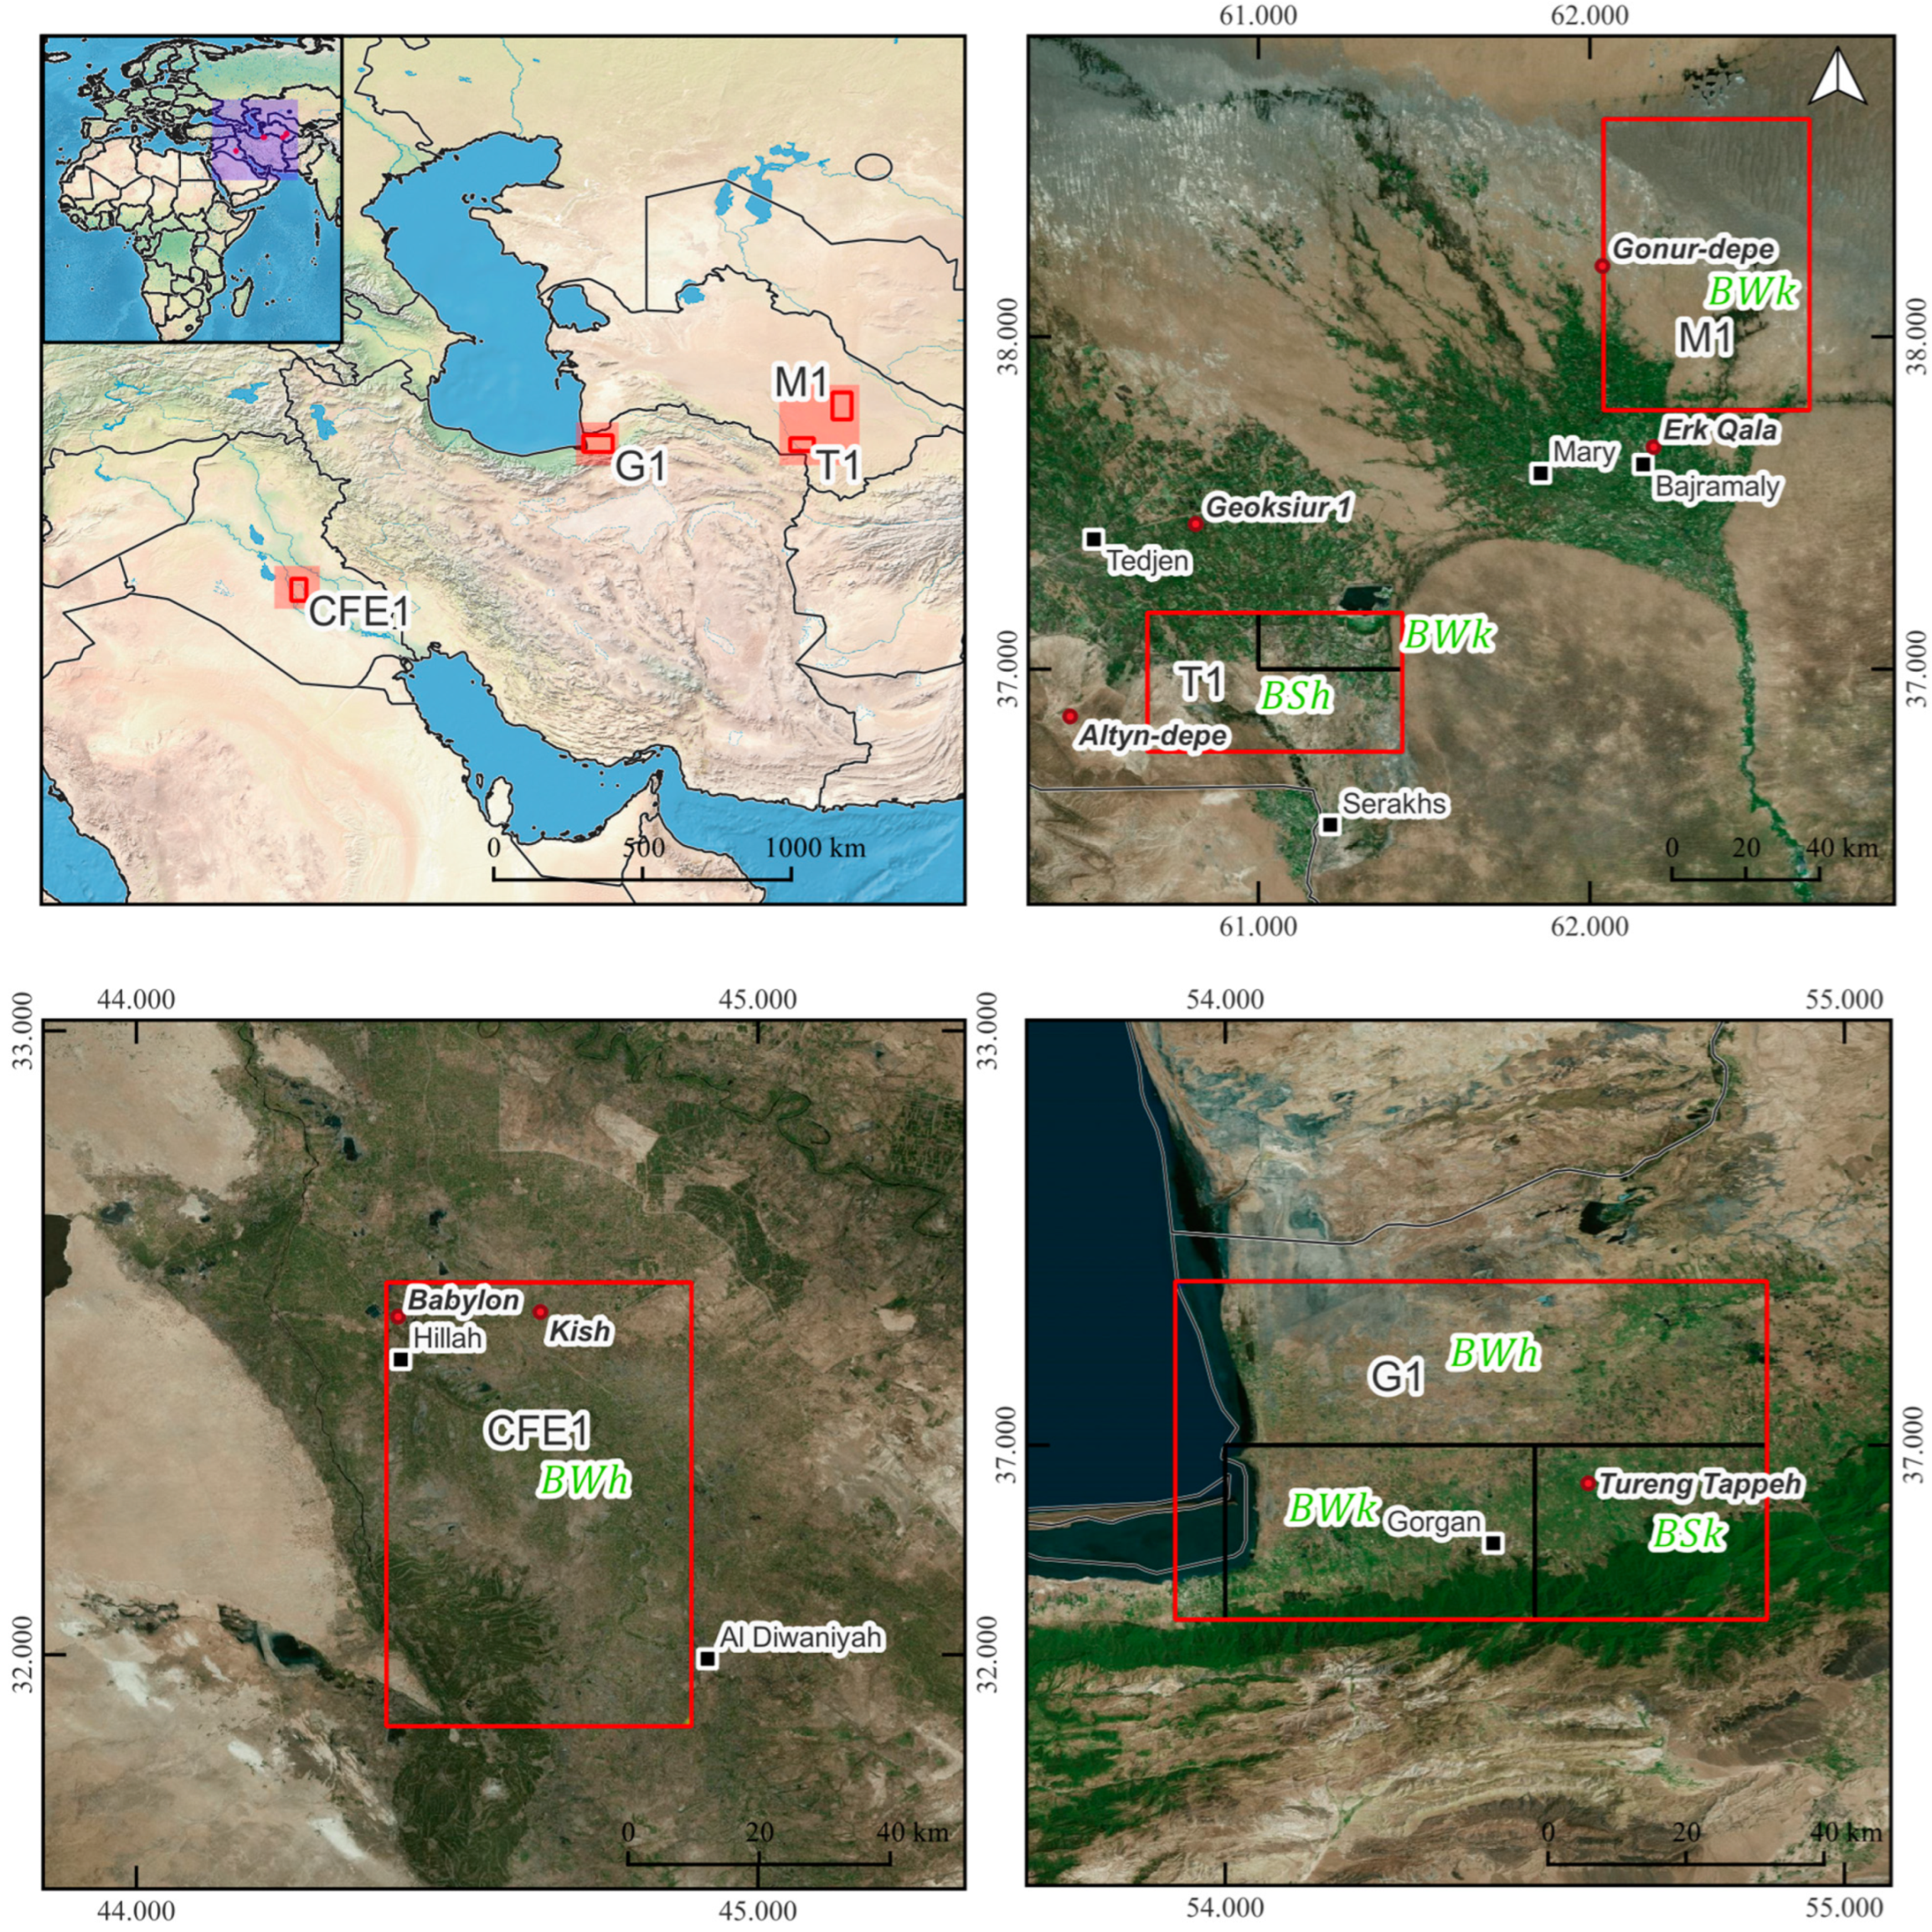
1.1. Research Areas
1.1.1. Central Floodplain of Euphrates (CFE1)
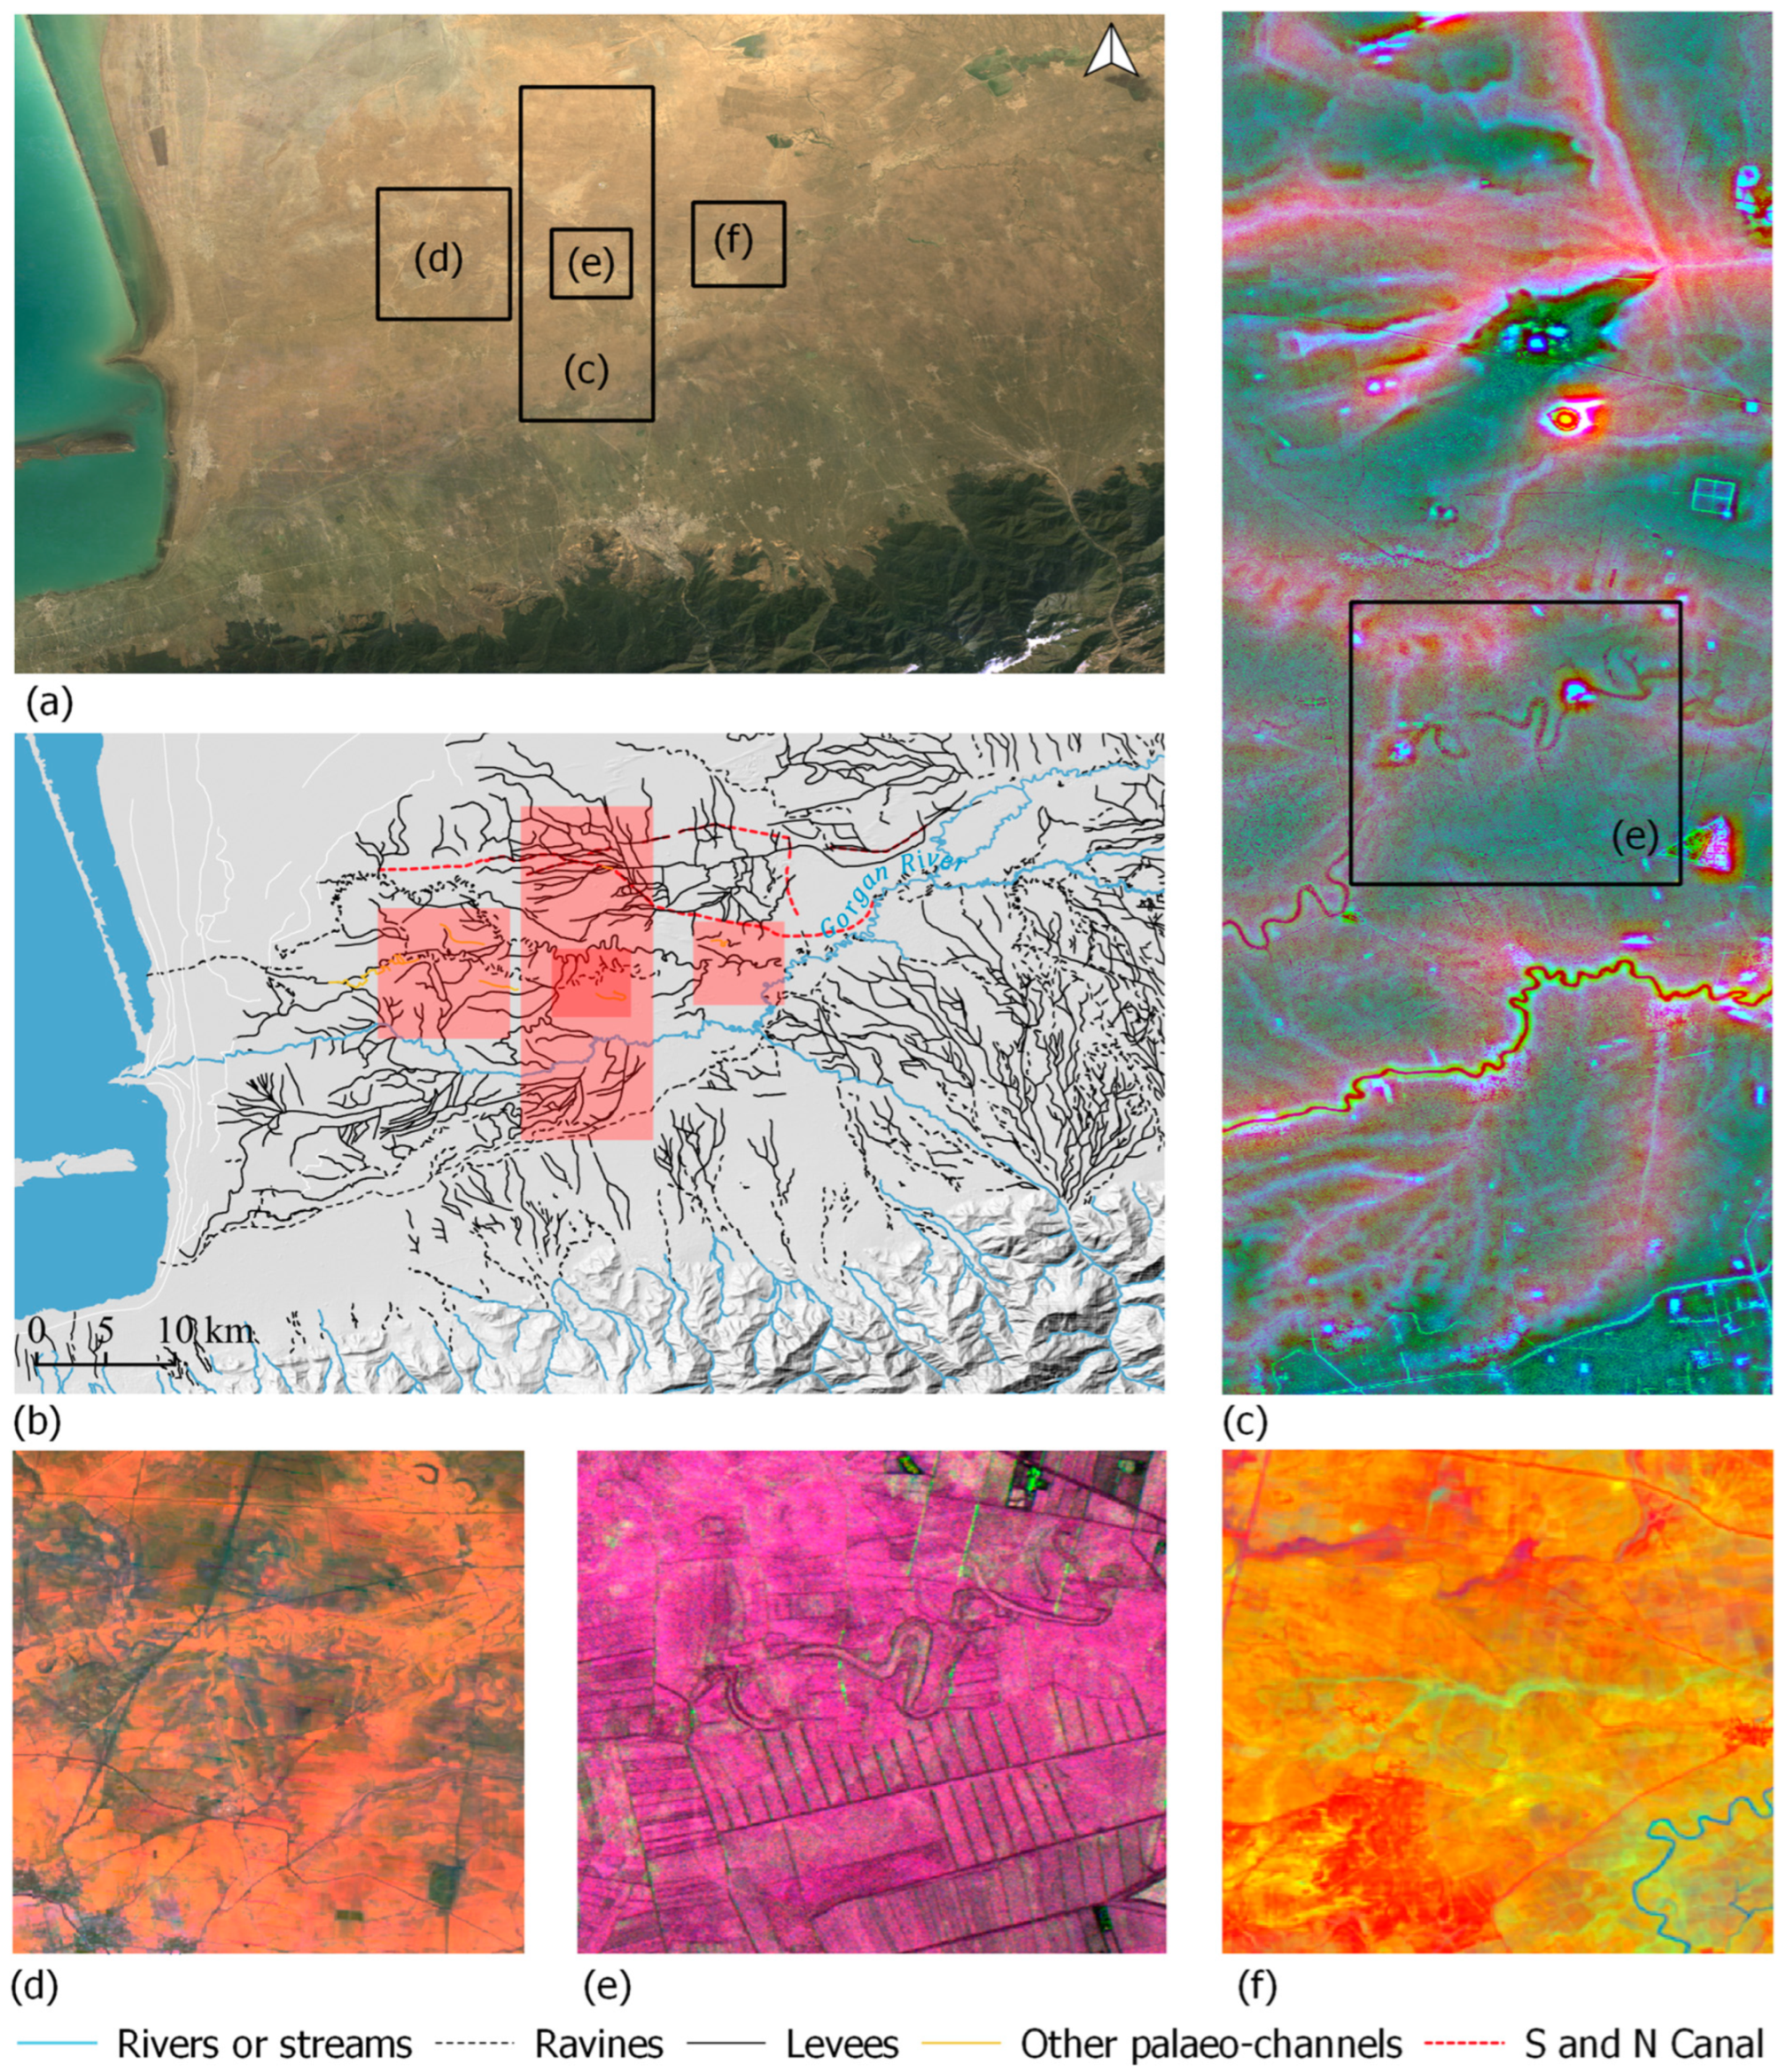
1.1.2. Gorgan Plain
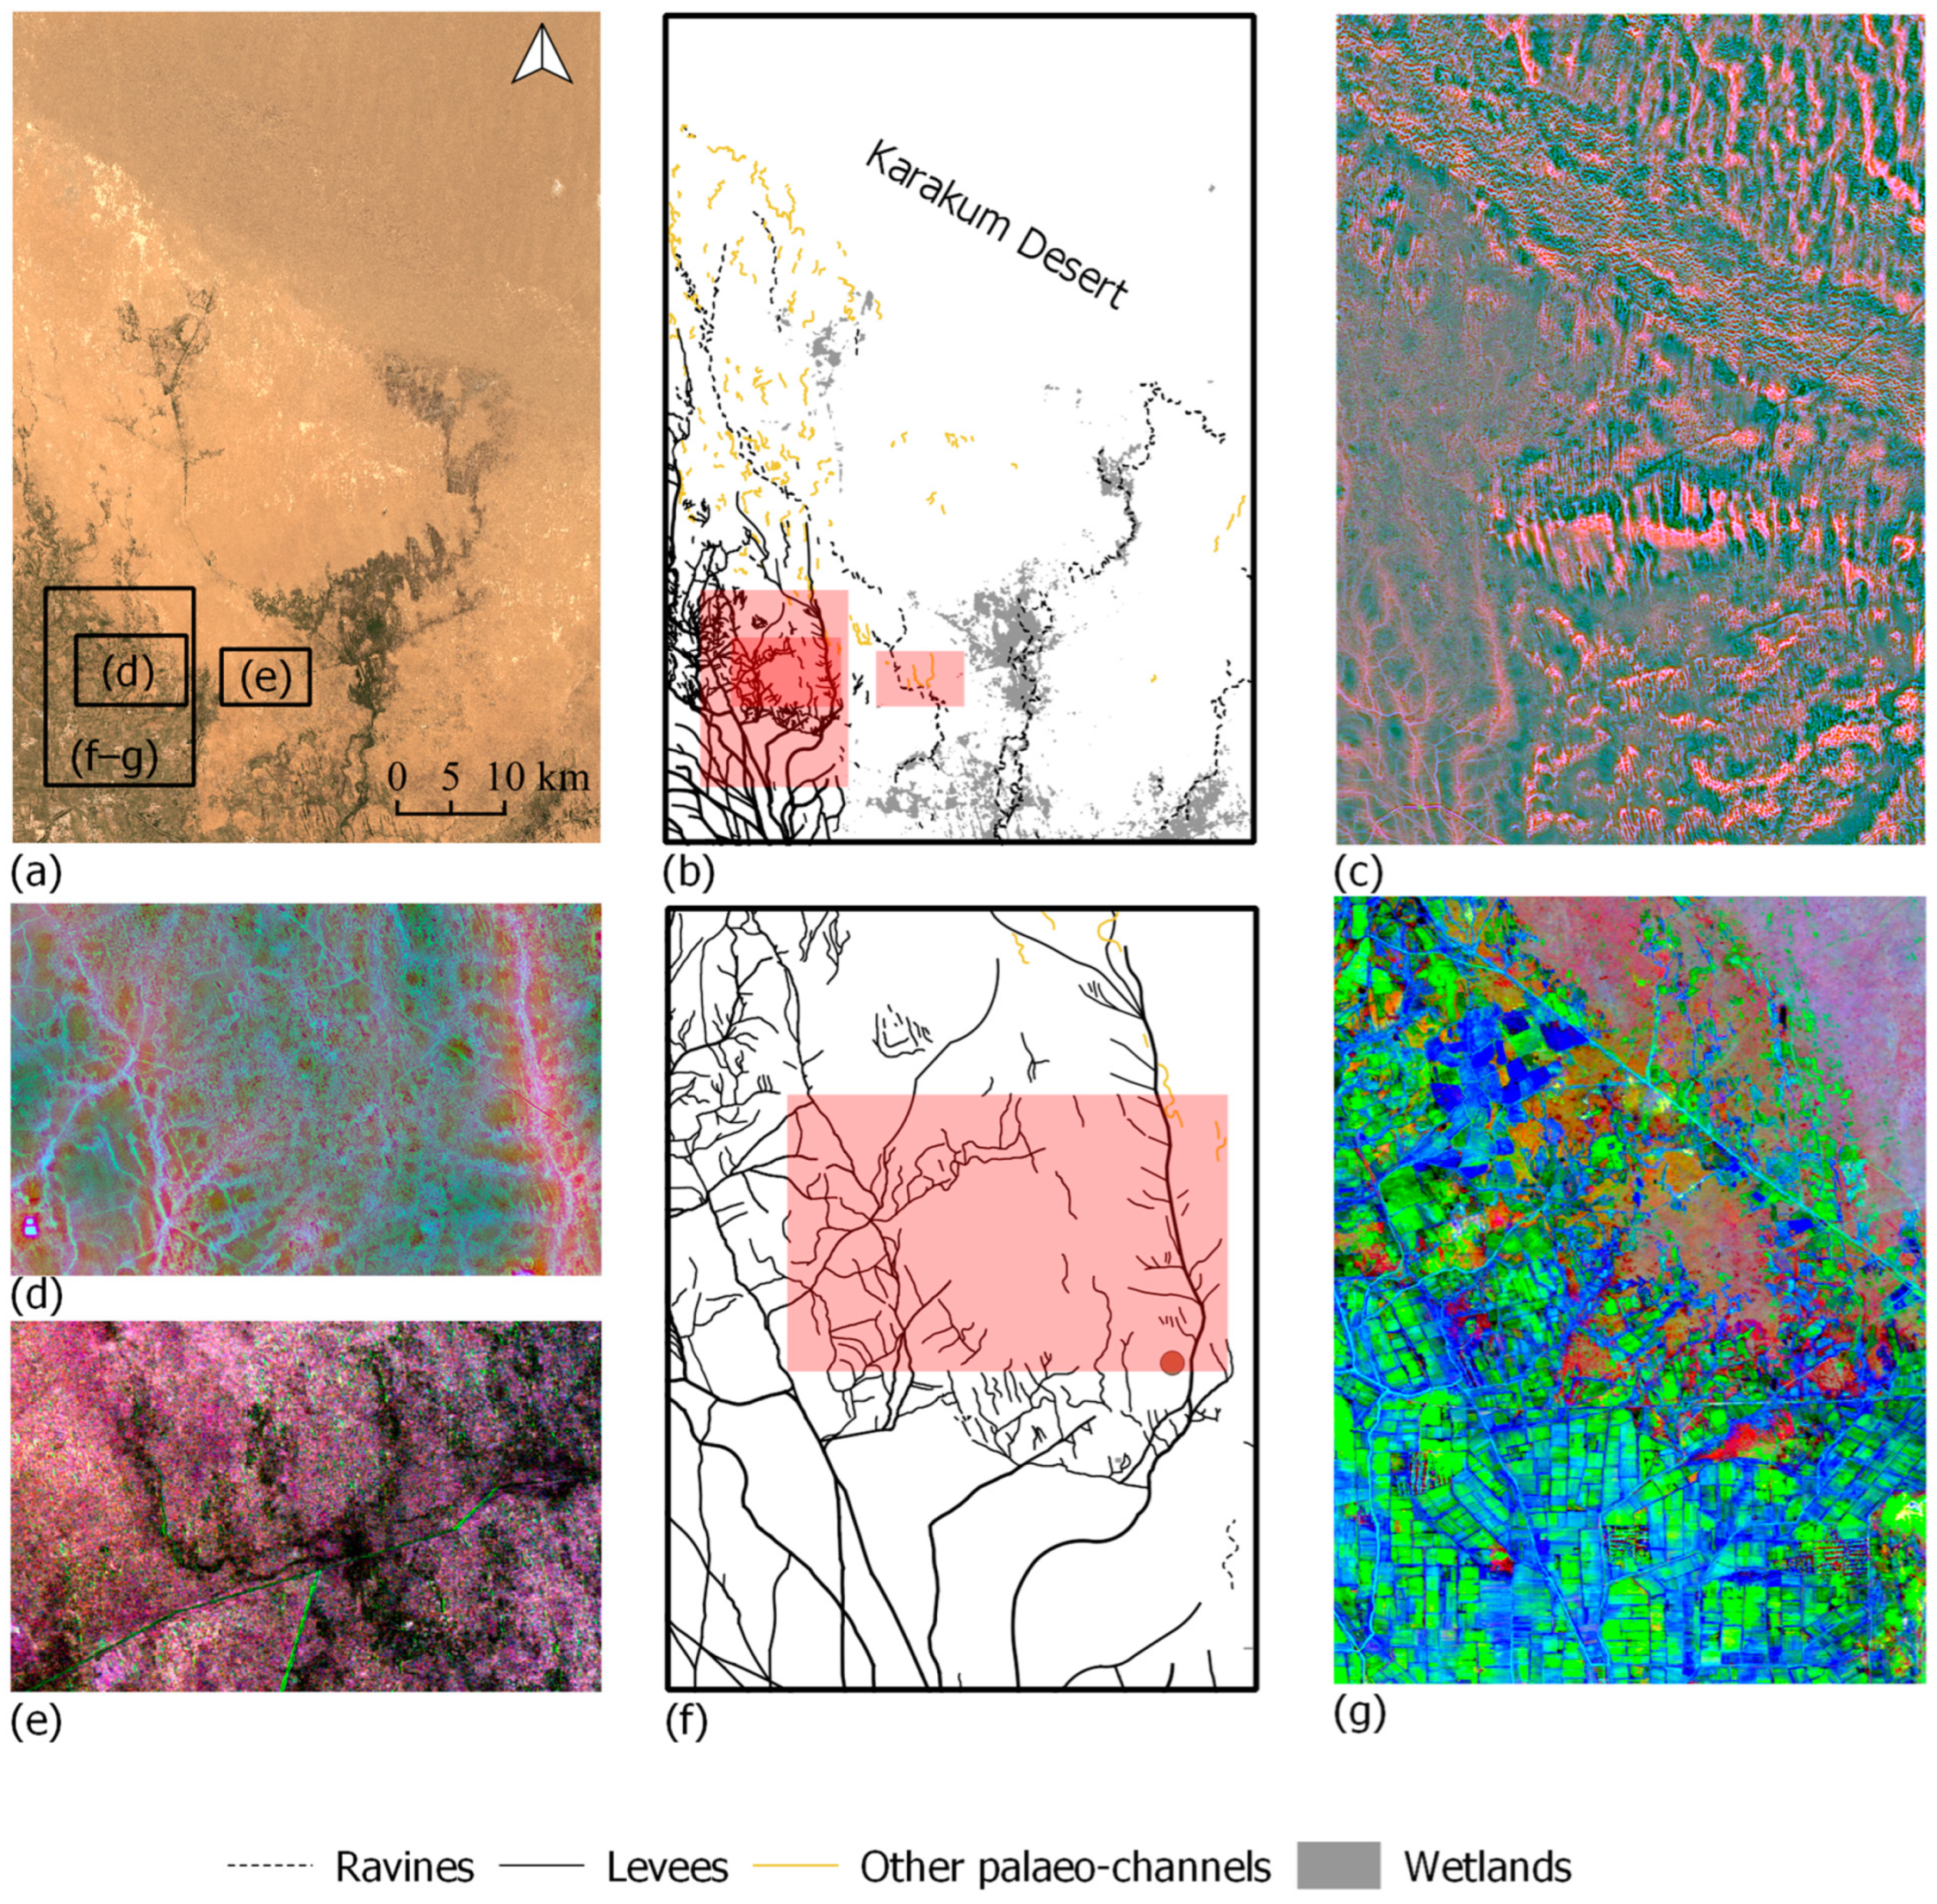
1.1.3. Murghab Fan
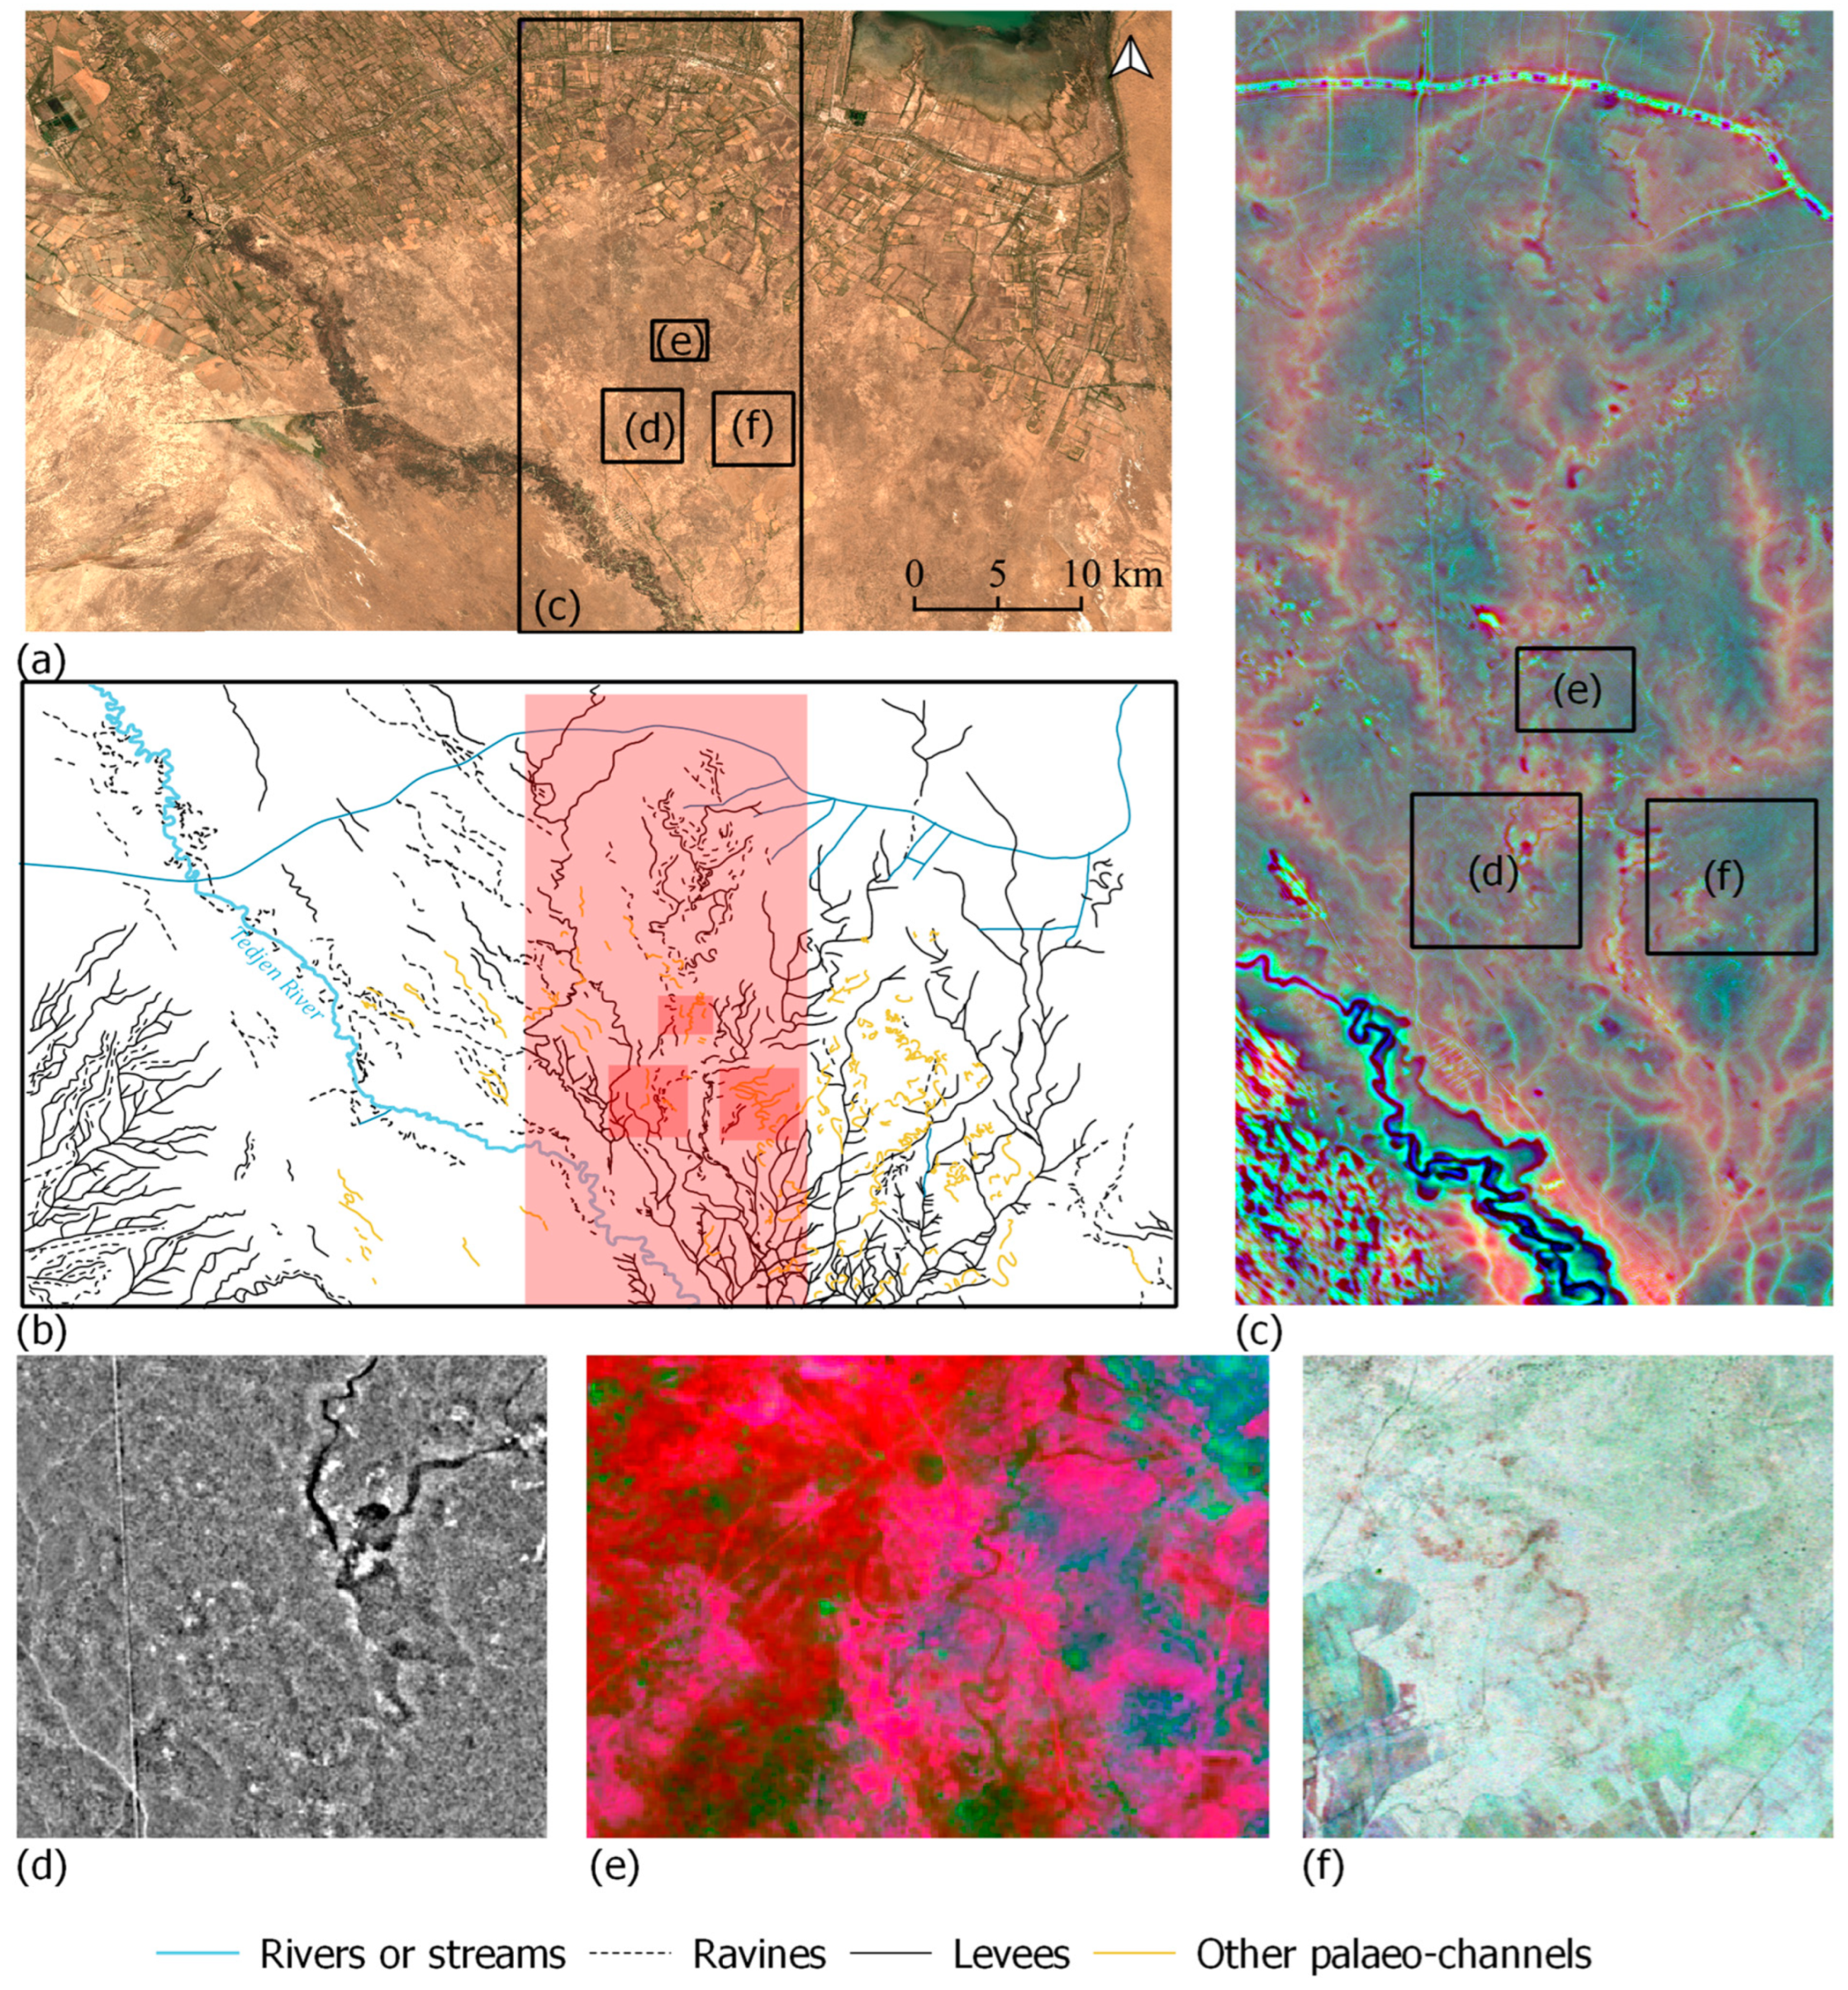
1.1.4. Area between Serakhs and Geoksyur Oases
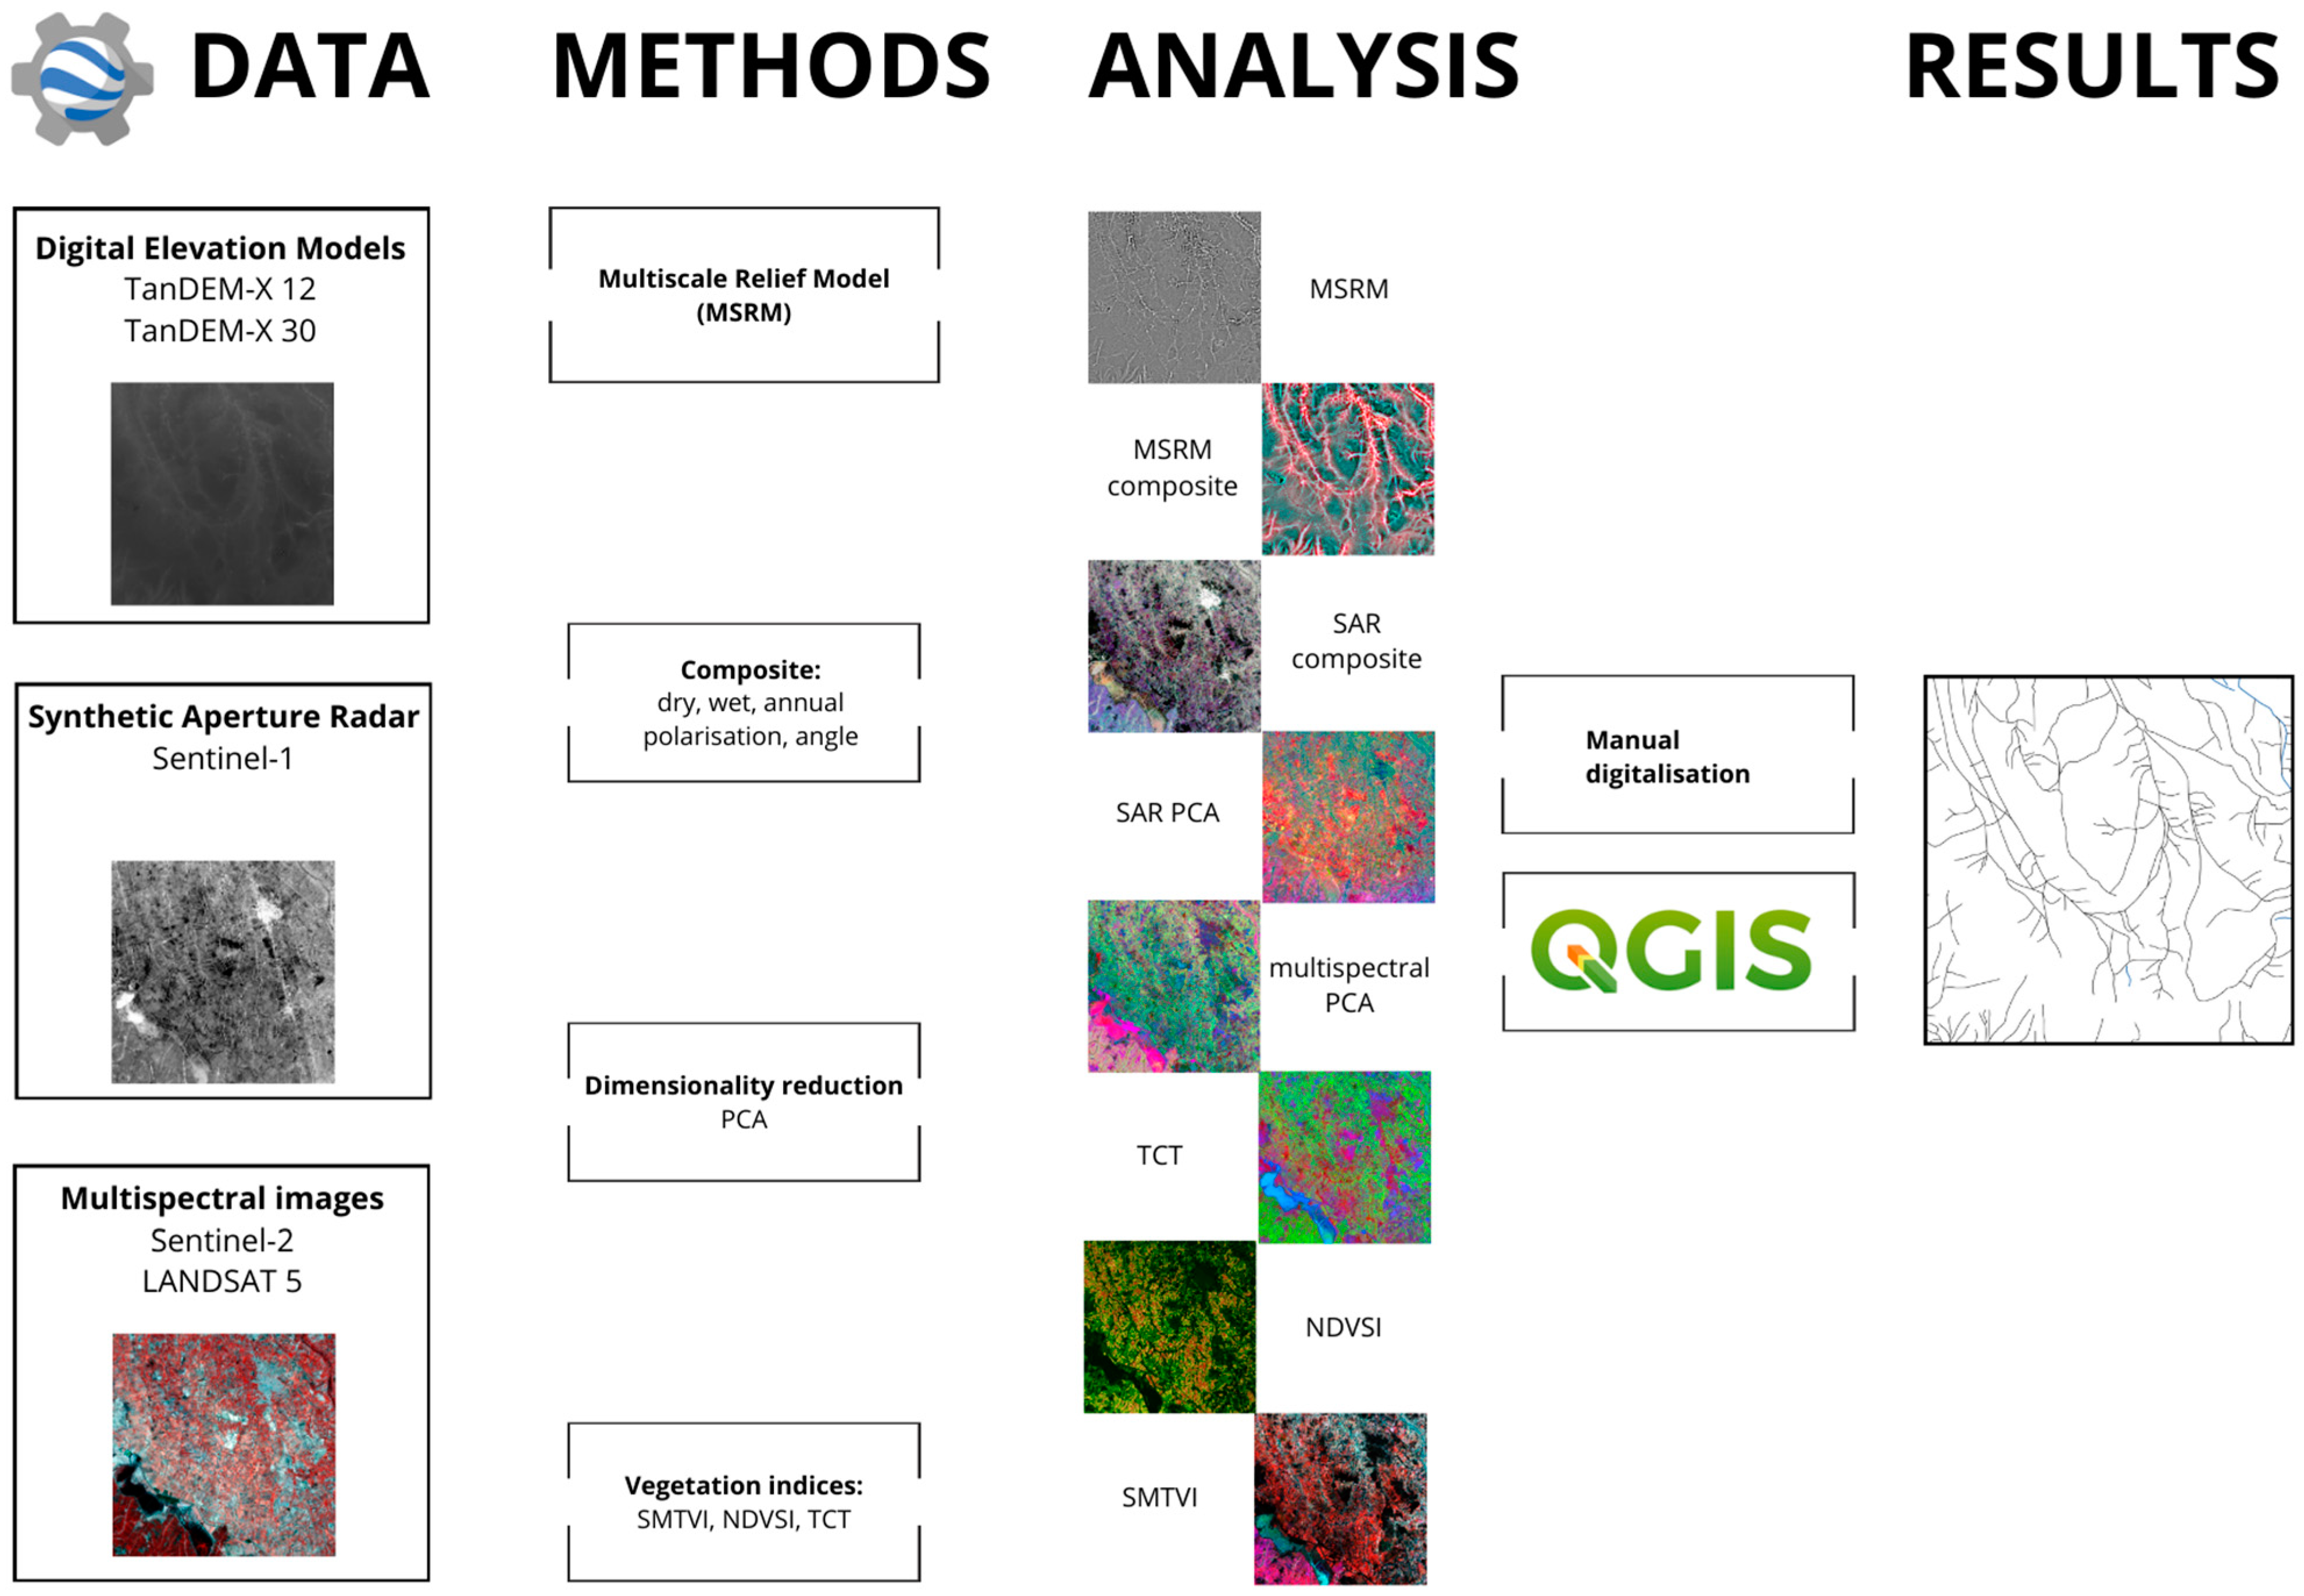
2. Materials and Methods
2.1. Materials
2.2. Methods

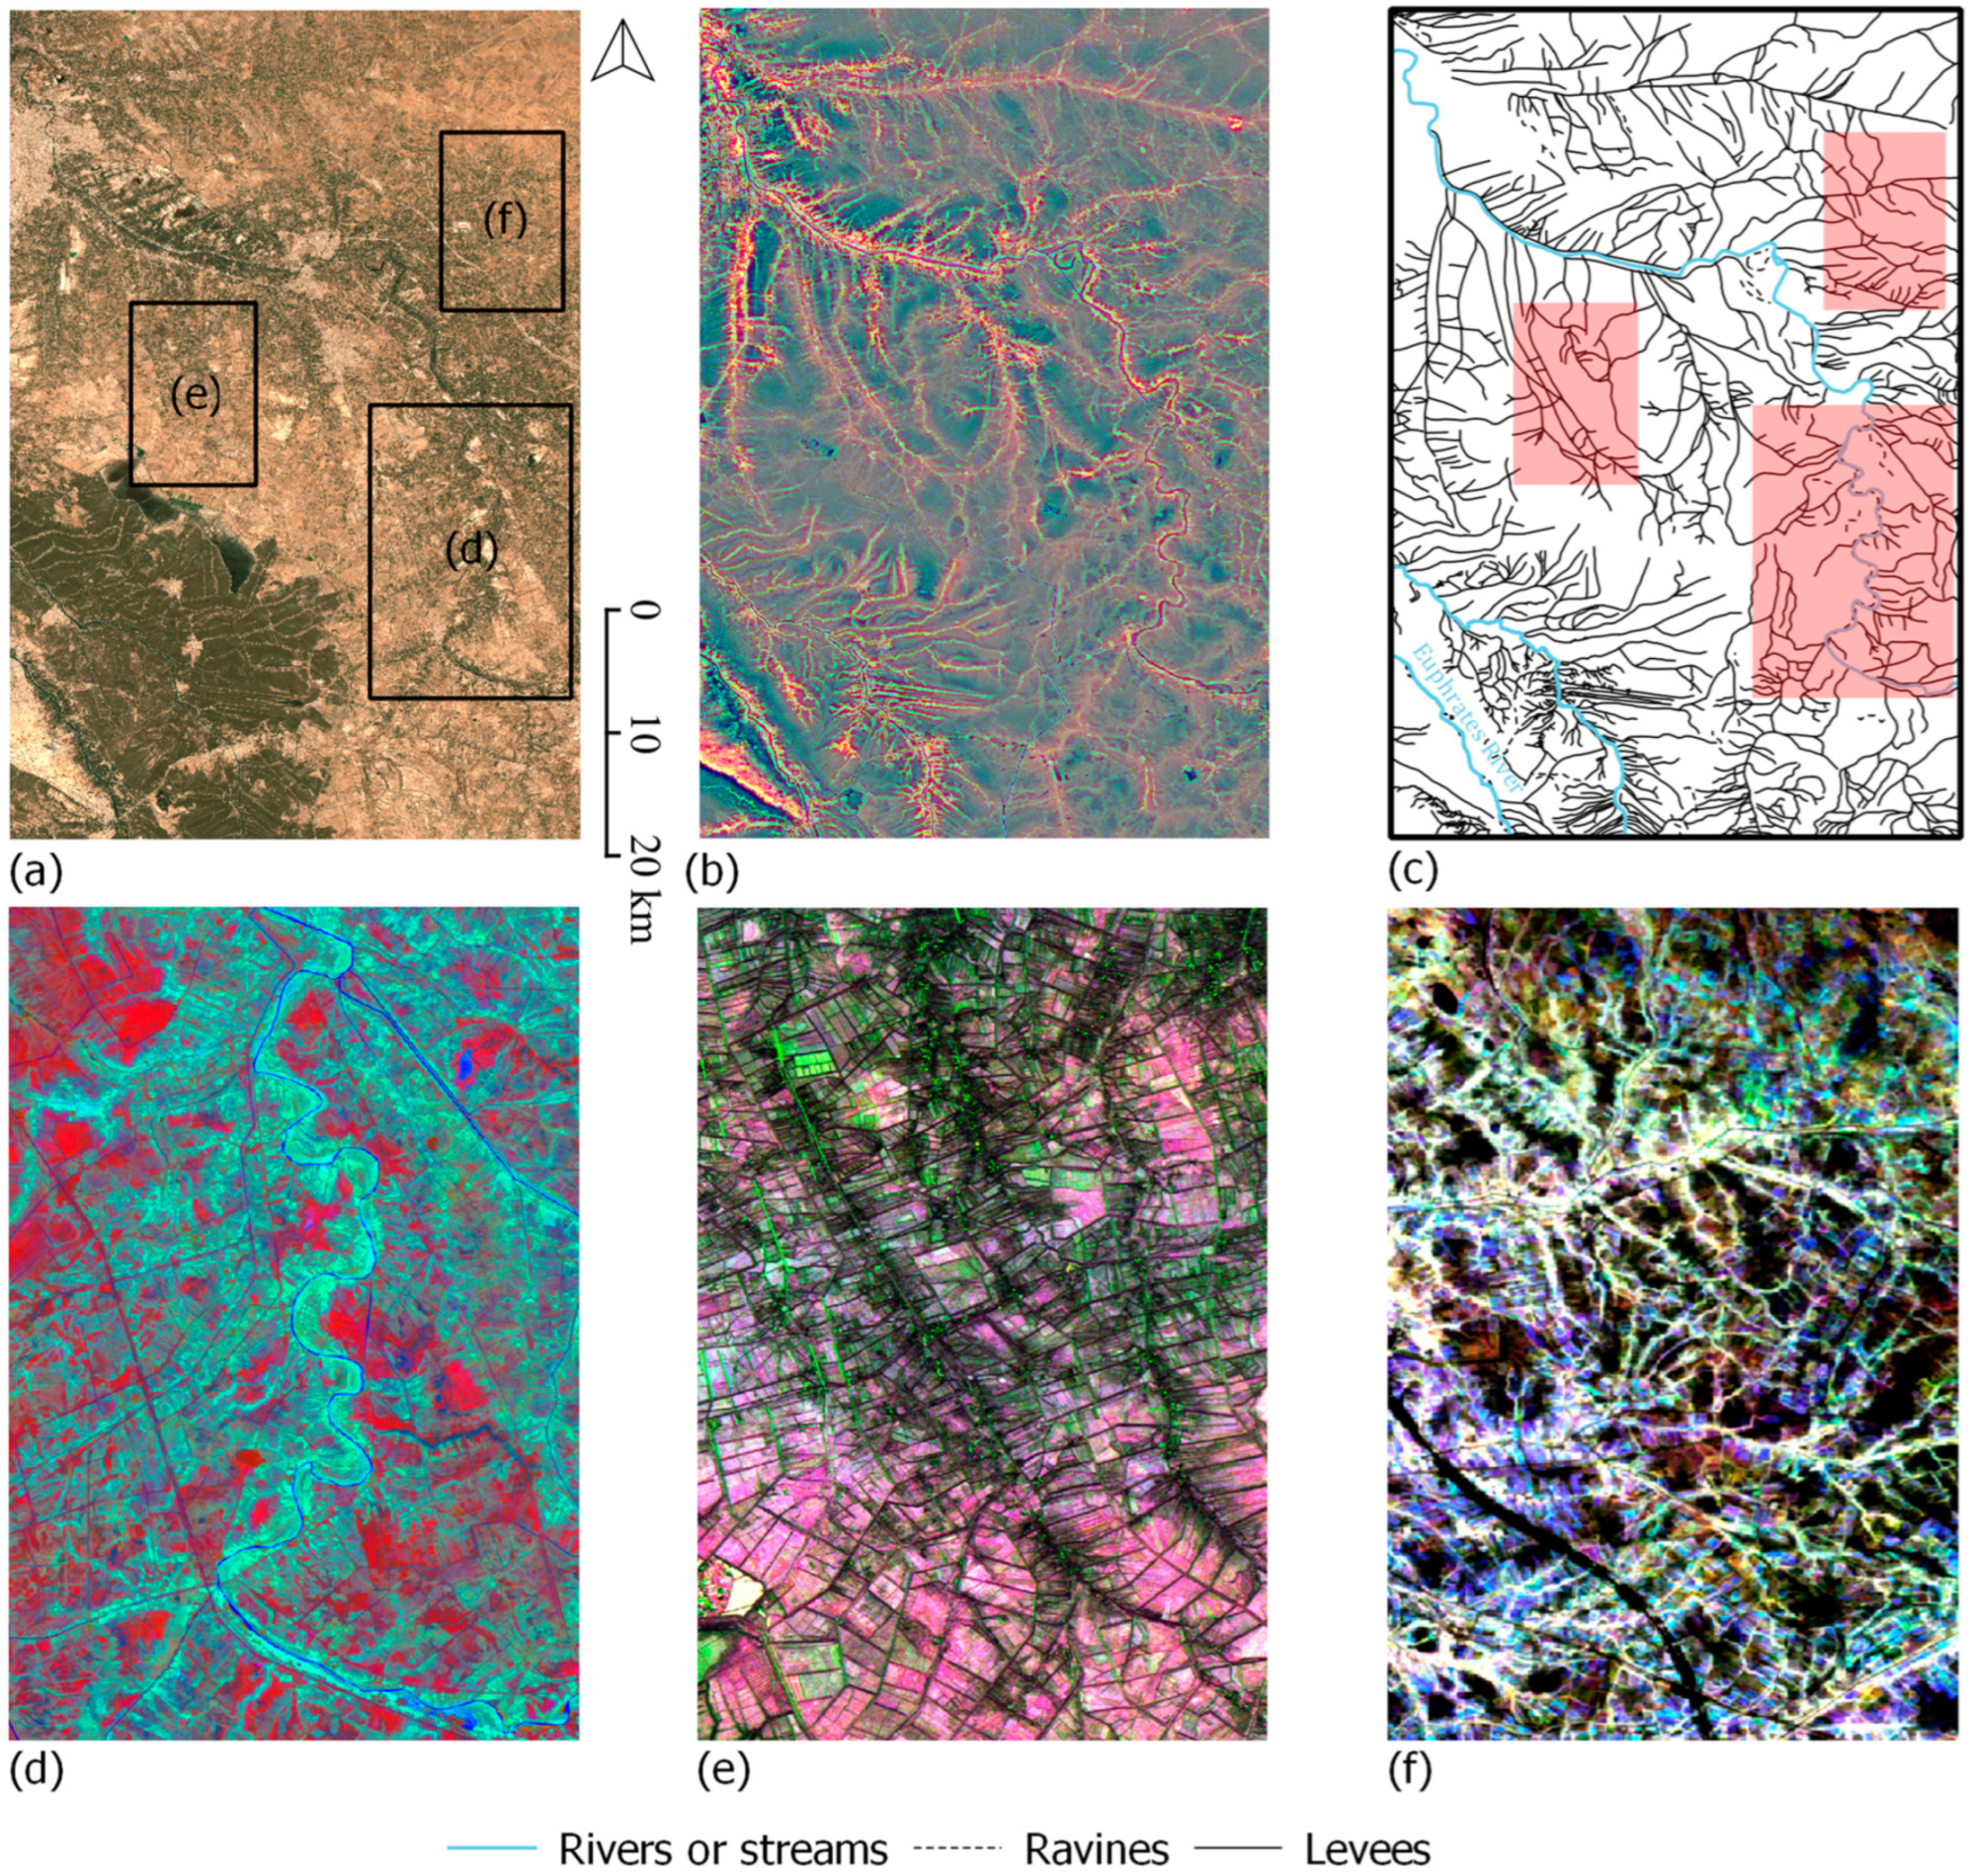
3. Results
4. Discussion
5. Conclusions
Supplementary Materials
Author Contributions
Funding
Data Availability Statement
Acknowledgments
Conflicts of Interest
References
- Bazza, M. Overview of the History of Water Resources and Irrigation Management in the Near East Region. Water Supply 2007, 7, 201–209. [Google Scholar] [CrossRef]
- Rost, S. Introduction. In Irrigation in Early States New Directions; Rost, S., Ed.; Oriental Institute of the University of Chicago: Chicago, IL, USA, 2022; pp. ix–xxvi. ISBN 978-1-61491-071-8. [Google Scholar]
- Wilkinson, T.J. Landscape of Irrigation. In Archaeological Landscapes of the Near East; University of Arizona Press: Tucson, AZ, USA, 2003; pp. 71–99. ISBN 0-8165-2173-5. [Google Scholar]
- Wilkinson, T.J.; Rayne, L. Hydraulic Landscapes and Imperial Power in the Near East. Water Hist. 2010, 2, 115–144. [Google Scholar] [CrossRef]
- Wilkinson, T.J.; Rayne, L.; Jotheri, J. Hydraulic Landscapes in Mesopotamia: The Role of Human Niche Construction. Water Hist. 2015, 7, 397–418. [Google Scholar] [CrossRef]
- Harrower, M.J. Is the Hydraulic Hypothesis Dead yet? Irrigation and Social Change in Ancient Yemen. World Archaeol. 2009, 41, 58–72. [Google Scholar] [CrossRef]
- Bagg, A.M. Irrigation. In A Companion to the Archaeology of the Ancient Near East: Volume I; Potts, D.T., Ed.; Wiley-Blackwell: Chichester, UK, 2012; pp. 261–278. [Google Scholar]
- Cole, S.W.; Gasche, H. Second and First Millennium B.C. Rivers in Northern Babylonia. In Changing Watercourses in Babylonia. Towards a Reconstruction of the Ancient Environment in Lower Mesopotamia; Gasche, H., Tanret, M., Eds.; Mesopotamian History and Environment, Series II, Memoirs, V. 5; University of Ghent: Ghent, Belgium; Oriental Institute Publications: Chicago, IL, USA, 1998; pp. 1–64. [Google Scholar]
- Madella, M.; Lancelotti, C. Archaeobotanical Perspectives on Water Supply and Water Management in the Indus Valley Civilization. In Irrigation in Early States New Directions; Rost, S., Ed.; The University of Chicago: Chicago, IL, USA, 2022; pp. 113–136. ISBN 978-1-61491-071-8. [Google Scholar]
- Oates, D.; Oates, J. Early Irrigation Agriculture in Mesopotamia. In Problems in Economic and Social Archaeology; Sieveking, G., de, G., Longworth, I.H., Wilson, K.E., Eds.; Duckworth: London, UK, 1976; pp. 109–135. [Google Scholar]
- Helbaek, H. Ecological Effects of Irrigation in Ancient Mesopotamia. Iraq 1960, 22, 186–196. [Google Scholar] [CrossRef]
- Charles, M.P.; Hoppé, C. The Effects of Irrigation on the Weed Floras of Winter Cereal Crops in Wadi Ibn Hamad (Southern Jordan). Levant 2003, 35, 213–230. [Google Scholar] [CrossRef]
- Jenkins, E.; Jamjoum, K.; Nuimat, S.; Stafford, R.; Nortcliff, S.; Mithen, S. Identifying Ancient Water Availability through Phytolith Analysis: An Experimental Approach. J. Archaeol. Sci. 2016, 73, 82–93. [Google Scholar] [CrossRef]
- Farquhar, G.D.; Richards, R. Isotopic Composition of Plant Carbon Correlates with Water—Use Efficiency of Wheat Genotypes. Aust. J. Plant Physiol. 1984, 11, 539–552. [Google Scholar] [CrossRef]
- Albarella, U.; Dobney, K.; Ervynck, A.; Rowley-Convy, P. (Eds.) Pigs and Humans: 10,000 Years of Interaction; Oxford University Press: Oxford, UK; New York, NY, USA, 2007; ISBN 978-0-19-920704-6. [Google Scholar]
- Miller, N.F.; Zeder, M.A.; Arter, S.R. From Food and Fuel to Farms and Flocks: The Integration of Plant and Animal Remains in the Study of the Agropastoral Economy at Gordion, Turkey. Curr. Anthropol. 2009, 50, 915–924. [Google Scholar] [CrossRef]
- Wilkinson, T.J.; Jotheri, J. The Origins of Levee and Levee-Based Irrigation in the Nippur Area—Southern Mesopotamia. In Cycles and Stages in Jeeps and Passats: Studies in the Ancient Near East in Honour of McGuire Gibson; Altaweel, M., Hritz, C., Eds.; University of Chicago Oriental Institute: Chicago, IL, USA, 2017. [Google Scholar]
- Richason, B.F.; Hritz, C. Remote Sensing and GIS Use in the Archaeological Analysis of the Central Mesopotamian Plain. In Remote Sensing in Archaeology; Wiseman, J., El-Baz, F., Eds.; Interdisciplinary Contributions To Archaeology; Springer: New York, NY, USA, 2007; pp. 283–325. ISBN 978-0-387-44453-6. [Google Scholar]
- Eger, A.A. The Swamps of Home : Marsh Formation and Settlement in the Early Medieval Near East. J. East. Stud. 2011, 70, 55–79. [Google Scholar] [CrossRef]
- Jotheri, J. Recognition Criteria for Canals and Rivers in the Mesopotamian Floodplain. In Water Societies and Technologies from the Past and Present; Zhuang, Y., Altaweel, M., Eds.; UCL Press: London, UK, 2018; pp. 111–126. ISBN 978-1-911576-71-6. [Google Scholar]
- Buławka, N.; Kaim, B. The Iron Age in Serakhs Oasis (Turkmenistan). The Preliminary Results of the Application of Geographic Information System in the Study of the Settlement Pattern of the Earliest Confirmed Occupation of the Oasis. In Proceedings of the CAA 2015. Keep The Revolution Going Proceedings of the 43rd Annual Conference on Computer Applications and Quantitative Methods in Archaeology; Campana, S., Scopigno, R., Carpentiero, G., Cirillo, M., Eds.; Archaeopress: Oxford, UK, 2016; Volume 2, pp. 791–801. [Google Scholar]
- Gorelick, N.; Hancher, M.; Dixon, M.; Ilyushchenko, S.; Thau, D.; Moore, R. Google Earth Engine: Planetary-Scale Geospatial Analysis for Everyone. Remote Sens. Environ. 2017, 202, 18–27. [Google Scholar] [CrossRef]
- Orengo, H.A.; Petrie, C.A. Large-Scale, Multi-Temporal Remote Sensing of Palaeo-River Networks: A Case Study from Northwest India and Its Implications for the Indus Civilisation. Remote Sens. 2017, 9, 735. [Google Scholar] [CrossRef]
- Orengo, H.A.; Petrie, C.A. Multi-Scale Relief Model (MSRM): A New Algorithm for the Visualization of Subtle Topographic Change of Variable Size in Digital Elevation Models. Earth Surf. Process. Landf. 2018, 43, 1361–1369. [Google Scholar] [CrossRef] [PubMed]
- Yang, L.; Driscol, J.; Sarigai, S.; Wu, Q.; Chen, H.; Lippitt, C.D. Google Earth Engine and Artificial Intelligence (AI): A Comprehensive Review. Remote Sens. 2022, 14, 3253. [Google Scholar] [CrossRef]
- Zhao, Q.; Yu, L.; Li, X.; Peng, D.; Zhang, Y.; Gong, P. Progress and Trends in the Application of Google Earth and Google Earth Engine. Remote Sens. 2021, 13, 3778. [Google Scholar] [CrossRef]
- Amani, M.; Ghorbanian, A.; Ahmadi, S.A.; Kakooei, M.; Moghimi, A.; Mirmazloumi, S.M.; Moghaddam, S.H.A.; Mahdavi, S.; Ghahremanloo, M.; Parsian, S.; et al. Google Earth Engine Cloud Computing Platform for Remote Sensing Big Data Applications: A Comprehensive Review. IEEE J. Sel. Top. Appl. Earth Obs. Remote Sens. 2020, 13, 5326–5350. [Google Scholar] [CrossRef]
- Goldblatt, R.; You, W.; Hanson, G.; Khandelwal, A. Detecting the Boundaries of Urban Areas in India: A Dataset for Pixel-Based Image Classification in Google Earth Engine. Remote Sens. 2016, 8, 634. [Google Scholar] [CrossRef]
- Sidhu, N.; Pebesma, E.; Câmara, G. Using Google Earth Engine to Detect Land Cover Change: Singapore as a Use Case. Eur. J. Remote Sens. 2018, 51, 486–500. [Google Scholar] [CrossRef]
- Boothroyd, R.J.; Williams, R.D.; Hoey, T.B.; Barrett, B.; Prasojo, O.A. Applications of Google Earth Engine in Fluvial Geomorphology for Detecting River Channel Change. WIREs Water 2021, 8, e21496. [Google Scholar] [CrossRef]
- Aman, M.A.; Chu, H.-J. Long-Term River Extent Dynamics and Transition Detection Using Remote Sensing: Case Studies of Mekong and Ganga River. Sci. Total Environ. 2023, 876, 162774. [Google Scholar] [CrossRef] [PubMed]
- Zhou, Y.; Tang, Q. Meandering Characteristics of the Yimin River in Hulun Buir Grassland, Inner Mongolia, China. Remote Sens. 2022, 14, 2696. [Google Scholar] [CrossRef]
- Langhorst, T.; Pavelsky, T. Global Observations of Riverbank Erosion and Accretion from Landsat Imagery. J. Geophys. Res. Earth Surf. 2023, 128, e2022JF006774. [Google Scholar] [CrossRef]
- Garcia, A.; Orengo, H.; Conesa, F.; Green, A.; Petrie, C. Remote Sensing and Historical Morphodynamics of Alluvial Plains. The 1909 Indus Flood and the City of Dera Ghazi Khan (Province of Punjab, Pakistan). Geosciences 2019, 9, 21. [Google Scholar] [CrossRef]
- Garcia-Molsosa, A.; Orengo, H.A.; Petrie, C.A. Reconstructing Long-Term Settlement Histories on Complex Alluvial Floodplains by Integrating Historical Map Analysis and Remote-Sensing: An Archaeological Analysis of the Landscape of the Indus River Basin. Herit. Sci. 2023, 11, 141. [Google Scholar] [CrossRef]
- Orengo, H.A.; Conesa, F.C.; Garcia-Molsosa, A.; Lobo, A.; Green, A.S.; Madella, M.; Petrie, C.A. Automated Detection of Archaeological Mounds Using Machine-Learning Classification of Multisensor and Multitemporal Satellite Data. Proc. Natl. Acad. Sci. USA 2020, 117, 18240–18250. [Google Scholar] [CrossRef] [PubMed]
- Liss, B.; Howland, M.D.; Levy, T.E. Testing Google Earth Engine for the Automatic Identification and Vectorization of Archaeological Features: A Case Study from Faynan, Jordan. J. Archaeol. Sci. Rep. 2017, 15, 299–304. [Google Scholar] [CrossRef]
- Agapiou, A. Detecting Looting Activity through Earth Observation Multi-Temporal Analysis over the Archaeological Site of Apamea (Syria) during 2011–2012. J. Comput. Appl. Archaeol. 2020, 3, 219–237. [Google Scholar] [CrossRef]
- Fattore, C.; Abate, N.; Faridani, F.; Masini, N.; Lasaponara, R. Google Earth Engine as Multi-Sensor Open-Source Tool for Supporting the Preservation of Archaeological Areas: The Case Study of Flood and Fire Mapping in Metaponto, Italy. Sensors 2021, 21, 1791. [Google Scholar] [CrossRef] [PubMed]
- Agapiou, A. Remote Sensing Heritage in a Petabyte-Scale: Satellite Data and Heritage Earth Engine© Applications. Int. J. Digit. Earth 2017, 10, 85–102. [Google Scholar] [CrossRef]
- Elfadaly, A.; Abutaleb, K.; Naguib, D.M.; Lasaponara, R. Detecting the Environmental Risk on the Archaeological Sites Using Satellite Imagery in Basilicata Region, Italy. Egypt. J. Remote Sens. Space Sci. 2022, 25, 181–193. [Google Scholar] [CrossRef]
- Lepori, M.; Zamora, D. Análisis espacial mediante Google Earth Engine para el estudio y comprensión de las vías de circulación entre la Puna y los Valles Altos catamarqueños. Relaciones 2023, 48, e051. [Google Scholar] [CrossRef]
- Conesa, F.C.; Orengo, H.A.; Lobo, A.; Petrie, C.A. An Algorithm to Detect Endangered Cultural Heritage by Agricultural Expansion in Drylands at a Global Scale. Remote Sens. 2023, 15, 53. [Google Scholar] [CrossRef]
- Rubel, F.; Kottek, M. Observed and Projected Climate Shifts 1901–2100 Depicted by World Maps of the Köppen-Geiger Climate Classification. Meteorol. Z. 2010, 19, 135–141. [Google Scholar] [CrossRef]
- New, M.; Lister, D.; Hulme, M.; Makin, I. A High-Resolution Data Set of Surface Climate over Global Land Areas. Clim. Res. 2000, 21, 1–25. [Google Scholar] [CrossRef]
- Zomer, R.J.; Xu, J.; Trabucco, A. Version 3 of the Global Aridity Index and Potential Evapotranspiration (ET0) Climate Database. Sci. Data 2022, 9, 409. [Google Scholar] [CrossRef] [PubMed]
- Yaseen, Z.M.; Sulaiman, S.O.; Sharif, A. The Nature of Tigris–Euphrates Rivers Flow: Current Status and Future Prospective. In Tigris and Euphrates Rivers: Their Environment from Headwaters to Mouth; Jawad, L.A., Ed.; Springer International Publishing: Cham, Switzerland, 2021; pp. 229–242. ISBN 978-3-030-57569-4. [Google Scholar]
- Adams, R.M. Heartland of Cities. Surveys of Ancient Settlement and Land Use on the Central Floodplain of the Euphrates; University of Chicago Press: Chicago, IL, USA; London, UK, 1981. [Google Scholar]
- Adamo, N.; Al-Ansari, N. In Old Babylonia: Irrigation and Agriculture Flourished Under the Code of Hammurabi (2000–1600 BC). J. Earth Sci. Geotech. Eng. 2020, 10, 41–57. [Google Scholar]
- van Soldt, W. Irrigation in Kassite Babylonia. Bull. Sumer. Agric. 1988, 4, 105–120. [Google Scholar]
- Jotheri, J.; Allen, M.B.; Wilkinson, T.J. Holocene Avulsions of the Euphrates River in the Najaf Area of Western Mesopotamia: Impacts on Human Settlement Patterns. Geoarchaeology 2016, 31, 175–193. [Google Scholar] [CrossRef]
- Altaweel, M.; Marsh, A.; Jotheri, J.; Hritz, C.; Fleitmann, D.; Rost, S.; Lintner, S.F.; Gibson, M.; Bosomworth, M.; Jacobson, M.; et al. New Insights on the Role of Environmental Dynamics Shaping Southern Mesopotamia: From the Pre-Ubaid To the Early Islamic Period. Iraq 2019, 81, 23–46. [Google Scholar] [CrossRef]
- Hopper, K. The Gorgan Plain of Northeast Iran: A Diachronic Analysis of Settlement and Land Use Patterns Relating to Urban, Rural and Mobile Populations on a Sasanian Frontier. Doctoral Thesis, Durham University, Durham, UK, 2017. [Google Scholar]
- Kehl, M. Quaternary Climate Change in Iran—The State of Knowledge. ERDKUNDE 2009, 63, 1–17. [Google Scholar] [CrossRef]
- Wilkinson, T.J.; Rekavandi, H.O.; Hopper, K.; Priestman, S.; Roustaei, K.; Galiatsatos, N. The Landscapes of the Gorgān Wall. In Persia’s Imperial Power in Late Antiquity: The Great Wall of Gorgān and Frontier Landscapes of Sasanian Iran; Sauer, E., Omrani Rekavandi, H., Wilkinson, T.J., Nokandeh, J., Eds.; British Institute of Persian Studies Archaeological Monographs Series; Oxbow Books: Oxford, UK, 2013; pp. 24–132. [Google Scholar]
- Salvatori, S.; Tosi, M.; Cerasetti, B. The Archaeological Map of the Murghab Delta. Studies and Reports. In The Bronze Age and Early Iron Age in the Margiana Lowlands: Facts and Methodological Proposal for a Redefinition of the Research Strategies; BAR International Series 1806; Archaeopress: Oxford, UK, 2008; Volume 2. [Google Scholar]
- Dolukhanov, P.M. The Ecological Prerequisities for Early Farming in Southern Turkmenia. In The Bronze Age Civilization of Central Asia. Recent Soviet Discoveries; Kohl, P.L., Ed.; Sharpe: New York, NY, USA, 1981; pp. 359–385. [Google Scholar]
- Šul’c, V.L. Reki Srednej Azii. Časti I i II; Gidrometeoizdat: Leningrad, Russia, 1960. [Google Scholar]
- Orlovsky, N.S. Climate of Turkmenistan. In Biogeography and Ecology of Turkmenistan; Fet, V., Atamuradov, K.I., Eds.; Monographiae Biologicae, 77; Springer Science/Business Media: Dordrecht, The Netherlands, 1994; pp. 23–48. [Google Scholar]
- Efremov, K.F.; Lavronenko, O.S.; Sarkisov, M.M. The V. I. Lenin Karakum Canal in the Turkmen SSR. Hydrotech. Constr. 1970, 4, 346–350. [Google Scholar] [CrossRef]
- Zonn, I.S. Karakum Canal: Artificial River in a Desert. In The Turkmen Lake Altyn Asyr and Water Resources in Turkmenistan; Zonn, I.S., Kostianoy, A.G., Eds.; The Handbook of Environmental Chemistry 28; Springer: Heidelberg, Germany; New York, NY, USA; Dordrecht, The Netherlands; London, UK, 2014; pp. 95–106. [Google Scholar]
- Lyonnet, B.; Dubova, N.A. Questioning the Oxus Civilization or Bactria-Margiana Archaeological Culture (BMAC). In The World of the Oxus Civilization; Lyonnet, B., Dubova, N.A., Eds.; Routledge Worlds; Routledge: London, UK; New York, NY, USA, 2020; pp. 7–65. [Google Scholar]
- Dal Pozzo, A.; Immordino, F.; Candigliota, E. Remote Sensing Multitemporal Data for Geomorphological Analysis of the Murghab Alluvial Fan in Turkmenistan. J. Earth Sci. Eng. 2017, 7, 55–73. [Google Scholar] [CrossRef]
- Buławka, N. Osadnictwo Kultury Jaz w Oazach Tedżenu i Murgabu w Turkmenistanie. The Settlement of Yaz Culture in the Oases of Tedjen and Murghab in Turkmenistan. Ph.D. Thesis, University of Warsaw, Warszawa, Poland, 2020. [Google Scholar]
- Cremaschi, M. Palaeohydrography and Middle Holocene Desertification in the Northern Fringe of the Murghab Delta. In The Archaeological Map of the Murghab Delta: Preliminary Reports 1990-1995. Volume 1; Gubaev, A., Koshelenko, G.A., Tosi, M., Eds.; Centro Scavi e Ricerche Archeologiche, Reports and Memoirs, Series Minor; Istituto Italiano per l’Africa e l’Oriente: Roma, Italy, 1998; Volume 3, pp. 14–25. [Google Scholar]
- Arciero, R. Irrigating the Desert: Approaches to Paleochannel Reconstruction in the Murghab (Turkmenistan) during the Bronze Age. In Proceedings of the Problems of Chronology and Cultural Genesis of Ancient Sedentary Societies of Eurаsia (from the Neolithic Period through the Early Iron Age); Institute for the History of Material Culture Russian Academy of Sciences: St Petersburg, Russia, 2019; pp. 64–66. [Google Scholar]
- Williams, T. Unmanned Aerial Vehicle Photography: Exploring the Medieval City of Merv, on the Silk Roads of Central Asia. Archaeol. Int. 2012, 15, 54–68. [Google Scholar] [CrossRef]
- Markofsky, S.B. Windows on a Delta Margin: A Case Study from the Murghab Delta, Turkmenistan. In Proceedings of the 8th International Congress on the Archaeology of the Ancient Near East. Archaeology of Fire, Conservation, Preservation and Site Management, Bioarchaeology in the Ancient Near East; Session, I., Bieliński, P., Gawlikowski, M., Koliński, R., Ławecka, D., Sołtysiak, A., Wygnańska, Z., Eds.; Harrassowitz Verlag: Wiesbaden, Germany, 2014; Volume 3, pp. 561–576. [Google Scholar]
- Lyonnet, B.; Dubova, N.A. The World of the Oxus Civilizations; Lyonnet, B., Dubova, N.A., Eds.; Routledge: Oxford, UK, 2021. [Google Scholar]
- Buławka, N.; Kaim, B.; Rzeplińska, M. Berdysyčran-Depe: A Bronze Age Site in the Lower Tedjen River Valley, Turkmenistan. Archaeol. Res. Asia 2021, 28, 100326. [Google Scholar] [CrossRef]
- Buławka, N. Settlement Patterns of the Yaz Culture in the Deltas of the Tedzhen River in Turkmenistan. In Proceedings of the A Millennium of History: The Iron Age in southern Central Asia (2nd and 1st Millennia BC), Berlin, Germany, 23–25 June 2014; Dedicated to the Memory of Viktor Ivanovich Sarianidi; Lhuillier, J., Boroffka, N., Eds.; Archäologie in Iran und Turan : Band 17/Mémoires de la Délégation Archéologique Française en Afghanistan: Volume XXXV; Deutsches Archäologisches Institut. Eurasien-Abteilung/Délégation Archéologique Française en Afghanistan: Berlin, Germany, 2018; pp. 143–158. ISBN 978-3-496-01594-9. [Google Scholar]
- Torres, R.; Snoeij, P.; Geudtner, D.; Bibby, D.; Davidson, M.; Attema, E.; Potin, P.; Rommen, B.; Floury, N.; Brown, M.; et al. GMES Sentinel-1 Mission. Remote Sens. Environ. 2012, 120, 9–24. [Google Scholar] [CrossRef]
- Mullissa, A.; Vollrath, A.; Odongo-Braun, C.; Slagter, B.; Balling, J.; Gou, Y.; Gorelick, N.; Reiche, J. Sentinel-1 SAR Backscatter Analysis Ready Data Preparation in Google Earth Engine. Remote Sens. 2021, 13, 1954. [Google Scholar] [CrossRef]
- Wessel, B. TanDEM-X Ground Segment—DEM Products Specification Document. EOC, DLR, Oberpfaffenhofen, Germany, Public Document TD-GS-PS-0021, Issue 3.2. 2018. Available online: https://tandemx-science.dlr.de/pdfs/TD-GS-PS-0021_DEM-Product-Specification_v3.2.pdf (accessed on 10 January 2022).
- González, C.; Bachmann, M.; Bueso-Bello, J.-L.; Rizzoli, P.; Zink, M. A Fully Automatic Algorithm for Editing the TanDEM-X Global DEM. Remote Sens. 2020, 12, 3961. [Google Scholar] [CrossRef]
- Bueso-Bello, J.-L.; Martone, M.; González, C.; Sica, F.; Valdo, P.; Posovszky, P.; Pulella, A.; Rizzoli, P. The Global Water Body Layer from TanDEM-X Interferometric SAR Data. Remote Sens. 2021, 13, 5069. [Google Scholar] [CrossRef]
- Martone, M.; Rizzoli, P.; Wecklich, C.; González, C.; Bueso-Bello, J.-L.; Valdo, P.; Schulze, D.; Zink, M.; Krieger, G.; Moreira, A. The Global Forest/Non-Forest Map from TanDEM-X Interferometric SAR Data. Remote Sens. Environ. 2018, 205, 352–373. [Google Scholar] [CrossRef]
- Jolliffe, I.T. Principal Component Analysis, 2nd ed.; Springer: New York, NY, USA, 2002. [Google Scholar]
- Kauth, R.J.; Thomas, G.S. The Tasselled Cap—A Graphic Description of the Spectral-Temporal Development of Agricultural Crops as Seen by Landsat. In Proceedings of the Symposium on Machine Processing of Remotely Sensed Data, Purdue University, West Lafayette, Indiana, 29 June–1 July 1976; Proceedings (A77-15051 04-43). Institute of Electrical and Electronics Engineers: New York, NY, USA, 1976; pp. 41–51. [Google Scholar]
- Crist, E.P. Application of the Tasseled Cap Concept to Simulated Thematic Mapper Data. Photogramm. Eng. 1984, 50, 343–352. [Google Scholar]
- Crist, E.P.; Kauth, R.J. The Tasseled Cap De-Mystified. Photogramm. Eng. Remote Sens. 1986, 52, 81–86. [Google Scholar]
- Nedkov, R. Orthogonal Transformation of Segmented Images from the Satellite Sentinel-2. Comptes Rendus Académie Sci. Vie Sci. 2017, 70, 687–691. [Google Scholar]
- Lasaponara, R.; Masini, N. QuickBird-Based Analysis for the Spatial Characterization of Archaeological Sites: Case Study of the Monte Serico Medieval Village. Geophys. Res. Lett. 2005, 32, L12313. [Google Scholar] [CrossRef]
- Lasaponara, R.; Masini, N. Image Enhancement, Feature Extraction and Geospatial Analysis in an Archaeological Perspective. In Satellite Remote Sensing; Lasaponara, R., Masini, N., Eds.; Remote Sensing and Digital Image Processing; Springer: Dordrecht, The Netherlands, 2012; Volume 16, pp. 17–63. ISBN 978-90-481-8800-0. [Google Scholar]
- Jones, R.E.; Sarris, A. Geophysical and Related Techniques Applied to Archaeological Survey in the Mediterranean: A Review. J. Mediterr. Archaeol. 2000, 13, 3–75. [Google Scholar]
- Abate, N.; Elfadaly, A.; Masini, N.; Lasaponara, R. Multitemporal 2016-2018 Sentinel-2 Data Enhancement for Landscape Archaeology: The Case Study of the Foggia Province, Southern Italy. Remote Sens. 2020, 12, 1309. [Google Scholar] [CrossRef]
- Ramkumar, M.; Kumaraswamy, K.; Balasubramani, K.; Nagarajan, R.; Santosh, M.; Abdul Rahman, S.; Prasad, K.A.; Juni, K.J.; Fathima, A.; Siddiqui, N.A.; et al. Neolithic Cultural Sites and Extreme Climate Related Channel Avulsion: Evidence from the Vaigai River Basin, Southern India. J. Archaeol. Sci. Rep. 2021, 40, 103204. [Google Scholar] [CrossRef]
- Tripathi, R.N.; Ramachandran, A.; Tripathi, V.; Badola, R. Syed Ainul Hussain Spatio-Temporal Habitat Assessment of the Gangetic Floodplain in the Hastinapur Wildlife Sanctuary. Ecol. Inform. 2022, 72, 101851. [Google Scholar] [CrossRef]
- Mondal, S.; Jeganathan, C.; Sinha, N.K.; Rajan, H.; Roy, T.; Kumar, P. Extracting Seasonal Cropping Patterns Using Multi-Temporal Vegetation Indices from IRS LISS-III Data in Muzaffarpur District of Bihar, India. Egypt. J. Remote Sens. Space Sci. 2014, 17, 123–134. [Google Scholar] [CrossRef]
- Huete, A.; Justice, C.; Liu, H. Development of Vegetation and Soil Indices for MODIS-EOS. Remote Sens. Environ. 1994, 49, 224–234. [Google Scholar] [CrossRef]
- Huete, A. A Comparison of Vegetation Indices over a Global Set of TM Images for EOS-MODIS. Remote Sens. Environ. 1997, 59, 440–451. [Google Scholar] [CrossRef]
- Huete, A.; Didan, K.; Miura, T.; Rodriguez, E.P.; Gao, X.; Ferreira, L.G. Overview of the Radiometric and Biophysical Performance of the MODIS Vegetation Indices. Remote Sens. Environ. 2002, 83, 195–213. [Google Scholar] [CrossRef]
- Berganzo-Besga, I.; Orengo, H.A.; Lumbreras, F.; Carrero-Pazos, M.; Fonte, J.; Vilas-Estévez, B. Hybrid MSRM-Based Deep Learning and Multitemporal Sentinel 2-Based Machine Learning Algorithm Detects near 10k Archaeological Tumuli in North-Western Iberia. Remote Sens. 2021, 13, 4181. [Google Scholar] [CrossRef]
- Hengl, T.; Parente, L. Monthly Precipitation in Mm at 1 Km Resolution (Multisource Average) Based on SM2RAIN-ASCAT 2007-2021, CHELSA Climate and WorldClim (0.3) [Data Set]. 2022. Zenodo. Available online: https://doi.org/10.5281/zenodo.6458580 (accessed on 10 January 2023).
- Cremaschi, M.; Castelli, R. Map 3. The Geomorphological Map of the Northern Frindge of the Murghab Delta. 1996. Scale 1: 75000 [Mapa]. In The Archaeological Map of the Murghab Delta: Preliminary Reports 1990–1995; Gubaev, A., Koshelenko, G.A., Tosi, M., Eds.; Centro Scavi e Ricerche Archeologiche, Reports and Memoirs, Series Minor, Volume 3; Istituto Italiano per l’Africa e l’Oriente: Rome, Italy, 1998; Volume 2. [Google Scholar]
- Mayoral, A.; Ejarque, A.; Garcia-Molsosa, A.; Georgiadis, M.; Apostolou, G.; Gaertner, V.; Kallintzi, C.; Kefalidou, E.; Orengo, H. A City against the Current: A Reconstruction of Holocene Sea-Level Changes and the Evolution of Coastal Landscapes in Ancient Abdera (Thrace, Gr.). CATENA 2024, 235, 107638. [Google Scholar] [CrossRef]
- Jotheri, J.; Allen, M.B. Recognition of Ancient Channels and Archaeological Sites in the Mesopotamian Floodplain Using Satellite Imagery and Digital Topography. In New agenda in remote sensing and landscape archaeology in the Near East: Studies in Honor of T.J. Wilkinson; Lawrence, D., Altaweel, M., Philip, G., Eds.; The Oriental Institute of the University of Chicago: Chicago, IL, USA, 2017. [Google Scholar]
- Hritz, C. A Malarial-Ridden Swamp: Using Google Earth Pro and Corona to Access the Southern Balikh Valley, Syria. J. Archaeol. Sci. 2013, 40, 1975–1987. [Google Scholar] [CrossRef]
- Casana, J.; Wright, R. Remote Sensing-Based Evidence of Indus-Era Irrigation Works in Punjab, Pakistan. Water Hist. 2023, 15, 293–312. [Google Scholar] [CrossRef]
- Ur, J. Remote Sensing of Ancient Canal and Irrigation Systems. In Irrigation in Early States New Directions; Rost, S., Ed.; The University of Chicago: Chicago, IL, USA, 2022; pp. 65–82. ISBN 978-1-61491-071-8. [Google Scholar]
- Hritz, C.; Wilkinson, T.J. Using Shuttle Radar Topography to Map Ancient Water Channels. Antiquity 2006, 80, 415–424. [Google Scholar] [CrossRef]
- Perego, A. AlsperGIS: SRTM DEM Destriping with SAGA GIS: Consequences on Drainage Network Extraction. Available online: http://www.alspergis.altervista.org/software/destriping.html (accessed on 1 September 2012).
- Hammer, E.; FitzPatrick, M.; Ur, J. Succeeding CORONA: Declassified HEXAGON Intelligence Imagery for Archaeological and Historical Research. Antiquity 2022, 96, 679–695. [Google Scholar] [CrossRef]

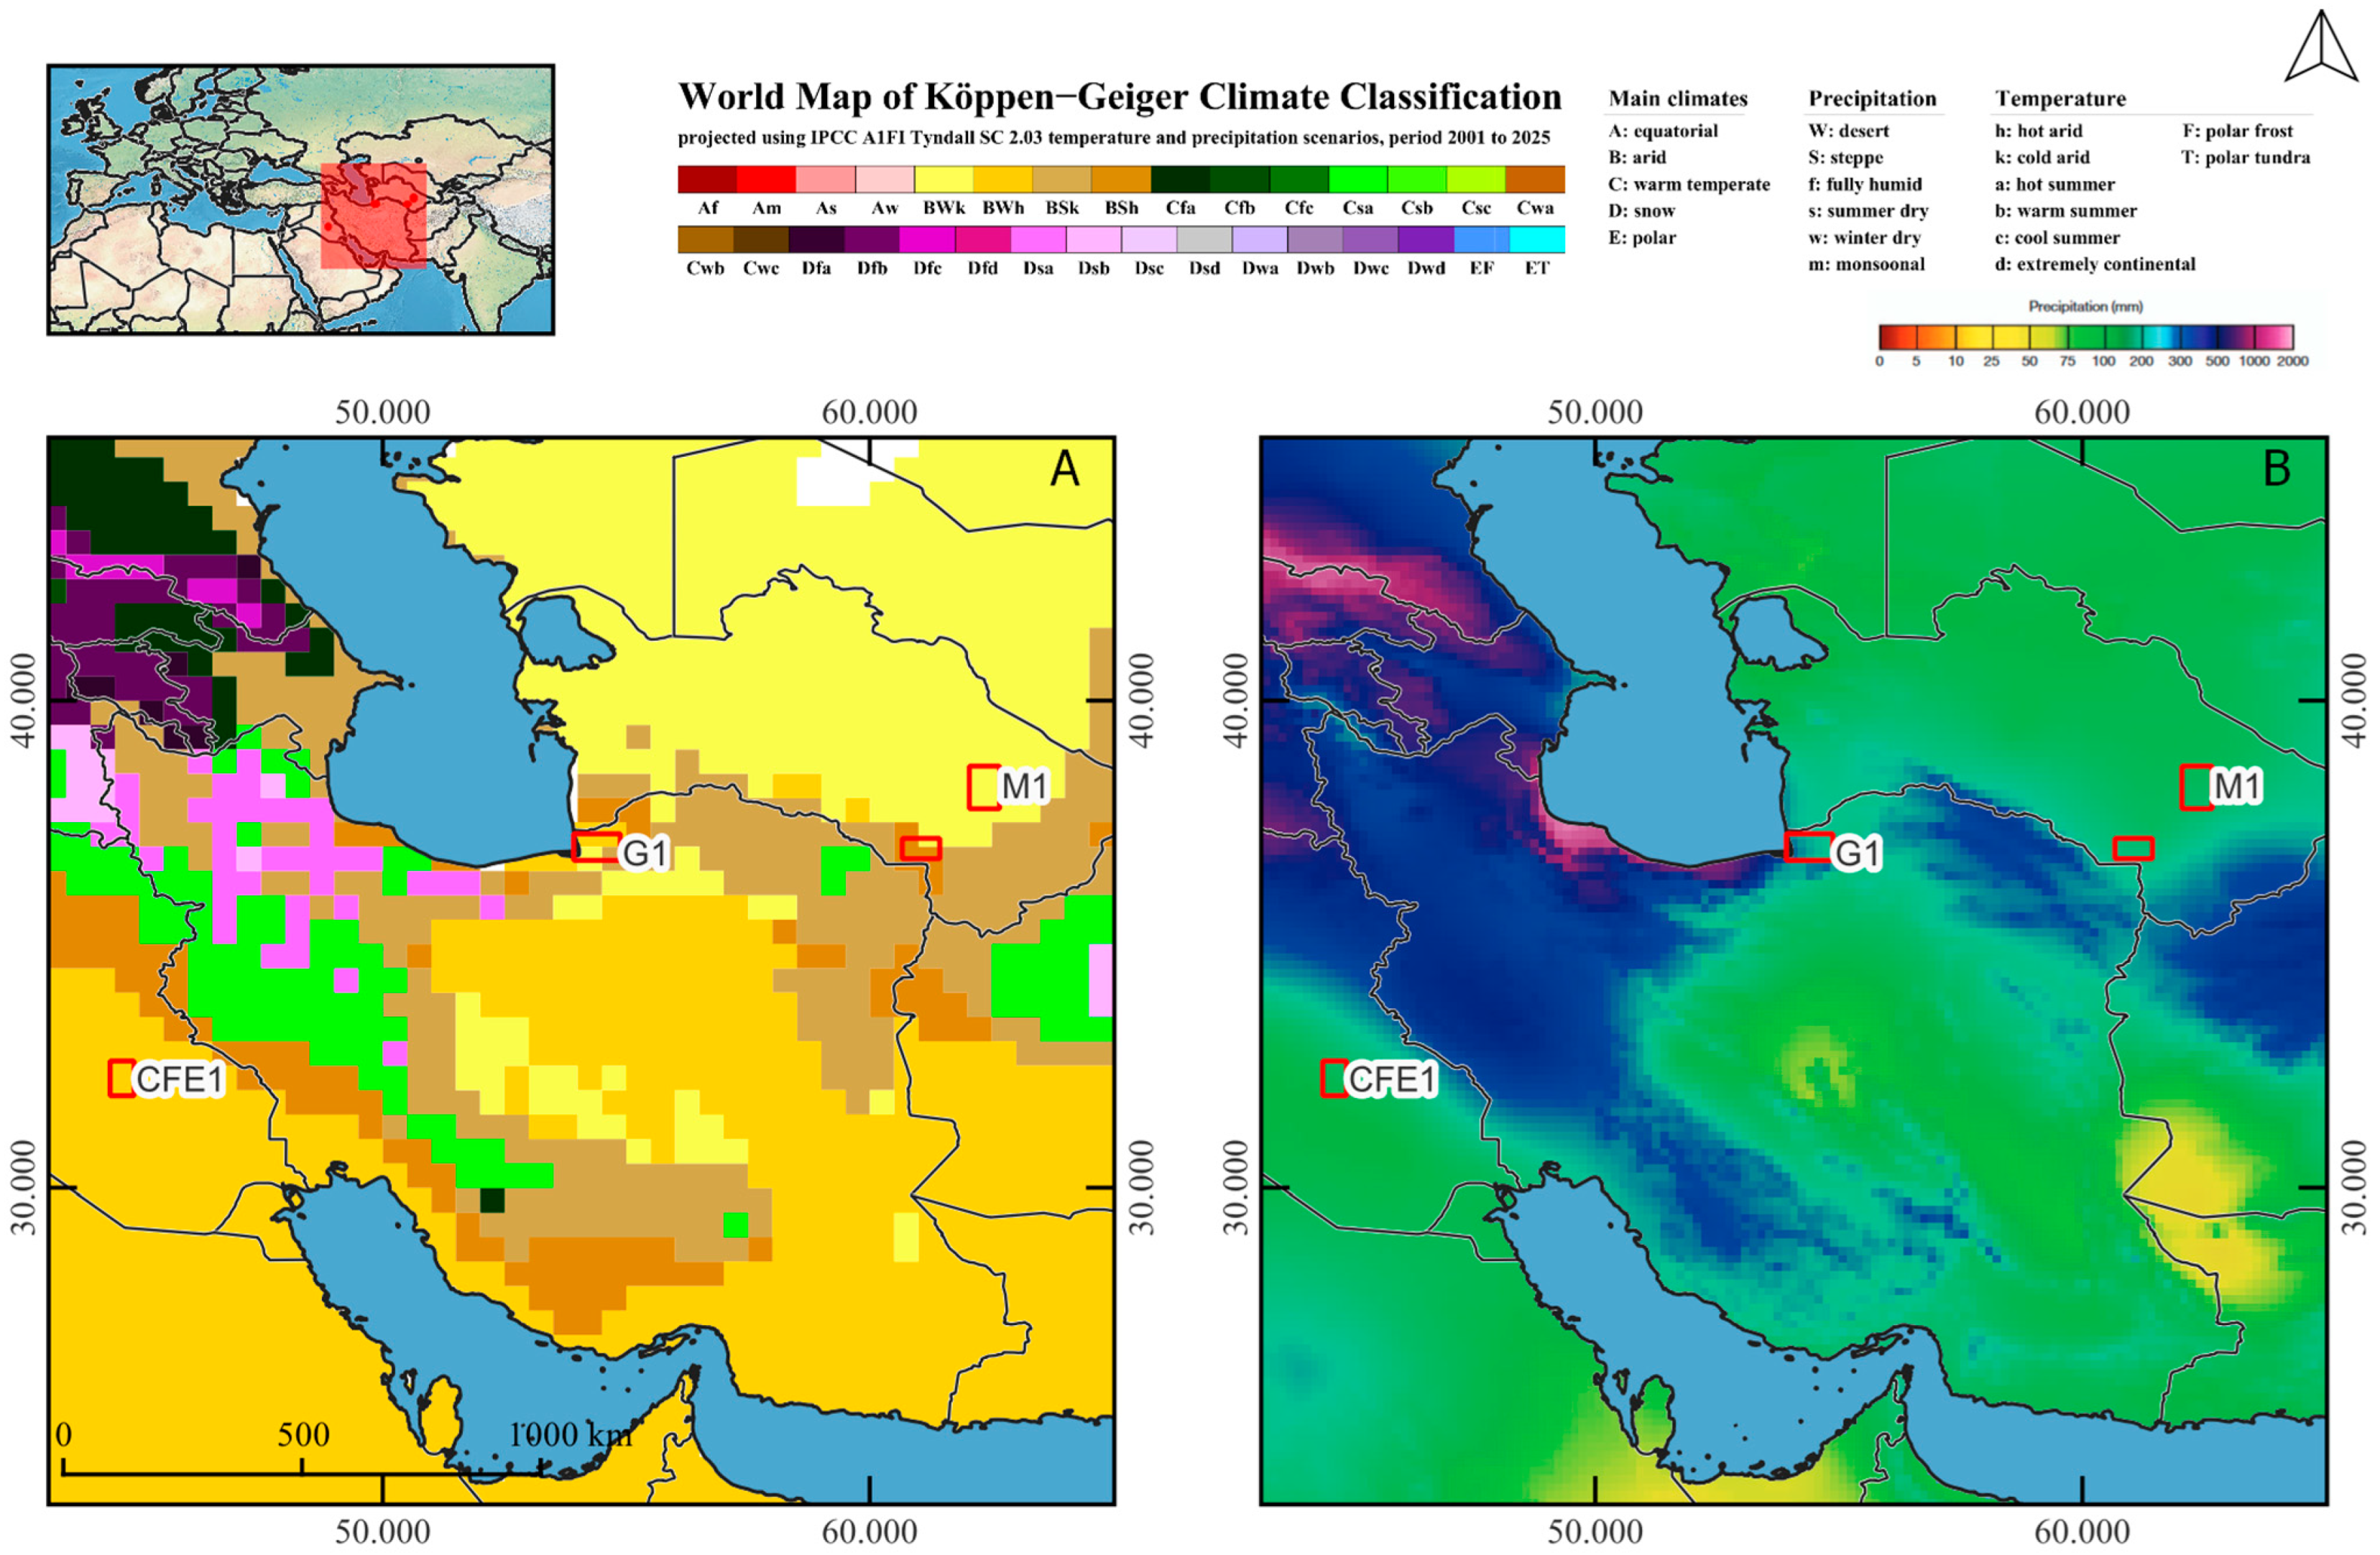
| Test Area (km2) | Climate (%) 1 | Precipitation [Mean] (mm) 2 | Evaporation [Sum] (mm) 3 | Wet Season (Month) | Landscape Type |
|---|---|---|---|---|---|
| CFE1 (3651) | BWh (100%) | 122 | 2960 | 1–4, 10–12 | Alluvial fan |
| G1 (5154) | BWh (53%) | 218 | 1507 | 1–4, 9–12 | Alluvial fan |
| BWk (27%) | 245 | 1481 | 1–4, 9–12 | Piedmont | |
| BSk (20%) | 201 | 1526 | 1–4, 9–12 | Piedmont | |
| M1 (5283) | BWk (100%) | 135 | 2135 | 1–4, 10–12 | Alluvial fan |
| T1 (3176) | BWk (23%) | 156 | 2137 | 1–4, 10–12 | Alluvial fan |
| BSh (77%) | 166 | 2166 | 1–4, 10–12 | Piedmont |
Disclaimer/Publisher’s Note: The statements, opinions and data contained in all publications are solely those of the individual author(s) and contributor(s) and not of MDPI and/or the editor(s). MDPI and/or the editor(s) disclaim responsibility for any injury to people or property resulting from any ideas, methods, instructions or products referred to in the content. |
© 2024 by the authors. Licensee MDPI, Basel, Switzerland. This article is an open access article distributed under the terms and conditions of the Creative Commons Attribution (CC BY) license (https://creativecommons.org/licenses/by/4.0/).
Share and Cite
Buławka, N.; Orengo, H.A. Application of Multi-Temporal and Multisource Satellite Imagery in the Study of Irrigated Landscapes in Arid Climates. Remote Sens. 2024, 16, 1997. https://doi.org/10.3390/rs16111997
Buławka N, Orengo HA. Application of Multi-Temporal and Multisource Satellite Imagery in the Study of Irrigated Landscapes in Arid Climates. Remote Sensing. 2024; 16(11):1997. https://doi.org/10.3390/rs16111997
Chicago/Turabian StyleBuławka, Nazarij, and Hector A. Orengo. 2024. "Application of Multi-Temporal and Multisource Satellite Imagery in the Study of Irrigated Landscapes in Arid Climates" Remote Sensing 16, no. 11: 1997. https://doi.org/10.3390/rs16111997
APA StyleBuławka, N., & Orengo, H. A. (2024). Application of Multi-Temporal and Multisource Satellite Imagery in the Study of Irrigated Landscapes in Arid Climates. Remote Sensing, 16(11), 1997. https://doi.org/10.3390/rs16111997