Article

Ice Thickness Measurement and Volume Modeling of Muztagh Ata Glacier No.16, Eastern Pamir

1
State Key Laboratory of Cryosphere Science, Northwest Institute of Eco-Environment and Resources, Chinese Academy of Sciences, Lanzhou 730099, China
2
University of Chinese Academy of Sciences, Beijing 100049, China
3
College of Geography and Environmental Science, Northwest Normal University, Lanzhou 730070, China
4
College of Science, Shihezi University, Shihezi 832000, China
5
School of Geography, Geomatics and Planning, Jiangsu Normal University, Xuzhou 221116, China
*
Author to whom correspondence should be addressed.
Remote Sens. 2024, 16(11), 2009; https://doi.org/10.3390/rs16112009
Submission received: 7 April 2024 / Revised: 29 May 2024 / Accepted: 30 May 2024 / Published: 3 June 2024
(This article belongs to the Section Remote Sensing in Geology, Geomorphology and Hydrology)

Abstract

:
As a heavily glaciated region, the Eastern Pamir plays a crucial role in regional water supply. However, considerable ambiguity surrounds the distribution of glacier ice thickness and the details of ice volume. Accurate data at the local scale are largely insufficient. In this study, ground-penetrating radar (GPR) was applied to assess the ice thickness at Muztagh Glacier No.16 (MG16) in Muztagh Ata, Eastern Pamir, for the first time, detailing findings from four distinct profiles, bridging the gap in regional measurements. We utilized a total of five different methods based on basic shear stress, surface velocity, and mass conservation, aimed at accurately delineating the ice volume and distribution for MG16. Verification was conducted using measured data, and an aggregated model outcome provided a unified view of ice distribution. The different models showed good agreement with the measurements, but there were differences in the unmeasured areas. The composite findings indicated the maximum ice thickness of MG16 stands at 115.87 ± 4.55 m, with an ice volume calculated at 0.27 ± 0.04 km3. This result is relatively low compared to the findings of other studies, which lies in the fact that the GPR measurements somewhat constrain the model. However, the model parameters remain the primary source of uncertainty. The results from this study can be used to enhance water resource assessments for future glacier change models.

1. Introduction

Global warming has intensified glacier melt, impacting the sustainable development of regional water resources [1]. The thickness of the ice of a glacier determines its shape and size, influencing its movement, regulating water storage, and ultimately impacting the glacier’s lifespan in a shifting climate [2]. Therefore, understanding the distribution of ice thickness and glacier volume is crucial for evaluating long-term glacier changes [3], hydrological impacts [4], and sea level changes [5].
Various methods can be used to measure ice thickness, including radio echo sounding [6,7], drilling [8], seismic surveys [9], and gravity measurements [10,11,12,13]. Given the substantial electrical resistivity of glacier ice and the pronounced contrast in electromagnetic impedance between ice and bedrock, ground-penetrating radar (GPR) technology is frequently employed to assess ice thickness [14,15,16,17]. However, in situ observation measurements of glacier thickness are constrained by the significant costs of observation, challenging conditions, and the logistical difficulties in deploying staff and equipment [18]. Therefore, various methods have been devised to infer the volume of ice or its thickness distribution from the observable characteristics of a glacier’s surface. For estimating ice volume, widely used scaling methods are based on empirical volume–area relationships [19,20]. However, these methods come with a substantial level of uncertainty and fail to offer insights into the spatial variation in ice thickness [21]. It is essential to recognize that accurate ice thickness distribution is often more critical than precise ice volume information in predicting glacier evolution over the coming decades [22].
For the simulation of ice thickness distribution, numerous different models have emerged based on the fundamentals of ice flow dynamics and the shallow ice approximation assumption. Methods that have been proposed include capitalizing on the inverse relationship between the slope of the local surface and the thickness of the ice, i.e., assuming that ice thickness decreases with increasing slope (Glabtop) [23,24], or the method extended by Li et al. [25] to account for lateral resistance on valley walls. Alternatively, these approaches may incorporate supplemental data, such as information on surface velocity and mass balance [26,27,28,29,30,31], or employ iterative techniques using advanced forward models of ice flow [32], as well as non-physical strategies grounded in neural network methodologies [33].
However, estimates of ice thickness obtained from modeling are subject to large uncertainties unless calibrated against ground truth data [2]. Therefore, it is crucial to obtain more direct measurements of glacier thickness. The observational data used for validation in many studies mainly come from the Global Glacier Thickness Database (GlaThiDa v3). However, this database only covers approximately 2% of the world’s glaciers [34], which is insufficient. Meanwhile, the distribution of ice thickness observation data in different regions is uneven, and there are very few available ice thickness observations in many regions [35]. This leads to the calibration of the model for the entire mountain range based on only a few glaciers and then applying these calibration factors to all other glaciers, introducing uncertainty [30,31,36].
This is particularly true in the Eastern Pamir. It is a highly glaciated region with 1179 glaciers covering a total area of 2054 km2 [37], where measurement data are scarce, and the ice thickness distribution is highly uncertain. Numerous studies have analyzed the mass balance [38,39,40,41,42] and surface velocity of glaciers [37,43,44,45] in the Eastern Pamir because of the “Pamir–Karakoram anomaly” [46] and frequent glacier surges [47]. However, research on ice thickness distribution in this region is limited. It has only been considered in the context of global glacier research [22,30,48]. Therefore, in order to accurately assess the dynamic changes in glaciers in the Eastern Pamir and make reliable predictions for the future, it is essential to accurately evaluate the distribution of glacier ice thickness and ice volume.
In this study, GPR was employed to assess the ice thickness at Muztagh Glacier No.16 within Muztagh Ata, Eastern Pamir. Ice thickness data were derived from four profiles to mitigate the scarcity of regional ice thickness information. Five different models based on shear stress, surface velocity, and mass conservation principles were used to estimate the ice thickness across the glacier. The outcomes of these models were then refined and verified through comparison with actual ice thickness measurements, with an evaluation of model efficacy following. The optimal ice thickness distribution was achieved by employing a weighted average of the various model outputs, which was subsequently compared with two consensus predictions. This study undertook comparative evaluations of the models, delving into the models’ parameter uncertainties and sensitivities, and explored the implications of these ice thickness estimations on assessments of ice volume. These findings are instrumental in delineating the fundamental conditions of the Eastern Pamir glaciers, furnishing crucial data for the management of regional water resources and forecasting glacier evolution in the future.

2. Study Area

A portion of the Pamir Plateau, situated within China and referred to as the Eastern Pamir, is characterized by a highly developed glaciation, comprising 1179 glaciers that span an area of 2054 km2 [37]. Muztagh Ata (38.17°N, 75.06°E; 7546 m a.s.l), one of the highest mountains situated on the Eastern Pamir, is influenced by the mid-latitude westerlies, making it one of the driest glaciated regions in China [46]. Data collected by the Western Environment Integrated Observation and Research Station at Muztagh Ata (38.28°N, 75.24°E; 3650 m a.s.l) highlighted an average annual temperature of 0.34 °C, an average temperature of 10.06 °C during the summer months (June to August), and an average annual precipitation of 154.03 mm for the period between 2009 and 2016 [49]. The region hosts 128 glaciers, collectively spanning over 377 km2 [38,50]. These glaciers are essential in supplying meltwater to the Gez, Taxkorgan, and Kangxiwa rivers within the Tarim Basin, serving as significant and sustainable water resources critical for downstream water management and the consistency of river flows [50,51].
Muztagh Glacier No.16 (MG16), situated on the western flank of Muztagh Ata and depicted in Figure 1, remains free from debris cover. As of 2023, it occupies an area of 6.76 km2 and extends from an altitude of 4632 m to 7091 m a.s.l. The glacier’s mean equilibrium line altitude (ELA) is established at 5460 m a.s.l, and it has recorded an average annual mass balance of +0.14 m water equivalent over the years from 1999 to 2013 [50].

3. Data

3.1. GPR Data

During the summer of 2023, MG16 underwent surveying utilizing a Pulse EKKO-Pro radar system, characterized by a 100 MHz central frequency and a bistatic antenna setup. This survey covered three transverse and one longitudinal profile, encompassing 280 discrete points situated between altitudes of 4661 and 4838 m a.s.l.
The arrangement for capturing GPR profiles involved maintaining the transmitter and receiver at a constant separation of 4 m, aligned parallel to each other yet orthogonal to the profiling direction [52]. The subsequent 2D radar imagery was used for the determination of ice thickness at various points through the analysis of the radar wave’s two-way travel time along the vertical axis. For mountain glaciers, the velocity at which electromagnetic waves from radar travel through glacier ice typically spans between 0.167 m/ns and 0.171 m/ns [17,52]. Based on field tests in this study, the speed was determined to be 0.169 m/ns. The total error for a 100 m ice thickness is estimated to be 5.8 m for the EKKO-Pro radar system. This calculation encompasses several components: the radar’s vertical resolution (equated to roughly one-fourth of the wavelength), inaccuracies in pinpointing the ice–bedrock interface reflections (about 2 ns), and discrepancies due to wave velocity changes (±5%) [7,53].

3.2. Glacier Outline

In order to minimize the uncertainty caused by the temporal misalignment of glacier outlines, we selected Landsat 9 OLI/TIRS images (spatial resolution: 30.00 m) that were free of clouds and had minimal snow cover during the 2023 ablation season. We delineated the boundary of the 2023 MZ 16 glacier through visual interpretation and referencing RGI 6.0, GF-6 satellite images (spatial resolution: 2.00 m), and Google Earth images. The Landsat 9 OLI/TIRS image was acquired on 18 September 2023 and is available at https://earthexplorer.usgs.gov/ (last access: 6 December 2023). The GF-6 satellite image was acquired on 29 September 2019.

3.3. DEM

In addressing the limitations imposed by DEM data quality on ice thickness inversion methodologies, this investigation integrates the ALOS World 3D—30 m (AW3D30) dataset as its primary input, following the insights provided by Chen et al. on the variability of ice thickness simulations influenced by distinct DEMs [54]. The AW3D30 digital surface model (DSM) dataset, which is acquired by the PRISM stereo camera mounted on the Advanced Land Observing Satellite (ALOS), boasts a horizontal resolution of about 30 m and maintains an elevation precision surpassing 5 m [55]. Access to this dataset is facilitated through the portal at https://www.eorc.jaxa.jp/ALOS/en/dataset/aw3d30/aw3d30_e.htm (last access: 6 December 2023).

3.4. Glacier Velocities

Glacier surface velocity data were derived from the work of Millan et al. [22], showcasing an advanced high-resolution survey of global glacier velocities through the analysis of imagery captured by Landsat 8, Sentinel-2, Venµs, and Sentinel-1 between 2017 and 2018. The original spatial resolution of this surface velocity data, set at 50 m, was resampled to 30 m in this study to simplify computational processes. The precision of these measurements is noted to be approximately 10 m/a [22]. It was resampled to 30 m for ease of calculation in this study. According to the data, the maximum velocity of MG16 is 57 m/a, located at its northern tributary. Data were available at https://doi.org/10.6096/1007 (last access: 6 December 2023).

4. Method

4.1. Ice Thickness Inversion Models

4.1.1. Shear Stress-Based Approaches

Utilizing the shallow ice approximation and adopting the concept of perfect plasticity [56,57], one can estimate glacier ice thickness through the analysis of surface slope and a presumed uniform shear; thus, the ice thickness h along the glacier’s centerline can be formulated as follows:
h = τ b f ρ g sin α
where τb denotes the basal shear stress, f represents a shape factor to account for the lateral drag at the glacier’s edges, ρ is the ice density, g symbolizes the acceleration due to gravity, and α indicates the surface slope. The inclusion of f compensates for the narrowness of alpine glaciers, where the valley walls bear a portion of the glacier’s weight, reducing the basal shear stress along the central flowline compared to that of a much broader channel [25]. As the ratio of the glacier’s half-width to its centerline ice thickness nears infinity, f tends toward 1, though valley glaciers commonly exhibit a value around 0.8 [25,56,58].
The determination of τb is possible through its empirical correlation with the altitude variance, Δz, between the glacier’s highest and lowest points, as demonstrated below [59]:
τ b = 0.5 + 159.8 Δ z 43.5 Δ z 2 Δ z 1.6 km 150 Δ z > 1.6 km
Δz is in km, with τb measured in kPa.
Two such approaches were used in this study.
  • Li et al.’s approach
Li et al. [25] developed this approach that is also based on Equation (1), which employs a more physically plausible approach for calibrating f in relation to the glacier’s local width. By presuming a parabolic cross-section, f can be determined through the equation below:
f = 1 1 1 + m w h
m = 0.9, with w representing the half-width on the centerline. By integrating Equations (1) and (3) and resolving for h, we derive Equation (4), which incorporates the effect of lateral friction:
h = m w τ b ρ g sin α m w τ b ρ g sin α
Typically, the width is ascertained by where a line perpendicular to the centerline intersects the glacier outline. The centerline was extracted and manually corrected using the method proposed by Zhang et al. [60] during the final processing. For tributary centerlines, their controlled areas need to be delineated. Equation (4) is sensitive to the half-width; thus, a slope threshold αlim is introduced, and the effective width is adjusted to correct for the error caused by the overestimated ice thickness on the valley wall calculated using the original half-width. The width of the local glacier reduced to a dimension where the slope of the ice surface remains below the threshold of αlim. In this study, αlim was set at 30°, as in most studies [25,31]. Meanwhile, ice thickness is affected by surface slope, with potential overestimation in flat glacier regions. To compensate for this, a minimum slope threshold (α0) of 4° was set in this study. The ice thicknesses estimated on the centerline and perpendicular line, with a set value of 0 for ice thickness on the glacier outline, were used for interpolating across the total glacier area.
  • Glabtop2
Frey et al. [21] developed Glabtop2, utilizing a similar principle that streamlines the ice thickness estimation procedure. This approach is fully grid-based and determines the ice thickness for a collection of randomly chosen grid cells, eliminating the necessity to delineate the centerline. The calculated thicknesses are then interpolated over the whole area of the glacier.

4.1.2. Ice Velocity-Based Approaches

Glacier motion encompasses internal deformation, basal sliding, and the deformation of the subglacial sediment. The velocities at the ice surface, denoted as u(h), are a sum of the velocities from internal deformation (ud) and the basal movement (ub) [12,56,61].
u ( h ) = u d ( h ) + u b
Equation (5) is simplified by including a correction factor β, which accounts for the basal velocity ub and signifies the fraction of glacier movement due to basal sliding [62]. Consequently, by correlating internal deformation with glacier surface speed and employing the Glen flow law, a closed-form equation that connects observed ice velocity to ice thickness can be established [56,63]:
( 1 β ) u ( h ) = u d ( h ) = 2 A n + 1 τ b n h
where τb represents the basal shear stress, A denotes the Arrhenius creep constant, and n, typically set to 3, is Glen’s flow exponent [56,58,64]. The value of the Arrhenius creep constant is influenced by temperature:
A = A * exp Q c R 1 T 1 T *
The constants are defined as A* = 2.4 × 10⁻²⁴, Qc = 115 kJ mol−1, R ≈ 0.0083145 (the ideal gas constant), and T* = 273 K [56]. T symbolizes the average temperature of the glacier’s ice, which can be estimated by the mean annual air temperature at the ELA with a difference of ΔTice-air = 7 °C [30,56]. Equations (1), (6) and (7) are combined to solve for ice thickness:
h = n + 1 2 ( f ρ g ) n A * exp Q c R 1 T 1 T * 1 / ( n + 1 ) u ( h ) ( 1 β ) sin ( α ) n 1 / ( n + 1 )
Two such approaches were used in this study.
  • VWDV
Van Wyk de Vries et al. [61] developed this approach, solving Equation (8) by analyzing the ice surface’s velocity and slope in two dimensions at every point.
  • ITIBOV
ITIBOV was developed by Gantayat et al. [29] and segments the glacier into elevation bands of 100 m, calculating the average ice surface flow velocity and topographical slope for each band. Then, Equation (8) is used to calculate ice thickness.

4.1.3. Mass Conserving Approach

When considering ice as an incompressible medium, the continuum equation dictates that divergence in ice flux ( q ) must be offset by changes in ice thickness over time (∂h/∂t) along with the rate of the surface mass balance of the glacier ( b ˙ ) [31]:
h t = b ˙ q
Upon integrating this principle across the entire glacier domain (Ω), the following becomes evident:
Ω h t d Ω = Ω b ˙ d Ω
To ensure the net divergence of glacier-wide ice flux equals zero, the apparent mass balance ( b ˜ ) [30,31] is discerned as the differential between the rate of glacier surface mass balance ( b ˙ ) and the rate of change in glacier surface elevation (∂h/∂t).
Ω b ˜ d Ω = 0
The apparent mass balance, for each grid cell, is computed utilizing the following equation:
b ˜ i = ( z i z 0 ) d b ˜ d z a b l z i z 0 ( z i z 0 ) d b ˜ d z a c c z i > z 0
The ablation and accumulation areas feature distinct vertical mass balance gradients, represented as d b ˜ / d z a b l and d b ˜ / d z a c c for ablation and accumulation zones, respectively [30,31]. The cell’s elevation (zi) and the elevation at the ELA (z0), determined by resolving Equation (10) for z0 as indicated in Equation (11), ensure a balanced glacier-wide apparent mass balance. Following this, the glacier’s width-normalized mean specific ice flux ( q ¯ i ) is computed by integrating apparent mass balance values upstream ( b ˜ ) and dividing by the glacier’s width. The ice thickness is then calculated as follows:
h = n + 2 2 ( f ρ g ) n A * exp Q c R 1 T 1 T * 1 / ( n + 2 ) q ¯ i ( 1 β ) sin ( α ) n 1 / ( n + 2 )
Leveraging a composite approach from multiple models has been shown to enhance the accuracy of ice thickness estimations [2,65]. In this study, the ensemble ice thickness (ES) was determined through a synthesis of outputs derived from five distinct models, employing respective weights (w1, w2, w3, w4, and w5), with the collective sum of these weights equating to 1. To calibrate and validate this method, 70% of the GPR measurements were utilized for calibration purposes, while the remaining 30% served for validation. The allocation of weights underwent iterative adjustments to minimize the mean absolute error (MAE) between the calibration dataset and the model’s output. Subsequently, the MAE between the ES and the validation dataset was computed, providing a refined measure of the model’s predictive accuracy in estimating ice thickness.

4.2. Ice Thickness Model Calibration and Validation

This study utilized a Monte Carlo approach, conducting 10,000 iterations for each analytical model [61]. The process involved random selection from the probability distributions assigned to each input parameter (Table 1). For every iteration, a subset comprising 70% of the GPR dataset was utilized as the training set. The mean absolute error (MAE) was then calculated across all GPR observations to assess each iteration’s accuracy. The selection criteria for the output relied on identifying the model iteration that demonstrated the lowest MAE. Further, to achieve a holistic accuracy assessment of the five models in their simulation of ice thickness, five additional accuracy metrics were employed: Root-Mean-Square Error (RMSE), Standard Deviation (STD), Relative Error (RE), Nash–Sutcliffe Efficiency (NSE), and R2, with their respective formulas provided for clarity [10,54].
M A E = i = 1 n | h G P R h | n
R M S E = i = 1 n ( h G P R h ) 2 n
S T D = i = 1 n h G P R h 1 n i = 1 n ( h G P R h ) 2 n 1
N S E = 1 i = 1 n ( h G P R h ) 2 i = 1 n h G P R 1 n i = 1 n h G P R 2
R E = h G P R h h G P R
R 2 = i = 1 n ( h G P R h ) 2 i = 1 n h G P R 1 n i = 1 n h G P R 2

4.3. Uncertainty of the Ice Volume Estimate

Similar to the study by Huss et al. [30], we primarily assessed the uncertainties stemming from model parameters, DEMs, and glacier contours. For model parameters, we conducted a series of sensitivity experiments to quantify the bias resulting from parameter uncertainty. We selected the maximum and minimum values within each parameter range for simulation. Assuming that the uncertainty of each parameter σ p is independent, the ice volume uncertainty due to all parameters is propagated through the error as σ M = i = 1 a σ p , i 2 , and a is the number of parameters. Uncertainties in DEMs ( σ D E M ) and glacier contours ( σ I ) are evaluated by analyzing ice volume deviations generated by simulations of DEMs or contours at different time periods. The overall uncertainty is as follows:
σ = σ M 2 + σ D E M 2 + σ I 2

5. Results

5.1. Characteristics of Ice Thickness along Transverse and Longitudinal Profiles
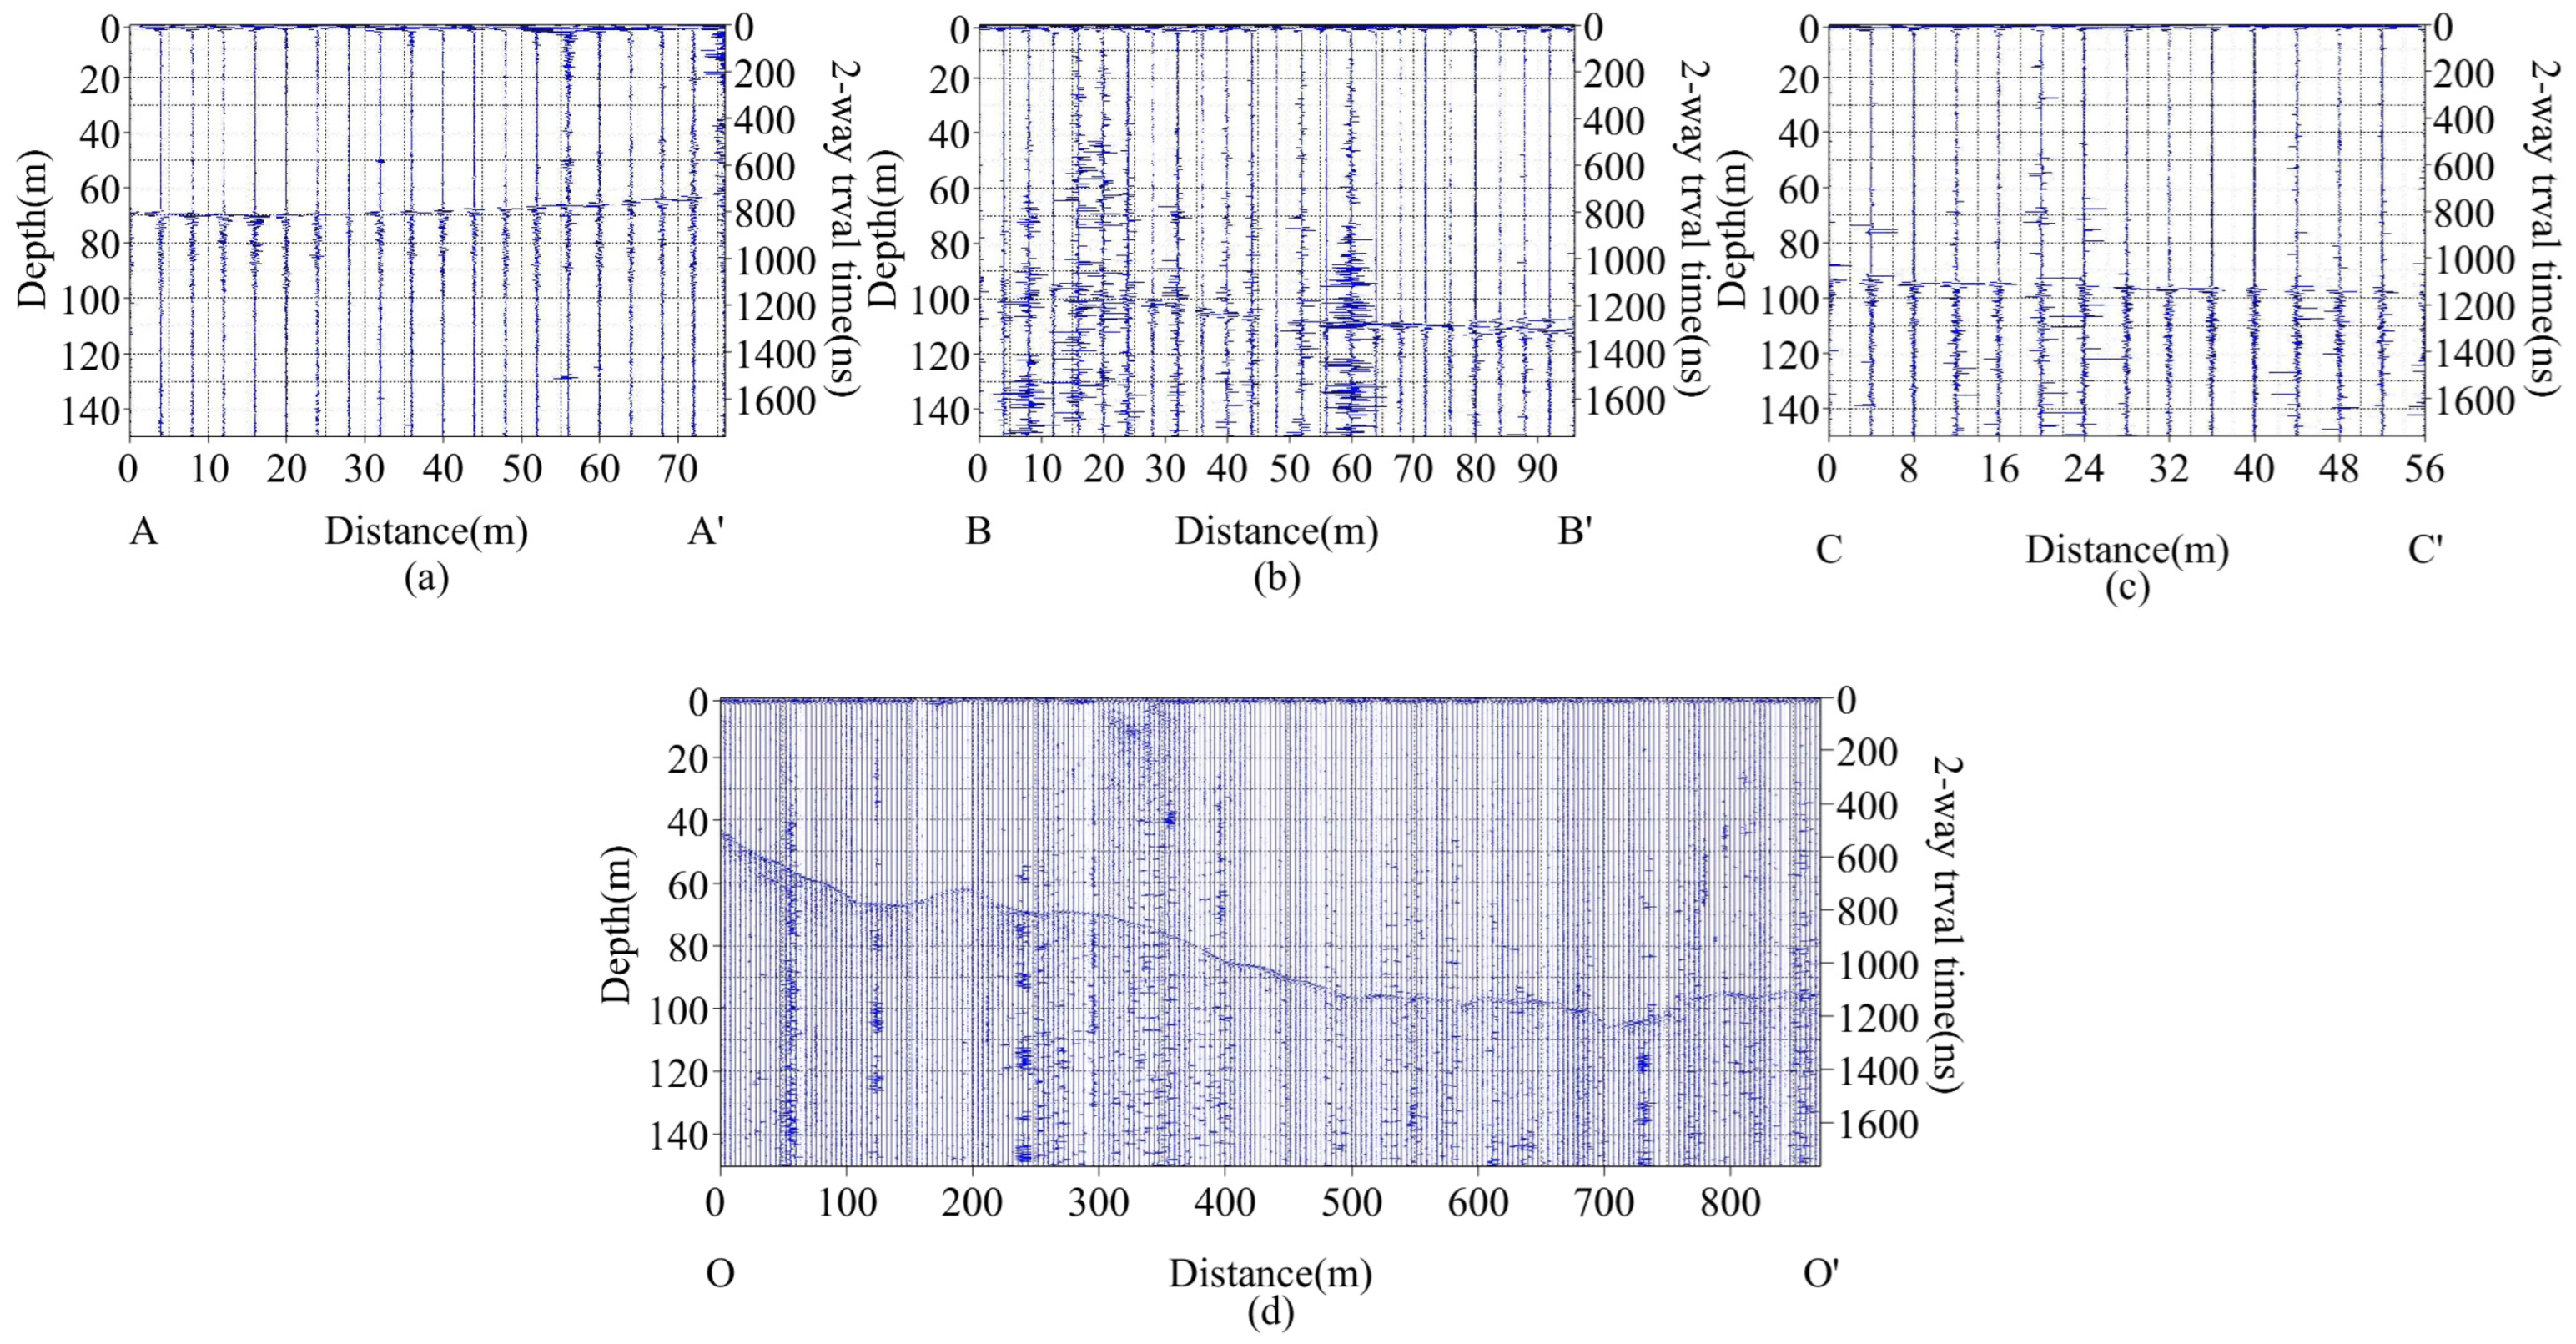
In Figure 2, the calibrated elevation radargrams of MG16 are presented, illustrating the glacier’s surface elevation changes and the variability in ice thickness across transverse and longitudinal profiles. The analysis of basal reflections is prominently clear in profiles A-A′ (Figure 2a), B-B′ (Figure 2b), and C-C′ (Figure 2c), with measurements predominantly conducted near the profile centers. The length of these measurements was constrained, resulting in a relatively consistent ice thickness and a comparably level glacier bedrock across these sections. Notably, the ice exhibited increased thickness towards the center of the profiles compared to their edges. Through the examination of these profiles, the average ice thickness was estimated to be approximately 88.76 m, with the thickest ice measurement, approximately 109.87 m, located at the center of profile B-B′. Profile A-A′ displayed a relatively flat basal topography with a thinner ice overlay, peaking at 68.86 m, likely indicating its position near the glacier’s terminus. Conversely, profile B-B′ illustrated a bedrock slope converging towards the center, and profile C-C′, situated at higher elevations, showed diminished ice thickness, reflective of underlying bedrock undulations.
Figure 2. Processed radargrams showing profiles (a) A-A′, (b) B-B′, (c) C-C′, and (d) O-O′ of MG16. The horizontal axis represents the distance from the initial point of the GPR survey. Each panel in the figure displays glacier ice thickness on the left vertical axis and the two-way travel time of the electromagnetic radar wave on the right vertical axis.
Remotesensing 16 02009 g002
Moreover, Figure 2d depicts the radargram for the longitudinal profile O-O′, tracking ice thickness variations along the glacier’s flow from its terminus to an elevation around 4831 m a.s.l. The mean ice thickness was determined to be 77 m. Upon closer inspection, the basal topography within this longitudinal section appeared predominantly flat, albeit with minor undulations. The section’s maximum ice thickness was recorded at elevations exceeding 4790 m a.s.l.

5.2. Spatial Distribution of Simulated Ice Thickness and Ice Volume

The ice thickness distributions of MG16 are presented in Figure 3, comparing outcomes derived from five different methods and a multi-model ensemble. The data distinctly exhibit significant differences in the calculated ice thickness across these methods. Predominantly, the most considerable ice thickness for MG16 is found within its lower and middle segments, especially at the confluence of its two tributaries, with elevation levels spanning from 4800 to 5100 m a.s.l.
Li’s approach demonstrates the largest simulated ice thickness of 141.39 m, with high values concentrated on the glacier centerline. However, it also shows the lowest mean ice thickness of 53.32 m, indicating that Li’s approach is more susceptible to extremes in estimating ice thickness compared to other methods [10,67]. In contrast, the velocity-based VWDV method presents a significantly higher estimated mean ice thickness of 73.31 m. Given its reliance solely on distributed velocity data encompassing the glacier’s entirety, the method affords a more nuanced portrayal of thickness distribution across various regions, thereby offering a comprehensive overview of the spatial variation in ice thickness. The mean and maximum ice thickness of ITIBOV and HF simulations are similar, but HF simulations provide more detailed information. The Glabtop2 method demonstrates relatively poor performance compared to other models in the area. It shows a lower overall range of ice thickness and less noticeable changes in thinning at the glacier terminus. The ES shows a maximum ice thickness of 115.87 m and a mean ice thickness of 59.8 m.
From the estimated volume, there is a clear difference between the results obtained using different methods (Table 2). Two shear stress-based approaches yield relatively low estimates: Glabtop2 estimates the smallest volume at 0.17 km3, while Li’s approach results in 0.25 km3. In contrast, the other three methods estimate the volume to be around 0.40 km3, with the VWDW method estimating the largest volume at 0.45 km3. Typically, the volume and area distributions exhibit a similar pattern. Overall, about 45% of the ice is stored in the ablation zone below the ELA, which accounts for 35% of the area (Figure 4). The two velocity-based approaches show a greater volume distribution in the lower part of the glacier and relatively less in the high-altitude region. This difference is also significant in the ice thickness distribution results. Conversely, the other approaches exhibit one of the regions with high ice thickness in the upper part of the glacier, a feature not evident in the VWDV and ITIBOV results. This disparity can be attributed to the characteristics of the raw velocity data distribution.

5.3. Accuracy of Estimated Ice Thickness

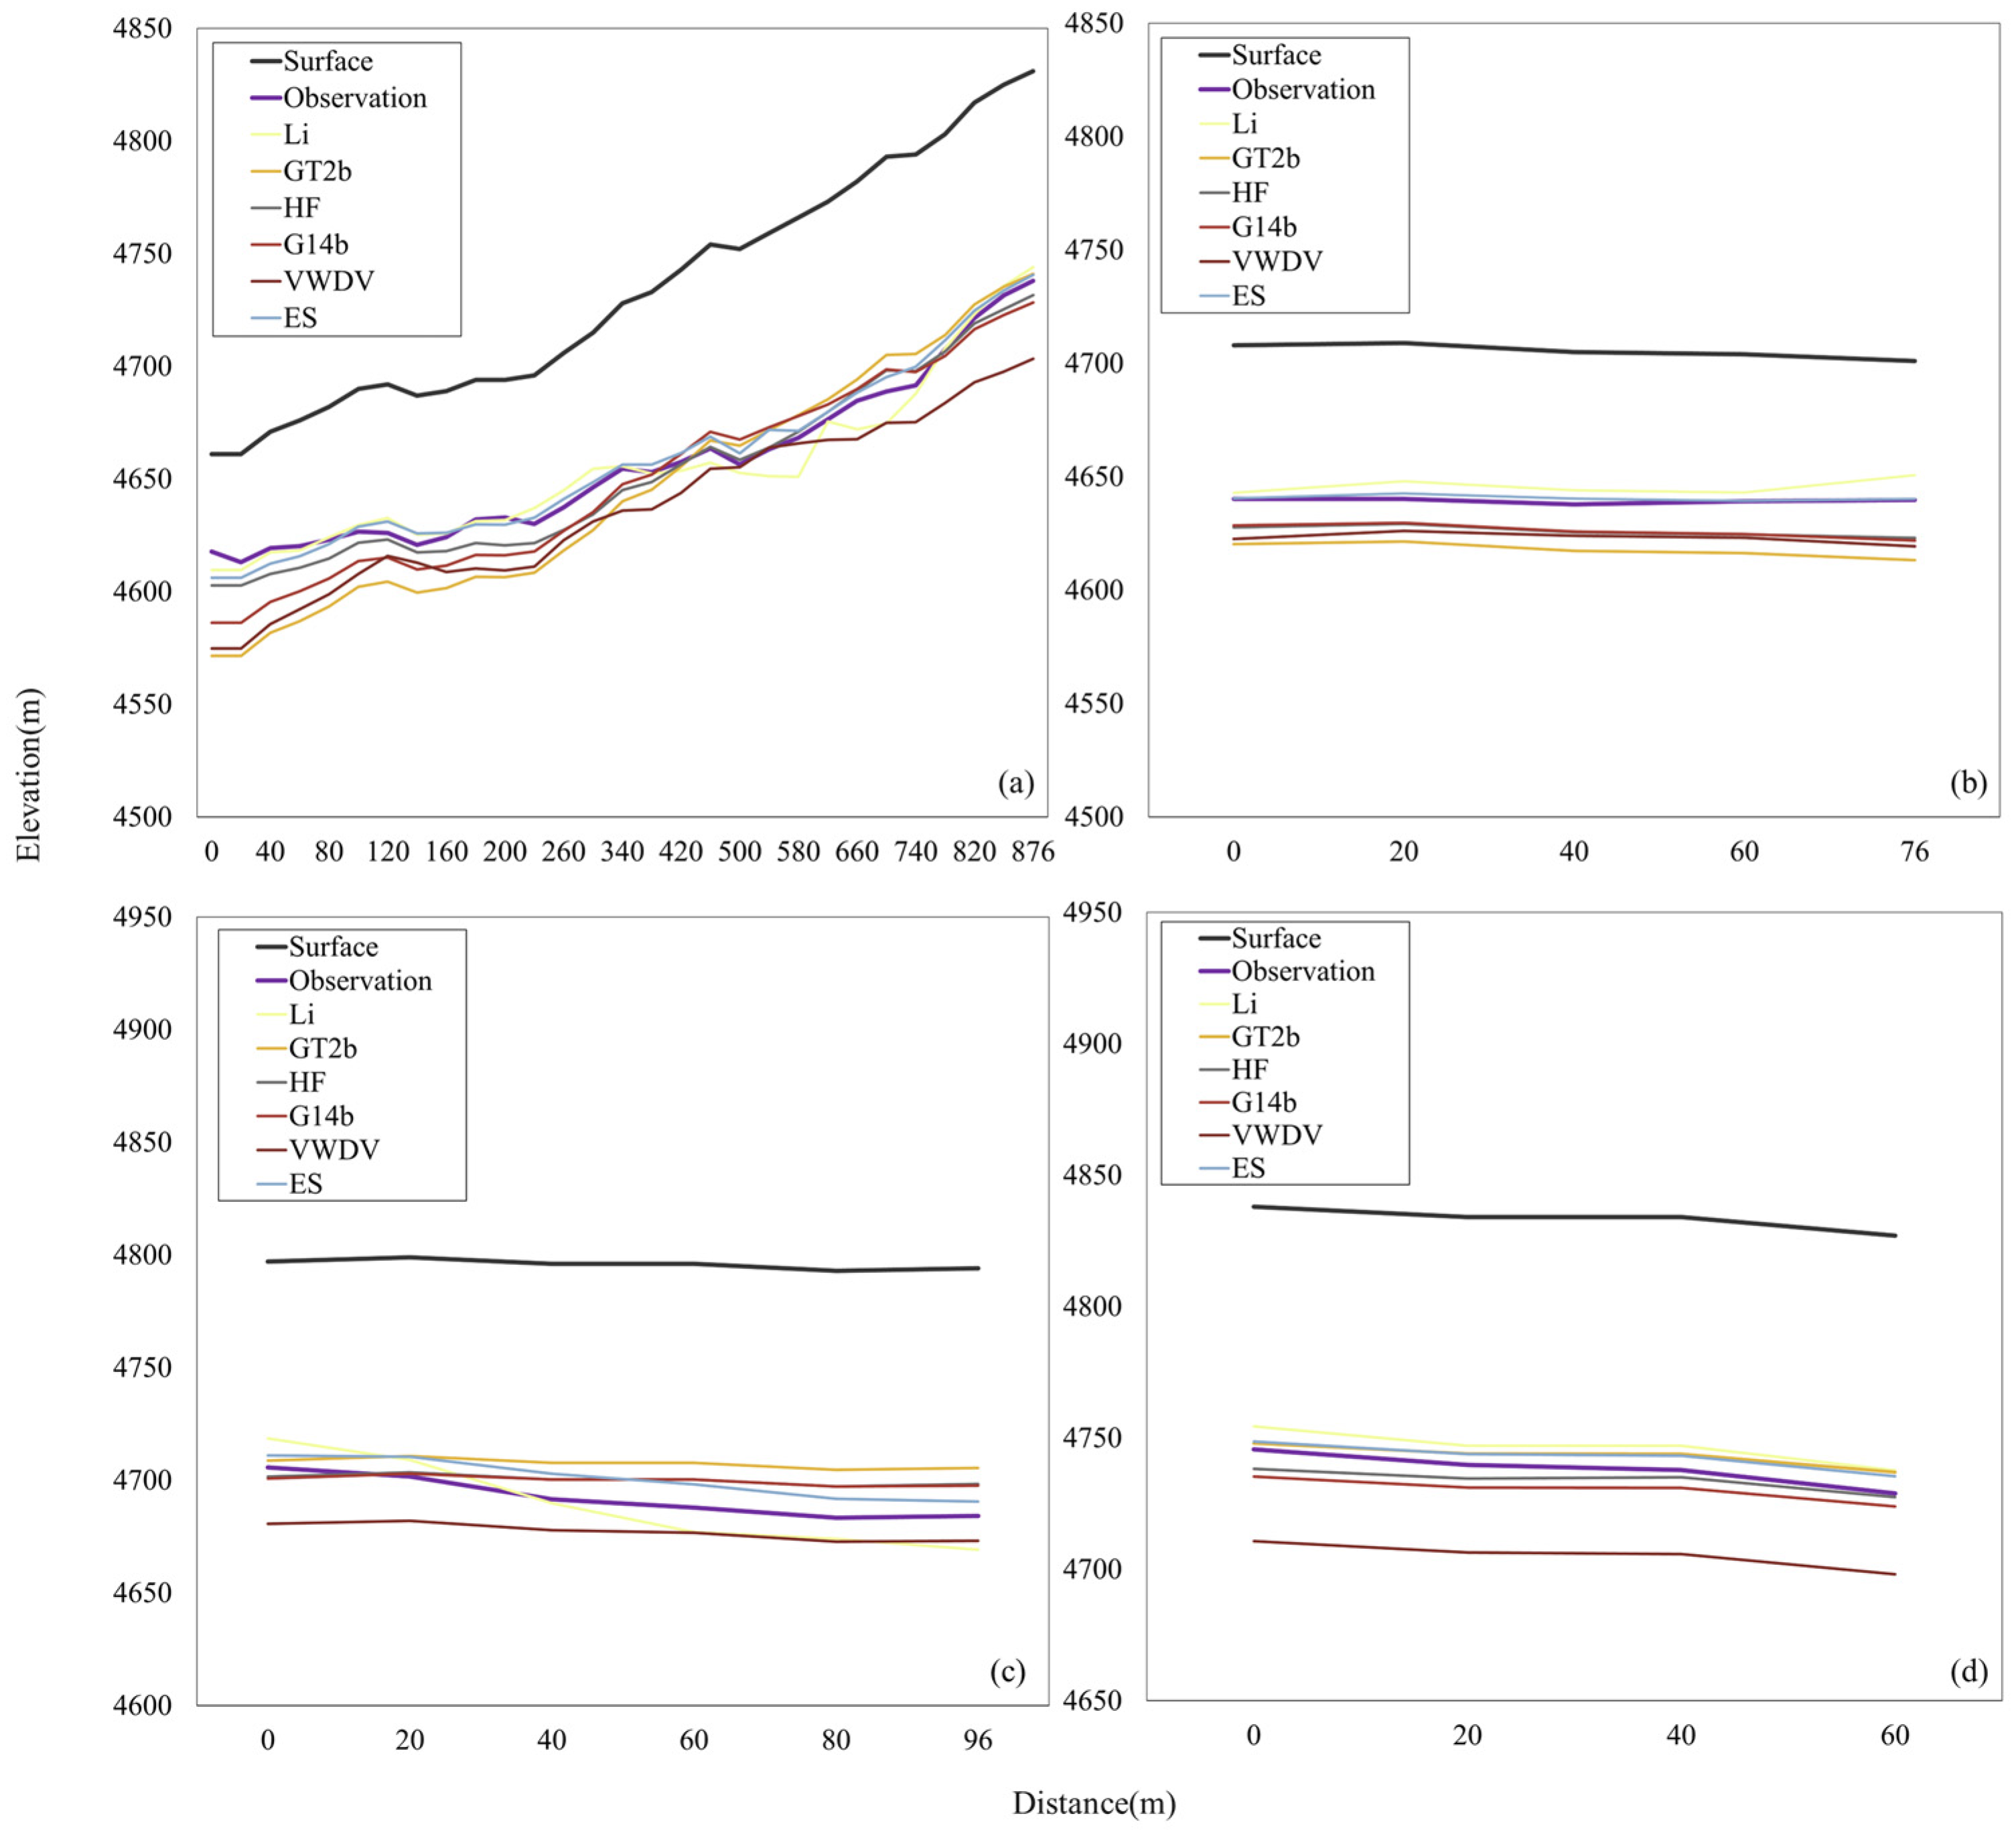
The simulation accuracy of the various models has been assessed based on GPR measurements. In the O-O′ profile, all models exhibit similar trends to the GPR measurements (Figure 5a). However, most methods demonstrate varying degrees of overestimation of ice thickness thinning at the glacier’s end. Li’s approach shows a slight deviation from the GPR measurements, with two deepening points in the upper part, possibly attributed to variations in the slope data. The HF method performs the best in this profile, showing a smaller deviation from the GPR measurements. Glabtop2 exhibits a trend more consistent with ITIBOV, albeit slightly underestimating in the upper part and significantly overestimating in the lower part compared to the GPR measurements. On the three transverse profiles, all methods overestimate the ice thickness values in A-A′, which is situated in the lower part of MG16, except for Li’s approach (Figure 5b). In B-B′ (Figure 5c), Li’s approach has a steeper slope with larger magnitude deviations compared to the GPR measurements, whereas the other methods show flatter results. This is potentially attributed to the specific assumptions of Li’s approach regarding the shape of the transects. The VWDV method overestimates ice thickness on all transverse profiles, and only the general trend aligns with the GPR measurements; its difference in the C-C′ profile is the most significant among all methods (Figure 5d). The overall comparison with the GPR measurements in Figure 6 shows that most of the modeled results are comparable to the GPR measurements. However, it is worth noting that the correlation between the results of Glabtop2 and the measured data is poor, with very small variations, as the values essentially remain around 90 m.
The results of Li’s approach, Glabtop2, HF, ITIBOV, and VWDV were evaluated using several metrics. The metrics used include the MAE, RMSE, STD, R2, NSE, and RE. The values of the metrics for each model are shown in Table 3. Among all the metrics, Li’s approach shows more consistency with the GPR measurements in glacier thickness estimation compared to other models. The MAE and RMSE are smaller at 6.11 m and 7.49 m, respectively. The HF model also performs well, with an R2 value similar to Li’s approach at 0.89. The R2 values of ITIBOV and VWDV are close to 0.72, but both models tend to significantly overestimate the ice thickness. However, VWDV has a larger error. The results of Glabtop2, although mostly comparable to VWDV and ITIBOV and partially even better than the two velocity-based models, have lower R2 values. Therefore, the reliability of the results is questionable.

6. Discussion

6.1. Comparison with Previous Research

Previous studies on glaciers in Muztagh Ata have primarily overlooked the distribution of ice thickness and the ice volume, with limited datasets and especially measurement data available for comparison. Thus, this study compares modeling results with ice thickness distribution and volume data estimated by Farinotti et al. [48] (F19) and Millan et al. [22] (M22), respectively. The ice volumes estimated using volume–area scaling and the OGGM [26] are also used for comparison. We primarily compared the ES with other datasets because it exhibits the least deviation from the measured GPR data.
Figure 7 shows the difference in ice thickness distribution between the ES, F19, and M22. The results show a significant difference in the distribution of ice thickness between the ES and F19 and M22. The overall mean difference between the ES and F19 is around 13.36 m. In comparison to F19, the ice thickness in the ablation zone of the ES is slightly higher, while in the accumulation zone, it is relatively lower. The velocity data used in this study are consistent with those used in M22. When compared to the velocity-based VWDV and ITIBOV results in this study, there is a significant numerical difference in the generally thicker ice thicknesses estimated by M22, although the basic characteristics are more similar. There is a mean difference of 25.19 m in between M22 and ES, with the most pronounced difference in the ablation zone, where the ice thickness value is much larger than the ES estimates, with a maximum difference of 89.72 m. Only in the glacier margins, with a small part of the accumulation area, is the ice thickness slightly smaller than that estimated by the ES. Compared with the GPR data, F19 shows a small overall bias and slightly underestimates the ice thickness values. However, this bias is reasonable, given the potential time mismatch with glacier movement. M22, on the other hand, exhibits a larger bias. Velocity-based methods typically depend on velocity data, and a tenfold increase in glacier surface flow velocity will lead to an overestimation of ice thickness by more than 75% [22]. It has been demonstrated that the bias in ice thickness estimated by M22 significantly rises at surface velocities exceeding 50 m/a [10]. Notably, there is a substantial portion of MG16 velocities that are greater than or close to 50 m/a [22]. The bias of VWDV in the current study is smaller than that of M22, primarily because of the inclusion of measured data to constrain the model and increase the number of parameters. This allows for adjusting the sliding parameter and creep parameter to reach the appropriate value instead of using the average value of the nearest region.
In terms of estimated ice volume, as shown in Table 4, the ice volume estimated by the ES is close to the ice volume estimated by the OGGM (0.27 km3) but is 20.66% lower than F19 and 31.83% lower than M22. Compared to estimates based on volume–area scaling approaches, the ES result is 34.47% lower than the relationship V = 0.034 A1.375 proposed by Radić et al. [68] and 39.52% lower than the relationship V = 0.043 A1.29 proposed by Grinsted [19]. This is very close to the range of differences found in most studies. In particular, for larger glaciers, the results of volume–area scaling approach estimation typically yield higher estimates. However, some studies have pointed out that this type of locally varying regression parameter may only apply to larger glacier groups with accurate profiles and not to individual glaciers [20]. Some studies have reported uncertainties of around 50–60% [19,69].
The differences in the volumes obtained by the five methods used to construct the ES can also reach 30%. Although the ES results are small in comparison with the results of all the other studies mentioned above, the HF, ITIBOV, and VWDV results are indeed closer to them. We believe there are several reasons why the ES ice volume is lower. First, the weights of Li’s approach and HF are relatively large in the ES. For models based on the glacier centerline and cross-sectional shape, GPR data with insufficient coverage due to glacier surface topography may affect the determination of the cross-sectional shape to some extent. It is roughly estimated that the difference in ice volume due to different cross-sectional shapes can be at least 20%. Secondly, there is a lack of verification data in the upper glacier accumulation area. The GPR measurements were primarily conducted on parts of the glacier that were devoid of crevasses, flat, and consequently thicker, indicative of compressive flow dynamics [7]. The precise ice thickness distribution within these areas remains undetermined, making the precision of each model’s estimations for this segment uncertain. Should the models’ outputs align closely with the GPR data from the ablation zone, the variance in ice volume could also be attributed to differences in the ice thickness distribution within the accumulation zone. Additionally, the accuracy of the ice thickness inversion models is highly dependent on the assumptions made regarding model parameters, particularly those pertaining to ice flow dynamics [35]. Although the model parameters have been optimized to some extent, there is still room for optimizing certain parameters, such as basal shear stress. Most current studies have questioned the upper limit of 150 kPa set by Linsbauer et al. [24] based on empirical values [70]. However, the value of the basal shear stress parameter is impacted by elements like climate and topography [67]. Therefore, a parameterization scheme that takes these factors into account may be a better choice, such as allowing for the assigned yield stress to vary (increase or decrease) towards certain regions [71].
The acquisition of more precise data will undoubtedly enhance the model significantly. Although the results of this study are supported by GPR data, it is an undeniable fact that the coverage of GPR data is limited due to the characteristics of the topography. Locations in a distant area and topographical limitations are the primary obstacles that hinder the acquisition of measured data on most glaciers. Compared to the more labor-intensive and costly drilling method and resolution-limited seismic surveys and gravity measurements, GPR’s high resolution and deployability make it the most easily promotable method for measuring ice thickness [72,73]. Advancements in airborne radar technology could open up possibilities for augmenting observational data in hard-to-reach areas [74]. However, it is important to note that GPR measurements can experience significant signal attenuation in temperate glaciers with high water content and in areas with thick ice, limiting its depth of investigation and potentially introducing some uncertainties [72]. Moreover, a synergistic approach, blending a 3D high-order numerical model with a 1D streamline model, might offer a more refined methodology for capturing the ice thickness and volume attributes of individual glaciers [18]. The 3D model, by accounting for additional variables like ice movement and temperature, can provide a detailed physical representation of the target glacier, when integrated with remote sensing information (such as adjusted basal sliding velocities of glaciers and derived ice temperatures), which may reduce inaccuracies associated with the basic ice approximation principle [12,20,35].

6.2. Uncertainty and Sensitivity

The precision of calculations concerning ice thickness and volume is influenced by (1) the variability and assumptions in model parameters and simplifications, (2) inaccuracies in the DEM, and (3) uncertainties in defining glacier margins. Evaluating the variability within each model’s parameters is crucial for understanding the uncertainty in simulation outcomes across different models. The impact of various assumptions and parameter settings on simulation results is significant. A comprehensive sensitivity analysis was performed on the parameters used for simulating ice thickness, aiming to identify potential deviations in ice volume estimates due to uncertainties in these parameters. Each parameter within the model was altered individually, staying within plausible bounds, to measure their effect on the results.
Maintaining the mean value for all parameters except those selected for variation, we assessed the impact on the ice volume by altering each of the seven critical parameters individually within the specified range (Table 1). Given the diversity in parameters employed across different models, the degree of sensitivity to each parameter is model-specific. Consequently, the response of model outcomes to parameters excluded from a model’s framework is 0.
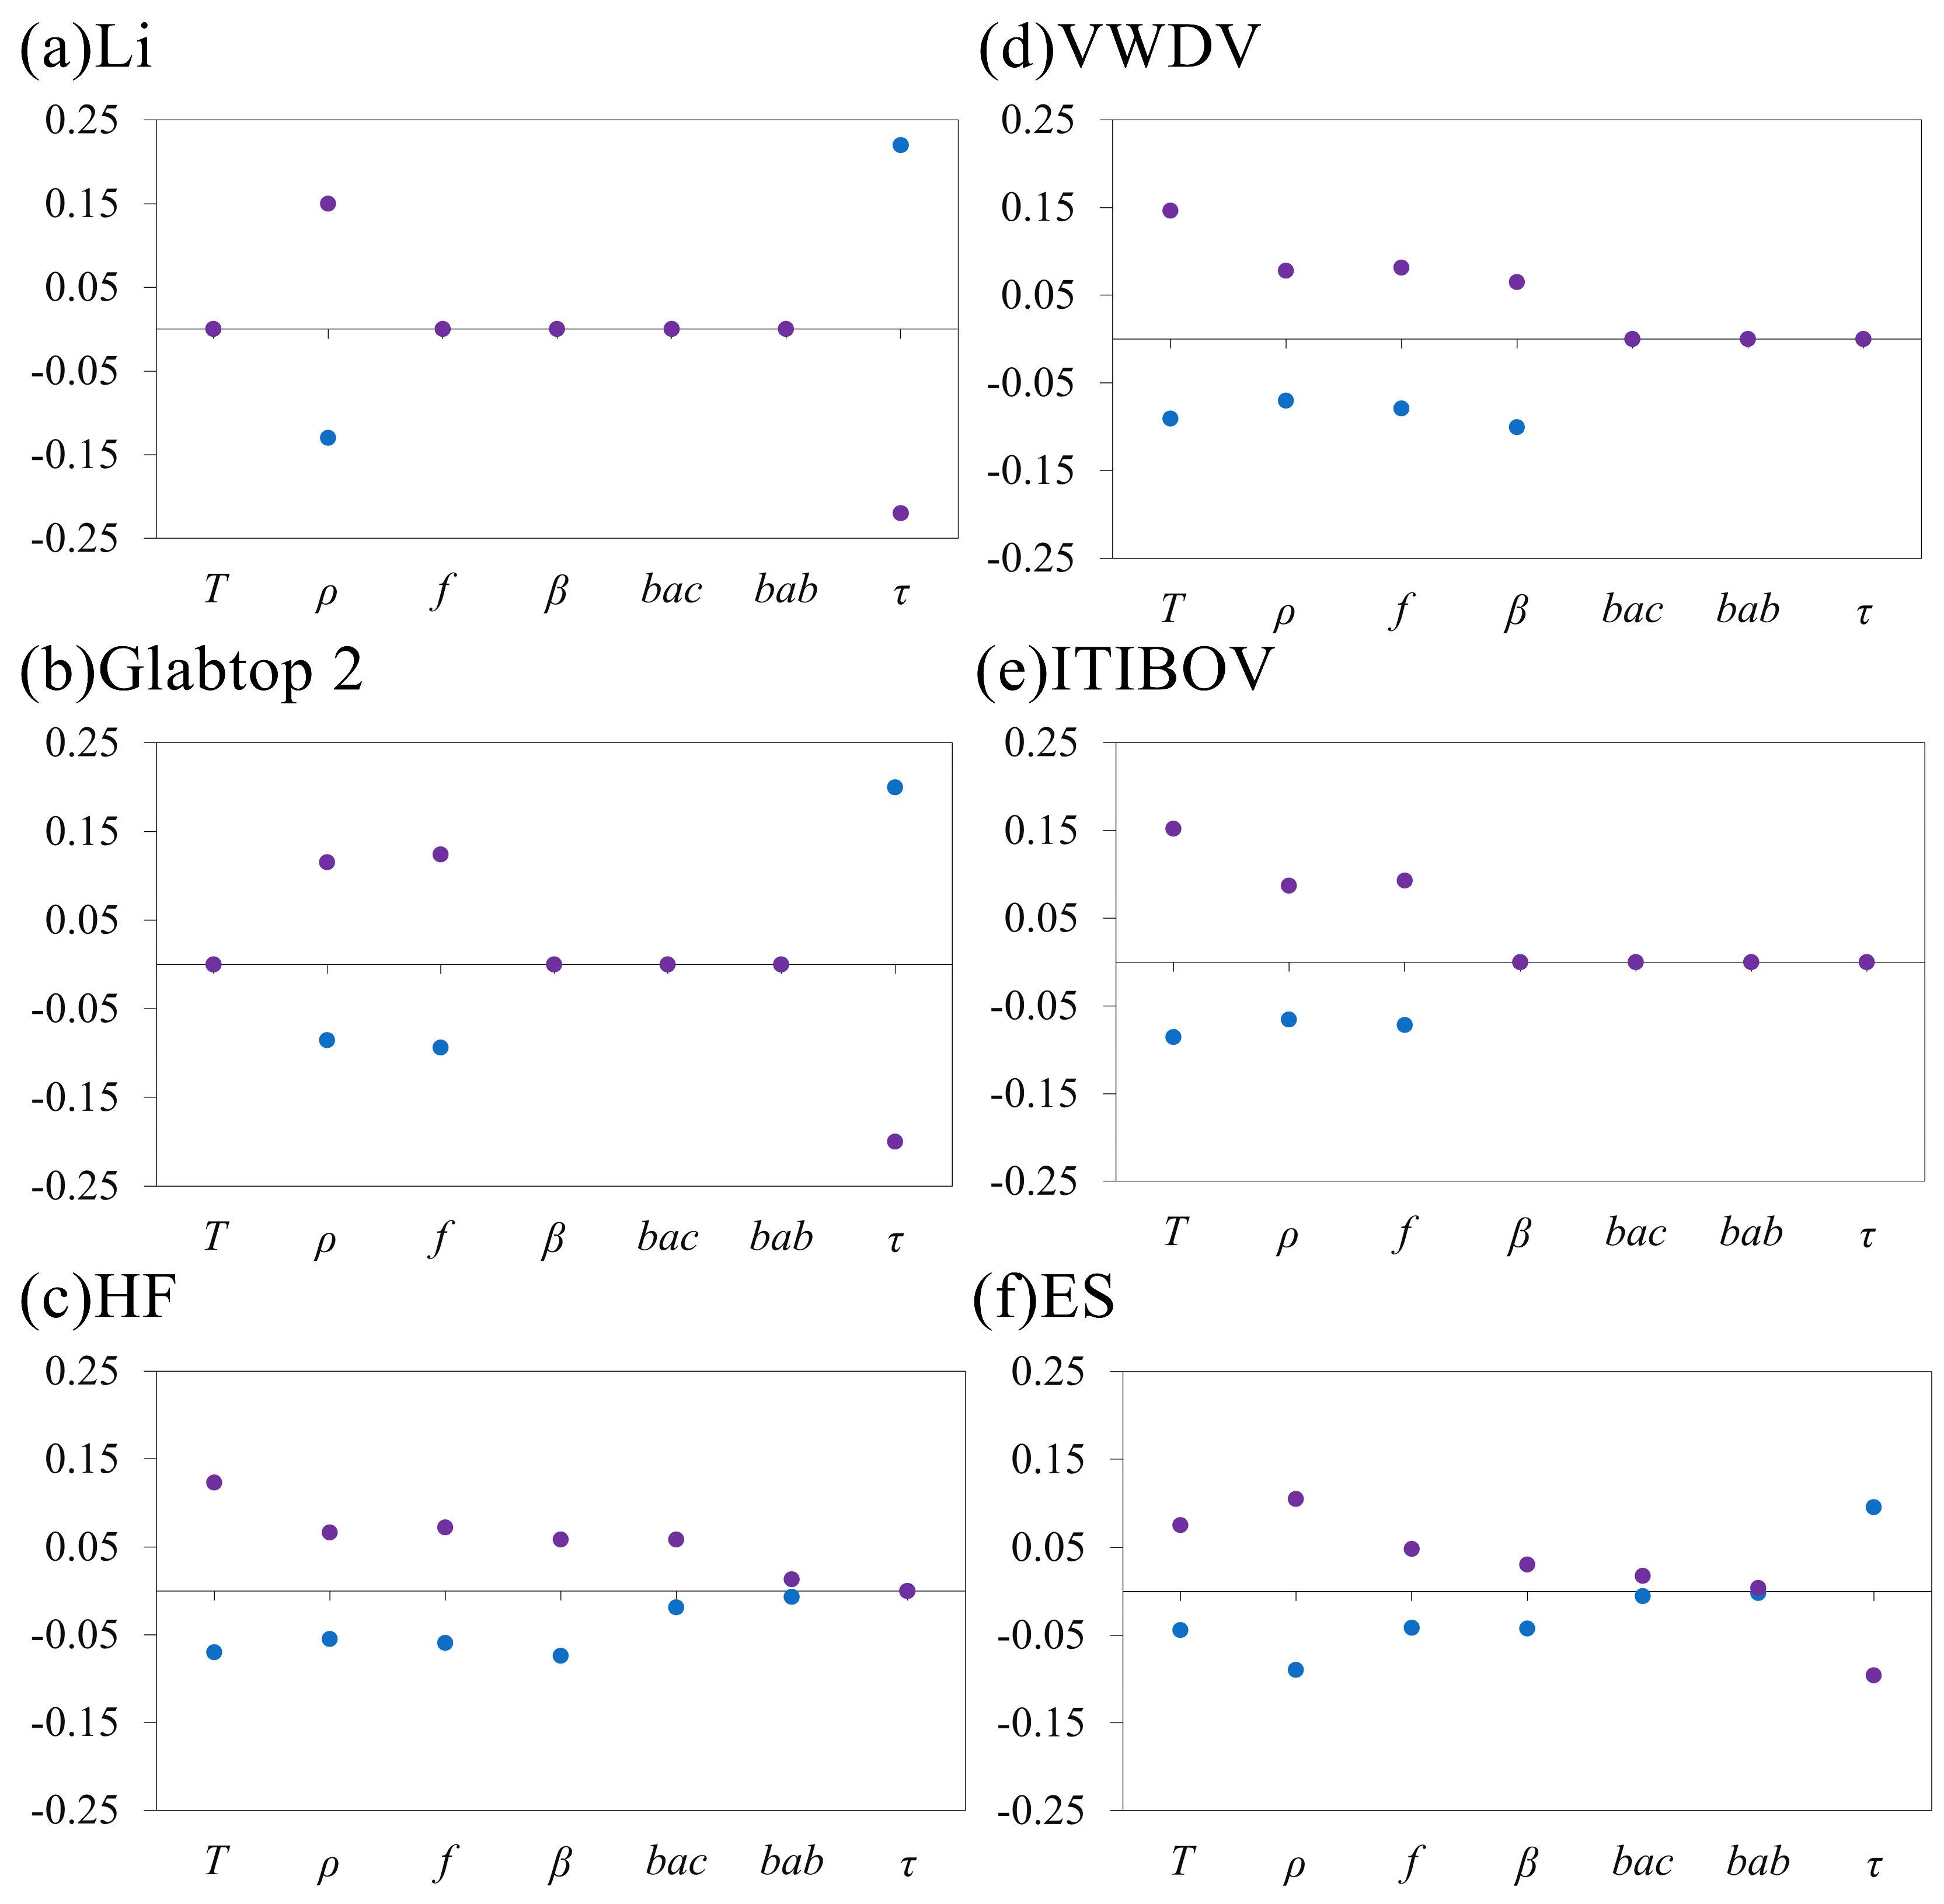
We varied T between −6 °C and −1 °C. As shown in Figure 8, all models using T are generally sensitive to this, and the maximum change in ice volume can reach 15%. The more negative the T, the greater the volume of simulated ice. There is a temperature dependence of the creep parameter A. Ice becomes softer as the temperature increases. According to laboratory results, the parameter A increases about tenfold between −30 °C and −10 °C and then further increases by fivefold or tenfold when the melting point is reached. The reason for the introduction of T is to use temperature to correct the default A* at 0 °C. The sensitivity to T is essentially the same as the sensitivity to A.
Two shear stress-based models use relatively few parameters, with basal shear stress standing out as the most critical and sensitive among them. Given the elevation span of MG16, which surpasses 1.6 km, a standard value of 150 kPa is commonly applied in these calculations. When we increased it by 30 kPa, the ice volume changed by 20%, and the shear stress parameter showed a positive correlation with the ice volume. Li’s approach is more sensitive to both shear stress and density. This may be because compared to Glabtop2, Li’s approach optimizes f and no longer uses a fixed value. Instead, it relies on the half-width at the centerline. The reduction in parameters increases the model’s reliance on the density and shear stress parameters. However, this also necessitates higher accuracy in defining glacier contours and extracting streamlines.
For the ice density ρ and shape factor f commonly used in most models, density changes range from 743 to 917 kg/m3. Ice volume changes due to density changes do not differ significantly between models, except for Li’s approach, and are generally concentrated around 8%. Li’s approach achieved approximately 15%. The change in ice volume caused by changes in f is relatively larger than that caused by changes in density and generally differs by about 1% from the change in ice volume caused by changes in density. The range of variation for β is 0–0.4. The velocity-based VWDV is more dependent on it than HF, and the change in ice volume caused by its alteration is not significantly different from f. HF involves numerous parameters. The total change in ice volume caused by parameter adjustments is relatively smaller compared to other models. Among the two parameters depicting the apparent mass balance, the effect within the accumulation zone is somewhat minimal. While the ablation zone’s impact is more pronounced, the influence of both zones on alterations in ice volume remains marginal. In addition to the seven parameters analyzed above, there is another important parameter n. Since the value of n is relatively constant, its uncertainty is not assessed here. However, general research shows that n has a much greater influence on ice volume than other parameters [56,61,75]. The sensitivity of the ensemble method’s parameters is calculated based on the individual model weights, which are most influenced by the density and shear stress parameters.
To evaluate the uncertainty in total ice volume resulting from poorly constrained parameter values, the individual uncertainties are combined. Table 1 displays the uncertainties associated with the parameters of each model, typically centered around 20%. VWDV has the highest level of uncertainty at 26%, whereas the ES has the lowest level of uncertainty at 18%.
The uncertainty caused by the glacier’s contour is more significant for models relying on streamlines. As MZ16 is located in the Pamir Plateau, glacier melt in this area has not been significant over the years, and the accumulated mass balance is close to equilibrium at 0 [76]. Therefore, compared to the RGI 6.0, the 2023 outline shows minimal changes in the glacier’s terminus, and the uncertainty resulting from the outline alteration is insignificant. The impact of DEM precision on the ice thickness inversion model is contingent on the specific features of the model. Typically, DEMs of higher resolution contribute to improved results from the model [18]. The accuracy of the DEM affects the slope of the glacier surface. Despite the time mismatch problem in the DEM, the maximum elevation change indicated by geodetic survey results over the years is only 2 m, which is almost negligible compared to the uncertainty caused by the parameters. The impact of constant or height deviations in the DEM is also insignificant, with the difference in ice volume being less than 0.5%. Thus, the final uncertainty is defined only by the uncertainty due to the parameters.

7. Conclusions

In this study, GPR was employed to measure the ice thickness across four profiles of the MG16 located in the Eastern Pamir for the first time. This approach helped bridge the gap in locally measured ice thickness data. The maximum ice thickness measured was 109.87 m. Accessibility to specific areas of the glacier is limited due to topography, crevasses, and snowpack, which hinders complete measurement coverage. Therefore, we inverted the ice thickness distribution of the glacier using a total of five different ice thickness models categorized based on basic shear stress, mass conservation, and velocity. We calibrated and verified the models using measured ice thickness data. The uncertainty introduced by each parameter was assessed.
Compared with the GPR measurement results, Li’s approach and the HF method exhibited smaller errors than other models in the individual model results. Since there are varying degrees of differences in each model, the weighted average was calculated to obtain the composite ice thickness distribution. The final result shows that the maximum ice thickness of MG16 is 115.87 m, the ice volume is 0.27 km3, and the uncertainty is 18%. The results are relatively small compared to other studies, and the differences mainly exist in areas with no measured data. The reasons for the differences lie partly in the fact that GPR measurements to some extent constrain the model used in this study. Additionally, the models in different studies operate based on different principles, depend on distinct parameters, and consider various fundamental conditions, such as glacier surface characteristics (e.g., slope, speed). Moreover, the primary source of uncertainty stems from the absence of constrained parameters. This underscores the significance of observing ice thickness data and other essential glacier information.

Author Contributions

Conceptualization, Y.Y., Z.L. and F.W. (Feiteng Wang); methodology, Y.Y., W.Z. and Z.L.; software, Y.Y. and W.Z.; validation, Y.Y. and Z.L.; formal analysis, Y.Y. and W.Z.; investigation, Y.Y., J.M., F.W. (Fanglong Wang), X.Z. and Q.L.; resources, Z.L.; data curation, Y.Y., Z.Z. and H.M.; writing—original draft preparation, Y.Y.; writing—review and editing, Y.Y. and Z.L.; visualization, Y.Y., J.M. and S.J.; supervision, Z.L. and F.W. (Feiteng Wang); project administration, Z.L.; funding acquisition, Z.L. All authors have read and agreed to the published version of the manuscript.

Funding

This research was funded by Third Xinjiang Scientific Expedition Program (Grant No. 2022xjkk0101), Second Qinghai-Tibet Scientific Expedition Program (Grant No. 2019 QZKK0201), the National Science Foundation of Gansu Province (Grant No. 23JRRA658) and National Natural Science Foundation of China (Grant No. 42301166).

Data Availability Statement

Data incorporated in this research are available for free through the following websites: Landsat 9 OLI/TIRS image https://earthexplorer.usgs.gov/ (last access: 6 December 2023); AW3D30 (https://www.eorc.jaxa.jp/ALOS/en/dataset/aw3d30/aw3d30_e.htm; last access: 6 December 2023); Glacier surface velocity data (https://doi.org/10.6096/1007; last access: 6 December 2023); Code of Glabtop2, HF, VWDV, and ITIBOV (https://doi.org/10.5281/zenodo.6323069; last access: 6 December 2023); Ice thickness distribution and volume data estimated by Farinotti et al. (https://doi.org/10.3929/ethz-b-000315707; last access: 6 December 2023) and Millan et al. (https://doi.org/10.6096/1007; last access: 6 December 2023).

Acknowledgments

We would like to thank Maowei Lin, Jian’an Chen, Puchen Chen, Jingshi Liu, and Wei Liu for their invaluable contributions to fieldwork and logistical support. We also thank Xinjiang Academy of Surveying and Mapping for providing the GF-6 satellite image.

Conflicts of Interest

The authors declare no conflicts of interest.

References

  1. Zemp, M.; Huss, M.; Thibert, E.; Eckert, N.; McNabb, R.; Huber, J.; Barandun, M.; Machguth, H.; Nussbaumer, S.U.; Gärtner-Roer, I. Global glacier mass changes and their contributions to sea-level rise from 1961 to 2016. Nature 2019, 568, 382–386. [Google Scholar] [CrossRef] [PubMed]
  2. Farinotti, D.; Brinkerhoff, D.J.; Fürst, J.J.; Gantayat, P.; Gillet-Chaulet, F.; Huss, M.; Leclercq, P.W.; Maurer, H.; Morlighem, M.; Pandit, A. Results from the ice thickness models intercomparison experiment phase 2 (ITMIX2). Front. Earth Sci. 2021, 8, 571923. [Google Scholar] [CrossRef]
  3. Rounce, D.R.; Hock, R.; Maussion, F.; Hugonnet, R.; Kochtitzky, W.; Huss, M.; Berthier, E.; Brinkerhoff, D.; Compagno, L.; Copland, L. Global glacier change in the 21st century: Every increase in temperature matters. Science 2023, 379, 78–83. [Google Scholar] [CrossRef] [PubMed]
  4. Huss, M.; Hock, R. Global-scale hydrological response to future glacier mass loss. Nat. Clim. Change 2018, 8, 135–140. [Google Scholar] [CrossRef]
  5. Kraaijenbrink, P.D.; Bierkens, M.F.; Lutz, A.F.; Immerzeel, W. Impact of a global temperature rise of 1.5 degrees Celsius on Asia’s glaciers. Nature 2017, 549, 257–260. [Google Scholar] [CrossRef] [PubMed]
  6. Aðalgeirsdóttir, G.; Guðmundsson, S.; Björnsson, H.; Pálsson, F.; Jóhannesson, T.; Hannesdóttir, H.; Sigurðsson, S.Þ.; Berthier, E. Modelling the 20th and 21st century evolution of Hoffellsjökull glacier, SE-Vatnajökull, Iceland. Cryosphere 2011, 5, 961–975. [Google Scholar] [CrossRef]
  7. Van Tricht, L.; Huybrechts, P.; Van Breedam, J.; Fürst, J.J.; Rybak, O.; Satylkanov, R.; Ermenbaiev, B.; Popovnin, V.; Neyns, R.; Paice, C.M. Measuring and inferring the ice thickness distribution of four glaciers in the Tien Shan, Kyrgyzstan. J. Glaciol. 2021, 67, 269–286. [Google Scholar] [CrossRef]
  8. Li, Y.; Tian, L.; Yi, Y.; Moore, J.; Sun, S.; Zhao, L. Simulating the Evolution of Qiangtang No. 1 Glacier in the Central Tibetan Plateau to 2050. Arct. Antarct. Alp. Res. 2017, 49, 1–12. [Google Scholar] [CrossRef]
  9. Booth, A.D.; Mercer, A.; Clark, R.; Murray, T.; Jansson, P.; Axtell, C. A comparison of seismic and radar methods to establish the thickness and density of glacier snow cover. Ann. Glaciol. 2013, 54, 73–82. [Google Scholar] [CrossRef]
  10. Pang, X.; Jiang, L.; Guo, R.; Xu, Z.; Li, X.; Lu, X. Surface Motion and Topographic Effects on Ice Thickness Inversion for High Mountain Asia Glaciers: A Comparison Study from Three Numerical Models. Remote Sens. 2023, 15, 5378. [Google Scholar] [CrossRef]
  11. Sommer, C.; Fürst, J.J.; Huss, M.; Braun, M.H. Constraining regional glacier reconstructions using past ice thickness of deglaciating areas—A case study in the European Alps. Cryosphere 2023, 17, 2285–2303. [Google Scholar] [CrossRef]
  12. Zekollari, H.; Huss, M.; Farinotti, D.; Lhermitte, S. Ice-Dynamical Glacier Evolution Modeling—A Review. Rev. Geophys. 2022, 60, e2021RG000754. [Google Scholar] [CrossRef]
  13. Rowan, A.V.; Egholm, D.L.; Quincey, D.J.; Glasser, N.F. Modelling the feedbacks between mass balance, ice flow and debris transport to predict the response to climate change of debris-covered glaciers in the Himalaya. Earth Planet. Sci. Lett. 2015, 430, 427–438. [Google Scholar] [CrossRef]
  14. Grab, M.; Mattea, E.; Bauder, A.; Huss, M.; Rabenstein, L.; Hodel, E.; Linsbauer, A.; Langhammer, L.; Schmid, L.; Church, G. Ice thickness distribution of all Swiss glaciers based on extended ground-penetrating radar data and glaciological modeling. J. Glaciol. 2021, 67, 1074–1092. [Google Scholar] [CrossRef]
  15. Plewes, L.A.; Hubbard, B. A review of the use of radio-echo sounding in glaciology. Prog. Phys. Geogr. 2001, 25, 203–236. [Google Scholar] [CrossRef]
  16. Woodward, J.; Burke, M.J. Applications of ground-penetrating radar to glacial and frozen materials. J. Environ. Eng. Geophys. 2007, 12, 69–85. [Google Scholar] [CrossRef]
  17. Wu, Z.; Liu, S.; Zhang, S.; Xiao, H. Internal structure and trend of glacier change assessed by geophysical investigations. Environ. Earth Sci. 2013, 68, 1513–1525. [Google Scholar]
  18. Li, F.; Maussion, F.; Wu, G.; Chen, W.; Yu, Z.; Li, Y.; Liu, G. Influence of glacier inventories on ice thickness estimates and future glacier change projections in the Tian Shan range, Central Asia. J. Glaciol. 2023, 69, 266–280. [Google Scholar] [CrossRef]
  19. Grinsted, A. An estimate of global glacier volume. Cryosphere 2013, 7, 141–151. [Google Scholar] [CrossRef]
  20. Bahr, D.B.; Pfeffer, W.T.; Kaser, G. A review of volume-area scaling of glaciers. Rev. Geophys. 2015, 53, 95–140. [Google Scholar] [CrossRef]
  21. Frey, H.; Machguth, H.; Huss, M.; Huggel, C.; Bajracharya, S.; Bolch, T.; Kulkarni, A.; Linsbauer, A.; Salzmann, N.; Stoffel, M. Estimating the volume of glaciers in the Himalayan—Karakoram region using different methods. Cryosphere 2014, 8, 2313–2333. [Google Scholar] [CrossRef]
  22. Millan, R.; Mouginot, J.; Rabatel, A.; Morlighem, M. Ice velocity and thickness of the world’s glaciers. Nat. Geosci. 2022, 15, 124–129. [Google Scholar] [CrossRef]
  23. Paul, F.; Linsbauer, A. Modeling of glacier bed topography from glacier outlines, central branch lines, and a DEM. Int. J. Geogr. Inf. Sci. 2012, 26, 1173–1190. [Google Scholar] [CrossRef]
  24. Linsbauer, A.; Paul, F.; Haeberli, W. Modeling glacier thickness distribution and bed topography over entire mountain ranges with GlabTop: Application of a fast and robust approach. J. Geophys. Res. Earth Surf. 2012, 117, 3007. [Google Scholar] [CrossRef]
  25. Li, H.; Li, Z.; Zhang, M.; Li, W. An improved method based on shallow ice approximation to calculate ice thickness along flow-line and volume of mountain glaciers. J. Earth Sci. 2011, 22, 441–448. [Google Scholar] [CrossRef]
  26. Maussion, F.; Butenko, A.; Champollion, N.; Dusch, M.; Eis, J.; Fourteau, K.; Gregor, P.; Jarosch, A.H.; Landmann, J.; Oesterle, F. The open global glacier model (OGGM) v1. 1. Geosci. Model Dev. 2019, 12, 909–931. [Google Scholar] [CrossRef]
  27. Brinkerhoff, D.J.; Aschwanden, A.; Truffer, M. Bayesian inference of subglacial topography using mass conservation. Front. Earth Sci. 2016, 4, 8. [Google Scholar] [CrossRef]
  28. Clarke, G.K.; Anslow, F.S.; Jarosch, A.H.; Radić, V.; Menounos, B.; Bolch, T.; Berthier, E. Ice volume and subglacial topography for western Canadian glaciers from mass balance fields, thinning rates, and a bed stress model. J. Clim. 2013, 26, 4282–4303. [Google Scholar] [CrossRef]
  29. Gantayat, P.; Kulkarni, A.V.; Srinivasan, J. Estimation of ice thickness using surface velocities and slope: Case study at Gangotri Glacier, India. J. Glaciol. 2014, 60, 277–282. [Google Scholar] [CrossRef]
  30. Huss, M.; Farinotti, D. Distributed ice thickness and volume of all glaciers around the globe. J. Geophys. Res. Earth Surf. 2012, 117, F04010. [Google Scholar] [CrossRef]
  31. Farinotti, D.; Huss, M.; Bauder, A.; Funk, M.; Truffer, M. A method to estimate the ice volume and ice-thickness distribution of alpine glaciers. J. Glaciol. 2009, 55, 422–430. [Google Scholar] [CrossRef]
  32. Van Pelt, W.; Oerlemans, J.; Reijmer, C.; Pettersson, R.; Pohjola, V.A.; Isaksson, E.; Divine, D. An iterative inverse method to estimate basal topography and initialize ice flow models. Cryosphere 2013, 7, 987–1006. [Google Scholar] [CrossRef]
  33. Clarke, G.K.; Berthier, E.; Schoof, C.G.; Jarosch, A.H. Neural networks applied to estimating subglacial topography and glacier volume. J. Clim. 2009, 22, 2146–2160. [Google Scholar] [CrossRef]
  34. Welty, E.; Zemp, M.; Navarro, F.; Huss, M.; Fürst, J.; Gärtner-Roer, I.; Landmann, J.; Machguth, H.; Naegeli, K.; Andreassen, L. GlaThiDa Contributors: Worldwide version-controlled database of glacier thickness observations. Earth Syst. Sci. Data 2020, 12, 3039–3055. [Google Scholar] [CrossRef]
  35. Hock, R.; Maussion, F.; Marzeion, B.; Nowicki, S. What is the global glacier ice volume outside the ice sheets? J. Glaciol. 2023, 69, 204–210. [Google Scholar] [CrossRef]
  36. Werder, M.A.; Huss, M.; Paul, F.; Dehecq, A.; Farinotti, D. A Bayesian ice thickness estimation model for large-scale applications. J. Glaciol. 2020, 66, 137–152. [Google Scholar] [CrossRef]
  37. Zhang, J.; He, P.; Hu, X.; Liu, Z. The spatio-temporal patterns of glacier activities in the eastern Pamir Plateau investigated by time series sub-pixel offsets from Sentinel-2 optical images. IEEE J. Sel. Top. Appl. Earth Obs. Remote Sens. 2023, 16, 1256–1268. [Google Scholar] [CrossRef]
  38. Zhu, M.; Yao, T.; Yang, W.; Xu, B.; Wu, G.; Wang, X.; Xie, Y. Reconstruction of the mass balance of Muztag Ata No. 15 glacier, eastern Pamir, and its climatic drivers. J. Glaciol. 2018, 64, 259–274. [Google Scholar] [CrossRef]
  39. Maurer, J.M.; Schaefer, J.; Rupper, S.; Corley, A. Acceleration of ice loss across the Himalayas over the past 40 years. Sci. Adv. 2019, 5, eaav7266. [Google Scholar] [CrossRef] [PubMed]
  40. Gardelle, J.; Berthier, E.; Arnaud, Y. Slight mass gain of Karakoram glaciers in the early twenty-first century. Nat. Geosci. 2012, 5, 322–325. [Google Scholar] [CrossRef]
  41. Azam, M.F.; Wagnon, P.; Berthier, E.; Vincent, C.; Fujita, K.; Kargel, J.S. Review of the status and mass changes of Himalayan-Karakoram glaciers. J. Glaciol. 2018, 64, 61–74. [Google Scholar] [CrossRef]
  42. Brun, F.; Berthier, E.; Wagnon, P.; Kääb, A.; Treichler, D. A spatially resolved estimate of High Mountain Asia glacier mass balances from 2000 to 2016. Nat. Geosci. 2017, 10, 668–673. [Google Scholar] [CrossRef] [PubMed]
  43. Zhang, Z.; Huang, D.; Lu, Y.; Zhang, S. A landsat-based dataset of glacier velocity in eastern Pamir from 1989 to 2020. China Sci. Data 2021, 6, 170–181. [Google Scholar]
  44. Peng, Y.; Li, Z.; Xu, C.; Zhang, H.; Han, W. Surface velocity analysis of surge region of karayaylak glacier from 2014 to 2020 in the pamir plateau. Remote Sens. 2021, 13, 774. [Google Scholar] [CrossRef]
  45. Yan, S.; Guo, H.; Liu, G.; Fu, W. Monitoring Muztagh Kuksai glacier surface velocity with L-band SAR data in southwestern Xinjiang, China. Environ. Earth Sci. 2013, 70, 3175–3184. [Google Scholar] [CrossRef]
  46. Yao, T.; Thompson, L.; Yang, W.; Yu, W.; Gao, Y.; Guo, X.; Yang, X.; Duan, K.; Zhao, H.; Xu, B. Different glacier status with atmospheric circulations in Tibetan Plateau and surroundings. Nat. Clim. Change 2012, 2, 663–667. [Google Scholar] [CrossRef]
  47. Lv, M.; Guo, H.; Lu, X.; Liu, G.; Yan, S.; Ruan, Z.; Ding, Y.; Quincey, D.J. Characterizing the behaviour of surge-and non-surge-type glaciers in the Kingata Mountains, eastern Pamir, from 1999 to 2016. Cryosphere 2019, 13, 219–236. [Google Scholar] [CrossRef]
  48. Farinotti, D.; Huss, M.; Fürst, J.J.; Landmann, J.; Machguth, H.; Maussion, F.; Pandit, A. A consensus estimate for the ice thickness distribution of all glaciers on Earth. Nat. Geosci. 2019, 12, 168–173. [Google Scholar] [CrossRef]
  49. Wang, Y.; Xu, B. Meteorological Observation Data from the Integrated Observation and Research Station of the Western Environment in Muztagh Ata (2003–2016), National Tibetan Plateau/Third Pole Environment Data Center. 2018. Available online: https://data.tpdc.ac.cn/en/data/11b1d6c6-f3e2-4311-991f-b496c3aa22a8(accessed on 6 December 2023).
  50. Holzer, N.; Vijay, S.; Yao, T.; Xu, B.; Buchroithner, M.; Bolch, T. Four decades of glacier variations at Muztagh Ata (eastern Pamir): A multi-sensor study including Hexagon KH-9 and Pléiades data. Cryosphere 2015, 9, 2071–2088. [Google Scholar] [CrossRef]
  51. Zhang, Z.; Liu, S.; Wei, J.; Xu, J.; Guo, W.; Bao, W.; Jiang, Z. Mass change of glaciers in Muztag Ata–Kongur Tagh, Eastern Pamir, China from 1971/76 to 2013/14 as derived from remote sensing data. PLoS ONE 2016, 11, e0147327. [Google Scholar] [CrossRef]
  52. Jin, S.; Li, Z.; Wang, Z.; Wang, F.; Xu, C.; Ai, S. Ice thickness distribution and volume estimation of Burqin Glacier No. 18 in the Chinese Altay Mountains. J. Arid Land 2020, 12, 905–916. [Google Scholar] [CrossRef]
  53. Lambrecht, A.; Mayer, C.; Aizen, V.; Floricioiu, D.; Surazakov, A. The evolution of Fedchenko glacier in the Pamir, Tajikistan, during the past eight decades. J. Glaciol. 2014, 60, 233–244. [Google Scholar] [CrossRef]
  54. Chen, W.; Yao, T.; Zhang, G.; Li, F.; Zheng, G.; Zhou, Y.; Xu, F. Towards ice-thickness inversion: An evaluation of global digital elevation models (DEMs) in the glacierized Tibetan Plateau. Cryosphere 2022, 16, 197–218. [Google Scholar] [CrossRef]
  55. Takaku, J.; Tadono, T.; Tsutsui, K.; Ichikawa, M. Validation of “AW3D” global DSM generated from Alos Prism. ISPRS Ann. Photogramm. Remote Sens. Spat. Inf. Sci. 2016, 3, 25–31. [Google Scholar] [CrossRef]
  56. Cuffey, K.M.; Paterson, W.S.B. The Physics of Glaciers; Academic Press: Cambridge, MA, USA, 2010. [Google Scholar]
  57. Fowler, A.; Larson, D. On the flow of polythermal glaciers-I. Model and preliminary analysis. Proc. R. Soc. London. A. Math. Phys. Sci. 1978, 363, 217–242. [Google Scholar]
  58. Nye, J. The flow of a glacier in a channel of rectangular, elliptic or parabolic cross-section. J. Glaciol. 1965, 5, 661–690. [Google Scholar] [CrossRef]
  59. Maisch, M.; Haeberli, W. Interpretation geometrischer Parameter von Spätglazialgletschern im Gebiet Mittelbünden, Schweizer Alpen, in Beiträge zur Quartärforschung in der Schweiz. Phys. Geogr. Univ. Zürich Zur. 1982, 1, 111–126. [Google Scholar]
  60. Zhang, D.; Yao, X.; Duan, H.; Liu, S.; Guo, W.; Sun, M.; Li, D. A new automatic approach for extracting glacier centerlines based on Euclidean allocation. Cryosphere 2021, 15, 1955–1973. [Google Scholar] [CrossRef]
  61. Van Wyk de Vries, M.; Carchipulla-Morales, D.; Wickert, A.D.; Minaya, V.G. Glacier thickness and ice volume of the Northern Andes. Sci. Data 2022, 9, 342. [Google Scholar] [CrossRef]
  62. Ramsankaran, R.; Pandit, A.; Azam, M.F. Spatially distributed ice-thickness modelling for Chhota Shigri Glacier in western Himalayas, India. Int. J. Remote Sens. 2018, 39, 3320–3343. [Google Scholar] [CrossRef]
  63. Glen, J. The flow law of ice: A discussion of the assumptions made in glacier theory, their experimental foundations and consequences. IASH Publ. 1958, 47, e183. [Google Scholar]
  64. Qi, C.; Goldsby, D.L.; Prior, D.J. The down-stress transition from cluster to cone fabrics in experimentally deformed ice. Earth Planet. Sci. Lett. 2017, 471, 136–147. [Google Scholar] [CrossRef]
  65. Farinotti, D.; Brinkerhoff, D.J.; Clarke, G.K.; Fürst, J.J.; Frey, H.; Gantayat, P.; Gillet-Chaulet, F.; Girard, C.; Huss, M.; Leclercq, P.W. How accurate are estimates of glacier ice thickness? Results from ITMIX, the Ice Thickness Models Intercomparison eXperiment. Cryosphere 2017, 11, 949–970. [Google Scholar] [CrossRef]
  66. Haeberli, W.; Hoelzle, M. Application of inventory data for estimating characteristics of and regional climate-change effects on mountain glaciers: A pilot study with the European Alps. Ann. Glaciol. 1995, 21, 206–212. [Google Scholar] [CrossRef]
  67. Gharehchahi, S.; James, W.H.; Bhardwaj, A.; Jensen, J.L.; Sam, L.; Ballinger, T.J.; Butler, D.R. Glacier Ice Thickness Estimation and Future Lake Formation in Swiss Southwestern Alps—The Upper Rhône Catchment: A VOLTA Application. Remote Sens. 2020, 12, 3443. [Google Scholar] [CrossRef]
  68. Radić, V.; Hock, R. Regional and global volumes of glaciers derived from statistical upscaling of glacier inventory data. J. Geophys. Res. Earth Surf. 2010, 115. [Google Scholar] [CrossRef]
  69. Marshall, S.J.; White, E.C.; Demuth, M.N.; Bolch, T.; Wheate, R.; Menounos, B.; Beedle, M.J.; Shea, J.M. Glacier water resources on the eastern slopes of the Canadian Rocky Mountains. Can. Water Resour. J. 2011, 36, 109–134. [Google Scholar] [CrossRef]
  70. Driedger, C.L.; Kennard, P. Glacier volume estimation on Cascade volcanoes: An analysis and comparison with other methods. Ann. Glaciol. 1986, 8, 59–64. [Google Scholar] [CrossRef]
  71. Zekollari, H.; Huybrechts, P.; Fürst, J.; Rybak, O.; Eisen, O. Calibration of a higher-order 3-D ice-flow model of the Morteratsch glacier complex, Engadin, Switzerland. Ann. Glaciol. 2013, 54, 343–351. [Google Scholar] [CrossRef]
  72. Liu, J.; Wang, S.; He, Y.; Li, Y.; Wang, Y.; Wei, Y.; Che, Y. Estimation of Ice Thickness and the Features of Subglacial Media Detected by Ground Penetrating Radar at the Baishui River Glacier No. 1 in Mt. Yulong, China. Remote Sens. 2020, 12, 4105. [Google Scholar] [CrossRef]
  73. Magnússon, E.; Pálsson, F.; Gudmundsson, M.T.; Högnadóttir, T.; Rossi, C.; Thorsteinsson, T.; Ófeigsson, B.G.; Sturkell, E.; Jóhannesson, T. Development of a subglacial lake monitored with radio-echo sounding: Case study from the eastern Skaftá cauldron in the Vatnajökull ice cap, Iceland. Cryosphere 2021, 15, 3731–3749. [Google Scholar] [CrossRef]
  74. Pritchard, H.; King, E.; Goodger, D.; McCarthy, M.; Mayer, C.; Kayastha, R. Towards Bedmap Himalayas: Development of an airborne ice-sounding radar for glacier thickness surveys in High-Mountain Asia. Ann. Glaciol. 2020, 61, 35–45. [Google Scholar] [CrossRef]
  75. Qi, C.; Goldsby, D.L. An experimental investigation of the effect of grain size on “dislocation creep” of ice. J. Geophys. Res. Solid Earth 2021, 126, e2021JB021824. [Google Scholar] [CrossRef]
  76. Hugonnet, R.; McNabb, R.; Berthier, E.; Menounos, B.; Nuth, C.; Girod, L.; Farinotti, D.; Huss, M.; Dussaillant, I.; Brun, F. Accelerated global glacier mass loss in the early twenty-first century. Nature 2021, 592, 726–731. [Google Scholar] [CrossRef]
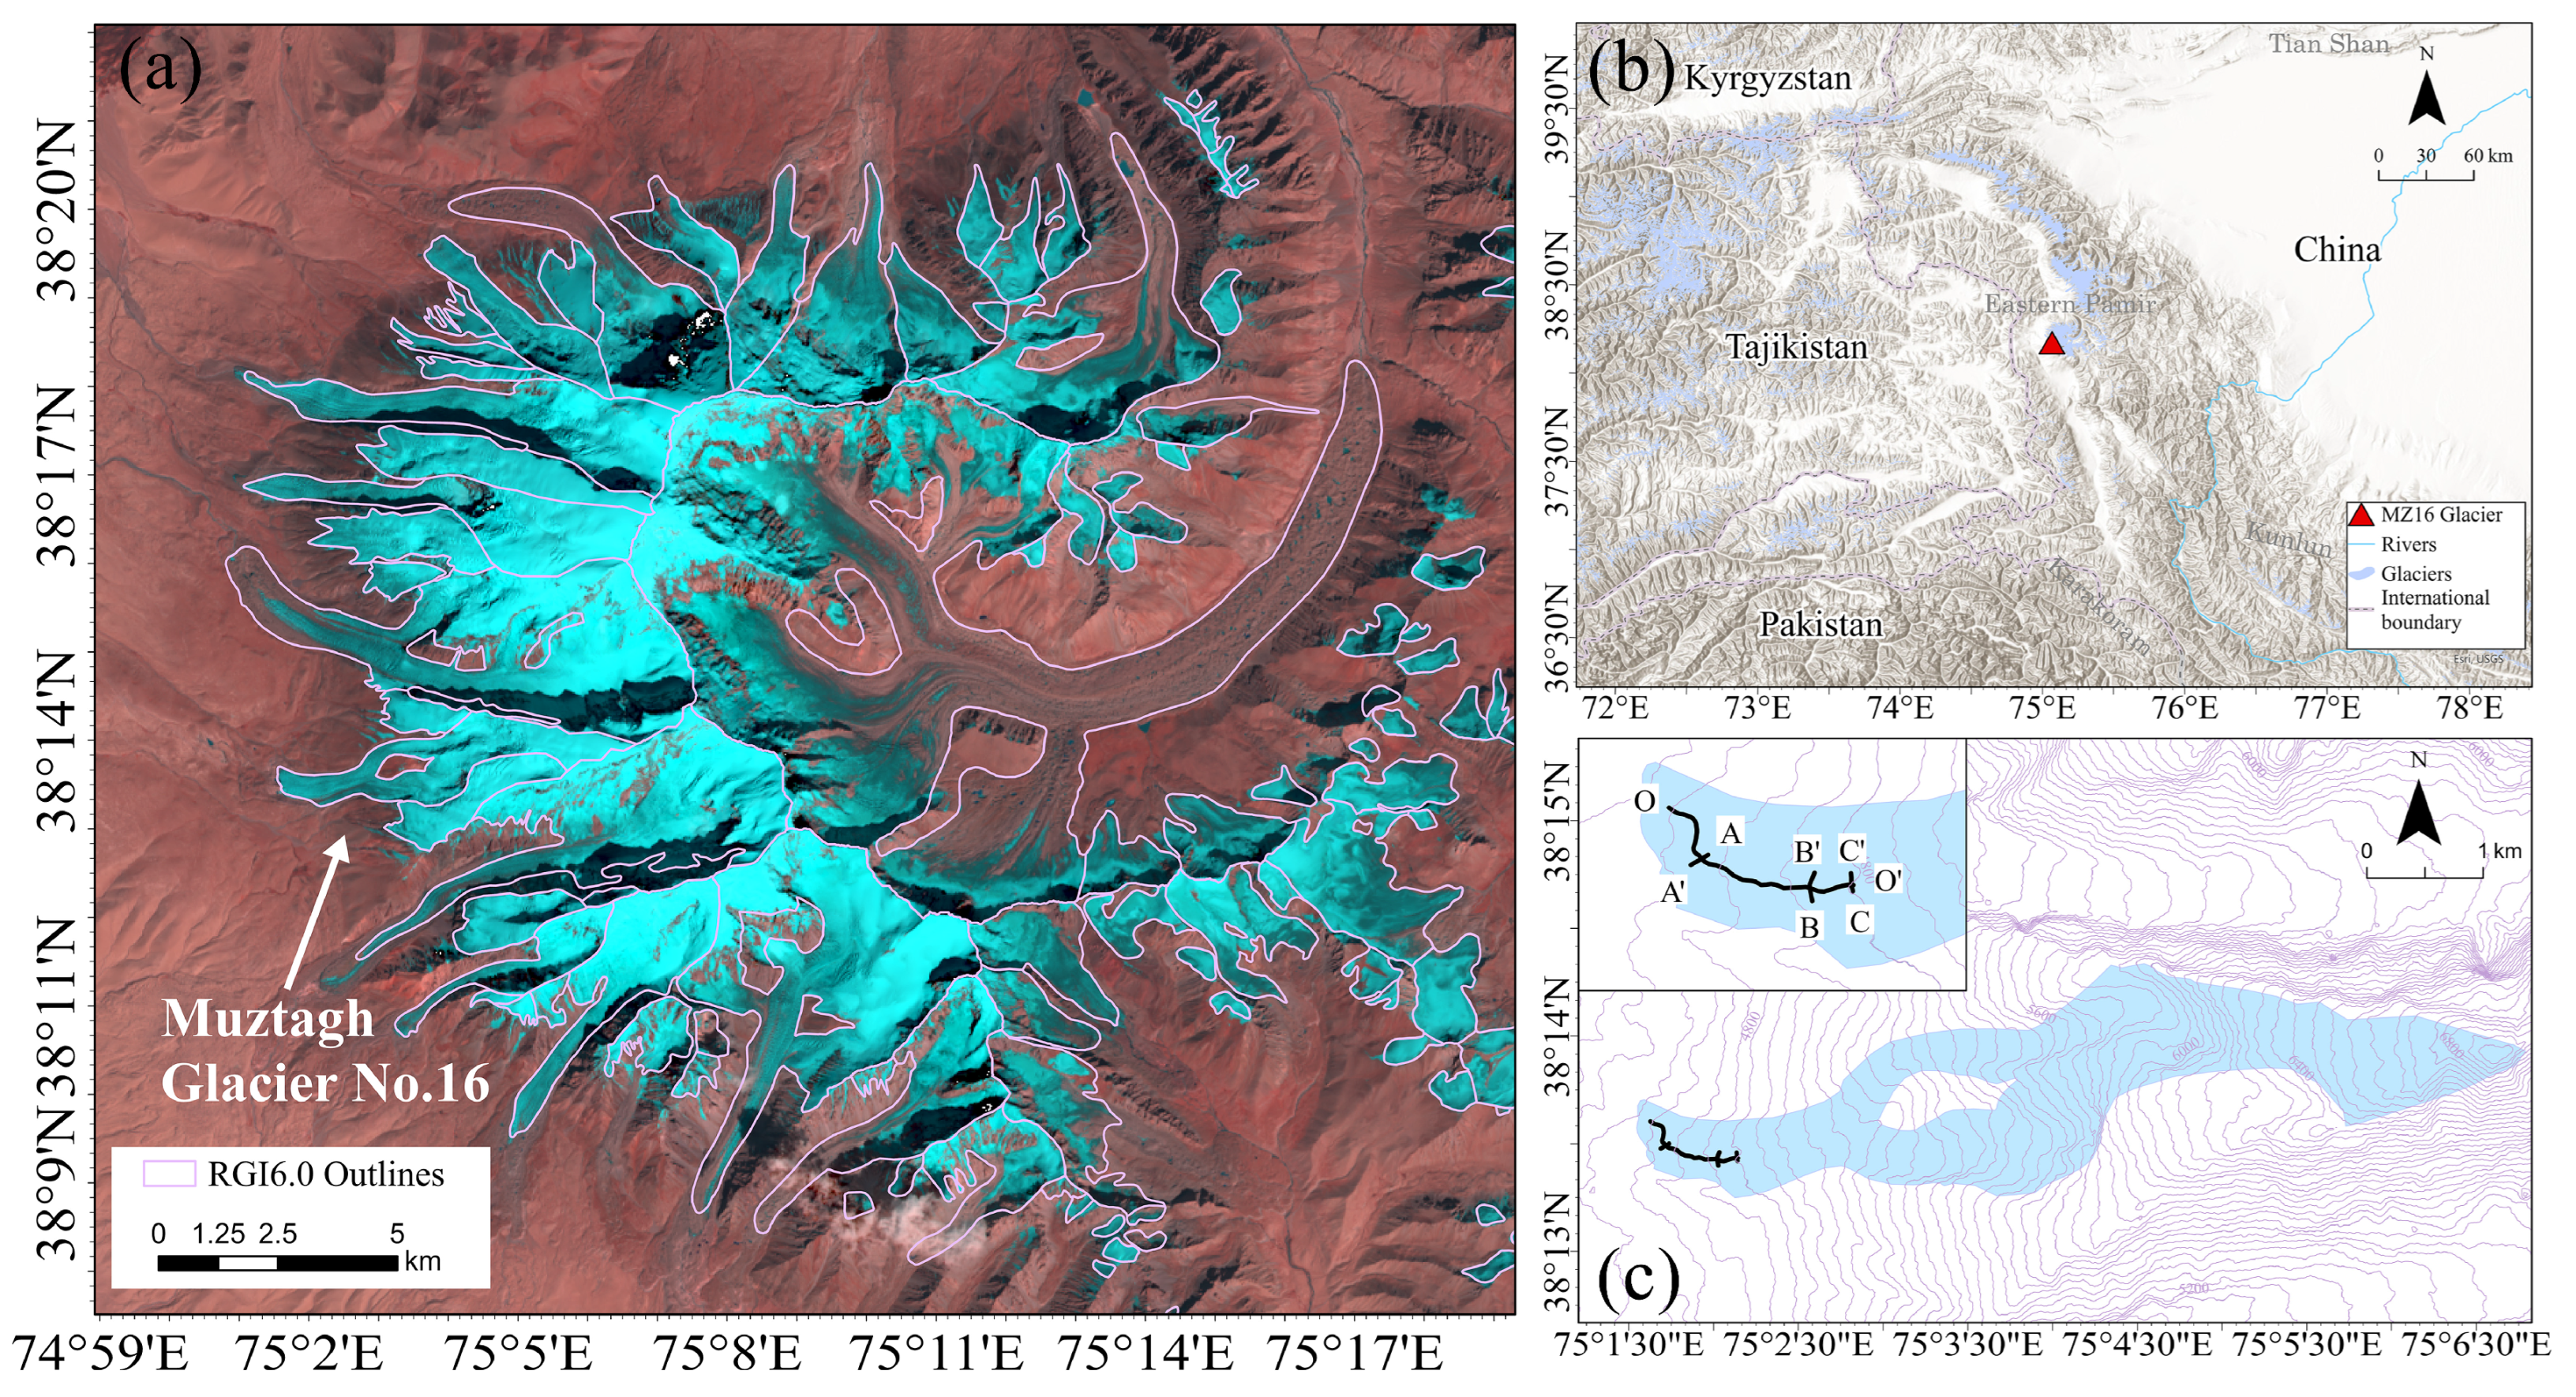
Figure 1. The location of Muztagh Glacier No.16 (MG16) in the Eastern Pamir. (a) The distribution of glaciers and site of MG16 in Muztagh Ata and (b) a broader map illustrating the glacier distribution across the Pamir Plateau in relation to other regions. (c) The GPR profiles of the MG16, the AA’ labels correspond to the same annotation as AA’ in Figure 2a.
Remotesensing 16 02009 g001
Figure 3. The representation of MG16′s ice thickness modeling includes (a) Li’s approach, (b) Glabtop2, (c) HF, (d) VWDV, (e) ITIBOV, and (f) ensemble results for ice thickness. Each section provides the mean (ME) and maximum (MAX) ice thickness as calculated by the respective method.
Remotesensing 16 02009 g003
Figure 4. The percentage of ice volume stored and area distribution in the different elevations of MG16.
Remotesensing 16 02009 g004
Figure 5. Comparison between estimated and observed ice thickness on profiles (a) O-O′, (b) A-A′, (c) B-B′, and (d) C-C′.
Remotesensing 16 02009 g005
Figure 6. Comparison of glacier thicknesses from different models and GPR measurements.
Remotesensing 16 02009 g006
Figure 7. Difference in distributed ice thickness between ES and (a) F2019 and (b) M22.
Remotesensing 16 02009 g007
Figure 8. Response of MG16′s ice volume to varied parameter distributions. Purple dots indicate parameters at their lower bounds, while blue dots indicate parameters at their upper bounds. bac and bab respectively represent d b ˜ / d z a c c and d b ˜ / d z a b l .
Remotesensing 16 02009 g008
Table 1. Parameter distributions for ice thickness inversion analysis.
ParameterDistributionReferences
T268–272[49,61]
n3[56,58,64]
f0.8–1[29,56,66]
β0–0.4[30,56]
ρ (kg/m3)741–917[56,61]
d b ˜ / d z a c c 0.008–0.01[30,31,48]
d b ˜ / d z a b l 0.004–0.006[30,31,48]
g9.79——
Table 2. Mean ice thickness at measurement sites and ice volume estimated using different models. More details about uncertainty of estimated volume are in 6.2.
MethodMean Ice Thickness at
Measurement Sites (m)
Volume (km3)Uncertainty of Volume (%)
Li80.990.2519.85
Glabtop288.300.1723.68
HF84.900.422.22
ITIBOV86.900.423.68
VWDV100.650.4526.06
ES78.330.2718.45
Table 3. Evaluation metric results of different models.
LiGlabtop2HFITIBOVVWDVES
MAE (m)6.1116.647.3911.1219.524.55
R20.900.020.890.730.720.97
RMSE (m)7.5019.818.6812.7221.935.34
STD (m)4.4010.894.616.2510.122.83
NSE0.84−0.140.780.53−0.390.92
RE0.01−0.15−0.07−0.11−0.270.02
Table 4. Previous studies’ estimates of ice volume, maximum, and average ice thickness: RH10 and G13 as distinct volume–area scaling relationships.
Volume (km3)Maximum Ice Thickness (m)Mean Ice Thickness (m)
F190.34110.9755.11
M220.40182.1164.83
OGGM0.27——43.76
RH100.45——72.93
G130.41——66.45
Disclaimer/Publisher’s Note: The statements, opinions and data contained in all publications are solely those of the individual author(s) and contributor(s) and not of MDPI and/or the editor(s). MDPI and/or the editor(s) disclaim responsibility for any injury to people or property resulting from any ideas, methods, instructions or products referred to in the content.