Abstract
Crater detection can provide valuable information for humans to explore the topography and understand the history of extraterrestrial planets. Due to the significantly varying scenario distributions, existing detection models trained on known labelled crater datasets are hardly effective when applied to new unlabelled planets. To address this issue, we propose a two-stage adaptive network (TAN) for semi-supervised cross-domain crater detection. Our network is built on the YOLOv5 detector, where a series of strategies are employed to enhance its cross-domain generalisation ability. In the first stage, we propose an attention-based scale-adaptive fusion (ASAF) strategy to handle objects with significant scale variances. Furthermore, we propose a smoothing hard example mining (SHEM) loss function to address the issue of overfitting on hard examples. In the second stage, we propose a sort-based pseudo-labelling fine-tuning (SPF) strategy for semi-supervised learning to mitigate the distributional differences between source and target domains. For both stages, we employ weak or strong image augmentation to suit different cross-domain tasks. Experimental results on benchmark datasets demonstrate that the proposed network can enhance domain adaptation ability for crater detection under varying scenario distributions.
1. Introduction
Delving into the topography and history of extraterrestrial planets (e.g., Mars and the Moon) through the analysis of impact craters is important for humans to explore outer space and broaden their cognition scope. Recent studies on crater detection have been conducted in the field of computer vision. However, the exploration of craters on these planets encounters various challenges [1,2,3]. For example, craters on different planets can exhibit significant differences in scale characteristics, density distributions, and background interference. Figure 1 shows two sample images from the LROC (Lunar Reconnaissance Orbiter Camera) dataset [4] and the DACD (Domain Adaptive Crater Detection) dataset [5], along with the distributions of craters in terms of scale variations on these two datasets. Overall, the LROC dataset contains smaller and more craters than the DACD dataset. Some images in the DACD dataset show severe background weathering, which significantly interferes with crater detection. Hence, detection models trained on known crater datasets are difficult to directly apply to new planets due to the domain gap. The development of a robust model with good generalisation abilities under significantly varying scenario distributions remains a great challenge.
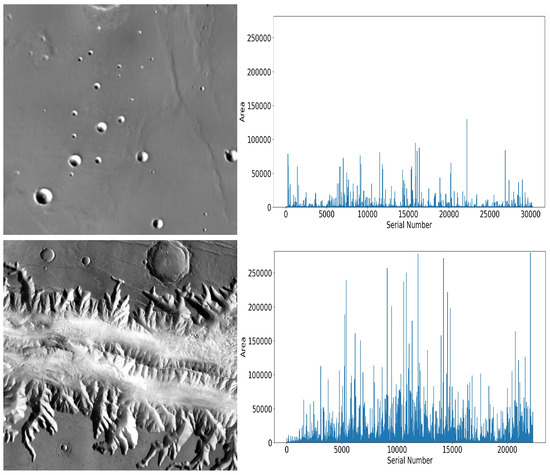
Figure 1.
(Top) One of the samples in the LROC dataset and the distributions of all craters in this dataset. (Bottom) One of the samples in the DACD dataset and the distributions of all craters in this dataset. Compared with the top sample, the bottom one has more background interference. According to the statistical results of these two datasets, the LROC dataset contains smaller and more craters than DACD.
Training a crater detection model that can adapt to the terrain of unknown exoplanets is challenging. Recent works [5,6,7,8,9] have attempted to address this issue. For example, the studies in [5,7,9] employ attention mechanisms or use dilated convolution to learn better feature representations. The work in [8] trains the model using generated data. However, due to the lack of sufficient real extraterrestrial data, existing generative models are not always effective. The studies in [5,9] develop progressive sampling strategies based on the subspace along the geodesic on the Grassmann manifold or Hough transforms to enhance the performance of crater detection. These methods assume that the cross-domain data distributions between source and target domains are similar, but in reality they vary significantly from one planet to another. To better learn the distribution of unknown target domains, some studies employ semi-supervised pseudo-labelling [10,11], consistent strategy training [12], and weakly supervised attention mechanisms [13]. In addition, some studies [14,15] attempt to mine hard samples by using a penalty function to enhance the model’s robustness. However, due to the significant domain gap, they do not generalise well to unknown distributions.
To improve the generalisation performance, in this paper, we propose a two-stage adaptive network (TAN) for semi-supervised cross-domain crater detection under varying scenario distributions. Our network is built on the YOLOv5 detector where a series of strategies are employed to enhance the cross-domain generalisation ability. In the first stage, we propose an attention-based scale-adaptive fusion (ASAF) strategy to handle objects with significant scale variances. We propose a smoothing hard example mining (SHEM) loss function to solve the issue of model overfitting on challenging examples. In the second stage, we propose a sort-based pseudo-labelling fine-tuning (SPF) strategy for semi-supervised learning to mitigate the distributional differences between the source and target domains. For both stages, we employ weak or strong image augmentation to suit different cross-domain tasks. Experimental results demonstrate the network’s strong domain adaptation ability for crater detection under varying scenario distributions.
The main contributions of this paper are summarised as follows:
- (1)
- We present an attention-based scale-adaptive fusion (ASAF) strategy. This strategy improves the model’s scale adaptability, which is helpful for detecting craters with significant scale variations.
- (2)
- We introduce a smoothing hard example mining (SHEM) loss function to address the issue that the model trained on the source domain is biased towards hard examples in the source domain, leading to poor generalisation to the target domain.
- (3)
- We design a sort-based pseudo-labelling fine-tuning (SPF) strategy. In SPF, we use the trained model from the source domain to generate high-quality pseudo-labels for the target domain. Subsequently, we fine-tune the model to make it adapt well to the target domain.
- (4)
- We adopt weak or strong image augmentation to suit different cross-domain tasks by taking into account the distribution characteristics of extraterrestrial planets.
2. Related Work
Over the past several years, object detection based on deep learning [16,17,18,19] has made great progress. Crater detection is also gradually gaining attention [5,6,7,8,9]. However, there are still several issues that have not yet been fully resolved, including the extreme imbalance of crater sizes, domain adaptation, and the absence of sufficiently labelled datasets.
2.1. Object Detection
For object detection, mainstream methods are based on feature pyramids and feature fusion. After the feature pyramid network (FPN) [17] was developed, there have been many variants [20]. For example, the work in [21] directly assigns shallow and deep features to different scales. After that, many methods such as top-down integration [17] and two-way integration [22] were developed. The classical approach [16] continuously reduces the feature map from top to bottom while fusing shallow features. Some subsequent studies have investigated bidirectional fusion features [20], or even more complex circular recursive fusion features [23]. However, most of the methods mentioned extract deep convolutional features through continuous subsampling, which is not ideal for detecting small objects.
A global receptive field can serve as an effective equaliser between large and small targets. The study in [24] examines the various receptive fields of images, while [25] employs hollow convolution to broaden the perceptual field, where attention is used to gather more contextual information. Some studies replace all the core convolutions of the backbone or neck network with attention modules [26,27]. Although these methods are good solutions to specific problems, shallow knowledge is still forgotten as the network layer deepens, and the information of small targets cannot be effectively propagated to deeper layers in the network.
Considering multiple-scale objects, image augmentation methods such as stitching and blurring [28] are used to balance the performance of large and small target detection. Because most of the hard-to-detect targets are small, researchers have conducted some data augmentation studies on small targets [28,29]. However, these augmentation methods are not suitable for cross-domain object detection, where uneven data distributions may be present in the source and target domains.
In view of the above problems, in this paper we propose the ASAF strategy to fuse shallow information and improve the detection ability of small objects. Furthermore, we employ different levels of data enhancement strategies (e.g., weak or strong image augmentation) to suit distinct cross-domain tasks by taking into account the distribution characteristics of extraterrestrial planets.
2.2. Domain-Adaptive Object Detection
Domain-adaptive object detection has achieved significant results [3,5,30,31]. In the field of crater detection, the target domain involves unknown extraterrestrial terrains and interference scenarios. Hence, researchers have made attempts in the directions of sample adaptation and model adaptation, most of which are based on the methods of adversarial learning or mutual supervised learning.
Some sample adaptation methods apply alignment strategies to address the differences between the source and target domains. For example, Ref. [32] attempts to align spatial distributions through intrinsic knowledge mining and relational knowledge constraints. Ref. [33] uses adversarial training and pseudo-labelling to adapt to the target domain. In this way, the model gradually learns the target domain, and the data in the target domain guide the classifiers to achieve a cross-domain effect. However, these methods require a thorough understanding of the similarities and differences between the target and source domains. If the target domain and its spatial distribution are unknown, these methods may not be effective.
Some model adaptation methods are based on the idea of cross-domain-adaptive modules. The design of adaptive modules allows unsupervised adaptation of the model to the target domain. Some studies have developed modules to help assess the consistency between domains [34] for improved alignment. There are also modules based on knowledge-mining strategies [35], by which the images are re-modelled and the network is guided to distinguish the similarities and differences between the domains.
Inspired by the above works, in this paper, we propose the SPF strategy to make the model trained on the source domain learn the distribution of the target domain after fine-tuning and obtain high-quality pseudo-labels.
2.3. Object Detection with a Scarcity of Labelled Data
Currently, there is no high-quality benchmark dataset for crater detection, and the quality of datasets is often uneven. To the best of our knowledge, only a few crater datasets [6,8,36] have been made available and there is currently no extensive benchmark dataset similar to COCO or PASCAL VOC. Because deep learning is data-hungry, generative learning [8,37,38] has gained attention for acquiring training data. There are also some works that use text to generate images [39]. Due to the scarcity of labelled data, it is currently challenging to synthesise real crater data.
Recent studies [10,12,33] have employed semi-supervised algorithms to address the limited labelled data through consistency-based learning or pseudo-labelling. Consistency-based learning algorithms use two networks to learn the consistency of output results for the same unlabelled images under various perturbations. As a result, information from unlabelled data is fully utilised. Pseudo-labelling algorithms [10,33] use models pre-trained on labelled data to generate pseudo-labels for unlabelled data during model training.
In case of limited labelled data, some studies [15,40] tackle this issue by increasing the penalty for erroneous samples, or by employing hard example mining strategies [41]. However, these studies do not address the cross-domain problem. When applied to cross-domain crater detection, the model is more biased towards challenging examples in the source domain, which fails to generalise well to the target domain with simple distributions.
Due to the great disparity of craters on different exoplanets, we need to develop some strategies to make the model adaptive to varying scenario distributions. Based on the above works, in this paper, we propose the SHEM loss function. It aims to identify challenging examples in the source domain with complex distributions, while facilitating the model’s adaptation to the target domain with simpler distributions. By contrast, if the source domain has relatively simple distributions, we only adopt the common hard example mining loss to make our model adaptive to the target domain with complex distributions.
3. Proposed Method
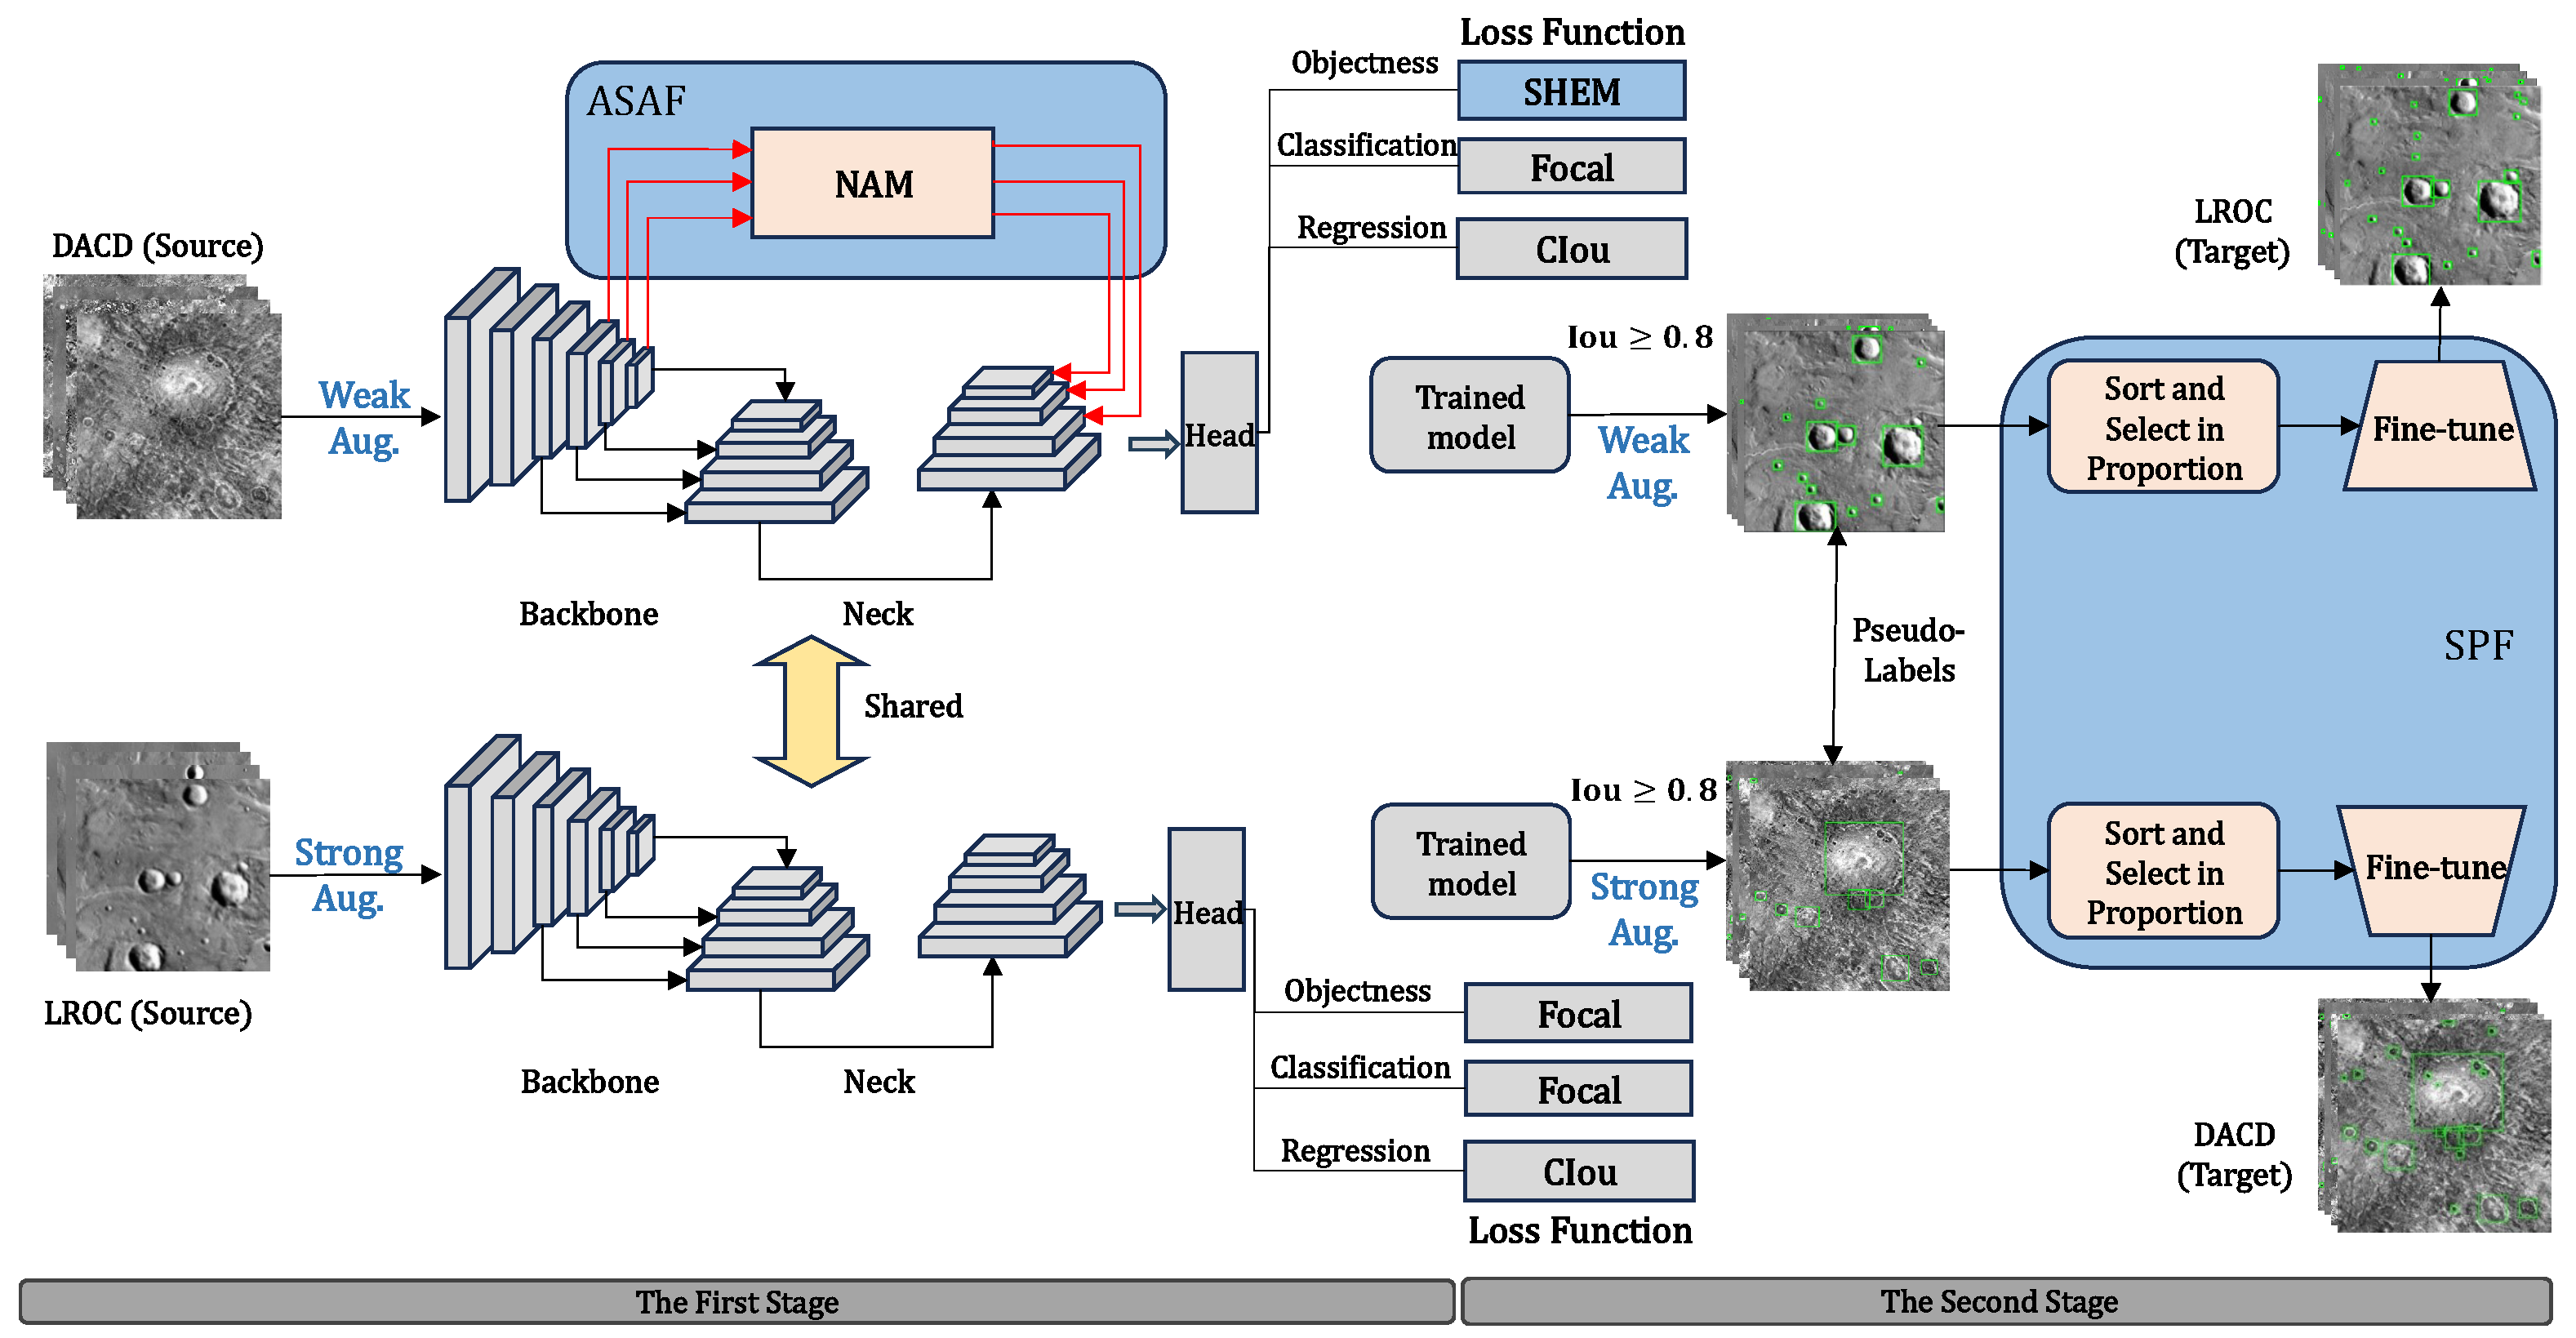
Figure 2 shows the proposed framework TAN, which mainly consists of the following four new components: the attention-based scale-adaptive fusion (ASAF) strategy, the smoothing hard example mining (SHEM) loss functions, the sorting-based pseudo-labelling fine-tuning (SPF), and the data augmentation strategy.

Figure 2.
The architecture of our proposed two-stage TAN model for cross-domain crater detection. The first stage: (1) ASAF utilises the attention-based NAM (Normalisation-Based Attention Module) to fuse shallow information to improve scale adaptation abilities; (2) the SHEM loss function is used to alleviate the bias of the model. The second stage: The SPF strategy is adopted to sort and select high-quality pseudo-labels which are used to fine-tune the model. In these two stages, we adopt weak or strong image augmentation to match different cross-domain tasks. The new components are highlighted in blue font or regions.
Specifically, Figure 2 illustrates two types of cross-domain tasks. The upper section of this figure illustrates cross-domain detection using the DACD dataset as the source domain and the LROC dataset as the target domain. This is a detection task from the complex to the simple domain. Hence, we adopt weak augmentation, ASAF, and SHEM to train our model in the source domain, followed by fine-tuning to learn the distribution of the target domain.
The bottom part of this figure illustrates cross-domain detection from simple to complex. That is, we use the LROC dataset as the source domain and the DACD dataset as the target domain. In this case, we rely on strong augmentation and the focal function (without ASAF) to mine challenging examples in the source domain. This approach facilitates subsequent learning in the target domain with complex distributions.
The motivations for the use of different first-stage training processes are as follows. For the cross-domain problem, craters in the source and target domains can have different scenario distributions (complex or simple). If the source domain is complex, we use a weak augmentation method to prevent the model over-learning the complex features. We also use the ASAF strategy to mitigate the extreme scale variations in craters (too big or small). In addition, we use the SHEM to mitigate the model bias towards hard examples and achieve better generalisation ability. On the contrary, if the source domain is simple, we use the strong augmentation to enhance the robustness of our model, and the ASAF and SHEM are accordingly no longer needed.
3.1. Attention-Based Scale-Adaptive Fusion (ASAF)
As the convolutional layers deepen, shallow and subtle target features are more likely to be overlooked. In addition, due to limited labelled data and potential interference, models tend to be biased towards the training data. Therefore, integrating the initial feature maps and emphasising informative features can mitigate this bias and enhance the model’s robustness.
Motivated by these observations, we introduce an ASAF strategy to integrate shallow information into the deeper layers. Specifically, our model architecture is based on the YOLOv5 [42], which consists of three main components: backbone, neck, and head. The core modules of the backbone and neck are C3, including three Conv blocks and a bottleneck block. Additionally, the backbone incorporates the focus structure, while the neck utilises the FPN [17] with the PAN (Path Aggregation Network) [22] architecture. We pass the shallow feature maps of different stages to the NAM (Normalisation-Based Attention Module) [43], and then, fuse the feature maps P3, P4, and P5 in the backbone and the neck (refer to Figure 3). Here, P denotes the feature maps of various sizes acquired from different layers of the network in the YOLOv5 architecture. Furthermore, to extract global long-range features, we incorporate C3TR (C3 + Transformer block [44]) into the backbone by replacing a series of bottlenecks in the C3 with one Transformer block [44]. In addition, we inject multiple C3 modules into the neck after fusing shallow attention-based feature maps. These C3 modules collectively contribute to improved performance for detecting large targets.
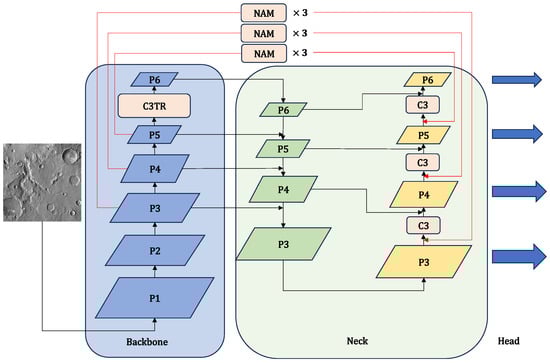
Figure 3.
Illustration of our model architecture with the ASAF strategy. To prevent the model from losing crucial information, we incorporate C3TR (C3 + Transformer) into the backbone. We pass the shallow feature maps of different stages to NAM to obtain shallow attention-based feature maps. We also inject multiple C3 modules into the neck to detect large targets.
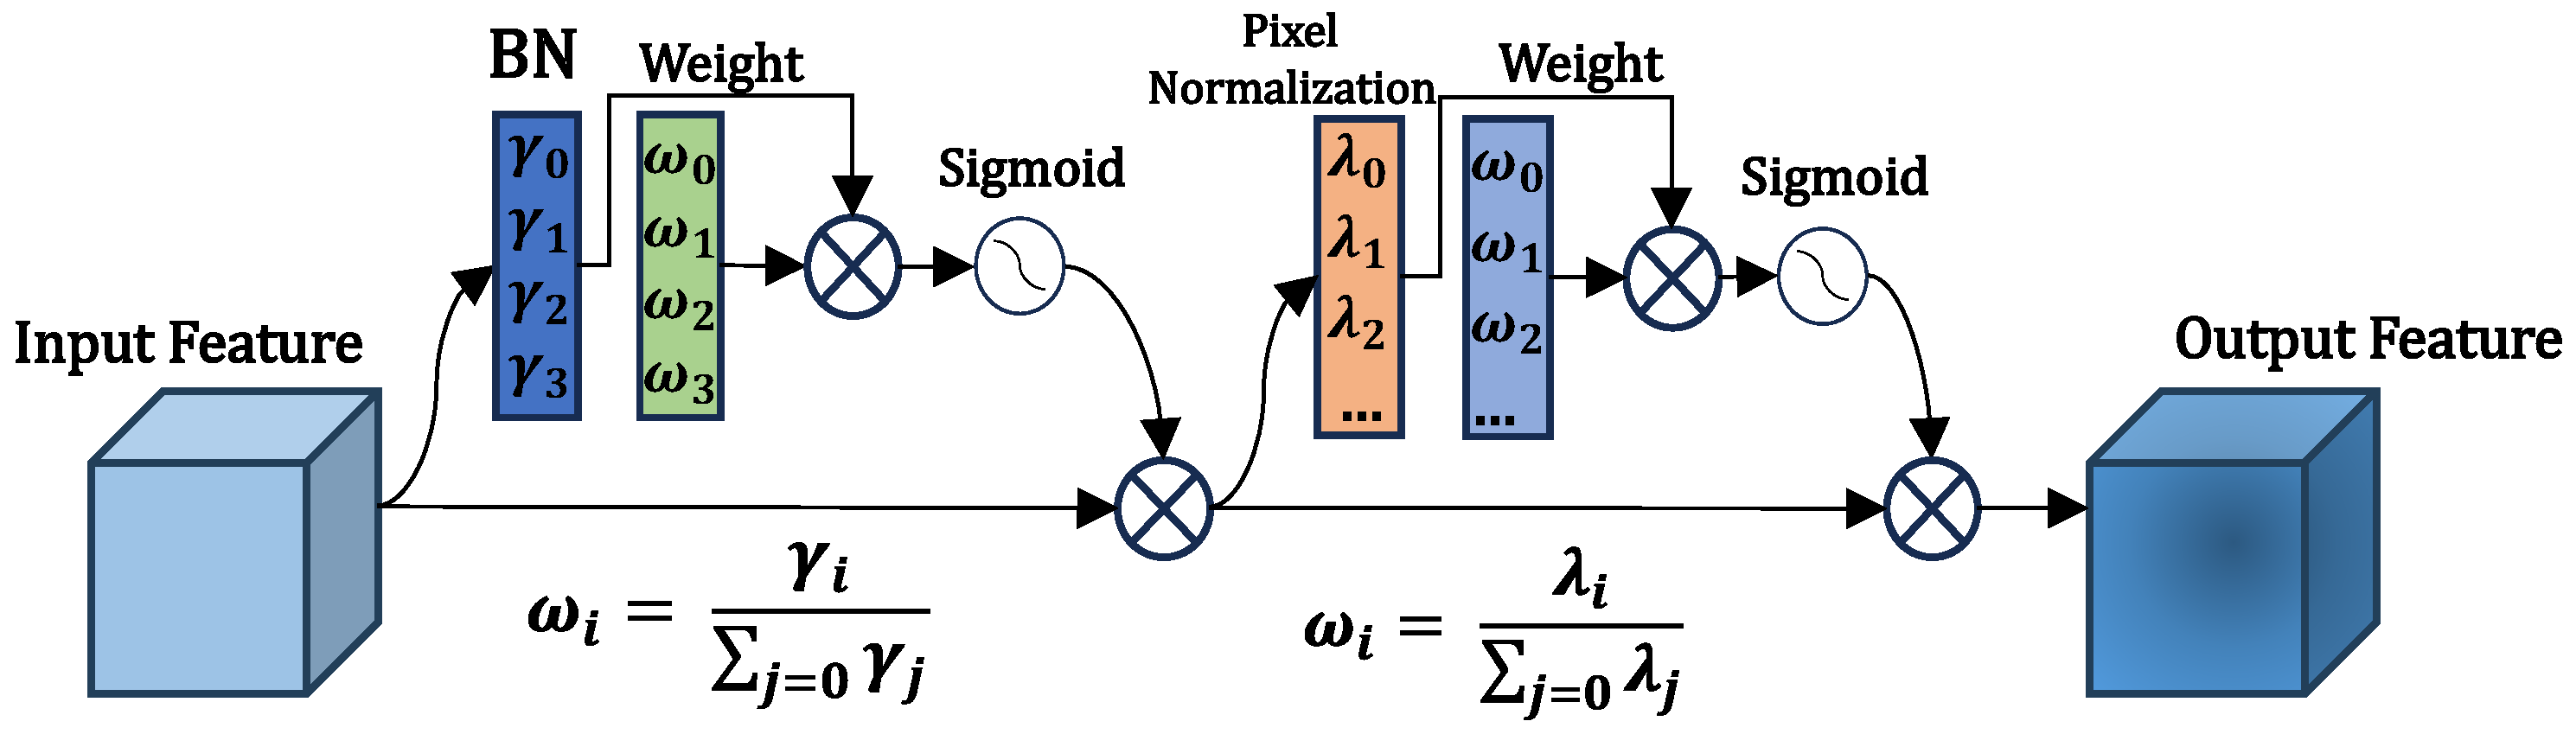
The details of NAMs [43] as attention mechanism modules are shown in Figure 4. Each NAM contains the CBAM (Convolutional Block Attention Module) [26] with some modified channel and spatial attention sub-modules. To be specific, the channel attention sub-module uses the scale factor in batch normalisation (BN), which measures the variance in the channels and indicates their significance. This can be formulated as follows:
where and are the mean and standard deviation of the mini-batch B, respectively; and are trainable affine transformation parameters (i.e., scale and shift). Assume that F1 is the input feature and is the output feature; they are given in the following equations:
where represents the output feature, is the scaling factor for each channel, and the weights are obtained as . Similarly, for the spatial attention sub-module, the formula for the spatial attention mechanism is given below:
where is the scaling factor of BN (i.e., pixel normalisation in Figure 4), the weights are , and the output is denoted as .

Figure 4.
The architecture of NAM [43].
3.2. Smoothing Hard Example Mining (SHEM)
The original YOLOv5 utilised the binary cross-entropy (BCE) loss function for classification and objectness. However, we found that the focal loss [45] outperforms BCE for binary crater detection due to its superior ability to balance positive and negative examples. The focal loss function is computed as follows:
where y represents the true label, q represents the predicted probability, represents the focal parameter, and is the correction parameter. The above equations can be summarised as the following equation:
To address challenging target detection where significant background interference and complex distributions are present, we introduce a loss function to mine hard examples. First, we employ the balance factor to enhance the focal loss function, known as the equilibrium focal loss (BFL) [14], defined as
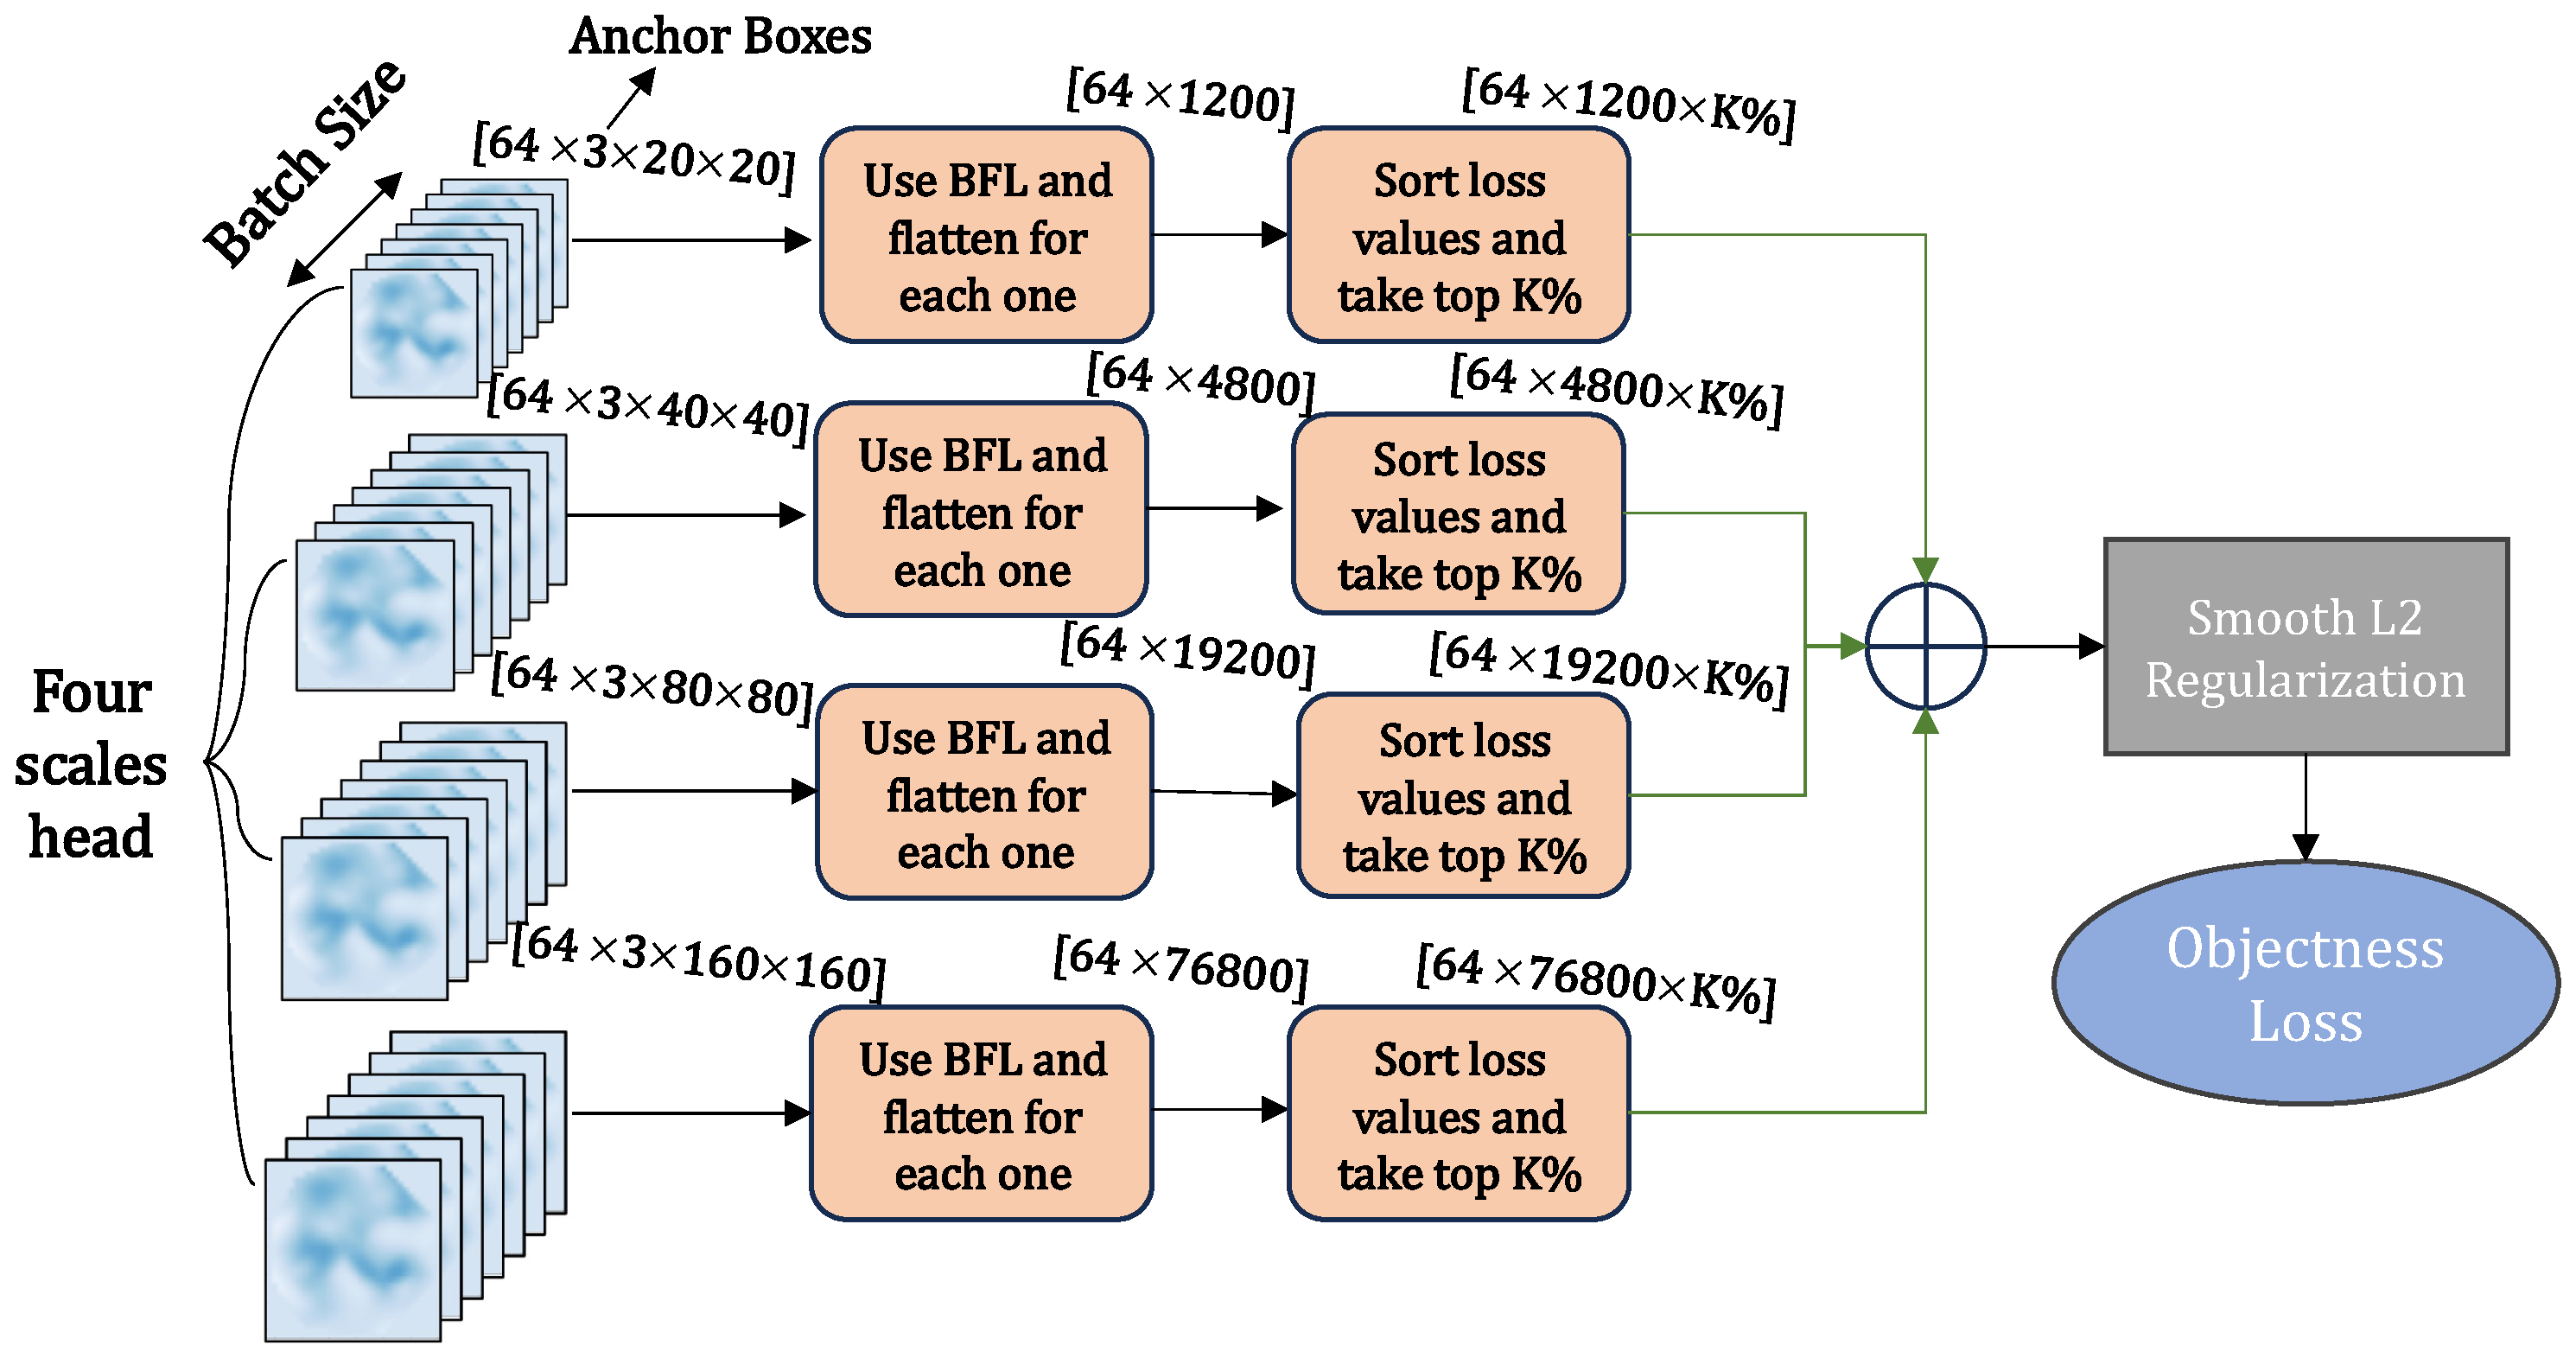
Based on Equation (7), we calculate BFLs for the feature maps at various scales, each with a distinct distribution of loss values. Then, we select the top K% of loss values that have been sorted as the loss values for the feature maps. Subsequently, we average and weigh the loss values at different scales to obtain the Loss Rank Function (LRM). Considering the substantial variations in crater scales, we extended the final head in the YOLOv5 model to four scales. While the LRM [14] loss function enables the model to learn numerous hard examples, its emphasis on hard examples may lead to overfitting on the source domain dataset. Therefore, we introduce the SHEM loss function to calculate the objectness loss. The computation framework of the SHEM loss function is depicted in Figure 5, and can be formulated as follows:
where w denotes a weight vector, and denotes a regularisation parameter (we set its value to ). Here, we utilise L2 regularisation to ensure the model gradually learns hard examples and mitigate the risk of overfitting. As shown in Figure 2, we use the three losses, i.e., SHEM, focal, and complete intersection over union (CIoU) losses to train our first-stage model for cross-domain detection (from complex to simple).

Figure 5.
The overall flow of the SHEM loss function. We calculate BFLs for the feature maps at four scales, each with a distinct distribution of loss values. Then, we select the top K% of loss values that have been sorted for the feature maps. Subsequently, we average and weigh the loss values at different scales to obtain the Loss Rank Function (LRM), followed by L2 regularisation to obtain the objectness loss.
3.3. Sorting-Based Pseudo-Labelling Fine-Tuning (SPF)
The gap between the source and target domains for crater detection can be significant, especially in the case that the target domain is entirely unknown to the source domain and lacks label information. Therefore, it is impractical to use the conventional learning model to obtain the feature distribution of the target domain. To address this issue, we employ pseudo-labelling to fine-tune the model, as detailed below.
The source domain dataset with labels is denoted as , where is the total number of samples, denotes the image sample, and denotes the corresponding sample labels. The target domain dataset without labels is denoted as , where is the total number of samples in the target domain. After obtaining the trained detection model in the source domain (denoted as ), as introduced previously, we apply to the unlabelled target domain to obtain the pseudo-labels for the image , i.e.,
To fully learn the distribution of the target domain with high-quality pseudo-labels, we sort images in descending order based on the number of detected objects in each sample and choose a subset of them as our fine-tuning training set. The formula is as follows:
Here, is the pseudo-labels for the jth image after sorting and selection, and h is the selected proportion, defined as
where is a control parameter, which is used to balance the number of pseudo-labelled data used for fine-tuning and the source data. The balance is achieved by setting a relatively small value if the amount of source data is much larger than that of the target data, and a large value if the amount of source data is much smaller than that of the target data.
Subsequently, we fine-tune the pre-trained model , which is obtained in the first stage, on as well as the corresponding images for 2–3 rounds by freezing the backbone parameters (the first 10 layers in the model). The calculation process is illustrated in Figure 2.
3.4. Data Augmentation Strategy
A challenge arises when the model trained on the source domain fails to adapt to the target domain due to a lack of understanding of the target domain’s distributions. Moreover, in the new domain, the model may encounter interference from unknown environments, and is influenced by factors such as different signal-to-interference ratios and background complexity. These domain gaps make the model hard to transfer between different domains, resulting in inaccurate detection results.
To address this issue, we propose a domain-adaptive data augmentation strategy for cross-domain detection that distinguishes between complex and simple data distributions. As shown in Figure 2, models trained on the source domain with less background interference tend to be less robust. To address this issue, we employ strong data augmentation techniques (e.g., affine transformation and random mosaic) to increase the complexity of the training data. Conversely, for the source domain data with complex distributions, we only apply minor data augmentation techniques (e.g., simple flipping and stitching) to ensure that the model learns from smoother data. In this way, the model becomes better adapted to the smoothed domain for cross-domain detection.
4. Experiments
In this section, we first introduce the datasets used for our experiments, and then, introduce the used evaluation metrics and our implementation details. Next, we compare our method with the state of the art (SOTA) and perform ablation experiments. After visualising the detection results, we provide some discussions on our method.
4.1. Datasets
We use the following three datasets for our experiments.
DACD Dataset. The DACD [5] (Domain Adaptive Crater Detection) dataset contains two scenes of craters: the day craters and the night craters on Mars. It consists of 1000 images from 90°S to 90°N latitude and 180°W to 180°E longitude, leading to more than 20,000 craters in total. The size of these craters is about 5 pixels to 300 pixels. The scenario of the dataset contains a lot of noisy interference.
LROC Dataset. To validate the effectiveness of our model for solving the cross-domain problem, we choose a public crater dataset [4], which is obtained by the Lunar Reconnaissance Orbiter Camera (LROC). It consists of 866 images of size 416 × 416 pixels captured on the Moon. The size of most of the craters is between 3 pixels and 200 pixels, and the craters are relatively densely distributed.
DOTA Dataset. In addition, we demonstrate the generalisation ability of our model on the large public remote sensing dataset DOTA [46] (A Large-scale Dataset for Object Detection in Aerial Images). It consists of 2806 aerial images from different sensors and platforms. There are 15 categories of images (about 4000-by-4000 pixels) which exhibit a variety of scales, orientations, and shapes.
4.2. Evaluation Metrics
We use recall, precision and mean average precision (mAP) to evaluate our model; these are defined as follows.
The quality of a single detection box is determined by the IoU value, which is the intersection ratio between the predicted and actual detection frames. We use recall and precision to evaluate the performance of the network model by setting the IoU threshold to 0.5 by default, i.e.,
When the IoU of the detection frame is greater than or equal to 0.5, it is classified as a true positive (TP); otherwise, the detected crater is classified as a false positive (FP). FN represents the number of false negatives, and TN is the number of negative samples that are correctly identified.
In addition to the above metrics, we use mAP to calculate the mean value of AP for all classes, where AP is the area under the precision–recall curve. In our experiments, we calculate two kinds of mAPs: (1) mAP@.5 by setting IoU to 0.5; (2) mAP@.5:.95 by varying IoU from 0.5 to 0.95 with an interval of 0.05 and averaging the results.
4.3. Implementation Details
In our experiments, we use the YOLOv5 [42] as our baseline. For dataset splitting, we split the source dataset into training and validation sets in a ratio of 8:2. We use Pytorch as our deep learning framework, and we resize the images to pixels during training. We adopt SGD [47] as our optimiser and use momentum gradient descent as our learning strategy with an initial learning rate of 0.01, 3 rounds of iteration once, and a weight decay of 0.0005. All the experiments are run on a 3.70 GHz and 18-processor Intel Xeon W-2255 CPU, and an Nvidia GeForce RTX 3080Ti GPU with 12 G memory.
4.4. Comparison with State-of-the-Art Methods
In this section, some comparisons with other models are conducted on the three datasets. We use MMDetection [48] as a tool. According to their working principle, some backbone networks are introduced for object detection in some models.
4.4.1. Comparisons on DACD Dataset and Cross-Domain from DACD to LROC
Some SOTA detection methods are selected in Table 1 for comparison with our model. Compared with some two-stage models (e.g., Faster R-CNN [16] and Libra R-CNN [49]), our model demonstrates superior precision but slightly inferior recall performance. Compared with single-stage detection models (e.g., YOLOv5 [42] and YOLOv7 [50]), our model achieves better detection performance in both precision and recall. In Table 1, the PVT has only a slightly higher recall, but the precision is much lower than our model. Finally, for cross-domain detection (from the DACD dataset to the LROC dataset), our model slightly improves the baseline YOLOv5 in precision, but achieves a significantly better result in recall (about 24.04%) than the baseline.

Table 1.
Performance comparison on the DACD dataset and cross-domain detection from DACD to LROC.
These results show that our proposed ASAF can achieve good generic detection performance by combining shallow information without cross-domain detection. After migrating to the LROC dataset, our model achieves the best results in terms of both precision and recall, demonstrating the effectiveness of SPF used in the second stage.
4.4.2. Comparisons on LROC Dataset and Cross-Domain from LROC to DACD
As shown in Table 2, the proposed model achieves the best performance in terms of precision. Due to the shallow information propagation using an attention-based scale-adaptive fusion strategy, our model can accurately detect small craters in the samples from the LROC dataset. When the model trained on the LROC dataset is tested on the DACD dataset, our model improves the baseline YOLOv5 [42] by 6.02% in terms of recall. This is because the use of SPF and the data augmentation strategy can adapt to the distribution of the target domain. The recall of our model is worse than that of PVT [57] and ATSS [58]. The reasons are as follows. The DACD dataset consists of high-resolution images which contain crater objects with unbalanced distributions, while LROC consists of images containing dense small crater objects. As ATSS is dedicated to addressing the unbalanced sample problems for object detection, it generally achieves good results on the DACD dataset. Due to the use of the convolution-free pyramid attention mechanism, PVT has a natural advantage for the dense small object detection task (see the results of recall on LROC), and still maintains excellent performance on the DACD dataset for the cross-domain problem.
Table 2.
Performance comparison on the LROC dataset and cross-domain detection from LROC to DACD.
4.4.3. Comparisons on the DOTA Dataset
In this section, we use a large remote sensing object detection dataset, DOTA [46], to evaluate the model’s performance on the generic detection task. The DOTA dataset contains many small targets and has a wide variety of scenarios. We follow the training and testing settings defined in [46] to evaluate the models on the DOTA dataset. We show the results in Table 3, where we have listed the AP value for each object category. The abbreviations of the categories are described as follows: BD—baseball field, GTF—runway, SV—small vehicle, LV—large vehicle, TC—tennis court, BC—basketball court, SC—storage tank, SBF—soccer field, RA—roundabout, SP—swimming pool, HC—helicopter. As can be seen from Table 3, our model shows better mAP performance compared to other methods, with the exception of YOLOv7. However, as shown in Table 1 and Table 2, YOLOv7 [50] exhibits poorer performance than our model for cross-domain crater detection. There are also some models [57,58] that perform well when the DACD dataset is used as the source domain, but show poor generalisation and robustness on the DOTA dataset because they struggle to adapt to complex changes. This proves that our model can guarantee no performance degradation in the generic remote image object detection task, in addition to demonstrating good generalisation abilities for cross-domain crater detection.
Table 3.
Performance comparison on the DOTA dataset.
4.5. Ablation Studies
The comparison results presented in Table 1, Table 2 and Table 3 demonstrate that the proposed TAN is superior to many state-of-the-art methods. In the following section, we comprehensively analyse TAN from three aspects to explore its superiority. For this purpose, we perform ablation experiments by using DACD as the source domain and LROC as the target domain.
(1) Effects of replacing NAM in the model by using different attention mechanism modules with an SHEM or a focal loss function. To this end, we do not use data augmentation strategies and SPF, and define YOLOv5 as the basic scheme, which uses the focal loss for objectness (without any attention mechanisms). Based on YOLOv5, we evaluate the effects of different attention mechanisms and loss functions on the precision and mAP@.5:.95, as illustrated in Figure 6. Here, Trans stands for the Transformer block [44], Bif stands for the Vision Transformer with Bi-Level Routing Attention block [27], SE stands for the SE block in Squeeze-and-Excitation Networks [59], CBAM stands for the Convolutional Block Attention Module [26], ECA stands for the Efficient Channel Attention block [60], and GAM stands for the Global Attention Mechanism block [61]. As show in Figure 6, the adopted SHEM outperforms the focal loss with respect to both evaluation indicators. The use of different attention mechanisms can generally improve the performance of the basic YOLOv5. Among them models, our adopted NAM [43] achieves the best performance. The above results show that our proposed method, using NAM coupled with the SHEM loss function, has good generalisation ability for cross-domain crater detection.
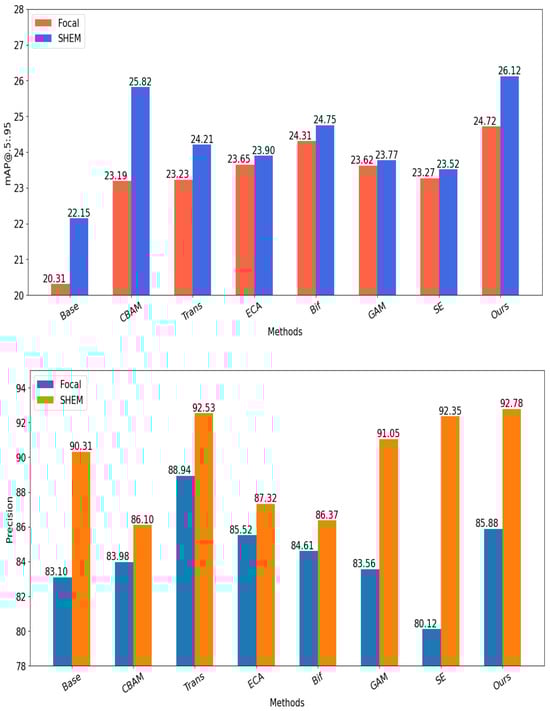
Figure 6.
Ablation experiment on different attention mechanism modules and loss functions for cross-domain crater detection from DACD to LROC.
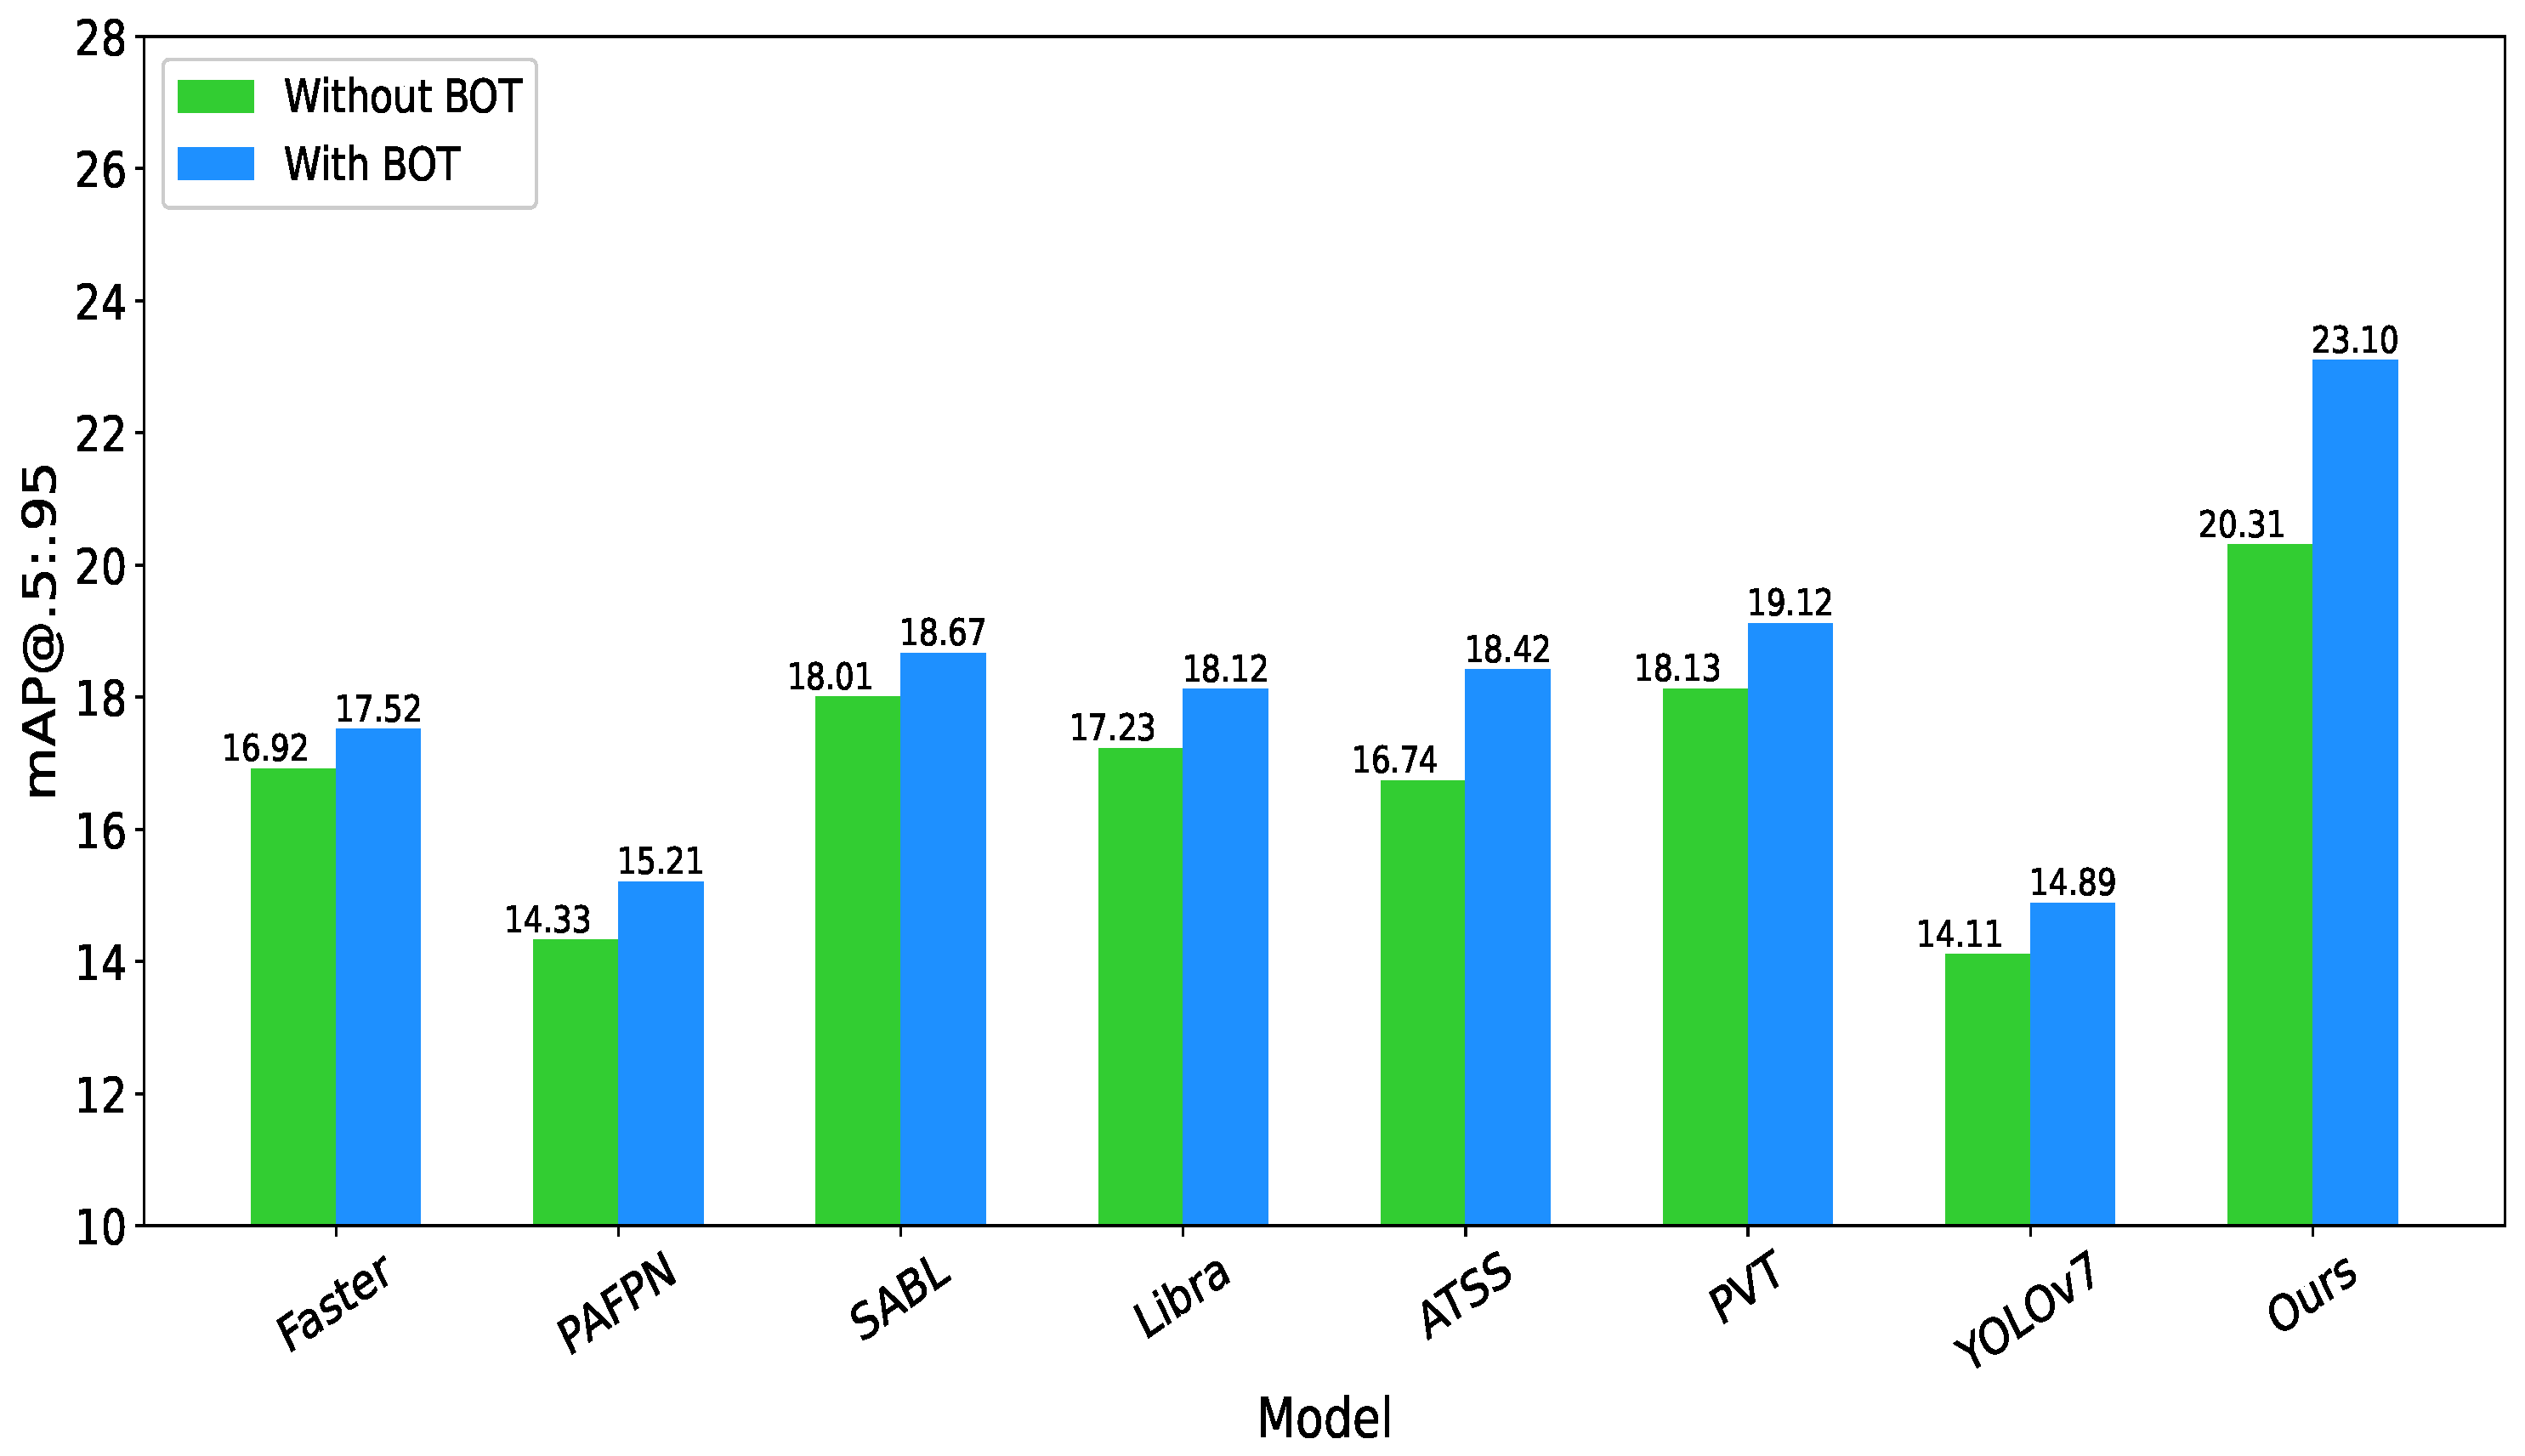
(2) Effects of data augmentation and SPF. The two strategies in our model complement each other, and we refer to it as BOT (bag of tricks) for cross-domain crater detection experiments from DACD to LROC. To validate their effectiveness, we do not use ASAF and SHEM in all the compared models. Instead, we compare the results using mAP@.5:.95 as the evaluation indicator. As shown in Figure 7, the use of BOT improves the mAP@.5:.95 for all the compared models. In particular, our model improves the mAP@.5:.95 value by 2.79 when BOT is used, demonstrating its effectiveness for cross-domain crater detection. In order to verify the effectiveness of the two strategies individually, we conduct experiments by only using SPF and the resulting mAP@.5:.95 is 21.98%. By comparing the results obtained using BOT (i.e., 23.10%) and without using BOT (i.e., 20.31%), we can see the efficacy of both data augmentation and SPF.
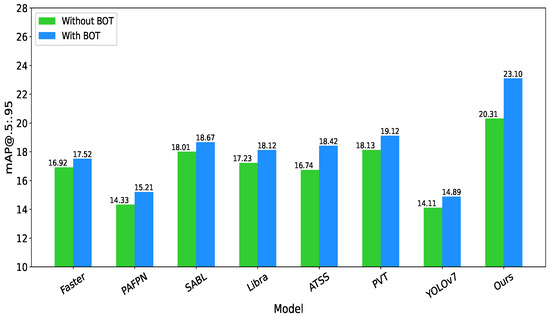
Figure 7.
Ablation experiment on BOT (data augmentation and SPF) for cross-domain crater detection from DACD to LROC, where the Faster refers to Faster R-CNN [16] and Libra refers to Libra R-CNN [49].
(3) Effects of different combinations of our proposed components. To this end, we conduct ablation experiments on different combinations of the proposed ASAF, SHEM, and BOT. As can be seen from Table 4, each component helps to improve the recall and mAP@.5:.95. When all the three components are used, our model achieves the best results, demonstrating the effectiveness of these components.
Table 4.
Ablation experiments on different combinations of our proposed strategies for cross-domain crater detection from DACD to LROC.
4.6. Visualisation
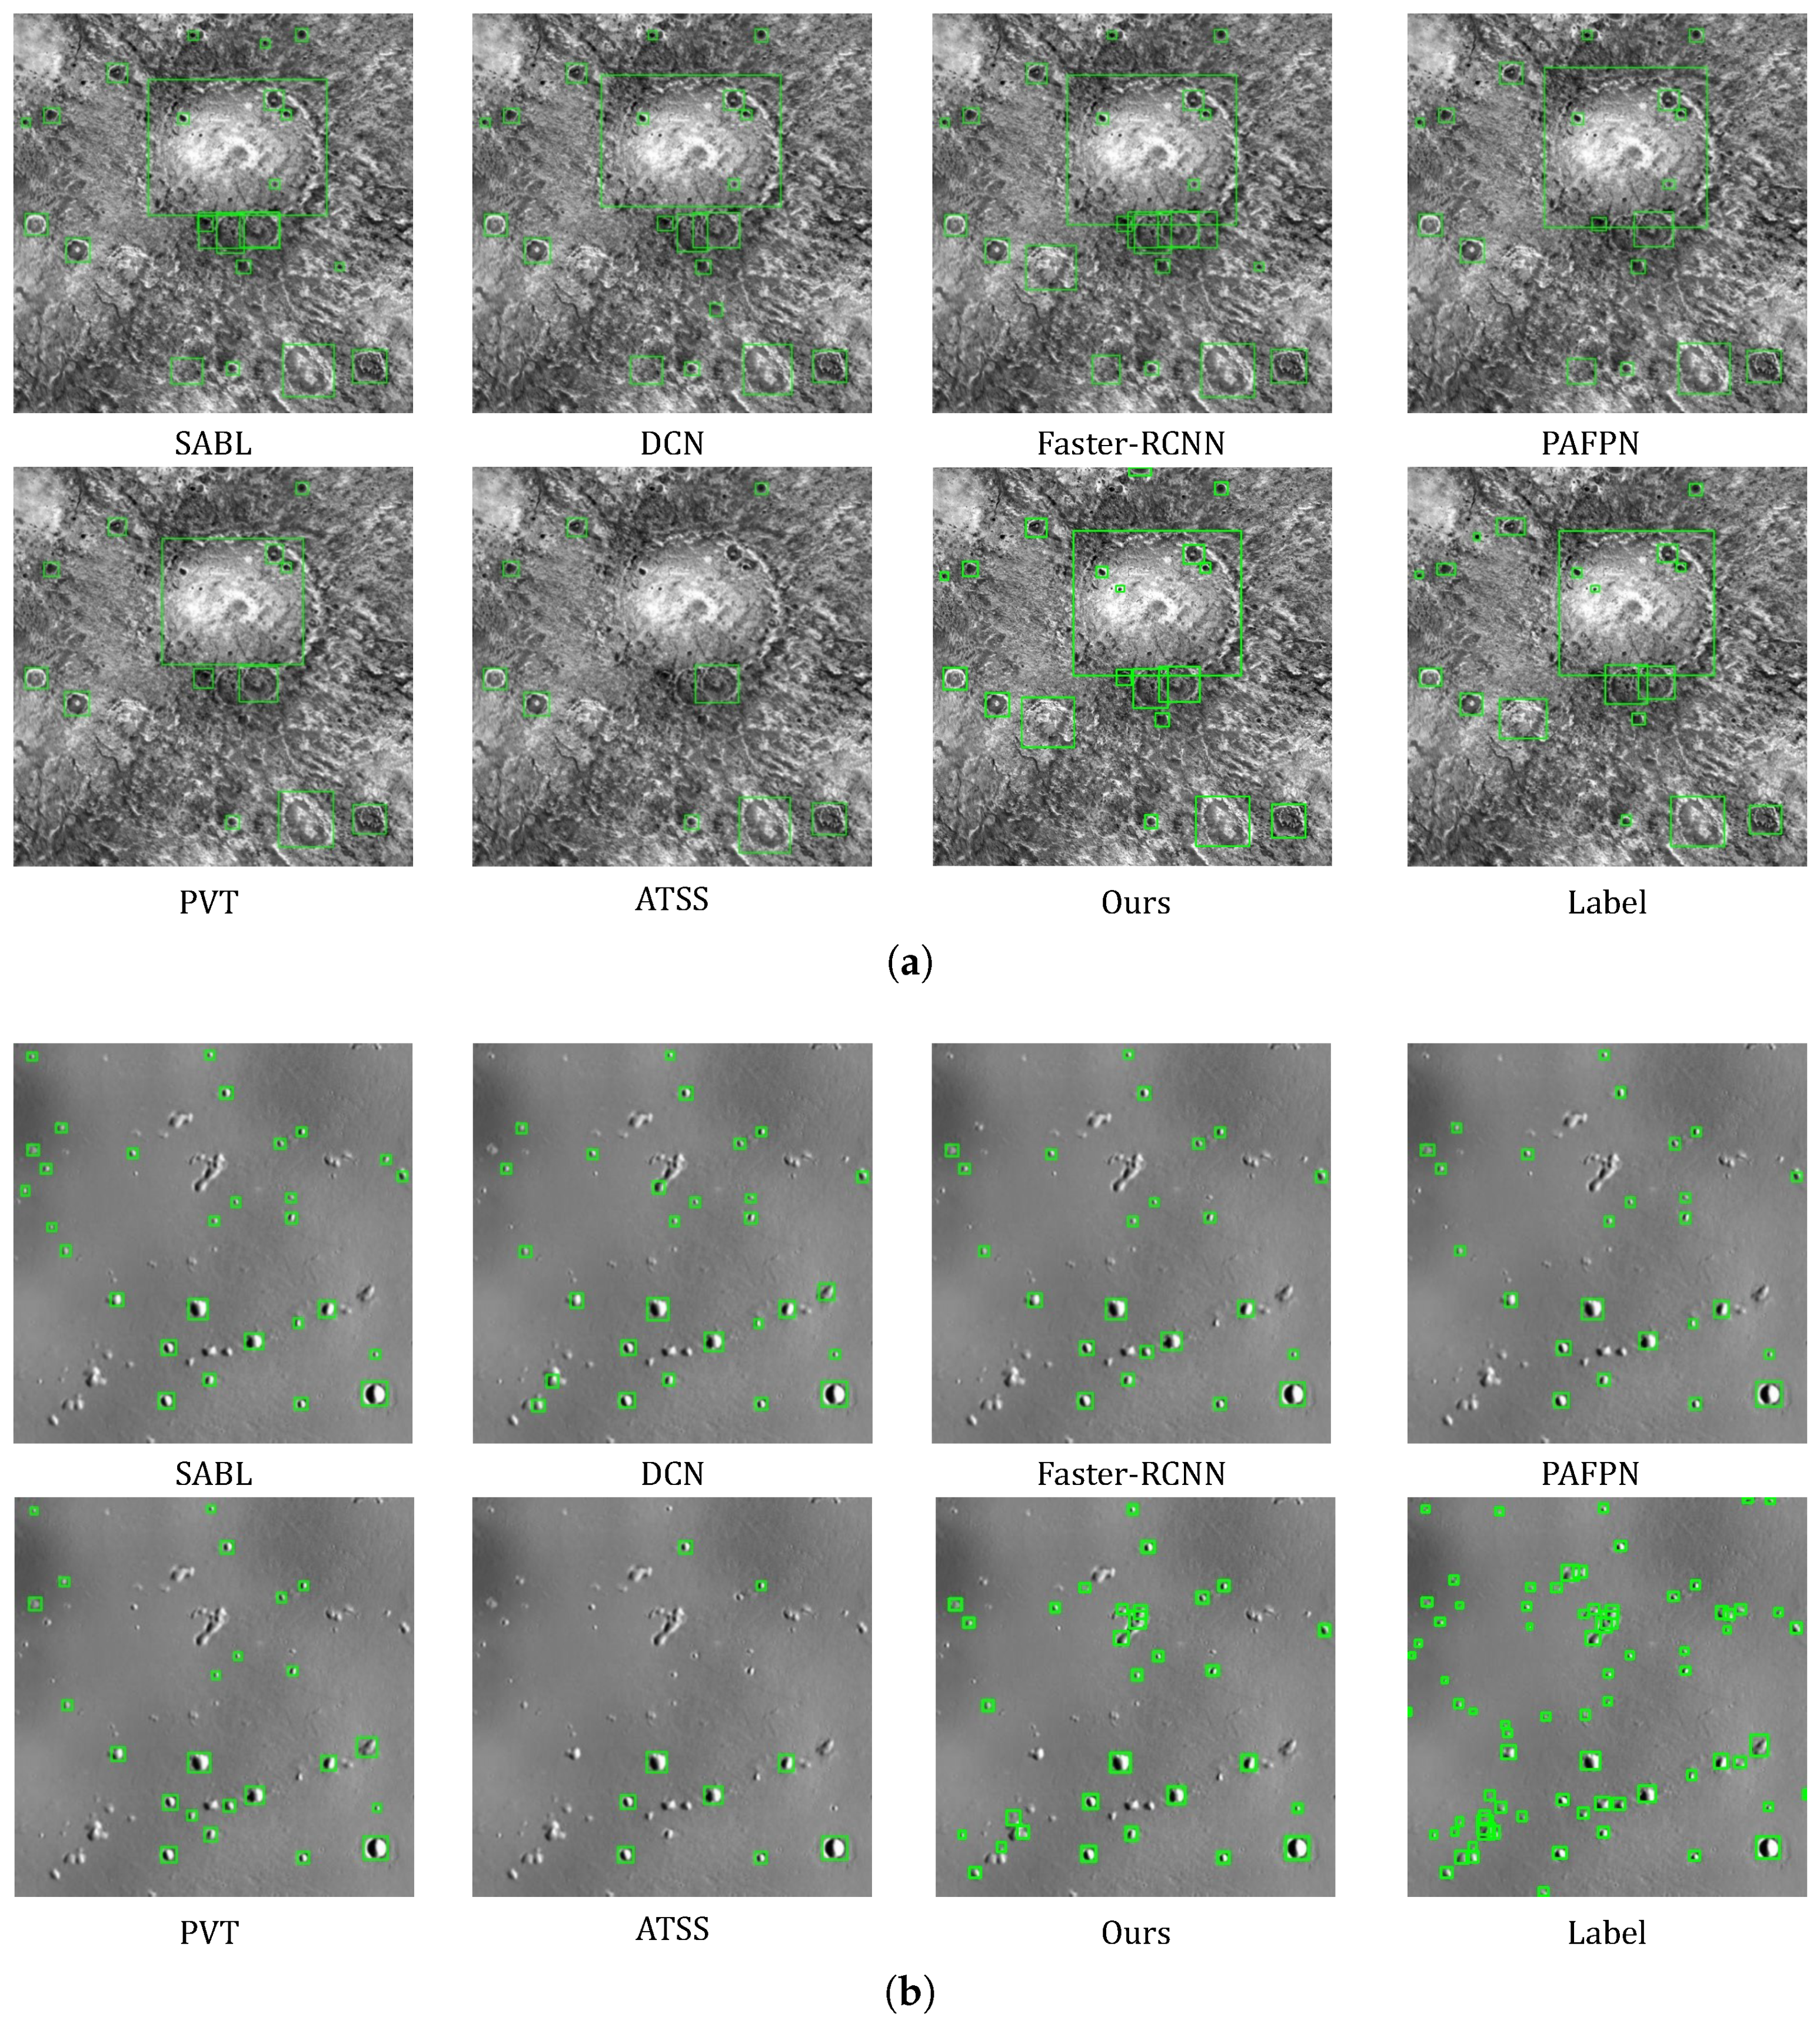
We visualise the detection results of different models on the DACD dataset. As can be seen in Figure 8a, our model demonstrates good detection results. ATSS [58] misses larger-scale craters, PVT [57] overlooks some small craters, and Faster R-CNN [16] detects more craters. For the cross-domain detection from DACD to LROC, our model detects more craters than other models, while ATSS misses many small craters, as shown in Figure 8b. Thus, our model has better generalisation ability, which enables it to adapt more effectively to cross-domain scenarios with different background distributions.
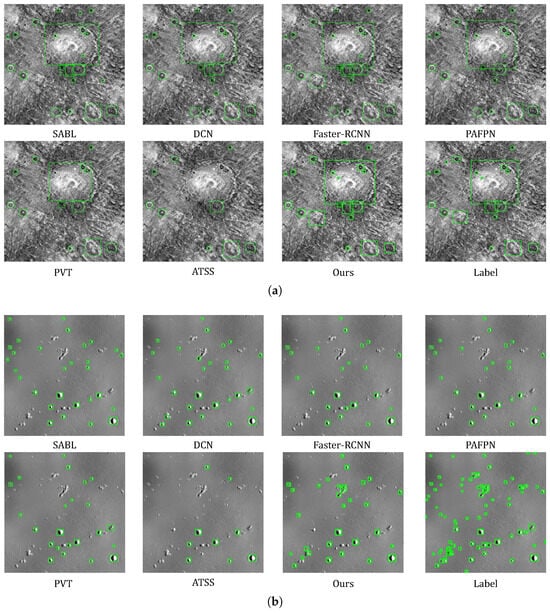
Figure 8.
Visualisation of the detection results of different models on the LROC dataset as well as the cross-domain detection results. (a). Visualisation of the detection results of the proposed method and the mainstream methods on the DACD dataset. (b). Visualisation of the detection results of the proposed method and the mainstream methods for cross-domain detection from DACD to LROC.
4.7. Further Discussion
In future research, we aim to enhance the model’s performance based on lower-quality labelled datasets. Our findings emphasise the significant challenge of accurately labelling craters in images. The manual labelling process is inherently complex and prone to errors. As such, our focus will shift towards techniques for weakly supervised target detection with incomplete labels or entirely unsupervised targets. We are committed to addressing the issue of effectively identifying more craters in scenarios involving poor data quality or incomplete labels.
In addition, we conduct experiments using different backbone networks in Table 5. As can be seen, the results obtained by using the backbone networks with a large number of parameters are not necessarily better. For backbone networks with a small number of parameters, such as ConvNeXt [62] and Ghost [63], the detection results are pretty good. Therefore, in future research we will investigate lightweight backbone networks which can still maintain high-quality detection results for practical applications.
Table 5.
Results obtained by using different backbone networks on the DACD dataset.
5. Conclusions
In this study, we propose TAN, a two-stage adaptive network for semi-supervised cross-domain crater detection. TAN is based on the YOLOv5 detector, which incorporates a series of strategies to improve the cross-domain generalisation abilities. In the first stage, we propose an attention-based scale-adaptive fusion strategy to address the scale variation issue of crater objects. We also propose a smoothing hard example mining loss function to solve the issue of overfitting on hard examples. In the second stage, we propose a sort-based pseudo-labelling fine-tuning strategy by using the trained model in the first stage to address the distributional differences between the source and target domains. For both the stages mentioned above, we employ weak or strong image augmentation to suit different cross-domain tasks (from complex to simple or vice versa).
To validate the performance of our network, we conduct ablation experiments on the DACD and LROC datasets, as well as cross-domain experiments. We also validate the generality of our model on a large remote sensing dataset called DOTA. All of our ablation experiments demonstrate the strong domain-adaptive ability of our model under varying scenario distributions.
Future Work. We will further improve our model’s generalisation ability, especially in case of poor data quality or very limited labelled data. In addition, we will explore lightweight models which can maintain good detection results.
Author Contributions
Methodology, Y.L.; Software, Y.L.; Validation, Y.L.; Formal analysis, Y.Z.; Resources, R.L.; Data curation, C.X.; Writing—original draft, Y.L.; Writing—review & editing, T.S. and T.G.; Visualization, R.C.; Project administration, T.S. All authors have read and agreed to the published version of the manuscript.
Funding
This work was supported by the National Natural Science Foundation of China (62371084), the Natural Science Foundation of Chongqing, China (CSTB2022NSCQ-MSX1418), the China Postdoctoral Science Foundation (2022MD723727), the Special Support for Chongqing Postdoctoral Research Project (2022CQBSHTB2041), and the Funding of Institute for Advanced Sciences of Chongqing University of Posts and Telecommunications (E011A2022330).
Data Availability Statement
The public sources of the data mentioned in this study have been described in the paper.
Conflicts of Interest
The authors declare no conflicts of interest.
References
- Han, Z.; Gui, X.J.; Sun, H.; Yin, Y.; Li, S. Towards Accurate and Robust Domain Adaptation Under Multiple Noisy Environments. IEEE Trans. Pattern Anal. Mach. Intell. 2023, 45, 6460–6479. [Google Scholar] [CrossRef] [PubMed]
- Xu, M.; Qin, L.; Chen, W.; Pu, S.; Zhang, L. Multi-view Adversarial Discriminator: Mine the Non-causal Factors for Object Detection in Unseen Domains. In Proceedings of the IEEE/CVF Conference on Computer Vision and Pattern Recognition, (CVPR), Vancouver, BC, Canada, 18–22 June 2023; pp. 8103–8112. [Google Scholar]
- Qin, R.; Zhang, G.; Tang, Y. On the Transferability of Learning Models for Semantic Segmentation for Remote Sensing Data. arXiv 2023, arXiv:2310.10490. [Google Scholar]
- W1. Lunar_crater Dataset. 2022. Available online: https://universe.roboflow.com/w1-lnwdz/lunar_crater (accessed on 24 March 2024).
- Yang, S.; Cai, Z. Progressive Domain Adaptive Network for Crater Detection. IEEE Trans. Geosci. Remote Sens. 2022, 60, 1–12. [Google Scholar] [CrossRef]
- Chen, M.; Liu, D.; Qian, K.; Li, J.; Lei, M.; Zhou, Y. Lunar Crater Detection Based on Terrain Analysis and Mathematical Morphology Methods Using Digital Elevation Models. IEEE Trans. Geosci. Remote Sens. 2018, 56, 3681–3692. [Google Scholar] [CrossRef]
- Yang, S.; Cai, Z. High-Resolution Feature Pyramid Network for Automatic Crater Detection on Mars. IEEE Trans. Geosci. Remote Sens. 2022, 60, 1–12. [Google Scholar] [CrossRef]
- Yang, H.; Xu, X.; Ma, Y.; Xu, Y.; Liu, S. CraterDANet: A Convolutional Neural Network for Small-Scale Crater Detection via Synthetic-to-Real Domain Adaptation. IEEE Trans. Geosci. Remote Sens. 2022, 60, 1–12. [Google Scholar] [CrossRef]
- Hsu, C.Y.; Li, W.; Wang, S. Knowledge-Driven GeoAI: Integrating Spatial Knowledge into Multi-Scale Deep Learning for Mars Crater Detection. Remote Sens. 2021, 13, 2116. [Google Scholar] [CrossRef]
- Hua, W.; Liang, D.; Li, J.; Liu, X.; Zou, Z.; Ye, X.; Bai, X. SOOD: Towards Semi-Supervised Oriented Object Detection. In Proceedings of the IEEE/CVF Conference on Computer Vision and Pattern Recognition, (CVPR), Vancouver, BC, Canada, 18–22 June 2023; pp. 15558–15567. [Google Scholar]
- Sohn, K.; Berthelot, D.; Li, C.L.; Zhang, Z.; Carlini, N.; Cubuk, E.D.; Kurakin, A.; Zhang, H.; Raffel, C. FixMatch: Simplifying semi-supervised learning with consistency and confidence. In Proceedings of the 34th International Conference on Neural Information Processing Systems, Red Hook, NY, USA, 6–12 December 2020. [Google Scholar]
- Zheng, M.; You, S.; Huang, L.; Wang, F.; Qian, C.; Xu, C. SimMatch: Semi-supervised Learning with Similarity Matching. In Proceedings of the IEEE/CVF Conference on Computer Vision and Pattern Recognition, (CVPR), New Orleans, LA, USA, 18–24 June 2022; pp. 14451–14461. [Google Scholar] [CrossRef]
- Tang, Z.; Sun, Y.; Liu, S.; Yang, Y. DETR with Additional Global Aggregation for Cross-domain Weakly Supervised Object Detection. In Proceedings of the IEEE/CVF Conference on Computer Vision and Pattern Recognition, (CVPR), Vancouver, BC, Canada, 18–22 June 2023; pp. 11422–11432. [Google Scholar]
- Yu, H.; Zhang, Z.; Qin, Z.; Wu, H.; Li, D.; Zhao, J.; Lu, X. Loss Rank Mining: A General Hard Example Mining Method for Real-time Detectors. In Proceedings of the 2018 International Joint Conference on Neural Networks (IJCNN), Rio de Janeiro, Brazil, 8–13 July 2018; pp. 1–8. [Google Scholar] [CrossRef]
- Lin, C.; Wang, S.; Xu, D.; Lu, Y.; Zhang, W. Object Instance Mining for Weakly Supervised Object Detection. In Proceedings of the AAAI Conference on Artificial Intelligence, New York, NY, USA, 7–12 February 2020; pp. 11482–11489. [Google Scholar] [CrossRef]
- Ren, S.; He, K.; Girshick, R.; Sun, J. Faster R-CNN: Towards Real-Time Object Detection with Region Proposal Networks. IEEE Trans. Pattern Anal. Mach. Intell. 2017, 39, 1137–1149. [Google Scholar] [CrossRef] [PubMed]
- Lin, T.Y.; Dollár, P.; Girshick, R.; He, K.; Hariharan, B.; Belongie, S. Feature Pyramid Networks for Object Detection. In Proceedings of the IEEE Conference on Computer Vision and Pattern Recognition, (CVPR), Honolulu, HI, USA, 21–26 July 2017; pp. 936–944. [Google Scholar] [CrossRef]
- Liu, W.; Quijano, K.; Crawford, M.M. YOLOv5-Tassel: Detecting Tassels in RGB UAV Imagery With Improved YOLOv5 Based on Transfer Learning. IEEE J. Sel. Top. Appl. Earth Observ. Remote Sens. 2022, 15, 8085–8094. [Google Scholar] [CrossRef]
- Yi, H.; Liu, B.; Zhao, B.; Liu, E. Small Object Detection Algorithm Based on Improved YOLOv8 for Remote Sensing. IEEE J. Sel. Top. Appl. Earth Observ. Remote Sens. 2024, 17, 1734–1747. [Google Scholar] [CrossRef]
- Liu, S.; Huang, D.; Wang, Y. Learning Spatial Fusion for Single-Shot Object Detection. arXiv 2019, arXiv:1911.09516. [Google Scholar]
- Shen, F.; Peng, X.; Wang, L.; Hao, X.; Shu, M.; Wang, Y. HSGM: A Hierarchical Similarity Graph Module for Object Re-Identification. In Proceedings of the 2022 IEEE International Conference on Multimedia and Expo (ICME), Taipei, Taiwan, 18–22 July 2022; pp. 1–6. [Google Scholar] [CrossRef]
- Liu, S.; Qi, L.; Qin, H.; Shi, J.; Jia, J. Path Aggregation Network for Instance Segmentation. In Proceedings of the 2018 IEEE/CVF Conference on Computer Vision and Pattern Recognition, Salt Lake City, UT, USA, 18–22 June 2018; pp. 8759–8768. [Google Scholar] [CrossRef]
- Qiao, S.; Chen, L.C.; Yuille, A. DetectoRS: Detecting Objects with Recursive Feature Pyramid and Switchable Atrous Convolution. In Proceedings of the IEEE/CVF Conference on Computer Vision and Pattern Recognition, Virtual, 19–25 June 2021; pp. 10208–10219. [Google Scholar] [CrossRef]
- Chen, L.C.; Papandreou, G.; Kokkinos, I.; Murphy, K.; Yuille, A.L. DeepLab: Semantic Image Segmentation with Deep Convolutional Nets, Atrous Convolution, and Fully Connected CRFs. IEEE Trans. Pattern Anal. Mach. Intell. 2017, 40, 834–848. [Google Scholar] [CrossRef] [PubMed]
- Li, Y.; Chen, Y.; Wang, N.; Zhang, Z.X. Scale-Aware Trident Networks for Object Detection. In Proceedings of the IEEE/CVF International Conference on Computer Vision, Seoul, Republic of Korea, 27 October–2 November 2019; pp. 6053–6062. [Google Scholar] [CrossRef]
- Woo, S.; Park, J.; Lee, J.Y.; Kweon, I.S. CBAM: Convolutional Block Attention Module. In Proceedings of the European Conference on Computer Vision (ECCV), Munich, Germany, 8–14 September 2018; pp. 3–19. [Google Scholar]
- Zhu, L.; Wang, X.; Ke, Z.; Zhang, W.; Lau, R.W. BiFormer: Vision Transformer with Bi-Level Routing Attention. In Proceedings of the IEEE/CVF Conference on Computer Vision and Pattern Recognition, (CVPR), Vancouver, BC, Canada, 18–22 June 2023; pp. 10323–10333. [Google Scholar]
- Kisantal, M.; Wojna, Z.; Murawski, J.; Naruniec, J.; Cho, K. Augmentation for small object detection. arXiv 2019, arXiv:1902.07296. [Google Scholar]
- Yu, X.; Gong, Y.; Jiang, N.; Ye, Q.; Han, Z. Scale Match for Tiny Person Detection. In Proceedings of the IEEE/CVF Winter Conference on Applications of Computer Vision, (WACV), Snowmass Village, CO, USA, 1–5 March 2020; pp. 1246–1254. [Google Scholar] [CrossRef]
- Kennerley, M.; Wang, J.G.; Veeravalli, B.; Tan, R.T. 2PCNet: Two-Phase Consistency Training for Day-to-Night Unsupervised Domain Adaptive Object Detection. In Proceedings of the IEEE/CVF Conference on Computer Vision and Pattern Recognition, (CVPR), Vancouver, BC, Canada, 18–22 June 2023; pp. 11484–11493. [Google Scholar]
- DeLatte, D.M.; Crites, S.T.; Guttenberg, N.; Tasker, E.J.; Yairi, T. Segmentation Convolutional Neural Networks for Automatic Crater Detection on Mars. IEEE J. Sel. Top. Appl. Earth Observ. Remote Sens. 2019, 12, 2944–2957. [Google Scholar] [CrossRef]
- Tian, K.; Zhang, C.; Wang, Y.; Xiang, S.; Pan, C. Knowledge Mining and Transferring for Domain Adaptive Object Detection. In Proceedings of the IEEE/CVF International Conference on Computer Vision, (ICCV), Virtual, 11–17 October 2021; pp. 9113–9122. [Google Scholar] [CrossRef]
- Li, Y.J.; Dai, X.; Ma, C.Y.; Liu, Y.C.; Chen, K.; Wu, B.; He, Z.; Kitani, K.; Vajda, P. Cross-Domain Adaptive Teacher for Object Detection. In Proceedings of the IEEE/CVF Conference on Computer Vision and Pattern Recognition, (CVPR), New Orleans, LA, USA, 18–24 June 2022; pp. 7571–7580. [Google Scholar] [CrossRef]
- Zhang, L.; Zhou, W.; Fan, H.; Luo, T.; Ling, H. Robust Domain Adaptive Object Detection with Unified Multi-Granularity Alignment. arXiv 2023, arXiv:2301.00371. [Google Scholar]
- Wu, J.; Chen, J.; He, M.; Wang, Y.; Li, B.; Ma, B.; Gan, W.; Wu, W.; Wang, Y.; Huang, D. Target-Relevant Knowledge Preservation for Multi-Source Domain Adaptive Object Detection. In Proceedings of the IEEE/CVF Conference on Computer Vision and Pattern Recognition, (CVPR), New Orleans, LA, USA, 18–24 June 2022; pp. 5301–5310. [Google Scholar]
- Robbins, S.J. A New Global Database of Lunar Impact Craters >1–2 km: 1. Crater Locations and Sizes, Comparisons With Published Databases, and Global Analysis. J. Geophys. Res. Planets 2019, 124, 871–892. [Google Scholar] [CrossRef]
- Yang, L.; Zhang, Z.; Song, Y.; Hong, S.; Xu, R.; Zhao, Y.; Zhang, W.; Cui, B.; Yang, M.H. Diffusion Models: A Comprehensive Survey of Methods and Applications. ACM Comput. Surv. 2023, 56, 1–39. [Google Scholar] [CrossRef]
- Li, T.; Chang, H.; Mishra, S.; Zhang, H.; Katabi, D.; Krishnan, D. MAGE: MAsked Generative Encoder to Unify Representation Learning and Image Synthesis. In Proceedings of the IEEE/CVF Conference on Computer Vision and Pattern Recognition, (CVPR), Vancouver, BC, Canada, 18–22 June 2023; pp. 2142–2152. [Google Scholar]
- Li, Y.; Liu, H.; Wu, Q.; Mu, F.; Yang, J.; Gao, J.; Li, C.; Lee, Y.J. GLIGEN: Open-Set Grounded Text-to-Image Generation. In Proceedings of the IEEE/CVF Conference on Computer Vision and Pattern Recognition, (CVPR), Vancouver, BC, Canada, 18–22 June 2023; pp. 22511–22521. [Google Scholar] [CrossRef]
- Koksal, A.; Tuzcuoglu, O.; Ince, K.G.; Ataseven, Y.; Alatan, A.A. Improved Hard Example Mining Approach for Single Shot Object Detectors. In Proceedings of the 2022 IEEE International Conference on Image Processing (ICIP), Bordeaux, France, 16–19 October 2022; pp. 3536–3540. [Google Scholar]
- Shrivastava, A.; Gupta, A.; Girshick, R. Training Region-Based Object Detectors with Online Hard Example Mining. In Proceedings of the IEEE Conference on Computer Vision and Pattern Recognition (CVPR), Las Vegas, NV, USA, 26 June–1 July 2016; pp. 761–769. [Google Scholar] [CrossRef]
- Jocher, G.; Stoken, A. ultralytics/yolov5: V6.0—YOLOv5n ‘Nano’ models, Roboflow integration, TensorFlow export, OpenCV DNN support. Zenodo 2021. [Google Scholar] [CrossRef]
- Liu, Y.; Shao, Z.; Teng, Y.; Hoffmann, N. NAM: Normalization-based Attention Module. arXiv 2021, arXiv:2111.12419. [Google Scholar]
- Dosovitskiy, A.; Beyer, L.; Kolesnikov, A.; Weissenborn, D.; Zhai, X.; Unterthiner, T.; Dehghani, M.; Minderer, M.; Heigold, G.; Gelly, S.; et al. An Image is Worth 16x16 Words: Transformers for Image Recognition at Scale. In Proceedings of the 9th International Conference on Learning Representations (ICLR), Virtual, 3–7 May 2021. [Google Scholar]
- Lin, T.Y.; Goyal, P.; Girshick, R.; He, K.; Dollár, P. Focal Loss for Dense Object Detection. In Proceedings of the IEEE International Conference on Computer Vision, Venice, Italy, 22–29 October 2017; pp. 2999–3007. [Google Scholar] [CrossRef]
- Xia, G.S.; Bai, X.; Ding, J.; Zhu, Z.; Belongie, S.; Luo, J.; Datcu, M.; Pelillo, M.; Zhang, L. DOTA: A Large-Scale Dataset for Object Detection in Aerial Images. In Proceedings of the IEEE Conference on Computer Vision and Pattern Recognition (CVPR), Salt Lake City, UT, USA, 18–22 June 2018; pp. 3974–3983. [Google Scholar] [CrossRef]
- Hu, J.; Huang, Z.; Shen, F.; He, D.; Xian, Q. A Bag of Tricks for Fine-Grained Roof Extraction. In Proceedings of the IEEE International Geoscience and Remote Sensing Symposium (IGARSS), Pasadena, CA, USA, 16–21 July 2023; pp. 678–680. [Google Scholar] [CrossRef]
- Chen, K.; Wang, J.; Pang, J.; Cao, Y.; Xiong, Y.; Li, X.; Sun, S.; Feng, W.; Liu, Z.; Xu, J.; et al. MMDetection: Open MMLab Detection Toolbox and Benchmark. arXiv 2019, arXiv:1906.07155. [Google Scholar]
- Pang, J.; Chen, K.; Li, Q.; Xu, Z.; Feng, H.; Shi, J.; Ouyang, W.; Lin, D. Towards Balanced Learning for Instance Recognition. Int. J. Comput. Vis. 2021, 129, 1376–1393. [Google Scholar] [CrossRef]
- Wang, C.Y.; Bochkovskiy, A.; Liao, H.Y.M. YOLOv7: Trainable Bag-of-Freebies Sets New State-of-the-Art for Real-Time Object Detectors. In Proceedings of the IEEE/CVF Conference on Computer Vision and Pattern Recognition, (CVPR), Vancouver, BC, Canada, 18–22 June 2023; pp. 7464–7475. [Google Scholar] [CrossRef]
- Chen, Y.; Li, W.; Sakaridis, C.; Dai, D.; Van Gool, L. Domain Adaptive Faster R-CNN for Object Detection in the Wild. In Proceedings of the IEEE Conference on Computer Vision and Pattern Recognition (CVPR), Salt Lake City, UT, USA, 18–22 June 2018; pp. 3339–3348. [Google Scholar] [CrossRef]
- Hsu, C.C.; Tsai, Y.H.; Lin, Y.Y.; Yang, M.H. Every Pixel Matters: Center-aware Feature Alignment for Domain Adaptive Object Detector. In Proceedings of the 16th European Conference, Glasgow, UK, 23–28 August 2020; pp. 733–748. [Google Scholar]
- Chen, Y.; Cao, Y.; Hu, H.; Wang, L. Memory Enhanced Global-Local Aggregation for Video Object Detection. In Proceedings of the IEEE/CVF Conference on Computer Vision and Pattern Recognition, (CVPR), Seattle, WA, USA, 13–19 June 2020; pp. 10334–10343. [Google Scholar] [CrossRef]
- Dai, J.; Qi, H.; Xiong, Y.; Li, Y.; Zhang, G.; Hu, H.; Wei, Y. Deformable Convolutional Networks. In Proceedings of the IEEE International Conference on Computer Vision (ICCV), Vancouver, BC, Canada, 7–14 July 2001; pp. 764–773. [Google Scholar] [CrossRef]
- Wang, J.; Zhang, W.; Cao, Y.; Chen, K.; Pang, J.; Gong, T.; Shi, J.; Loy, C.C.; Lin, D. Side-Aware Boundary Localization for More Precise Object Detection. In Proceedings of the European Conference Computer Vision, Glasgow, UK, 23–28 August 2020; Springer: Berlin/Heidelberg, Germany, 2020; pp. 403–419. [Google Scholar]
- Zhu, X.; Su, W.; Lu, L.; Li, B.; Wang, X.; Dai, J. Deformable DETR: Deformable Transformers for End-to-End Object Detection. arXiv 2020, arXiv:2010.04159. [Google Scholar]
- Wang, W.; Xie, E.; Li, X.; Fan, D.P.; Song, K.; Liang, D.; Lu, T.; Luo, P.; Shao, L. Pyramid Vision Transformer: A Versatile Backbone for Dense Prediction without Convolutions. In Proceedings of the IEEE/CVF International Conference on Computer Vision, (ICCV), Virtual, 11–17 October 2021; pp. 548–558. [Google Scholar] [CrossRef]
- Zhang, S.; Chi, C.; Yao, Y.; Lei, Z.; Li, S.Z. Bridging the Gap Between Anchor-based and Anchor-free Detection via Adaptive Training Sample Selection. In Proceedings of the IEEE/CVF Conference on Computer Vision and Pattern Recognition, (CVPR), Seattle, WA, USA, 13–19 June 2020; pp. 9759–9768. [Google Scholar]
- Hu, J.; Shen, L.; Sun, G. Squeeze-and-Excitation Networks. In Proceedings of the IEEE Conference on Computer Vision and Pattern Recognition (CVPR), Salt Lake City, UT, USA, 18–22 June 2018; pp. 7132–7141. [Google Scholar] [CrossRef]
- Wang, Q.; Wu, B.; Zhu, P.; Li, P.; Zuo, W.; Hu, Q. ECA-Net: Efficient Channel Attention for Deep Convolutional Neural Networks. In Proceedings of the IEEE/CVF Conference on Computer Vision and Pattern Recognition (ICCV), Seattle, WA, USA, 14–19 June 2020; pp. 11531–11539. [Google Scholar] [CrossRef]
- Liu, Y.; Shao, Z.; Hoffmann, N. Global Attention Mechanism: Retain Information to Enhance Channel-Spatial Interactions. arXiv 2021, arXiv:2112.05561. [Google Scholar]
- Liu, Z.; Mao, H.; Wu, C.Y.; Feichtenhofer, C.; Darrell, T.; Xie, S. A ConvNet for the 2020s. In Proceedings of the IEEE/CVF Conference on Computer Vision and Pattern Recognition, (CVPR), New Orleans, LA, USA, 18–24 June 2022; pp. 11966–11976. [Google Scholar] [CrossRef]
- Han, K.; Wang, Y.; Tian, Q.; Guo, J.; Xu, C.; Xu, C. GhostNet: More Features From Cheap Operations. In Proceedings of the IEEE/CVF Conference on Computer Vision and Pattern Recognition (ICCV), Seattle, WA, USA, 14–19 June 2020; pp. 1577–1586. [Google Scholar] [CrossRef]
- Gao, S.H.; Cheng, M.M.; Zhao, K.; Zhang, X.Y.; Yang, M.H.; Torr, P. Res2Net: A New Multi-Scale Backbone Architecture. IEEE Trans. Pattern Anal. Mach. Intell. 2021, 43, 652–662. [Google Scholar] [CrossRef] [PubMed]
- He, K.; Zhang, X.; Ren, S.; Sun, J. Deep Residual Learning for Image Recognition. In Proceedings of the IEEE Conference on Computer Vision and Pattern Recognition (CVPR), Las Vegas, NV, USA, 26 June–1 July 2016; pp. 770–778. [Google Scholar] [CrossRef]
- Wang, C.Y.; Mark Liao, H.Y.; Wu, Y.H.; Chen, P.Y.; Hsieh, J.W.; Yeh, I.H. CSPNet: A New Backbone that can Enhance Learning Capability of CNN. In Proceedings of the IEEE/CVF Conference on Computer Vision and Pattern Recognition Workshops (CVPRW), Seattle, WA, USA, 14–19 June 2020; pp. 1571–1580. [Google Scholar] [CrossRef]


Disclaimer/Publisher’s Note: The statements, opinions and data contained in all publications are solely those of the individual author(s) and contributor(s) and not of MDPI and/or the editor(s). MDPI and/or the editor(s) disclaim responsibility for any injury to people or property resulting from any ideas, methods, instructions or products referred to in the content. |
© 2024 by the authors. Licensee MDPI, Basel, Switzerland. This article is an open access article distributed under the terms and conditions of the Creative Commons Attribution (CC BY) license (https://creativecommons.org/licenses/by/4.0/).