Article

Attributing the Decline of Evapotranspiration over the Asian Monsoon Region during the Period 1950–2014 in CMIP6 Models

1
Key Laboratory for Meteorological Disaster Monitoring and Early Warning and Risk Management of Characteristic Agriculture in Arid Regions, Yinchuan 750002, China
2
School of Atmospheric Sciences, Nanjing University of Information Science and Technology, Nanjing 210044, China
3
Earth System Modeling Center, Nanjing University of Information Science and Technology, Nanjing 210044, China
*
Author to whom correspondence should be addressed.
Remote Sens. 2024, 16(11), 2027; https://doi.org/10.3390/rs16112027
Submission received: 16 May 2024 / Revised: 31 May 2024 / Accepted: 1 June 2024 / Published: 5 June 2024

Abstract

:
Evapotranspiration (ET) accounts for over half of the moisture source of Asian monsoon rainfall, which has been significantly altered by anthropogenic forcings. However, how individual anthropogenic forcing affects the ET over monsoonal Asia is still elusive. In this study, we found a significant decline in ET over the Asian monsoon region during the period of 1950–2014 in Coupled Model Intercomparison Project Phase 6 (CMIP6) models. The attribution analysis suggests that anthropogenic aerosol forcing is the primary cause of the weakening in ET in the historical simulation, while it is only partially compensated by the strengthening effect from GHGs, although GHGs are the dominant forcings for surface temperature increase. The physical mechanisms responsible for ET changes are different between aerosol and GHG forcings. The increase in aerosol emissions enhances the reflection and scattering of the downward solar radiation, which decreases the net surface irradiance for ET. GHGs, on the one hand, increase the moisture capability of the atmosphere and, thus, the ensuing rainfall; on the other hand, they increase the ascending motion over the Indian subcontinent, leading to an increase in rainfall. Both processes are beneficial for an ET increase. The results from this study suggest that future changes in the land–water cycle may mainly rely on the aerosol emission policy rather than the carbon reduction policy.

1. Introduction

Evapotranspiration (ET) is an essential component of the local hydrological cycle over monsoonal Asia. About 50% of the atmospheric moisture source is provided by ET in the summer season (Figure 1), and it bridges the surface energy, water cycle, and carbon cycle over the highly vegetated, densely populated Asian monsoon region, which has intense human activity [1,2,3,4]. Significant anthropogenic forcings have originated from the Asian region, particularly since the 1950s [5]. Anthropogenic aerosols and greenhouse gases (GHGs) have significantly altered the hydrological cycle over monsoonal Asia [6,7,8]. Thus, understanding how different anthropogenic emissions influence ET is important for the availability and usage of freshwater resources by humans and terrestrial ecosystems [9,10].
Prior studies revealed that GHGs and aerosols can influence ET through their climate effect and complex physiological, biophysical, and biogeochemical vegetation processes [11,12,13]. The increase in GHGs warms the Earth, enhancing local ET by increasing the vapor pressure difference between the land and the atmosphere [1,14,15]. CO2, as a major component of GHGs, promotes plant growth through enhanced photosynthesis [16,17], leading to an increase in ET [18]. The increase in CO2 concentration could reduce the stomatal conductance, resulting in a decrease in water loss from plants [19,20,21]. Aerosols can scatter and absorb solar radiation [22], changing the surface energy source for ET [8]. The deposition of aerosols onto vegetation surfaces would affect plant physiology and transpiration rates [23,24]. Meanwhile, aerosols benefit the photosynthesis and transpiration of the plant-shaded leaves through the diffusion-radiation fertilization effect [25].
Detection and attribution studies have investigated the role of different aspects of human activity on ET changes [26,27,28,29,30]. Changes in land use/land cover, irrigation, and groundwater withdrawals directly influence the surface water availability and, thus, the ET [31,32]. Douville et al. demonstrated that anthropogenic radiative forcings have already impacted the decadal changes in ET [9]. Using datasets from the offline land surface model, Mao et al. showed the relative importance of the climate variables, atmospheric composition, and land use change to the observed increasing global ET during the 1982–2010 period [33]. The result suggests that the increase in precipitation positively contributes to the ET change, while the physiological and structural effect of CO2 reduces ET over the vegetation-dense regions. Using the simulations from CMIP6, Liu et al. attributed the increase in ET in the period 1980–2020 mainly to anthropogenic forcings [34]. he GHGs dominate the increase in global and continental-scale ET, while the impact of aerosols has apparent regional features, significantly influencing the ET over Europe and Asia over the last 30 years [34]. In humid regions, like monsoon regions, the changes in ET are mainly constrained by the evaporative demand rather than the moisture supply [35]. Cao et al. found that anthropogenic aerosol forcing is more effective in altering net surface radiation than GHG forcing [8], which is consistent with the dominant impact of aerosols on ET across Asia.
It is essential to understand the response of ET to climate variables, such as precipitation, radiation, and vapor pressure deficits. On a regional scale, Zeng and Cai [26] investigated the impacts of different factors on the ET over large river basins and found that precipitation is the dominant contributor and that it is dampened/enhanced by terrestrial storage changes on the inter-annual time scale. The estimation of daily ET change at 236 stations across the US shows a significant declining trend, which is mainly attributed to the decrease in surface conductance and partially offset by shortwave radiation, longwave radiation, and wind speed [27]. On the sub-continental scale, the heterogeneity features of the observed global ET trends in 1980–2011 may be caused by the terrestrial moisture supply, which was largely affected by the atmospheric circulation change due to the “La niña”-like sea surface temperature trend over the tropical Pacific after the 1970s [36,37]. Martens et al. [28] found that the earth system’s internal modes effectively affect the ET over wet regions, such as the monsoon region, by altering the atmospheric demand for water. Consistently, the attribution study over monsoonal East Asia also indicates the importance of vapor pressure deficit for ET change [38]. A global-scale survey of the ET trend shows that it went upwards in 1982–1997 and then downward in 1998–2008. The decline in the latter period is driven primarily by moisture limitations in the Southern Hemisphere [35]. The overall upward trend during the period 1982–2013 is mainly driven by vegetation greening, while increased precipitation and enhanced atmospheric evaporative demand have secondary roles [4,29].
A gap in knowledge still exists in the prior attribution studies. First, the reliable ET observation is for a relative short time span, mostly starting from the 1980s [39,40,41,42]. Fully attributing the observed ET to anthropogenic forcing may not be appropriate since significant decadal/multidecadal variations exist in the climate drivers over the Asian monsoon region [28,29,36,43]. The trend in ET during the 1980s–2020s may partially originate from the decadal modes, like the inter-decadal Pacific oscillation and Atlantic multidecadal oscillation [28,36]. Second, a process level of understanding why aerosols are uniquely important for ET in the Asian monsoon region is not well established yet [37]. In this study, we used the single forcing experiments from the Detection and Attribution Intercomparison Project (DAMIP) and historical simulations in the CMIP6 to investigate the relative importance of GHGs and aerosols on the ET trend over monsoonal Asia since the 1950s, when significant GHG and aerosol emissions were observed. The contribution of each climate factor to the ET changes under GHG forcing and aerosol forcing is explicitly examined. In addition, how individual anthropogenic forcing affects the key climate factors are explored. The rest of the paper is organized as follows: Section 2 introduces the data and methods. The declining trend in the ET over Asia in the historical experiment of the CMIP6 model is analyzed in Section 3. Section 4 demonstrates the contributions and factors in GHG forcing and aerosol forcing to ET changes. Section 5 summarizes the main findings.

2. Materials and Methods

2.1. Datasets

Three widely used ET datasets are employed in this study, including the Global Land Evaporation Amsterdam Model dataset (GLEAM v3.0a), the Global Land Data Assimilation System version 2.0 with Noah model (GLDAS-Noah), and the highly generalized land ET (HG-Land ET). The three datasets are all based on the remote sensing-based actual ET products. The GLEAM v3.0a dataset is from state-of-the-art diagnostic actual ET products that are based on remote sensing [43]. The GLDAS-Noah ET dataset has produced fields of land surface states and fluxes (e.g., soil moisture, latent and sensible heat flux) by running an offline land surface model together with data assimilation techniques [44]. The HG-Land ET dataset integrates the satellite-observed vegetation information, in situ ET observations, precipitation observations, and reanalysis datasets by machine-learning algorithms [45]. The averages of the three datasets are regarded as the ET observation. The observed precipitation data are from Version 4.04 of the Climate Research Unit (CRU), with a resolution of 0.5° × 0.5° spanning from 1901 to 2020 [44]. In this study, we only focus on the summer season (June-August) when both the ET and precipitation reach their peaks.
The historical simulations from 32 CMIP6 models are used to assess the ET change under anthropogenic forcing (Table 1). The historical simulation is forced by the observed temporally evolving external forcings, such as GHGs, anthropogenic aerosols, volcanic eruptions, the earth’s orbit parameters, and land use/land cover, with the simulation period being 1850–2014 [45,46]. The roles of individual external forcings on ET change are identified from the single forcing simulations in the DAMIP. The impacts from two types of forcings are mainly focused, namely the impacts of anthropogenic aerosol from the historical anthropogenic aerosol-only (hist-aer) experiment and the impact of GHGs from the historical GHG-only (hist-GHG) experiment. The hist-aer and hist-GHG experiments are designed as historical experiments but are forced by the well-mixed greenhouse gas-only and anthropogenic aerosol-only during the period 1850–2014, respectively [47]. In the 15 DAMIP models, 5 models (Table 1) provided the variables of precipitation, downward and upward solar radiation, downward and upward longwave radiation, surface temperature, 2 m wind speed, and humidity. Those variables are used to identify the detailed processes responsible for the ET change under individual forcings. Thus, the results from the five models are used to identify the relative importance of the individual factors. The five models are ACCESS-CM2, ACCESS-ESM1-5, CanESM5, IPSL-CM6A-LR, and MRI-ESM2-0. For easy comparison, all model data are regridded to a common resolution of 2° × 2° with bilinear interpolation. In this study, we focus on the period of 1950–2014, when GHG and aerosol emissions are more significant than in the previous decades.

2.2. Methods

Following previous studies [37,48], the ET can be predicted from the climatic variables, including precipitation, net surface radiation, surface temperature, vapor pressure deficiency, and 2 m wind speed. The equation is as follows:
E T = P + 0.408 Δ ( R n G ) + γ 900 T + 273 u V P D Δ + γ ( 1 + 0.34 u ) P [ 1 + ( 0.408 Δ ( R n G ) + γ 900 T + 273 u V P D P ( Δ + γ ( 1 + 0.34 u ) ) ) ϖ ] 1 / ϖ
where P is the precipitation, Rn is the net surface radiation, G is the soil heat-flux density, γ and Δ are the psychometric constant and slope of the vapor pressure curve, respectively, T is the 2 m air temperature, and u is the 2 m wind speed. VPD means the vapor pressure deficit. According to Allen et al. [48], G is set to 0.
To isolate the contribution of an individual factor to the ET change, a group of sensitivity calculations is conducted. For example, the contribution of precipitation change to the total ET change is calculated by setting the other four variables to their climatological mean values but using the temporally evolving values for precipitation. A similar calculation is conducted for each variable [37,49].
The 30-year (1985–2014) climatology precipitation data of the Global Precipitation Climatology Project [50] are used to define the Asian monsoon domain. It is the region where the precipitation difference between summer (May–September) and winter (November–March) exceeds 2.5 mm d−1, and summer precipitation accounts for at least 55% of the annual total [8].

3. Decline in the ET over the Asian Monsoon Region in CMIP6 Models

Figure 1 shows the pattern of ET over Asian land and its ratio to precipitation during the summer season (June-July-August) of 1985–2014 from observations and the ensemble mean of the five DAMIP models (Table 1). In the observed data, high ET is located over the southeast of the Asian continent, with the maximum centers located over South China and the Indochina Peninsula. The ensemble mean of historical simulation from the five DAMIP models reproduced the pattern and magnitude of ET well. Relatively lower ET over central Asia and a relatively high southwest–northeast elongated ET band extends from the Indian subcontinent to northeastern China. In the Asian monsoon region, a large proportion of precipitation comes from ET, suggesting the vital role of local hydrological recycling, although the monsoon rainfall is dominated by remote moisture transport in a traditional view. The contribution of local hydrological recycling exceeds 50% over North China in observation and CMIP6 models. The areal-averaged contribution of local hydrological recycling is 53% and 63% in observation and CMIP6 models, respectively. Therefore, it is essential to understand the detailed physical processes responsible for the change in ET during the recent decades.
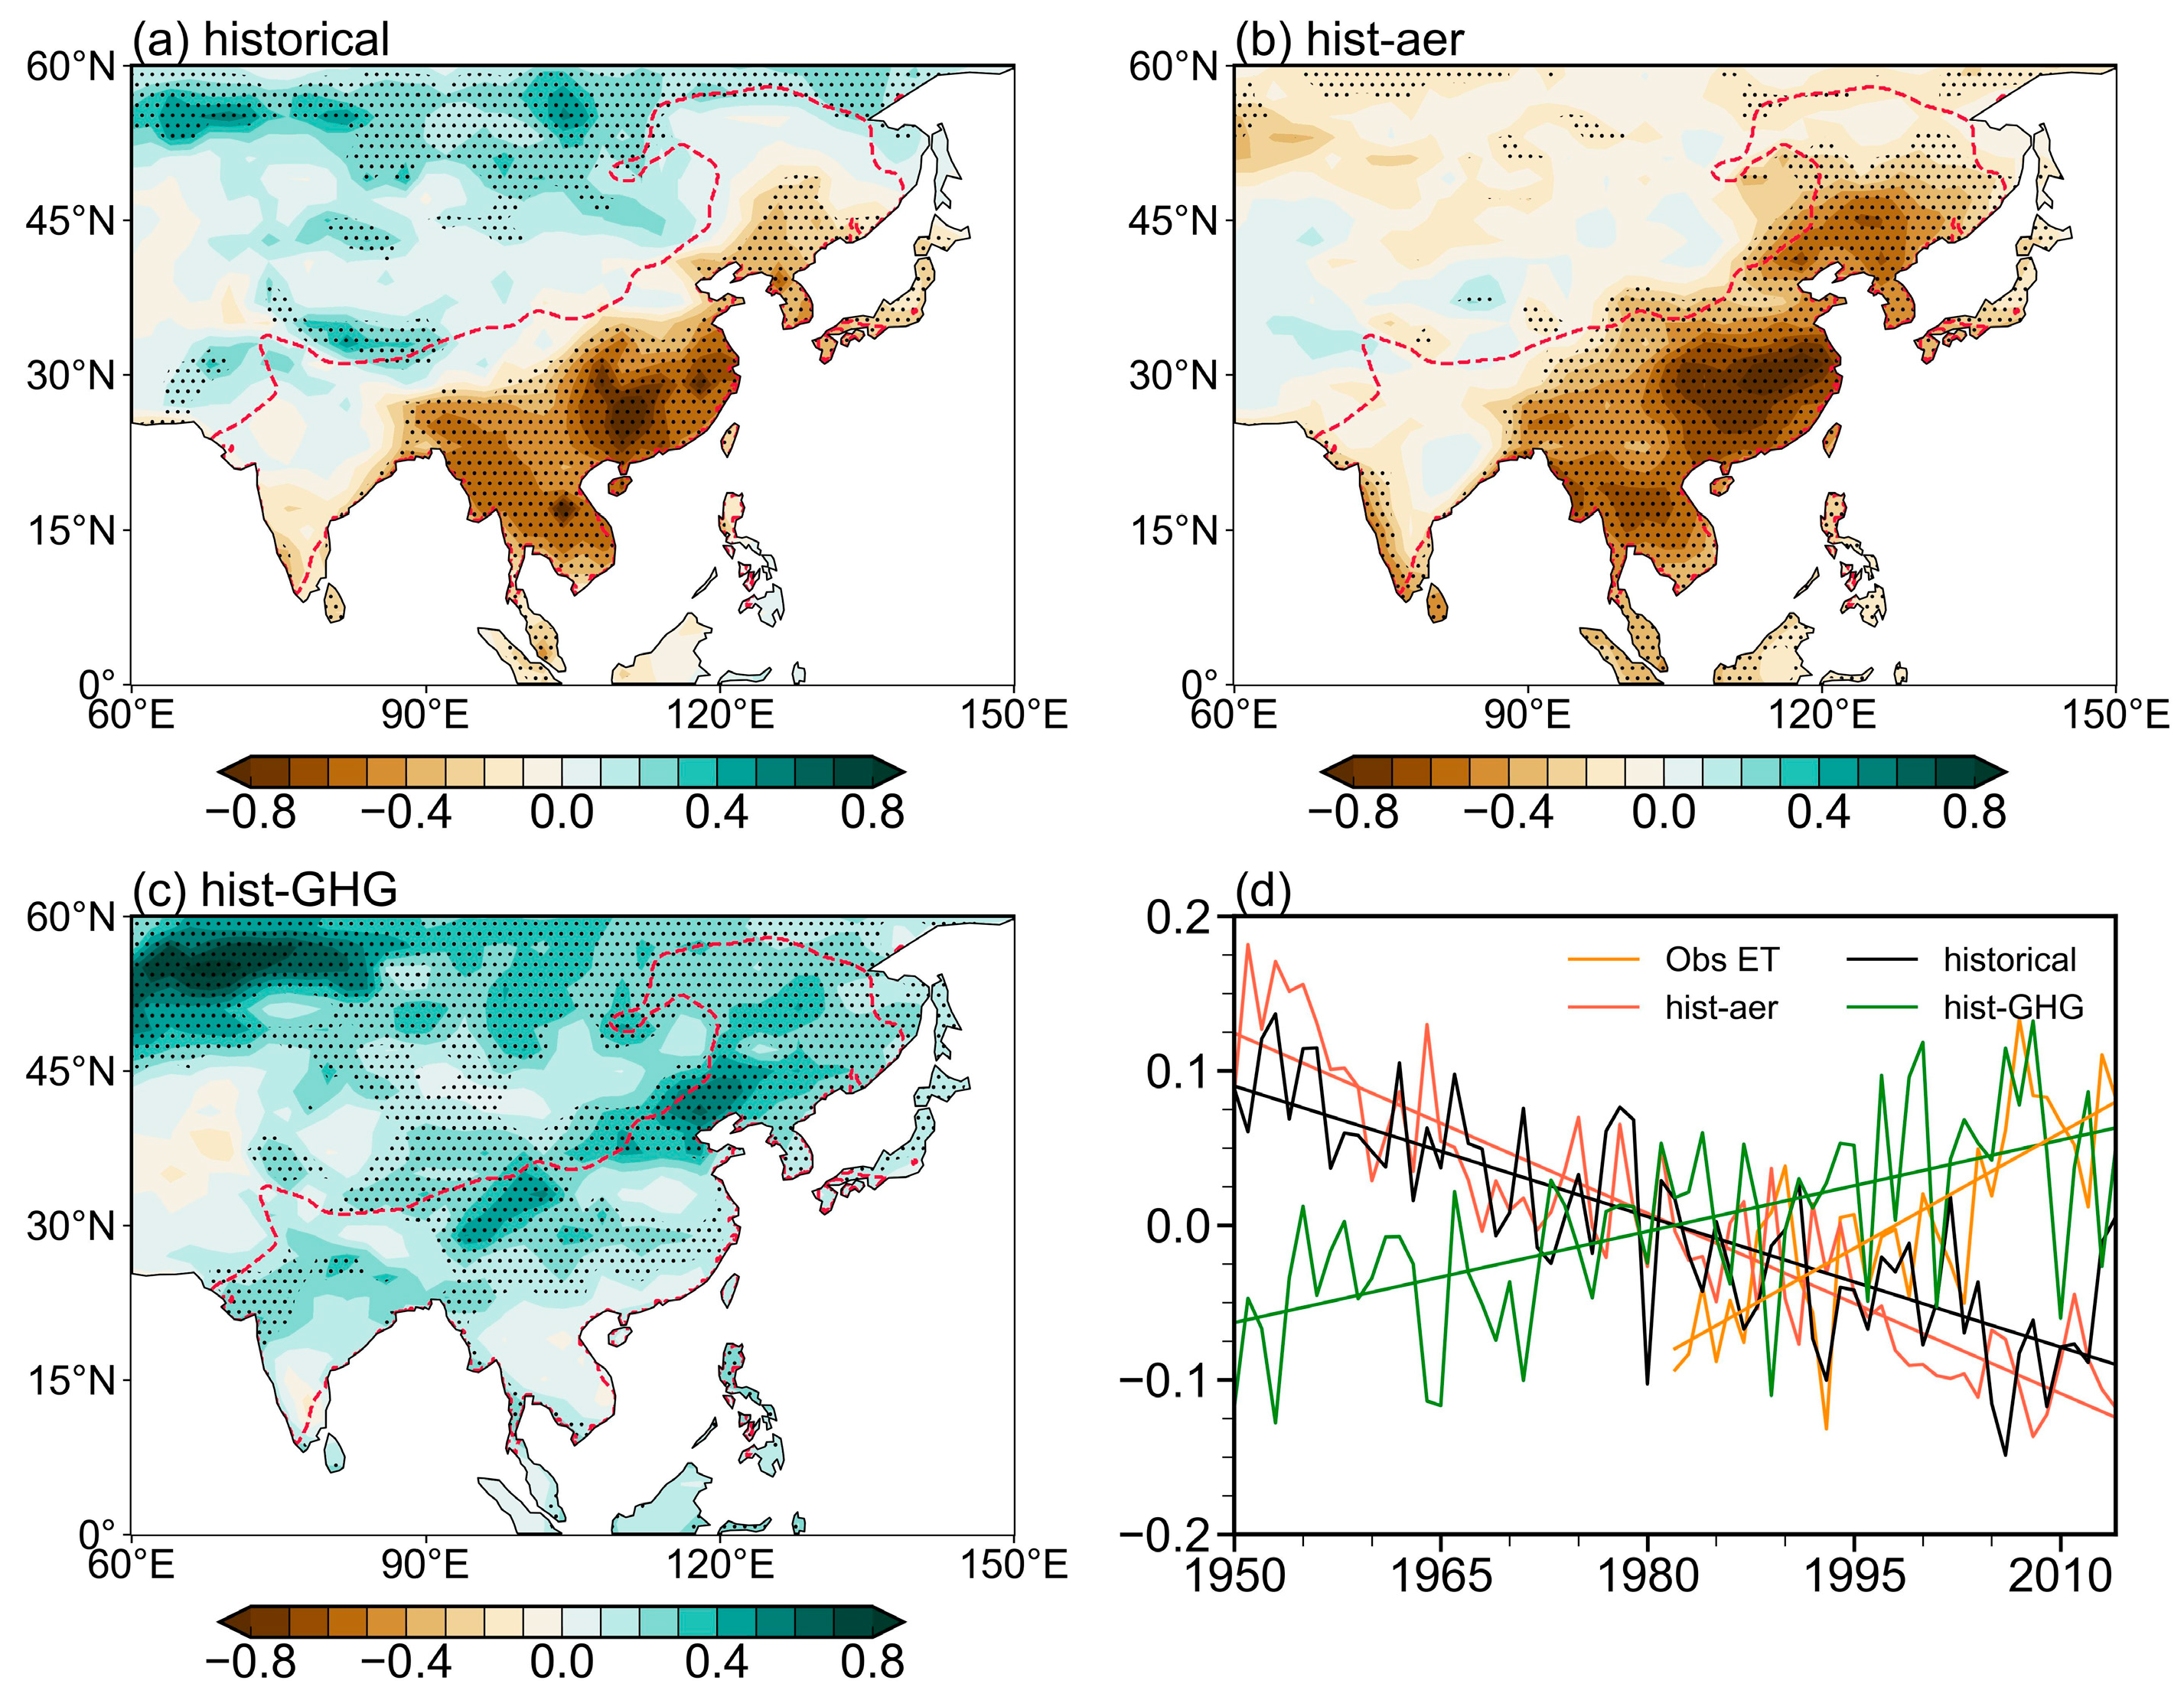
We focus on the past seven decades (1950–2014), in which significant anthropogenic emissions have occurred [5]. As shown in Table 1, twenty-seven of the thirty-two models show negative trends for the ET over the Asian monsoonal region. The multi-model ensemble mean suggests a linear trend of −0.17 mm d−1 cent−1 in 1950–2014, which was significant at a 95% confidence level. The decline in ET was also apparent between 1980 and 2014. It is opposite to the increased trends in the observed data over the same period (Figure 2) [1,22,51]. This indicates that the observed increase in ET over the Asia monsoon region may be dominated by the internal variability [28,29,37]. The DAMIP experiment demonstrates the impacts of GHGs and anthropogenic aerosols on ET changes. In the 15 DAMIP models, the ensemble mean of historical simulation has a linear trend of −0.16 mm d−1 cent−1, which is significant at a 95% confidence level. This decreasing magnitude is close to the ensemble mean of the 32 models. In the hist-aer experiment, anthropogenic aerosols would decrease the ET with a trend of −0.36 mm d−1 cent−1, while it is partially compensated by the influence of greenhouse gases (+0.17 mm d−1 cent−1). The sum of the impacts from individual forcing is −0.19 mm d−1 cent−1, close to the results from the historical simulation of the 15 DAMIP models. It suggests that the long-term change in ET during 1950–2014 could mainly attribute to anthropogenic aerosol and GHG forcings. In the next sections, we will focus on how aerosols and GHGs affect ET through different physical processes.
Figure 2 shows the spatial patterns of the ET trends from the ensemble mean of historical, hist-aer, and hist-GHG experiments of the five DAMIP models. The corresponding trend patterns from the ensemble mean of all 15 DAMIP models are similar to the 5 models. The historical experiment shows a decrease in ET over the majority of the Asian monsoon region, with a weaker increase over the northwestern boundary of the monsoon region. This decrease is dominated by the contribution from anthropogenic aerosols (Figure 2b). In particular, a large negative ET trend covers the Indochina Peninsula and the majority of East Asia. In contrast, GHGs could increase the ET over the entire Asian continent, leading to a weaker increase in ET over the northwest boundary monsoon region (Figure 2c). According to Equation (1), the trend in the ET is attributable to the changes in precipitation, net surface irradiance, surface temperature, vapor pressure deficit, and 2 m wind speed. Thus, we can understand the trends in ET from changes in those climate factors.
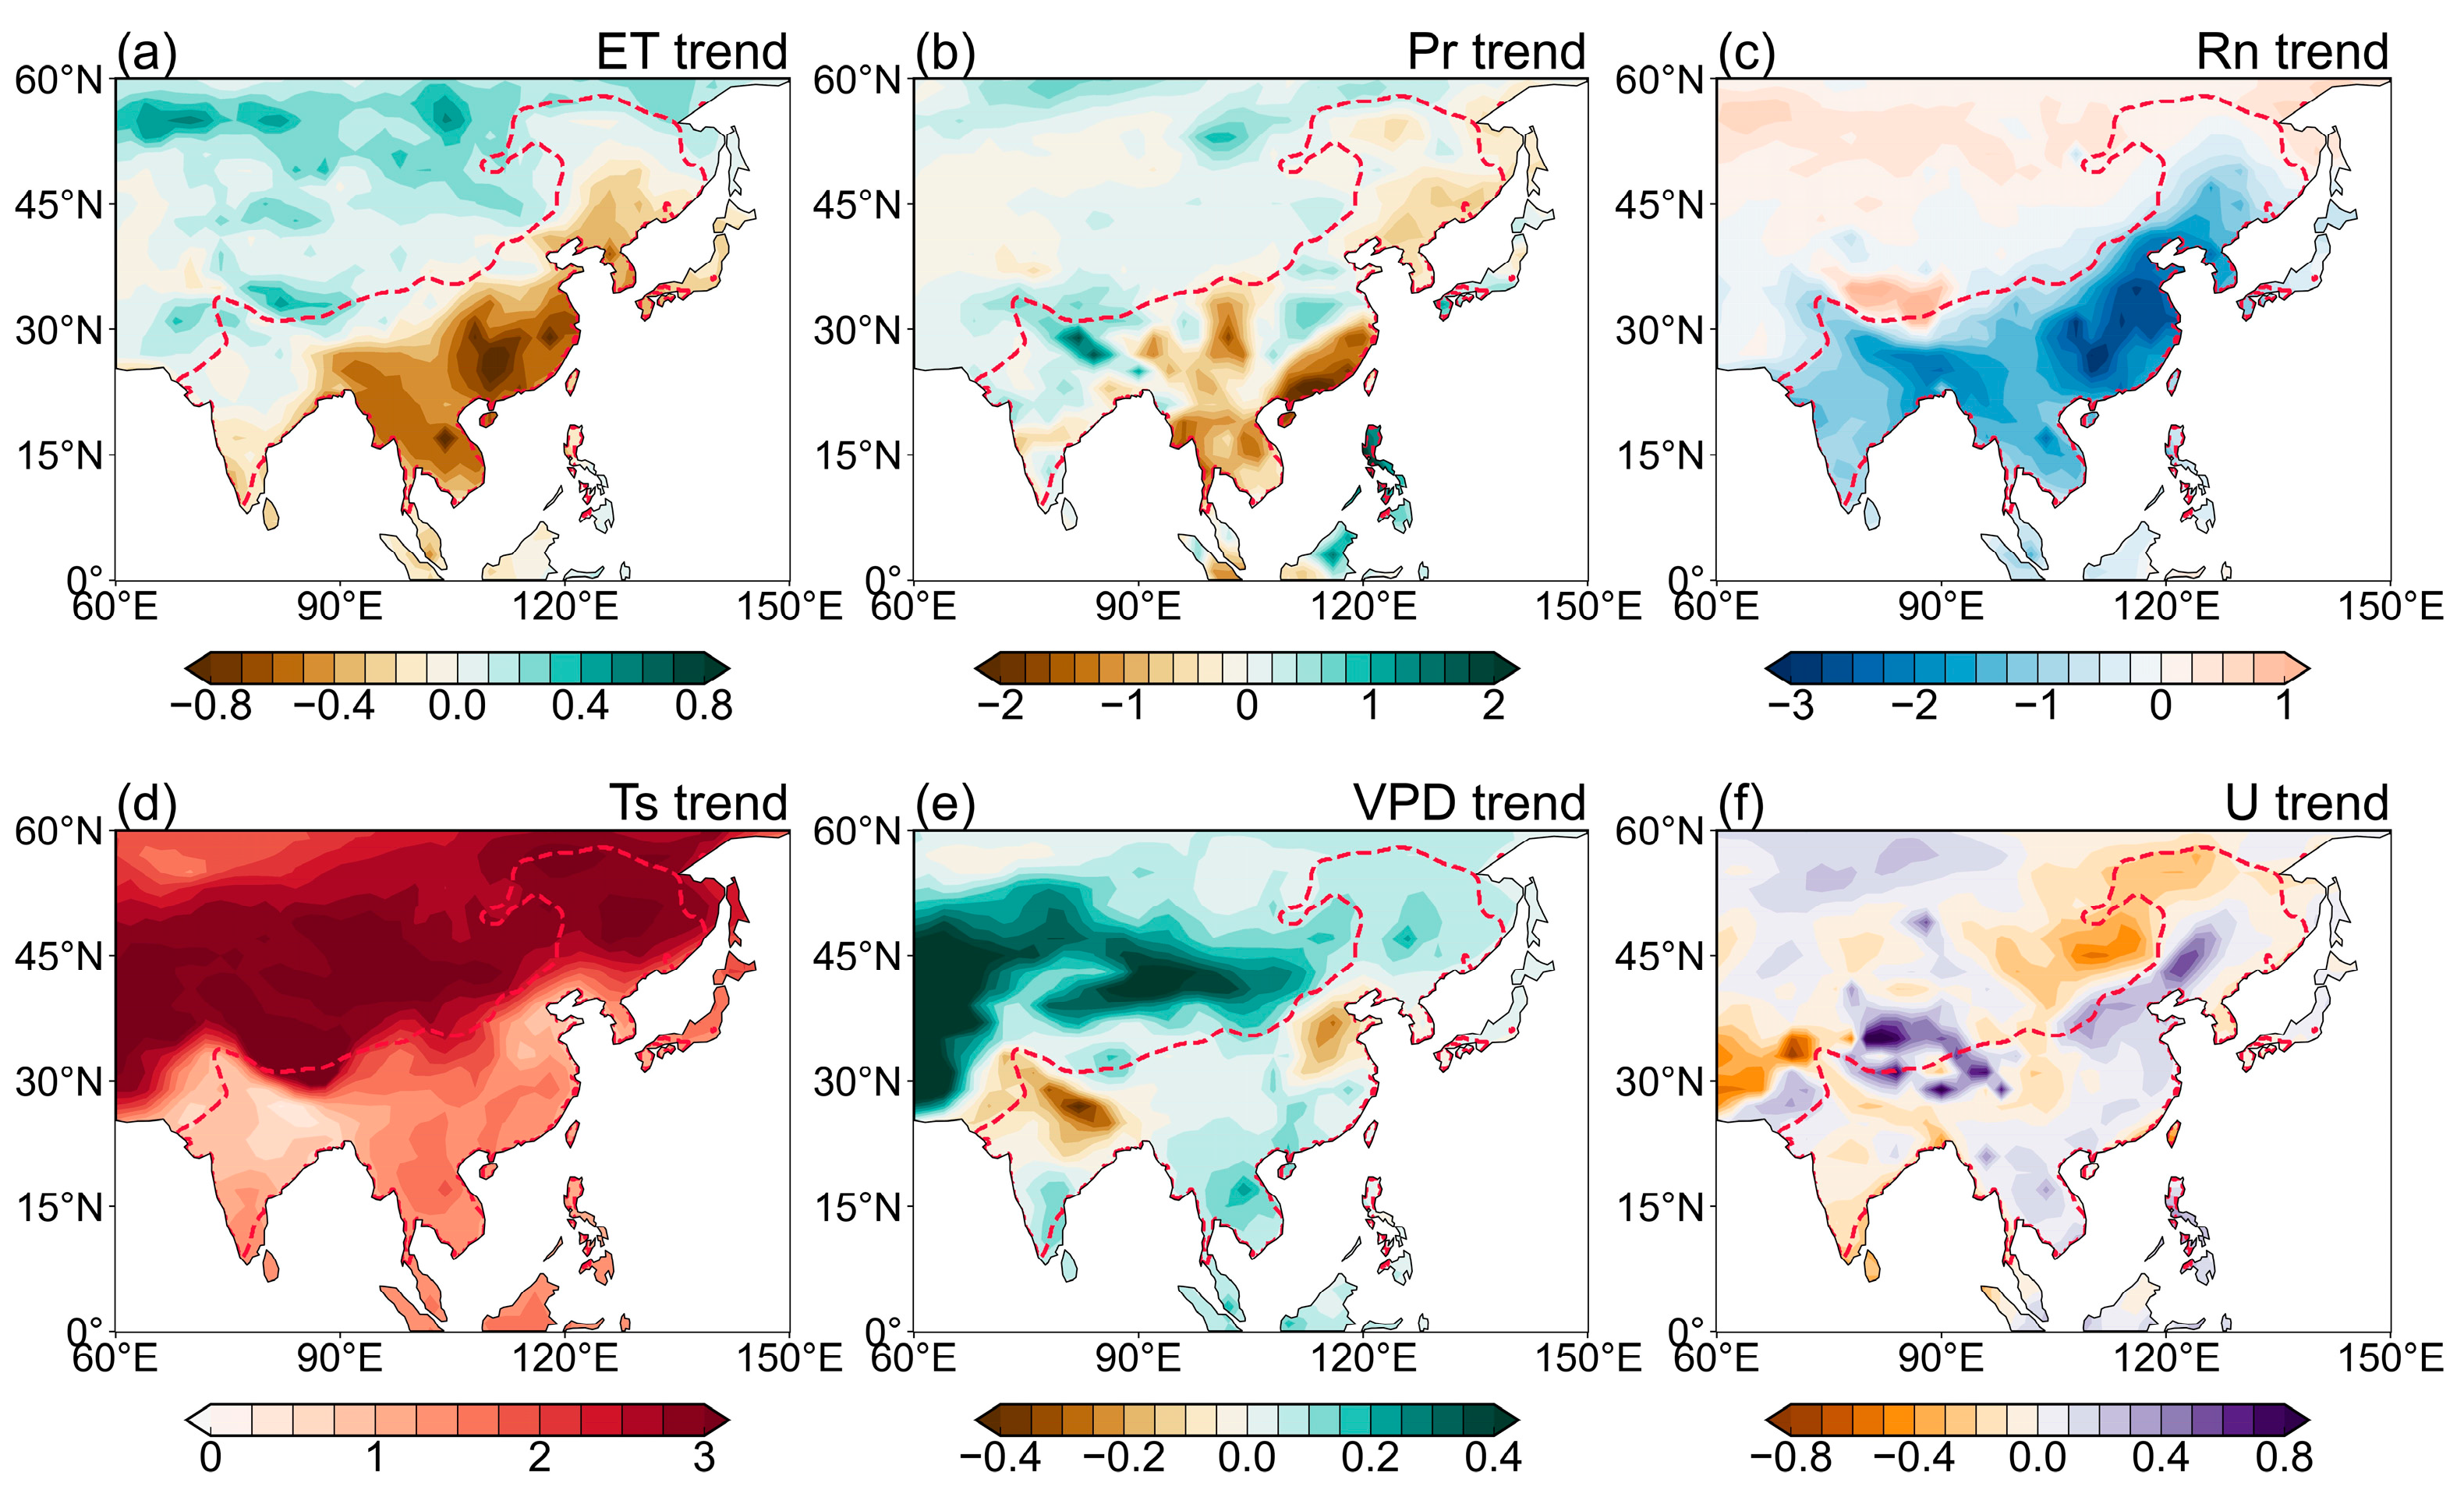
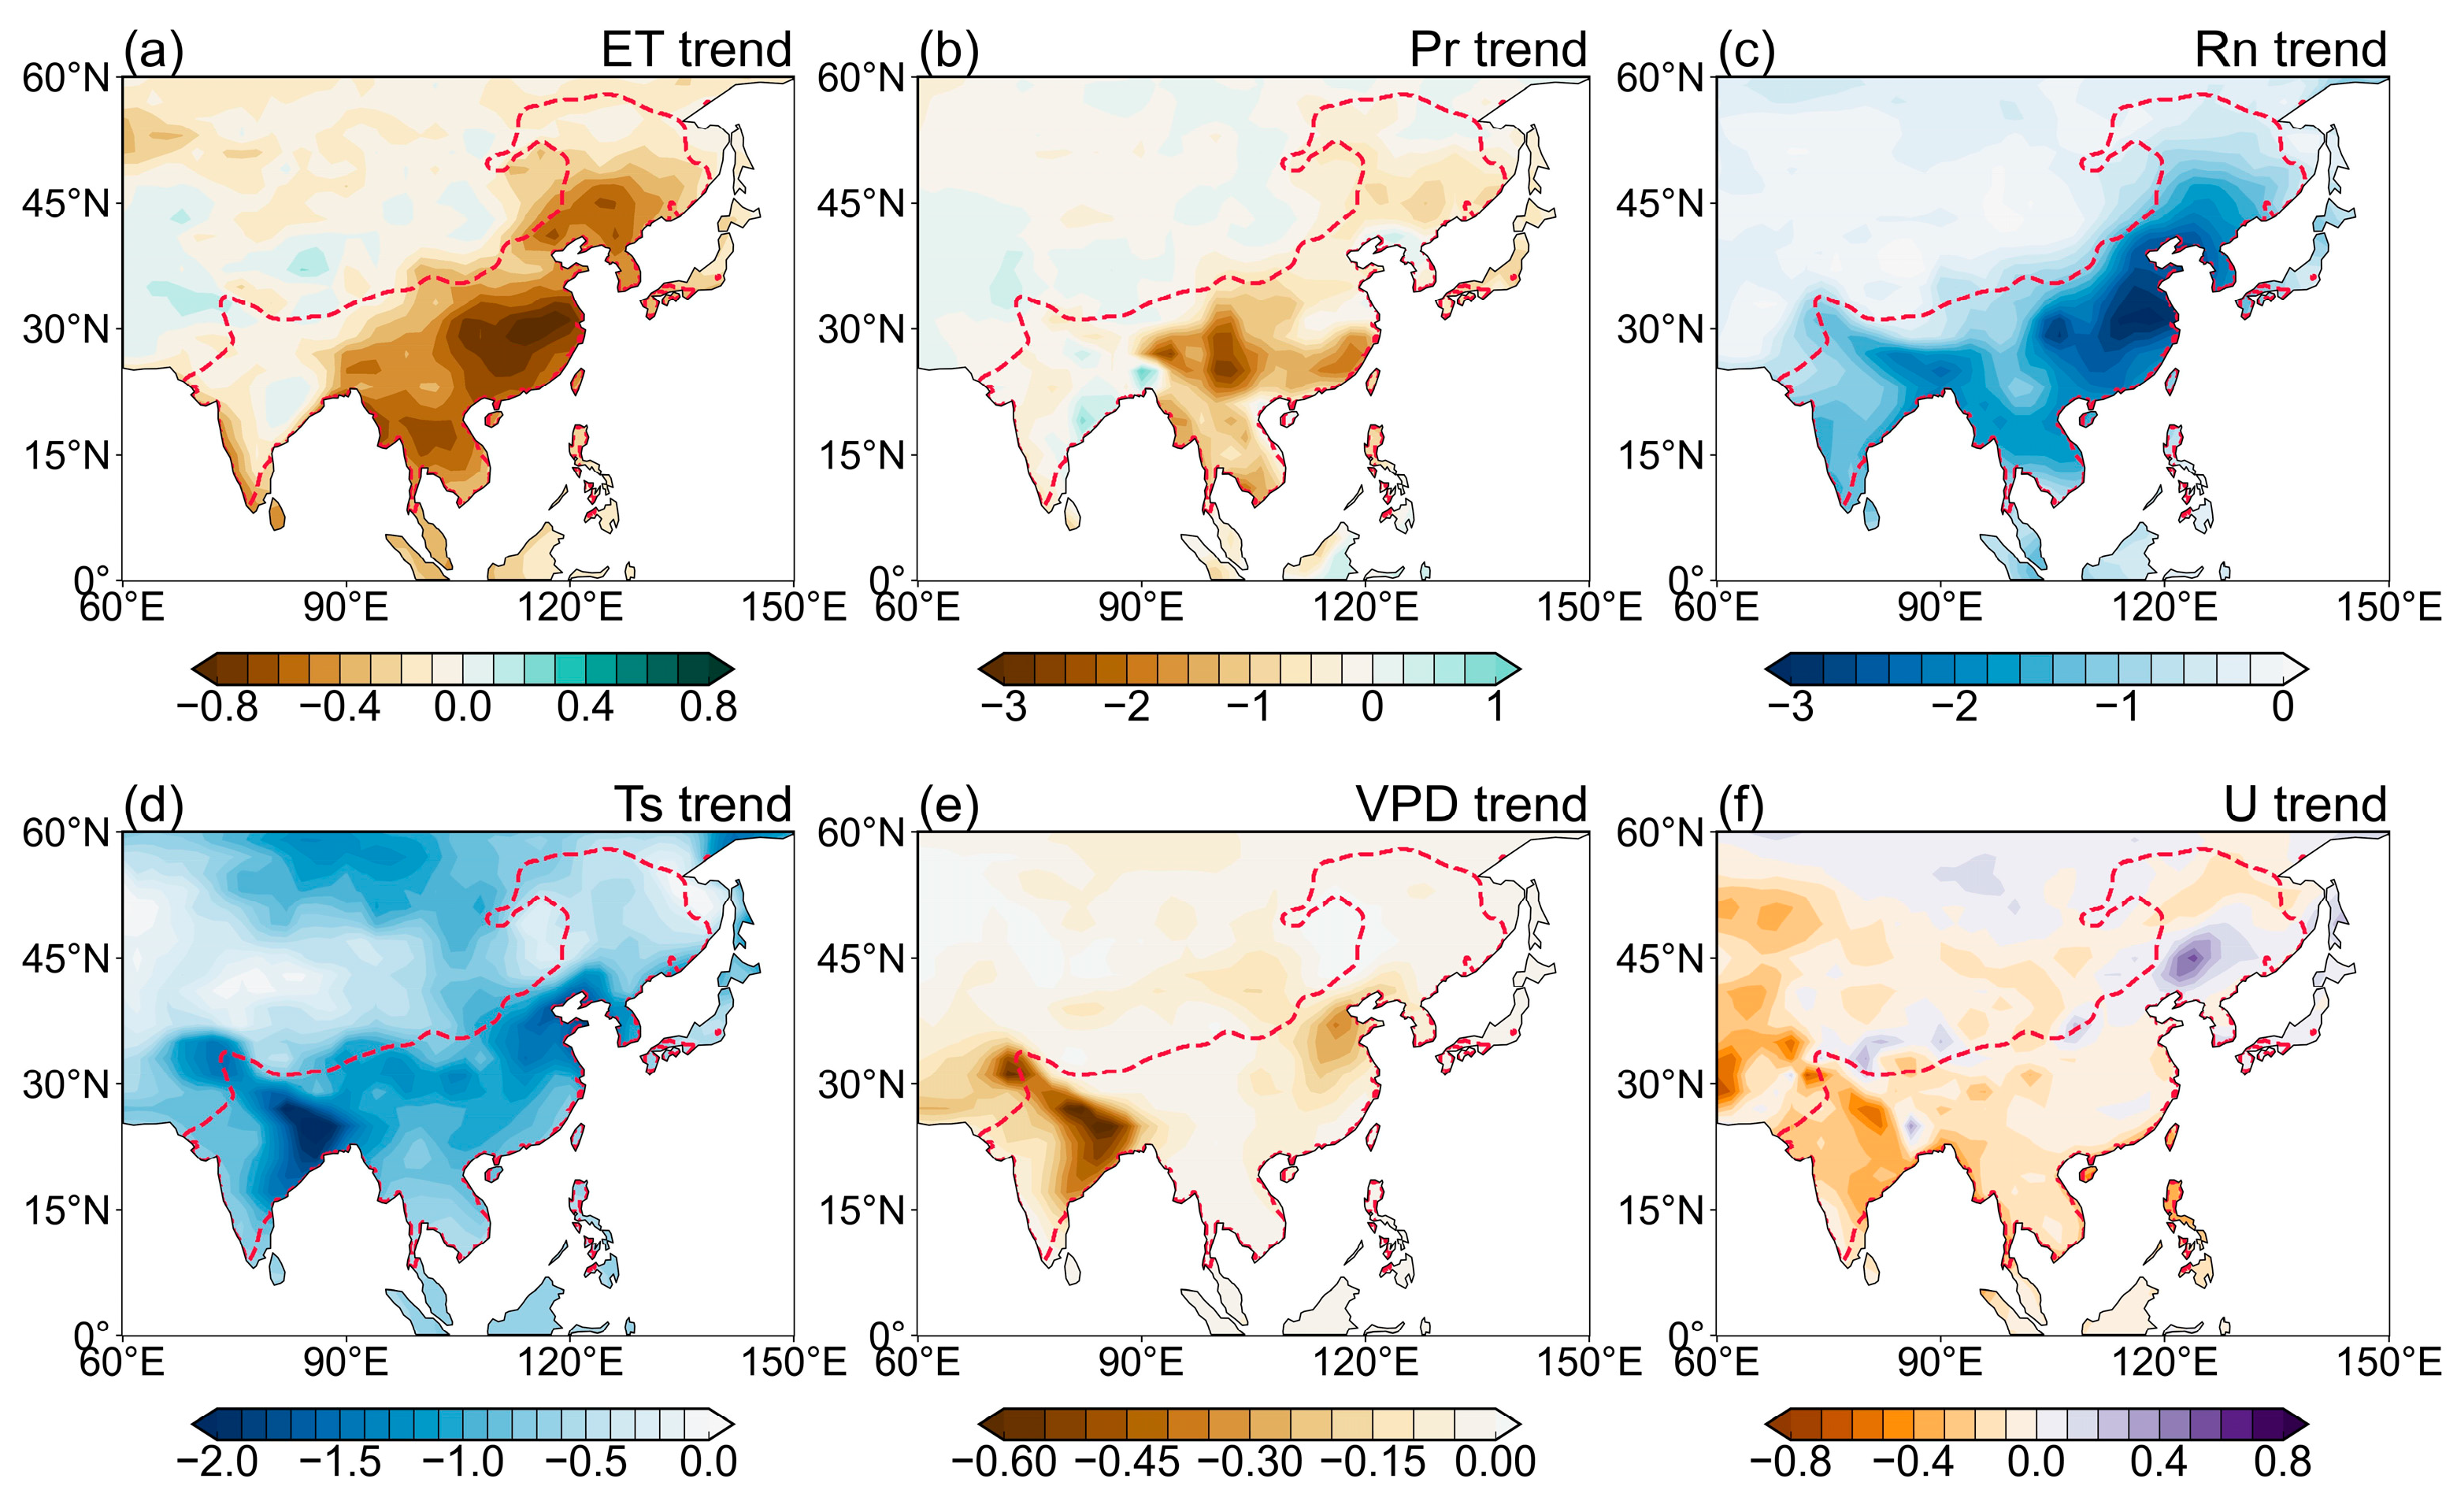
Figure 3 compares the changes in ET and its component variables from the historical simulation. From 1950 to 2014, the decrease in ET over the majority of the Asian monsoon region is consistent with the reduction in precipitation and net surface irradiance (Figure 3a–c). There is a notable decrease in precipitation over the Indochina Peninsula and southeast China (Figure 3b). The net surface irradiance is apparently decreased over the entire monsoon region, indicating less surface energy for ET (Figure 3c). On the other hand, the surface temperature increased during the period 1950–2014, when there was positive radiative forcing from GHGs (Figure 3d). The increases in the surface temperature potentially increase the ET, thus competing with the impacts from precipitation and radiation. The changes in the vapor pressure deficit and the 2 m wind speed are relatively weak, with some regional features (Figure 3e,f).
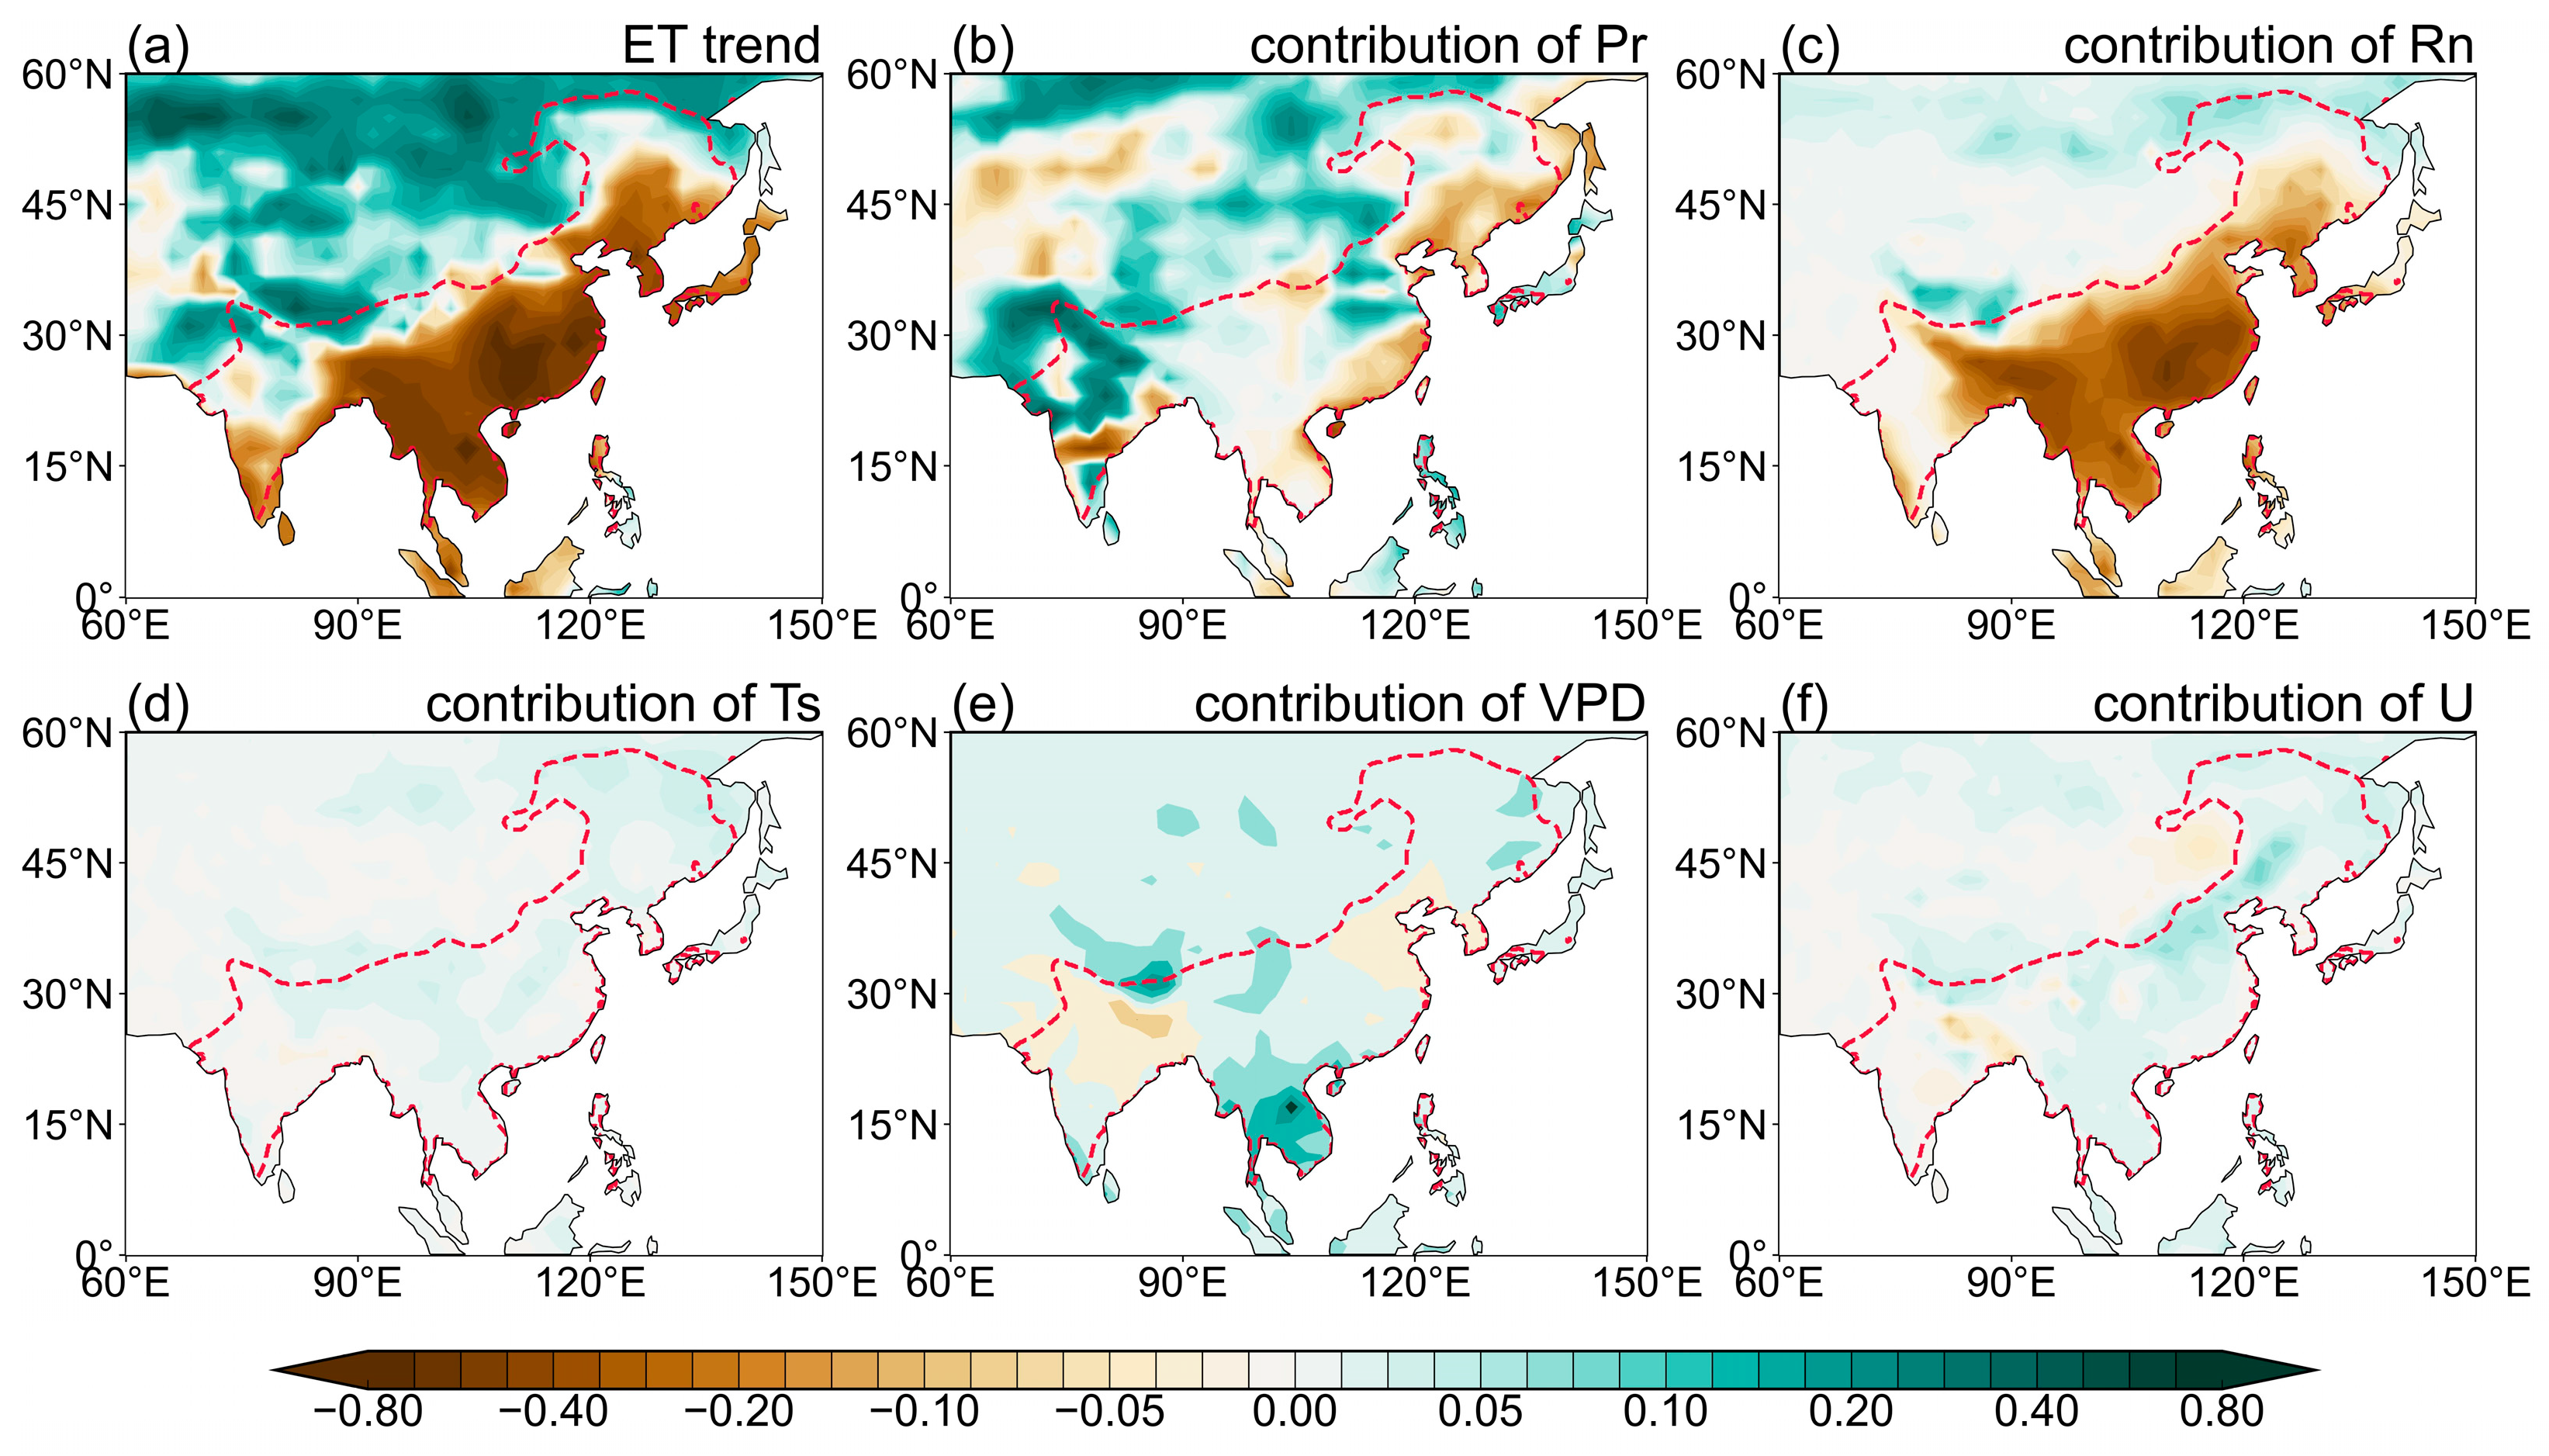
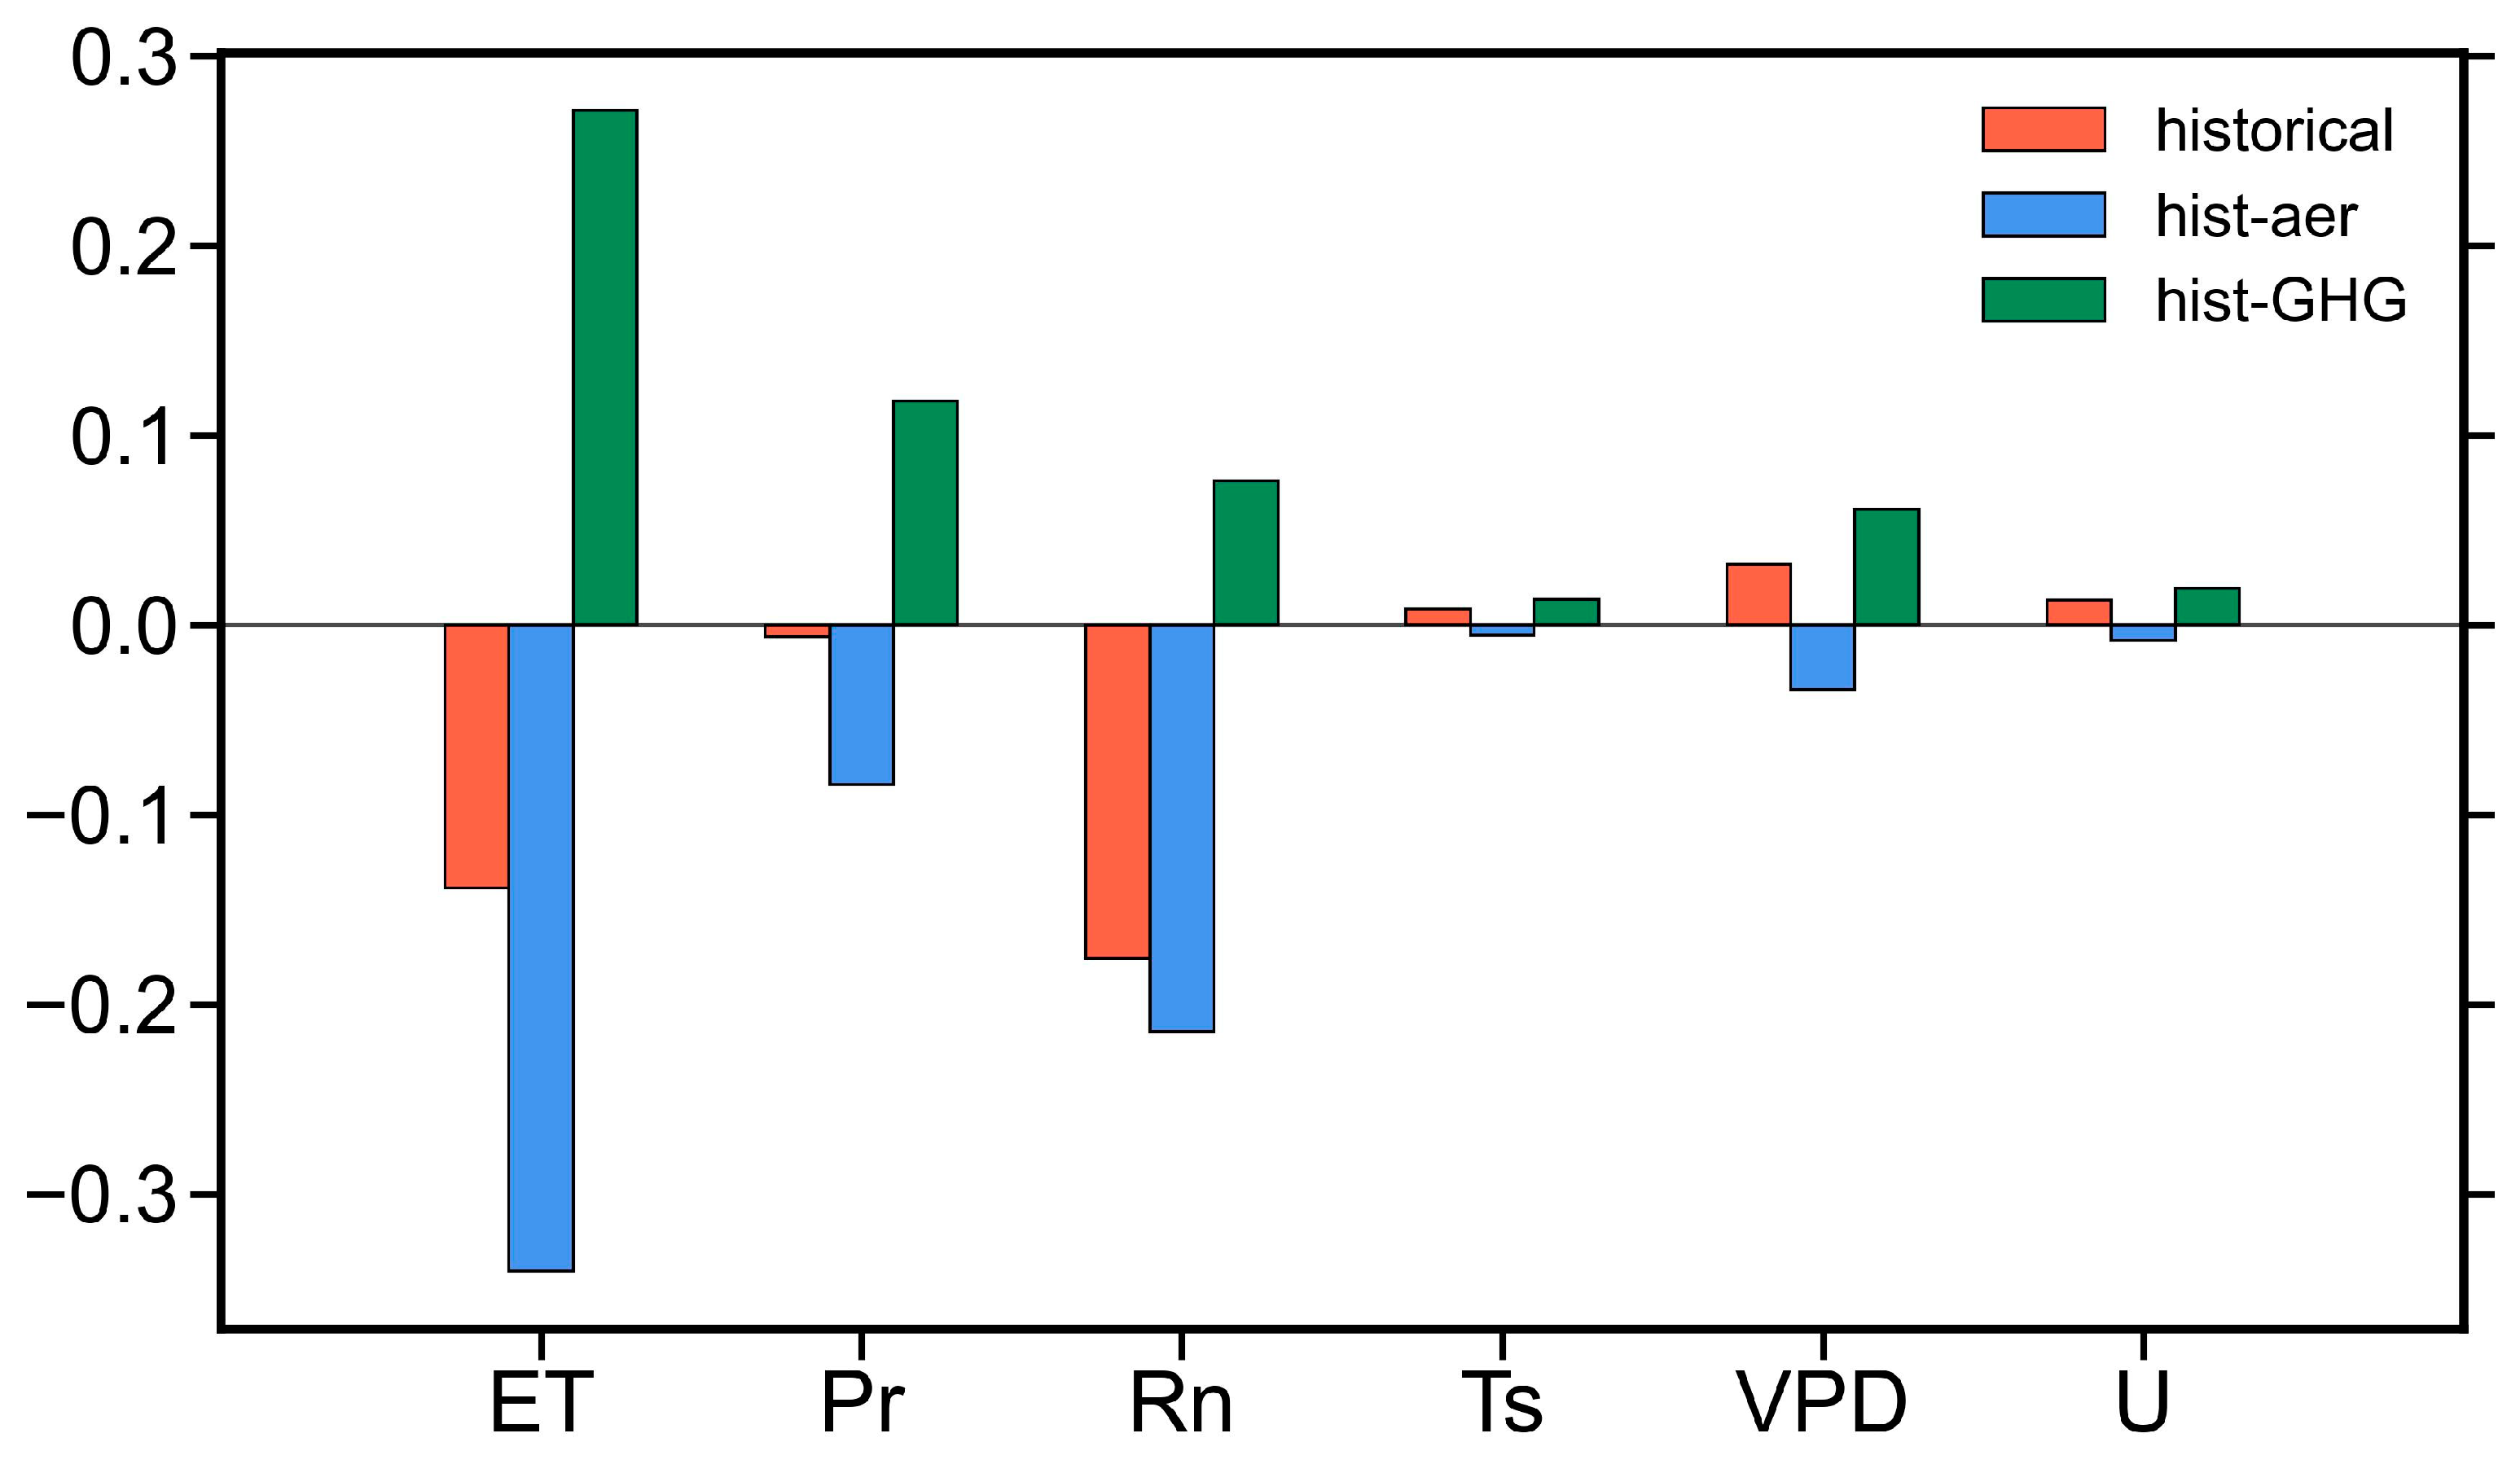
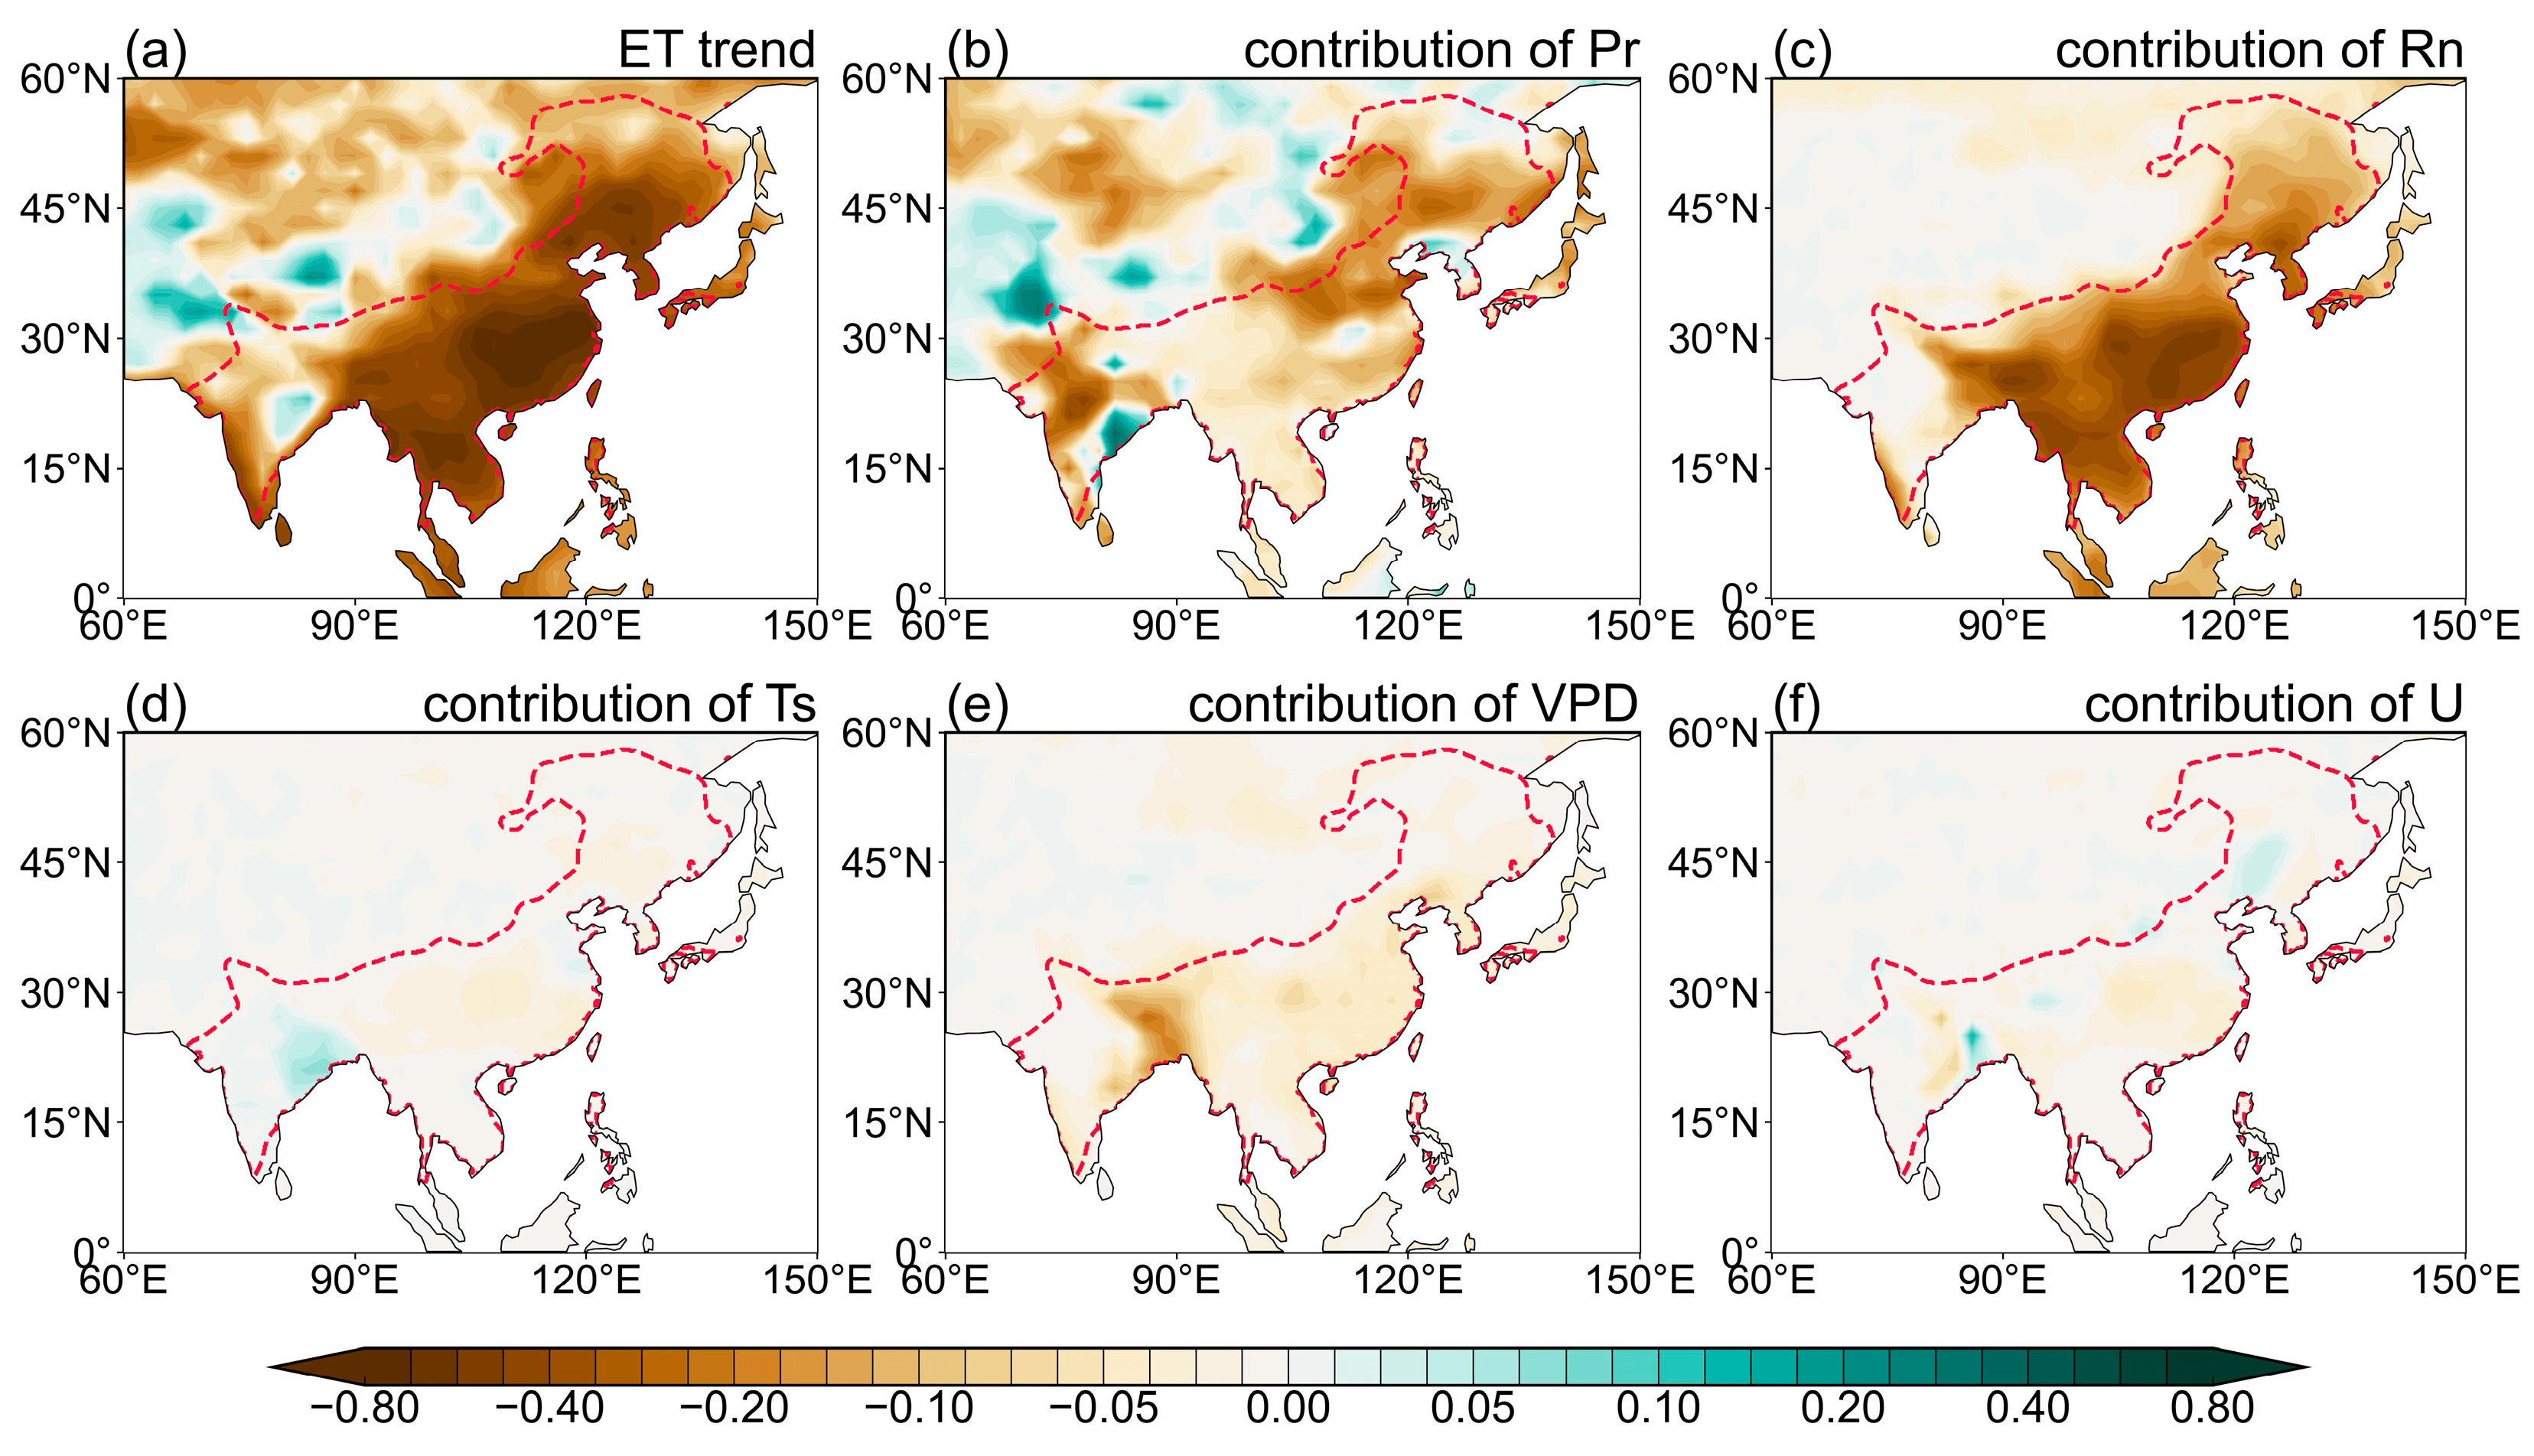
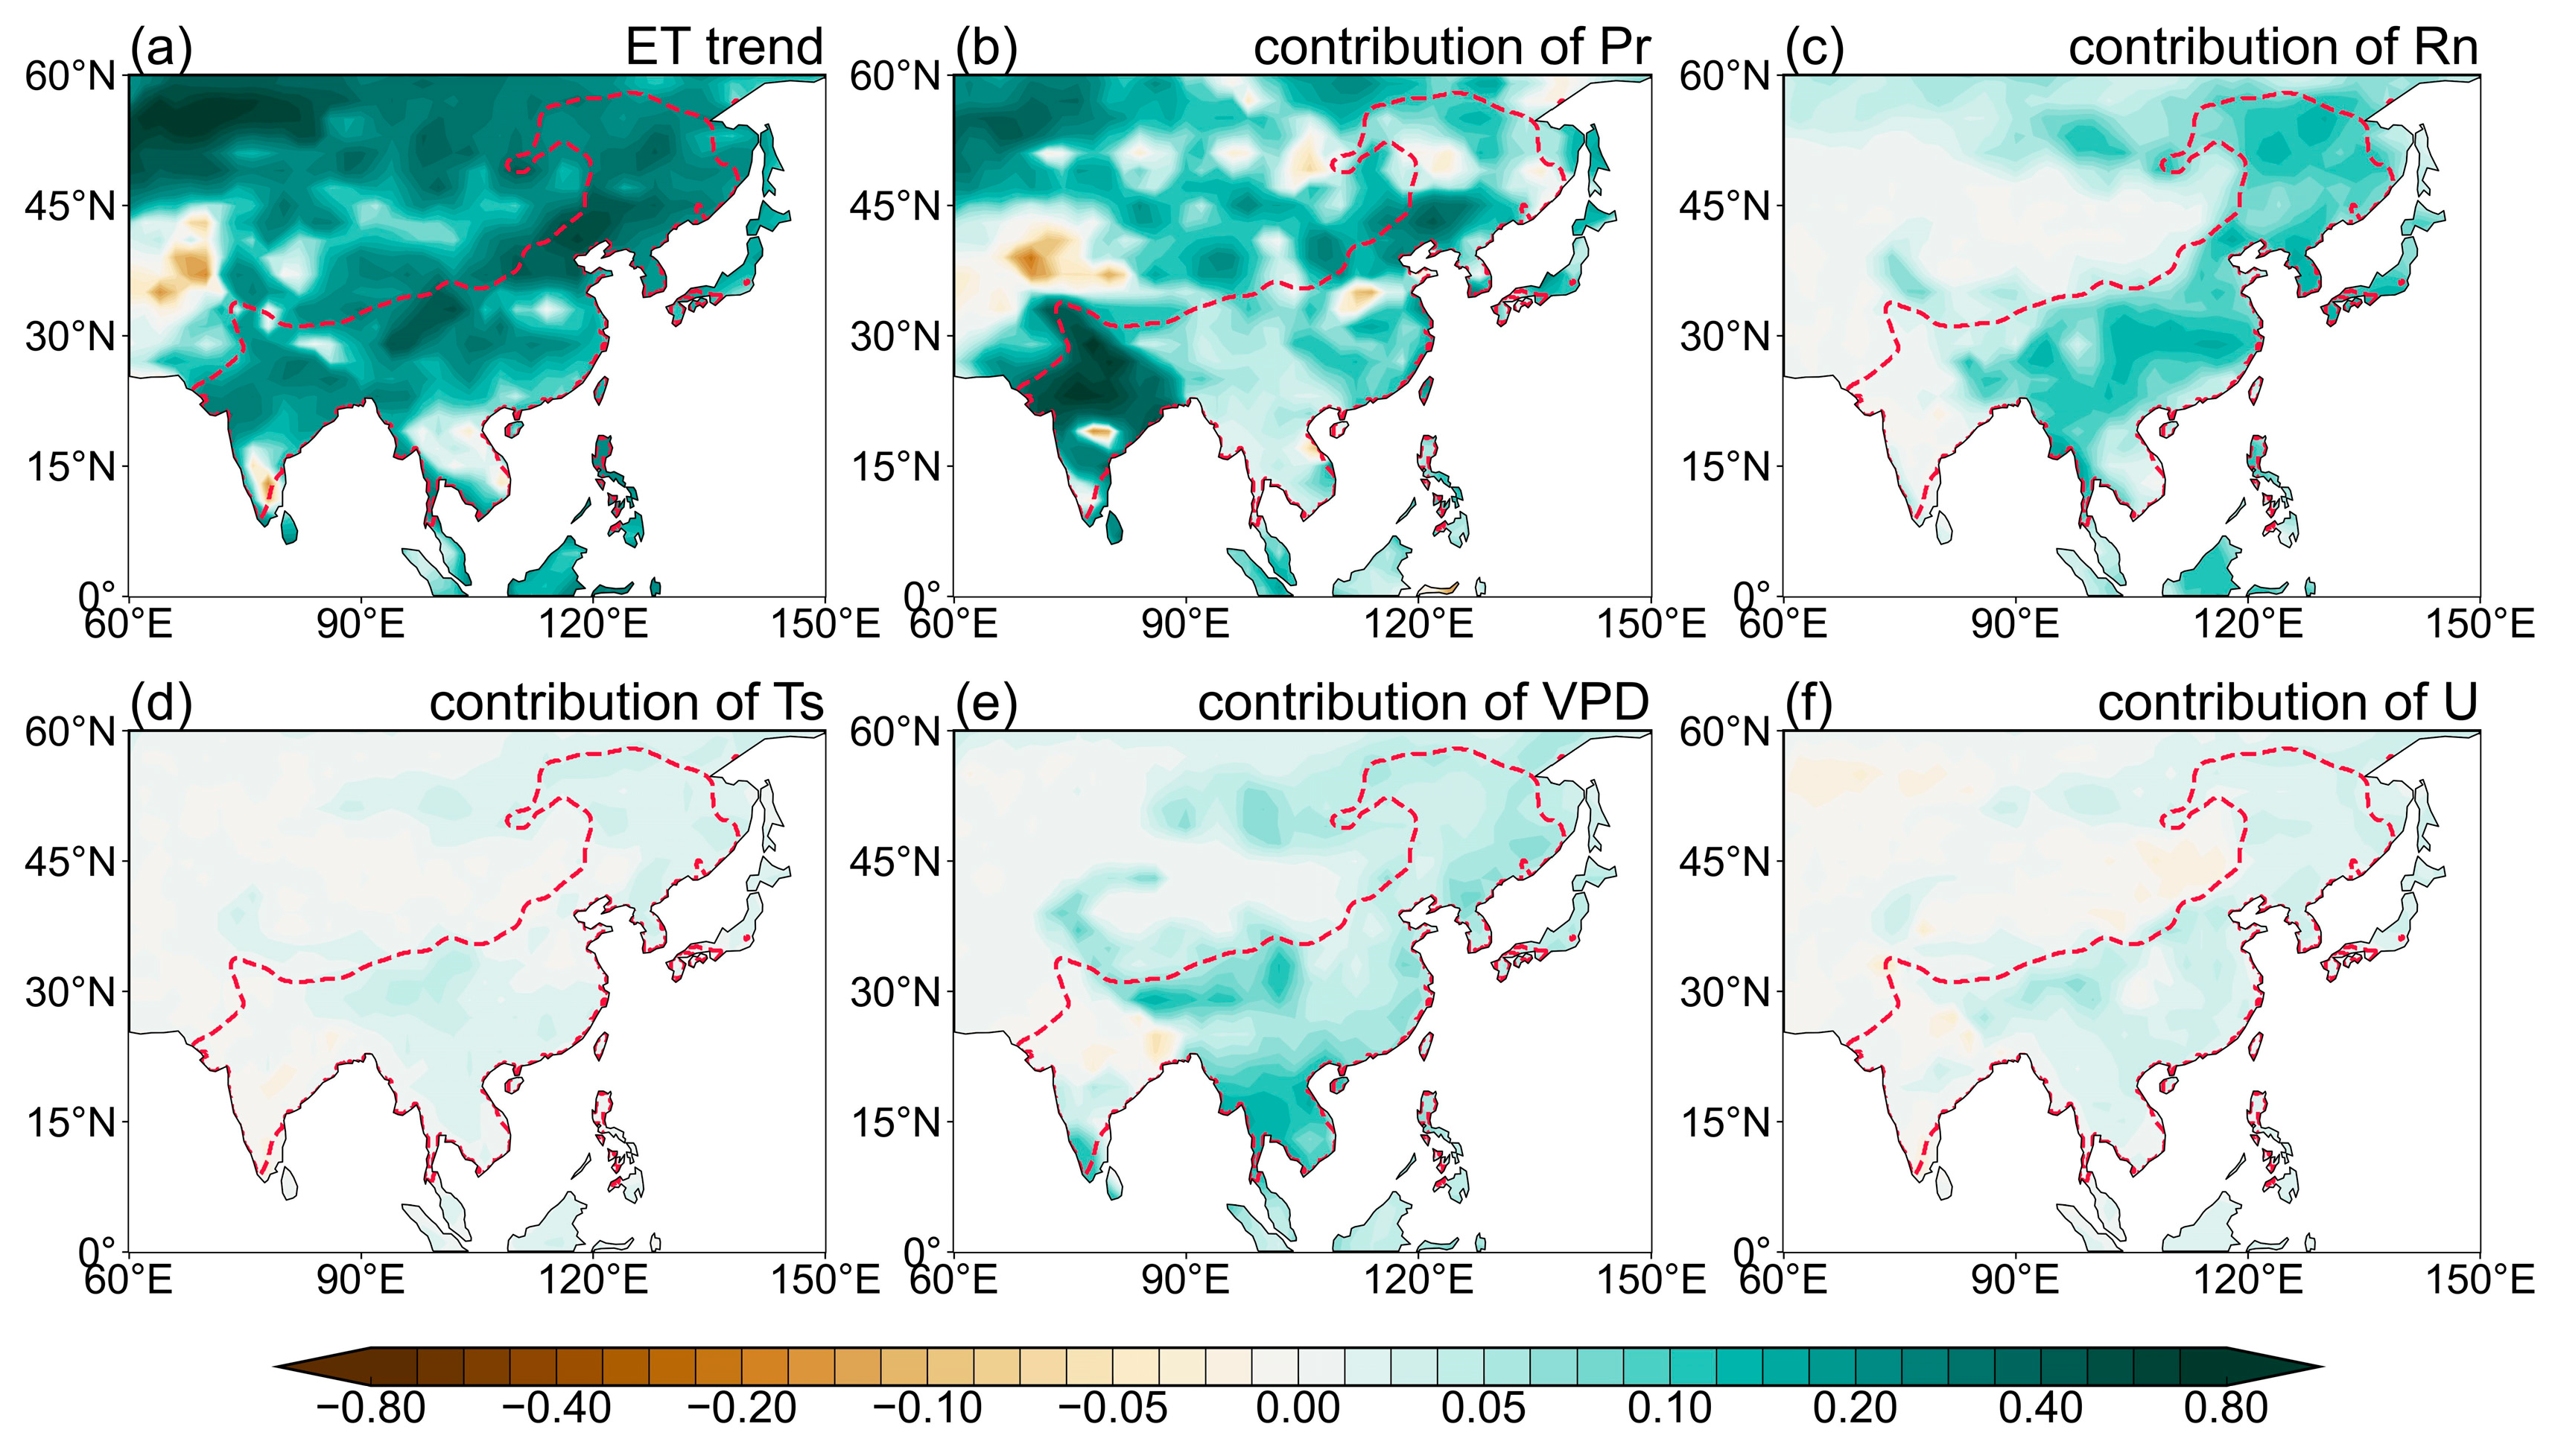
To understand the primary processes responsible for the decrease in ET during the 1950–2014 period under full anthropogenic forcing, Figure 4 illustrates the contribution of each factor to the ET trend. The decrease in net surface irradiance reduces the ET over the entire Asian monsoon region, especially over the Indochina Peninsula and South China (Figure 4c). Thus, the dry surface over the Indochina Peninsula and South China is mainly attributable to the lack of net surface irradiance (Figure 4a,c). The contribution of precipitation shows increases in the ET over the Indian subcontinent, but it decreases over the majority of East Asia (Figure 4b). It suggests that the pattern of the ET change may be partially affected by precipitation. The increase in the vapor pressure deficit causes an increase in the ET over the Indochina Peninsula, which partially mitigates the impact of net surface irradiance. The changes in wind speed and surface temperature would increase the ET over the northern boundary of the monsoon region, while their contributions are relatively weaker compared with that from radiation and precipitation. Figure 5 quantified the contribution of individual factors. Among the five factors, the net surface irradiance is the dominant source of ET in terms of magnitude in the historical experiment (red bars in Figure 5). The vapor pressure deficit has a minor role. The contributions from precipitation, wind speed, and surface temperature have limited contributions to the areal-averaged ET, but precipitation plays some role in the ET pattern change. The above analysis suggests that the decrease in ET may mainly be attributable to the reduction in net surface irradiance and the change in precipitation. The changes in net surface irradiance and precipitation can be understood from the impacts of anthropogenic aerosols and GHGs, respectively (Figure 5).

4. The Roles of Anthropocentric Aerosols and GHGs

We further demonstrate how individual anthropogenic forcings, namely aerosol and GHG forcings, would change the ET and its components, especially the net surface radiation and precipitation. The impacts from aerosols are illustrated in Figure 6 with the data from the hist-aer experiment. An apparent decrease in ET is seen over the entire Asian monsoon region, especially over South China and the Indochina Peninsula. In 1950–2014, the changes in the net surface radiation, precipitation, surface temperature, vapor pressure deficit, and surface wind speed all consistently show negative trends, resulting in a reduction in ET (Figure 6). It is of interest to note that the reduction in net surface radiation due to aerosols largely explains the corresponding change in the historical experiment in terms of magnitude and spatial pattern (Figure 3c). The reduction in precipitation due to aerosols dominates the changes over the Indochina Peninsula and southeast China in the historical experiment (Figure 6b and Figure 3b).
In terms of the relative contribution of individual factors, the two factors dominate the reduction in ET under aerosol forcing (Figure 5 and Figure 7). Weakening of the net surface irradiance reduces the ET over South China and Indochina Peninsula (Figure 7c). The decrease in precipitation reduces the ET all over the Asian monsoon region, although this is smaller than the radiation in magnitude (Figure 7b). The areal-averaged contributions from precipitation and net surface irradiance are −0.084 mm d−1 cent−1 and −0.21 mm d−1 cent−1, accounting for about 25% and 62%, respectively, of the total trend (−0.34 mm d−1 cent−1) (Figure 5). Furthermore, the contributions from the surface temperature, vapor pressure deficiency, and surface wind speed are only about 2%, 10%, and 2%, respectively (Figure 5).
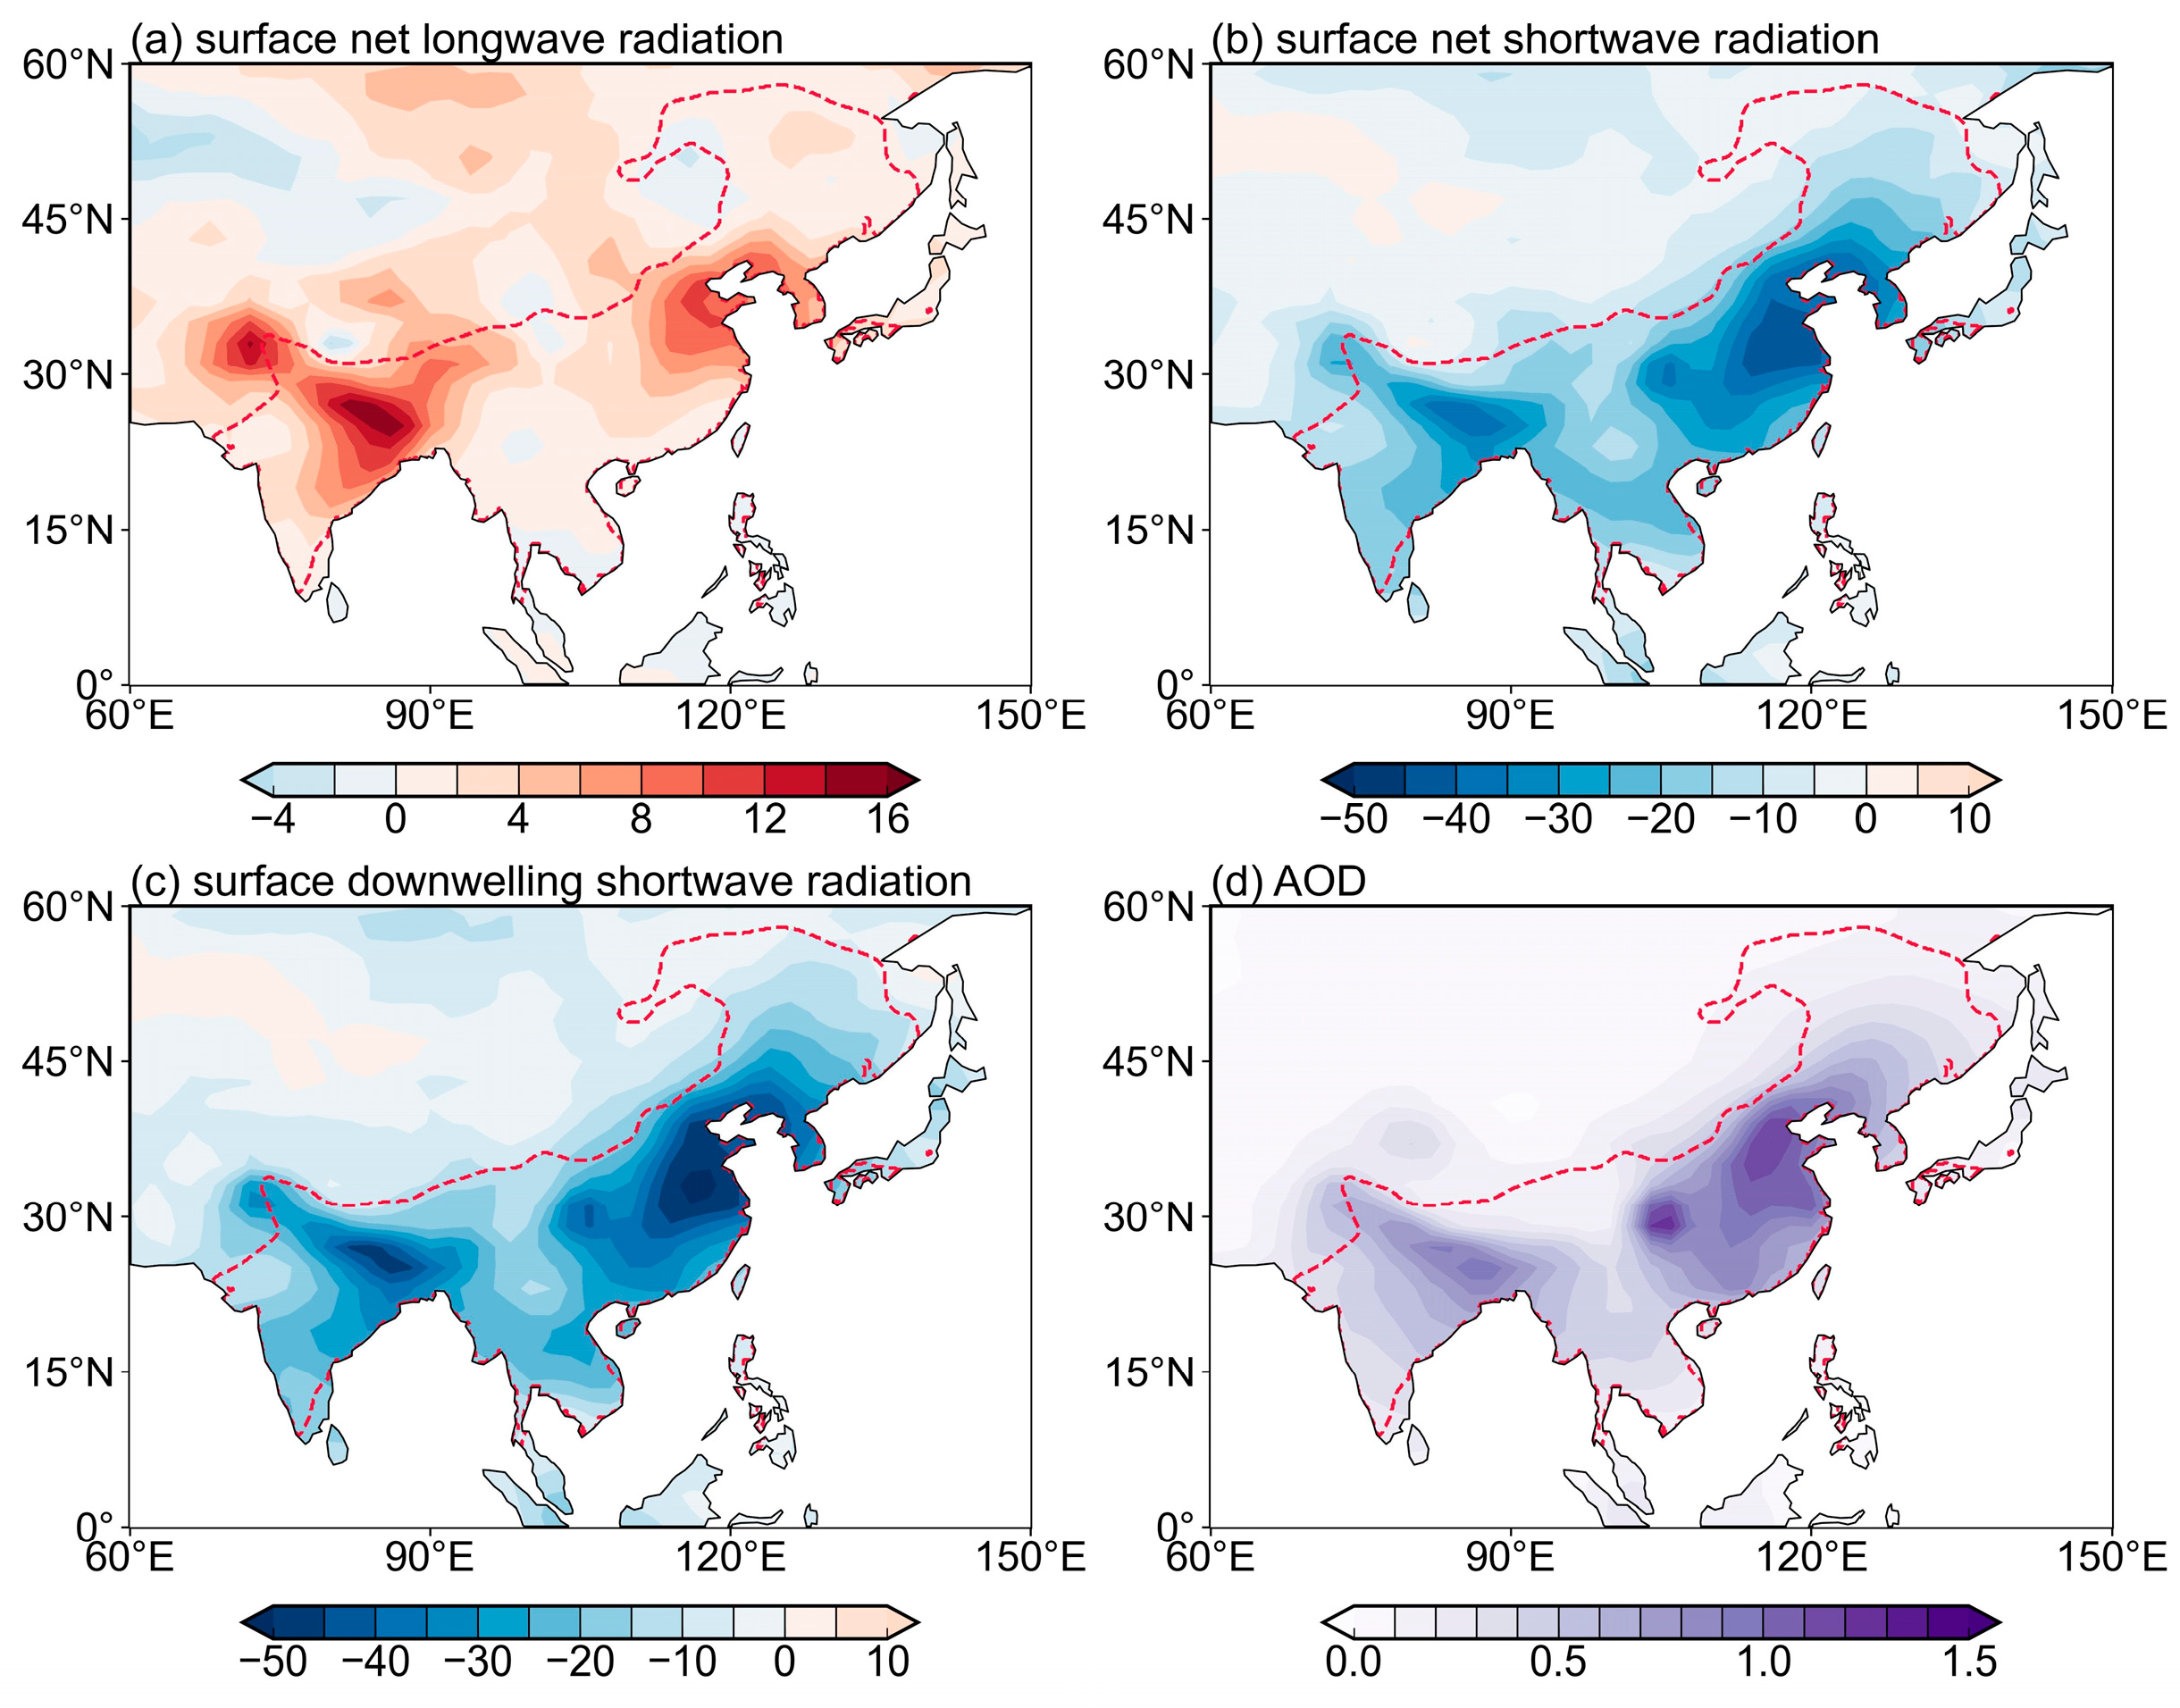
The analysis in the previous section shows that the reduction in ET in the historical simulation is largely attributable to the reduction in net surface irradiance (Figure 4). Both the changes in the ET and the net surface irradiance are dominated by anthropogenic aerosols. It is natural to ask why and how the aerosols could reduce the net surface irradiance and the ensuing ET. We diagnosed the changes in net surface irradiance as being attributable to the longwave and shortwave radiation components. Figure 8 shows the changes in the net longwave radiation, net shortwave radiation, downward shortwave radiation, and the pattern of aerosol optical depth at 550 nm. The decomposition shows that the reduction in downward shortwave radiation could significantly weaken the net shortwave radiation and the ensuing net surface energy for ET (Figure 8a–c). The downward shortwave radiation is decreased by 25.2 W m−2 cent−1 over the Asian monsoon region, which largely contributes to the reduction in the net shortwave radiation change (−21.9 W m−2 cent−1) and, thus, the net surface irradiance (−18.5 W m−2 cent−1). As revealed by prior studies, the aerosol–radiation interaction could influence the surface irradiance. During the period 1950–2014, the increase in aerosol emissions, represented by the AOD increase of 550 nm (Figure 8d), could scatter and reflect incoming solar radiation, leading to a reduction in the amount of shortwave radiation reaching the Earth’s surface. As shown in Figure 8d, the changes in the pattern of AOD resemble the reduction in downward shortwave radiation, indicating that the aerosol–radiation interaction plays an important role in the reduction in surface energy for ET.
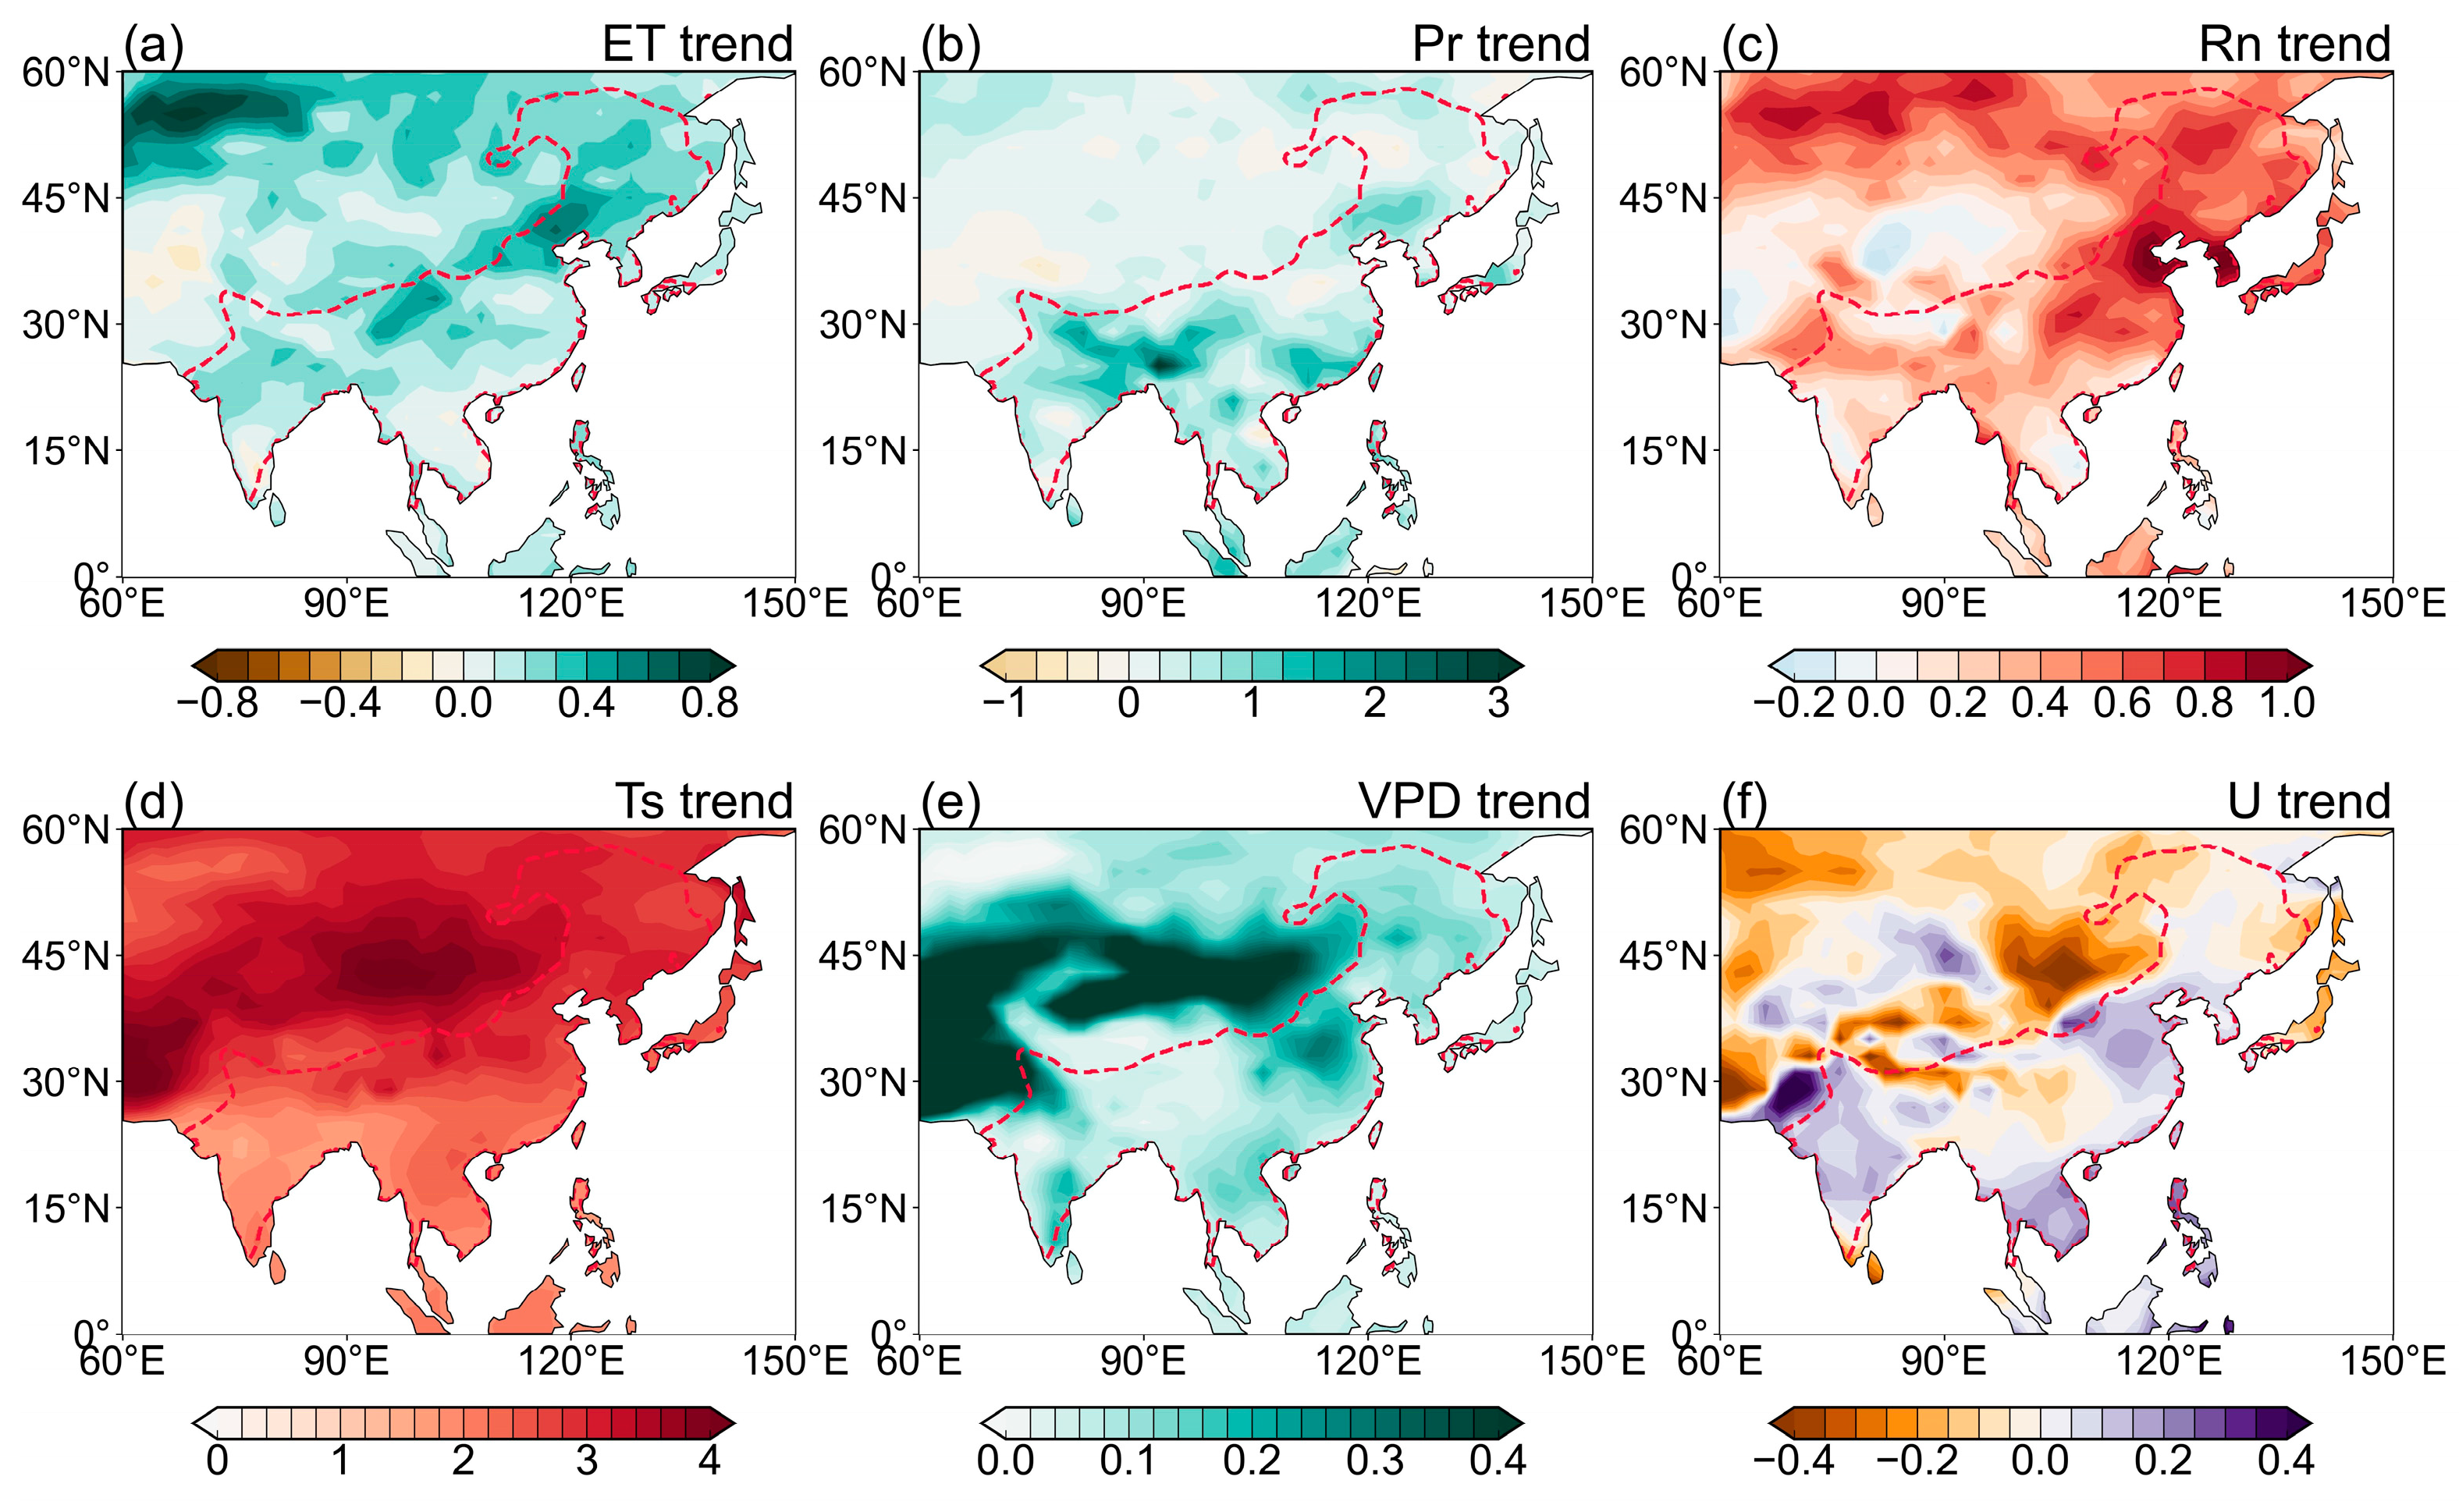
Contrary to the impact of aerosols, GHGs increase the ET. Figure 9 shows that GHGs increase the precipitation, net surface radiation, surface temperature, vapor pressure deficit, and surface wind speed over the Asian monsoon region. Given the positive relationship between the ET and each factor over the high-humidity monsoon region, the increases in all the factors positively contribute to the enhancement of ET, albeit at different magnitudes. As shown in Figure 10, the increase in ET due to GHGs is mainly attributable to the increase in precipitation over the Indian subcontinent and to the increase in net surface radiation over East Asia. A minor increase comes from the contribution of the vapor pressure deficit over the Indochina Peninsula. Quantitatively, the precipitation, radiation, and vapor pressure deficit account for 44%, 28%, and 22% of the increases in the total ET (Figure 6). The contributions from the rest of the two factors are negligible.
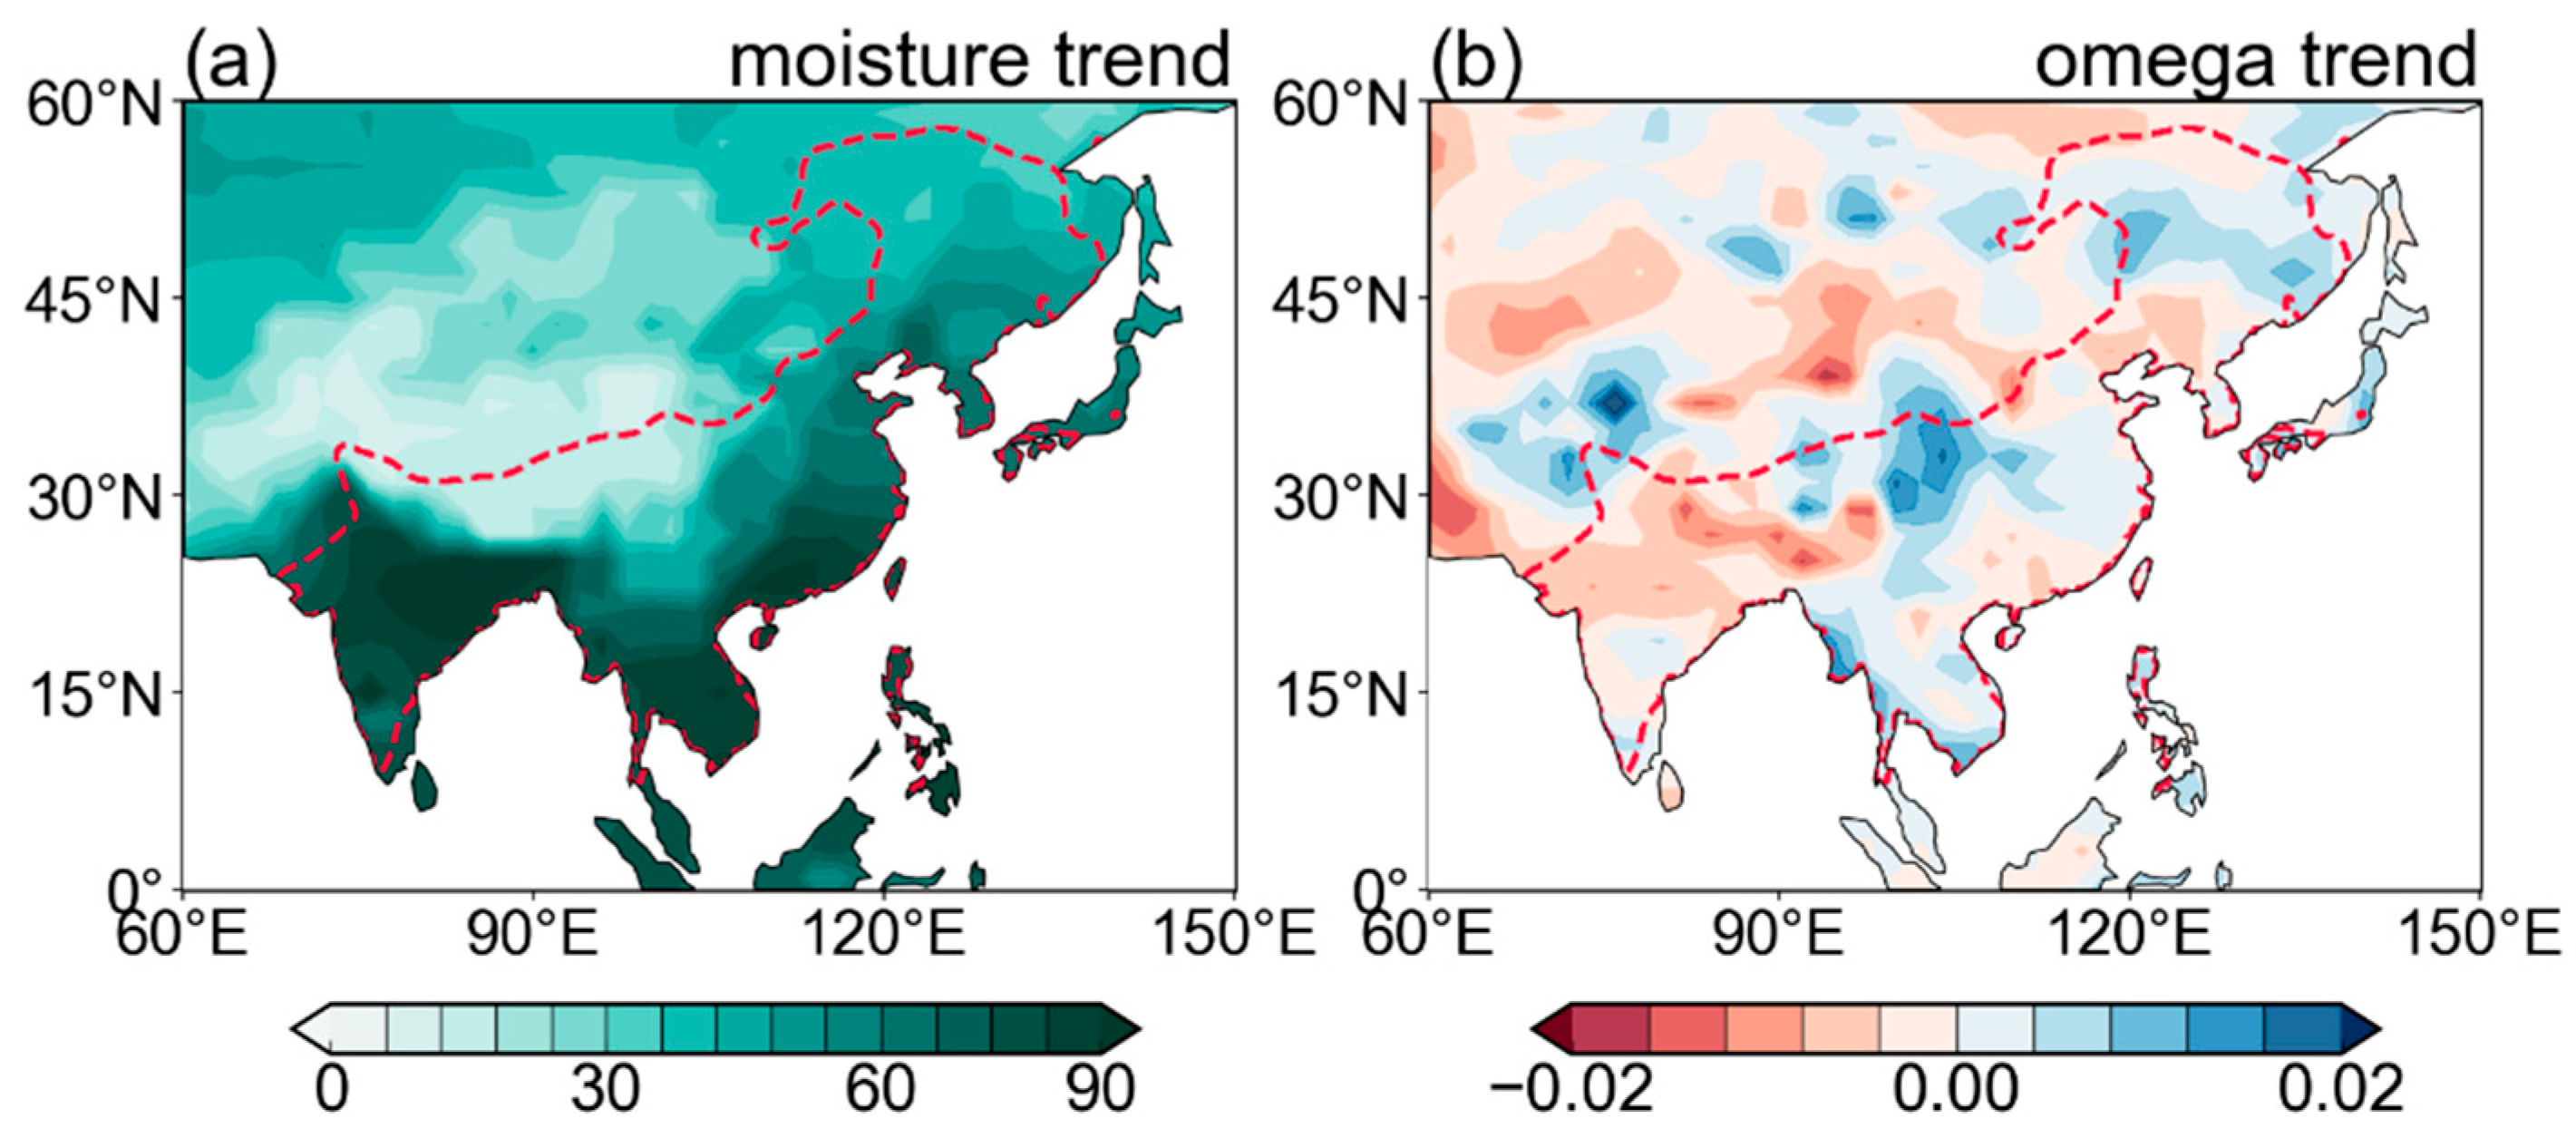
The increase in precipitation is attributable to atmospheric moistening due to the warming of air temperature and the ascending motion of the mid-troposphere. Figure 11 shows the trends of the vertically integrated atmospheric moisture and vertical pressure velocity at 500 hPa in the hist-GHG experiment. The positive radiative forcing from GHGs warms the surface and the atmospheric temperature (Figure 9d), leading to the higher moisture capability of the atmosphere. Thus, the moisture content is increased in the entire atmospheric column (Figure 11a), which could enhance precipitation without a change in monsoon circulation. Additionally, the increase in GHGs warms the land surface more than the adjacent ocean. It strengthens the land–sea thermal contrast during the summer season, leading to the enhancement of the ascending motion over the Indian subcontinent (Figure 11b). It enhances convection and precipitation. Therefore, both thermodynamic and dynamic processes could increase the precipitation, contributing to the increase in ET under GHG forcing.

5. Conclusions

During the 1950–2014 period, significant increases in anthropogenic aerosols and GHG emissions were observed over the densely populated Asian monsoon region. In this study, we explored the impacts of the two major anthropogenic forcings, namely aerosol and GHG forcings, on changes in the ET over monsoonal Asia. Although prior studies emphasized the importance of remote moisture transport on monsoon precipitation, local hydrological recycling contributes about half of the precipitation. ET also plays an essential role in the availability of groundwater for human activity and agricultural productivity. During the period 1950–2014, 27 out of 32 of the CMIP6 models simulated a decline in ET over the Asian monsoon region, demonstrating the important role of anthropogenic forcing. It indicates that the observed increase in ET since the 1980s may mainly originate from the earth system’s internal modes.
A detailed analysis of the ET reduction in the historical simulation shows that the reduction in net surface irradiance dominates the negative trend of ET, and a precipitation change would decrease the ET over the Indochina Peninsula and southeast China while increasing ET over North India. These two factors dominate the magnitude and pattern of ET change in the historical simulation. The attribution analysis suggests that anthropogenic aerosol forcing is the major cause of the weakening in ET in the historical simulation, while it is only partially compensated by the GHG forcing. The linear addition of the two forcings explains about 90% of the changes in ET in the historical simulation during the period 1950–2014. It is important to note that the aerosols and GHGs affect ET through different physical mechanisms; for instance, aerosols dominate surface energy processes, while GHGs mainly affect the atmospheric moisture for precipitation.
Anthropogenic aerosols influence the ET by modulating the shortwave radiation reaching the Earth’s surface. The increases in aerosol emissions during 1950–2014 enhance the reflection and scattering of the downward solar radiation, leading to less solar radiation reaching the surface. It decreases the net surface irradiance, resulting in a decline in ET in 1950–2014. The contribution from precipitation is relatively weaker and only effective over northwest India and part of North China. In terms of the increase in GHGs, this can warm the surface and atmosphere column, leading to an increase in the moisture capability of the atmosphere and contributing to the increase in rainfall over the Asian monsoon region. GHGs can also enhance the ascending motion over the Indian subcontinent. The thermodynamic and dynamic effects of GHGs both primarily increase the precipitation and positively contribute to the ET change. The significant compensation effect of the two forcings yields the pattern of ET trend in the historical experiment of 1950–2014. The results from this study suggest that future changes in the land–water cycle may mainly rely on the aerosol emission policy, rather than the carbon reduction policy.

Author Contributions

Conceptualization, J.C. and X.Z.; methodology, J.C. and Z.K.; formal analysis, Z.K., X.Z., R.G., and N.G.; writing—original draft preparation, J.C. and X.Z.; writing—review and editing, J.C. and X.Z. All authors have read and agreed to the published version of the manuscript.

Funding

This research was jointly funded by the National Key R&D Program of China (2023YFF0805402), the Natural Science Foundation of China of Jiangsu Province (BK20220108), the Natural Science Foundation of China (42375034), the Ningxia Science and Technology Innovation Team: Research and Application of Ningxia Intelligent Digital Forecasting Technology (2024CXTD006), and the Key R&D Program of Ningxia (2022BEG03058).

Data Availability Statement

The CMIP6 model data are freely available from https://esgf-node.llnl.gov/projects/cmip6/ (assessed on 1 April 2024). The GLEAM3.0a dataset can be downloaded from https://www.gleam.eu (assessed on 1 April 2024). The GLDAS2.0-Noah dataset can be downloaded from https://disc.gsfc.nasa.gov/datasets?keywords=GLDAS (assessed on 1 April 2024). The HG-Land ET dataset can be downloaded from https://doi.org/10.57760/sciencedb.10519 (assessed on 1 April 2024).

Acknowledgments

We acknowledge the computer resources at the NUIST High-Performance Computer Center.

Conflicts of Interest

The authors declare no conflicts of interests.

References

  1. Trenberth, K.E.; Fasullo, J.T.; Kiehl, J. Earth’s global energy budget. Bull. Am. Meteorol. Soc. 2009, 90, 311–324. [Google Scholar] [CrossRef]
  2. Koster, R.D.; Sud, Y.C.; Guo, Z.; Dirmeyer, P.A.; Bonan, G.; Oleson, K.W.; Chan, E.; Verseghy, D.; Cox, P.; Davies, H.; et al. GLACE: The global land atmosphere coupling experiment. Part I: Overview. J. Hydrometeorol. 2006, 7, 590–610. [Google Scholar] [CrossRef]
  3. Wang, K.; Dickinson, R.E. A review of global terrestrial evapotranspiration: Observation, modeling, climatology, and climatic variability. Rev. Geophys. 2012, 50, RG2005. [Google Scholar] [CrossRef]
  4. Yang, Y.; Roderick, M.L.; Guo, H.; Miralles, D.G.; Zhang, L.; Fatichi, S.; Luo, X.; Zhang, Y.; McVicar, T.R.; Tu, Z.; et al. Evapotranspiration on a greening Earth. Nat. Rev. Earth Environ. 2023, 4, 626–641. [Google Scholar] [CrossRef]
  5. IPCC. Climate Change 2021: The Physical Science Basis; Masson-Delmotte, V., Zhai, P., Pirani, A., Connors, S.L., Péan, C., Berger, S., Caud, N., Chen, Y., Goldfarb, L., Gomis, M.I., et al., Eds.; Cambridge University Press: Cambridge, UK, 2021. [Google Scholar]
  6. Wu, G.; Li, Z.; Fu, C.; Zhang, X.; Zhang, R.; Zhang, R.; Zhou, T.; Li, J.; Li, J.; Zhou, D.; et al. Advances in studying interactions between aerosols and monsoon in China. Sci. China Earth Sci. 2016, 59, 1–16. [Google Scholar] [CrossRef]
  7. Cao, J.; Zhao, H.; Wang, B.; Wu, L. Hemisphere-asymmetric tropical cyclones response to anthropogenic aerosol forcing. Nat. Commun. 2021, 12, 6787. [Google Scholar] [CrossRef] [PubMed]
  8. Cao, J.; Wang, H.; Wang, B.; Zhao, H.; Wang, C.; Zhu, X. Higher sensitivity of Northern Hemisphere monsoon to anthropogenic aerosol than greenhouse gases. Geophys. Res. Lett. 2022, 49, e2022GL100270. [Google Scholar] [CrossRef]
  9. Douville, H.; Ribes, A.; Decharme, B.; Alkama, R.; Sheffield, J. Anthropogenic influence on multidecadal changes in recon- structed global evapotranspiration. Nat. Clim. Change 2013, 3, 59–62. [Google Scholar] [CrossRef]
  10. Sun, S.; Chen, H.; Wang, G.; Li, J.; Mu, M.; Yan, G.; Xu, B.; Huang, J.; Wang, J.; Zhang, F.; et al. Shift in potential evapotranspiration and its implications for dryness/wetness over Southwest China. J. Geophys. Res. Atmos. 2016, 121, 9342–9355. [Google Scholar] [CrossRef]
  11. Zhou, H.; Yue, X.; Lei, Y.; Tian, C.; Ma, Y.; Cao, Y. Aerosol radiative and climatic effects on ecosystem productivity and evapotranspiration. Curr. Opin. Environ. Sci. Health 2021, 19, 100218. [Google Scholar] [CrossRef]
  12. Mahowald, N. Aerosol indirect effect on biogeochemical cycles and climate. Science 2011, 334, 794–796. [Google Scholar] [CrossRef] [PubMed]
  13. Unger, N.; Yue, X.; Harper, K.L. Aerosol climate change effects on land ecosystem services. Faraday Discuss. 2017, 200, 121–142. [Google Scholar] [CrossRef]
  14. Ficklin, D.L.; Novick, K.A. Historic and projected changes in vapor pressure deficit suggest a continental-scale drying of the United States atmosphere. J. Geophys. Res. Atmos. 2017, 122, 2061–2079. [Google Scholar] [CrossRef]
  15. Scheff, J.; Frierson, D.M.W. Robust future precipitation declines in CMIP5 largely reflect the poleward expansion of model subtropical dry zones. Geophys. Res. Lett. 2012, 39, L18704. [Google Scholar] [CrossRef]
  16. Thompson, S.L.; Govindasamy, B.; Mirin, A.; Caldeira, K.; Delire, C.; Milovich, J.; Wickett, M.; Erickson, D. Quantifying the effects of CO2-fertilized vegetation on future global climate and carbon dynamics. Geophys. Res. Lett. 2004, 31, L23211. [Google Scholar] [CrossRef]
  17. Norby, R.J.; DeLucia, E.H.; Gielen, B.; Calfapietra, C.; Giardina, C.P.; King, J.S.; Ledford, J.; McCarthy, H.R.; Moore, D.J.P.; Ceulemans, R.; et al. Forest response to elevated CO2 is conserved across a broad range of productivity. Proc. Natl. Acad. Sci. USA 2005, 102, 18052–18056. [Google Scholar] [CrossRef]
  18. Zhu, Z.; Piao, S.; Myneni, R.B.; Huang, M.; Zeng, Z.; Canadell, J.G.; Ciais, P.; Sitch, S.; Friedlingstein, P.; Arneth, A.; et al. Greening of the Earth and its drivers. Nat. Clim. Change 2016, 6, 791–795. [Google Scholar] [CrossRef]
  19. Bonfils, C.; Anderson, G.; Santer, B.D.; Phillips, T.J.; Taylor, K.E.; Cuntz, M.; Zelinka, M.D.; Marvel, K.; Cook, B.I.; Cvijanovic, I.; et al. Competing influences of anthropogenic warming, ENSO, and plant physiology on future terrestrial aridity. J. Clim. 2017, 30, 6883–6904. [Google Scholar] [CrossRef] [PubMed]
  20. Medlyn, B.E.; Duursma, R.A.; Eamus, D.; Ellsworth, D.S.; Prentice, I.C.; Barton, C.V.; Crous, K.Y.; De Angelis, P.; Freeman, M.; Wingate, L. Reconciling the optimal and empirical approaches to modelling stomatal conductance. Glob. Change Biol. 2011, 17, 2134–2144. [Google Scholar] [CrossRef]
  21. Swann, A.; Hoffman, F.; Koven, C.D.; Randerson, J.T. Plant responses to increasing CO2 reduce estimates of climate impacts on drought severity. Proc. Natl. Acad. Sci. USA 2016, 113, 10019–10024. [Google Scholar] [CrossRef]
  22. Li, J.; Carlson, B.E.; Yung, Y.L.; Lv, D.; Hansen, J.; Penner, J.E.; Liao, H.; Ramaswamy, V.; Kahn, R.A.; Zhang, P.; et al. Scattering and absorbing aerosols in the climate system. Nat. Rev. Earth Environ. 2022, 3, 363–379. [Google Scholar] [CrossRef]
  23. Rai, A.; Kulshreshtha, K.; Srivastava, P.K.; Mohanty, C.S. Leaf surface structure alterations due to particulate pollution in some common plants. Environmentalist 2010, 30, 18–23. [Google Scholar] [CrossRef]
  24. Bergin, M.H.; Greenwald, R.; Xu, J.; Berta, Y.; Chameides, W.L. Influence of aerosol dry deposition on photosynthetically active radiation available to plants: A case study in the Yangtze delta region of China. Geophys. Res. Lett. 2001, 28, 3605–3608. [Google Scholar] [CrossRef]
  25. Gu, L.; Baldocchi, D.; Verma, S.B.; Black, T.A.; Vesala, T.; Falge, E.M.; Dowty, P.R. Advantages of diffuse radiation for terrestrial ecosystem productivity. J. Geophys. Res. Atmos. 2002, 107, 4050. [Google Scholar] [CrossRef]
  26. Zeng, R.; Cai, X. Climatic and terrestrial storage control on evapotranspiration temporal variability: Analysis of river basins around the world. Geophys. Res. Lett. 2016, 43, 185–195. [Google Scholar] [CrossRef]
  27. Rigden, A.J.; Salvucci, G.D. Stomatal response to humidity and CO2 implicated in recent decline in US evaporation. Glob. Change Biol. 2016, 23, 1140–1151. [Google Scholar] [CrossRef] [PubMed]
  28. Martens, B.; Waegeman, W.; Dorigo, W.A.; Verhoest, N.E.C.; Miralles, D.G. Terrestrial evaporation response to modes of climate variability. NPJ Clim. Atmos. Sci. 2018, 1, 43. [Google Scholar] [CrossRef]
  29. Zhang, K.; Kimball, J.S.; Nemani, R.R.; Running, S.W.; Hong, Y.; Gourley, J.J.; Yu, Z. Vegetation Greening and Climate Change Promote Multidecadal Rises of Global Land Evapotranspiration. Sci. Rep. 2015, 5, 15956. [Google Scholar] [CrossRef]
  30. Guan, Y.; Gu, X.; Slater, L.J.; Li, X.; Li, J.; Wang, L.; Tang, X.; Kong, D.; Zhang, X. Human-induced intensification of terrestrial water cycle in dry regions of the globe. NPJ Clim. Atmos. Sci. 2024, 7, 45. [Google Scholar] [CrossRef]
  31. Leng, G.; Huang, M.; Tang, Q.; Sacks, W.J.; Lei, H.; Leung, L.Y.R. Modeling the effects of irrigation on land surface fluxes and states over the conterminous United States: Sensitivity to input data and model parameters. J. Geophys. Res. Atmos. 2013, 118, 9789–9803. [Google Scholar] [CrossRef]
  32. Sterling, S.M.; Ducharne, A.; Polcher, J. The impact of global land-cover change on the terrestrial water cycle. Nat. Clim. Change 2013, 3, 385–390. [Google Scholar] [CrossRef]
  33. Mao, J.; Fu, W.; Shi, X.; Ricciuto, D.M.; Fisher, J.B.; Dickinson, R.E.; Wei, Y.; Shem, W.; Piao, S.; Wang, K.; et al. Disentangling climatic and anthropogenic controls on global terrestrial evapotranspiration trends. Environ. Res. Lett. 2015, 10, 094008. [Google Scholar] [CrossRef]
  34. Liu, J.; Zhang, J.; Kong, D.; Feng, X.; Feng, S.; Xiao, M. Contributions of anthropogenic forcings to evapotranspiration changes over 1980–2020 using GLEAM and CMIP6 simulations. J. Geophys. Res. Atmos. 2021, 126, e2021JD035367. [Google Scholar] [CrossRef]
  35. Jung, M.; Reichstein, M.; Ciais, P.; Seneviratne, S.I.; Sheffield, J.; Goulden, M.L.; Bonan, G.; Cescatti, A.; Chen, J.; De Jeu, R.; et al. Recent decline in the global land evapotranspiration trend due to limited moisture supply. Nature 2010, 467, 951–954. [Google Scholar] [CrossRef] [PubMed]
  36. Miralles, D.G.; Van Den Berg, M.J.; Gash, J.H.; Parinussa, R.M.; De Jeu, R.A.; Beck, H.E.; Holmes, T.R.; Jiménez, C.; Verhoest, N.E.; Dorigo, W.A.; et al. El Niño–La Niña cycle and recent trends in continental evaporation. Nat. Clim. Change 2014, 4, 122–126. [Google Scholar] [CrossRef]
  37. Wang, B.; Sun, W.; Jin, C.; Luo, X.; Yang, Y.-M.; Li, T.; Xiang, B.; McPhaden, M.J.; Cane, M.A.; Jin, F.; et al. Understanding the recent increase in multiyear La Niñas. Nat. Clim. Change 2023, 13, 1075–1081. [Google Scholar] [CrossRef]
  38. Li, S.; Wang, G.; Sun, S.; Hagan, D.F.T.; Chen, T.; Dolman, H.; Liu, Y. Long-term changes in evapotranspiration over China and attribution to climatic drivers during 1980–2010. J. Hydrol. 2021, 595, 126037. [Google Scholar] [CrossRef]
  39. Martens, B.; Gonzalez Miralles, D.; Lievens, H.; Van Der Schalie, R.; De Jeu, R.A.M.; Fernández-Prieto, D.; Beck, H.E.; Dorigo, W.A.; Verhoest, N.E.C. GLEAM v3: Satellite-based land evaporation and root-zone soil moisture. Geosci. Model Dev. 2017, 10, 1903–1925. [Google Scholar] [CrossRef]
  40. Schellekens, J.; Dutra, E.; Martínez-de La Torre, A.; Balsamo, G.; Van Dijk, A.; Sperna Weiland, F.; Minvielle, M.; Calvet, J.C.; Decharme, B.; Eisner, S.; et al. A global water resources ensemble of hydrological models: The eartH2Observe Tier-1 dataset. Earth Syst. Sci. Data 2017, 9, 389–413. [Google Scholar] [CrossRef]
  41. Rodell, M.; Houser, P.R.; Jambor, U.E.; Gottschalck, J.; Mitchell, K.; Meng, C.J.; Arsenault, K.; Cosgrove, B.; Radakovich, J.; Bosilovich, M.; et al. The global land data assimilation system. Bull. Am. Meteorol. Soc. 2004, 85, 381–394. [Google Scholar] [CrossRef]
  42. Feng, Q.; Shen, J.; Yang, F.; Liang, S.; Liu, J.; Kuang, X.; Wang, D.; Zeng, Z. Long-term gridded land evapotranspiration reconstruction using Deep Forest with high generalizability. Sci. Data 2023, 10, 908. [Google Scholar] [CrossRef] [PubMed]
  43. Wang, G.J.; Gong, T.T.; Lu, J.; Lou, D.; Hagan, D.F.T.; Chen, T.X. On the long-term changes of drought over China (1948–2012) from different methods of PET estimations. Int. J. Climatol. 2018, 38, 2954–2966. [Google Scholar] [CrossRef]
  44. Harris, I.; Jones, P.D.; Osborn, T.J.; Lister, D.H. Updated high-resolution grids of monthly climatic observations: The CRU TS3.10 dataset. Int. J. Climatol. 2014, 34, 623–642. [Google Scholar] [CrossRef]
  45. Eyring, V.; Bony, S.; Meehl, G.A.; Senior, C.A.; Stevens, B.; Stouffer, R.J.; Taylor, K.E. Overview of the Coupled Model Intercomparison Project Phase 6 (CMIP6) experimental design and organization. Geosci. Model Dev. 2016, 9, 1937–1958. [Google Scholar] [CrossRef]
  46. Hoesly, R.M.; Smith, S.J.; Feng, L.; Klimont, Z.; Janssens-Maenhout, G.; Pitkanen, T.; Seibert, J.J.; Vu, L.; Andres, R.J.; Bolt, R.M.; et al. Historical (1750–2014) anthropogenic emissions of reactive gases and aerosols from the Community Emissions Data System (CEDS). Geosci. Model Dev. 2016, 11, 369–408. [Google Scholar] [CrossRef]
  47. Gillett, N.P.; Shiogama, H.; Funke, B.; Hegerl, G.; Knutti, R.; Matthes, K.; Santer, B.D.; Stone, D.; Tebaldi, C. The Detection and Attribution Model Intercomparison Project (DAMIP v1.0) contribution to CMIP6. Geosci. Model Dev. 2016, 9, 3685–3697. [Google Scholar] [CrossRef]
  48. Allen, R.G.; Pereira, L.S.; Raes, D.; Smith, M. Crop Evapotranspiration-Guidelines for Computing Crop Water Requirements-FAO Irrigation and Drainage Paper 56; FAO: Rome, Italy, 1998; Volume 300, p. D05109. [Google Scholar]
  49. Sun, S.; Chen, H.; Sun, G.; Ju, W.; Wang, G.; Li, X.; Hua, W. Attributing the changes in reference evapotranspiration in Southwestern China Using a new separation method. J. Hydrometeorol. 2017, 18, 777–798. [Google Scholar] [CrossRef]
  50. Huffman, G.J.; Adler, R.F.; Bolvin, D.T.; Gu, G. Improving the global precipitation record: GPCP version 2.1. Geophys. Res. Lett. 2009, 36, L17808. [Google Scholar] [CrossRef]
  51. Feng, T.; Su, T.; Ji, F.; Zhi, R.; Han, Z. Temporal characteristics of actual evapotranspiration over China under global warming. J. Geophys. Res. Atmos. 2018, 123, 5845–5858. [Google Scholar] [CrossRef]
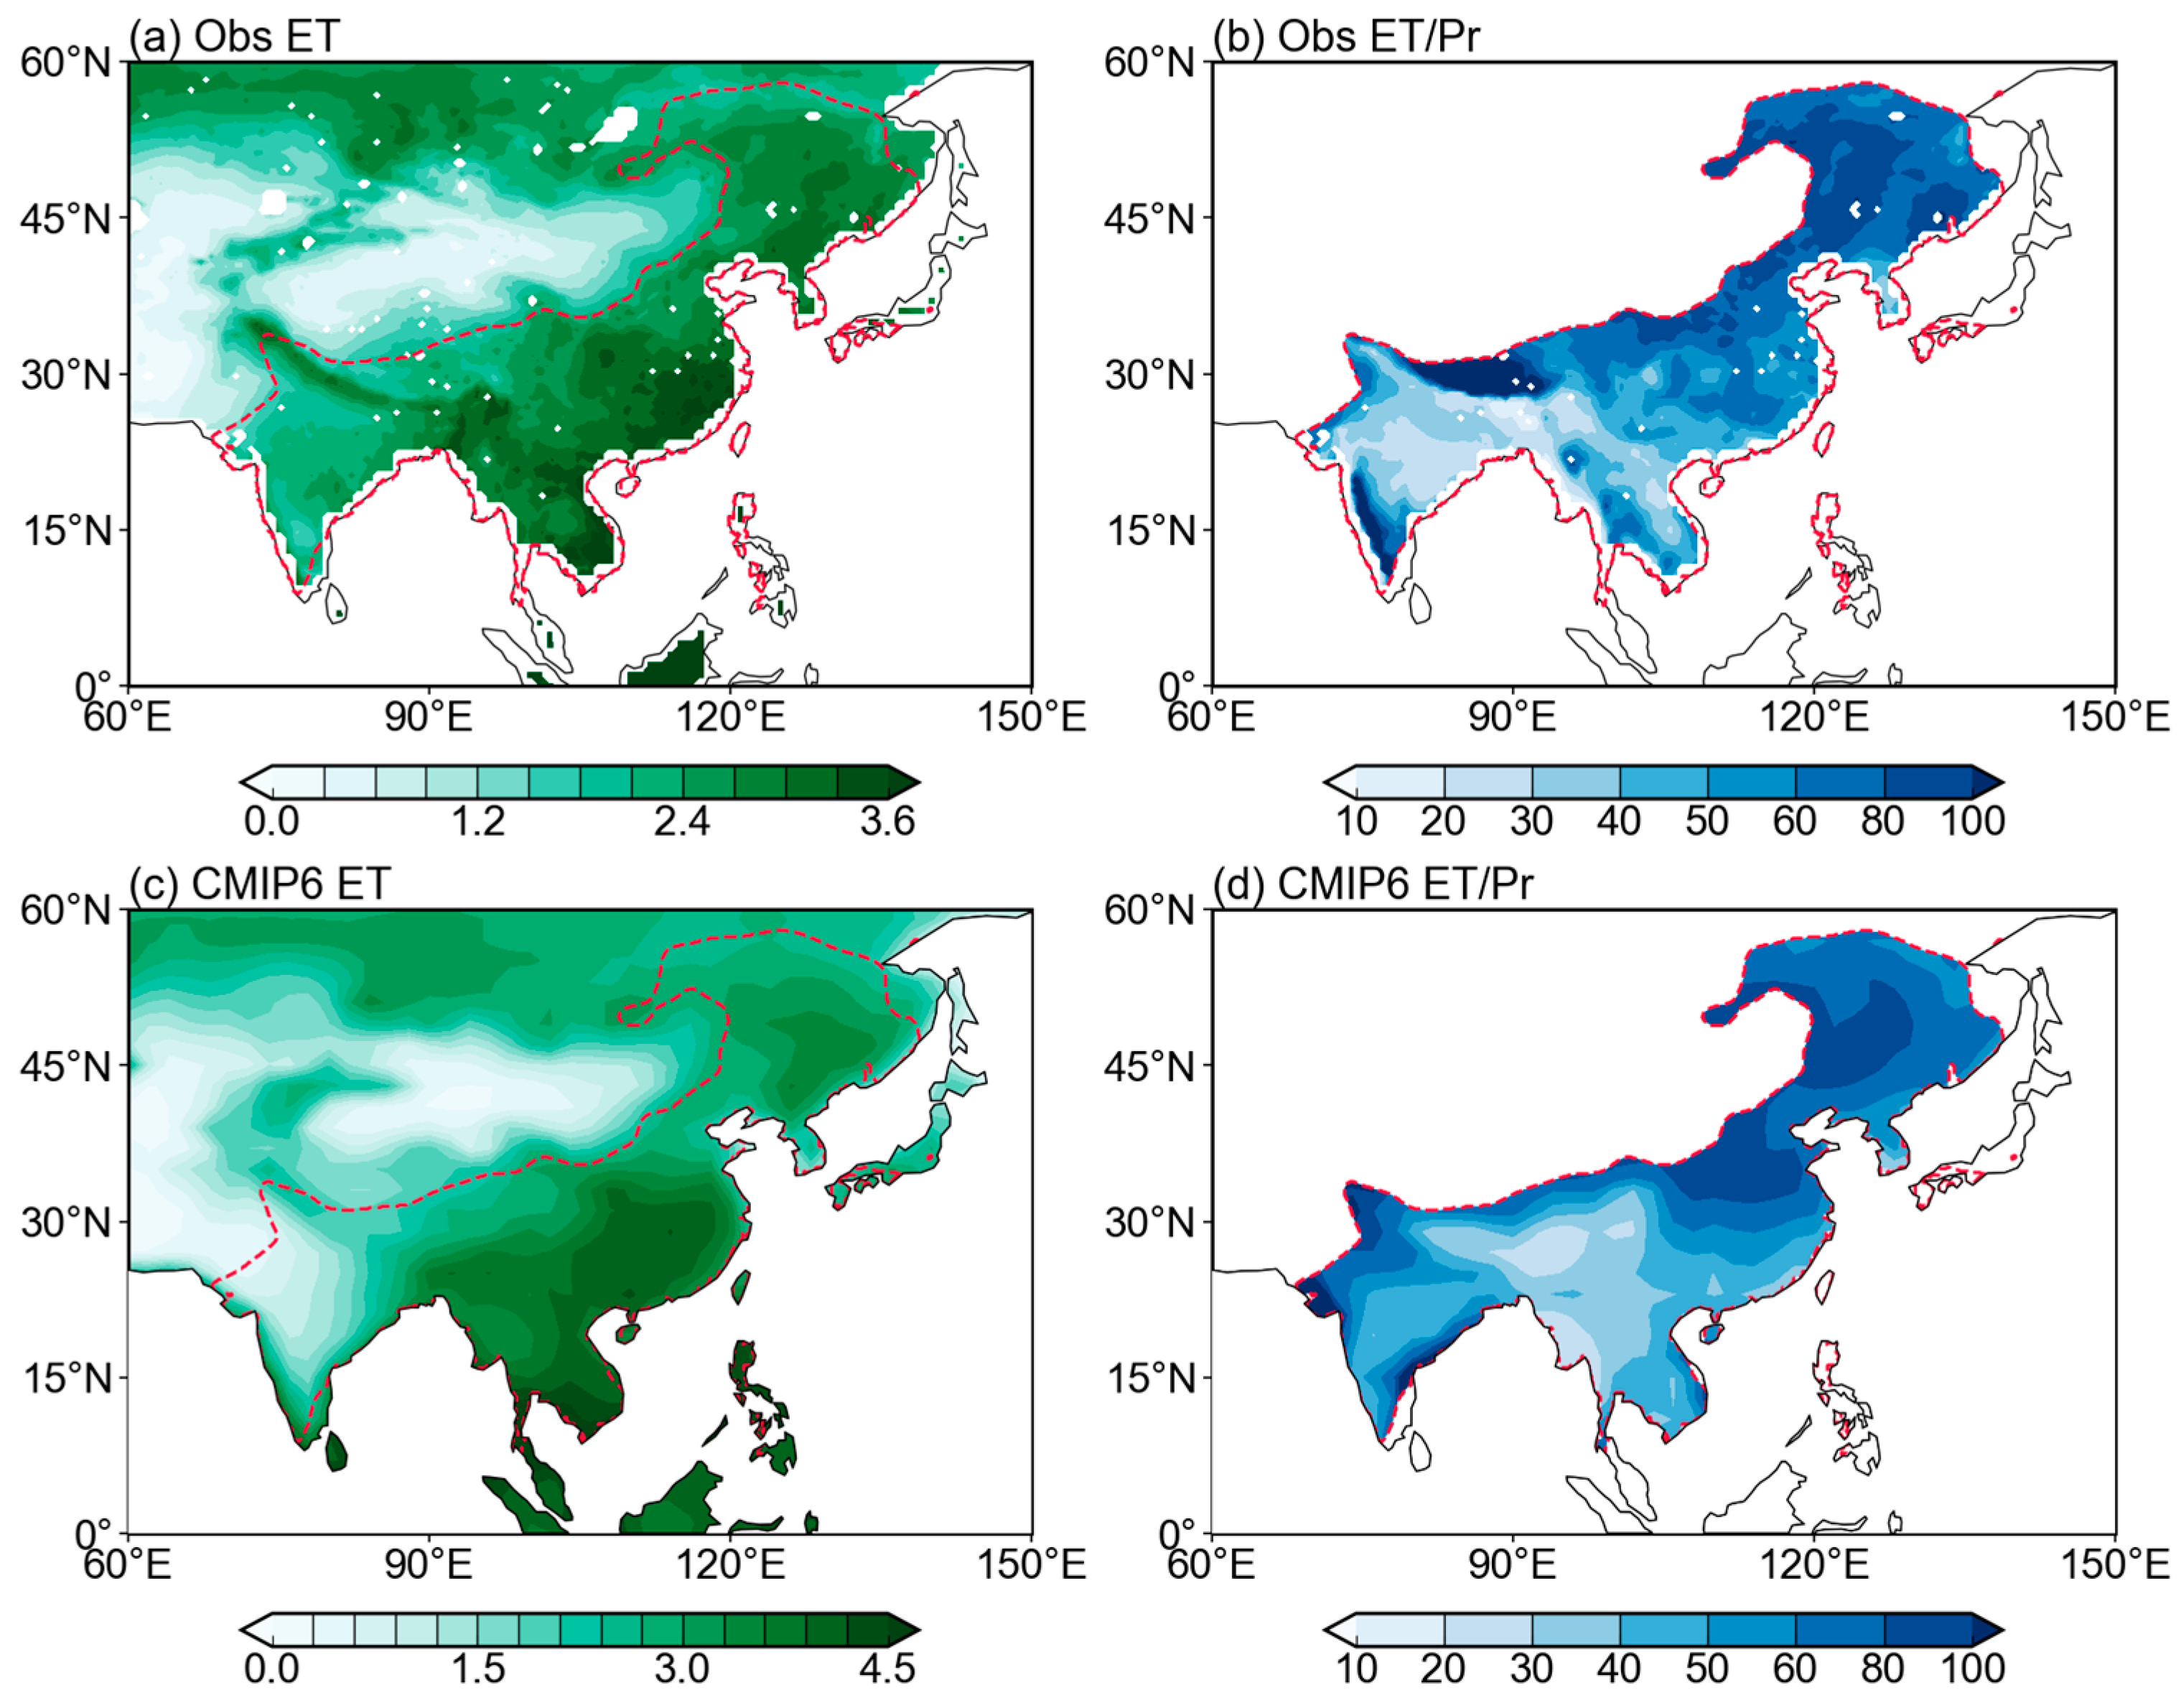
Figure 1. Climatological ET (mm d−1) from (a) observational data and (c) five CMIP6 model means. And the ratio of ET to precipitation (%) from (b) observation and (d) CMIP6 models. The observed precipitation is from the CRU dataset. The climatological ET and precipitation is defined as the mean of the JJA period of 1985–2014. The red dashed lines present the Asian monsoon region.
Remotesensing 16 02027 g001
Figure 2. Spatial distribution of the trends (mm d−1 cent−1) in ET from the (a) historical experiment, (b) hist-aer experiment, and (c) hist-GHG experiment. (d) The observed and simulated temporal evolution of areal-averaged ET (mm d−1) over the Asian monsoon region. Dots represent the linear trends, which are significant at a 95% confidence level.The red dashed lines present the Asian monsoon region.
Remotesensing 16 02027 g002
Figure 3. Trends in the (a) ET, (b) precipitation (mm d−1 cent−1), (c) net surface radiation (MJ m−2 d−1 cent−1), (d) 2 m surface temperature (K cent−1), (e) vapor pressure deficient (KPa cent−1), and (f) 2 m wind speed (m s−1 cent−1) from the historical experiment. The red dashed lines present the Asian monsoon region.
Remotesensing 16 02027 g003
Figure 4. Spatial distribution of the (a) ET trend (mm d−1 cent−1) and its contributions from (b) precipitation (mm d−1 cent−1), (c) net surface radiation (mm d−1 cent−1), (d) 2 m surface temperature (mm d−1 cent−1), (e) vapor pressure deficit(mm d−1 cent−1), and (f) 2 m wind speed (mm d−1 cent−1) from the historical experiment. The red dashed lines present the Asian monsoon region.
Remotesensing 16 02027 g004
Figure 5. Relative contribution of individual factors to ET trends (mm d−1 cent−1) in the historical (red bars), hist-aer (blue bars), and hist-GHG (green bars) experiments.
Remotesensing 16 02027 g005
Figure 6. Trends in the (a) ET, (b) precipitation (mm d−1 cent−1), (c) net surface radiation (MJ m−2 d−1 cent−1), (d) 2 m surface temperature (K cent−1), (e) vapor pressure deficit (VPD, KPa cent−1), and (f) 2 m wind speed (U, m s−1 cent−1) due to anthropogenic aerosols (from the hist-aer experiment). The red dashed lines present the Asian monsoon region.
Remotesensing 16 02027 g006
Figure 7. Spatial distribution of the (a) ET trend (mm d−1 cent−1) and its contributions from (b) precipitation (mm d−1 cent−1), (c) net surface radiation (mm d−1 cent−1), (d) 2 m surface temperature (mm d−1 cent−1), (e) vapor pressure deficit (mm d−1 cent−1), and (f) 2 m wind speed (mm d−1 cent−1) due to anthropogenic aerosols (from the hist-aer experiment). The red dashed lines present the Asian monsoon region.
Remotesensing 16 02027 g007
Figure 8. Trends in the (a) net surface longwave radiation (W m−2 cent−1), (b) net surface shortwave radiation (W m−2 cent−1), (c) downward shortwave radiation (W m−2 cent−1), and (d) aerosol optical depth (cent−1) due to anthropogenic aerosols (from the hist-aer experiment). The red dashed lines present the Asian monsoon region.
Remotesensing 16 02027 g008
Figure 9. Trends in the (a) ET, (b) precipitation (mm d−1 cent−1), (c) net surface radiation (MJ m−2 d−1 cent−1), (d) 2 m surface temperature (K cent−1), (e) vapor pressure deficit (VPD, KPa cent−1), and (f) 2 m wind speed (U, m s−1 cent−1) due to GHGs (from the hist-GHG experiment). The red dashed lines present the Asian monsoon region.
Remotesensing 16 02027 g009
Figure 10. Spatial distribution of the (a) ET trend (mm d−1 cent−1) and its contributions from (b) precipitation (mm d−1 cent−1), (c) net surface radiation (mm d−1 cent−1), (d) 2 m surface temperature (mm d−1 cent−1), (e) vapor pressure deficit (mm d−1 cent−1), and (f) 2 m wind speed (mm d−1 cent−1) from the hist-GHG experiment. The red dashed lines present the Asian monsoon region.
Remotesensing 16 02027 g010
Figure 11. Trends in the (a) vertical integrated atmospheric moisture (k kg−1 cent−1) and (b) vertical pressure velocity at 500 hPa (Pa s−1 cent−1) from the hist-GHG experiment. The red dashed lines present the Asian monsoon region.
Remotesensing 16 02027 g011
Table 1. CMIP6 models used in this study and the trends (mm d−1 cent−1) in ET from individual models. The first five models are used to quantify the relative importance of the individual climate factors.
ModelsHist./15 hist. Modelshist-aerhist-GHG
ACCESS-CM20.025−0.320.20
ACCESS-ESM1-5−0.40−0.440.14
CanESM5−0.29−0.460.33
IPSL-CM6A-LR−0.19−0.280.10
MRI-ESM2-0−0.56−0.440.22
BCC-CSM2-MR−0.060−0.300.18
CESM2−0.065−0.280.11
CNRM-CM6-1−0.15−0.230.05
E3SM-2-0−0.25−0.440.21
FGOALS-g30.010−0.0470.26
GFDL-ESM4−0.57−0.600.17
GISS-E2-1-G0.023−0.340.18
HadGEM3-GC31-LL−0.11−0.510.17
MIROC6−0.16−0.330.10
NorESM2-LM0.047−0.340.14
AWI-CM-1-1-MR−0.30
CAMS-CSM1-0−0.060
CAS-ESM2-0−0.20
CESM2-WACCM−0.17
CMCC-ESM20.038
EC-Earth3−0.003
EC-Earth3-Veg−0.014
EC-Earth3-Veg-LR−0.045
FGOALS-f3-L−0.016
FIO-ESM-2-0−0.13
INM-CM4-8−0.087
INM-CM5-0−0.027
MPI-ESM1-2-HR−0.28
MPI-ESM1-2-LR−0.29
NESM3−0.42
NorESM2-MM−0.057
TaiESM1−0.32
MME−0.17/−0.16−0.360.17
Disclaimer/Publisher’s Note: The statements, opinions and data contained in all publications are solely those of the individual author(s) and contributor(s) and not of MDPI and/or the editor(s). MDPI and/or the editor(s) disclaim responsibility for any injury to people or property resulting from any ideas, methods, instructions or products referred to in the content.