Article

Early Detection of Rice Sheath Blight Using Hyperspectral Remote Sensing

1
School of Remote Sensing & Geomatics Engineering, Nanjing University of Information Science & Technology, Nanjing 210044, China
2
Technology Innovation Center of Integration Applications in Remote Sensing and Navigation, Ministry of Natural Resources, Nanjing 210044, China
3
Jiangsu Engineering Center for Collaborative Navigation/Positioning and Smart Applications, Nanjing 210044, China
4
Jiangsu Hilly Region Zhenjiang Agricultural Science Research Institute, Zhenjiang 212400, China
5
College of Artificial Intelligence, Hangzhou Dianzi University, Hangzhou 310018, China
*
Author to whom correspondence should be addressed.
Remote Sens. 2024, 16(12), 2047; https://doi.org/10.3390/rs16122047
Submission received: 3 May 2024 / Revised: 31 May 2024 / Accepted: 4 June 2024 / Published: 7 June 2024
(This article belongs to the Section Remote Sensing in Agriculture and Vegetation)

Abstract

:
Sheath blight (ShB) is one of the three major diseases in rice and is prevalent worldwide. Lesions spread vertically from leaf sheaths near the water surface towards the upper parts. This increases the need to develop an approach for the early detection of infection. Hyperspectral remote sensing has been proven to be a potential technology for the early detection of diseases but remains challenging due to redundant information and weak spectral signals. This study proposed a stepwise screening method of spectral features for the early detection of ShB using rice canopy hyperspectral data over two years of successive experiments. The procedure consists of the selection of key wavebands using three algorithms and a further filtration of key wavelengths and vegetation indices considering feature importance, separability, and high correlation. Sheath-blight infection can disrupt the canopy architecture and influence the biochemical parameters in rice plants. The study reported that obvious variations in the chlorophyll content and LAI of rice plants occurred under early stress of ShB, and the sensitive features selected had strong correlations with these two growth factors. By fusing support vector machine with the optimal features, the detection model for early ShB exhibited an overall accuracy of 87%, showing higher accuracy at the current level of early-stage detection of rice ShB at the field scale. The proposed method not only provides methodological support for early detecting rice ShB but also serves as a reference for diagnosing other stalk diseases in crops.

1. Introduction

Rice, as one of the world’s major staple crops, boasts a long history of cultivation, with a significant presence in our lives [1]. However, the prevalence of rice-sheath blight (ShB) has had a profound impact on rice yields and quality, leading to a yield loss of up to 45% [2,3]. Rice-sheath blight is a fungal disease caused by the causative agent of Rhizoctonia solani. The pathogen Rhizoctonia solani Kunh AG1-IA (anamorph) and Thanatephorus cucumeris (Frank) Donk (teleomorph) is a soil-dwelling saprotroph and facultative parasite. The pathogen primarily reproduces through the fragmentation of its mycelium, which can persist in the soil for several years in the form of sclerotia, with over 30% of which remaining viable even in rice fields subjected to prolonged flooding. Upon coming into contact with a host plant, the fungus initiates the growth of a new mycelium [4]. The initial onset of sheath blight occurs in the lower part of the plant, the typical symptom of which is water-soaked lesions with brown margins that appear on the stalks and leaf sheaths and do not reach the functional stems and leaves of the rice plant. Delayed disease management can increase the pathogen population, providing favorable conditions for the later spread and development of ShB, significantly complicating disease control [5,6]. Therefore, early diagnosis of rice-sheath blight is particularly crucial before the development of the disease to the functional stems and leaves, enabling targeted pesticide application and holding significant importance for both farmers and the advancement of smart agriculture.
Remote-sensing technology is currently a method that can rapidly and extensively acquire spatially continuous surface information, making it of great research value for monitoring crop diseases and pests [7]. In early research on the remote-sensing detection of rice sheath blight, the focus was primarily on image-based detection. This involved using cameras, mobile phones, or other imaging devices to capture close-range RGB images of rice plants affected by ShB [8,9,10,11]. Detection methods that rely on RGB images are suitable for phenotype research but not for a portable diagnosis of ShB in the complicated field [12,13,14,15,16]. In comparison, hyperspectral remote sensing has the potential to finely contrast the spectral differences in specific parts of plants. It is highly advantageous for extracting spectral characteristics under various stress levels and band selection, making it beneficial for early and precise disease detection. Researchers have conducted preliminary studies using hyperspectral remote sensing to investigate rice leaves or stem sections affected by varying degrees of rice sheath blight [17,18,19,20]. When rice plants are subjected to the stress of ShB, their internal composition, morphological parameters, and physiological indicators will change [21]. The total chlorophyll content in leaves infected by ShB declines over healthy leaves, and pathogenesis-related proteins and defense-enzyme activities can obviously change in plants infected with Rhizoctonia solani [22]. Zhu et al. [21] highlighted the significant importance of hyperspectral remote sensing in conjunction with rice physiological and chemical parameters for early detection of ShB. This approach holds great potential for early disease prevention and increasing rice yields. However, it should be noted that the research was limited to indoor studies and focused on leaf sections, which may not fully represent the natural development of rice sheath blight.
The study focuses on non-destructively, quickly, and accurately recognizing early sheath blight in rice in the field by hyperspectral technology. The main objectives are (1) to screen out the spectral characteristics sensitive to ShB at early stages by combining spectral wavebands and vegetation indices; (2) to analyze the relationship between sensitive features and rice growth parameters affected by early ShB; (3) to determine the optimal detective model of early sheath blight in rice and evaluate the detective ability of the model under various varieties of rice; and (4) to validate the applicability of the detection model for other rice diseases.

2. Materials and Methods

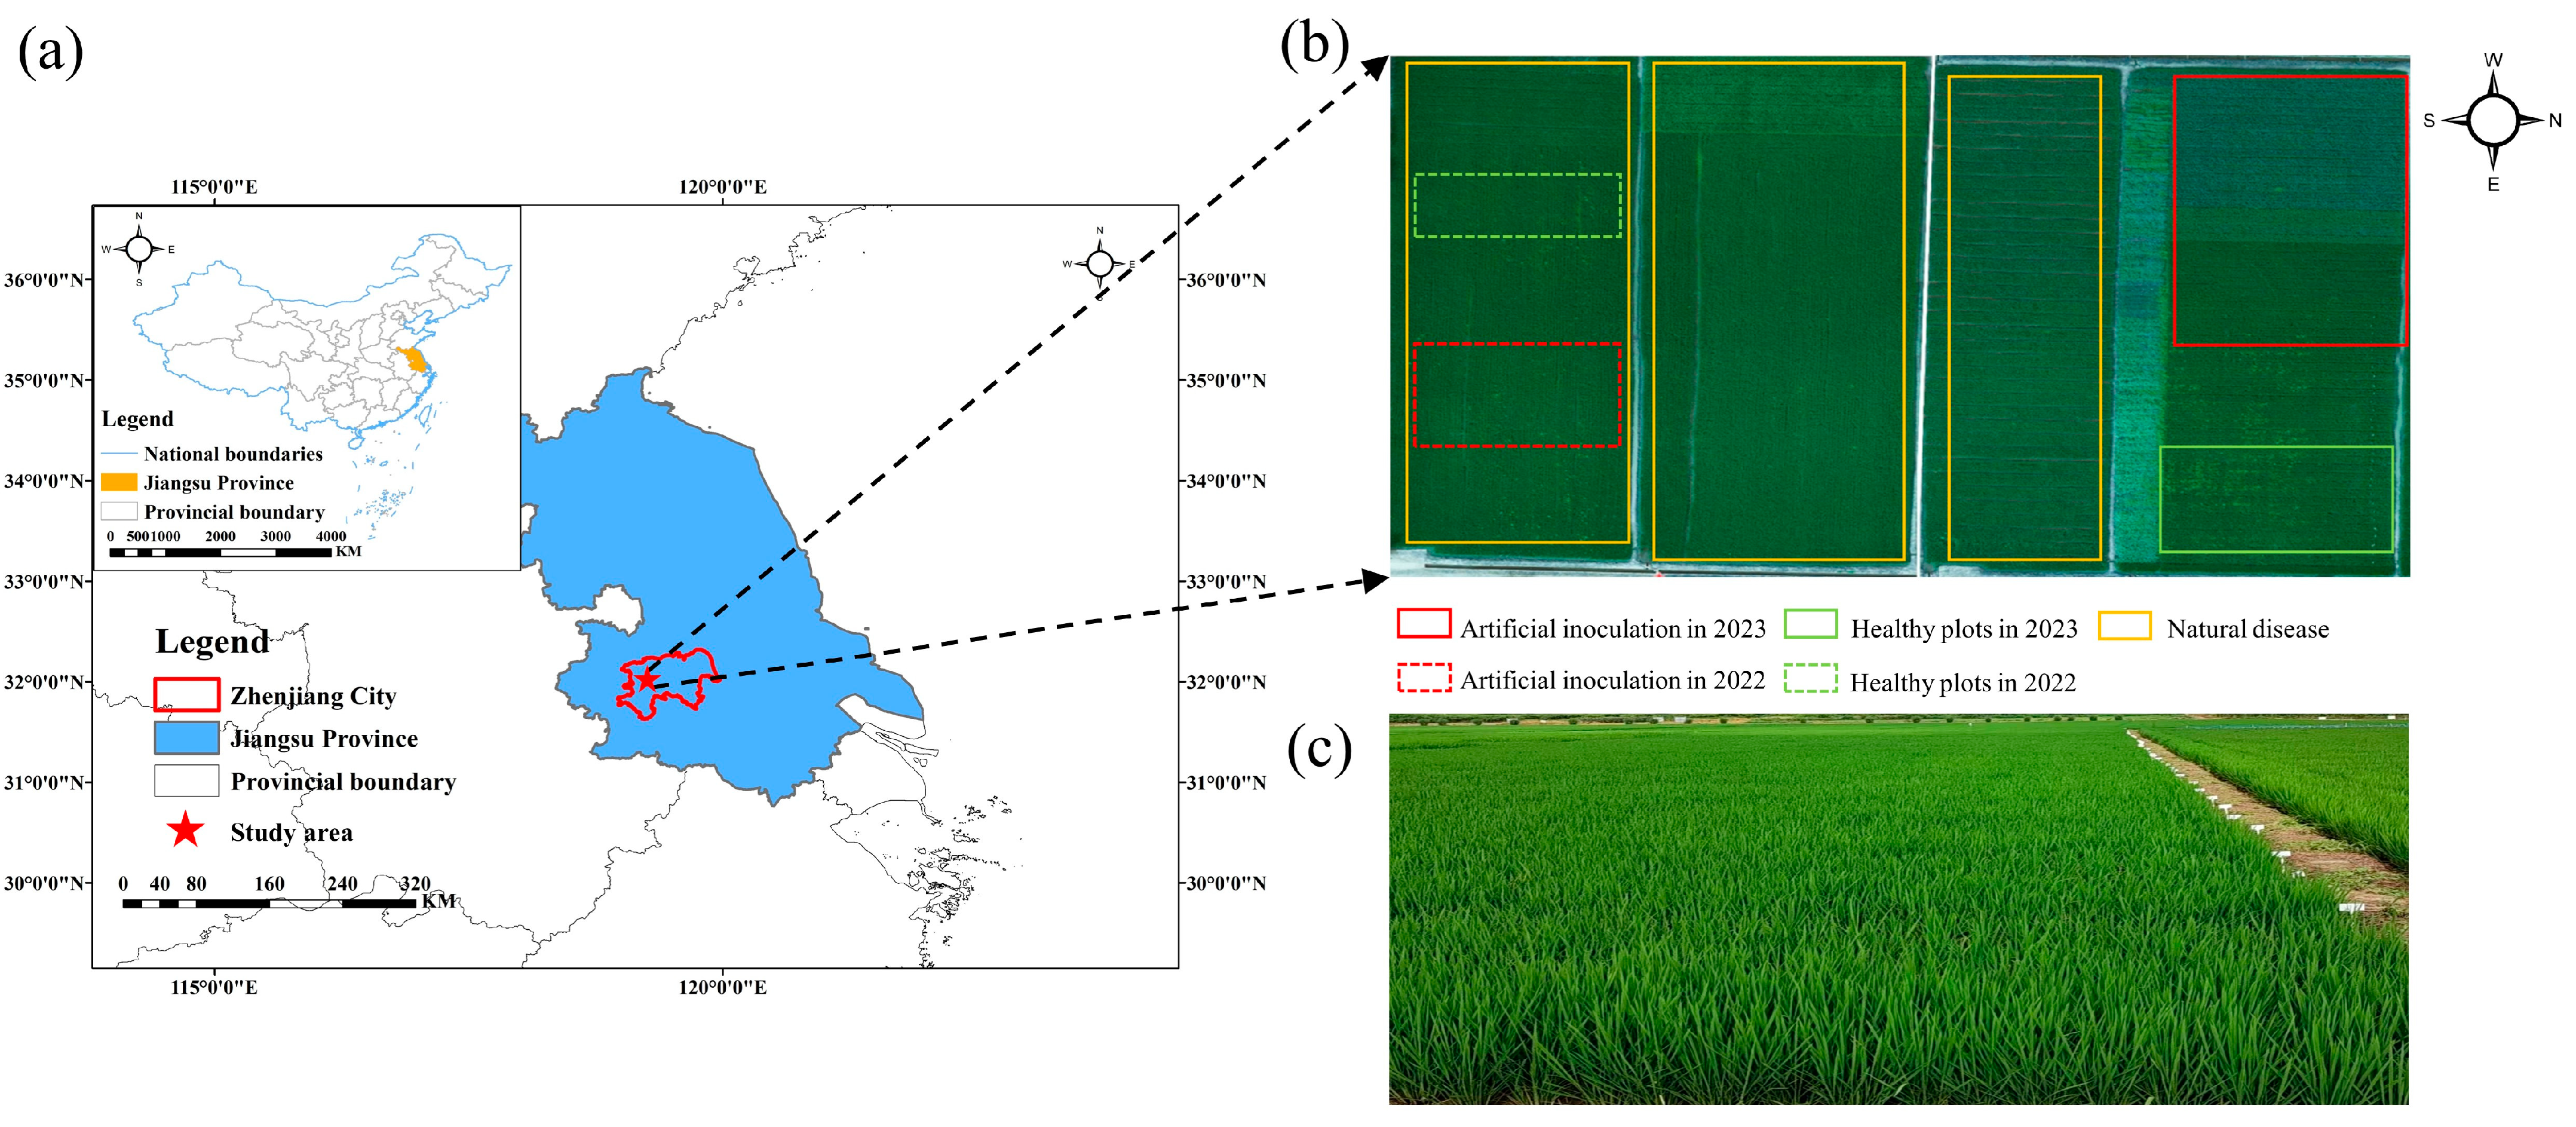
2.1. Experiment Design

The field experiment was carried out at the Jiangsu (Zhenjiang) Modern Agriculture (Rice and Wheat) Technology Comprehensive Demonstration Base (31°58′5.27″N, 119°17′47.23″E), Baitu Town, Zhenjiang City, Jiangsu Province. Two years of successive experiments were performed to obtain effective and adequate canopy data of rice ShB in the early stages (Figure 1 and Table 1).
Experiment 1 was performed during May and November, 2022. This trial test was only carried out in one piece of field by artificially inoculating based on one rice cultivar. The local main cultivar, Wuyunjing24, is susceptible to ShB. The artificial control area had 21 plots, of which 5 plots were artificially inoculated (red dashed box in Figure 1b), 3 plots were control-check sprayed with the pesticide agent for preventing sheath blight (green dashed box in Figure 1b), and 13 plots were naturally infected (plots between green and red dashed boxes in Figure 1b). The size of each plot was 23 × 1.5 m2, with a plot-to-plot distance of 30 cm and a row-to-row distance of 20 cm. In each plot, 153 hills were planted, with 6 hills/row, and the central 2 hills for 5 plots were inoculated with the inoculum of Thanatephorus cucumeris (Frank) Donk. With thin matchsticks with a length of 1.0 cm and a width of 2 mm, the fungus grew profusely on a potato dextrose medium for 3 to 4 days incubated at 26 °C in the dark. The woody matchsticks colonized by the ShB fungus were used as the inoculum and inserted into the leaf sheaths of rice plants at the tillering stage [23]. The ShB rapidly spread to nearby rice plants when a plant was successfully infected by this pathogen inoculation under the favorite weather conditions. In the contrast plots, the prevention and control of rice sheath blight were carried out by spraying a 240 g/L thiophanate-methyl SC (suspension concentrate) pesticide. Other standard practices for fertilization, irrigation, and pest management were maintained according to local regulations throughout the rice growth period.
To enhance the diversity of the samples, experiment 2 was performed with multiple rice cultivars and fields, from May to November, 2023. The experiment included an artificially inoculated field and three naturally diseased fields (yellow boxes in Figure 1b). The artificially inoculated field was not the one in 2022, which became the naturally diseased one due to the residual pathogen of ShB. The artificial control area had 38 plots, of which 5 plots were artificially inoculated (red solid box in Figure 1b), and 5 plots were control-check sprayed with the pesticide agent for preventing sheath blight (green solid box in Figure 1b), and 28 plots were naturally infected, with 23 × 1.2 m2 of each plot. In addition, the naturally diseased areas involved more varieties to construct models with robustness, including Huruan1212 and Yongyou1245. In addition, the study collected 10 samples of rice leaf blast and 15 samples of the interactive disease of leaf blast and sheath blight to validate the applicability of the detection model.

2.2. Data Acquisition

2.2.1. Collection of Canopy Spectra

All rice canopy spectra were obtained 5–7 days after inoculation using a FieldSpec 3 full-range portable spectroradiometer (Analytical Spectral Devices ASD, Boulder, CO, USA) during tillering peak and jointing stages. The spectrometer has a field of view of 25° and records the spectral reflectance in the 350 to 2500 nm range at sampling intervals of 1.4 nm in the 350–1050 nm range and 2 nm in the 1000–2500 nm, providing data after resampling at the 1 nm interval. The determinations in each case were conducted on clear or lightly cloudy days with minimal wind or light wind conditions from 10:00 a.m. and 2:00 p.m. The sensor was operated vertically 100 cm above the canopy to collect effective information on the rice canopy maximally and avoid the influence of background noise on spectral reflectance. Ten readings were taken at each point, the average value of which was taken as the final measurement value. Before measuring the canopy reflectance, a BaSO4 calibration plate was used to estimate incident radiation and reflectance.

2.2.2. Measurement of LAI and the Chlorophyll Content

The leaf area index (LAI) and the chlorophyll content, relevant for rice growth, were acquired at two growth stages each year for analyzing their response to ShB at the early stage. The leaf area index was measured using the plant canopy analyzer LAI-2200 (LI-COR, Inc., Lincoln, NE, USA). The instrument has an attachment, a cap with an opening angle of 90° for avoiding direct sunlight within the LAI-2200 sensor and minimizing the effects of the illumination and background conditions [24]. The LAI value at each survey point was taken from one above-canopy and four below-canopy radiation measurements. It is generally observed either in the early morning or late afternoon to ensure diffuse lighting conditions.
A chlorophyll meter [SPAD-502, Soil-Plant Analysis Development (SPAD) Section, Minolta Camera Co., Osaka, Japan] is a widely used device for estimating chlorophyll concentration. SPAD chlorophyll meter readings have been shown to be strongly associated with extracted chlorophyll from plants. Measurements were collected on the 6 topmost fully expanded leaves on each hill, taking three readings from three parts of each leaf. The average of these measurements is the SPAD value for the point. The following formula was further used to convert all SPAD values into the chlorophyll content (Cab)( μ g · cm−2) [25].
C a b = 6.34299 × exp S P A D × 0.04379 6.10629

2.2.3. Survey of the Disease

This study on rice ShB primarily concentrates on the qualitative differentiation of healthy and early-infected individuals. The investigation of rice disease severity was carried out based on the “Rules for evaluation of rice for resistance to sheath blight” (Chinese Standard: NY/T 2720-2015, [26]) of the Ministry of Agriculture to evaluate rice infection (Table 2). The functional leaves (the top-most three leaves from the top of a plant) have a significant impact on grain filling, fruiting, and yield. Therefore, based on the criterion of whether the lesions extend to the inverted 3-leaf or above sheaths or corresponding leaves, all samples are classified into two classes by manual recordings of the position and number of infected leaves and leaf sheaths at each hill: 0 level (healthy class) and 1–3 levels (early-infected class).

2.3. Methodology

2.3.1. The Study Framework

Figure 2 shows the analytical workflow of this study, which consists of four main steps. First, the original spectral data were pre-processed to reduce illumination and year differences. Second, to determine optimal spectral characteristics for the discrimination of early-stage sheath blight, the screening process of features was key waveband selection and further filtration combined with vegetation indices. Three different algorithms, namely the competitive adaptive reweighted sampling (CARS), successive projections algorithm (SPA), and principal component analysis (PCA), were adopted to reduce the dimension of hyperspectral data, and different sensitive band sets were obtained. Further screening of these characteristic wavelengths and vegetation indices selected were followed to reduce the high redundancy between features by the progressive approach. The process referred to the recursive elimination of features by the recursive feature elimination method in the random forest (RF-RFE), sorting of the features obtained above by the Jeffries-Matusita (JM) distance and, then, the removal of features with high correlations using the Pearson correlation coefficient in the correlation analysis (CA). Based on sensitive features, the early-detection models were constructed using three algorithms, including random forest (RF), support vector machine (SVM), and linear discriminant analysis (LDA). Finally, the optimal model for detecting early ShB was determined and validated by evaluation metrics and under other diseases.

2.3.2. Preprocessing of Original Spectral Data

Due to significant noise caused by water-vapor absorption bands in the spectral range of 1320 to 1500 nm and 1770 to 2020 nm, this study only utilized spectral data from the spectral ranges of 400 to 1319 nm, 1501 to 1769 nm, and 2021 to 2337 nm. Spectral preprocessing is necessary to reduce issues, such as scattering and noise [27]. To suppress the differences in spectral curves caused by varying lighting conditions on the same day, a transformation was applied to all spectra by dividing them by the average reflectance of the spectral curve [28]. Additionally, a spectral ratio curve was used to adjust the 2023 data to match the 2022 data to reduce the spectral differences between different years. This ratio curve was obtained by dividing the average canopy spectral curve of healthy rice in 2022 by the average canopy spectral curve of healthy rice in 2023. The canopy spectral data collected in 2023 were divided by this ratio curve to generate a set of spectral curves that eliminate year-to-year differences [29].

2.3.3. Vegetation Indices Selected for Early Detection of Rice ShB

Some published spectral indices, related to pigment content, physiological variation, photosynthetic activity, and stress state, were used to sufficiently obtain ShB information. Table 3 summarizes the descriptions and reference sources of these indices. These narrow-band indices were selected to capture various aspects of the host plant from surface morphology and internal structure.

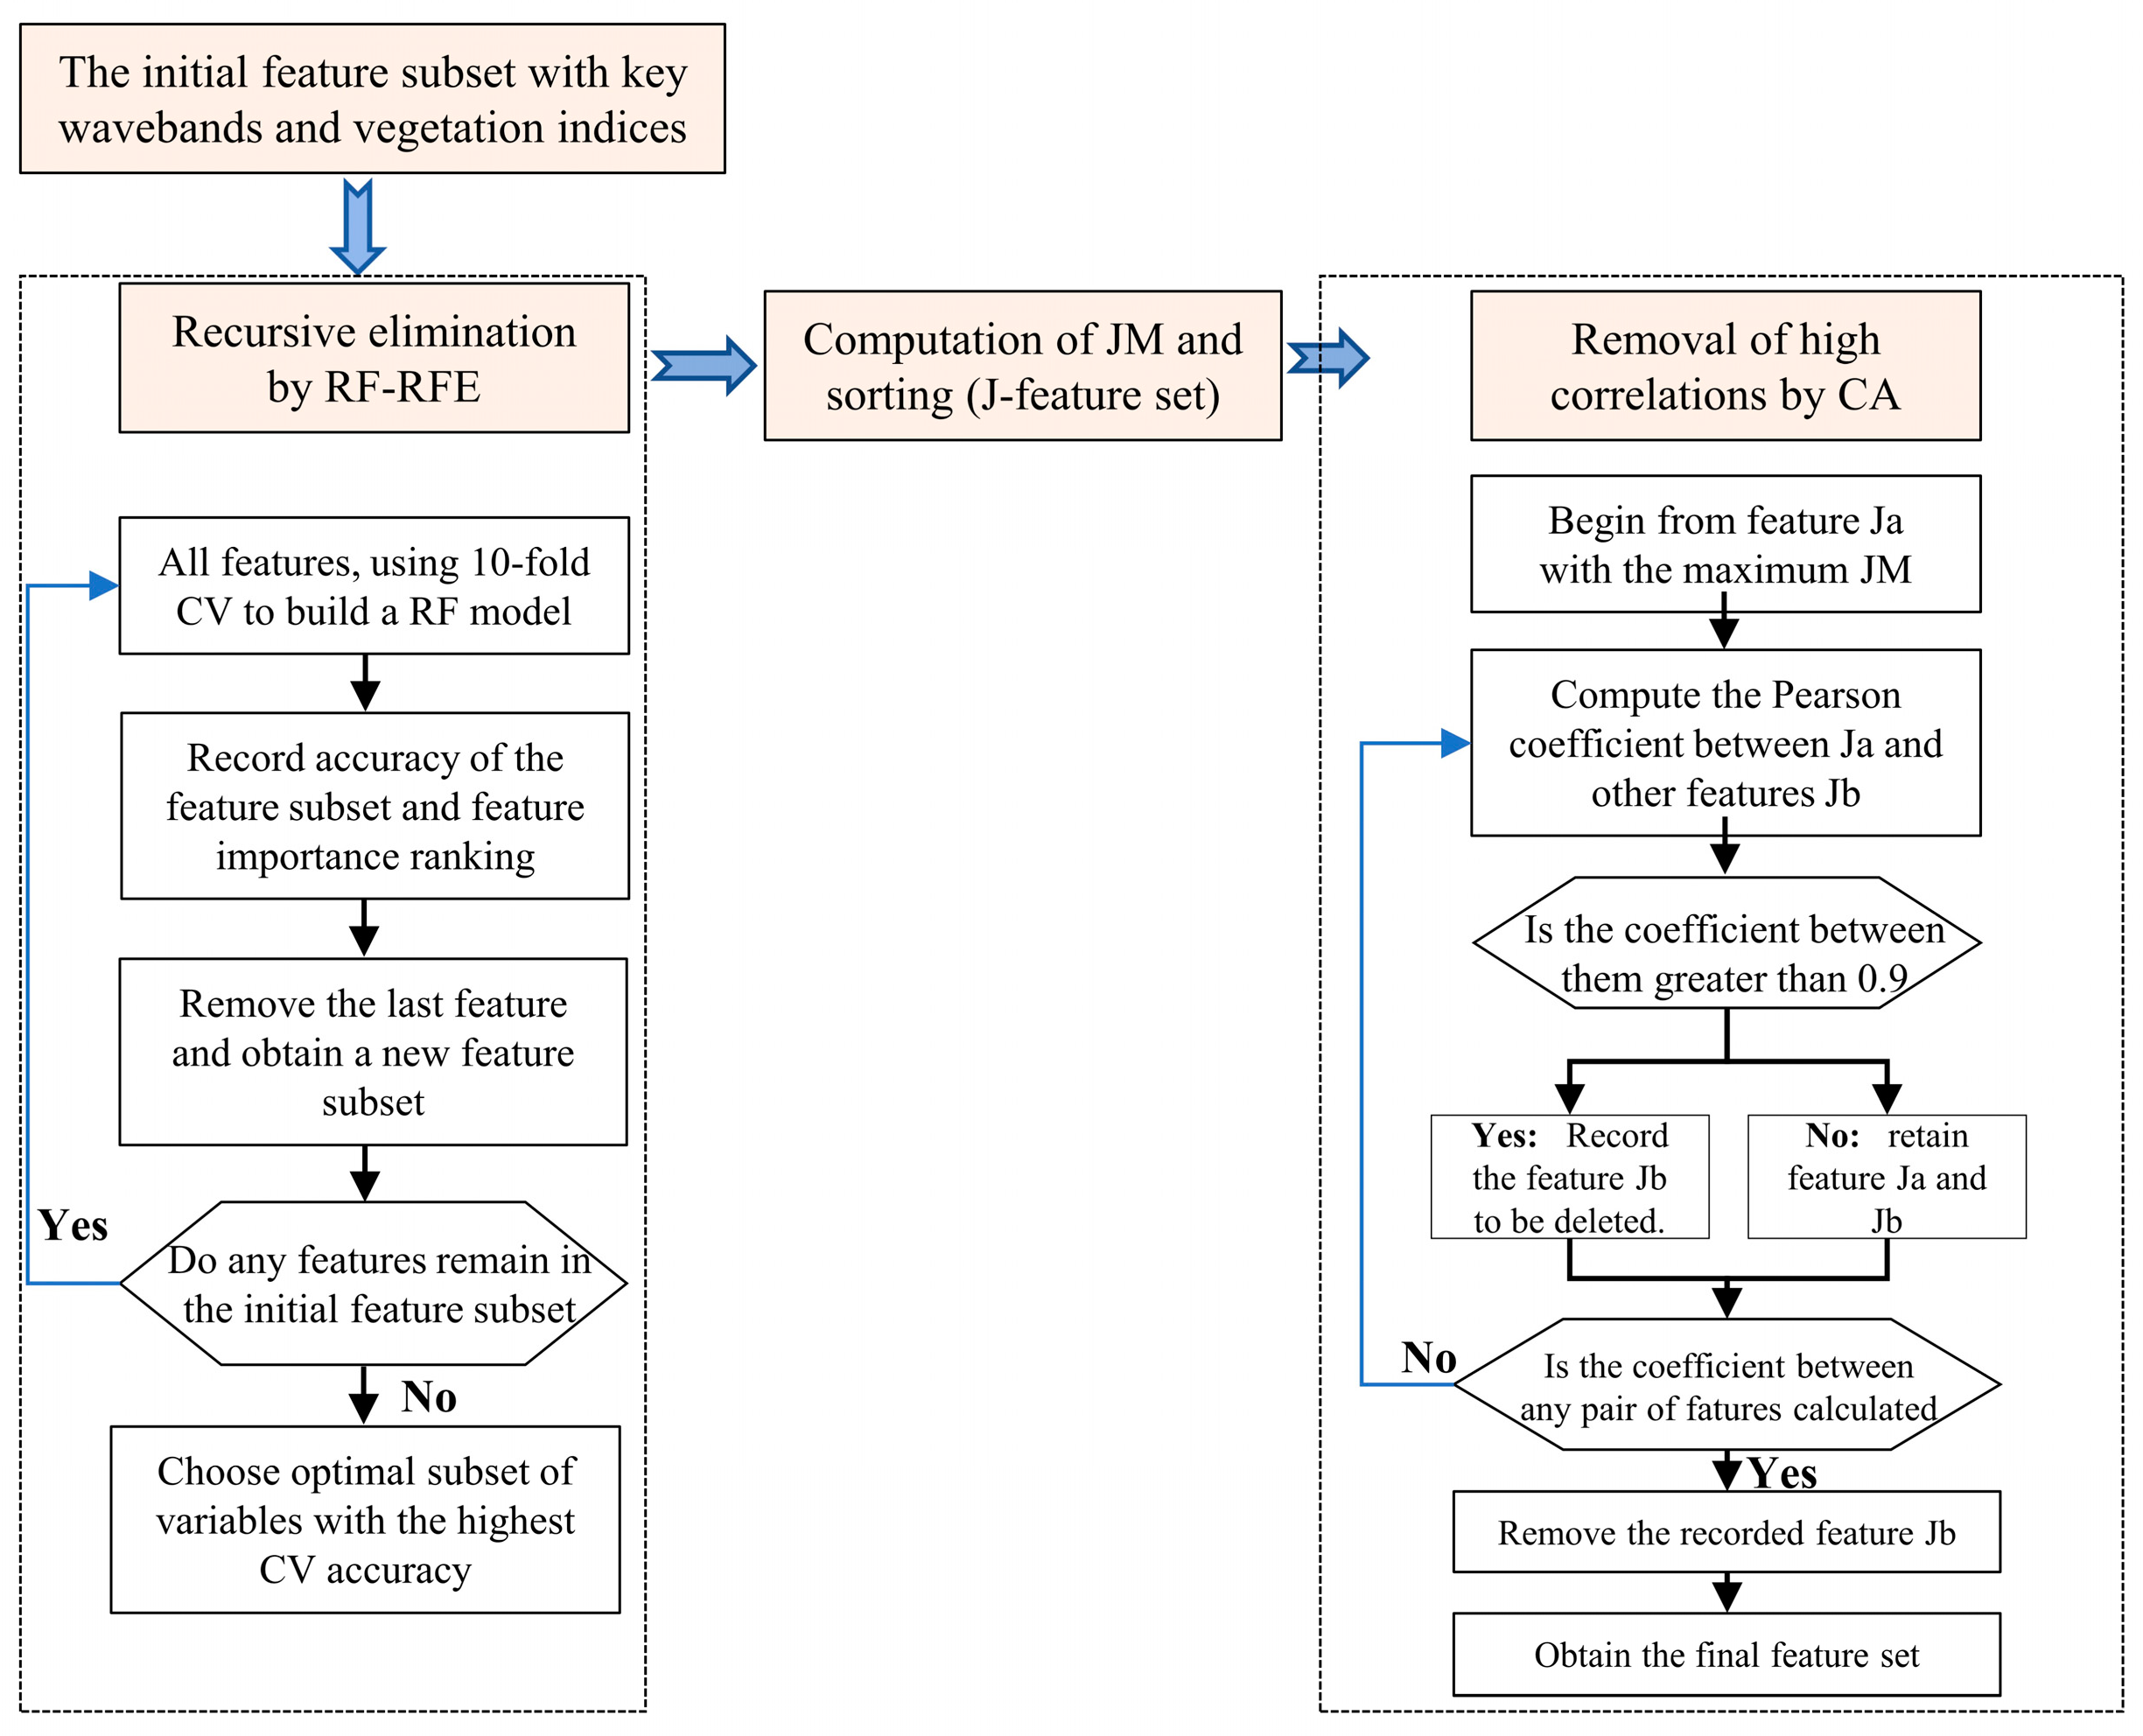
2.3.4. The Screening Strategy of Spectral Characteristics for the Early Detection of ShB

To effectively extract spectral features relevant to the discrimination of sheath blight, the study proposed a stepwise approach with two sequential parts for exploring the spectral characteristics of early ShB. The first part refers to the selection of a key wavelength set based on three methods. The second part is followed by the filtering of all features with a sensitive waveband set and vegetation indices set through a progressive process.
  • Algorithms of the dimensionality reduction in wavebands;
Three different methods were adopted to maximize the acquisition of key wavelength information related to sheath blight, which are CARS, SPA, and PCA. CARS is a variable screening method for regression proposed by [50] and is commonly used in the dimensionality reduction of hyperspectral data. It selects an optimal combination of key wavelengths of multi-component spectral data by employing the principle of ‘survival of the fittest’. The process is conducted by building N partial least squares (PLS) models using randomly selected samples in N sampling runs. However, the purpose of the study was the early identification of rice ShB. Therefore, the partial least squares regression in this algorithm had been replaced with a partial least squares discriminant analysis (PLS-DA), while other parts of the algorithm remained the same. Finally, key wavelengths are obtained in a PLS model with the highest recognition accuracy. In each sampling run, the Monte Carlo strategy is used for model sampling, and a two-step procedure is developed for wavelength selection. The procedure is the core part of CARS for wavelength reduction, including an exponentially decreasing function (EDF) and adaptive reweighted sampling (ARS). After N sampling runs, CARS obtains the N subsets of variables and the corresponding N recognition accuracy values.
The successive projections algorithm (SPA) is a forward variable selection algorithm for minimizing collinearity in vector space [51]. The specific computational process is outlined as follows.
When N = 1, select any one spectral column vector, where j(j = G(0)), and assign it to X, denoted as XG(0).
  • The set of wavelengths not selected is denoted as M;
    M = j , 1 G , j G 0 , , G n 1
  • Then, compute the projection vectors of the remaining column vectors;
      P x j = x j x j T X G n 1 x G n 1 x G n 1 T x G n 1 1 , j M
The index with the maximum projection is denoted as G ( n ) = a r g ( m a x | | P x j | | ) , where j ϵ M. If n = n + 1 and z < N , continue looping to calculate, where x j = P x j , j M .
In addition to CARS and SPA, PCA [52,53] was also compared with the others. Principal component analysis (PCA) is a widely used statistical method in multivariate data analysis. It aims to reveal the underlying structure and patterns of the data using as few independent principal components as possible. These independent principal components constitute linear combinations of the original variables, not only retaining as much information as possible from the original data but also ensuring mutual independence among the principal components.
  • Further optimal methods of key wavelengths and various vegetation indices.
Due to the still-remaining high redundancy between the features, the further scheme was designed to optimize these characteristics of key wavelengths and various vegetation indices (Figure 3). These features were input into the classifier of the random forest as the initial feature subset, of which the accuracy and the importance were obtained by the 10-fold cross verification. Then, all the features were recursively eliminated to form a new feature subset by removing the least-important feature, which was used to construct the RF model with a corresponding accuracy until the initial feature subset was empty. Finally, the feature subset with the highest accuracy was chosen and regarded as the input of CA. Before the variables obtained by RF-RFE were removed from high correlations by CA, the JM distances of these features between the healthy and diseased samples were computed, and all features were sorted by the values of JM distances from high to low, named the J-feature set. The process of CA is shown in Figure 3. (1) Calculate the Pearson coefficient between feature Ja with the maximum JM and other features Jb in the J-feature set. (2) If the correlation between two features is greater than 0.9, then Jb is recorded and finally removed from the J-feature set. Otherwise, it remains in the set. (3) After calculation and comparison, the feature Ja is selected into the final feature set and removed from the J-feature set. (4) Repeat the steps of (1)–(3) until the J-feature set is empty. The final feature set is optimal for early ShB.
Jeffries-Matusita (JM) distance is a widely used metric to measure the separability between different categories. Its detailed formula refers to [54].

2.3.5. Descriptions of ShB Identification Algorithms

To compare the discriminant effects of different methods and obtain an optimal recognition model of early ShB, two machine-learning algorithms and a linear method were used, namely, support vector machine (SVM), random forest (RF), and linear discriminant analysis (LDA). SVM is a supervised learning algorithm used for classification and regression problems [55]. Its goal is to find an optimal hyperplane or a set of hyperplanes that separate different classes of samples while maximizing the margin between them. It has good generalization and robustness, and it can be adapted to different data scenarios by adjusting parameters and selecting appropriate kernel functions. This study constructed an SVM model with a Gaussian radial basis function kernel. Optimal parameters were found using a grid search, such as ‘svm_type’, ‘cost’, and ‘gamma’, which are C-SVC, 20, and 0.07, respectively.
Random forest (RF) is an algorithm based on multiple decision trees [56] that can improve model accuracy without significantly increasing computational complexity and is less affected by multicollinearity. Each decision tree is built on a subset of data obtained through random sampling, and the classification of each tree is based on the features of some attribute within a certain range. The number of decision trees was 30, and the maximum depth of trees was 4.
In addition to machine-learning methods, linear discriminant analysis (LDA) [57] was also employed for comparison purposes.

2.3.6. Evaluation Metrics of Models

In binary classification problems, four evaluation metrics are widely used, including precision, recall, specificity, and F1_score. Recall, also known as sensitivity, measures the fraction of actual positive samples that the model correctly identifies. The F1_score takes into account both precision and recall, providing a comprehensive evaluation of the model’s identification performance in various situations. The formulas of these metrics are as follows.
P r e c i s i o n = T P T P   +   F P
R e c a l l = T P T P   +   F N
F 1 _ s c o r e = 2 × P r e c i s i o n   ×   R e c a l l P r e c i s i o n   +   R e c a l l
S p e c i f i c i t y = T N T N   +   F P
where TP is the number of true positive samples correctly predicted as the positive class, FP represents the number of negative class samples wrongly predicted as the positive class, FN means the number of true positive samples wrongly predicted as the negative class, and TN is the number of true negative samples correctly predicted as the negative class. In evaluating the accuracy, 10-fold cross validation was used to verify the generalization ability of the model.

3. Results

3.1. Optimal Spectral Features for Early Detection of Rice ShB

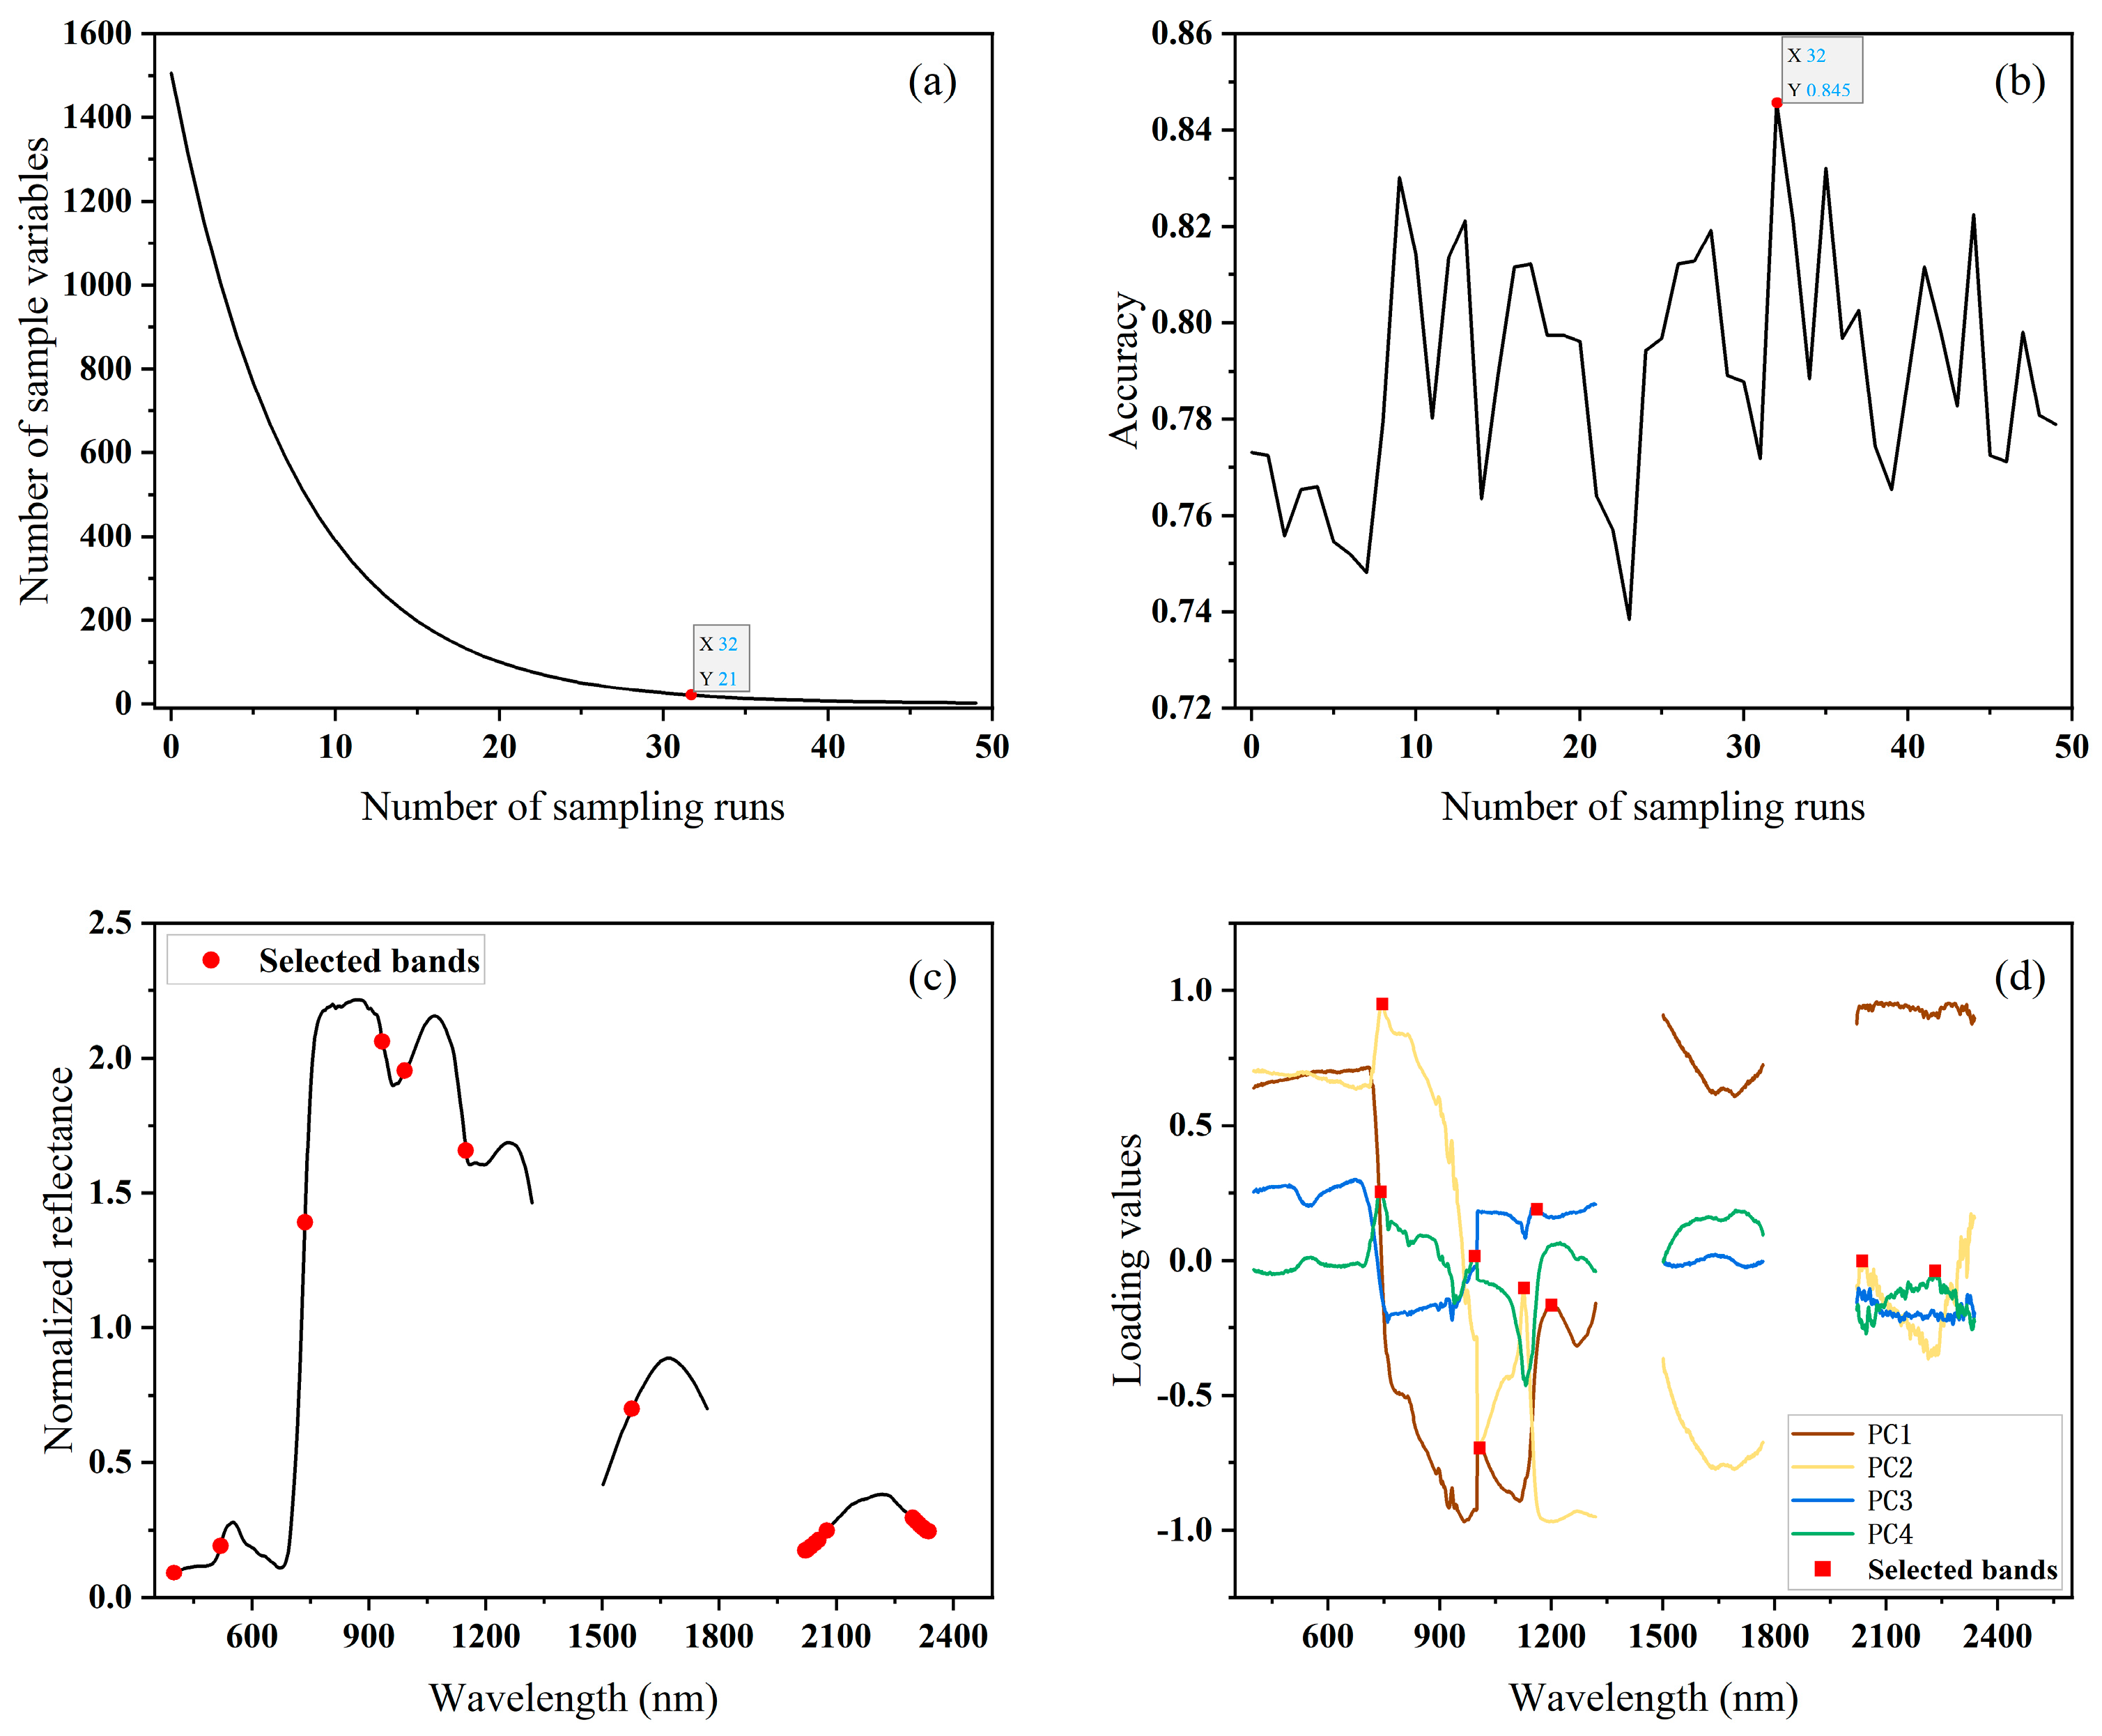
3.1.1. Selection of Key Wavelengths

In the early detection of sheath blight accurately, a stepwise approach with two sequential parts was proposed and applied in the optimization of features. The first step is effective wavelength extraction using the three algorithms of CARS, SPA, and PCA. Figure 4a,b shows the changing trend of the number of variables and the corresponding accuracy of a PLS-DA model under different sampling runs. The number of selected variables went through two stages of fast decrease and refined change, due to the action of EDA in the CARS. The identification accuracy of 10-fold cross validation first descends, then increases until reaching the greatest value in a gentle way, and finally decreases because of the removal of key wavelengths. The highest accuracy was acquired with its value of 0.85 when the number of sampling runs reached 32 (the red dots marked in the figure). Correspondingly, 21 variables were selected as the sensitive wavebands-based CARS algorithm, as shown in Table 4. It is worth noting that these wavelengths are primarily located at the blue–green and near-infrared ranges, while some wavebands are still continuous, leading to redundant information.
The successive projections algorithm (SPA) has been shown to be a useful tool for variable selection, which employs the average risk G of misclassification as the cost function to guide selection. SPA was applied to the same data set of rice ShB. The screening result of SPA is indicated in Figure 4c and Table 4. Compared with the result of the CARS algorithm, 22 variables were extracted based on the SPA algorithm and mainly distributed in the short-wave infrared range, but two wavelengths are the same.
The principal component analysis (PCA) is the most frequently used technique for data dimensionality reduction and feature extraction for subsequent classification analysis. Unlike the above two algorithms, PCA only deals with the response data (X-matrix) without using a class index for each sample. The first four principal components (PCs) had a cumulative contribution rate above 0.97, which can explain most of the spectral information. Curves of factor loadings of principal component 1 (PC1), principal component 2 (PC2), principal component 3 (PC3), and principal component 4 (PC4) are shown in Figure 4d. The wave peaks with the highest factor loadings in these curves were determined as the most significant wavelengths (the red boxes marked in the figure). Finally, the 10 wavelengths selected could contribute the most to the classification, covering the red and short-wave infrared regions.
Above all, the key wavebands obtained by each algorithm had a different focus, which were located mainly at the blue, red, near-infrared, and short-wave infrared ranges. All variables based on the three methods were regarded as the input data set for the next processing.

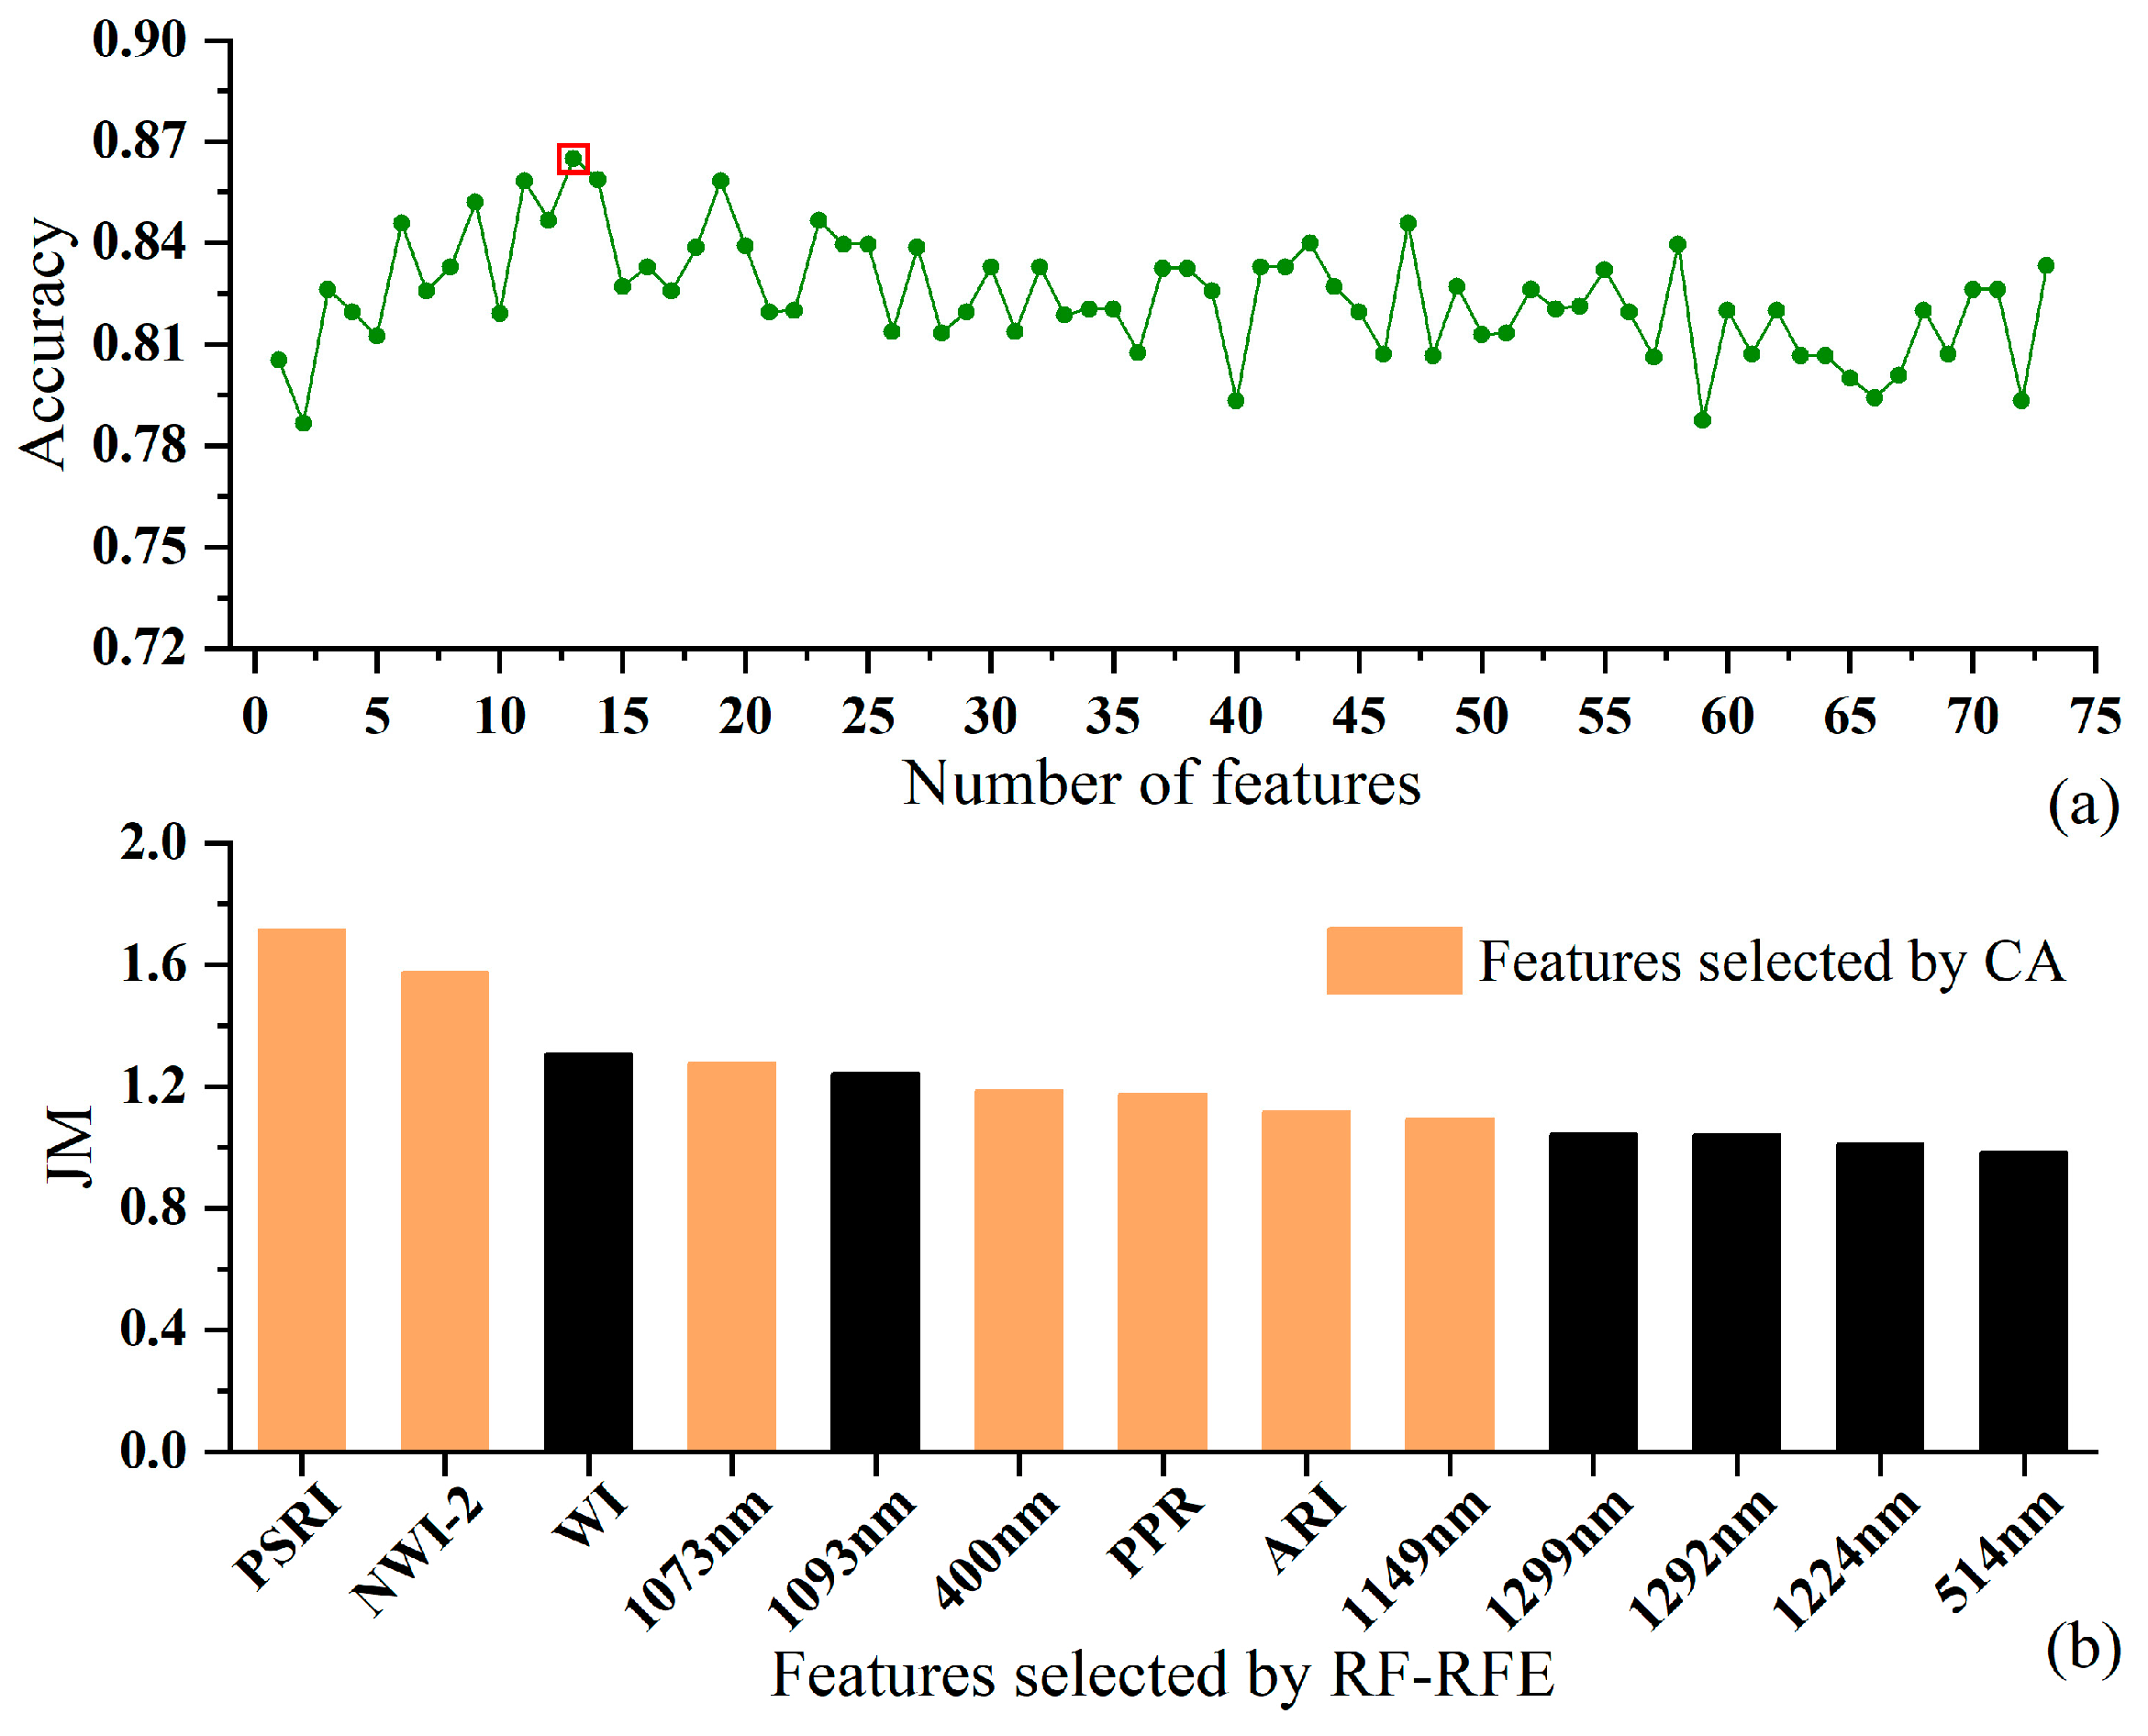
3.1.2. Further Screening of Key Wavelengths and Vegetation Indices

Per algebraic combinations of original bands, narrow-band vegetation indices are designed based on hyperspectral data, which have been proven to be useful in detecting important changes in the biophysical properties or functionality of plants. Vegetation indices were developed and used for detecting crop diseases that affect plant pigments, multiple plant parameters (e.g., LAI, biomass), or water content. Twenty-two common vegetation indices (Table 3) related to diseases and 51 key wavelengths were merged as a new feature set to sufficiently search for spectral information in early rice ShB. All these variables were further filtered by three successive steps from RFE to JM, then to CA. Figure 5a shows the accuracy of rice ShB corresponding to a different number of features. The accuracy fluctuates with the increase of temporal features because of the information redundancy between features and feature importance. As shown in the figure (the red box), the accuracy was highest when the number of features reached 13. Obviously, the dimensionality had been greatly reduced due to the elimination of irrelevant features. However, the correlation among these features is still high, such as between 1292 and 1299 nm. Thirteen variables were sorted by the JM distance of each feature calculated and were screened again by CA. Finally, seven features were selected for the establishment of subsequent recognition models and highlighted in Figure 5b, including four indices and three sensitive wavelengths, namely, PSRI, NWI-2, PPR, ARI, 1073 nm, 400 nm, and 1149 nm.

3.2. The Correlation Analysis of Optimal Spectral Features and Rice Growth Parameters

Sheath-blight disease affects rice’s morphological, biochemical, and physiological parameters (e.g., plant height, planting density, total chlorophyll content, and carbohydrate metabolism). The chlorophyll content and LAI of 154 diseased and healthy samples were non-destructively collected in the field by portable and handheld instruments and analyzed to explore whether these two factors are affected by sheath blight. The analysis of variance (Table 5) showed significant differences in the chlorophyll content (Cab) and LAI over the observation period, and a significant contrast between the diseased plants versus the controls was indicated. The finding indicates that sheath-blight disease can influence canopy chlorophyll and LAI changes in rice plants at the early stages of the disease.
Plants exhibit absorbing and reflecting variations among different waveband ranges under infection of diseases, namely spectral responses of diseases. This is because diseases can cause changes in plant pigments, water content, morphology, structure, etc. Correlation analysis between optimal spectral features (Figure 5b) and rice growth parameters is shown in Figure 6. Among them, the coefficient between NWI-2 and chlorophyll (Cab) reaches significance at the 0.999 confidence level, and the correlation coefficient (|R|) is close to 0.5. In addition, all spectral features have a significant correlation with LAI at the 0.001 probability level, among which NWI-2, 1073 nm, 1149 nm, and ARI are highly sensitive to LAI, with correlation coefficients (|R|) greater than 0.5. Therefore, the spectral features selected by the above method are valid and can indicate pigment and LAI changes affected by early ShB.

3.3. Detection Models Based on Hyperspectral Features

Based on the optimal spectral features selected, the accuracy of identifying ShB using three methods, (i) LDA, (ii) SVM, and (iii) RF, is shown in Figure 7a. For LDA, models with two types of inputs were compared, namely, using the first four principal components (PCs) and seven features, respectively. The ShB recognition obtained by LDA with the input of PCs (recall = 0.76, F1_score = 0.76, and specificity = 0.68) yielded better results. However, utilizing two machine-learning algorithms from SVM (recall = 0.85, F1_score = 0.88, and specificity = 0.78) and RF (recall = 0.80, F1_score = 0.84, and specificity = 0.74) improved the ShB identification. Particularly, the model using SVM performed better, with an overall accuracy of 87%. SVM is a binary classification model based on statistical theory, which effectively separates data points of different categories by constructing a hyperplane. However, three models all had lower specificity for healthy samples. Figure 7b shows the recognition differences in various cultivars using the SVM model. It was found that the detection model can better recognize healthy and diseased samples in Huruan1212 and Wuyunjing24 (Huruan1212: recall = 0.96 and specificity = 0.9; Wuyunjing24: recall = 0.83 and specificity = 0.82), while lower for healthy samples in Yongyou1245 (specificity = 0.50). Compared with common rice cultivars, the variety of Yongyou1245 belongs to hybrid rice with complementary excellent traits in growth, resistance, and yield, having similar and good growth patterns between healthy and infected rice plants in the early onset stage of rice sheath blight. It resulted in being more prone to misclassification for early ShB in this cultivar.

4. Discussion

Sheath blight caused by R. solani is a fungal disease and is ranked as the second most important after rice blast [58]. Early detection of inoculate is an important point to be considered for ShB management. Unlike plant foliar diseases, R. solani mainly attacks stalks and leaf sheaths in rice. The disease progresses in classical phases of early to late necrosis, developing from the initial lesions on the leaf phases of the rice crop towards the upper parts, i.e., leaf blades, panicles, and tillers at the later stages of infection [59]. The early disease symptoms appear in leaf sheaths and stems, leading to softness of the sheath and stem lodging. Stem lodging blocks the water transport, which disturbs canopy architecture, i.e., plant height, tiller angle, leaf length and width, and stem thickness [60,61]. This further affects changes in the biophysical parameters of rice plants, i.e., LAI and biomass. Additionally, some studies found that sheath-blight infection had an impact on rice biochemical and physiological parameters, such as physiological parameters, including the total chlorophyll content, carbohydrate metabolism, flavonoids, and POD, PPO, and SOD activities [22,62,63,64]. The study reports obvious variations in the chlorophyll content and LAI in rice plants under early stress of ShB (Table 5). However, plant morphological traits and biochemical status depend upon rice varieties [4,65]. Rice varieties with short heights and abundant tillers have yield increases due to a high use of nitrogen fertilizers, while this provides a microclimate that enhances R. solani infection [66]. Three cultivars used in our study have different phenotypic traits, especially the hybrid rice of Yongyou1245 with taller stature and fewer tillers. Hence, different Cab, LAI, and sheath-blight severity were exhibited in these rice varieties.
Selecting the most informative features is often a more effective approach to overcoming the challenge of redundant and irrelevant information contained in hyperspectral data. How to select a set of meaningful variables remains an area of active research interest, with too many features increasing the computational cost of the classifier while very few features eliminate better features that would have increased classification performance in accuracy and other measures. Since the symptoms of rice ShB are from the inverted four-leaf (or below) sheath or the corresponding leaves, by combining wavebands and vegetation indices, a stepwise screening strategy of spectral features is purposely proposed to capture the most unique disease information. Three methods of key wavebands selection are widely adopted and originate from different theories to gain the most appropriate subset. PCA employs only the instrumental response data without involving dependent variables; the wavelength coverage ranges obtained are different from those based on CARS and SPA. Owing to disease progression and plant growth differences, the rice canopy architecture of plants varies with the influence levels of early ShB, which are distinct from or similar to healthy plants. Hence, the spectral information contained in key wavelengths from CARS and SPA consists of the response data and a class index for each object, which is more reasonable and robust. The evidence is that the final selected wavelengths come from the results of CARS and SPA. Vegetation indices are mathematical operations of specific wavebands to amplify the spectral information representing plants under various stresses. Researchers have designed many vegetation indices that indicate stress status, crop growth, pigment content, physiological variation, and photosynthetic activity. However, these indices still retain redundant information and high correlations with the key wavelengths selected. The further filtration of all features is the joint adoption of three sequential methods, namely RF-RFE, JM, and CA, considering feature importance, separability, and correlation. The screening strategy of progressive refinement is highly interpretable and robust. The objective of this study is to find sensitive wavelengths and vegetation indices for early-stage rice ShB. However, so far, many spectral transformation methods have been developed to extract effective features of crop diseases. It is needed to use some other methods to transform the original spectrum to improve the accuracy of recognition in the future.
The final feature subset is of both a certain mechanism and the best contribution to the discrimination model of early ShB. These features were closely associated with leaf area index (LAI) under the early stress of ShB (Figure 6). In particular, the index of NWI-2 (combination from 850 to 970 nm) and key wavebands (1073 nm and 1149 nm) around the near-infrared region were found to be more sensitive for recognizing rice ShB. The sensitivity of these features depends on the extent of penetration of radiation into the canopy. Near-infrared radiation reflectance changes with the architecture of the plant canopy, i.e., leaf orientation, color, and size. The severity of early ShB affects the growth of the inverted four-leaf (or below) sheaths or the corresponding leaves and, afterward, disturbs the whole canopy architecture. The growth parameters of LAI and biomass are also indicators describing the plant canopy, contributing to the values of these spectral features. However, the genotypes have expressed high variation for morphological traits, such as green leaf area duration, height, heading and maturity dates, and yield potential, leading to weaker differences between various rice cultivars or between healthy and ShB-infected samples at early stages. Other sensitive features, namely ARI, PSRI, and PPR, imply the destruction of the pigment system, although these features were not significantly correlated with Cab. Pigments, including chlorophylls (Chl), carotenoids, and anthocyanin, participate in light absorption in particular bands. In general, spectral variations under the disease infection are associated with the total chlorophyll (sum of Chl_a and Chl_b), while less attention was given to carotenoids and anthocyanin. ARI was constructed for estimating anthocyanin accumulation and also serves as an indicator of leaf senescence and stress. PSRI is sensitive to the ratio of carotenoids and chlorophylls. Hence, spectral variations may be related to carotenoids and anthocyanin in rice plants infected by early ShB.
Compared with the traditional approach (i.e., LDA in this study), machine-learning algorithms exhibited high sensitivity, particularly SVM. Meanwhile, the early-detection model of ShB was proven to be applicable through the validation of other rice diseases. The model correctly recognized sheath-blight disease under leaf blast disease and the interactive disease of leaf blast and sheath blight in the same variety and growth stage. This is attributed to significant spectral differences between leaf blast and sheath blight in the whole spectral range, especially in seven selected features (Figure 8). The differences reduce and even disappear when the interactive disease of leaf blast and sheath blight happens, although it is visible in the range of 900 to 1300 nm when the severity of the leaf blast disease is slight. Symptoms of leaf blast appear on the surface leaves of the rice canopy, which are different from those of sheath blight. Therefore, it is yet challenging to achieve a reliable and accurate monitoring result under realistic field conditions, where several stresses/pests or other stresses may occur simultaneously. In the future, it is important to further explore the transferability of the model under more complex conditions, such as other rice planting areas and similar diseases/pests. Additionally, it is not clear how early ShB affects the canopy structure (i.e., height, leaf angle, leaf length, and width) and how reflected radiation scatters and transfers in such a canopy.

5. Conclusions

Our study successfully demonstrated that rice canopy hyperspectral data could be effectively utilized for early ShB detection through the stepwise screening process of features and the SVM algorithm. The main findings are as follows:
  • The screening strategy of spectral features with two sequential parts was proposed, including the selection of a key wavelength set based on three different methods and further filtering of all features with key wavebands and vegetation indices through analysis of RF-RFE and CA. It was found that seven features are sensitive to early ShB through step-by-step optimization, namely, the reflectance at 400 nm, 1073 nm, and 1049 nm combined with NWI-2, PSRI, PPR, and ARI;
  • Sheath blight can influence canopy chlorophyll and LAI changes in rice plants at the early stages of the disease. The spectral features selected have a significant correlation with LAI, especially the index NWI-2, which also exhibits a high association with the total chlorophyll content;
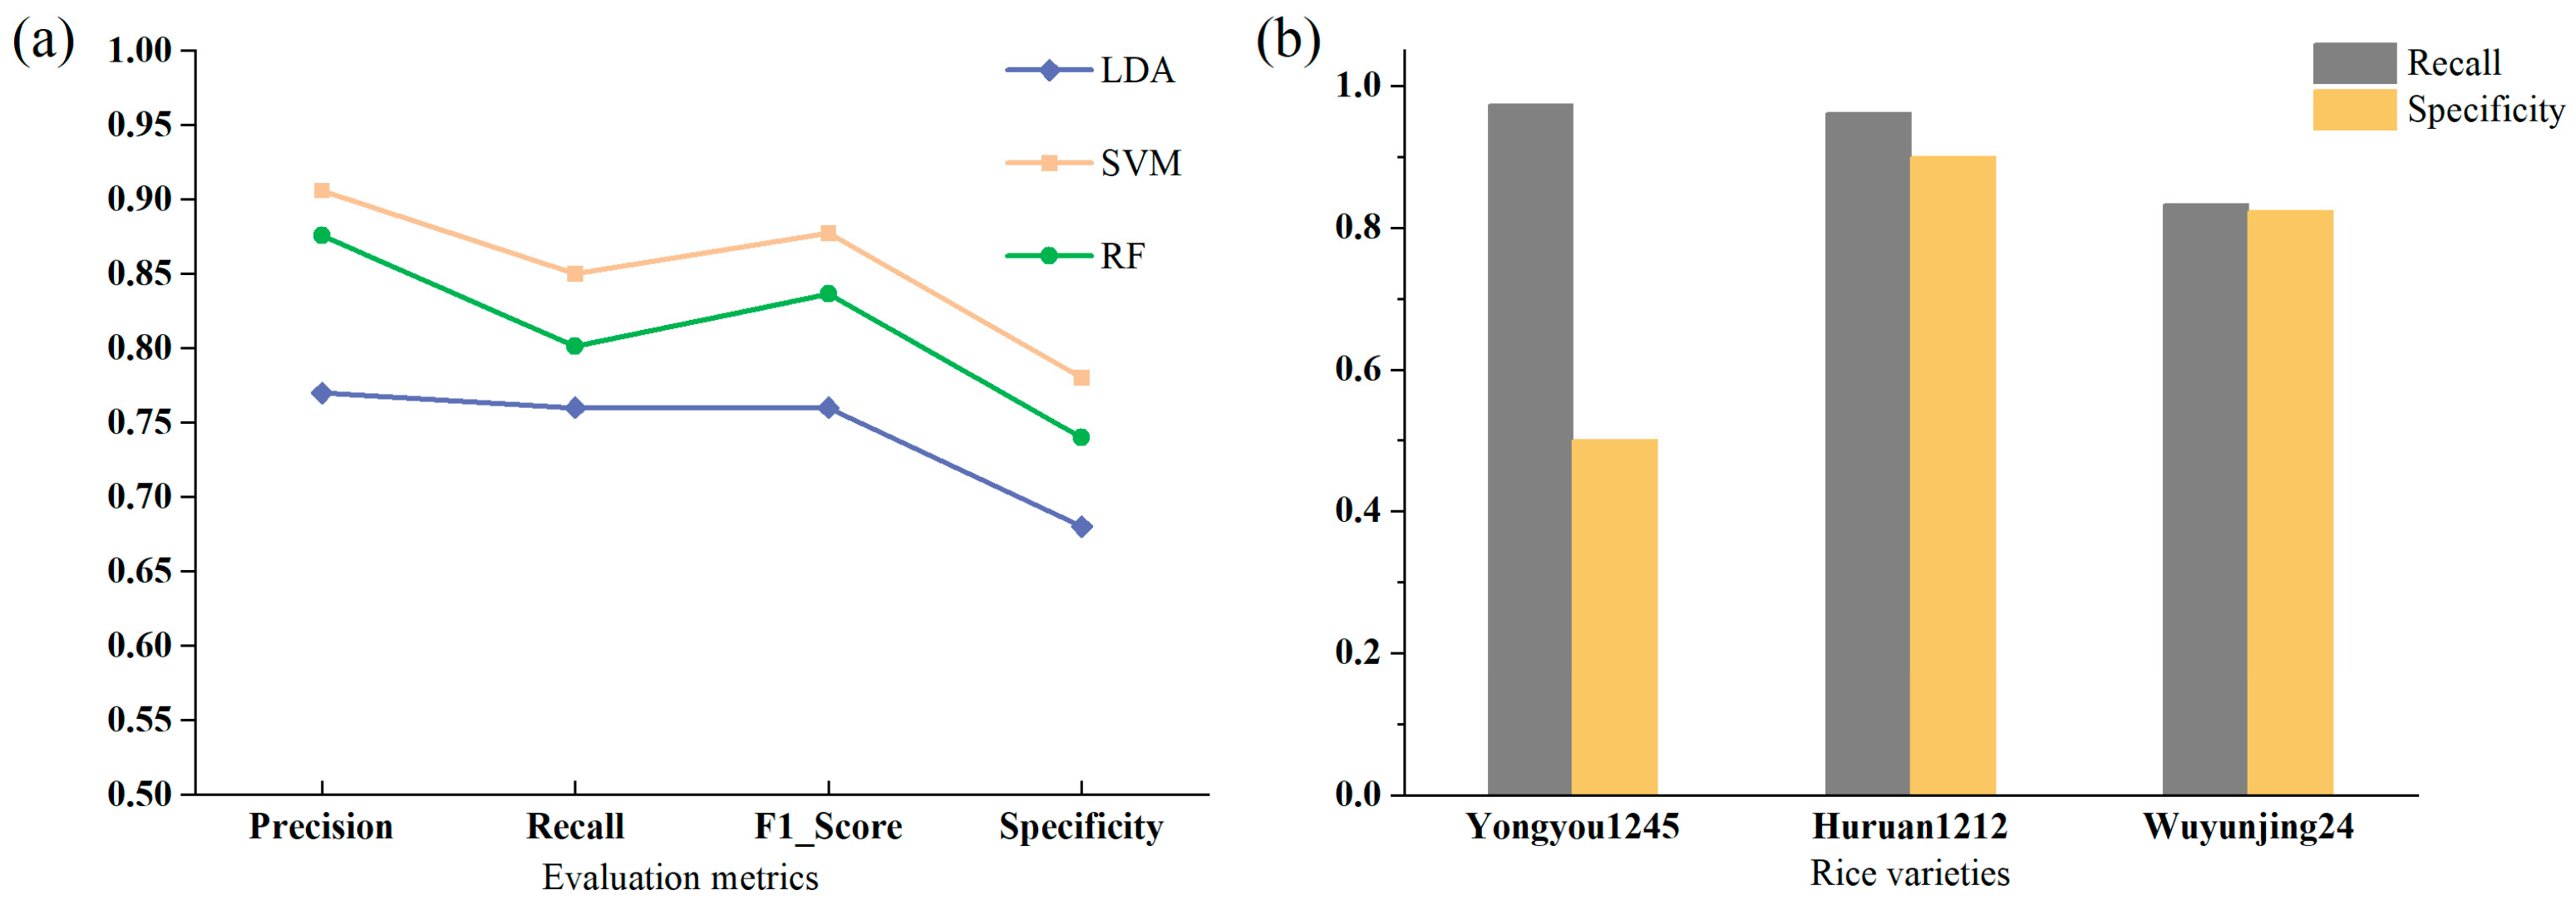
  • The SVM model outperformed the RF and LDA models in early ShB identification and yielded different detective accuracies in a variety of rice. The simultaneous occurrence of several diseases/pests poses a limitation to assessing early ShB stress at the field scale.

Author Contributions

Conceptualization, F.L. and B.L.; methodology, F.L. and B.L.; software, B.L.; data acquisition and processing, F.L., B.L. and R.Z.; validation, F.L. and B.L.; investigation, F.L., B.L., R.Z. and H.C.; formal analysis, F.L.; writing—original draft preparation, F.L. and B.L.; writing—review and editing, F.L., B.L. and J.Z.; visualization, B.L.; supervision, F.L.; funding acquisition, F.L. All authors have read and agreed to the published version of the manuscript.

Funding

This research was funded by the Basic Research Program (Natural Science Foundation)—General Project of Jiangsu Province (Grant No. BK20211287); the National Key R&D Program of China (Grant No. 2022YFD2000100); and the National Natural Science Foundation of China (Grant No. 42071420).

Data Availability Statement

Data are contained within the article.

Conflicts of Interest

The authors declare no conflicts of interest.

References

  1. Zhou, Y.; Bao, J.; Zhang, D.; Li, Y.; Li, H.; He, H. Effect of heterocystous nitrogen-fixing cyanobacteria against rice sheath blight and the underlying mechanism. Appl. Soil Ecol. 2020, 153, 103580. [Google Scholar] [CrossRef]
  2. Zhang, Z.J.; Zeng, Y.; Jiang, Z.Y.; Shu, B.S.; Sethuraman, V.; Zhong, G.H. Design, synthesis, fungicidal property and QSAR studies of novel β-carbolines containing urea, benzoylthiourea and benzoylurea for the control of rice sheath blight. Pest Manag. Sci. 2018, 74, 1736–1746. [Google Scholar] [CrossRef] [PubMed]
  3. Margani, R.; Hadiwiyono; Widadi, S. Utilizing Bacillus to inhibit the growth and infection by sheath blight pathogen, Rhizoctoniasolani in rice. In Proceedings of IOP Conference Series: Earth and Environmental Science; IOP Publishing Ltd.: Bristol, UK, 2018; p. 012070. [Google Scholar]
  4. Singh, P.; Mazumdar, P.; Harikrishna, J.A.; Babu, S. Sheath blight of rice: A review and identification of priorities for future research. Planta 2019, 250, 1387–1407. [Google Scholar] [CrossRef] [PubMed]
  5. Wu, W.; Huang, J.; Cui, K.; Nie, L.; Wang, Q.; Yang, F.; Shah, F.; Yao, F.; Peng, S. Sheath blight reduces stem breaking resistance and increases lodging susceptibility of rice plants. Field Crops Res. 2012, 128, 101–108. [Google Scholar] [CrossRef]
  6. Singh, A.K.; Srivastava, J. Sheath blight disease of paddy and their management. In Recent Advances in the Diagnosis and Management of Plant Diseases; Springer: New Delhi, India, 2015; pp. 91–99. [Google Scholar] [CrossRef]
  7. Zhang, J.C.; Yuan, L.; Wang, J.H.; Luo, J.H.; Du, S.Z.; Huang, W.J. Research progress of crop diseases and pests monitoring based on remote sensing. Trans. Chin. Soc. Agric. Eng. 2012, 28, 1–11. [Google Scholar] [CrossRef]
  8. Shrivastava, V.K.; Pradhan, M.K. Rice plant disease classification using color features: A machine learning paradigm. J. Plant Pathol. 2021, 103, 17–26. [Google Scholar] [CrossRef]
  9. Lu, Y.; Li, Z.; Zhao, X.; Lv, S.; Wang, X.; Wang, K.; Ni, H. Recognition of rice sheath blight based on a backpropagation neural network. Electronics 2021, 10, 2907. [Google Scholar] [CrossRef]
  10. Jiang, F.; Lu, Y.; Chen, Y.; Cai, D.; Li, G. Image recognition of four rice leaf diseases based on deep learning and support vector machine. Comput. Electron. Agric. 2020, 179, 105824. [Google Scholar] [CrossRef]
  11. Yuan, Y.; Chen, L.; Wu, N.; Li, M. Recognition of Rice Sheath Blight Based on Image Procession. J. Agric. Mech. Res. 2016, 38, 84–87. [Google Scholar] [CrossRef]
  12. Chen, J.; Zhang, D.; Nanehkaran, Y.A.; Li, D. Detection of rice plant diseases based on deep transfer learning. J. Sci. Food Agric. 2020, 100, 3246–3256. [Google Scholar] [CrossRef]
  13. Rahman, C.R.; Arko, P.S.; Ali, M.E.; Khan, M.A.I.; Apon, S.H.; Nowrin, F.; Wasif, A. Identification and recognition of rice diseases and pests using convolutional neural networks. Biosyst. Eng. 2020, 194, 112–120. [Google Scholar] [CrossRef]
  14. Cao, Y.L.; Jiang, K.L.; Yu, Z.X.; Xiao, W.; Liu, Y.D. Detection and Recognition of Rice Sheath Blight Based on Deep Convolutional Neural Network. J. Shenyang Agric. Univ. 2020, 51, 568–575. [Google Scholar] [CrossRef]
  15. Liu, T.T.; Wang, T.; Hu, L. Rhizocotonia Solani Recognition Algorithm Based on Convolutional Neural Network. Chin J Rice Sci 2019, 33, 90–94. [Google Scholar] [CrossRef]
  16. Han, X.T.; Yang, B.J.; Li, S.X.; Liao, F.B.; Liu, S.H.; Tang, J.; Yao, Q. Intelligent Forecasting Method of Rice Sheath Blight Based on Images. Sci. Agric. Sin. 2022, 55, 1557–1567. [Google Scholar] [CrossRef]
  17. Zhang, J.; Tian, Y.; Yan, L.; Wang, B.; Wang, L.; Xu, J.; Wu, K. Diagnosing the symptoms of sheath blight disease on rice stalk with an in-situ hyperspectral imaging technique. Biosyst. Eng. 2021, 209, 94–105. [Google Scholar] [CrossRef]
  18. Lin, F.; Guo, S.; Tan, C.; Zhou, X.; Zhang, D. Identification of rice sheath blight through spectral responses using hyperspectral images. Sensors 2020, 20, 6243. [Google Scholar] [CrossRef] [PubMed]
  19. Zhang, D.-Y.; Lan, Y.-B.; Zhou, X.-G.; Chen, L.-P.; Murray, S.C.; Zhang, G.-Z. Research imagery and spectral characteristics of rice sheath blight using three portable sensors. In Proceedings of the 2015 ASABE Annual International Meeting, New Orleans, LA, USA, 26–29 July 2015; p. 1. [Google Scholar]
  20. Li, Z.W.; Yuan, J.; Ding, W.M.; Yang, H.B.; Shen, S.Q.; Cui, J.L. Identification of rice sheath blight based on hyperspectral imaging technique. J. South China Agric. Univ. 2018, 39, 97–103. [Google Scholar] [CrossRef]
  21. Zhu, M.Y.; Yang, H.B.; Li, Z.W. Early Detection and Identification of Rice Sheath Blight Disease Based on Hyperspectral Image and Chlorophyll Content. Spectrosc. Spectr. Anal. 2019, 39, 1898–1904. [Google Scholar] [CrossRef]
  22. Chhabra, R.; Sharma, R.; Hunjan, M.S.; Sharma, V.K.; Thakur, S.; Chauhan, S. Physio-biochemical and histological alterations in response to sheath blight disease of rice (Oryza sativa L.). J. Phytopathol. 2022, 170, 778–790. [Google Scholar] [CrossRef]
  23. Xue, X.; Cao, Z.; Zhang, X.; Wang, Y.; Zhang, Y.; Chen, Z.; Pan, X.; Zuo, S. Overexpression of OsOSM1 enhances resistance to rice sheath blight. Plant Dis. 2016, 100, 1634–1642. [Google Scholar] [CrossRef]
  24. Stroppiana, D.; Boschetti, M.; Confalonieri, R.; Bocchi, S.; Brivio, P.A. Evaluation of LAI-2000 for leaf area index monitoring in paddy rice. Field Crops Res. 2006, 99, 167–170. [Google Scholar] [CrossRef]
  25. Markwell, J.; Osterman, J.C.; Mitchell, J.L. Calibration of the Minolta SPAD-502 leaf chlorophyll meter. Photosynth. Res. 1995, 46, 467–472. [Google Scholar] [CrossRef] [PubMed]
  26. NY/T 2720-2015; Rules for Evaluation of Rice for Resistance to Sheath Blight. Ministry of Agriculture of the People’s Republic of China: Beijing, China, 2015.
  27. Zhang, X.; Sun, J.; Li, P.; Zeng, F.; Wang, H. Hyperspectral detection of salted sea cucumber adulteration using different spectral preprocessing techniques and SVM method. Lwt 2021, 152, 112295. [Google Scholar] [CrossRef]
  28. Zhang, J.; Pu, R.; Huang, W.; Yuan, L.; Luo, J.; Wang, J. Using in-situ hyperspectral data for detecting and discriminating yellow rust disease from nutrient stresses. Field Crops Res. 2012, 134, 165–174. [Google Scholar] [CrossRef]
  29. Ma, H.; Huang, W.; Jing, Y.; Pignatti, S.; Laneve, G.; Dong, Y.; Ye, H.; Liu, L.; Guo, A.; Jiang, J. Identification of Fusarium head blight in winter wheat ears using continuous wavelet analysis. Sensors 2019, 20, 20. [Google Scholar] [CrossRef]
  30. Gitelson, A.A.; Merzlyak, M.N.; Chivkunova, O.B. Optical properties and nondestructive estimation of anthocyanin content in plant leaves. Photochem. Photobiol. 2001, 74, 38–45. [Google Scholar] [CrossRef] [PubMed]
  31. Penuelas, J.; Baret, F.; Filella, I. Semi-empirical indices to assess carotenoids/chlorophyll a ratio from leaf spectral reflectance. Photosynthetica 1995, 31, 221–230. [Google Scholar]
  32. Haboudane, D.; Miller, J.R.; Tremblay, N.; Zarco-Tejada, P.J.; Dextraze, L. Integrated narrow-band vegetation indices for prediction of crop chlorophyll content for application to precision agriculture. Remote Sens. Environ. 2002, 81, 416–426. [Google Scholar] [CrossRef]
  33. Daughtry, C.S.; Walthall, C.; Kim, M.; De Colstoun, E.B.; McMurtrey Iii, J. Estimating corn leaf chlorophyll concentration from leaf and canopy reflectance. Remote Sens. Environ. 2000, 74, 229–239. [Google Scholar] [CrossRef]
  34. Metternicht, G. Vegetation indices derived from high-resolution airborne videography for precision crop management. Int. J. Remote Sens. 2003, 24, 2855–2877. [Google Scholar] [CrossRef]
  35. Peñuelas, J.; Gamon, J.; Fredeen, A.; Merino, J.; Field, C. Reflectance indices associated with physiological changes in nitrogen-and water-limited sunflower leaves. Remote Sens. Environ. 1994, 48, 135–146. [Google Scholar] [CrossRef]
  36. Gitelson, A.; Merzlyak, M.N. Spectral reflectance changes associated with autumn senescence of Aesculus hippocastanum L. and Acer platanoides L. leaves. Spectral features and relation to chlorophyll estimation. J. Plant Physiol. 1994, 143, 286–292. [Google Scholar] [CrossRef]
  37. Chen, J.M. Evaluation of vegetation indices and a modified simple ratio for boreal applications. Can. J. Remote Sens. 1996, 22, 229–242. [Google Scholar] [CrossRef]
  38. Gamon, J.; Serrano, L.; Surfus, J. The photochemical reflectance index: An optical indicator of photosynthetic radiation use efficiency across species, functional types, and nutrient levels. Oecologia 1997, 112, 492–501. [Google Scholar] [CrossRef] [PubMed]
  39. Filella, I.; Serrano, L.; Serra, J.; Penuelas, J. Evaluating wheat nitrogen status with canopy reflectance indices and discriminant analysis. Crop Sci. 1995, 35, 1400–1405. [Google Scholar] [CrossRef]
  40. Gamon, J.; Penuelas, J.; Field, C. A narrow-waveband spectral index that tracks diurnal changes in photosynthetic efficiency. Remote Sens. Environ. 1992, 41, 35–44. [Google Scholar] [CrossRef]
  41. Barnes, J.D.; Balaguer, L.; Manrique, E.; Elvira, S.; Davison, A. A reappraisal of the use of DMSO for the extraction and determination of chlorophylls a and b in lichens and higher plants. Environ. Exp. Bot. 1992, 32, 85–100. [Google Scholar] [CrossRef]
  42. Merton, R. Monitoring community hysteresis using spectral shift analysis and the red-edge vegetation stress index. In Proceedings of the Seventh Annual JPL Airborne Earth Science Workshop, Pasadena, CA, USA, 12–16 January 1998; JPL: Pasadena, CA, USA, 1998; pp. 12–16. [Google Scholar]
  43. Merton, R.; Huntington, J. Early simulation results of the ARIES-1 satellite sensor for multi-temporal vegetation research derived from AVIRIS. In Proceedings of the Eighth Annual JPL Airborne Earth Science Workshop, Pasadena, CA, USA, 9–11 February 1999; JPL: Pasadena, CA, USA, 1999; pp. 9–11. [Google Scholar]
  44. Merzlyak, M.N.; Gitelson, A.A.; Chivkunova, O.B.; Rakitin, V.Y. Non-destructive optical detection of pigment changes during leaf senescence and fruit ripening. Physiol. Plant. 1999, 106, 135–141. [Google Scholar] [CrossRef]
  45. Broge, N.H.; Leblanc, E. Comparing prediction power and stability of broadband and hyperspectral vegetation indices for estimation of green leaf area index and canopy chlorophyll density. Remote Sens. Environ. 2001, 76, 156–172. [Google Scholar] [CrossRef]
  46. Klemas, V.; Smart, R. The influence of soil salinity, growth form, and leaf moisture on the spectral reflectance of Spartina alternifolia canopies. Photogramm. Eng. Remote Sens. 1983, 49, 77–83. [Google Scholar]
  47. Harris, A.; Bryant, R.; Baird, A. Detecting near-surface moisture stress in Sphagnum spp. Remote Sens. Environ. 2005, 97, 371–381. [Google Scholar] [CrossRef]
  48. Peñuelas, J.; Filella, I.; Biel, C.; Serrano, L.; Save, R. The reflectance at the 950–970 nm region as an indicator of plant water status. Int. J. Remote Sens. 1993, 14, 1887–1905. [Google Scholar] [CrossRef]
  49. Babar, M.; Reynolds, M.; Van Ginkel, M.; Klatt, A.; Raun, W.; Stone, M. Spectral reflectance to estimate genetic variation for in-season biomass, leaf chlorophyll, and canopy temperature in wheat. Crop Sci. 2006, 46, 1046–1057. [Google Scholar] [CrossRef]
  50. Li, H.; Liang, Y.; Xu, Q.; Cao, D. Key wavelengths screening using competitive adaptive reweighted sampling method for multivariate calibration. Anal. Chim. Acta 2009, 648, 77–84. [Google Scholar] [CrossRef]
  51. Soares, S.F.C.; Gomes, A.A.; Araujo, M.C.U.; Galvão Filho, A.R.; Galvão, R.K.H. The successive projections algorithm. TrAC Trends Anal. Chem. 2013, 42, 84–98. [Google Scholar] [CrossRef]
  52. Du, Q.; Fowler, J.E. Hyperspectral image compression using JPEG2000 and principal component analysis. IEEE Geosci. Remote Sens. Lett. 2007, 4, 201–205. [Google Scholar] [CrossRef]
  53. Jolliffe, I.T.; Cadima, J. Principal component analysis: A review and recent developments. Philos. Trans. R. Soc. A Math. Phys. Eng. Sci. 2016, 374, 20150202. [Google Scholar] [CrossRef]
  54. Dabboor, M.; Howell, S.; Shokr, M.; Yackel, J. The Jeffries–Matusita distance for the case of complex Wishart distribution as a separability criterion for fully polarimetric SAR data. Int. J. Remote Sens. 2014, 35, 6859–6873. [Google Scholar] [CrossRef]
  55. Pisner, D.A.; Schnyer, D.M. Support vector machine. In Machine Learning; Elsevier: Amsterdam, The Netherlands, 2020; pp. 101–121. [Google Scholar] [CrossRef]
  56. Breiman, L. Random forests. Mach. Learn. 2001, 45, 5–32. [Google Scholar] [CrossRef]
  57. Xanthopoulos, P.; Pardalos, P.M.; Trafalis, T.B.; Xanthopoulos, P.; Pardalos, P.M.; Trafalis, T.B. Linear discriminant analysis. In Robust Data Mining; Springer: New York, NY, USA, 2013; pp. 27–33. [Google Scholar] [CrossRef]
  58. Senapati, M.; Tiwari, A.; Sharma, N.; Chandra, P.; Bashyal, B.M.; Ellur, R.K.; Bhowmick, P.K.; Bollinedi, H.; Vinod, K.; Singh, A.K. Rhizoctonia solani Kühn pathophysiology: Status and prospects of sheath blight disease management in rice. Front. Plant Sci. 2022, 13, 881116. [Google Scholar] [CrossRef]
  59. Abbas, A.; Mubeen, M.; Iftikhar, Y.; Shakeel, Q.; Imran Arshad, H.M.; Carmen Zuñiga Romano, M.D.; Hussain, S. Rice Sheath Blight: A Comprehensive Review on the Disease and Recent Management Strategies. Sarhad J. Agric. 2023, 39, 111–125. [Google Scholar] [CrossRef]
  60. Zou, J.; Pan, X.; Chen, Z.; Xu, J.; Lu, J.; Zhai, W.; Zhu, L. Mapping quantitative trait loci controlling sheath blight resistance in two rice cultivars (Oryza sativa L.). Theor. Appl. Genet. 2000, 101, 569–573. [Google Scholar] [CrossRef]
  61. Dey, S.; Badri, J.; Prakasam, V.; Bhadana, V.; Eswari, K.; Laha, G.; Priyanka, C.; Rajkumar, A.; Ram, T. Identification and agro-morphological characterization of rice genotypes resistant to sheath blight. Australas. Plant Pathol. 2016, 45, 145–153. [Google Scholar] [CrossRef]
  62. Shen, M.; Cai, C.; Song, L.; Qiu, J.; Ma, C.; Wang, D.; Gu, X.; Yang, X.; Wei, W.; Tao, Y. Elevated CO2 and temperature under future climate change increase severity of rice sheath blight. Front. Plant Sci. 2023, 14, 1115614. [Google Scholar] [CrossRef] [PubMed]
  63. Zuo, S.; Chen, X.; Chen, H.; Xu, Y.; Zhang, J.; Chen, Y.; Chen, Z.; TONG, Y.; Xu, J.; Pan, X. Defense response and physiological difference of rice cultivars with different sheath blight resistance levels to the toxins produced by Rhizoctonia solani. Chin. J. Rice Sci. 2014, 28, 551. [Google Scholar] [CrossRef]
  64. Molla, K.A.; Karmakar, S.; Molla, J.; Bajaj, P.; Varshney, R.K.; Datta, S.K.; Datta, K. Understanding sheath blight resistance in rice: The road behind and the road ahead. Plant Biotechnol. J. 2020, 18, 895–915. [Google Scholar] [CrossRef]
  65. Willocquet, L.; Noel, M.; Sackville Hamilton, R.; Savary, S. Susceptibility of rice to sheath blight: An assessment of the diversity of rice germplasm according to genetic groups and morphological traits. Euphytica 2012, 183, 227–241. [Google Scholar] [CrossRef]
  66. Tang, Q.; Peng, S.; Buresh, R.J.; Zou, Y.; Castilla, N.P.; Mew, T.W.; Zhong, X. Rice varietal difference in sheath blight development and its association with yield loss at different levels of N fertilization. Field Crops Res. 2007, 102, 219–227. [Google Scholar] [CrossRef]
Figure 1. Location of the study area and experiment arrangements. (a) Distribution of the study area, (b) Detailed layout of the field, (c) Actual field photos.
Remotesensing 16 02047 g001
Figure 2. Flowchart for discrimination of rice ShB at early stages.
Remotesensing 16 02047 g002
Figure 3. The further screening of key wavelengths and vegetation indices.
Remotesensing 16 02047 g003
Figure 4. (a) The changing trend of the number of variables; (b) the accuracy of CV under various number of sampling runs; (c) results of the selected wavelengths using SPA; (d) results of the selected wavelengths using PCA.
Remotesensing 16 02047 g004
Figure 5. (a) Identification accuracy corresponding to the different number of features by the method of RF-RFE; (b) JM distances of features obtained by RF-RFE and CA.
Remotesensing 16 02047 g005
Figure 6. Correlation analysis between optimal spectral features and rice growth parameters. ** indicates significant correlation at 0.999 confidence level.
Remotesensing 16 02047 g006
Figure 7. (a)The performance comparison of identifying early ShB using different algorithms, (b) Differences in recognition of different rice varieties by the SVM model.
Remotesensing 16 02047 g007
Figure 8. Spectral curves of early ShB and other diseases, where “Mixed” indicates the simultaneous occurrence of rice leaf blast and sheath blight.
Remotesensing 16 02047 g008
Table 1. Basic description of the experimental information.
ExperimentsVarieties (Resistance)Data Collection Time
(Growth Period)
Sample Numbers
Experiment 1Wuyunjing24 (susceptibility)1 and 6 August 2022
(jointing stage)
70
Experiment 2Wuyunjing24 (susceptibility)24 July and 4 August 2023
(tillering stage)
84
Huruan1212 (moderateness)
Yongyou1245 (moderateness)
Table 2. Rice sheath blight grading criteria.
Disease LevelsSymptomsClasses
0There are no symptoms on the leaf sheaths and leaves of the plant.Healthy
1There are a few scattered lesions at the base of the plant.Early-infected
2The lesions extend to the inverted 5-leaf sheath or corresponding leaves (the sword leaf is the inverted leaf).
3The lesions extend to the inverted 4-leaf sheath or corresponding leaves.
4The lesions extend to the inverted 3-leaf sheaths or corresponding leaves.
5The lesions extend to the inverted 2-leaf sheaths or corresponding leaves.
6The lesions extend to less than half of the flag leaf sheath.
7The lesions extend to more than half of the flag leaf sheath.
8The sword leaves appear to have disease spots or become yellow due to loss of water.
9Part or all of the diseased stems and ears of rice die abnormally.
Table 3. Vegetation indices used in the study.
IndexFormulationRelated toReferences
Anth reflectance index (ARI)(R550)−1 − (R700)−1Pigment content
and variation
[30]
Structure Intensive Pigment Index (SIPI)(R800 − R445)/(R800 + R680)[31]
Transformed Chlorophyll Absorption in Reflectance Index (TCARI)3((R700 − R670) − 0.2(R700 − R550)(R700/R670))[32]
Modified Chlorophyll Absorption in Reflectance Index (MCARI)((R700-R670) − 0.2(R700 − R550)(R700/R670))[33]
Plant Pigment Ratio (PPR)(R550 − R450)/(R550 + R450)[34]
Normalized Chlorophyll Pigment Ratio Index (NPCI)(R680 − R430)/(R680 + R430)[35]
Red-Edge NDVI(RNDVI)(R750 − R705)/(R750 + R705)Crop growth[36]
Normalized Difference Vegetation Index (NDVI)(R750 − R650)/(R750 + R650)[34]
Modified Simple Ratio (MSR)(R750/R650 − 1)/(R750/R650 + 1)1/2[37]
Photochemical Reflectance Index (PRI)(R570 − R531)/(R570 + R531)Photosynthetic
activity
[38]
Nitrogen Reflectance Index (NRI)(R570 − R670)/(R570 + R670)[39]
physiological health reflectance index (PHRI)(R550 − R531)/(R550 + R531)[40]
Normalized Pheophytization Index (NPQI)(R415 − R435)/(R415+ R435)Physiological
variation
[41]
Red-Edge Vegetation Stress Index 1 (RVS1)(R714 + R750)/2 − R733[42]
Red-Edge Vegetation Stress Index 2 (RVS2)(R651 + R750)/2 − R751[42]
Red-edge vegetation stress index (RVSI)(R712 + R752)/2 − R732[43]
Plant Senescence Reflectance Index (PSRI)(R680 − R500)/R750[44]
Triangular Vegetation Index (TVI)0.5(120(R750 − R550) − 200(R670 − R550))[45]
Normalized Difference Infrared Index (NDII)(R819 − R1600)/(R819 + R1600)Stress state[46]
Moisture Stress Index (MSI)Rmean(1550~1750)/Rmean(760~800)[47]
Water Index (WI)R970/R900[48]
Normalized water Index-2 (NWI-2)(R970 − R850)/(R970 +R850)[49]
Table 4. Wavelengths selected by CARS, SPA, and PCA.
MethodVariable NumberWavelengths
CARS21489, 506, 510, 514, 517, 518, 520, 994, 995, 996, 998, 999, 1073, 1093, 1292, 1299, 2025, 2053, 2054, 2304, 2324
SPA22400, 519, 736, 934, 992, 1149, 1576, 2021, 2025, 2033, 2044, 2053, 2075, 2295, 2299, 2305, 2312, 2317, 2321, 2325, 2330, 2336
PCA10671, 707, 741, 745, 1224, 1501, 1640, 1700, 2074, 2328
Table 5. Analysis of variance for the chlorophyll content and LAI in rice plants infected by ShB.
Growth FactorItemsSum of SquaresDegrees of FreedomMean SquareFSignificance
CabBetween165.0831165.0834.4360.037 *
Within5656.39915237.213
Total5821.482153
LAIBetween8.93518.93512.1330.001 *
Within111.9391520.736
Total120.874153
Note: * means significance at the 0.05 probability level.
Disclaimer/Publisher’s Note: The statements, opinions and data contained in all publications are solely those of the individual author(s) and contributor(s) and not of MDPI and/or the editor(s). MDPI and/or the editor(s) disclaim responsibility for any injury to people or property resulting from any ideas, methods, instructions or products referred to in the content.

