Abstract
Various factors influence wildfire probability, including land use/land cover (LULC), fuel types, and their moisture content, meteorological conditions, and terrain characteristics. The Adriatic Sea coastal area in Croatia has a long record of devastating wildfires that have caused severe ecological and economic damages as well as the loss of human lives. Assessing the conditions favorable for wildfires and the possible damages are crucial in fire risk management. Adriatic settlements and ecosystems are highly vulnerable, especially during summer, when the pressure from tourist migration is the highest. However, available fire risk models designed to fit the macro-scale level of assessment cannot provide information detailed enough to meet the decision-making conditions at the local level. This paper describes a model designed to assess wildfire risks at the meso-scale, focusing on environmental and anthropogenic descriptors derived from moderate- to high-resolution remote sensing data (Sentinel-2), Copernicus Land Monitoring Service datasets, and other open sources. Risk indices were integrated using the multi-criteria decision analysis method, the analytic hierarchy process (AHP), in a GIS environment. The model was tested in three coastal catchments, each having recently experienced severe fire events. The approach successfully identified zones at risk and the level of risk, depending on the various environmental and anthropogenic conditions.
Keywords:
Adriatic coast; fire hazard; fire risk; meso-scale; Sentinel-2; open-source data; geospatial AHP 1. Introduction
Wildfires have in recent years become one of the most environmental and economic threats worldwide. In some regions, fires are an important factor in maintaining the health and function of ecosystems: many ecosystems are adapted to fire regimes [1]. However, wildfires, i.e., extreme free-burning fires, have a significant impact on ecosystems’ natural balance [2,3]. Fires affect ecosystems, causing change in vegetation patterns, soil properties, and hydrological processes, consequently altering the watershed conditions and water quality and hence posing a threat to water supply sources [4,5,6,7,8]. They also have a devastating impact on property, infrastructure, and populations’ health and lives. Of all the known factors that can cause a fire, approximately 10% are natural processes (e.g., lightning strikes), while the rest are of anthropogenic origin (accidental or intentional) [9,10]. Climate change plays a significant role in inducing fire risks [11]. Only in the last decade has the global surface temperature increased by 1.1 °C compared to the pre-industrial period of 1850–1900 [12]. Prolonged droughts and durations of fire seasons, alterations in precipitation, soil moisture, and wind patterns, an increased frequency of lightning strikes, etc., contribute greatly to susceptibility to wildfires [13,14,15,16]. Wildfires and climate change are intertwined processes [17,18]: wildfires are strongly influenced by climate change, but they also act as drivers of climate change. Fires have a deep impact on the environment, as they contribute to releasing CO2 and aerosols into the atmosphere and increased removal of vegetation cover.
Over the past years, wildfires have caused significant damage in Europe. With more than 1.2 million ha burned by wildfires in EU countries, the year 2017 holds a dramatic record [19], followed by the year 2022, with nearly 900,000 ha of land burned [20]. Approximately 96% of those wildfires were caused by people. Climatic and biophysical characteristics of the Mediterranean (such as high temperatures during summer, the availability of fuel, i.e., dry vegetation) make the region fire-prone: naturally induced open fires have historically been present and helped form and shape the current landscape. However, population migration from rural to urban areas and the abandonment of agricultural lands, coupled with the effects of climate change, have resulted in the increased frequency and magnitude of fires [21]. In 2021, approximately 5000 km2 of area was burned in the European Union [22]. According to the European Forest Fire Information System (EFFIS), in Croatia in 2017 alone for example, 108 fire events equal to or larger than approximately 30 ha were mapped and the total area of 67,666 ha was burned as opposed to the average 8395.64 ha burned in the period of 2006–2015 [23] (Figure 1).
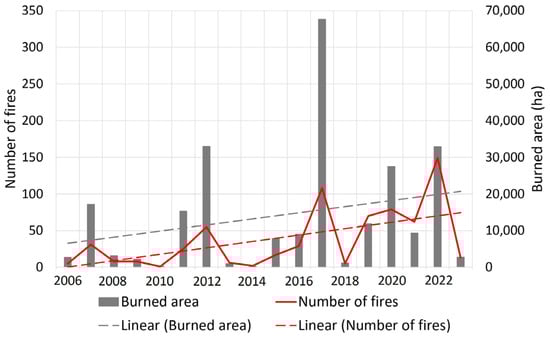
Figure 1.
Wildfires mapped in EFFIS of approx. 30 ha or larger in Croatia for the period of 2006–2023 [23].
Traditionally, fire management practices have been focused on eliminating open fires. As a consequence, in ecosystems that are dependent on open fires for maintaining their health, natural processes have been disrupted. Without open fires eliminating fuel circulation, the ignition of dead and dry vegetation led to severe wildfires which posed a significant threat to the environment and communities. Fire management therefore required a paradigm shift from the fire suppression policy that was practiced in the 20th century to reducing fire risk, which is a more integrated management approach that insures the safety of people and their properties, infrastructures, economic activities, and ecosystem services. An integrated fire management strategy implies risk assessment relying on the analysis and evaluation of threat conditions (both spatially and temporally) [24], creating the conditions for making a threat-informed decision. The main goal of fire risk assessment is to reduce the negative impacts of wildfires. It is “the potential for adverse consequences or impacts due to the interaction between one or more natural or human-induced hazards, exposure of humans, infrastructure and ecosystems, and systems’ vulnerabilities” [25]. Risk assessment includes the analysis of three main risk components: the hazard, exposure, and vulnerability [22,26,27]. A hazard is the probability of occurrence of an event that can cause damage to the exposed elements (e.g., the probability of fire occurrence) [25,28,29] while exposure indicates the presence of elements (people, properties, ecosystems) in areas where they could be adversely affected by wildfire. Vulnerability is the predisposition of the exposed elements to be adversely affected by wildfire [25,28].
Factors that influence wildfires at all stages, i.e., ignition, behavior, and spread, are numerous, including topography, meteorology, vegetation, and anthropogenic activity [22,24,30]. To adequately reflect the complexity and non-linearity of fire risk assessment, various fire hazard and fire risk models have been proposed over the years (e.g., [26,29,31,32,33]); however, there is no commonly accepted methodology. The geospatial concept of fire risk assessment integrates geospatial exposure analysis and the effect a fire of a certain probability will have on the exposed elements; hence, it involves geospatial analysis, fire simulation, and quantification of potential losses and benefits. Taking into consideration its geospatial nature, most fire risk assessment models are focused on computing fire behavior, fire danger, and fire effects to spatially assess a fire hazard and consequently the fire risk using simulation modeling of weather and fuel moistures [31,34]. Multi-criteria decision analysis (MCDA) integrated with a geographical information system (GIS) has proven to be a valuable tool in fire hazard and fire risk assessment and is often used to incorporate and evaluate characteristics of various fire risk components (e.g., [30,35,36,37,38,39,40]). Apart from the ability to consider various factors affecting the problem at hand, the MCDA approach allows for the efficient control of assigning the preferences to criteria/alternatives considered and works well with both numerical and categorical data. The rating system is based on an expert opinion, which may increase the uncertainty of the results but is also very beneficial in many decision-making processes. The simplicity and transparency of the weighting procedure enables better control over preference selection. In recent years, the growing availability of remote sensing data and development of climate models have induced interest in using machine learning (ML) methods to model wildfires [41], such as random forest (e.g., [26,42,43]), the support vector machine algorithm (e.g., [43,44,45,46]), and the Bayesian network model (e.g., [29]). Furthermore, data-driven models are flexible in terms of their adjustment to the availability of data in providing an adequate description of the spatiotemporal characteristics of fire drivers [47,48,49]. In general, both approaches (MCDA and ML methods) gain satisfactory results in natural hazard and risk assessment. Most of the comparisons of the ML and MCDA methods in natural hazard assessment are in favor of ML (e.g., [50,51,52,53,54,55]). MCDA methods, in general, have the advantage of accounting for an expert opinion, while ML methods provide more objectivity and do not necessarily require knowing the underlying physical processes, but they do require more detailed data (in terms of a high quality and quantity including climatic, biophysical, and anthropogenic drivers, such as air and land surface temperature, wind speed, and direction, fuel and soil moisture conditions, etc.) to train and to validate the model, which was not available for our study area. MCDA methods, despite having a somewhat poorer performance in comparison to ML methods, are able to perform with scarce data and provide realistic results.
Most of the models available, including both ML and MCDA models, are focused on larger scales of assessment (macro-scale), using low- and moderate-resolution data, e.g., the pan-European Wildfire Risk Assessment (EWRA) (downloadable at 1 km resolution [23]), which are designed to be scalable up to the global extent [24]. The macro-scale has the advantages of data availability and also a level of generalization but the disadvantage of accessing spatial and thematical detail required at the catchment (meso-scale) level. Meso-scale fire risk is difficult to assess without an appropriate model and moderate- to high-resolution data. Due to the high heterogeneity of fire drivers (vegetation type and distribution, landscape, temporal variability of population density) in Adriatic coastal regions, currently available models cannot provide adequate information for effective fire management. These areas are highly susceptible to wildfires, especially during summer when population density rapidly increases as a result of tourist migration. As an attempt to fill this gap and provide more reliable information suitable for decision-makers, we focused on designing a conceptual model for integrated meso-scale fire risk assessment, using the open data available in the Copernicus Land Monitoring Service and satellite multispectral data (Sentinel-2). The data used are thematically and spatially better suited to addressing the variability of the factors influencing the fire risks at local levels and wildfires drivers. The described transparent selection of the preferences in assessing fire risk components enables the complexity of fire risk assessment to be broken down into manageable sections and simplifies the decision-making process. Visualization of the results is presented in the form of fire hazard and fire risk maps: fire hazard maps provide information on wildfire probability and fire behavior [27] while fire risk maps identify the areas most severely impact by a fire in terms of the exposed elements (people, infrastructure, ecosystems), their value, and their vulnerability. The framework was tested in three coastal catchments close to the town of Šibenik in Croatia. All three catchments recently experienced severe fire events that threatened the local communities and valuable ecosystems.
2. Materials and Methods
2.1. Study Areas
To assess the fire hazards and fire risks, three catchments were selected in the hinterland of the city of Šibenik in Dalmatia, Croatia (Figure 2): two Dubrava catchments (two neighboring catchments with areas of 70.99 km2 and 33.24 km2 and no permanent watercourse) and the Grebaštica catchment (with an area of 33.59 km2). The elevation of the catchments varied from the sea level up to 533 m a.s.l. in the Dubrava catchments and 654 m a.s.l. in the Grebaštica catchment. All three experienced a severe fire event recently (as reported by the Croatian Firefighting Association). In the Dubrava catchments, the fire started on 27 July 2019 and lasted for 3 days, burning 7.15 km2. The Grebaštica catchment was affected by fire for 5 days, starting on 13 July 2023 and burning 3.29 km2.
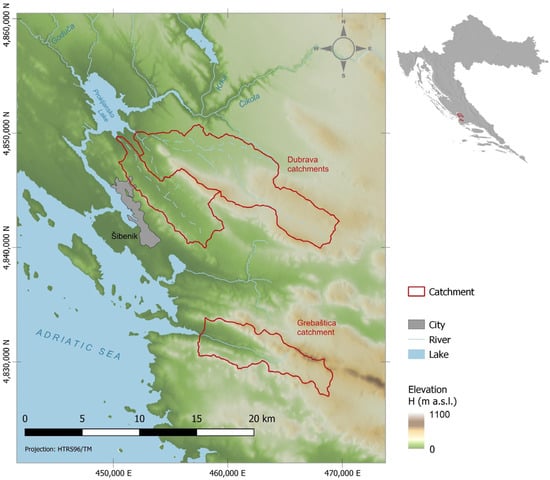
Figure 2.
Location of the analyzed catchments.
The climate of the area was typical of the Mediterranean, characterized by hot, dry summers and moderately cold, humid winters. The highest average air temperatures (24–25 °C) occurred in July. With average air temperatures of 6–7 °C, January was the coldest month. Both the absolute maximum of 39.2 °C and the absolute minimum of −10.2 °C were recorded in the city of Šibenik [56,57].
2.2. Land Use/Land Cover (LULC) Data
The open LULC data used were collected from various sources and disaggregated to fit the catchment-scale analysis. Most of the data were derived from the Copernicus Land Monitoring LULC datasets, i.e., CORINE Land Cover (CLC), Coastal Zones (CZ), Natura 2000 (N2K), and Urban Atlas (UA), depending on their coverage of the catchments. The nomenclature of all analyzed LULC datasets correspond to the Mapping and Assessment of Ecosystems and their Services (MAES) typology.
Considering the sizes of the analyzed catchments, and the meso-scale (catchment level) of assessment, the CLC dataset, having a minimum mapping unit (MMU) of 25 ha and minimum width unit (MWU) of 100 m [58], was not selected for the assessment, although its spatial coverage of the catchments was to their full extent. Instead, the more detailed CZ dataset was selected for all three catchments (MMU = 0.5 ha and MWU = 10 m), despite its partial coverage of the Dubrava catchments (86% of the area). To fill in the missing data, the CLC dataset was downscaled to aggregated CZ nomenclature (depending on the significance of the LULC class for the wildfire ignition and spread), using a Sentinel-2 image acquired on 27 June 2019, the N2K and UA datasets, as well as a digital orthophoto as ancillary data. The Grebaštica catchment was fully covered by the CZ dataset; hence, only the aggregation of the CZ classes was applied to prepare the LULC data (Figure 3).

Figure 3.
LULC: (a) Dubrava catchments; (b) Grebaštica catchment.
Apart from the LULC data, the high-resolution (10 m) Imperviousness Density (IMD) and Impervious Built-Up (IBU) datasets, providing a detailed overview of the settlements, were retrieved from the Copernicus Land Monitoring Service [59].
2.3. Terrain Characteristics
Terrain characteristics (altitude, slope, aspect, concavity) were derived from the digital elevation model at the pan-European level (EU-DEM) with a spatial resolution of 25 m (Figure 4).
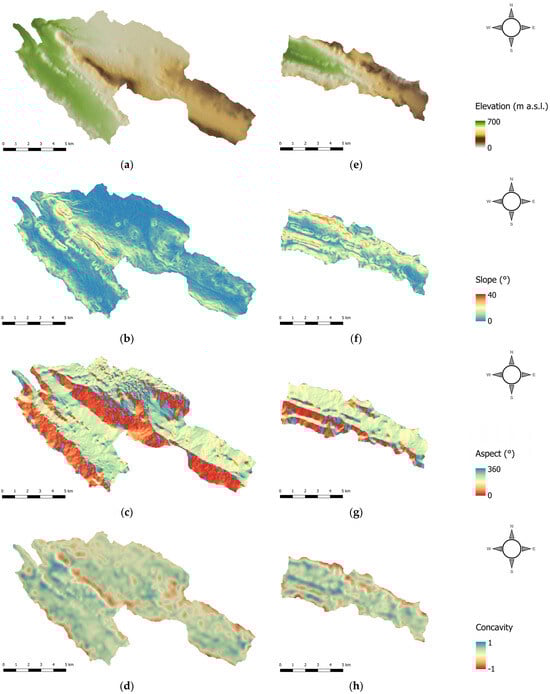
Figure 4.
Terrain characteristics: (a–d) Dubrava catchments; (e–h) Grebaštica catchment.
2.4. Population Density Data
Population density data were derived from the latest census data (2021) collected at the settlement level by the Croatian Bureau of Statistics [60]. The data collected correspond to the values aggregated at the administrative level (settlements), which do not reflect the actual distribution of the inhabitants within the settlements. Hence, the disaggregation procedure proposed by Horvat and Krvavica (described in detail in [61]) was applied to estimate the spatial distribution of people within fire-prone areas. Assuming that the population density was related to the IMD and that inhabitants resided only in LULC built-up areas, the applied disaggregation technique used the IMD and LULC datasets as ancillary data. The result was the spatial distribution of population density at the pixel level (Figure 5).
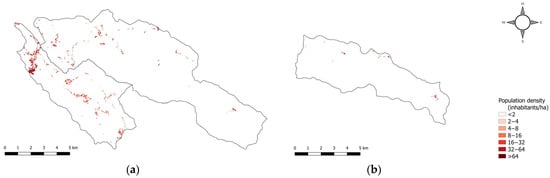
Figure 5.
Spatial distribution of the population density: (a) Dubrava catchments; (b) Grebaštica catchment.
2.5. Natura 2000
Habitats and species that are part of the Natura 2000 network are often subject to serious damage by wildfires and needed to be taken into consideration. Protected zones (based on the Birds and Habitat Directives) covered 8% of the Dubrava catchments’ total area and 3% of the Grebaštica catchment. Spatial and attribute data regarding the protected zones were derived from the freely available Natura 2000 site.
2.6. Burned Areas and Burn Severity
Burned areas and burn severity were derived from the multispectral satellite images acquired prior to and after the recorded fire events (Table 1). Burn severity is considered to be an important variable that defines the degree to which a fire affects an ecosystem and hence prompts ecosystem responses [62,63]. In other words, it describes the effects a fire has on surface characteristics.

Table 1.
Satellite images used.
Fire effects can be analyzed through spectral indices that reveal the state of the surface before and after a fire event. The most commonly used index to delineate burnt areas and to estimate burn severity is the normalized burn ratio (NBR). It integrates two spectral bands that respond most to burning and is calculated for a single date as the difference between the spectral reflectance in the near-infrared (NIR) and shortwave infrared (SWIR) bands, scaled by the sum of the two bands, i.e., [64]:
NBR = (NIR − SWIR)/(NIR + SWIR).
It can take on any value from −1 (recently burnt surface or bare ground) to 1 (healthy vegetation) depending on the surface conditions. To delineate a burned area and to quantify the effect of fire on a surface in terms of burn severity, two NBR values are needed as the following: before and after the fire. The difference normalized burn ratio (dNBR) is calculated by subtracting the pre-fire NBR (NBRprefire) and post-fire NBR (NBRpostfire):
dNBR = NBRprefire − NBRpostfire.
The result of Equations (1) and (2) describe the spatial distribution of a fire’s effect and can be attributed to the burn severity (Figure 6).
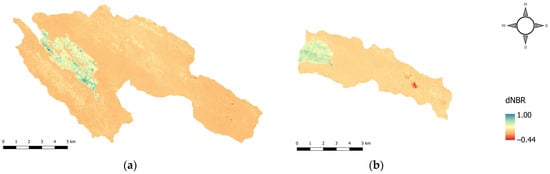
Figure 6.
dNBR values: (a) Dubrava catchments; (b) Grebaštica catchment.
2.7. Framework for Fire Hazard and Risk Assessment
Fire risk assessment integrates three main risk components, the hazard, exposure, and vulnerability, and expresses the probability of negative outcomes of a fire [22]. In general, the assessment follows the FirEUrisk conceptual scheme (Figure 7), with adjustments depending on the availability and the quality of the data required for estimating specific risk components. The main methodological steps are the following:

Figure 7.
Fire risk conceptual scheme (adapted from the FirEUrisk project [65]).
- Generation of input variables for risk components;
- Assessment of risk components (hazard, exposure, and vulnerability);
- Fire risk assessment;
- Validation.
2.7.1. Fire Hazard
A fire hazard depends on the fire ignition probability and the propagation of the fire describing its behavior. Fire ignition can be caused by natural processes (lightning) and by people; however, the majority of fires are caused by human factors (accidental or deliberate). Propensity to fire ignition therefore depends on the presence of people in wildland–urban interface (WUI) areas and the vicinity of roads. Once a fire is ignited, its propagation is mainly governed by environmental conditions: fuel and terrain characteristics and weather conditions.
In general, a WUI is the contact area of urban land use and fire-prone wildland vegetation [66,67,68,69]. Although there have been a number of WUI mapping methodologies proposed and tested (e.g., [70,71,72]), a univocal definition of a WUI is not yet available for the Mediterranean region [73]. The WUI mapping procedure distinguishes two major classes, depending on the relationship between the built-up surfaces and the wildland vegetation: the (i) interface (where built-up areas meet wildland vegetation) and (ii) intermix (where built-up areas intermingle with wildland vegetation) [74]. At an intermix WUI, buildings are directly exposed to fire as they are surrounded by flammable vegetation, while at an interface WUI, buildings are within a spotting distance from large patches of flammable vegetation. The threshold for a building’s density that qualifies for WUI analysis varies; e.g., Carlson et al. [75] adopted 6.17 houses per km2 while Bar-Massada et al. [71] considered it to be all built-up surfaces. We applied the latter approach, i.e., all built-up surfaces, resulting from overlying LULC artificial classes (Table 2) with an IBU layer, were taken into consideration, regardless of their building densities. WUI mapping was based on the following assumptions:
Table 2.
Reclassification of the LULC data.
- Any woody vegetation is prone to fire ignition and can support fire spread under sufficiently dry conditions [71].
- All areas within a certain distance from built-up surfaces (home ignition zones) are assumed to be potentially at risk [74,76].
Built-up and woody vegetation areas were derived from the LULC map (Table 2). Woody vegetation consists of all forest and transitional woodland vegetation. However, since urban fabric and industrial, commercial, public, and military units also include associated non-sealed and vegetated surfaces, artificial LULC surfaces were overlaid with the IBU layer to locate only the surfaces occupied by buildings. Once woody vegetation and built-up surfaces were extracted, WUI areas were mapped based on the thresholds proposed by [71] (Table 3):
Table 3.
Susceptibility classes of fire hazard components.
- A home ignition zone is located within a 100 m buffer from built-up areas. All surfaces inside the buffer are assumed to be potentially at risk (potential WUI areas).
- Fire behavior is influenced by the proportion of woody vegetation neighboring potential WUI areas. If more than 50% of land cover surrounding buildings within a 500 m radius from them is woody vegetation, buildings are directly exposed to fire and areas are identified as intermix WUI.
- Continuous woody vegetation cover close to buildings increases the risk from wildfire; therefore, patches of woody vegetation larger than 5 km2 [67] are delineated. Buildings within a 600 m radius from those large patches are identified as interface WUI.
Assuming that population/housing density increased with the built-up density, so did the fire ignition probability. Following the definitions of intermix and interface WUIs, the appropriate susceptibility class was assigned to each WUI type (adapted from [71,77]) with respect to their fire ignition susceptibility (Table 3).
Previous research showed that proximity to roads has a significant influence on fire ignition (e.g., [78,79]): the highest influence is experienced within a 50 m [80] wide buffer and decreases as the distance from roads increases, until it reaches 600 m (corresponding to the radius around large patches of woody vegetation in the interface WUI identification). Distances were classified into six distance classes and assigned categorical values indicating the susceptibility of each distance class to fire ignition (Table 3). In this context, susceptibility is the propensity to fire ignition, depending on the distance class.
Fire behavior is greatly influenced by fire intensity, which is related to the heat energy released by a fire [22,26,62]. It mostly depends on the fuel type, fuel moisture content and topographic (slope) and climatic conditions (wind).
Fuel types refer to the susceptibility of vegetation to burn. The EFFIS provided a fuel map of Europe [81] with 10 aggregated fuel classes, based on 13 fuel models used in fire behavior analysis [82,83] at a spatial resolution of 250 m, which was too coarse for this meso-scale analysis. To reduce spatial aggregation, a site-specific fuel map was created, based on the EFFIS description of fuel type classes (Table 3) and the available LULC data (Figure 3).
Fuel moisture content (FMC) is a complex parameter dependent on the environment and the characteristics of vegetation. Vegetation with higher FMC values is not readily ignited as opposed to the low FMC vegetation that easily ignites and burn. Along with the fuel map, the EFFIS provided a spatial distribution of fuel moisture parameters, namely the fine fuel moisture content (FFMC), duff moisture code (DC), and drought code (DC), as well as the fire behavior indices, i.e., the initial spread index (ISI) and buildup index (BUI). However, data were available at 8 km spatial resolution that did not fit the requirements of the meso-scale level of this assessment. Methods for estimating both dead (DFMC) and live fuel moisture content (LFMC) are numerous and range from field measurements to approaches based on remote sensing. Field measurements are costly and time-consuming, representing the instantaneous and site-specific conditions that are difficult to extrapolate over space and time [84]; however, they provide detailed species-specific FMC data (e.g., [85,86,87]). Remote sensing, on the other hand, enables the continuous monitoring of larger areas, providing data necessary to estimate the FMC at finer spatial and temporal resolutions (e.g., MODIS [88,89,90,91,92]), Landsat [93,94,95], Sentinel-2 [90,96]).
Research focused on LFMC, investigating the relationship between the reflectance in various spectral regions and LFMC, showed that indices computed as a function of the reflectance in a shortwave infrared (SWIR) region are directly related to the LFMC (e.g., [90,94,97,98,99]) because of the strong absorption of water in that region. The normalized difference infrared index (NDII), calculated as a function of the NIR and SWIR reflectance, proved to perform well for all three major fuel type classes: grassland, shrubland, and forest [88,94]. Hence, we used it as an indicator of the live fuel moisture content. The equation used to calculate NDII is equal to NBR (Equation (1)) [100].
The NDII value indicates susceptibility to fire based on the LFMC of an observed pixel (Table 3). The thresholds depended on the value ranges specific to each catchment (Table 4).
Table 4.
NDII classification thresholds.
The terrain characteristics of slope, aspect, and concavity influence fire propagation. The amount of sunlight fuels receive influences the moisture content; hence, slopes facing south will be the more susceptible to fire that those facing other directions. Also, slopes facing east receive sunlight before noon while the temperatures are lower than the temperatures in the afternoon when west slopes receive more solar radiation. Fire moving up a slope will spread faster than moving down a slope or on a horizontal plane because flames preheat and dry the fuels [24,101]. The concavity of a terrain also plays an important role as fire will spread faster on a concave terrain [24]. All four terrain characteristics were derived from the DEM (Figure 4) and reclassified based on their susceptibility to fire (Table 3).
The influence of weather parameters on fire behavior was evaluated with the dimensionless fire weather index (FWI), a meteorologically based index that uses temperature, relative humidity, wind speed, and precipitation to evaluate the potential for wildland fire [22]. The index is accepted and used by the EFFIS for direct fire danger assessment due to weather conditions [102]. Calculations of the daily FWI were available from the Copernicus Climate Change Service (C3S) and from the Croatian Meteorological and Hydrological Service [103,104]. Threshold values used in the susceptibility classification were adopted from the EFFIS during the northern hemisphere fire season (June–September) (Table 3) [105].
An integrated fire risk approach implies merging the risk components. As previously described, all input components are assigned the categorical values that correspond to the susceptibility class. To evaluate each hazard component and finally the hazard and risk, all of the input data (maps) needed to be converted to a common metric. The normalization technique that was used was the local weighted linear combination (WLC) method [106]:
where min{aki} is the minimum value of the input map, aki is the attribute value at the observed location, and rk is the range of the values in the input map. The method resulted in normalized input maps with values that range from 0 to 1.
v(aki) = (aki − min{aki})/rk
The weights of the normalized fire hazard components were evaluated using the analytic hierarchy process [107] as the multi-criteria decision analysis (MCDA) method. Its hierarchical structure (Figure 8) includes decomposing the decision problem into a hierarchy that consists of the most important elements [108].
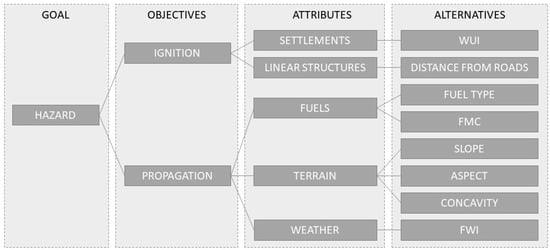
Figure 8.
AHP hierarchical structure of the criteria and alternatives in a fire hazard.
First, the hierarchy was constructed containing elements at four levels: the overall goal (fire hazard), criteria (fire behavior indicators, i.e., fire ignition and fire propagation), attributes (components that influence fire behavior, i.e., contact of people with the flammable vegetation—settlements and roads), and alternatives (characteristics that impact the level of susceptibility to fire behavior indicators). The method is based on the pairwise comparison of the elements at each hierarchical level with respect to the parent element at the higher level: the elements that were compared were assigned a relative importance intensity described in (Table A1) and comparison matrices were constructed at each hierarchical level. Relative weights for each hierarchical element were then computed. The consistency of the comparison was verified by the consistency ratio CR, not exceeding 10%:
where CI is the consistency index and RI is the random consistency index given by Saaty [107] (Table A2). The value λmax is the maximum eigenvalue of the comparison matrix and n is the order of the matrix. The overall priority rating was then constructed by aggregating the relative weights.
CR = CI/RI
CI = (λmax − n)/(n − 1)
Finally, a fire hazard map was computed as the sum of weighted components.
2.7.2. Fire Exposure and Vulnerability
Exposure refers to the extent to which people, assets, and ecosystems are affected by a fire while vulnerability indicates potential damages caused by a fire [24]. It enables locating the specific LULC features and people that might suffer the adverse consequences of a wildfire and links the fire hazard with vulnerability. Most fires are caused by humans and occur in WUI areas or close to them. Therefore, people living in WUI areas are more vulnerable to fires. Vulnerability assessment of the people exposed to fires was based on the presence of the people in WUIs. The intersection of the population density grid derived from the census data (Figure 5) and WUIs resulted in the number of people exposed to fire. The vulnerability class was assigned depending on the population density of the observed pixel (Table 5).
Table 5.
Vulnerability assessment of the people exposed to wildfires.
A similar approach was applied to the assets (all built-up areas: residential, industrial, and commercial, road and railway networks, mineral extraction, dump and construction sites, etc.). Assets exposed to fire resulted from the intersection of the corresponding LULC classes and previously created fire hazard map. Assuming that the building density increased with the imperviousness density, vulnerability evaluation was based on the classification of the exposed residential areas with respect to the IMD value (Table 5). All remaining assets were derived from the LULC data (Figure 3), with vulnerability qualitatively expressed, depending on the type of asset (Table 5).
Ecological values (EVs) were represented by ecological indicators describing the richness and diversity of species. These indicators were available at the national level as protected areas (Natura 2000). Areas that are part of the Natura 2000 network (birds and habitat directives) are considered highly vulnerable to wildfires (Table 5).
Ecosystem services (ESs) influence our wellbeing and present the benefits people gain from the nature [109,110]. Estimation of the benefits each ecosystem service provided to the economy is complex and difficult as there is no monitoring system that can measure these services in detail [111]. The Integrated System for Natural Capital Accounting (INCA) developed a method of measuring ES potential and ES demand at the European scale [112], aggregating over an accounting area, and then estimating the actual ES use as the share of demand that can be satisfied by the potential. ES use was calculated for every ecosystem type that provided the service and was recorded in the supply table, but instead of monetary values (provided in an aggregated form for the entire EU), we used relative supply estimates (Table A3) [111]. The LULC maps of the catchments are based on the CZ classification, which built upon the Mapping and Assessment of Ecosystems and their Services (MAES) classes. Hence, nine ecosystem types in the supply table correspond to the aggregated LULC classes in both catchments. Each LULC class was assigned with a vulnerability class based on its relative supply (Table 6).
Table 6.
Vulnerability assessment of ecosystem types.
Vulnerability components were converted to the same metric by applying the normalization in Equation (3). Vulnerability assessment was also based on the AHP method, using the hierarchical structure shown in Figure 9.
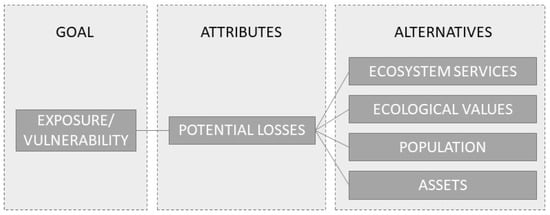
Figure 9.
AHP hierarchical structure of criteria and alternatives in the vulnerability assessment.
The vulnerability map was the result of the sum of weighted vulnerability components.
Finally, a fire hazard map was overlaid with the vulnerability classes to locate and classify fire risk in the catchments. It was assumed that hazard and vulnerability had equal weights in determining the risk.
2.7.3. Validation of the Results
Results were validated in all selected catchments using the burn severity derived from the previously mapped dNBR (Figure 6) as the severity indicator for both fire events. Burn severity describes the impact of a wildfire on the environment [62] and can be correlated with vegetation cover and fuel type [113], which are variables that significantly influence fire behavior, and consequently, fire hazard. Hence, it was used for the validation of the results. Based on the burn severity classes proposed for the dNBR classification [114] (Table 7), burned areas in all catchments were classified and compared to the overlapping fire hazard classes.
Table 7.
Burn severity classes (adapted from [114]).
3. Results
Fire hazard components were analyzed and classified depending on their susceptibility to fire ignition and fire propagation. Conversion to a common metric with Equation (3) (Figure 10 and Figure 11) enabled the overall fire hazard analysis and mapping.
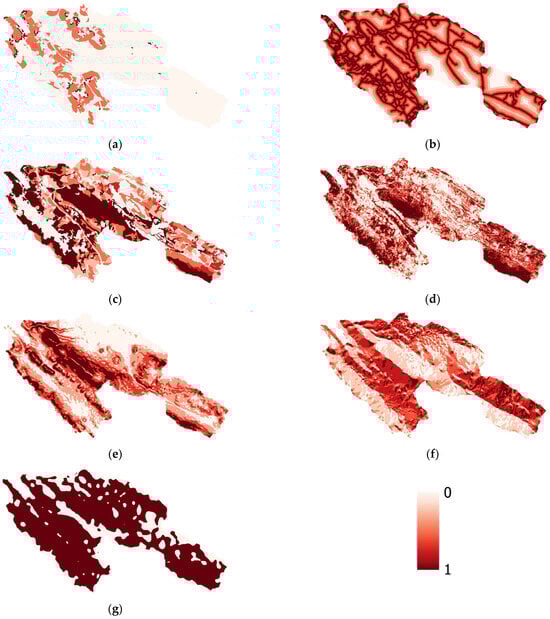
Figure 10.
Normalized susceptibility classes in Dubrava catchments: (a) WUI; (b) distance from roads; (c) fuel type; (d) NDII (LFMC; (e) slope; (f) aspect; (g) concavity.

Figure 11.
Normalized susceptibility classes in Grebaštica catchment: (a) WUI; (b) distance from roads; (c) fuel type; (d) NDII; (e) slope; (f) aspect; (g) concavity.
The catchments were not densely populated (less than 2% of the total catchment area in the Dubrava catchments was covered by urban fabric and less than 1% in the Grebaštica catchment). In that respect, the interface WUI covered only 1.7% and 3% of the Dubrava and Grebaštica catchments, respectively (Table 8). However, road networks were dense in both catchments, increasing their propensity to fire ignition.
Table 8.
Portions of the urban fabrics and the WUI areas in the total catchment areas.
Reclassification of the LULC datasets showed that woody vegetation covered nearly 50% in the Dubrava catchments and more than 50% in the Grebaštica catchment (Table 9). Such conditions are greatly in favor of fire propagation.
Table 9.
Fuel type coverage.
In the absence of FMC data, this parameter was evaluated indirectly, using the NDII index. Strong absorption of water in the SWIR region enabled the qualitative estimation of the moisture content: higher NDII values indicated lower moisture content in the fuel, hence the moisture conditions were in favor of fire propagation. Thresholds for NDII classification were determined as quartiles of the resulting values (Table 3), splitting the NDII into four susceptibility classes (Table 4).
Terrain characteristics derived from the DEM were classified and assigned the appropriate susceptibility class as described in Table 3.
The potential for wildland fire due to weather conditions was evaluated with the FWI. The spatial distribution of the FWI was available from the EFFIS for 2019; however, due to the coarse resolution of the available dataset, variation in the FWI was not detected in the Dubrava catchments. Furthermore, with no spatial distribution of the FWI available for the year 2023, point values obtained from the Šibenik meteorological station were used in the Grebaštica catchment (Table 10).
Table 10.
FWI susceptibility classification.
Weights of fire hazard components (priorities attributed to each component) were calculated using the AHP method, as described in Figure 8. Comparison matrices were constructed at each hierarchical level with the corresponding priorities (Table A4). The priorities of each alternative were finally calculated by multiplying priorities across all levels (Table 11). It was assumed that ignition and propagation had equal impact on fire hazard. However, in terms of fire ignition, higher priority was given to proximity to roads while the FMC was assumed to be the major factor in fire propagation, followed by the weather characteristics.
Table 11.
AHP priorities calculated for the fire hazard components.
The final fire hazard map was calculated as the sum of fire hazard components multiplied by the assigned priority (Figure 12):
Fire hazard = 0.063 ∙ WUI + 0.438 ∙ Distance from roads + 0.070 ∙ Fuel type + 0.209 ∙ FMC + 0.040 ∙ Slope + 0.014 ∙ Aspect + 0.007 ∙ Concavity + 0.160 ∙ FWI

Figure 12.
Fire hazard: (a) Dubrava catchments; (b) Grebaštica catchment.
Vulnerability depends on the population density, assets, as well as services provided by ecosystems within catchments and the indicators describing the richness and the diversity of species. In this conceptual model, vulnerability was evaluated qualitatively, rather than by attaching monetary value. Similar to the fire risk components, vulnerability components were converted to the same metric, indicating the most vulnerable areas (Figure 13 and Figure 14).
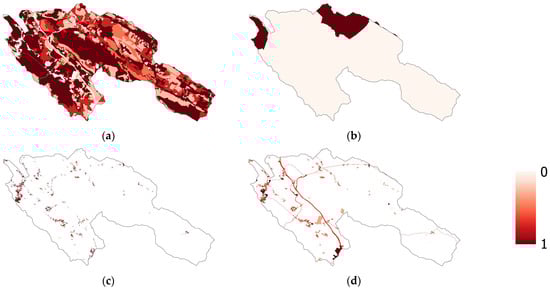
Figure 13.
Normalized vulnerability classes in Dubrava catchments: (a) ecosystem services; (b) ecological value; (c) population; (d) assets.

Figure 14.
Normalized vulnerability classes in Grebaštica catchment: (a) ecosystem services; (b) ecological value; (c) population; (d) assets.
The weights of the vulnerability components (Table 12) were calculated as priorities of the alternatives in the AHP hierarchical structure (Figure 9), based on a pairwise comparison (Table A5). The overall vulnerability within the catchments was determined as the sum of weighted vulnerability components:
Vulnerability = 0.061 ∙ Ecosystem services + 0.102 ∙ Ecological value + 0.729 ∙ Population + 0.108 ∙ Assets
Table 12.
AHP priorities calculated for the vulnerability components.
The final fire risk map was a result of overlaying the fire hazard map with the vulnerability classes (Figure 15). Classification into four risk classes based on equal frequencies indicated different risk levels in the catchments.

Figure 15.
Fire risk: (a) Dubrava catchments; (b) Grebaštica catchment.
As a comparison, Figure 16 shows the fire risk maps for the Dubrava catchments generated as an index that summarizes the combined effect of hazard and vulnerability, resulting from the EFFIS fire risk assessment [22]. It is an aggregated fire risk index (0–100%), expressed as the percentage of each cell under each specific class. Lacking the appropriate level of detail, such a coarse dataset clearly cannot meet the requirements at the micro- or meso-levels of fire management.
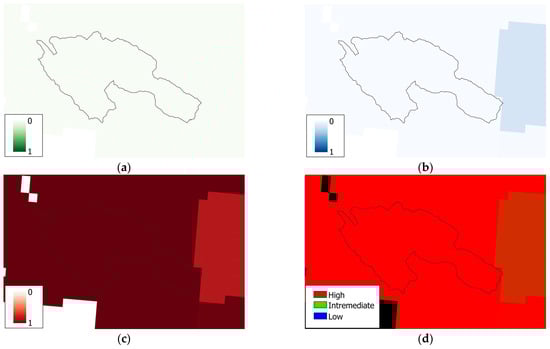
Figure 16.
EFFIS fire risk maps for the Dubrava catchments (adapted from [23]): (a) low-risk; (b) intermediate-risk; (c) high-risk; (d) color composite of the low-, intermediate-, and high-risks resulting in the fire risk index classification.
To validate the results of the described assessment, the fire hazard results were compared to the severity of the fire events in the catchments by overlaying the hazard classes with the severity index, dNBR. The spatial distribution of the dNBR (Figure 6) describes the burn severity and was classified into five classes (Table 7).
Fire hazard classes were extracted only for the burned areas and overlaid with the classified burn severity index (Table 13). In general, spatially comparing estimated fire hazard and burn severity, it performed better in the Dubrava catchments: moderately low and moderately high severity classes correspond well with moderate (52.6% overlap) and high hazard classes (40.3% overlap). In the Grebaštica catchment, the best match was achieved for the low hazard class (91% overlap).
Table 13.
Fire severity classes (adapted from [114]) compared to the fire hazard classes.
To test the impact of changes in the weights of the decision criteria (priorities of the alternatives), a sensitivity analysis was applied. First, the most critical alternative was detected, i.e., the alternative with the smallest change in value (dMIN) that changed the alternative ranking (Table 14) [115]:
where ΔMIN is the minimum difference between the alternative’s priority and the priority of the alternative closest in rank, P is the alternative’s priority, and i is the rank of the alternative. The most critical alternative in fire hazard assessment turned out to be fuel type. In the vulnerability assessment, the most critical alternative was the ecological value.
ΔMIN = P(i) − min [P(i) − P(i + 1), P(i) − P(i − 1)]
dMIN = ΔMIN ∙ 100/P(i)
Table 14.
Hazard and vulnerability critical alternatives.
The priority of the most critical alternative was then changed by factor β (arbitrarily selected values of 10%, 15%, 20%, 25%) while priorities of the remaining alternatives were changed accordingly, using the following equations [115]:
where α is the change in the current priority of the critical alternative PCR (i.e., β ∙ PCR), keeping the condition ΣP’(i) = 1 true. The results are summarized in Table 15.
P’(i) = P(i)/[1 − α] for non-critical alternatives
P’(i) = [P(i) − α]/[1 − α∙PCR] for critical alternative
P’(i) = [P(i) − α]/[1 − α∙PCR] for critical alternative
Table 15.
Hazard and vulnerability sensitivity analysis.
The ranking of the hazard alternatives changed at 20% of the change in the critical priority value while the ranking of the vulnerability alternatives started changing at 50% of the change in the critical priority value; hence, the evaluation stability was greater for vulnerability than hazard. A change of priorities (Table 15) revealed a positive overall trend in hazard assessment (Figure 17).
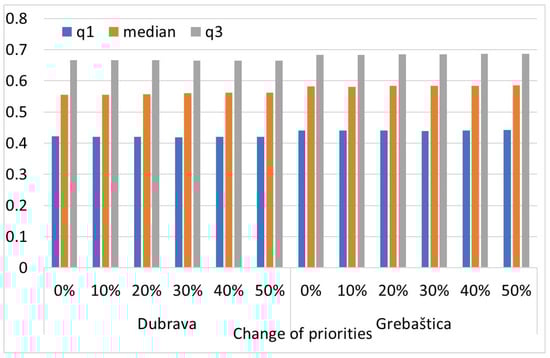
Figure 17.
Effect of the change of priorities on the basic statistical parameters of the fire hazard assessment in the catchments.
The performance of the model for β = 20% (at which the ranking of the alternatives changed) showed only a slight change in the overlapped fire severity and fire hazard areas (Table 16). In the Dubrava catchments, moderately low and moderately high severity classes still corresponded well with moderate (52.6% overlap) and high hazard classes (39.3% overlap), while in the Grebaštica catchment, the best match was again achieved for the low hazard class (89.61% overlap).
Table 16.
Fire severity classes (adapted from [114]) compared to fire hazard classes for the β = 20% case and the deviation from the initial values (for β = 0%).
In general, the change of priorities did not cause a significant change in the overall performance of the model.
4. Discussion
The main goal of this paper was to design a conceptual model that would enable fire hazard and fire risk assessment at a more detailed level, using moderate- to high-resolution data that were already available. Different fire risk assessment methodologies have been proposed and applied over the past decades, covering large, macro-scale regions (e.g., Canada, USA, Europe, Australia [2,22,24,27,31,116]). However, fire drivers as well as their possible consequences are still not adequately described at a finer resolution, capturing the heterogeneity of fire risk variables at the micro- or meso-scales. The extent of an area affected by fire plays an important role in determining the level of detail that needs to be addressed in a model itself and the data required for this assessment. The described conceptual model aims to assess the hazard and risk in the catchments that occupy areas that cannot be modeled using the global models currently available. However, micro- or meso-scale modeling requires data collected with an appropriate level of detail and spatial resolution that can describe various fire drivers’ characteristics, but they are difficult to acquire. Instead, coarse resolution data are often used. The spatial resolution of data governs the choice of an assessment model and significantly impact the results: coarse resolution data cannot capture the dynamics and heterogeneity of vegetation cover (fuels) and fail to accurately represent landscapes and variables that influence fire behavior [117]. The data used in our model were derived from publicly available databases, such as the Copernicus Land Monitoring Service, census, and satellite remote sensing data and disaggregated to a detail compliant with the extent of the study area and the analyzed fire events. This approach accounts for fire ignition and fire propagation and integrates governing fire hazard and fire risk components with the AHP hierarchical weighting scheme, resulting in a qualitative evaluation of hazards and risks.
In terms of fire ignition, the focus was solely on human ignition (intentional and deliberate). Areas that are susceptible to fire ignition are spatially closely related to residential areas and transport infrastructure. Zones of meeting or mixing with wildland vegetation were mapped as interface and intermix WUIs, respectively, based on the available LULC data, following the procedure adapted from [71,75]. Although the catchments were not densely populated, WUIs occupied approximately 20% of the Dubrava catchments and 30% of the Grebaštica catchment. At this point, LULC data, spatially improved with the IMD dataset, were classified only into three classes, built-up, woody vegetation, and other, assuming that any woody vegetation was equally prone to fire ignition while grassland and other (sparse) vegetation cover are not susceptible to fire ignition. Instead of classifying vegetation into the three described classes, vegetation may be classified with respect to the percentage of vegetation cover [118]. However, considering the surface and vegetation characteristics typical of a karst environment, we found the first approach more appropriate. Apart from residential areas (including industrial and commercial zones), an important factor in analyzing fire ignition is the vicinity of transport infrastructure. It evidently increases the propensity of fire ignition, but also depends on the surrounding LULC. The propensity to fire ignition is different for different LULCs and it is stronger in less impacted LULC regions [79]. In both catchments, a zonal buffer (Table 3) was created along the existing roads. With no traffic data available, traffic density was not taken into consideration at this point.
The spatial distribution, condition (in terms of moisture), and depth of the various fuel types are crucial to their fire behavior. Some studies used the CLC dataset to identify and classify various fuel types (e.g., [26,119]). As previously discussed, the spatial characteristics of the CLC dataset could not meet the meso-scale requirements of this study regarding spatial resolution. Instead, the more spatially detailed CZ dataset was used. Fuel type classification adopted from the EFFIS fuel classification scheme recognized ten aggregated classes of which four were mapped in the analyzed catchments (short grass, chaparral, brush, and hardwood litter). Similarly to the CLC, with a 250 m spatial resolution, the EFFIS dataset was too spatially coarse to be used, hence classification was applied on the available LULC data. Considering the size of the catchments, thematical detail provided by the EFFIS classification scheme [81] was found to be satisfactory. A far more critical parameter in assessing fire propagation was the fuel moisture content. Since the data were not available, we used the NDII as a qualitative indicator of the FMC status in the catchments. As expected, higher NDII values coincided with forest and woodland vegetation that were classified as highly susceptible to fire propagation. The FMC can also be considered through the dimensionless FWI, which is calculated as the combination of the initial spread index (ISI) and buildup index (BUI) [22]. Both the ISI and BUI were derived from the FMC components, i.e., Fine Fuel Moisture Code (FFMC), Duff Moisture Code (DMC), and Drought Code (DC), which were calculated from the weather observations of temperature, wind speed, relative humidity, and precipitation. The spatial distribution of the available FWI data could not capture the variability in the index within the catchments, so instead, uniform FWI values from two sources (the C3S and Croatian Meteorological and Hydrological Service) were adopted for both catchments. Based on the EFFIS classification scheme, the FWI susceptibility to fire propagation was evaluated as high.
Relief in both catchments was well developed. High-resolution DEM adequately captured variable terrain characteristics in terms of parameters that strongly influenced fire propagation, i.e., the slope, aspect, and concavity. Reinforced with a favorable wind direction, they can significantly impact the spread of fire in a certain direction. Weather variables, in general, are a critical factor in fire hazard and risk assessment. Commonly used variables analyzing the weather patterns that precede fire events are precipitation, air temperature, relative humidity, wind speed, and wind direction, all incorporated in the FWI.
The AHP is widely accepted and the most often used MCDA method for generating risk indices (e.g., [30,119,120]). The method effectively reduces the subjectivity of ranking alternatives and works well with a categorical domain. Various priorities of fire hazard components were tested and the combination with the lowest consistency ratio was selected. In comparison with fire severity, the results varied among the catchments. In the Dubrava catchments, the moderate hazard class spatially matched well with the moderately low severity class. For the low severity class, hazard was overestimated but underestimated for the high severity class. In the Grebaštica catchment, only the low hazard class corresponded well with the low severity class, but in areas with higher severity, fire hazard was underestimated.
Fire exposure/vulnerability were observed jointly, indicating elements exposed in vulnerable areas [22], through major risk components: ecosystem services, ecological values, population density, and assets. Instead of assigning a monetary value, all components were analyzed quantitatively, based on their significance. The highest vulnerability was assigned to people. Fires have a great impact on socioeconomic vulnerability, not only in terms of exposing people to physical injuries and loss of lives but also in terms of creating a significant stress that needs to be addressed when evaluating vulnerability. Ecological vulnerability was observed through ecological values and ecosystem services. Ecological values, presenting the benefits that biotic and abiotic components provide, were derived from the Natura 2000 sites. Assessing the ecosystem services was somewhat more complex, as they represent the contribution of ecosystems to society and to the economy [110]. The data needed were derived from the LULC data, which were based on the MAES classification and combined with the economic values provided by the ecosystem services [111]. In other words, ecosystem services were directly derived from the LULC map and linked to the INCA method for measuring ES potential of each LULC class.
The described approach integrates various indicators into components with a common domain which allows for the simple evaluation and assessment first of fire hazard and vulnerability, and finally, the risk. The final fire risk map showing categorical risk classes resulted from overlaying the fire hazard map with the vulnerability components. Assessing both fire hazard and fire risk is a difficult and complex task. Nevertheless, it is essential for designing fire management strategies, especially at the meso-scale level, and it requires more detailed insight into the driving factors and possible consequences that existing global models cannot provide.
With this model, we aimed to reduce the complexity of the procedures and the data needed to evaluate the hazard and risk in small, heterogenous catchments with a population density that was highly susceptible to seasonal (tourist) migration. It provides the basic information local authorities need to develop management plans and adaptation strategies.
There are potential limitations to the presented approach. First and foremost, it is a conceptual model that provides a conceptual description of fire-driving factors. A critical step in assessing a fire hazard is estimating the fuel moisture content. Remote sensing and qualitative analysis can provide various, easily accessible indicators that can be related to FMC but the future focus should be on providing high-resolution LFMC and DFMC data that will improve the model’s accuracy. Land surface temperature (LST) is another important environmental factor that contributes to fire susceptibility. Higher LST values are a result of overheating the ground surface and also depend on numerous factors such as air temperature, vegetation cover, incoming solar radiation, etc. At this stage, it was taken into consideration indirectly through indices used in assessing the fire hazard. A next step in improving the model is improving the spatial resolution of the currently available LST data (e.g., MODIS LST data at 1 km) and fitting the data into the proposed model.
Furthermore, exposure to people and hence vulnerability was analyzed as a static parameter. Coastline regions experience significant migrations during the summer months. The tourist season coincides with the fire season and it is necessary to take into consideration this increase in population density.
5. Conclusions
Wildfires are serious and an increasing threat, especially in fire-prone areas such as the Mediterranean, including the Croatian coastline. Small communities affected by wildfires are faced with the need to reduce the negative impacts of wildfire and improve communities’ resilience. The availability of high-resolution data is crucial. Most of the models that are available today provide fire risk information at relatively coarse spatial scales that cannot adequately meet the decision-making requirements at the local levels. The aforementioned EFFIS wildfire risk assessment provides fire risk maps based on data at 8 km spatial resolution. In the global assessment of wildfire risk, that is a sufficient level of detail; however, in terms of regional assessment, the information derived from such models is not sufficient.
The conceptual model used in the preliminary research described in this paper provides a tool that uses already available data and assesses fire risks without additional extensive measurements. It provides a decision-making tool adapted to risk assessment at smaller scales. However, it is not scale-dependent and can easily be adjusted to different scales, depending on the data available. Although it is based on the qualitative assessment of risk and its components, it is not limited by them and can be adjusted to quantitative assessment.
This preliminary research, despite its pinpointed limitations, provides a more detailed insight into the factors affecting fire ignition and behavior, and hence fire hazards as well as the vulnerability of anthropogenic and environmental factors that are essential for the decision-making process at the local level, and thus enables a better articulation of the mitigation strategies. Further improvement will be focused on collecting the high-quality and high quantity data needed to incorporate more sophisticated approaches such as applying ML methods.
Author Contributions
Conceptualization, B.H. and B.K.; methodology, B.H. and B.K.; software, B.H.; validation, B.H. and B.K.; formal analysis, B.H.; investigation, B.H.; resources, B.H. and B.K.; data curation, B.H.; writing—original draft preparation, B.H.; writing—review and editing, B.H. and B.K.; visualization, B.H.; project administration, B.K.; funding acquisition, B.K. All authors have read and agreed to the published version of the manuscript.
Funding
This research was fully supported by the University of Rijeka projects: uniri-technic-18-129 and uniri-technic-18-54, 23-67, and 23-74.
Data Availability Statement
The Coastal Zones land cover, Natura 2000 land cover, Urban Atlas land cover, Imperviousness Density, and Imperviousness Built-Up datasets from the Copernicus Land Monitoring Service are available at https://land.copernicus.eu/ (accessed on 21 September 2023). The Census 2021 data from the Croatian Bureau of Statistics are available at https://dzs.gov.hr/ (accessed on 21 September 2023). The Natura 2000 data from the Ministry of Economy and Regional Development are available at https://bioportal.hr/ (accessed on 20 March 2024).
Conflicts of Interest
The authors declare no conflicts of interest.
Appendix A
Table A1.
AHP pairwise comparison table (adapted from [107]).
Table A1.
AHP pairwise comparison table (adapted from [107]).
| Relative Importance Intensity | Definition | Description |
|---|---|---|
| 1 | Equal importance | Two activities contribute equally to the objective |
| 3 | Weak importance of one over another | Experience and judgement slightly favor one activity over another |
| 5 | Strong importance of one over another | Experience and judgement strongly favor one activity over another |
| 7 | Very strong importance of one over another | An activity is strongly favored and its dominance demonstrated |
| 9 | Absolute importance | The evidence favoring one activity over another is of the highest possible order or affirmation |
| 2, 4, 6, 8 | Intermediate values | When compromise is needed between two levels of importance |
Table A2.
Random consistency index (adapted from [107]).
Table A2.
Random consistency index (adapted from [107]).
| n | 1 | 2 | 3 | 4 | 5 | 6 | 7 | 8 | 9 | 10 |
|---|---|---|---|---|---|---|---|---|---|---|
| RI | 0 | 0 | 0.52 | 0.89 | 1.11 | 1.25 | 1.35 | 1.4 | 1.45 | 1.49 |
Table A3.
Supply estimates of seven ecosystem services from nine ecosystem types (adapted from [111]).
Table A3.
Supply estimates of seven ecosystem services from nine ecosystem types (adapted from [111]).
| Urban | Cropland | Grassland | Woodland and Forest | Wetland | Heathland | Sparsely Vegetated Areas | Rivers and Lakes | Marine Inlets and Transitional Waters | |
|---|---|---|---|---|---|---|---|---|---|
| Crop provision | 0 | 100% | 0 | 0 | 0 | 0 | 0 | 0 | 0 |
| Timber provision | 0 | 0 | 0 | 100 | 0 | 0 | 0 | 0 | 0 |
| Crop pollination | N/A * | 100% | N/A * | N/A * | 0 | N/A * | 0 | 0 | 0 |
| Carbon sequestration | 0 | 0 | 0 | 100 | 0 | 0 | 0 | N/A * | N/A * |
| Flood control | 0.6% | 6.2% | 19.2% | 69.8% | 2% | 2.2% | 0.01% | N/A * | N/A * |
| Water purification | 2% | 55.9% | 7.4% | 27.7% | 0.6% | 0.6% | 0.3% | 5.6% | N/A * |
| Nature-based recreation | 0.2% | 8.1% | 14.9% | 61% | 4.6% | 6.2% | 2.7% | 2% | 0.6% |
| Relative supply per ecosystem type | 0.7% | 35.8 % | 8.6% | 47.5% | 2.2% | 0.9% | 1.7% | 2.4% | 0.2% |
* N/A: not available.
Table A4.
Hazard comparison matrices.
Table A4.
Hazard comparison matrices.
| Alternatives vs. Attributes | |||||||
|---|---|---|---|---|---|---|---|
| Fuel Type | FMC | Slope | Aspect | Concavity | Priority | CR | |
| Fuel type | 1 | 0.33 | – | – | – | 0.25 | 0.7% |
| FMC | 3 | 1 | – | – | – | 0.75 | |
| Slope | – | – | 1 | 3 | 5 | 0.648 | 0.4% |
| Aspect | – | – | 0.33 | 1 | 2 | 0.23 | |
| Concavity | – | – | 0.2 | 0.5 | 1 | 0.122 | |
| FWI | |||||||
| Attributes vs. Objectives | |||||||
| Settlements | Roads | Fuels | Terrain | Weather | Priority | CR | |
| Settlements | 1 | 0.14 | – | – | – | 0.125 | 0.7% |
| Roads | 7 | 1 | – | – | – | 0.875 | |
| Fuels | – | – | 1 | 4 | 2 | 0.558 | 1.9% |
| Terrain | – | – | 0.25 | 1 | 0.33 | 0.122 | |
| Weather | – | – | 0.5 | 3 | 1 | 0.32 | |
Table A5.
Vulnerability comparison matrices.
Table A5.
Vulnerability comparison matrices.
| Alternatives vs. Attributes | ||||||
|---|---|---|---|---|---|---|
| Ecosystem Services | Ecological Value | Population | Assets | Priority | CR | |
| Ecosystem services | 1 | 0.5 | 0.11 | 0.5 | 0.061 | 1.7% |
| Ecological value | 2 | 1 | 0.11 | 1 | 0.102 | |
| Population | 9 | 9 | 1 | 7 | 0.729 | |
| Assets | 2 | 1 | 0.14 | 1 | 0.108 | |
References
- Wasserman, T.N.; Mueller, S.E. Climate Influences on Future Fire Severity: A Synthesis of Climate-Fire Interactions and Impacts on Fire Regimes, High-Severity Fire, and Forests in the Western United States. Fire Ecol. 2023, 19, 43. [Google Scholar] [CrossRef]
- OECD. Taming Wildfires in the Context of Climate Change; OECD: Paris, France, 2023; ISBN 9789264609211. [Google Scholar]
- UNEP. Spreading Like Wildfire—The Rising Threat of Extraordinary Landscape Fires; UNEP: Nairobi, Kenya, 2022. [Google Scholar]
- Soulis, K.X.; Generali, K.A.; Papadaki, C.; Theodoropoulos, C.; Psomiadis, E. Hydrological Response of Natural Mediterranean Watersheds to Forest Fires. Hydrology 2021, 8, 15. [Google Scholar] [CrossRef]
- Stoof, C.R.; Vervoort, R.W.; Iwema, J.; van den Elsen, E.; Ferreira, A.J.D.; Ritsema, C.J. Hydrological Response of a Small Catchment Burned by Experimental Fire. Hydrol. Earth Syst. Sci. 2012, 16, 267–285. [Google Scholar] [CrossRef]
- Versini, P.-A.; Velasco, M.; Cabello, A.; Sempere-Torres, D. Hydrological Impact of Forest Fires and Climate Change in a Mediterranean Basin. Nat. Hazards 2013, 66, 609–628. [Google Scholar] [CrossRef]
- Leopardi, M.; Scorzini, A. Effects of Wildfires on Peak Discharges in Watersheds. IForest 2015, 8, 302–307. [Google Scholar] [CrossRef]
- Hrelja, I.; Šestak, I.; Bogunović, I. Wildfire Impacts on Soil Physical and Chemical Properties—A Short Review of Recent Studies. Agric. Conspec. Sci. 2020, 85, 293–301. [Google Scholar]
- Wang, J.; Song, W.; Zheng, H.; Telesca, L. Temporal Scaling Behavior of Human-Caused Fires and Their Connection to Relative Humidity of the Atmosphere. Ecol. Model. 2010, 221, 85–89. [Google Scholar] [CrossRef]
- Tedim, F.; Xanthopoulos, G.; Leone, V. Forest Fires in Europe. In Wildfire Hazards, Risks and Disasters; Elsevier: Amsterdam, The Netherlands, 2015; pp. 77–99. [Google Scholar]
- van Oldenborgh, G.J.; Krikken, F.; Lewis, S.; Leach, N.J.; Lehner, F.; Saunders, K.R.; van Weele, M.; Haustein, K.; Li, S.; Wallom, D.; et al. Attribution of the Australian Bushfire Risk to Anthropogenic Climate Change. Nat. Hazards Earth Syst. Sci. 2021, 21, 941–960. [Google Scholar] [CrossRef]
- Calvin, K.; Dasgupta, D.; Krinner, G.; Mukherji, A.; Thorne, P.W.; Trisos, C.; Romero, J.; Aldunce, P.; Barrett, K.; Blanco, G.; et al. IPCC, 2023: Climate Change 2023: Synthesis Report. Contribution of Working Groups I, II and III to the Sixth Assessment Report of the Intergovernmental Panel on Climate Change; Core Writing Team, Lee, H., Romero, J., Eds.; IPCC: Geneva, Switzerland, 2023. [Google Scholar]
- Sungmin, O.; Hou, X.; Orth, R. Observational Evidence of Wildfire-Promoting Soil Moisture Anomalies. Sci. Rep. 2020, 10, 11008. [Google Scholar] [CrossRef] [PubMed]
- Krueger, E.S.; Levi, M.R.; Achieng, K.O.; Bolten, J.D.; Carlson, J.D.; Coops, N.C.; Holden, Z.A.; Magi, B.I.; Rigden, A.J.; Ochsner, T.E. Using Soil Moisture Information to Better Understand and Predict Wildfire Danger: A Review of Recent Developments and Outstanding Questions. Int. J. Wildland Fire 2022, 32, 111–132. [Google Scholar] [CrossRef]
- Veraverbeke, S.; Rogers, B.M.; Goulden, M.L.; Jandt, R.R.; Miller, C.E.; Wiggins, E.B.; Randerson, J.T. Lightning as a Major Driver of Recent Large Fire Years in North American Boreal Forests. Nat. Clim. Chang. 2017, 7, 529–534. [Google Scholar] [CrossRef]
- Boyer, E.W.; Wagenbrenner, J.W.; Zhang, L. Wildfire and Hydrological Processes. Hydrol. Process 2022, 36, e14640. [Google Scholar] [CrossRef]
- Singh, S. Forest Fire Emissions: A Contribution to Global Climate Change. Front. For. Glob. Change 2022, 5, 925480. [Google Scholar] [CrossRef]
- Szpakowski, D.; Jensen, J. A Review of the Applications of Remote Sensing in Fire Ecology. Remote Sens. 2019, 11, 2638. [Google Scholar] [CrossRef]
- San-Miguel-Ayanz, J.; Durrant, T.; Boca, R.; Libertà, G.; Branco, A.; de Rigo, D.; Ferrari, D.; Maianti, P.; Vivancos, T.A.; Costa, H.; et al. Forest Fires in Europe, Middle East and North Africa 2017; European Commission, Joint Research Centre, Publication Office: Luxemburg, 2017. [Google Scholar]
- San-Miguel-Ayanz, J.; Durrant, T.; Boca, R.; Maianti, P.; Libertá, G.; Oom, D.; Branco, A.; de Rigo, D.; Suarez-Moreno, M.; Ferrari, D.; et al. Forest Fires in Europe, Middle East and North Africa 2022; European Commission, Joint Research Centre, Publication Office: Luxembourg, 2023. [Google Scholar]
- Hrenović, J.; Kisić, I.; Delač, D.; Durn, G.; Bogunović, I.; Mikulec, M.; Pereira, P. Short-Term Effects of Experimental Fire on Physicochemical and Microbial Properties of a Mediterranean Cambisol. Fire 2023, 6, 155. [Google Scholar] [CrossRef]
- Oom, D.; de Rigo, D.; Pfeiffer, H.; Branco, A.; Ferrari, D.; Grecchi, R.; Artés-Vivancos, T.; Houston Durrant, T.; Boca, R.; Maianti, P.; et al. Pan-European Wildfire Risk Assessment; EUR 31160 EN; Publication Office of the European Union: Luxembourg, 2022. [Google Scholar]
- European Union, 1995–2024 European Forest Fire Information System (EFFIS). Available online: https://effis.jrc.ec.europa.eu/apps/effis.statistics/estimates (accessed on 10 January 2024).
- Chuvieco, E.; Yebra, M.; Martino, S.; Thonicke, K.; Gómez-Giménez, M.; San-Miguel, J.; Oom, D.; Velea, R.; Mouillot, F.; Molina, J.R.; et al. Towards an Integrated Approach to Wildfire Risk Assessment: When, Where, What and How May the Landscapes Burn. Fire 2023, 6, 215. [Google Scholar] [CrossRef]
- Tagarev, T.; Papadopoulos, G.A.; Hagenlocher, M.; Sliuzas, R.; Ishiwatari, M.; Gallego, E. Integrating the Risk Management Cycle. In Science for Disaster Risk Management 2020: Acting Today, Protecting Tomorrow; Casajus Valles, A., Marin Ferrer, M., Poljanšek, K., Clark, I., Eds.; Publications Office of the European Union: Luxembourg, 2020. [Google Scholar]
- Trucchia, A.; Meschi, G.; Fiorucci, P.; Provenzale, A.; Tonini, M.; Pernice, U. Wildfire Hazard Mapping in the Eastern Mediterranean Landscape. Int. J. Wildland Fire 2023, 32, 417–434. [Google Scholar] [CrossRef]
- Meng, Y.; Deng, Y.; Shi, P. Mapping Forest Wildfire Risk of the World. In World Atlas Natural Disaster Risk; Shi, P., Kasperson, R., Eds.; Springer: Berling/Heidelberg, Germany, 2015; pp. 261–275. [Google Scholar] [CrossRef]
- IPCC. Managing the Risks of Extreme Events and Disasters to Advance Climate Change Adaptation. A Special Report of Working Groups I and II of the Intergovernmental Panel on Climate Change; Field, C.B., Barros, V., Stocker, T.F., Qin, D., Dokken, D.J., Ebi, K.L., Mastrandrea, M.D., Mach, K.J., Plattner, G.-K., Allen, S.K., et al., Eds.; Cambridge University Press: Cambridge, UK; New York, NY, USA, 2012. [Google Scholar]
- Marquez Torres, A.; Signorello, G.; Kumar, S.; Adamo, G.; Villa, F.; Balbi, S. Fire Risk Modeling: An Integrated and Data-Driven Approach Applied to Sicily. Nat. Hazards Earth Syst. Sci. 2023, 23, 2937–2959. [Google Scholar] [CrossRef]
- Maniatis, Y.; Doganis, A.; Chatzigeorgiadis, M. Fire Risk Probability Mapping Using Machine Learning Tools and Multi-Criteria Decision Analysis in the GIS Environment: A Case Study in the National Park Forest Dadia-Lefkimi-Soufli, Greece. Appl. Sci. 2022, 12, 2938. [Google Scholar] [CrossRef]
- Keane, R.E.; Drury, S.A.; Karau, E.C.; Hessburg, P.F.; Reynolds, K.M. A Method for Mapping Fire Hazard and Risk across Multiple Scales and Its Application in Fire Management. Ecol. Model. 2010, 221, 2–18. [Google Scholar] [CrossRef]
- Salis, M.; Ager, A.A.; Arca, B.; Finney, M.A.; Bacciu, V.; Duce, P.; Spano, D. Assessing Exposure of Human and Ecological Values to Wildfire in Sardinia, Italy. Int. J. Wildland Fire 2013, 22, 549. [Google Scholar] [CrossRef]
- Müller, M.M.; Vilà-Vilardell, L.; Vacik, H. Towards an Integrated Forest Fire Danger Assessment System for the European Alps. Ecol. Inf. 2020, 60, 101151. [Google Scholar] [CrossRef]
- Hessburg, P.F.; Reynolds, K.M.; Keane, R.E.; James, K.M.; Salter, R.B. Evaluating Wildland Fire Danger and Prioritizing Vegetation and Fuels Treatments. Ecol. Manag. 2007, 247, 1–17. [Google Scholar] [CrossRef]
- Gigović, L.; Jakovljević, G.; Sekulović, D.; Regodić, M. GIS Multi-Criteria Analysis for Identifying and Mapping Forest Fire Hazard: Nevesinje, Bosnia and Herzegovina. Teh. Vjesn.-Tech. Gaz. 2018, 25, 891–897. [Google Scholar] [CrossRef]
- Chuvieco, E.; Aguado, I.; Jurdao, S.; Pettinari, M.L.; Yebra, M.; Salas, J.; Hantson, S.; de la Riva, J.; Ibarra, P.; Rodrigues, M.; et al. Integrating Geospatial Information into Fire Risk Assessment. Int. J. Wildland Fire 2014, 23, 606. [Google Scholar] [CrossRef]
- Noori, S.; Mohammadi, A.; Miguel Ferreira, T.; Ghaffari Gilandeh, A.; Mirahmadzadeh Ardabili, S.J. Modelling and Mapping Urban Vulnerability Index against Potential Structural Fire-Related Risks: An Integrated GIS-MCDM Approach. Fire 2023, 6, 107. [Google Scholar] [CrossRef]
- Thompson, M.P.; Scott, J.; Helmbrecht, D.; Calkin, D.E. Integrated Wildfire Risk Assessment: Framework Development and Application on the Lewis and Clark National Forest in Montana, USA. Integr. Environ. Assess. Manag. 2013, 9, 329–342. [Google Scholar] [CrossRef]
- Ju, W.; Xing, Z.; Wu, J.; Kang, Q. Evaluation of Forest Fire Risk Based on Multicriteria Decision Analysis Techniques for Changzhou, China. Int. J. Disaster Risk Reduct. 2023, 98, 104082. [Google Scholar] [CrossRef]
- Dunn, C.J.; O’Connor, C.D.; Abrams, J.; Thompson, M.P.; Calkin, D.E.; Johnston, J.D.; Stratton, R.; Gilbertson-Day, J. Wildfire Risk Science Facilitates Adaptation of Fire-Prone Social-Ecological Systems to the New Fire Reality. Environ. Res. Lett. 2020, 15, 025001. [Google Scholar] [CrossRef]
- Jain, P.; Coogan, S.C.P.; Subramanian, S.G.; Crowley, M.; Taylor, S.; Flannigan, M.D. A Review of Machine Learning Applications in Wildfire Science and Management. Environ. Rev. 2020, 28, 478–505. [Google Scholar] [CrossRef]
- Chuvieco, E.; Pettinari, M.L.; Koutsias, N.; Forkel, M.; Hantson, S.; Turco, M. Human and Climate Drivers of Global Biomass Burning Variability. Sci. Total Environ. 2021, 779, 146361. [Google Scholar] [CrossRef] [PubMed]
- Hong, H.; Tsangaratos, P.; Ilia, I.; Liu, J.; Zhu, A.-X.; Xu, C. Applying Genetic Algorithms to Set the Optimal Combination of Forest Fire Related Variables and Model Forest Fire Susceptibility Based on Data Mining Models. The Case of Dayu County, China. Sci. Total Environ. 2018, 630, 1044–1056. [Google Scholar] [CrossRef] [PubMed]
- Singh, K.R.; Neethu, K.P.; Madhurekaa, K.; Harita, A.; Mohan, P. Parallel SVM Model for Forest Fire Prediction. Soft Comput. Lett. 2021, 3, 100014. [Google Scholar] [CrossRef]
- Li, Y.; Feng, Z.; Chen, S.; Zhao, Z.; Wang, F. Application of the Artificial Neural Network and Support Vector Machines in Forest Fire Prediction in the Guangxi Autonomous Region, China. Discret. Dyn. Nat. Soc. 2020, 2020, 5612650. [Google Scholar] [CrossRef]
- Tan, C.; Feng, Z. Mapping Forest Fire Risk Zones Using Machine Learning Algorithms in Hunan Province, China. Sustainability 2023, 15, 6292. [Google Scholar] [CrossRef]
- Kondylatos, S.; Prapas, I.; Ronco, M.; Papoutsis, I.; Camps-Valls, G.; Piles, M.; Fernández-Torres, M.; Carvalhais, N. Wildfire Danger Prediction and Understanding with Deep Learning. Geophys. Res. Lett. 2022, 49, e2022GL099368. [Google Scholar] [CrossRef]
- Hai, T.; Theruvil Sayed, B.; Majdi, A.; Zhou, J.; Sagban, R.; Band, S.S.; Mosavi, A. An Integrated GIS-Based Multivariate Adaptive Regression Splines-Cat Swarm Optimization for Improving the Accuracy of Wildfire Susceptibility Mapping. Geocarto Int. 2023, 38, 2167005. [Google Scholar] [CrossRef]
- Umunnakwe, A.; Parvania, M.; Nguyen, H.; Horel, J.D.; Davis, K.R. Data-Driven Spatio-Temporal Analysis of Wildfire Risk to Power Systems Operation. IET Gener. Transm. Distrib. 2022, 16, 2531–2546. [Google Scholar] [CrossRef]
- Khalid, R.; Khan, U.T. A Comparison of Multi-Criteria and Machine Learning Weighting for Flood Risk Assessment in the Southern Ontario, Canada. In Proceedings of the EGU General Assembly 2022, Vienna, Austria, 23–27 May 2022. [Google Scholar]
- Vojtek, M.; Vojteková, J.; Costache, R.; Pham, Q.B.; Lee, S.; Arshad, A.; Sahoo, S.; Linh, N.T.T.; Anh, D.T. Comparison of Multi-Criteria-Analytical Hierarchy Process and Machine Learning-Boosted Tree Models for Regional Flood Susceptibility Mapping: A Case Study from Slovakia. Geomat. Nat. Hazards Risk 2021, 12, 1153–1180. [Google Scholar] [CrossRef]
- Khuc, T.D.; Truong, X.Q.; Tran, V.A.; Bui, D.Q.; Bui, D.P.; Ha, H.; Tran, T.H.M.; Pham, T.T.T.; Yordanov, V. Comparison of Multi-Criteria Decision Making, Statistics, and Machine Learning Models for Landslide Susceptibility Mapping in Van Yen District, Yen Bai Province, Vietnam. Int. J. Geoinform. 2023, 19, 33–45. [Google Scholar] [CrossRef]
- Kumar, R.; Dwivedi, S.B.; Gaur, S. A Comparative Study of Machine Learning and Fuzzy-AHP Technique to Groundwater Potential Mapping in the Data-Scarce Region. Comput. Geosci. 2021, 155, 104855. [Google Scholar] [CrossRef]
- Krušić, J.; Marjanović, M.; Samardžić-Petrović, M.; Abolmasov, B.; Andrejev, K.; Miladinović, A. Comparison of Expert, Deterministic and Machine Learning Approach for Landslide Susceptibility Assessment in Ljubovija Municipality, Serbia. Geofizika 2017, 34, 251–273. [Google Scholar] [CrossRef]
- Bera, S.; Das, A.; Mazumder, T. Evaluation of Machine Learning, Information Theory and Multi-Criteria Decision Analysis Methods for Flood Susceptibility Mapping under Varying Spatial Scale of Analyses. Remote Sens. Appl. 2022, 25, 100686. [Google Scholar] [CrossRef]
- Gajić-Čapka, M.; Patarčić, M.; Perčec Tadić, M.; Srnec, L.; Zaninović, K. Spatial Distribution of Average Annual Air Temperature and Rainfall in Croatia (Prostorna Raspodjela Srednje Godišnje Temperature Zraka i Količine Oborina u Hrvatskoj). In Proceedings of the 3rd Croatian Water Conference: Croatia in 21st Century, Osijek, Croatia, 28–31 May 2003; Gereš, D., Ed.; Hrvatske Vode: Osijek, Croatia, 2003; pp. 75–81. [Google Scholar]
- Gajić-Čapka, M.; Perčic Tadić, M.; Patarčić, M. Digital Annual Precipitation Map of Croatia (Digitalna Oborinska Karta Hrvatske). Croat. Meteorol. J. 2003, 38, 21–33. [Google Scholar]
- EEA. CORINE Land Cover: Product User Manual (Version 1.0); European Union, Copernicus Land Monitoring Service, European Environmental Agency (EEA): Copenhagen, Denmark, 2021. [Google Scholar]
- GeoVille. Lot1: Imperviousness 2018, Imperviousness Change 2015–2018 and Built-Up 2018, User Manual. 2018. Available online: https://land.copernicus.eu/en/products/high-resolution-layer-imperviousness/imperviousness-change-2015-2018 (accessed on 6 June 2024).
- DZS. Census of Population, Households and Dwellings 2021. First Results by Settlements. Statistical Report; Croatian Bureau of Statistics: Zagreb, Croatia, 2022. [Google Scholar]
- Horvat, B.; Krvavica, N. Disaggregation of the Copernicus Land Use/Land Cover (LULC) and Population Density Data to Fit Mesoscale Flood Risk Assessment Requirements in Partially Urbanized Catchments in Croatia. Land 2023, 12, 2014. [Google Scholar] [CrossRef]
- Keeley, J.E. Fire Intensity, Fire Severity and Burn Severity: A Brief Review and Suggested Usage. Int. J. Wildland Fire 2009, 18, 116. [Google Scholar] [CrossRef]
- Miller, J.D.; Thode, A.E. Quantifying Burn Severity in a Heterogeneous Landscape with a Relative Version of the Delta Normalized Burn Ratio (DNBR). Remote Sens. Environ. 2007, 109, 66–80. [Google Scholar] [CrossRef]
- Key, C.H.; Benson, N.C. Landscape Assessment (LA): Sampling and Analysis Methods. 2006. Available online: http://gsp.humboldt.edu/OLM/Courses/GSP_216/labs/rmrs_gtr164_13_land_assess.pdf (accessed on 6 June 2024).
- FirEUrisk Project FirEUrisk. Available online: https://fireurisk.eu/ (accessed on 7 January 2024).
- Davis, J.B. The Wildland-Urban Interface: Paradise or Battleground? J. For. 1990, 88, 26–31. [Google Scholar] [CrossRef]
- Radeloff, V.C.; Hammer, R.B.; Stewart, S.I.; Fried, J.S.; Holcomb, S.S.; McKeefry, J.F. The Wildland-Urban Interface in the United States. Ecol. Appl. 2005, 15, 799–805. [Google Scholar] [CrossRef]
- Kumar, M.; Li, S.; Nguyen, P.; Banerjee, T. Examining the Existing Definitions of Wildland-urban Interface for California. Ecosphere 2022, 13, e4306. [Google Scholar] [CrossRef]
- USDI; USDA. Federal Wildland Fire Management: Policy and Program Review, Final Report; United Stated Department of Interior, United States Department of Agriculture: Washington, DC, USA, 1995. [Google Scholar]
- Del Giudice, L.; Arca, B.; Scarpa, C.; Pellizzaro, G.; Duce, P.; Salis, M. The Wildland-Anthropic Interface Raster Data of the Italy–France Maritime Cooperation Area (Sardinia, Corsica, Tuscany, Liguria, and Provence-Alpes-Côte d’Azur). Data Brief 2021, 38, 107355. [Google Scholar] [CrossRef] [PubMed]
- Bar-Massada, A.; Alcasena, F.; Schug, F.; Radeloff, V.C. The Wildland—Urban Interface in Europe: Spatial Patterns and Associations with Socioeconomic and Demographic Variables. Landsc. Urban. Plan. 2023, 235, 104759. [Google Scholar] [CrossRef]
- Mitsopoulos, I.; Mallinis, G.; Dimitrakopoulos, A.; Xanthopoulos, G.; Eftychidis, G.; Goldammer, J.G. Vulnerability of Peri-urban and Residential Areas to Landscape Fires in Greece: Evidence by Wildland-Urban Interface Data. Data Brief 2020, 31, 106025. [Google Scholar] [CrossRef] [PubMed]
- Modugno, S.; Balzter, H.; Cole, B.; Borrelli, P. Mapping Regional Patterns of Large Forest Fires in Wildland–Urban Interface Areas in Europe. J. Environ. Manag. 2016, 172, 112–126. [Google Scholar] [CrossRef]
- Radeloff, V.C.; Helmers, D.P.; Kramer, H.A.; Mockrin, M.H.; Alexandre, P.M.; Bar-Massada, A.; Butsic, V.; Hawbaker, T.J.; Martinuzzi, S.; Syphard, A.D.; et al. Rapid Growth of the US Wildland-Urban Interface Raises Wildfire Risk. Proc. Natl. Acad. Sci. USA 2018, 115, 3314–3319. [Google Scholar] [CrossRef] [PubMed]
- Carlson, A.R.; Helmers, D.P.; Hawbaker, T.J.; Mockrin, M.H.; Radeloff, V.C. The Wildland–Urban Interface in the United States Based on 125 Million Building Locations. Ecol. Appl. 2022, 32, e2597. [Google Scholar] [CrossRef] [PubMed]
- Cohen, J.D. Preventing Disaster: Home Ignitability in the Wildland-Urban Interface. J. For. 2000, 98, 15–21. [Google Scholar] [CrossRef]
- Tikotzki, I.; Bar-Massada, A.; Levin, N. A Geographically Flexible Approach for Mapping the Wildland-Urban Interface Integrating Fire Activity Data. Front. Environ. Sci. 2023, 11, 1231490. [Google Scholar] [CrossRef]
- Ye, J.; Wu, M.; Deng, Z.; Xu, S.; Zhou, R.; Clarke, K.C. Modeling the Spatial Patterns of Human Wildfire Ignition in Yunnan Province, China. Appl. Geogr. 2017, 89, 150–162. [Google Scholar] [CrossRef]
- Ricotta, C.; Bajocco, S.; Guglietta, D.; Conedera, M. Assessing the Influence of Roads on Fire Ignition: Does Land Cover Matter? Fire 2018, 1, 24. [Google Scholar] [CrossRef]
- Romero-Calcerrada, R.; Novillo, C.J.; Millington, J.D.A.; Gomez-Jimenez, I. GIS Analysis of Spatial Patterns of Human-Caused Wildfire Ignition Risk in the SW of Madrid (Central Spain). Landsc. Ecol. 2008, 23, 341–354. [Google Scholar] [CrossRef]
- EFFIS. European Fuel Map, 2017, Based on JRC Contract Number 384347 on the “Development of a European Fuel Map”. European Union, Copernicus Land Monitoring Service. 2017. Available online: https://forest-fire.emergency.copernicus.eu/applications/data-and-services (accessed on 15 January 2024).
- Albini, F.A. Estimating Wildfire Behavior and Effects; Gen. Tech. Rep. INT-GTR-30; Department of Agriculture, Forest Service, Intermountain Forest and Range Experiment Station: Ogden, UT, USA, 1976. [Google Scholar]
- Anderson, H.E. Aids to Determining Fuel Models for Estimating Fire Behavior; Gen. Tech. Rep. INT-GTR-122; US Department of Agriculture, Forest Service, Intermountain Forest and Range Experiment Station: Ogden, UT, USA, 1982. [Google Scholar]
- Qi, Y.; Dennison, P.E.; Spencer, J.; Riaño, D. Monitoring Live Fuel Moisture Using Soil Moisture and Remote Sensing Proxies. Fire Ecol. 2012, 8, 71–87. [Google Scholar] [CrossRef]
- Bakšić, N.; Bakšić, D.; Jazbec, A. Hourly Fine Fuel Moisture Model for Pinus Halepensis (Mill.) Litter. Agric. Meteorol. 2017, 243, 93–99. [Google Scholar] [CrossRef]
- Bakšić, N.; Bakšić, D. Predicting the Fine Fuel Moisture Content in Dalmatian Black Pine Needle Litter. Int. J. Wildland Fire 2022, 31, 708–719. [Google Scholar] [CrossRef]
- Aguado, I.; Chuvieco, E.; Borén, R.; Nieto, H. Estimation of Dead Fuel Moisture Content from Meteorological Data in Mediterranean Areas. Applications in Fire Danger Assessment. Int. J. Wildland Fire 2007, 16, 390. [Google Scholar] [CrossRef]
- Quan, X.; Yebra, M.; Riaño, D.; He, B.; Lai, G.; Liu, X. Global Fuel Moisture Content Mapping from MODIS. Int. J. Appl. Earth Obs. Geoinf. 2021, 101, 102354. [Google Scholar] [CrossRef]
- Dragozi, E.; Giannaros, T.M.; Kotroni, V.; Lagouvardos, K.; Koletsis, I. Dead Fuel Moisture Content (DFMC) Estimation Using MODIS and Meteorological Data: The Case of Greece. Remote Sens. 2021, 13, 4224. [Google Scholar] [CrossRef]
- Marino, E.; Yebra, M.; Guillén-Climent, M.; Algeet, N.; Tomé, J.L.; Madrigal, J.; Guijarro, M.; Hernando, C. Investigating Live Fuel Moisture Content Estimation in Fire-Prone Shrubland from Remote Sensing Using Empirical Modelling and RTM Simulations. Remote Sens. 2020, 12, 2251. [Google Scholar] [CrossRef]
- Nolan, R.H.; Resco de Dios, V.; Boer, M.M.; Caccamo, G.; Goulden, M.L.; Bradstock, R.A. Predicting Dead Fine Fuel Moisture at Regional Scales Using Vapour Pressure Deficit from MODIS and Gridded Weather Data. Remote Sens. Environ. 2016, 174, 100–108. [Google Scholar] [CrossRef]
- Xie, J.; Qi, T.; Hu, W.; Huang, H.; Chen, B.; Zhang, J. Retrieval of Live Fuel Moisture Content Based on Multi-Source Remote Sensing Data and Ensemble Deep Learning Model. Remote Sens. 2022, 14, 4378. [Google Scholar] [CrossRef]
- García, M.; Riaño, D.; Yebra, M.; Salas, J.; Cardil, A.; Monedero, S.; Ramirez, J.; Martín, M.P.; Vilar, L.; Gajardo, J.; et al. A Live Fuel Moisture Content Product from Landsat TM Satellite Time Series for Implementation in Fire Behavior Models. Remote Sens. 2020, 12, 1714. [Google Scholar] [CrossRef]
- Chuvieco, E.; Cocero, D.; Aguado, I.; Palacios, A.; Prado, E. Improving Burning Efficiency Estimates through Satellite Assessment of Fuel Moisture Content. J. Geophys. Res. Atmos. 2004, 109, D14S07. [Google Scholar] [CrossRef]
- Zormpas, K.; Vasilakos, C.; Athanasis, N.; Soulakellis, N.; Kalabokidis, K. Dead Fuel Moisture Content Estimation Using Remote Sensing. Eur. J. Geogr. 2017, 8, 17–32. [Google Scholar]
- Costa-Saura, J.M.; Balaguer-Beser, Á.; Ruiz, L.A.; Pardo-Pascual, J.E.; Soriano-Sancho, J.L. Empirical Models for Spatio-Temporal Live Fuel Moisture Content Estimation in Mixed Mediterranean Vegetation Areas Using Sentinel-2 Indices and Meteorological Data. Remote Sens. 2021, 13, 3726. [Google Scholar] [CrossRef]
- Yebra, M.; Dennison, P.E.; Chuvieco, E.; Riaño, D.; Zylstra, P.; Hunt, E.R.; Danson, F.M.; Qi, Y.; Jurdao, S. A Global Review of Remote Sensing of Live Fuel Moisture Content for Fire Danger Assessment: Moving towards Operational Products. Remote Sens. Environ. 2013, 136, 455–468. [Google Scholar] [CrossRef]
- Roberts, D.A.; Dennison, P.E.; Peterson, S.; Sweeney, S.; Rechel, J. Evaluation of Airborne Visible/Infrared Imaging Spectrometer (AVIRIS) and Moderate Resolution Imaging Spectrometer (MODIS) Measures of Live Fuel Moisture and Fuel Condition in a Shrubland Ecosystem in Southern California. J. Geophys. Res. Biogeosci 2006, 111, G04S02. [Google Scholar] [CrossRef]
- Jurdao, S.; Yebra, M.; Guerschman, J.P.; Chuvieco, E. Regional Estimation of Woodland Moisture Content by Inverting Radiative Transfer Models. Remote Sens. Environ. 2013, 132, 59–70. [Google Scholar] [CrossRef]
- Hardisky, M.A.; Klemas, V.; Smart, R.M. The Influence of Soil Salinity, Growth Form, and Leaf Moisture on the Spectral Radiance of Spartina Alterniflora Canopies. Photogramm. Eng. Remote Sens. 1983, 49, 77–83. [Google Scholar]
- Rothermel, R.C. How to Predict the Spread and Intensity of Forest and Range Fires. General Technical Report INT-143; US Department of Agriculture, Forest Service, Intermountain Forest and Range Experiment Station: Ogden, UT, USA, 1983. [Google Scholar]
- San-Miguel-Ayanz, J.; Costa, H.; de Rigo, D.; Libertà, G.; Vivancos, T.A.; Durrant, T.; Nuijten, D.; Löffler, P.; Moore, P. Basic Criteria to Assess Wildfire Risk at the Pan-European Level; EUR 29500 EN; Publications Office of the European Union: Luxembourg, 2018. [Google Scholar]
- DHMZ. Meteorological and Hydrological Bulletin 7/2019; DHMZ: Zagreb, Croatia, 2019. [Google Scholar]
- DHMZ. Meteorological and Hydrological Bulletin 7/2023; DHMZ: Zagreb, Croatia, 2023. [Google Scholar]
- Fire Danger Indicators for Europe from 1970 to 2098 Derived from Climate Projections. Available online: https://climate.copernicus.eu/ (accessed on 25 March 2024).
- Malczewski, J. Local Weighted Linear Combination. Trans. GIS 2011, 15, 439–455. [Google Scholar] [CrossRef]
- Saaty, T.L. The Analytic Hierarchy Process; McGraw-Hill: New York, NY, USA, 1980. [Google Scholar]
- Malczewski, J. GIS and Multicriteria Decision Analysis; John Wiley & Sons, Inc.: New York, NY, USA, 1999. [Google Scholar]
- AZO. Mapping and Assessment of Ecosystems and Their Services in Croatia (Kartiranje i Procjena Ekosustava i Njihovih Usluga u Hrvatskoj); AZO: Zagreb, Croatia, 2015. [Google Scholar]
- La Notte, A.; Vallecillo, S.; Garcia-Bendito, E.; Grammatikopoulou, I.; Czùcz, B.; Ferrini, S.; Grizzetti, B.; Rega, C.; Herrando, S.; Villero, D.; et al. Ecosystem Services Accounting—Part III—Pilot Accounts for Habitat and Species Maintenance, on-Site Soil Retention and Water Purification; EUR 30856 EN; Publications Office of the European Union: Luxembourg, 2021. [Google Scholar]
- Vysna, V.; Maes, J.; Petersen, J.E.; La Notte, A.; Vallecillo, S.; Aizpurua, N.; Ivits, E.; Teller, A. Accounting for Ecosystems and Their Services in the European Union (INCA). Final Report from Phase II of the INCA Project Aiming to Develop a Pilot for an Integrated System of Ecosystem Accounts for the EU; Statistical Report; EU: Luxembourg, 2021. [Google Scholar]
- La Notte, A.; Vallecillo, S.; Grammatikopoulou, I.; Polce, C.; Rega, C.; Zulian, G.; Kakoulaki, G.; Grizzetti, B.; Ferrini, S.; Zurbaran-Nucci, M.; et al. The Integrated System for Natural Capital Accounting (INCA) in Europe: Twelve Lessons Learned from Empirical Ecosystem Service Accounting. One Ecosyst. 2022, 7, e84925. [Google Scholar] [CrossRef]
- Szpakowski, D.M.; Jensen, J.L.R.; Butler, D.R.; Chow, T.E. A Study of the Relationship between Fire Hazard and Burn Severity in Grand Teton National Park, USA. Int. J. Appl. Earth Obs. Geoinf. 2021, 98, 102305. [Google Scholar] [CrossRef]
- Key, C.H.; Benson, N.C. Landscape Assessment: Ground Measure of Severity, the Composite Burn Index, and Remote Sensing of Severity, the Normalized Burn Ratio. In FIREMON: Fire Effects Monitoring and Inventory System; Gen. Tech. Rep. RMRS-GTR-164-CD; U.S. Department of Agriculture, Forest Service, Rocky Mountain Research Station: Fort Collins, CO, USA, 2006; p. LA-1-55. Available online: https://www.fs.usda.gov/research/treesearch/24066 (accessed on 11 October 2023).
- Triantaphyllou, E.; Sánchez, A. A Sensitivity Analysis Approach for Some Deterministic Multi-Criteria Decision-Making Methods. Decis. Sci. 1997, 28, 151–194. [Google Scholar] [CrossRef]
- Pandey, P.; Huidobro, G.; Lopes, L.F.; Ganteaume, A.; Ascoli, D.; Colaco, C.; Xanthopoulos, G.; Giannaros, T.M.; Gazzard, R.; Boustras, G.; et al. A Global Outlook on Increasing Wildfire Risk: Current Policy Situation and Future Pathways. Trees For. People 2023, 14, 100431. [Google Scholar] [CrossRef]
- Taneja, R.; Hilton, J.; Wallace, L.; Reinke, K.; Jones, S. Effect of Fuel Spatial Resolution on Predictive Wildfire Models. Int. J. Wildland Fire 2021, 30, 776–789. [Google Scholar] [CrossRef]
- Hanberry, B. Reclassifying the Wildland–Urban Interface Using Fire Occurrences for the United States. Land 2020, 9, 225. [Google Scholar] [CrossRef]
- Busico, G.; Giuditta, E.; Kazakis, N.; Colombani, N. A Hybrid GIS and AHP Approach for Modelling Actual and Future Forest Fire Risk Under Climate Change Accounting Water Resources Attenuation Role. Sustainability 2019, 11, 7166. [Google Scholar] [CrossRef]
- Eskandari, S.; Miesel, J.R. Comparison of the Fuzzy AHP Method, the Spatial Correlation Method, and the Dong Model to Predict the Fire High-Risk Areas in Hyrcanian Forests of Iran. Geomat. Nat. Hazards Risk 2017, 8, 933–949. [Google Scholar] [CrossRef]
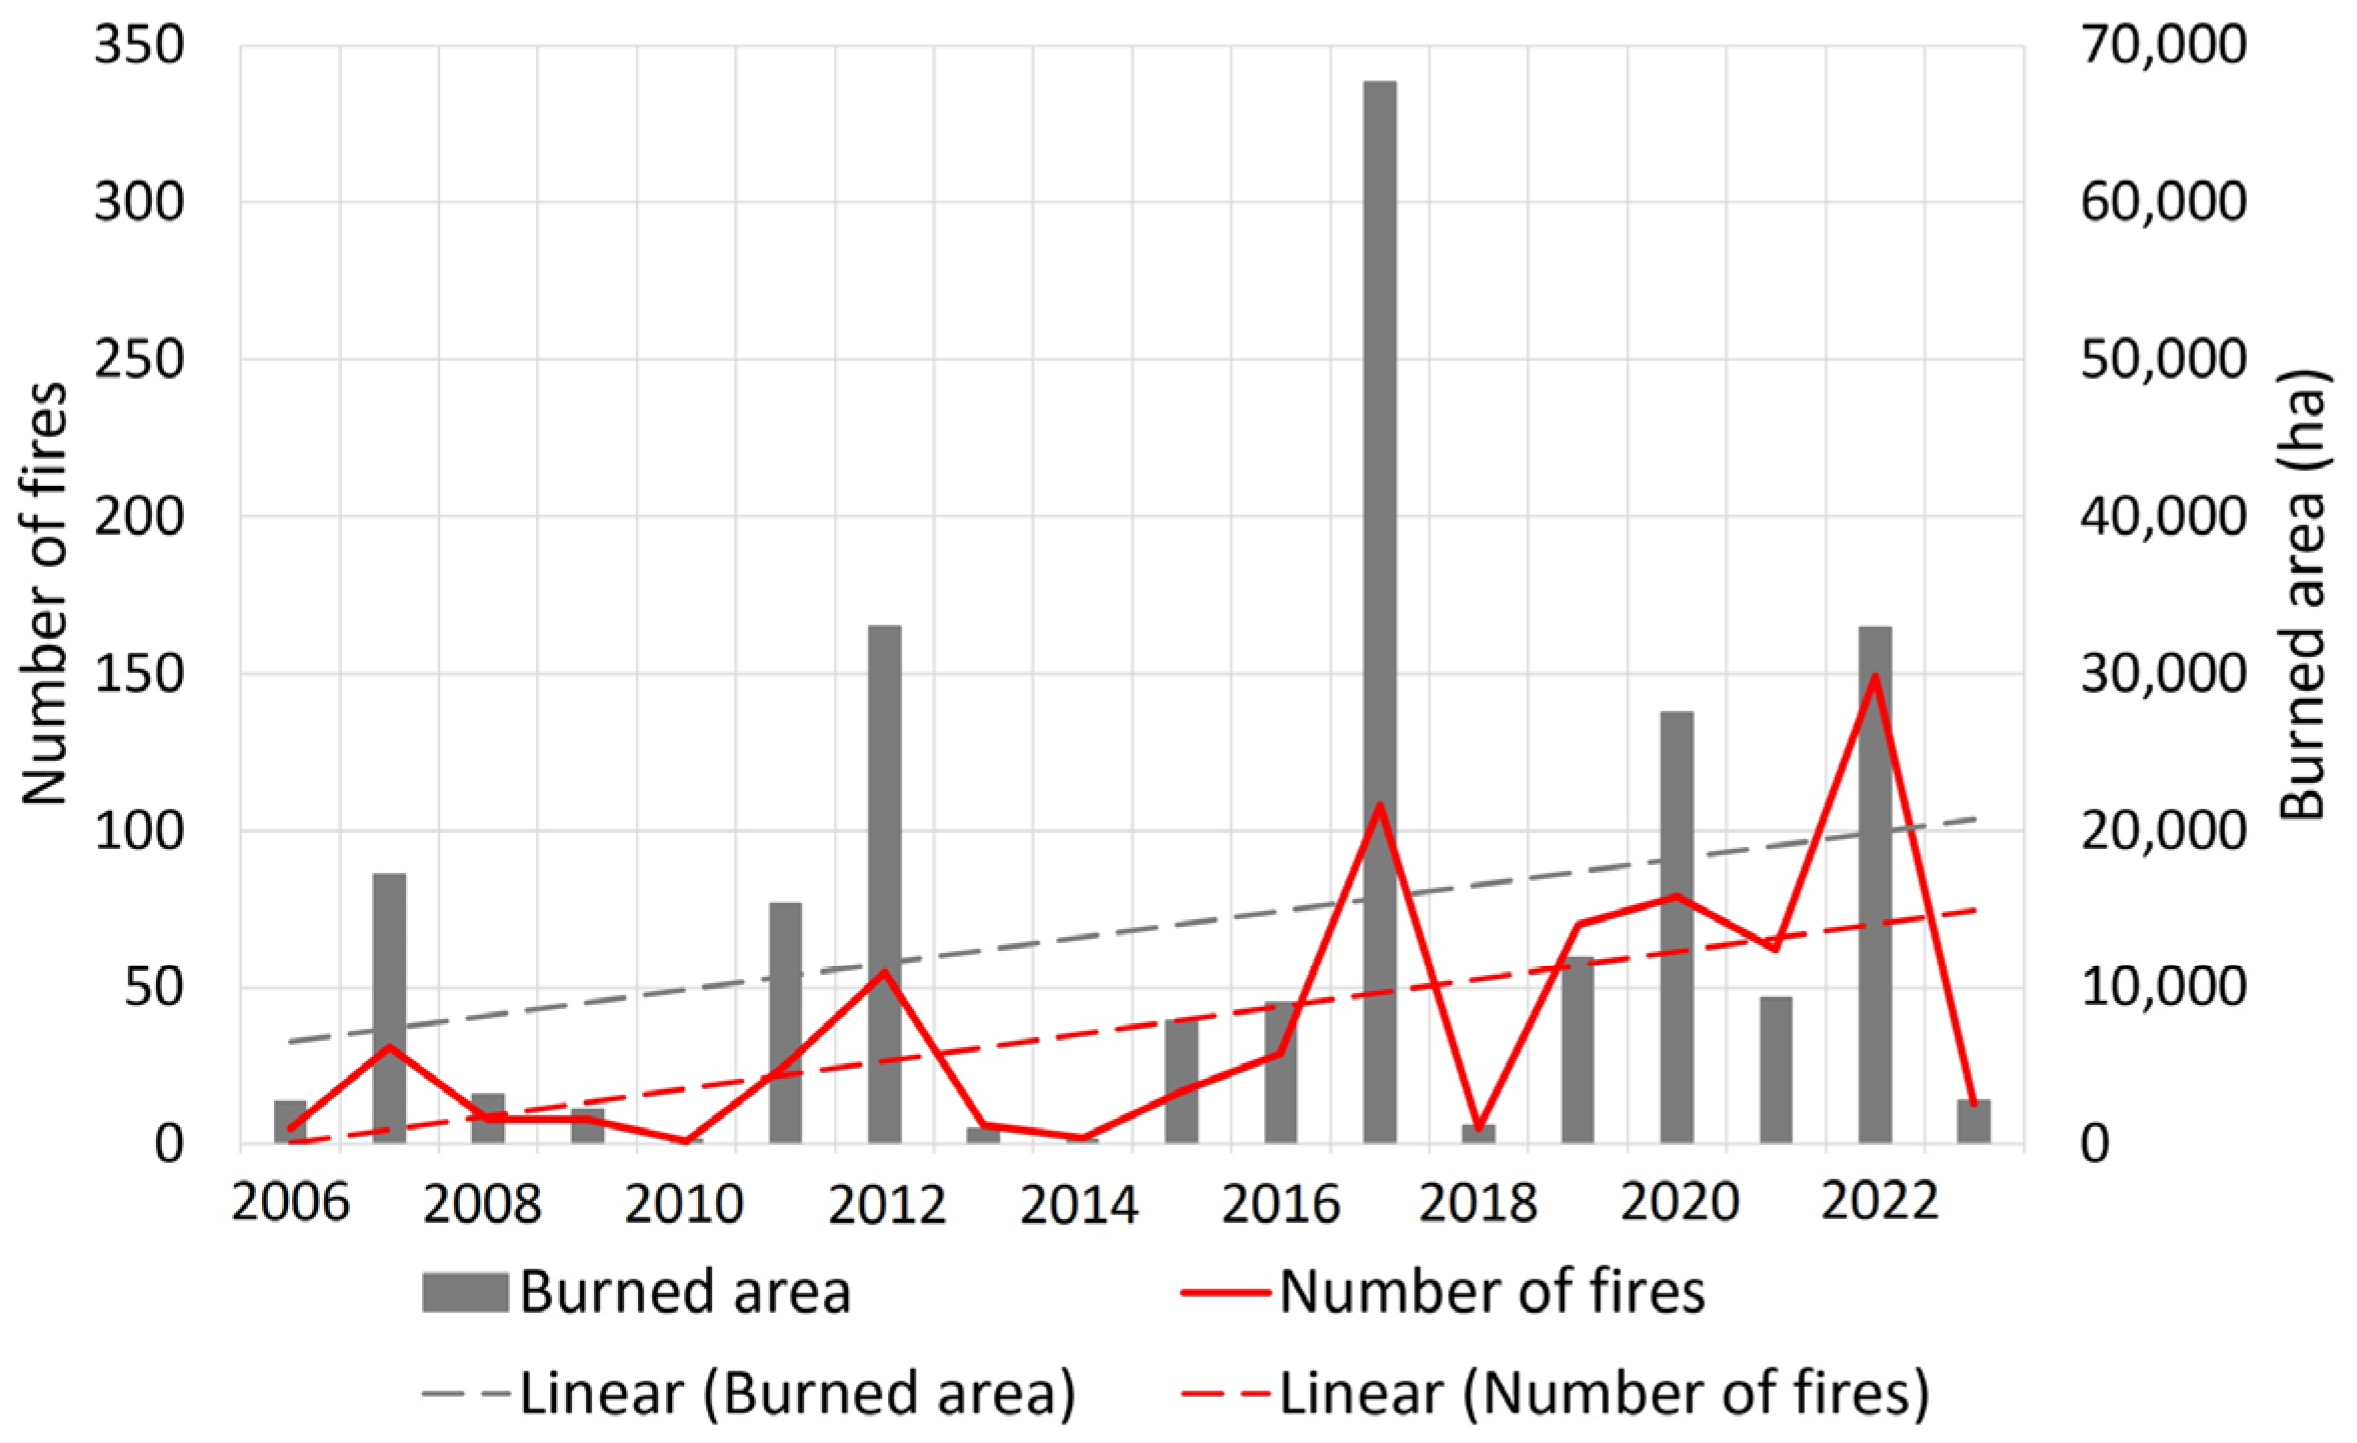
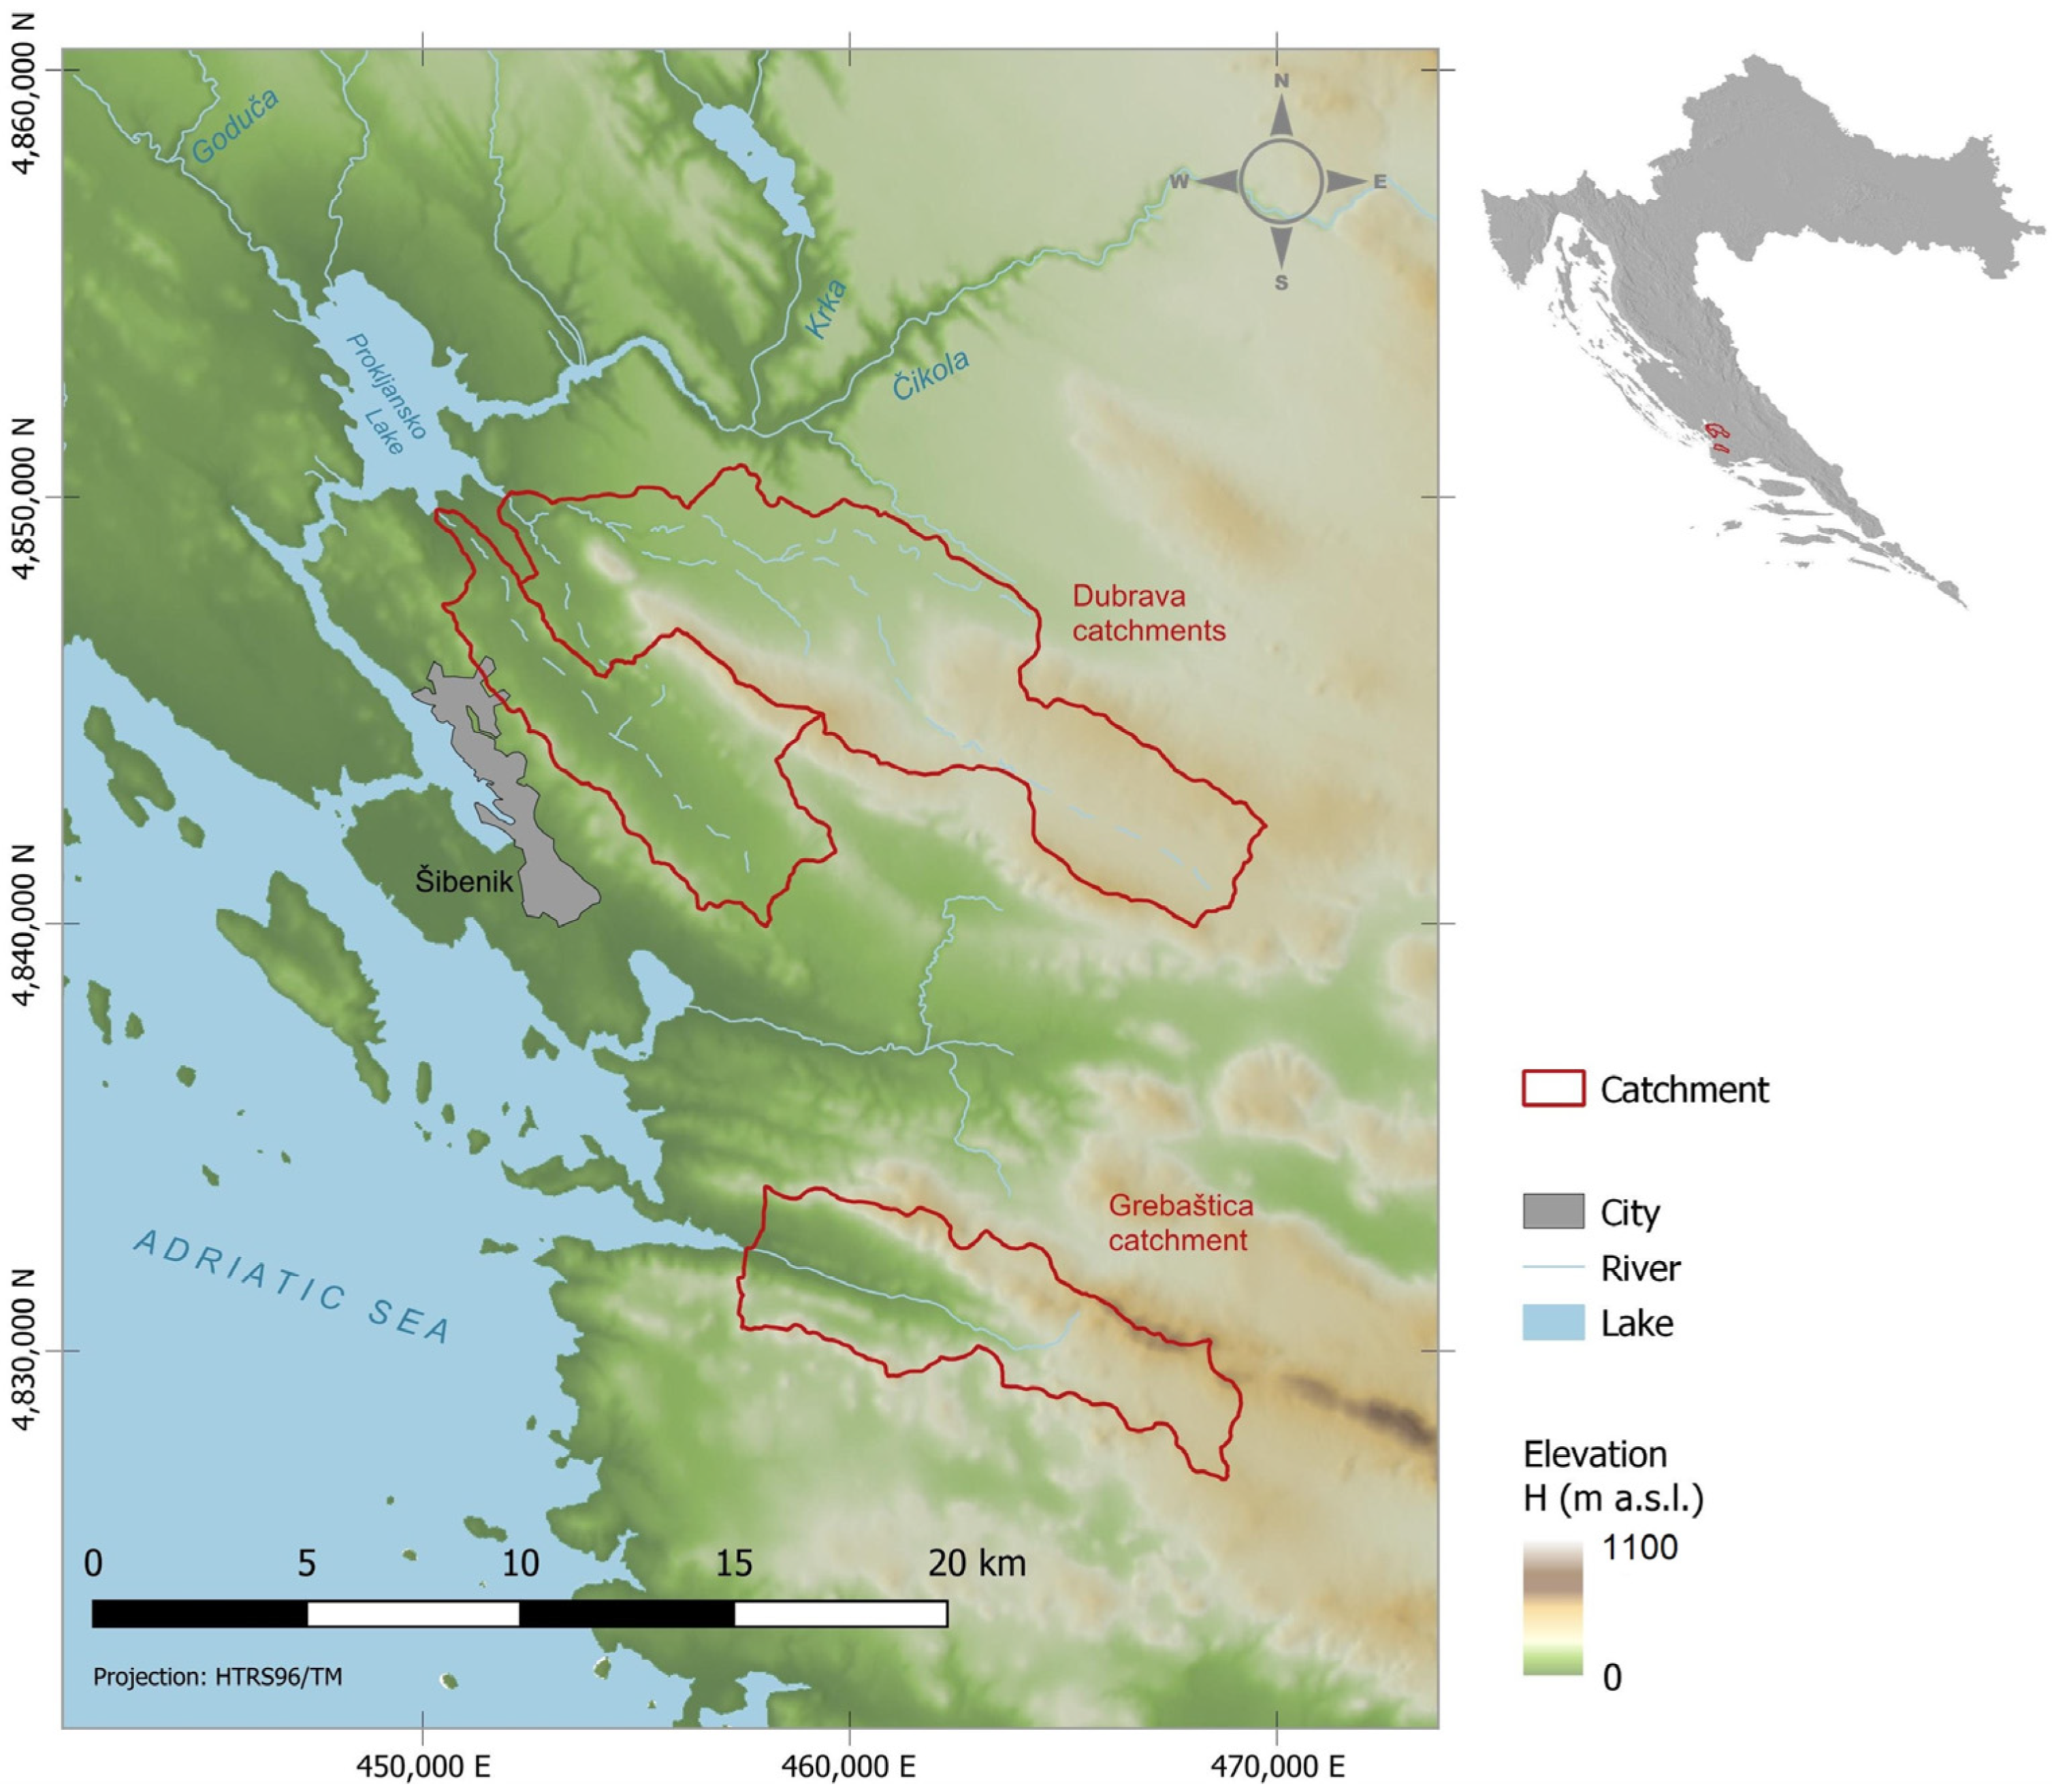
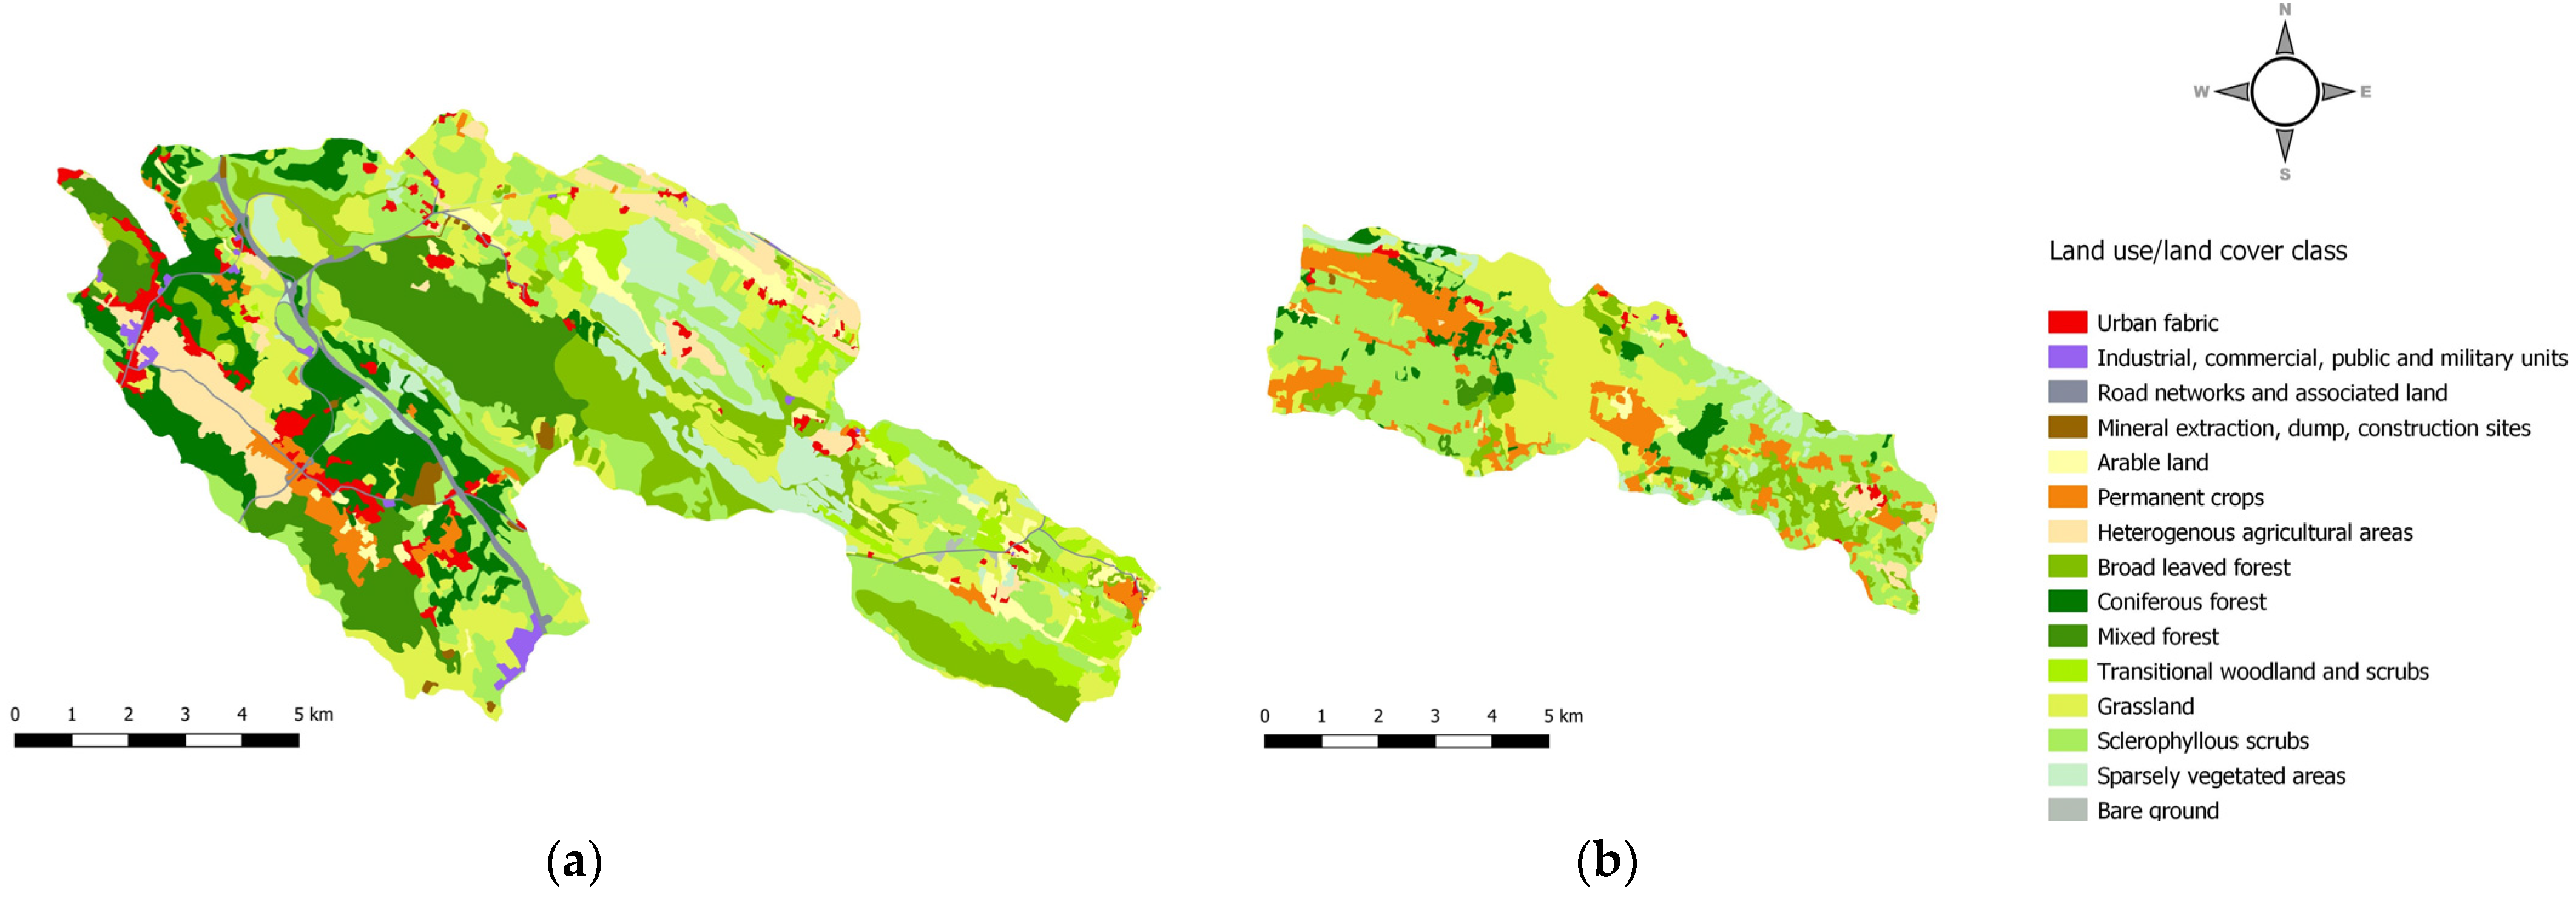

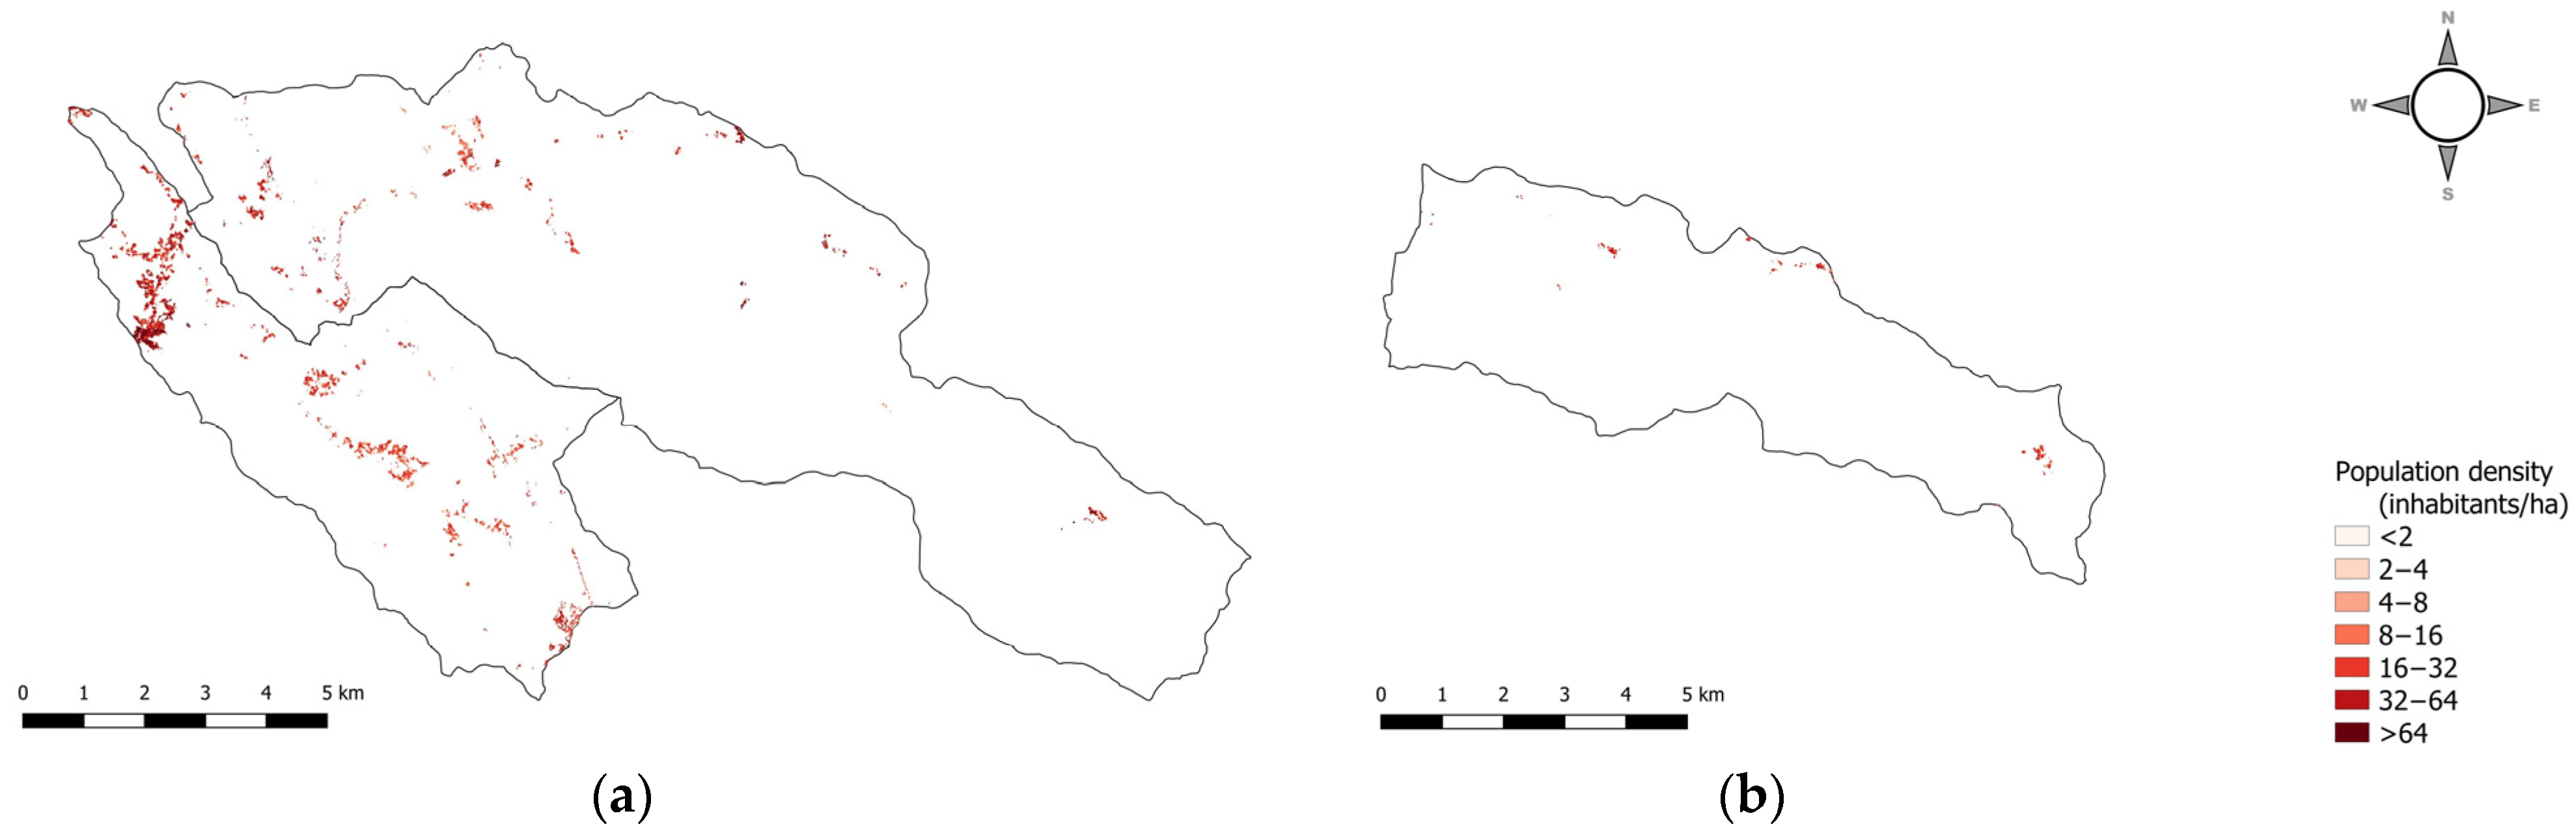

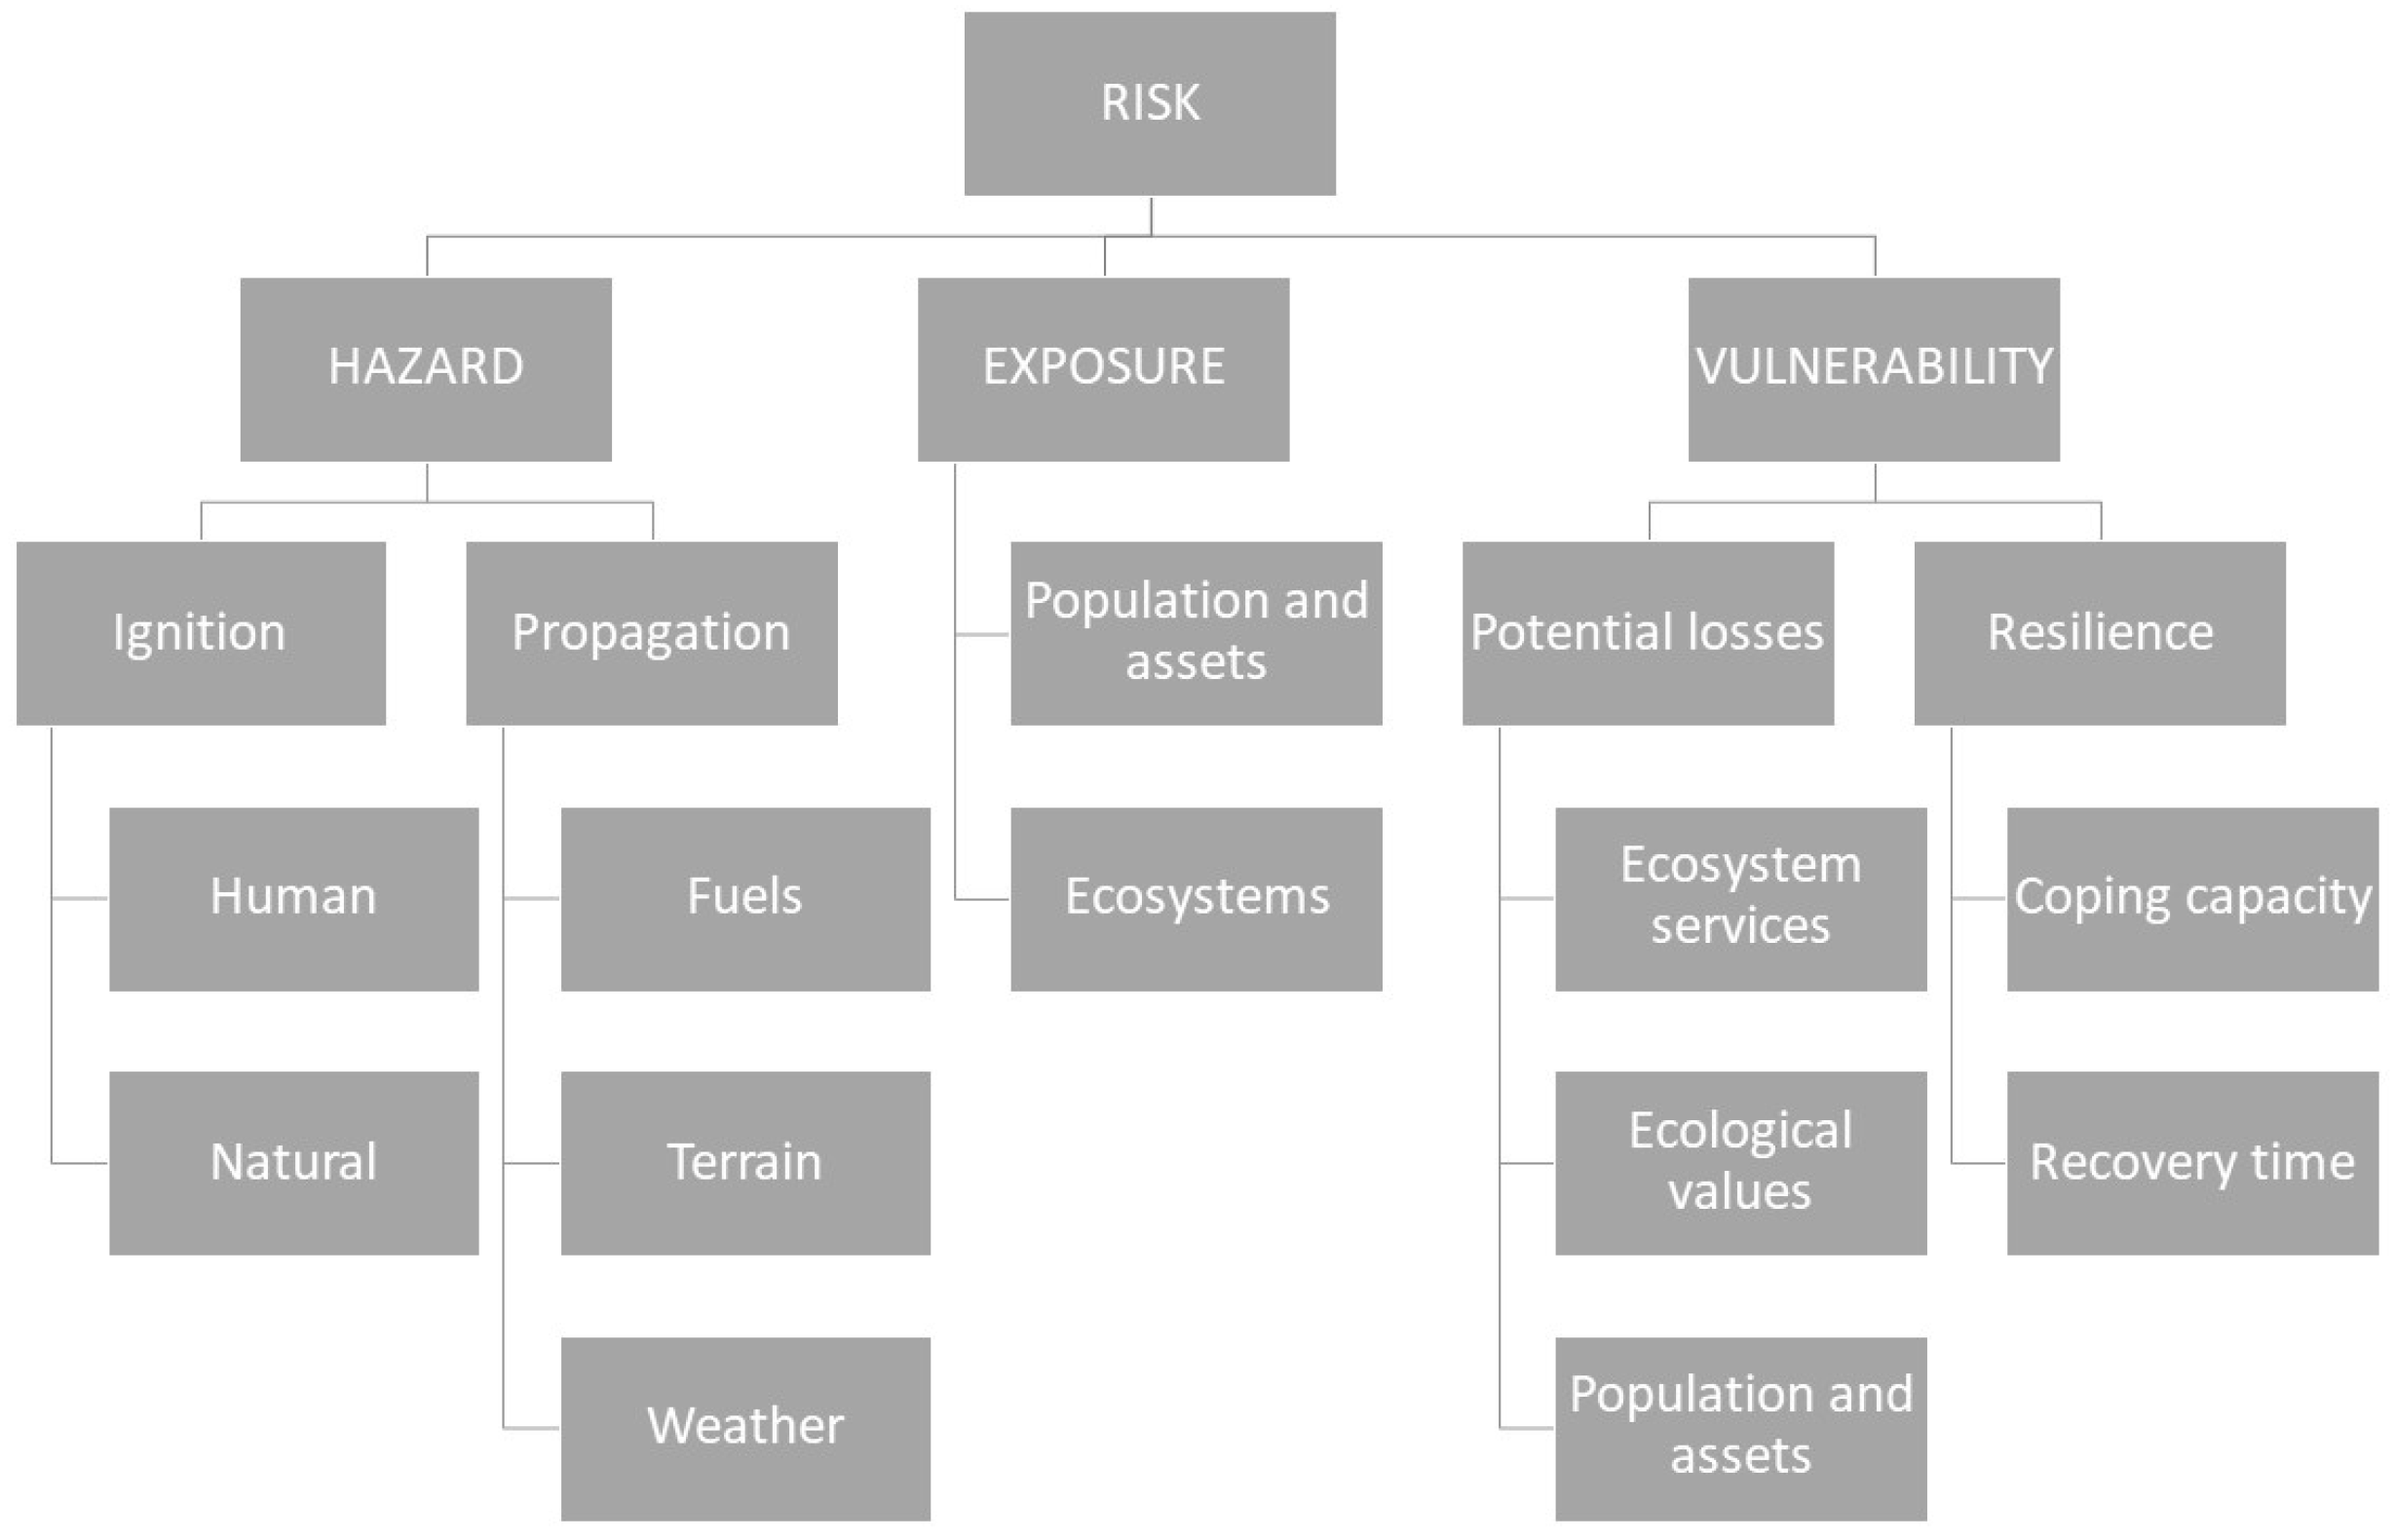


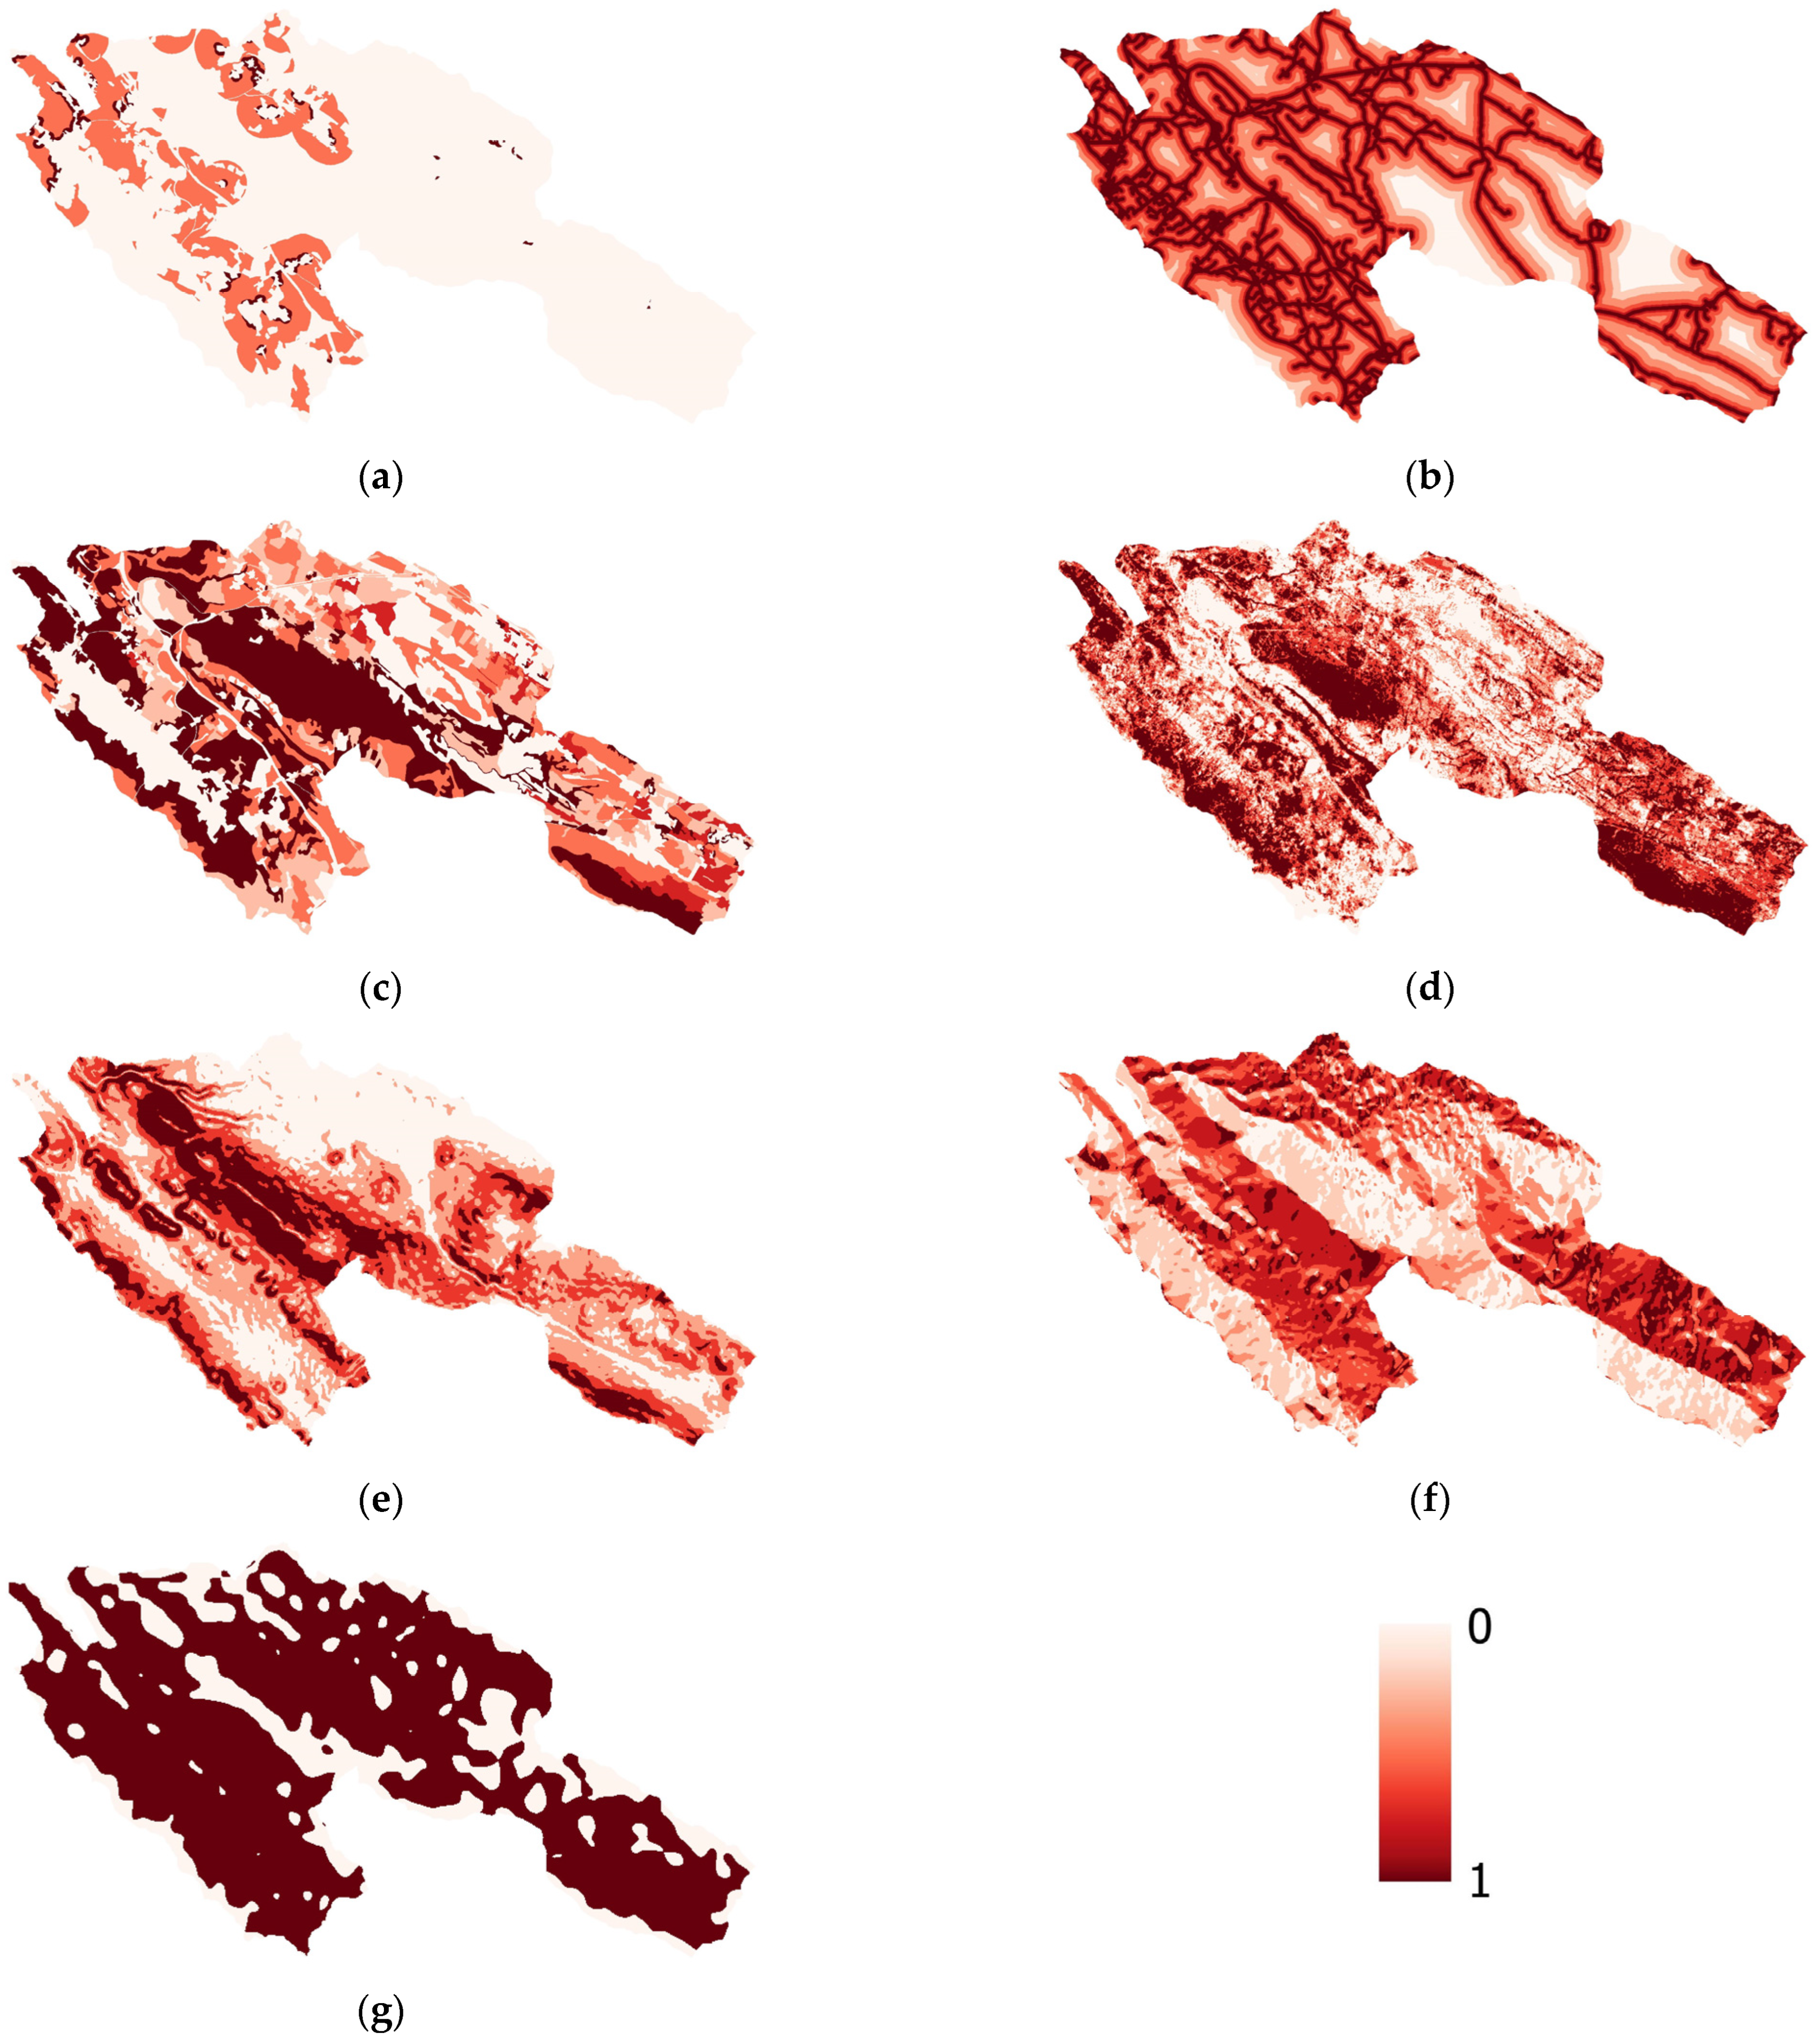
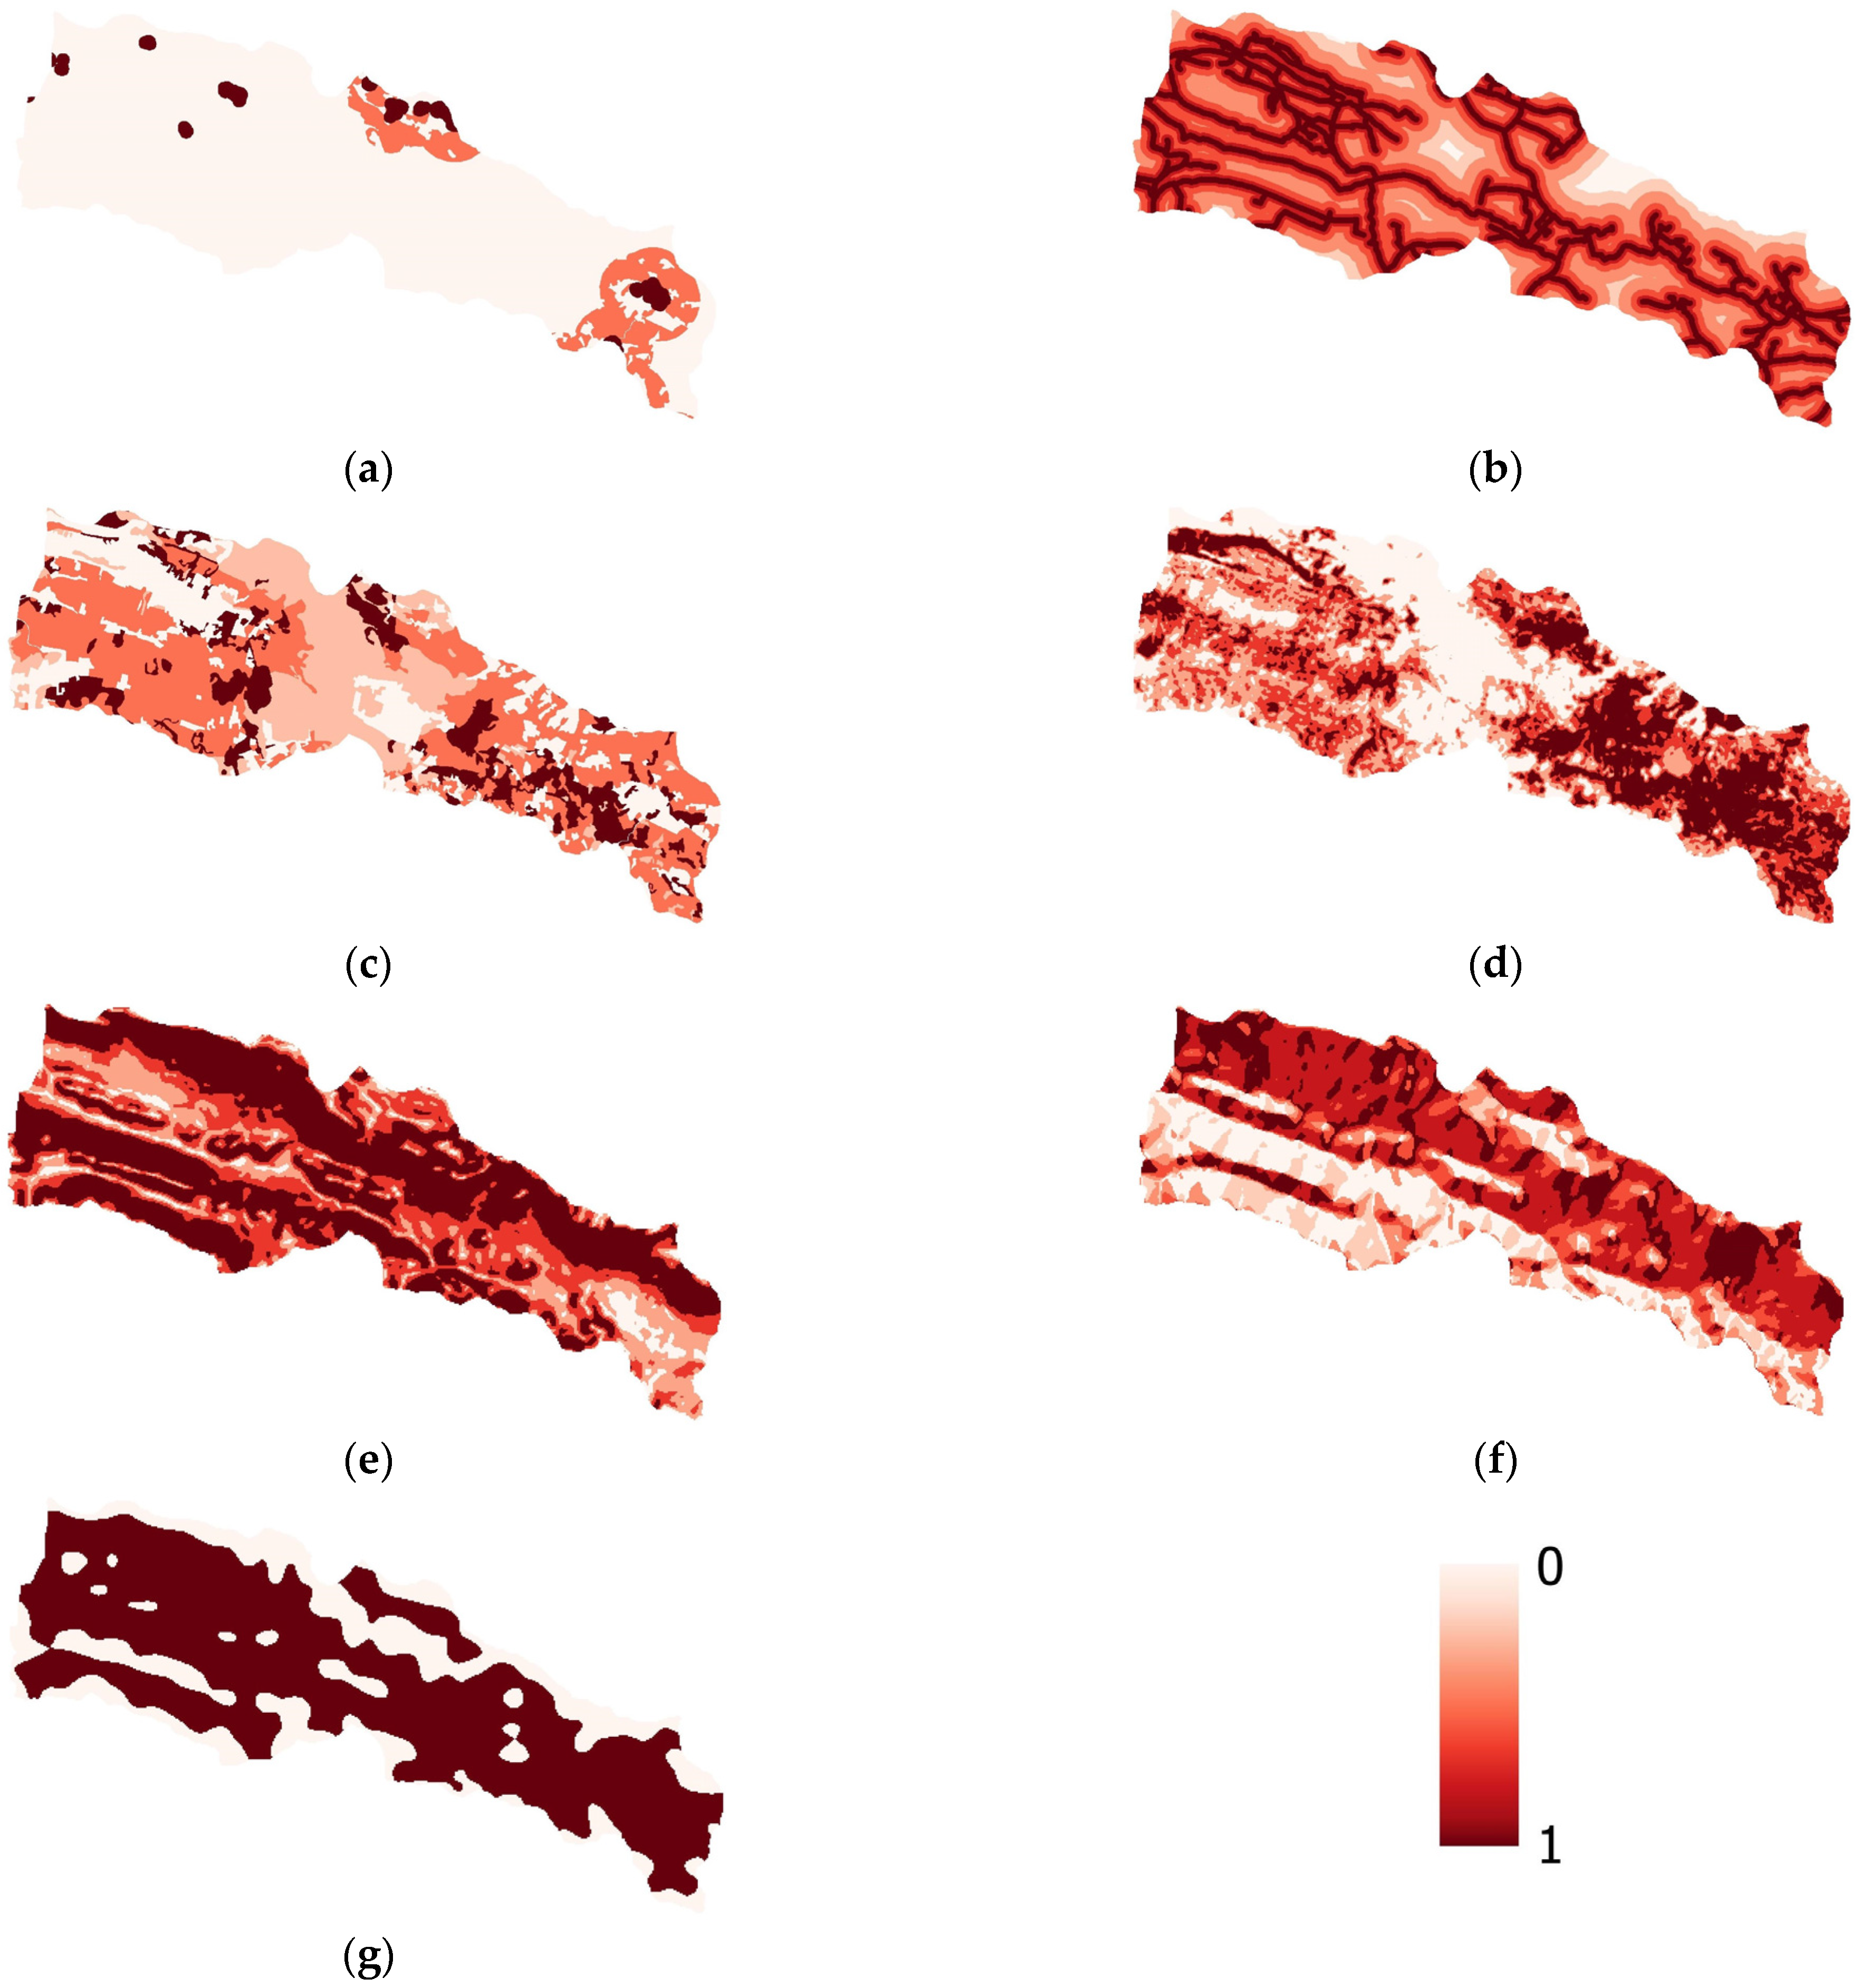
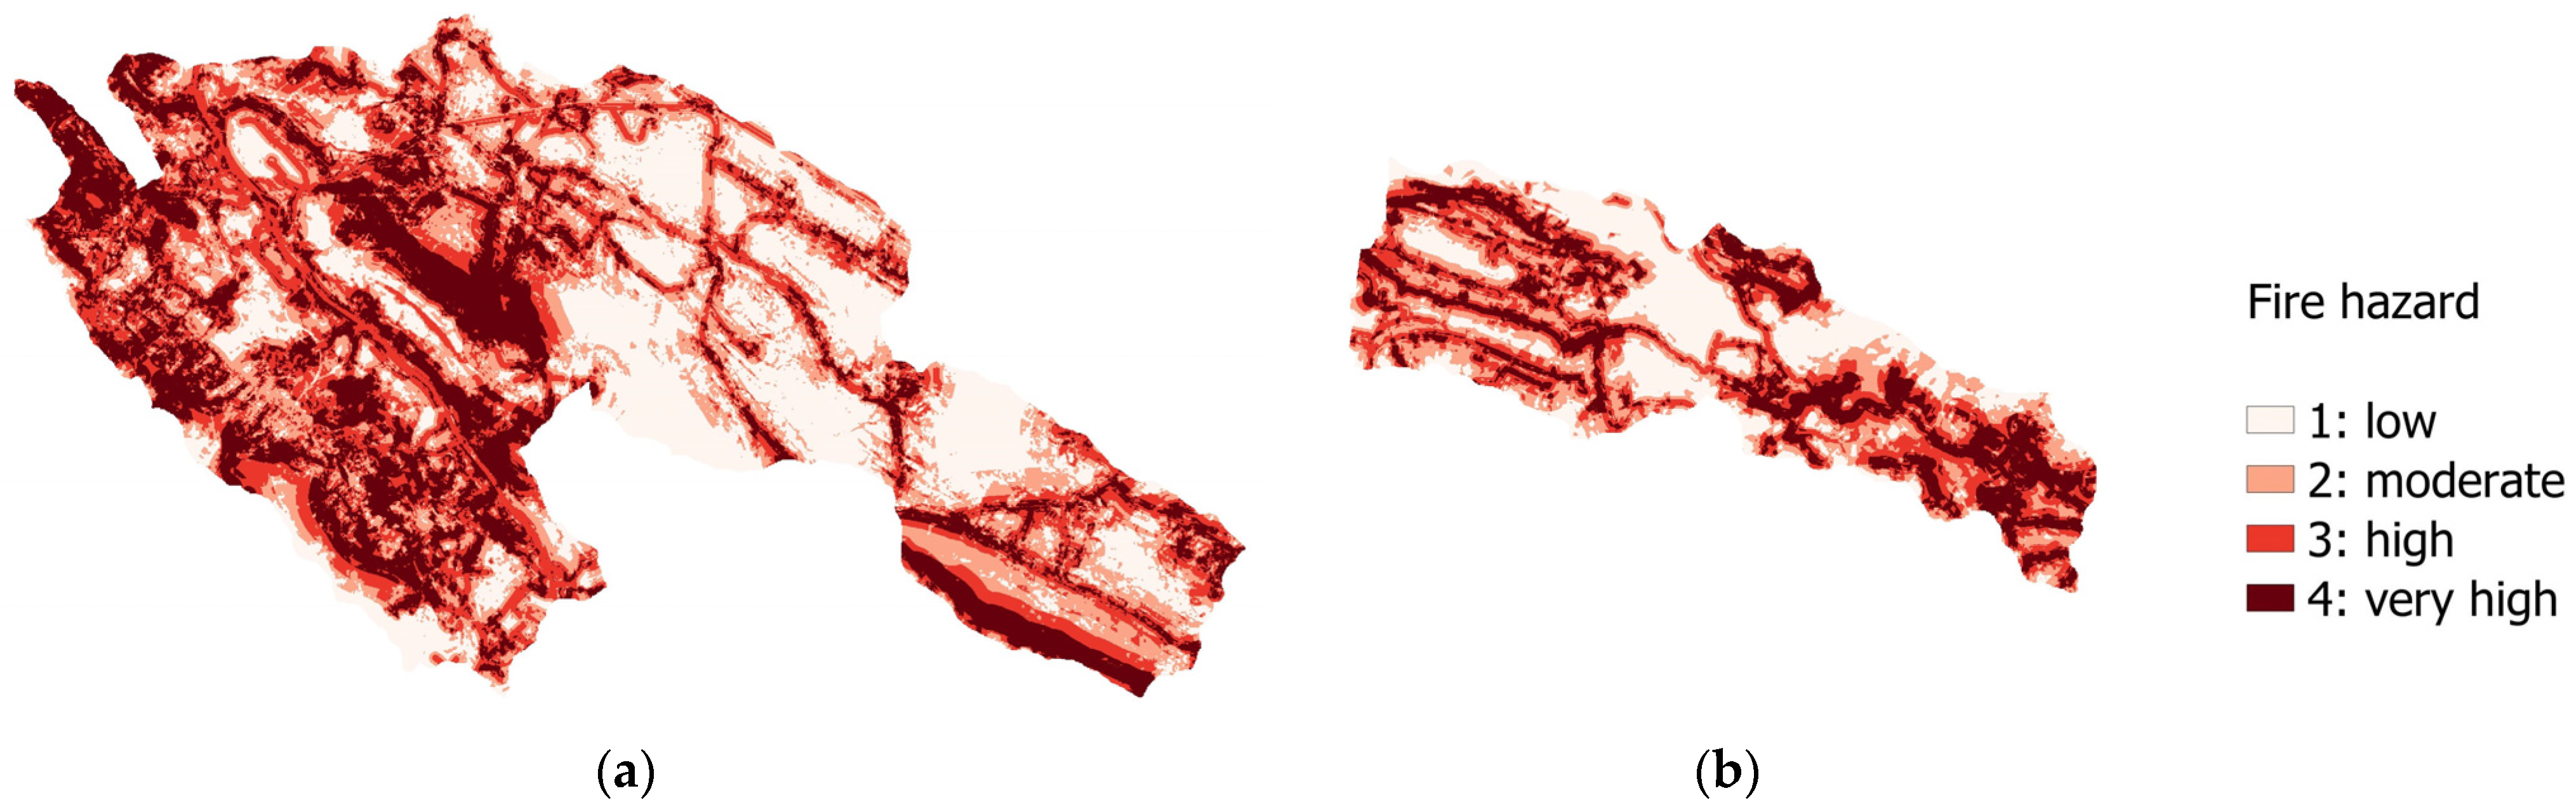

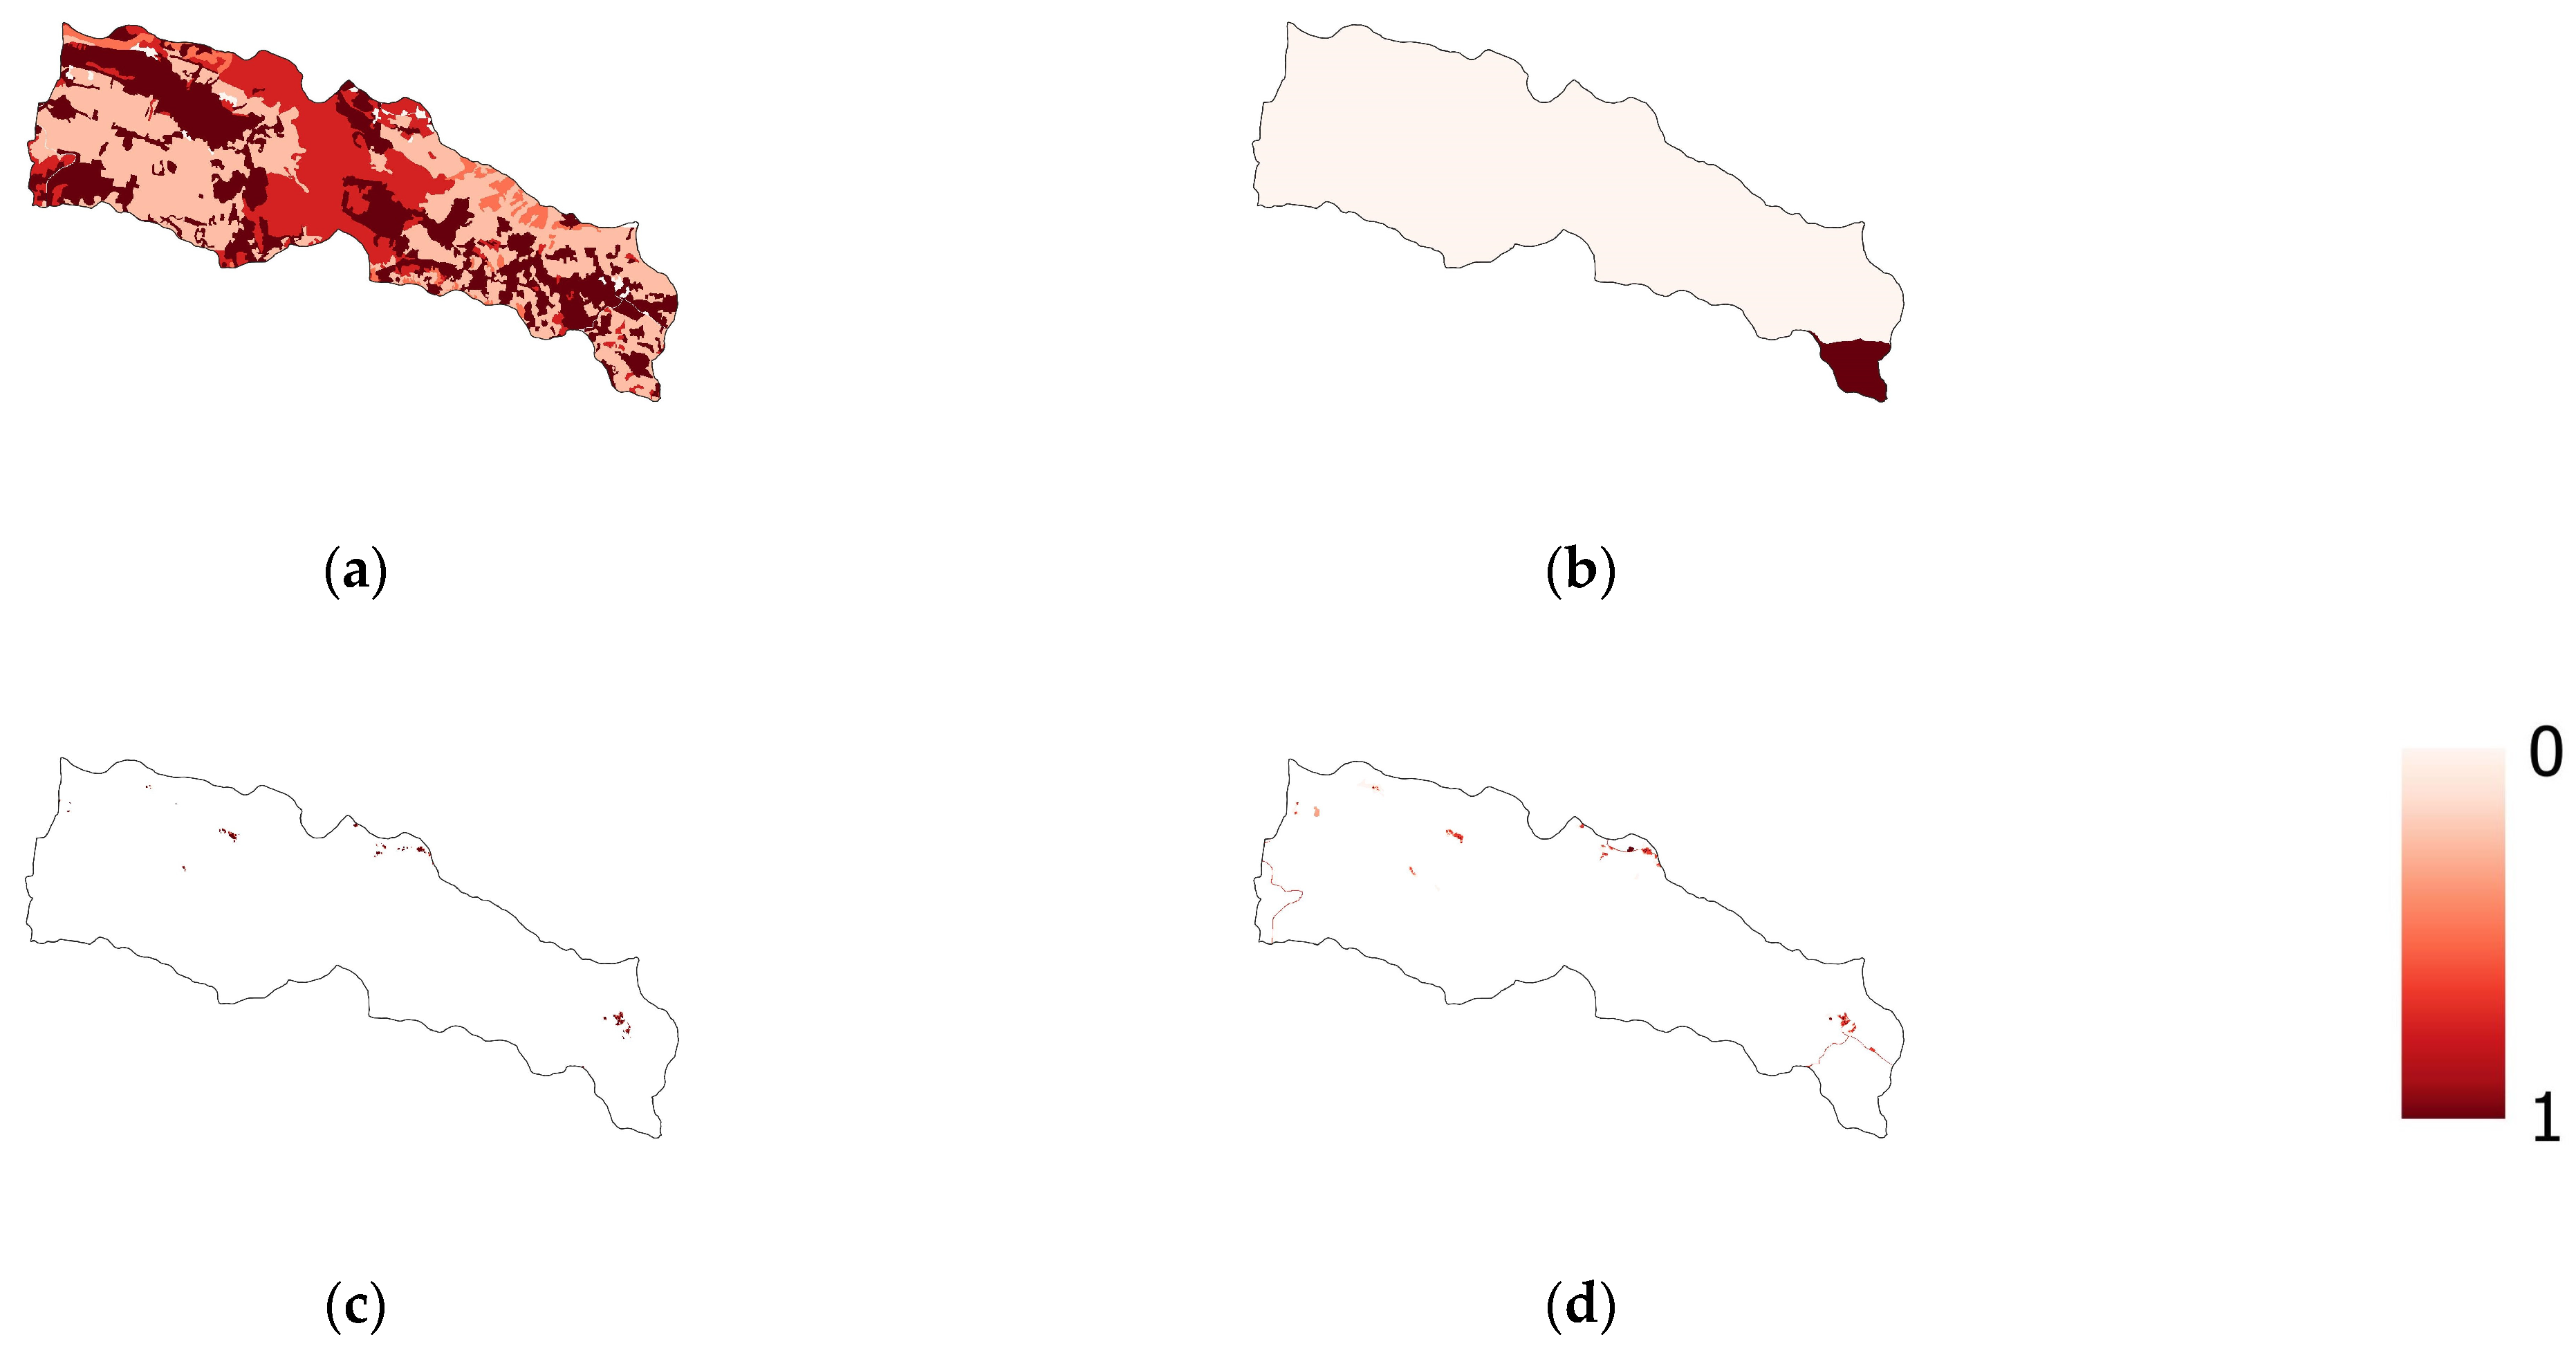
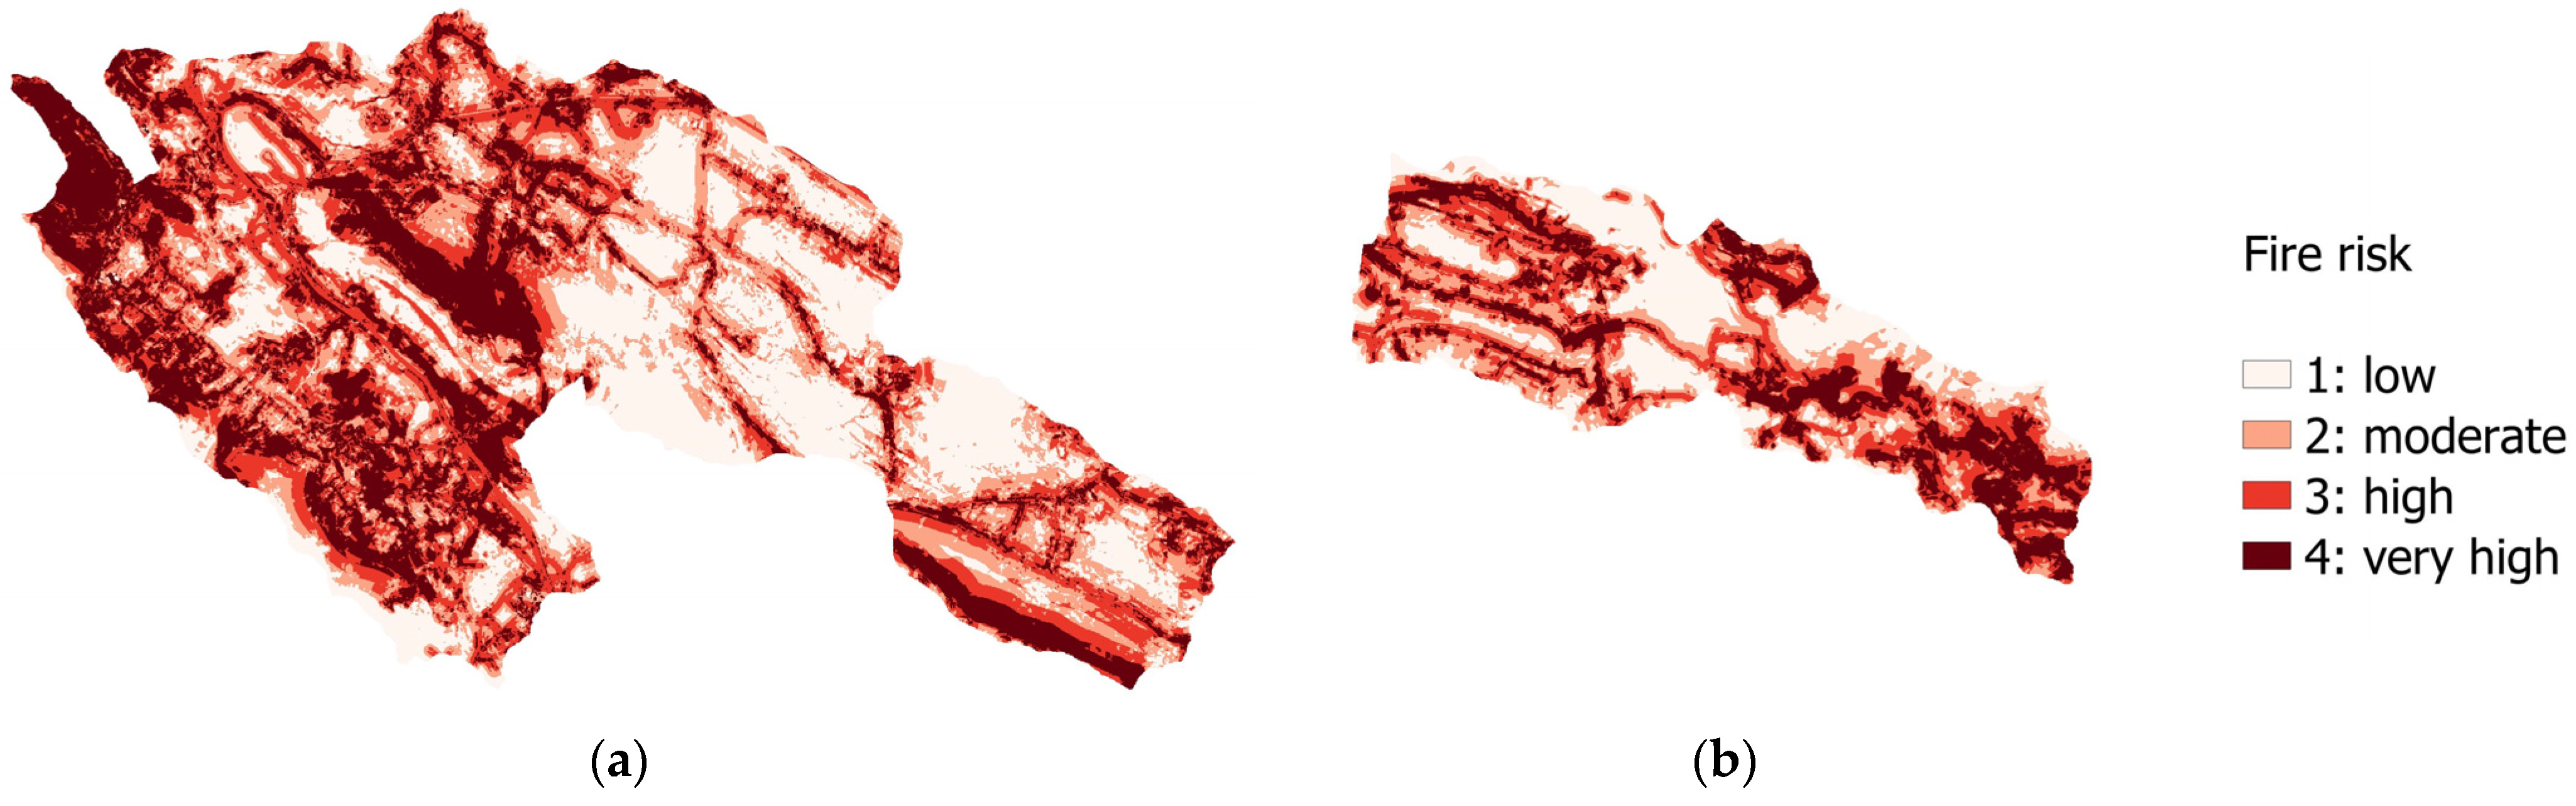
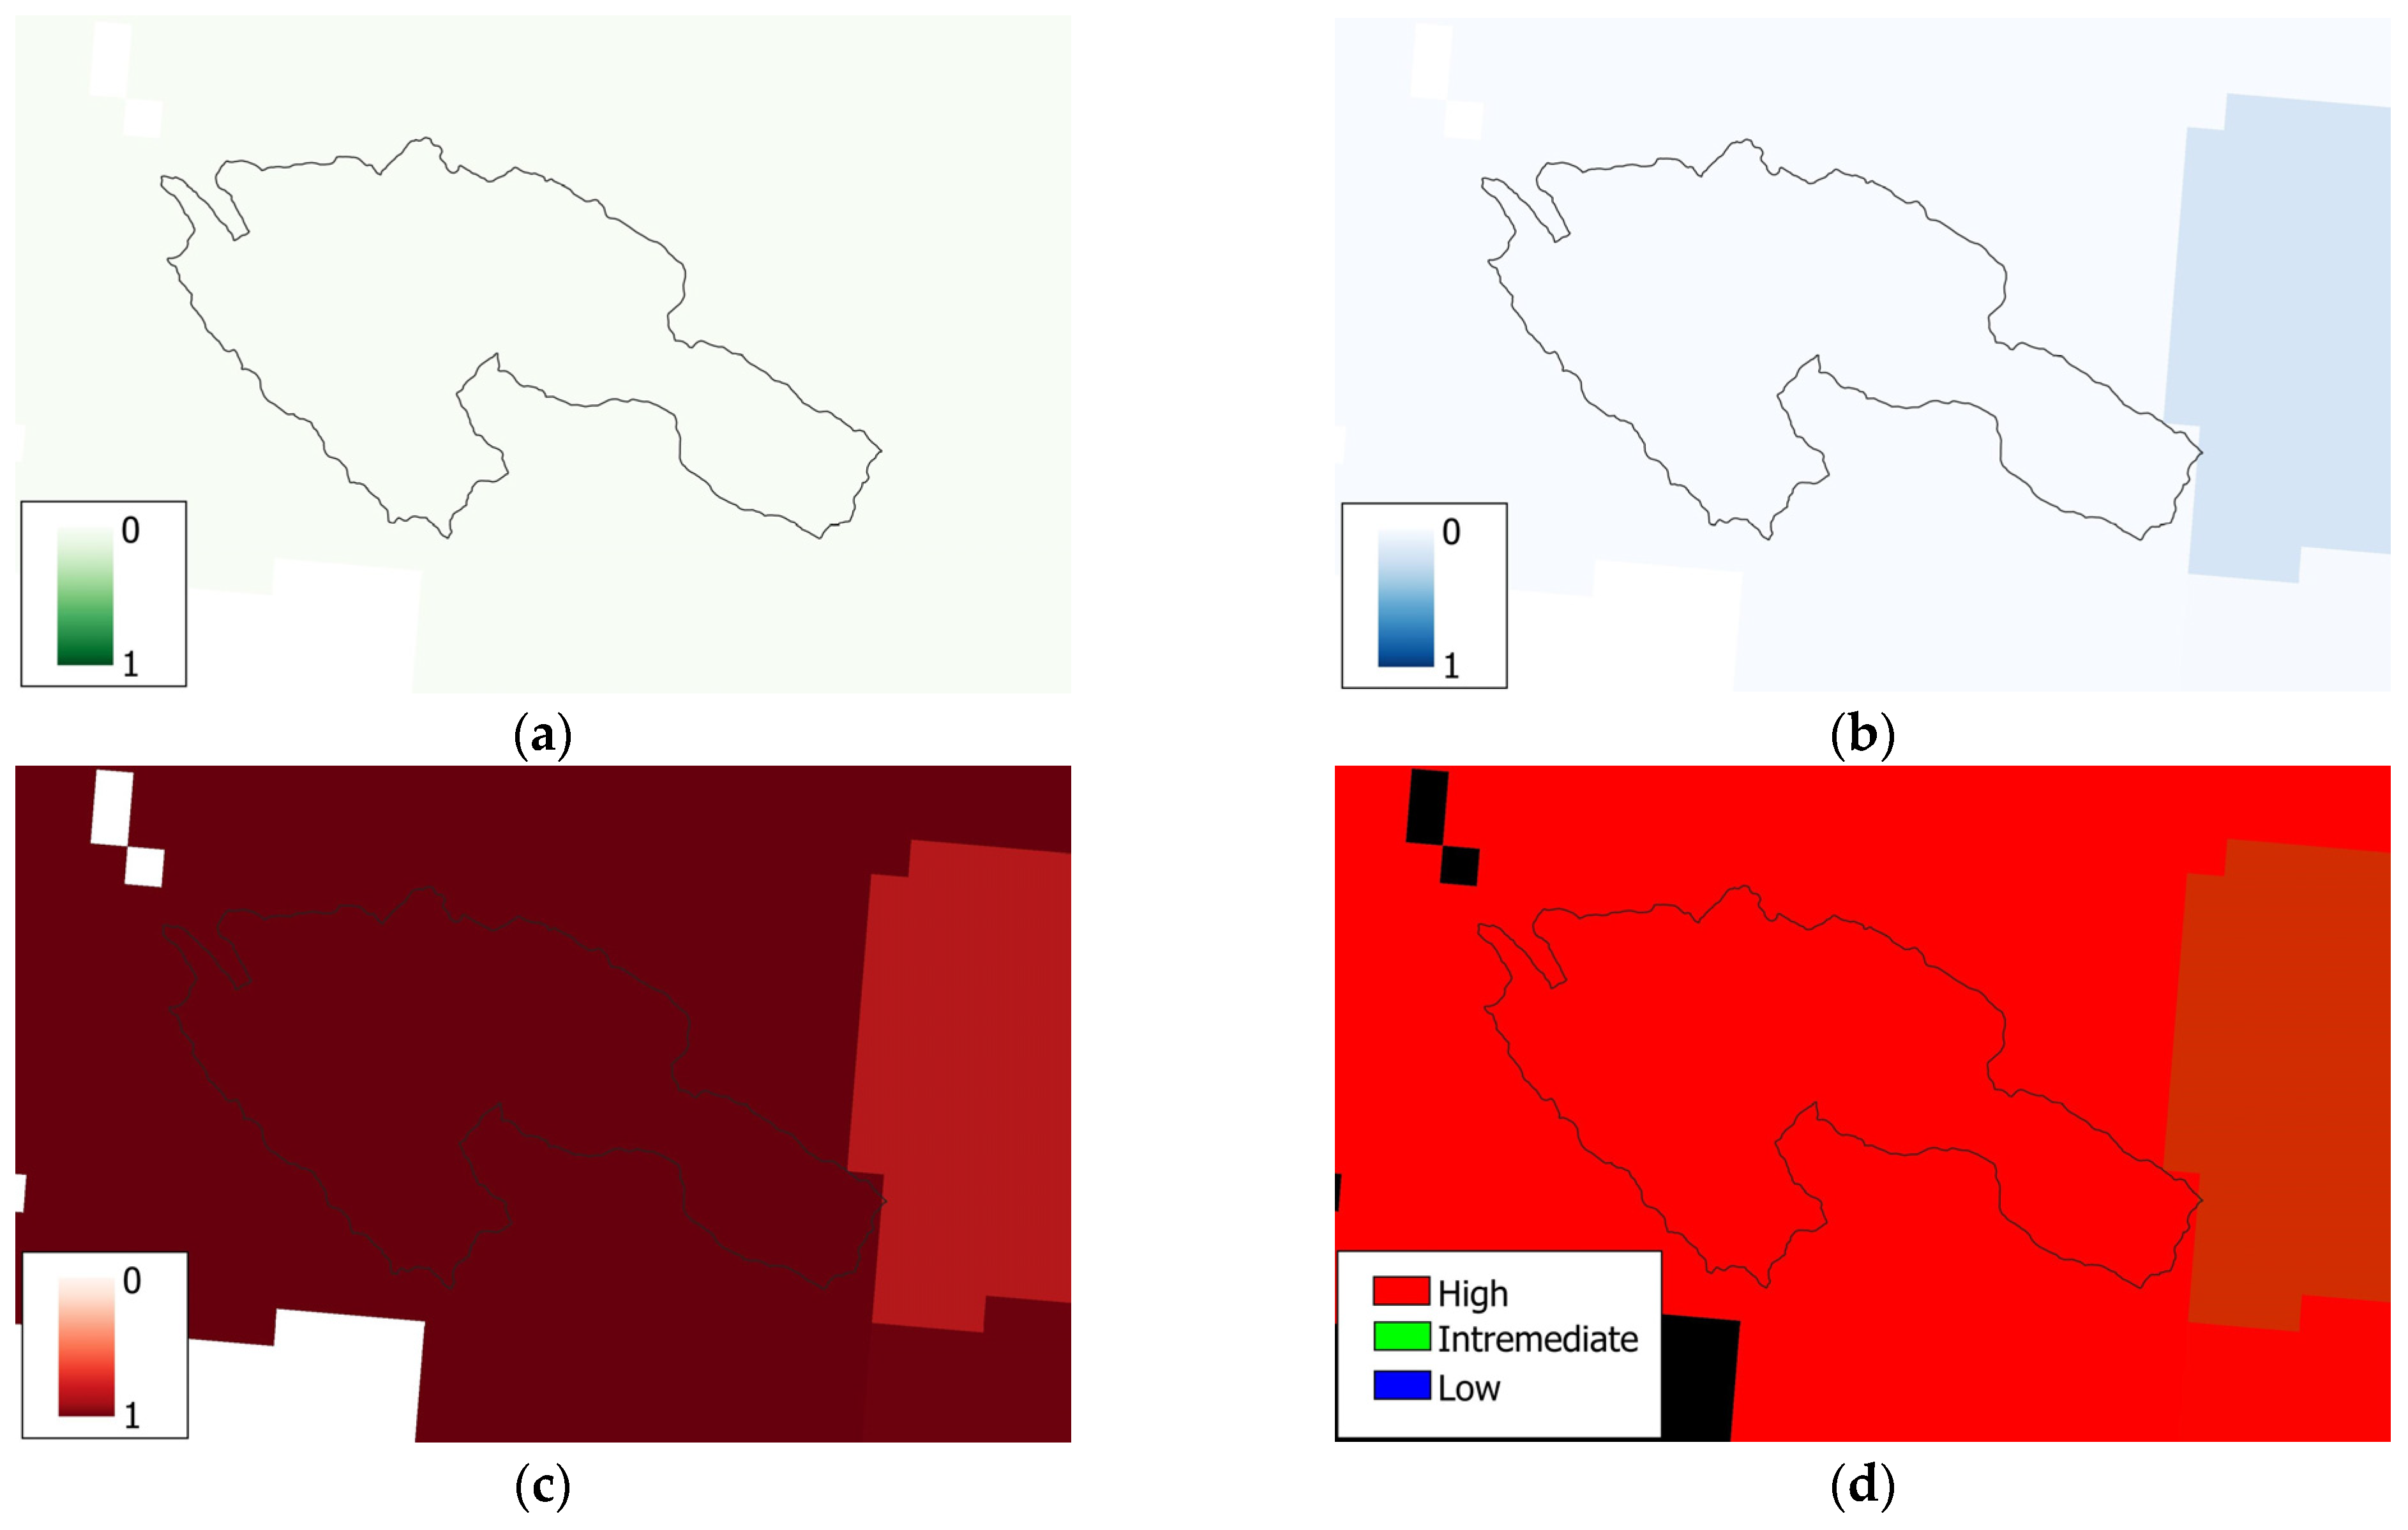
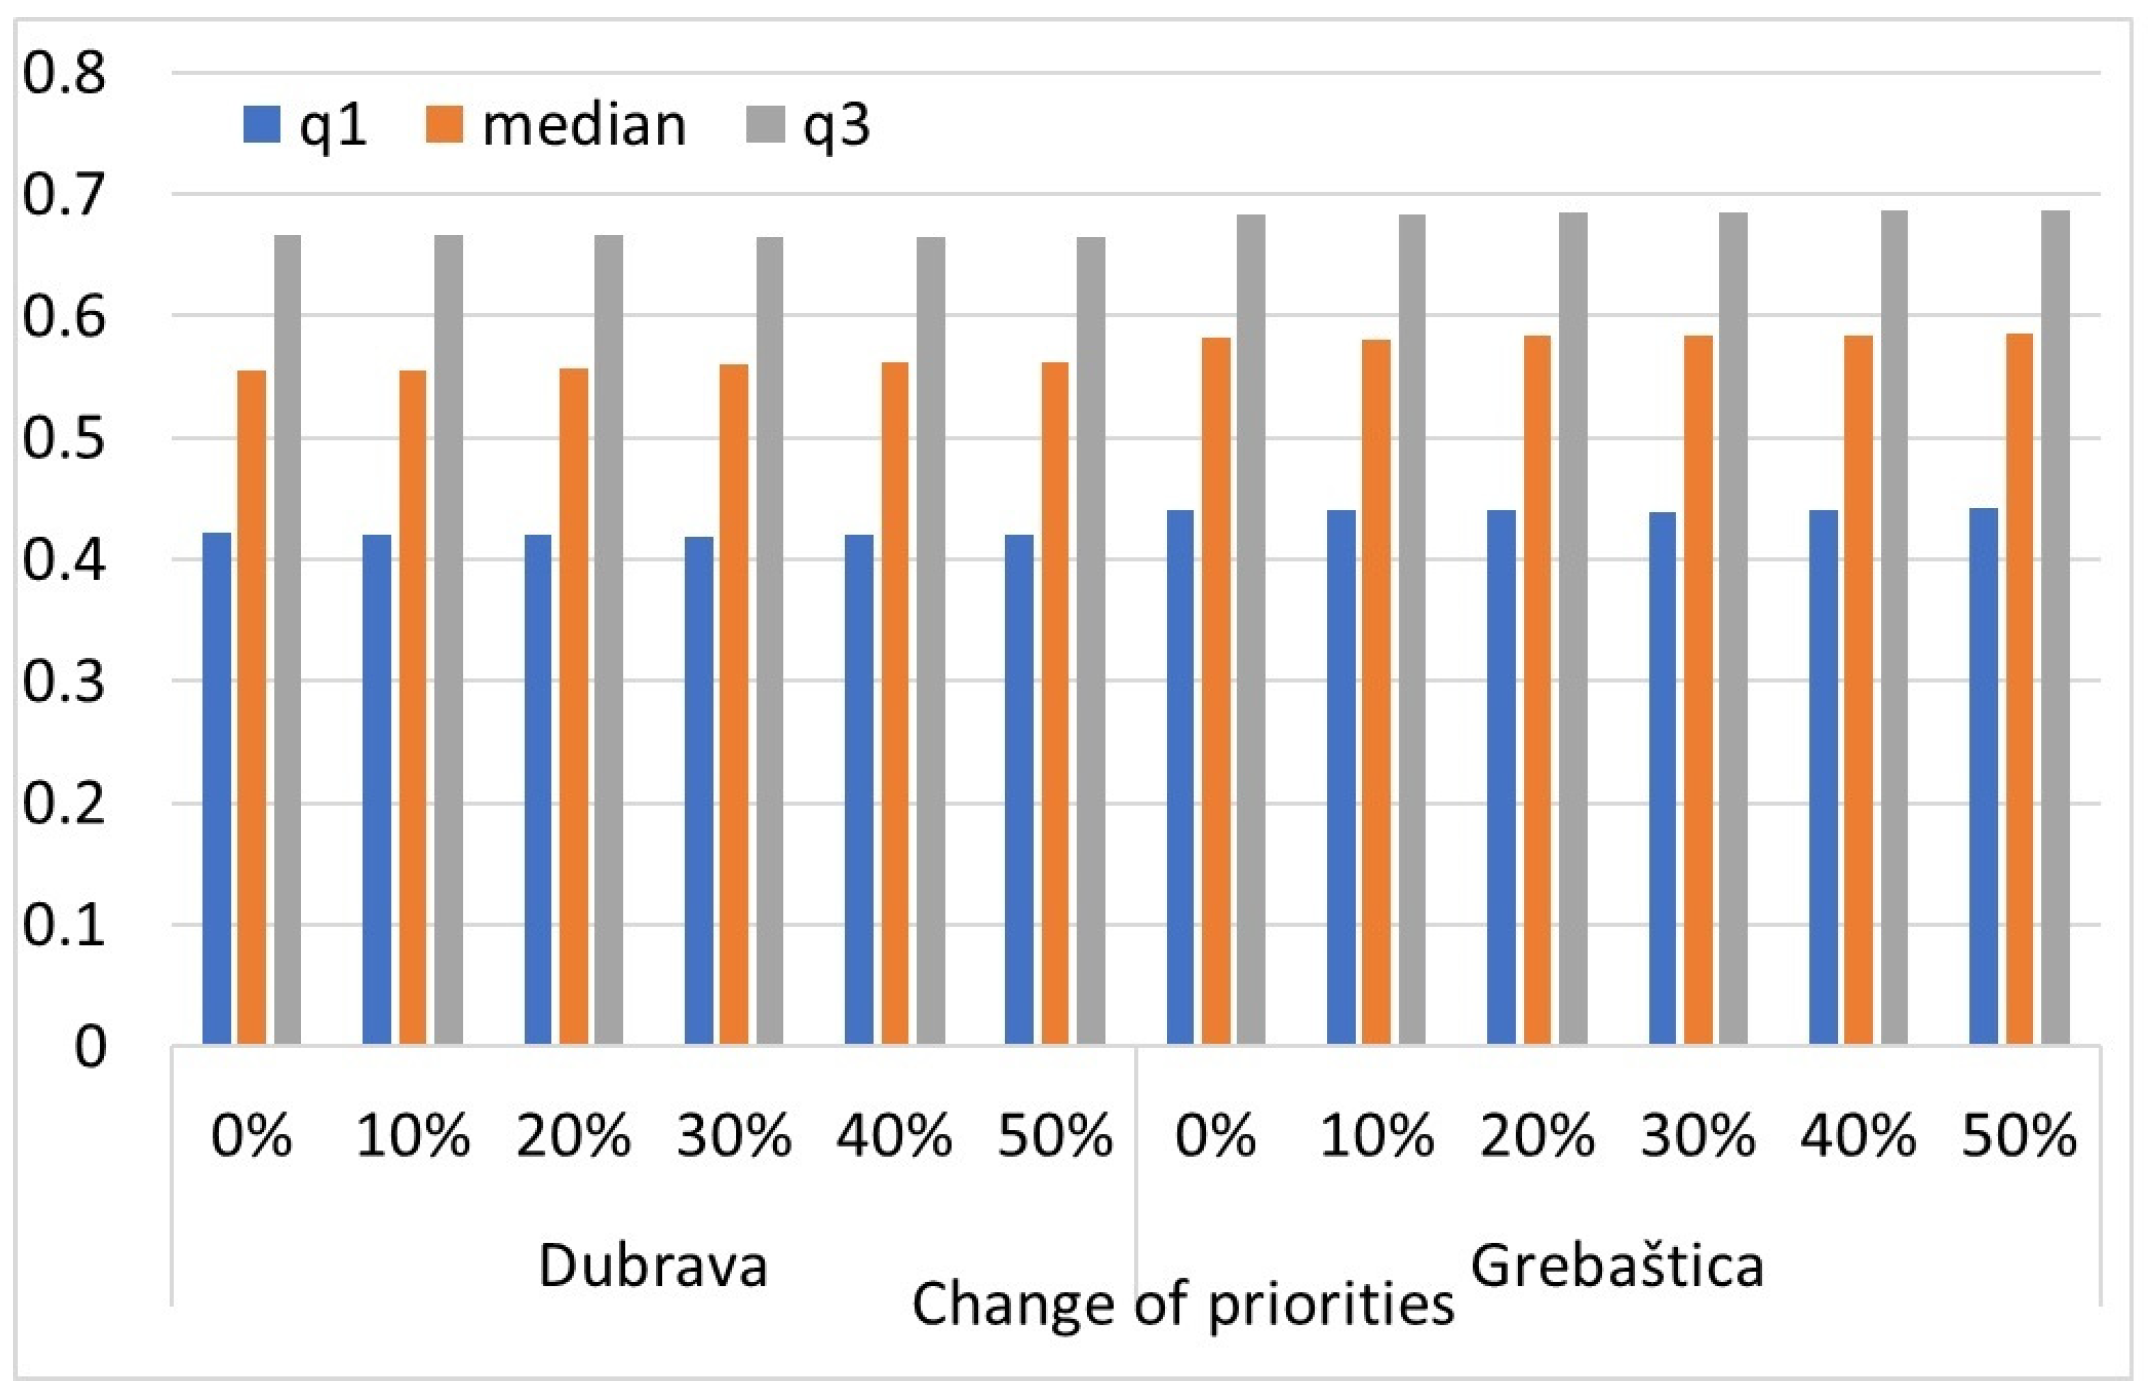
Disclaimer/Publisher’s Note: The statements, opinions and data contained in all publications are solely those of the individual author(s) and contributor(s) and not of MDPI and/or the editor(s). MDPI and/or the editor(s) disclaim responsibility for any injury to people or property resulting from any ideas, methods, instructions or products referred to in the content. |
© 2024 by the authors. Licensee MDPI, Basel, Switzerland. This article is an open access article distributed under the terms and conditions of the Creative Commons Attribution (CC BY) license (https://creativecommons.org/licenses/by/4.0/).