Article

Evaluating the Performance of the Enhanced Ross-Li Models in Characterizing BRDF/Albedo/NBAR Characteristics for Various Land Cover Types in the POLDER Database

1
School of Resources and Environmental Engineering, Hefei University of Technology, Hefei 230009, China
2
State Key Laboratory of Remote Sensing Science, Beijing Normal University, Beijing 100875, China
3
Faculty of Geographical Science, Institute of Remote Sensing Science and Engineering, Beijing Normal University, Beijing 100875, China
4
German Research Center for Geosciences, Telegrafenberg, 14473 Potsdam, Germany
5
School of Mechatronical Engineering, Beijing Institute of Technology, Beijing 100081, China
*
Author to whom correspondence should be addressed.
Remote Sens. 2024, 16(12), 2119; https://doi.org/10.3390/rs16122119
Submission received: 11 April 2024 / Revised: 30 May 2024 / Accepted: 6 June 2024 / Published: 11 June 2024
(This article belongs to the Special Issue Remote Sensing of Surface BRDF and Albedo)

Abstract

:
The latest versions of the Ross-Li model include kernels that represent isotropic reflection of the surface, describe backward reflection of soil and vegetation systems, characterize strong forward reflection of snow, and adequately consider the hotspot effect (i.e., RossThick-LiSparseReciprocalChen-Snow, RTLSRCS), theoretically able to effectively characterize BRDF/Albedo/NBAR features for various land surface types. However, a systematic evaluation of the RTLSRCS model is still lacking for various land cover types. In this paper, we conducted a thorough assessment of the RTLSRCS and RossThick-LiSparseReciprocalChen (RTLSRC) models in characterizing BRDF/Albedo/NBAR characteristics by using the global POLDER BRDF database. The primary highlights of this paper include the following: (1) Both models demonstrate high accuracy in characterizing the BRDF characteristics across 16 IGBP types. However, the accuracy of the RTLSRC model is notably reduced for land cover types with high reflectance and strong forward reflection characteristics, such as Snow and Ice (SI), Deciduous Needleleaf Forests (DNF), and Barren or Sparsely Vegetated (BSV). In contrast, the RTLSRCS model shows a significant improvement in accuracy for these land cover types. (2) These two models exhibit highly consistent albedo inversion across various land cover types (R2 > 0.9), particularly in black-sky and blue-sky albedo, except for SI. However, significant differences in white-sky albedo inversion persist between these two models for Evergreen Needleleaf Forests (ENF), Evergreen Broadleaf Forests (EBF), Urban Areas (UA), and SI (p < 0.05). (3) The NBAR values inverted by these two models are nearly identical across the other 15 land cover types. However, the consistency of NBAR results is relatively poor for SI. The RTLSRC model tends to overestimate compared to the RTLSRCS model, with a noticeable bias of approximately 0.024. This study holds significant importance for understanding different versions of Ross-Li models and improving the accuracy of satellite BRDF/Albedo/NBAR products.

1. Introduction

The reflection from natural objects is typically anisotropic, a fundamental trait effectively described by the Bidirectional Reflectance Distribution Function (BRDF) [1,2], which encapsulates information about their physical structure and composition. The BRDF modeling of land surfaces plays a pivotal role in understanding the spatial variability of surface reflectance attributes, thereby enhancing the interpretability and applicability of remote sensing [3,4]. Precise BRDF models enable quantitative delineation of surface reflection attributes across diverse incidents and viewing geometries, capturing both intensity and spatial distribution of reflectance [5,6]. Therefore, researchers can effectively distinguish and classify distinct surface features, facilitating the inference of crucial parameters such as physical structure, vegetation cover, and soil moisture, among others [7,8]. These insights provide vital support and a robust foundation for environmental monitoring, resource management, urban planning, and various other research domains.
The spatial distribution and magnitude variation of natural BRDF features are closely linked to the spatial structural characteristics and optical properties of natural objects, primarily determined by land cover types [9,10,11]. Vegetation and soil typically absorb incident visible light, with their reflection characteristics gradually decreasing from backscattering to forward scattering directions [12]. Peak reflectance is generally achieved in the backscattering direction when the incident and viewing angles align, known as the hotspot effect [13]. Snow surfaces exhibit more isotropic behavior than other natural surfaces, often displaying higher reflectance in the forward scattering direction, especially under large incident and viewing geometries, in contrast to other natural surfaces [5,6,12]. Accurate inversion of surface BRDF necessitates a substantial amount of multi-angle data capable of depicting the surface anisotropic reflectance characteristics. However, due to limitations in sensor observation capabilities and satellite orbits, satellites can only capture directional reflectance from specific angular positions [14,15]. This limitation is more pronounced for remote sensing sensors with higher spatial resolutions (e.g., Landsat and Sentinel), often insufficient for adequately describing surface BRDF characteristics [16]. Therefore, to better characterize the BRDF features of different natural objects, BRDF modeling for various land cover types is typically essential, enabling the inverse estimation of various geophysical parameters.
Currently, BRDF models encompass various surface types, including soil, vegetation, snow, sand, water, and others. These models meticulously account for the unique composition and reflective properties of each natural surface. Moreover, there are specialized BRDF models designed for mixed scenes. Soil models include the Hapke model, Global Spectral Vector (GSV) model, Brightness–Shape–Moisture (BSM) model, Multilayer Radiative Transfer Model of Soil Reflectance (MARMIT) model, and their respective enhancements [12,17,18,19,20,21]. Vegetation models consist of the PROSPECT model, Scattering by Arbitrarily Inclined Leaves (SAIL) model, and Needle Leaf Optical Properties (LIBERTY) model, among others [22]. Snow models comprise the Discrete Ordinate Radiative Transfer (DISORT) model, bicontinuous Photon Tracking (bic-PT) model, and Asymptotic Radiative Transfer (ART) model, along with improved versions [5,6,23,24,25,26,27]. Sand models are represented by the Spectral Light Transport (SPLITS) model and the Seven-Parameter model [28,29]. Water models include the Morel2002, Lee2004, Park2005, Voer2008, and Lee2011 models [30]. Mixed scene modeling primarily focuses on soil–vegetation systems, exemplified by models like the PROSPECT + SAIL (PROSAIL) model, Kuusk model, Ross-Li model (i.e., RossThick-LiSparseReciprocal, RTLSR), and LargE-Scale remote sensing data and image Simulation framework (LESS) model [4,22,31,32]. Moreover, researchers are increasingly interested in modeling the BRDF of soil–vegetation–snow systems, as demonstrated by models such as the enhanced Ross-Li model (RossThick-LiSparseReciprocal-Snow, RTLSRS), the LESS model coupled with ART, and the Snow-covered Forest Bidirectional Reflectance (SFBR) model [32,33,34]. This holds significant scientific importance for analyzing surface reflection characteristics and parameter inversion studies for various land cover types.
The Ross-Li models have found widespread application in diverse realms, such as correcting anisotropic reflection effects, monitoring dynamic changes in vegetation, estimating vegetation structural parameters, and generating global albedo products [8,35,36]. Recently, these models have been employed to correct scattered light in ground-based multi-angle observations [37], collaboratively invert vegetation structural characteristics with the PROSAIL model [38], correct the hotspot effect by geometric conditions (RossThick-LiSparseReciprocalChen, RTLSRC) [39], and characterize complex mountainous BRDF features and albedo inversion [40]. Nevertheless, these enhanced Ross-Li BRDF models primarily focused on simulating the anisotropic reflection of soil–vegetation systems with an emphasis on strong backscattering effects [34,41]. To enhance the portrayal of the anisotropic features of snow, Jiao et al. introduced a snow kernel within the RTLSR model framework, enhancing the representation of snow reflectance properties, termed the RTLSRS model [34]. Ding et al. conducted a comprehensive assessment of the capability of the snow kernel to represent snow reflective characteristics [5,6,41]. Their findings indicated that the RTLSRS model exhibits strong performance in describing snow BRDF features and retrieving albedo.
The latest versions of the Ross-Li model include kernels that incorporate isotropic reflection of the land surface, describe backward reflection of soil and vegetation systems, characterize strong forward reflection of snow, and adequately consider the hotspot effect (i.e., RossThick-LiSparseReciprocalChen-Snow, RTLSRCS), theoretically capable of effectively describing the BRDF/Albedo/Nadir BRDF Adjusted Reflectance (NBAR) characteristics of various surface types [41]. However, there remains a paucity of systematic and comprehensive evaluation of the enhanced Ross-Li models across diverse land cover types. Therefore, this study utilizes the global Polarization and Directionality of the Earth’s Reflectance (POLDER) BRDF database, which includes 16 International Geosphere-Biosphere Programme (IGBP) land cover types [9], to systematically assess the accuracy of enhanced Ross-Li models in characterizing BRDF signatures and inverting albedo for different land cover types. Furthermore, comparing the inversion results of the RTLSRCS and RTLSRC models can better demonstrate the effectiveness of the snow kernel across other land cover types. Such an evaluation holds substantial scientific significance for understanding the reflective characteristics of different land cover types, constructing natural surface BRDF models, and enhancing the accuracy of the satellite products.
The organization of this study is outlined as follows: Section 2 introduces the POLDER BRDF database, enhanced Ross-Li models, and evaluation approaches. Results and analysis of the Ross-Li models are presented in Section 3. Finally, Section 4 and Section 5 summarize potential discussions and key findings of this study.

2. Materials and Methods

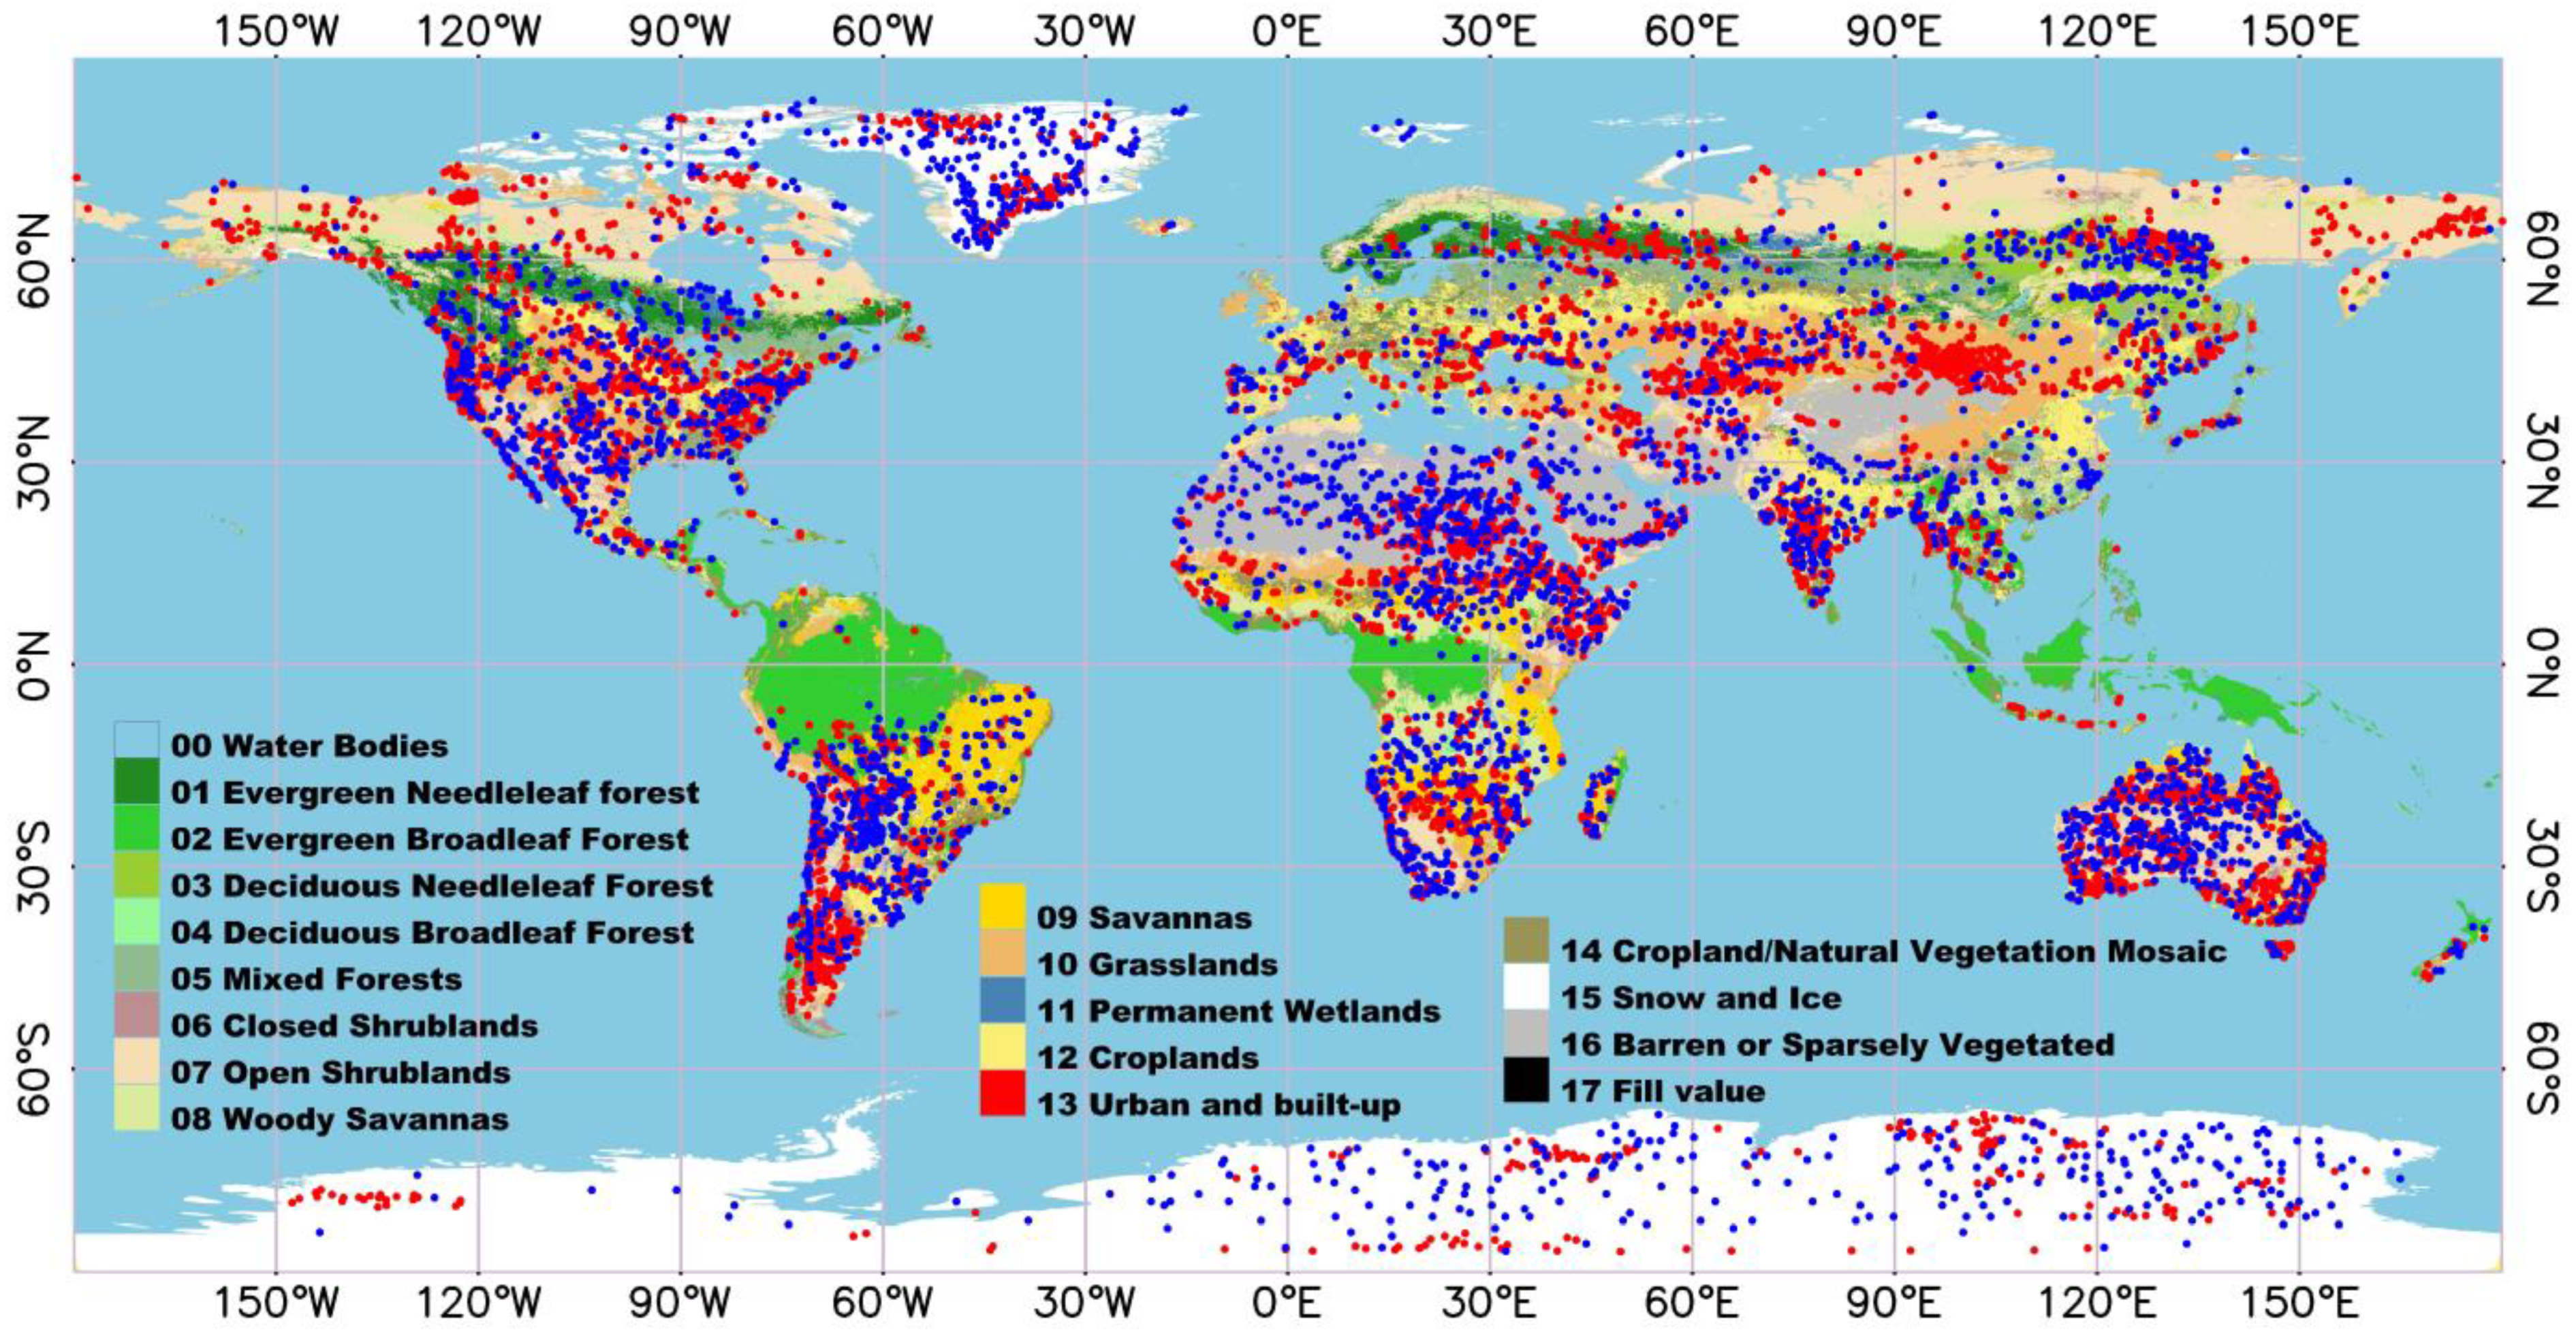
2.1. POLDER BRDF Database

The objective of the POLDER-3 instrument is to monitor Earth’s surface radiation characteristics, encompassing reflection and absorption properties across diverse environments such as land, ocean, and atmosphere. It facilitates the quantitative estimation and monitoring of remote sensing parameters, including aerosols, clouds, and surface albedo, thereby offering crucial support for research in domains like climate change, environmental conservation, and natural disasters. The POLDER instrument captures observations within an angle range of up to 60–70° and a relative azimuth angle range spanning nearly all directions from 0° to 360°. During the passage of the POLDER satellite, multiple observations of natural features are made, ensuring ample BRDF sampling of the target [9,42]. The POLDER BRDF database provides multi-angle reflectance data across six bands, spanning the visible and near-infrared (NIR) spectra. These POLDER multi-angle observations undergo atmospheric correction and cloud validation to derive the bidirectional reflectance factor of natural features. Stringent quality control measures are implemented for the POLDER BRDF database upon its release. However, given the focus of this study on evaluating enhanced Ross-Li models accuracy across diverse land cover types, data with homogeneity ≥ 90% from the POLDER BRDF database are initially filtered. Subsequently, considering the reflection characteristics of each land cover type, further elimination of unreasonable data is conducted (please refer to specific screening criteria in Table 1). Finally, observations with a number < 50 and unreasonable surface BRDF shapes are excluded. In total, 10,574 POLDER pixels, with their spatial distribution as shown in Figure 1, were utilized (6814 pixels from November 2005 to October 2006 and 3760 pixels from January to December 2008) to evaluate enhanced Ross-Li models’ capabilities in characterizing scattering features and retrieving albedo for diverse land cover types.
Table 1 presents the number of POLDER pixels, the average values and standard deviation of incident-observation geometric conditions, and reflectance in the red and NIR bands across 16 IGBP types. The variation in solar zenith angle (SZA) is primarily influenced by the spatial distribution of various surface types. For instance, Evergreen Needleleaf Forests (ENF), Deciduous Needleleaf Forests (DNF), and Snow and Ice (SI) are mainly found in middle and high latitudes, resulting in relatively high SZA in these regions. Specifically, the average SZAs for ENF and DNF are approximately 48° and 53°, respectively, while SI exhibits an average SZA of around 62°. In contrast, Barren or Sparsely Vegetated (BSV) is more prevalent in middle and low latitudes, where the SZA tends to be lower, with an approximate mean value of around 34°. Other land cover types are more prevalent in mid-latitude areas, where the overall average SZA is approximately 40°. Variations in viewing zenith angle (VZA) are minimal. The average VZA is approximately 44°, with a standard deviation of 2°, while the mean relative azimuth angle (RAA) spans the entire 2π space, averaging about 176° with a standard deviation of 20°. Despite the relatively large range of RAA values, the overall relative change is modest.
Among the 16 IGBP land cover types, the SI exhibits the highest reflectance, with a mean value of approximately 0.90 in the red and 0.84 in the NIR band, followed by BSV reflectance at approximately 0.30. Reflectance for other land cover types averages around 0.10 (0.25) in the red (NIR) band. The DNF and BSV reflectance demonstrate the highest standard deviation, indicating greater variability and uncertainty. The DNFs are primarily located in middle and high latitudes, areas notably influenced by snow cover. Conversely, the BSV reflectance shows considerable variability due to various factors, such as its complex composition [12]. Additionally, reflectance in the NIR band typically exceeds that in the red band, except for SI, primarily due to the relatively significant contribution of multiple reflections [43]. This pattern is reversed in the case of SI compared to other land cover types. The reflectance pattern of SI is highly anisotropic, markedly distinct from other natural surfaces, particularly evident under extensive incident-observation geometry conditions [5,6]. Analyzing the average angles and reflectance values of various land cover types in the global POLDER BRDF datasets has theoretical and reference significance for understanding the reflection characteristics of different land cover types, conducting satellite data quality control, and improving land surface classification accuracy.

2.2. Enhanced Ross-Li BRDF Models

The Ross-Li model posits that the reflection of natural objects comprises three components [4], which are defined as
R θ s , θ v , φ , λ = f iso λ + f vol λ K vol θ s , θ v , φ + f geo λ K geo θ s , θ v , φ
In this equation, R(θs, θv, φ, λ) is the surface reflectance. The isotropic scattering kernel describes the Lambertian surface, the volume scattering kernel Kvol(θs, θv, φ) describes continuous vegetation canopies, and the geometric optical kernel Kgeo(θs, θv, φ) describes discrete vegetation canopies. The coefficients for these three kernels are represented by fiso(λ), fvol(λ), and fgeo(λ), respectively.
Jiao et al. (2016) and Dong et al. (2019) modified the volume scattering and geometric optical kernels by considering the geometric conditions of illumination and observation [36,39], proposing an improved expression to better characterize the hotspot signatures, which are defined as
K RTC ( θ s , θ v , φ ) = ( π 2 ξ ) cos ξ + sin ξ cos θ s + cos θ v ( 1 + C 1 e ξ C 2 ) π 2
cos ξ = cos θ s cos θ v + sin θ s sin θ v cos φ
K LSRC ( θ s , θ v , φ , λ ) = O ( θ s , θ v , φ ) ( 1 + C 1 e ξ C 2 ) sec θ s sec θ v + 1 2 ( 1 + cos ξ ) sec θ s sec θ v
O ( θ s , θ v , φ ) = 1 π ( arccos X X 1 X 2 ) ( sec θ s + sec θ v )
X = h b D 2 + ( tan θ s tan θ v sin φ ) 2 sec θ s + sec θ v
D = tan 2 θ s tan 2 θ v 2 tan θ s tan θ v cos φ
θ = arctan ( b r tan θ )
In these equations, ξ is the phase angle, and we chose the hotspot parameters C1 = 0.5 and C2 = 3.4 to simplify the computation process [39]. We refer to the combined form of the KRTC(θs, θv, φ) and KLSRC(θs, θv, φ) kernel functions as the RTLSRC model.
To improve the depiction of snow reflectance properties, Jiao et al. (2019) developed a snow kernel within the framework of the Ross-Li model [34], which is defined as
R θ s , θ v , φ , λ = f iso λ + f vol λ K vol θ s , θ v , φ + f geo λ K geo θ s , θ v , φ + f snw λ K snw θ s , θ v , φ
In this equation, fsnw(λ) and Ksnw(θs, θv, φ) represent the weight coefficient and snow kernel, respectively. The Ksnw(θs, θv, φ) is defined as
K snw ( θ s , θ v , φ ) = R 0 ( θ s , θ v , φ ) ( 1 α f g ( θ s , θ v , φ ) ) + k 0
R 0 θ s , θ v , φ = B 1 + B 2 ( cos θ s + cos θ v ) + B 3 cos θ s cos θ v + P ( ξ ) 4 ( cos θ s + cos θ v )
P ( ξ ) = 11.1 e 0.087 ( 180 ξ ) + 1.1 e 0.014 ( 180 ξ )
f g ( θ s , θ v , φ ) = cos ξ exp ( cos ξ )
In these equations, R0(θs, θv, φ) denotes the reflectance of a semi-infinite snow layer [36]. We refer to the combined form of the KRTC(θs, θv, φ), KLSRC(θs, θv, φ), and Ksnw(θs, θv, φ) as the RTLSRCS model.
The weighting coefficients are utilized for the retrieval of the black-sky albedo (BSA) and white-sky albedo (WSA), which are defined as
B S A ( θ s , λ ) = 1 π 0 2 π 0 π / 2 R ( θ s , θ v , ϕ , λ ) sin θ v cos θ v d θ v d ϕ
W S A ( λ ) = 2 0 π / 2 B S A ( θ s , λ ) sin θ s cos θ s d θ s
The blue-sky albedo is calculated as a linear combination of BSA and WSA, which is defined as
ρ ( θ s ) = [ 1 P ] B S A ( θ s ) + P W S A
In this equation, ρs) is the blue-sky albedo, and P denotes the proportion of diffuse light.
For the shortwave broadband albedo of POLDER data, the conversion can be computed utilizing the formula proposed by Liang et al. [44,45], where the band conversion formula can be expressed as follows:
ρ = 0.112 ρ 1 + 0.388 ρ 2 0.266 ρ 3 + 0.668 ρ 4 + 0.0019
In this equation, ρ represents the shortwave broadband albedo of POLDER data, and ρi represents the spectral albedo of the POLDER data.

2.3. Evaluation Methods of the Enhanced Ross-Li Models

This paper begins with an assessment of the capabilities of two recently developed kernel-driven models in characterizing BRDF features across various land cover types. Following this, we conduct a comparative analysis to discern the discrepancies between these two models in terms of albedo inversion. Finally, we extended our comparison to their performance in the inversion of NBAR. Such systematic and comprehensive capabilities of the kernel-driven models in describing BRDF/Albedo/NBAR characteristics for various land cover types are crucial for understanding the reflectance characteristics and parameter inversion of different land cover types. In this study, we utilize several quality assessment indices to evaluate the performance of the models, including the coefficient of determination (R2), root mean square error (RMSE), normalized RMSE (NRMSE), mean relative error (MRE), and bias values. Additionally, we employ the T-test to evaluate the disparities between the RTLSRC and RTLSRCS models concerning the retrieval of albedo and NBAR, as expressed in Equations (18)–(22).
R M S E = i = 1 n ( y 2 y 1 ) 2 n
N R M S E = R M S E y m a x y m i n × 100 %
M R E = 1 n i = 1 n y 2 y 1 y 1 × 100 %
b i a s = i = 1 n ( y 2 y 1 ) n
T = X 1 X 2 ( N 1 1 ) S 1 2 + ( N 2 1 ) S 2 2 N 1 + N 2 2 ( 1 N 1 + 1 N 2 )
In these equations, y1 denotes the POLDER reflectance, y2 denotes the reflectance of model simulation, and n denotes the number of samples. X1 and X2 correspond to the sample means, S1 and S2 represent the standard deviations of the samples, and N1 and N2 represent the numbers of samples.

3. Results and Analysis

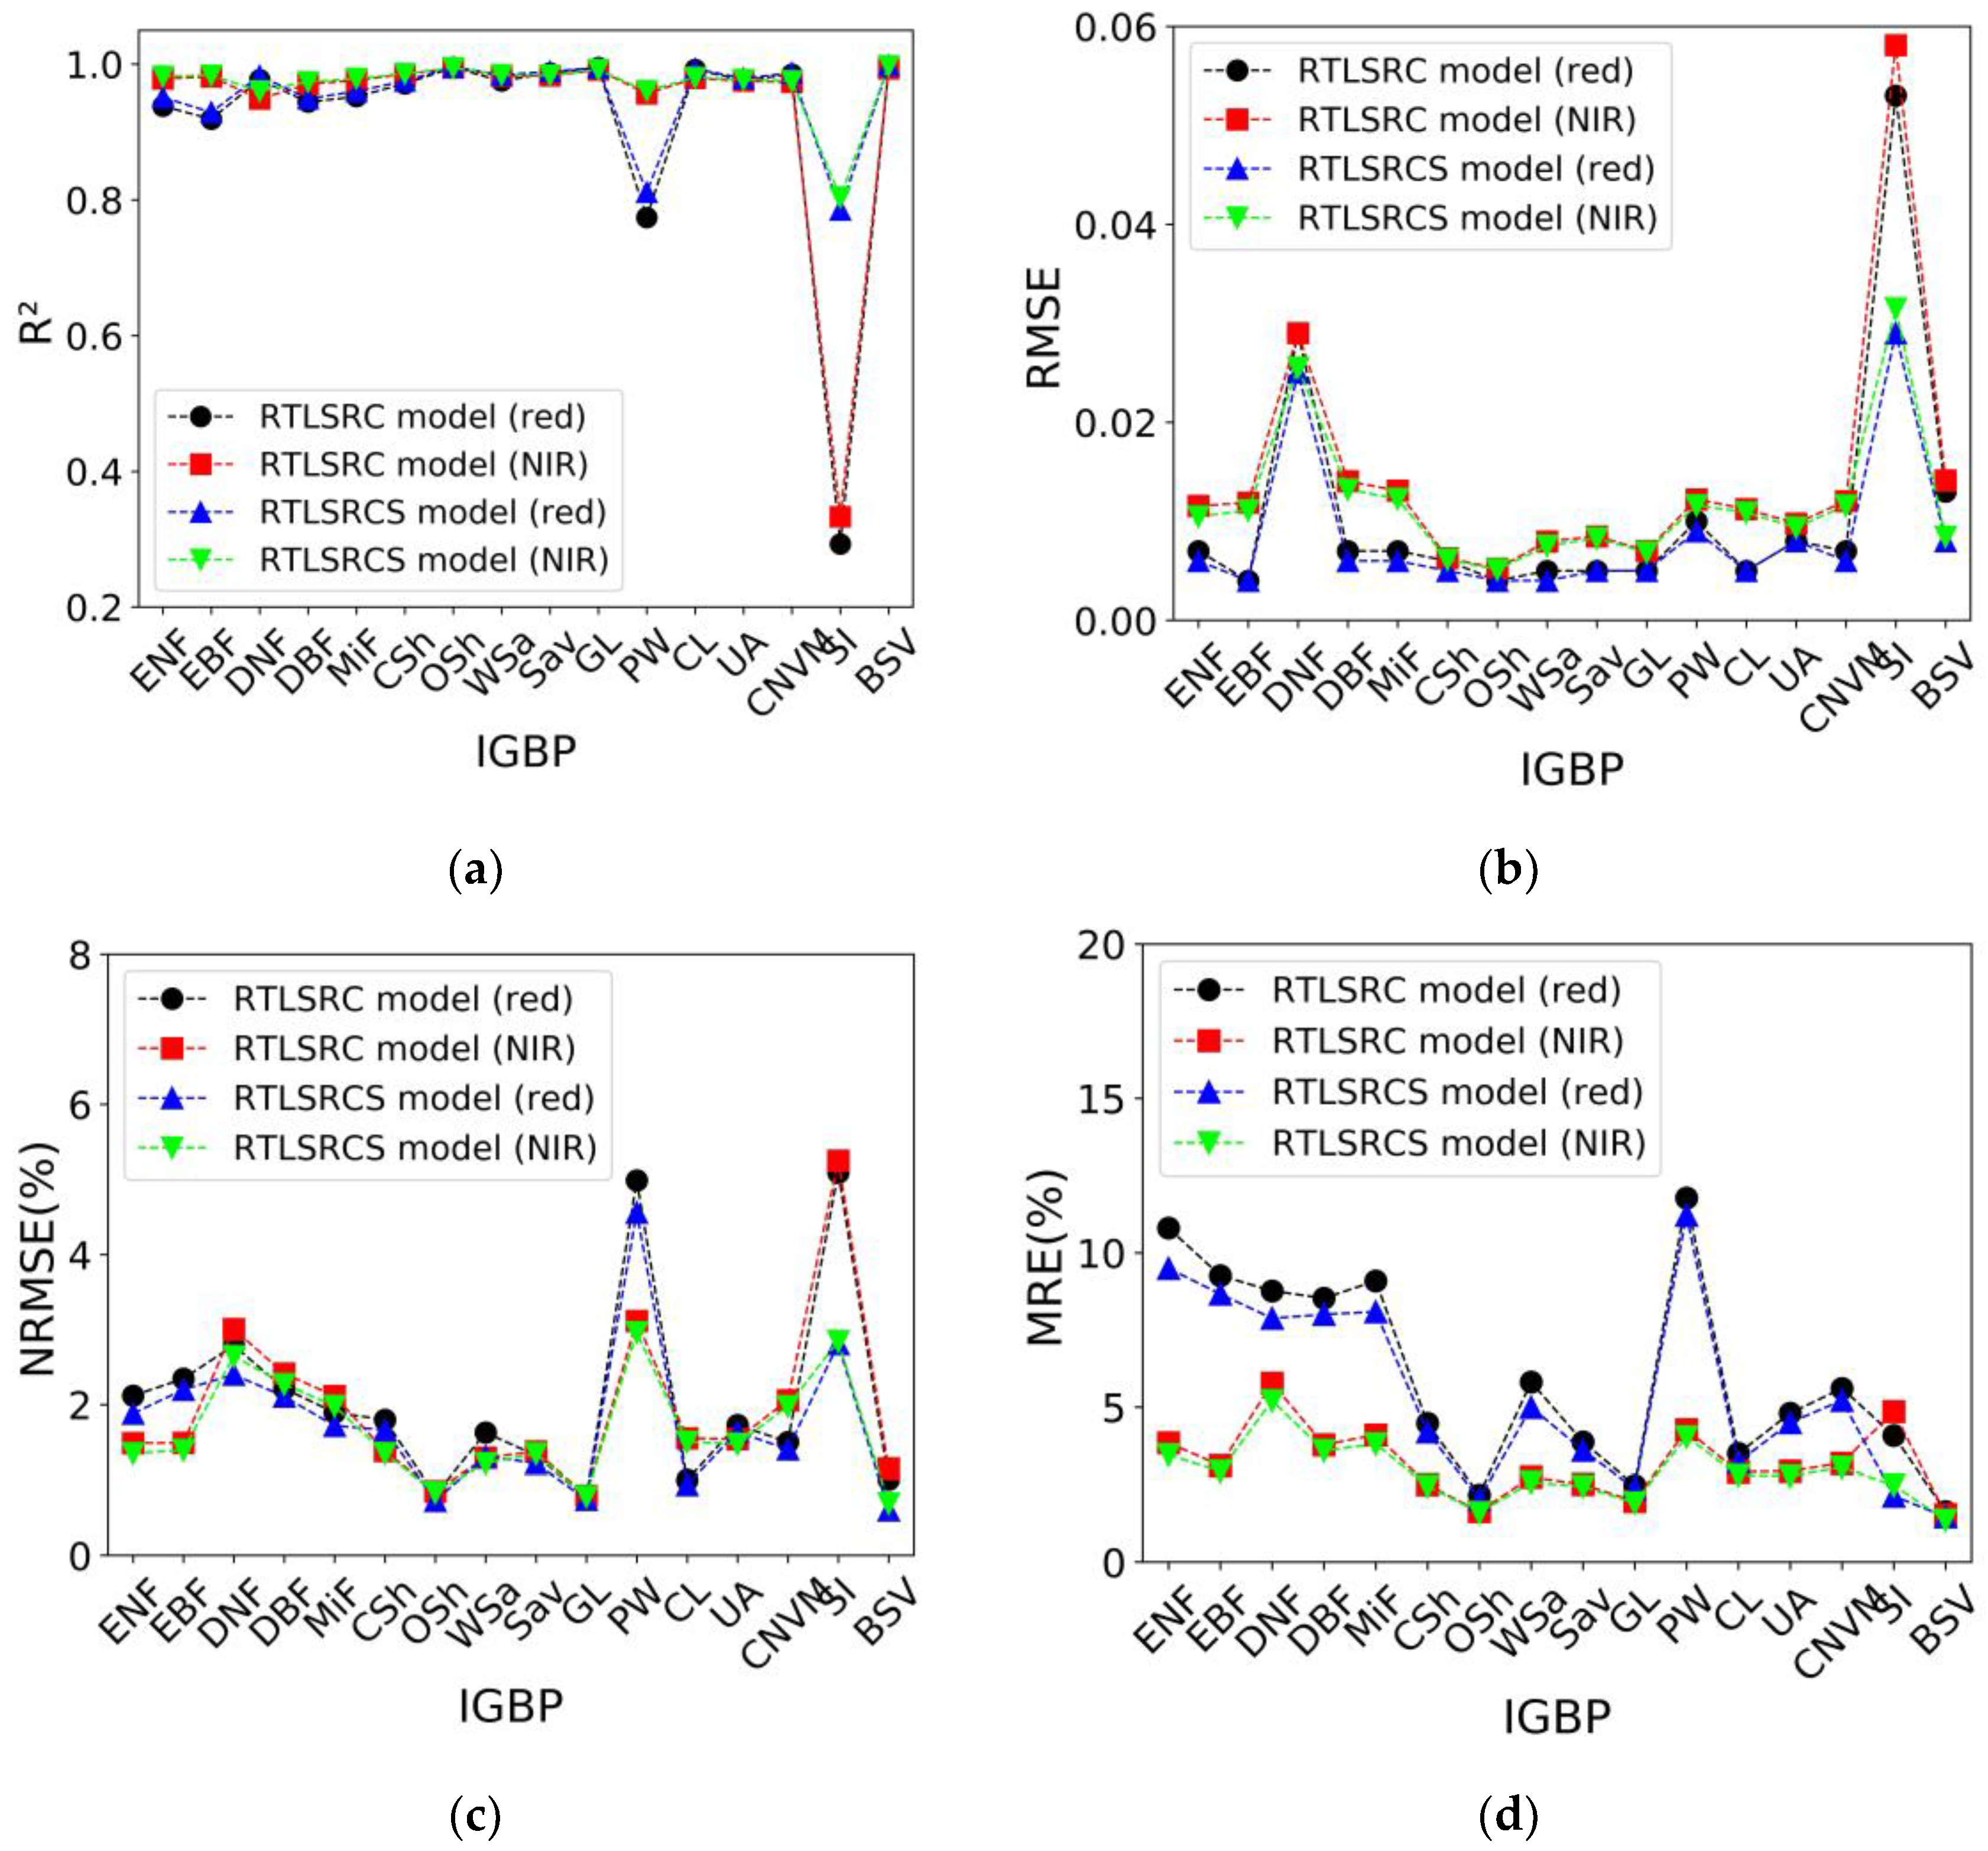
3.1. Evaluating the Enhanced Ross-Li Models to Characterize the BRDF Characteristics

Firstly, we comprehensively validate the fitting accuracy of the RTLSRC and RTLSRCS models for various land cover types using the global POLDER BRDF datasets in Figure 2. Since the bias values of these two models fitting the POLDER data are close to 0, we do not discuss them. For the overall R2 values, both versions of the enhanced Ross-Li models achieve R2 greater than 0.9 for most land cover types. However, for the SI land cover type, the RTLSRC model exhibits relatively poor fitting results, with an overall R2 of approximately 0.3. Conversely, the RTLSRCS model, designed specifically for the SI, significantly enhances the accuracy compared to the RTLSRC model, achieving an overall R2 of approximately 0.8. In contrast, these models demonstrate relatively poor performance for PW in the red band, with an R2 of approximately 0.8. This phenomenon may be attributed to the limited availability of PW data and the differences in BRDF characteristics between PW and other land cover types [10]. For the overall RMSE values, both models yield RMSE values of approximately 0.01 for most land cover types. However, the RMSE results of these two models for DNF and SI are relatively higher. The RMSE values for SI (DNF) using the RTLSRC model are approximately 0.056 (0.029), whereas for SI (DNF) using the RTLSRCS model, there is a significant reduction in RMSE values to approximately 0.030 (0.025). This is because the RTLSRCS model better captures the reflection characteristics of SI. As for DNF, although we conducted rigorous quality control, its higher SZA and reflectance (Table 1) compared to others may be influenced by snow cover. Regarding BSV, the RMSE values fitted by the RTLSRCS model (~0.008) are significantly lower than those of the RTLSRC model (~0.014), possibly due to BSV exhibiting relatively strong forward reflection characteristics compared to others. Additionally, both models demonstrate better performance in fitting RMSE results in the red band compared to the NIR band, attributable to the lower reflectance in the red band relative to the NIR band, except for SI.
To reduce the difference in reflectance magnitude of different surface types and wavelengths, we further utilize NRMSE and MRE values to assess the accuracy of these two models. For the overall NRMSE values, both versions of the enhanced Ross-Li models yield results below 6% for most cases, with relatively poorer fits observed for DNF, PW, and SI. Regarding SI, the results of the RTLSRC model still exhibit issues, whereas the performance of the RTLSRCS model, as normalized by NRMSE values, approaches that of other types. Thus, the improvements made to the RTLSRCS model for SI are deemed highly effective. The RTLSRCS model demonstrates notable enhancements in fitting accuracy relative to the RTLSRC model, particularly in the red and NIR bands, sequentially for SI, BSV, DNF, and PW, with average NRMSE values reduced by 2.34%, 0.43%, 0.37%, and 0.29%, respectively. For the overall MRE values, both models generally yield results below 10%, showing significant disparities between the different bands. In the NIR band, both models generally demonstrate lower MRE values compared to the red band, except for SI, where the trend is reversed. The RTLSRCS model demonstrates notable improvements in fitting accuracy relative to the RTLSRC model, particularly in the red band, sequentially for SI, ENF, MiF, and DNF, with MRE values reduced by 1.95%, 1.30%, 0.89%, and 0.82%, respectively. Conversely, the RTLSRCS model shows significant improvements in fitting accuracy relative to the RTLSRC model in the NIR band, particularly for SI, DNF, and ENF, with reductions of 2.37%, 0.57%, and 0.39%, respectively. In summary, both enhanced Ross-Li models exhibit high fitting accuracy across all 16 land cover types. However, for SI, the RTLSRC model demonstrates relatively poor fitting performance. This is attributed to the model’s focus on soil–vegetation systems, making it unsuitable for characterizing the reflective characteristics of snow. In contrast, the RTLSRCS model, designed specifically for SI, shows a significant improvement in accuracy over the RTLSRC model. For DNF, ENF, and BSV, the RTLSRCS model demonstrates noticeable improvements in fitting POLDER data accuracy compared to the RTLSRC model. For other land cover types, the RTLSRCS model shows some degree of improvement in fitting accuracy relative to the RTLSRC model. Regarding PW, both models demonstrate relatively poor performance in the red band, potentially attributed to the limited availability of PW data and variations in BRDF characteristics when compared to other surface types. These results indicate that the RTLSRCS model is suitable for various IGBP types. The accuracy of the RTLSRC model notably diminishes, particularly for land cover types characterized by high reflectance and strong forward reflection, such as SI, BSV, and DNF.

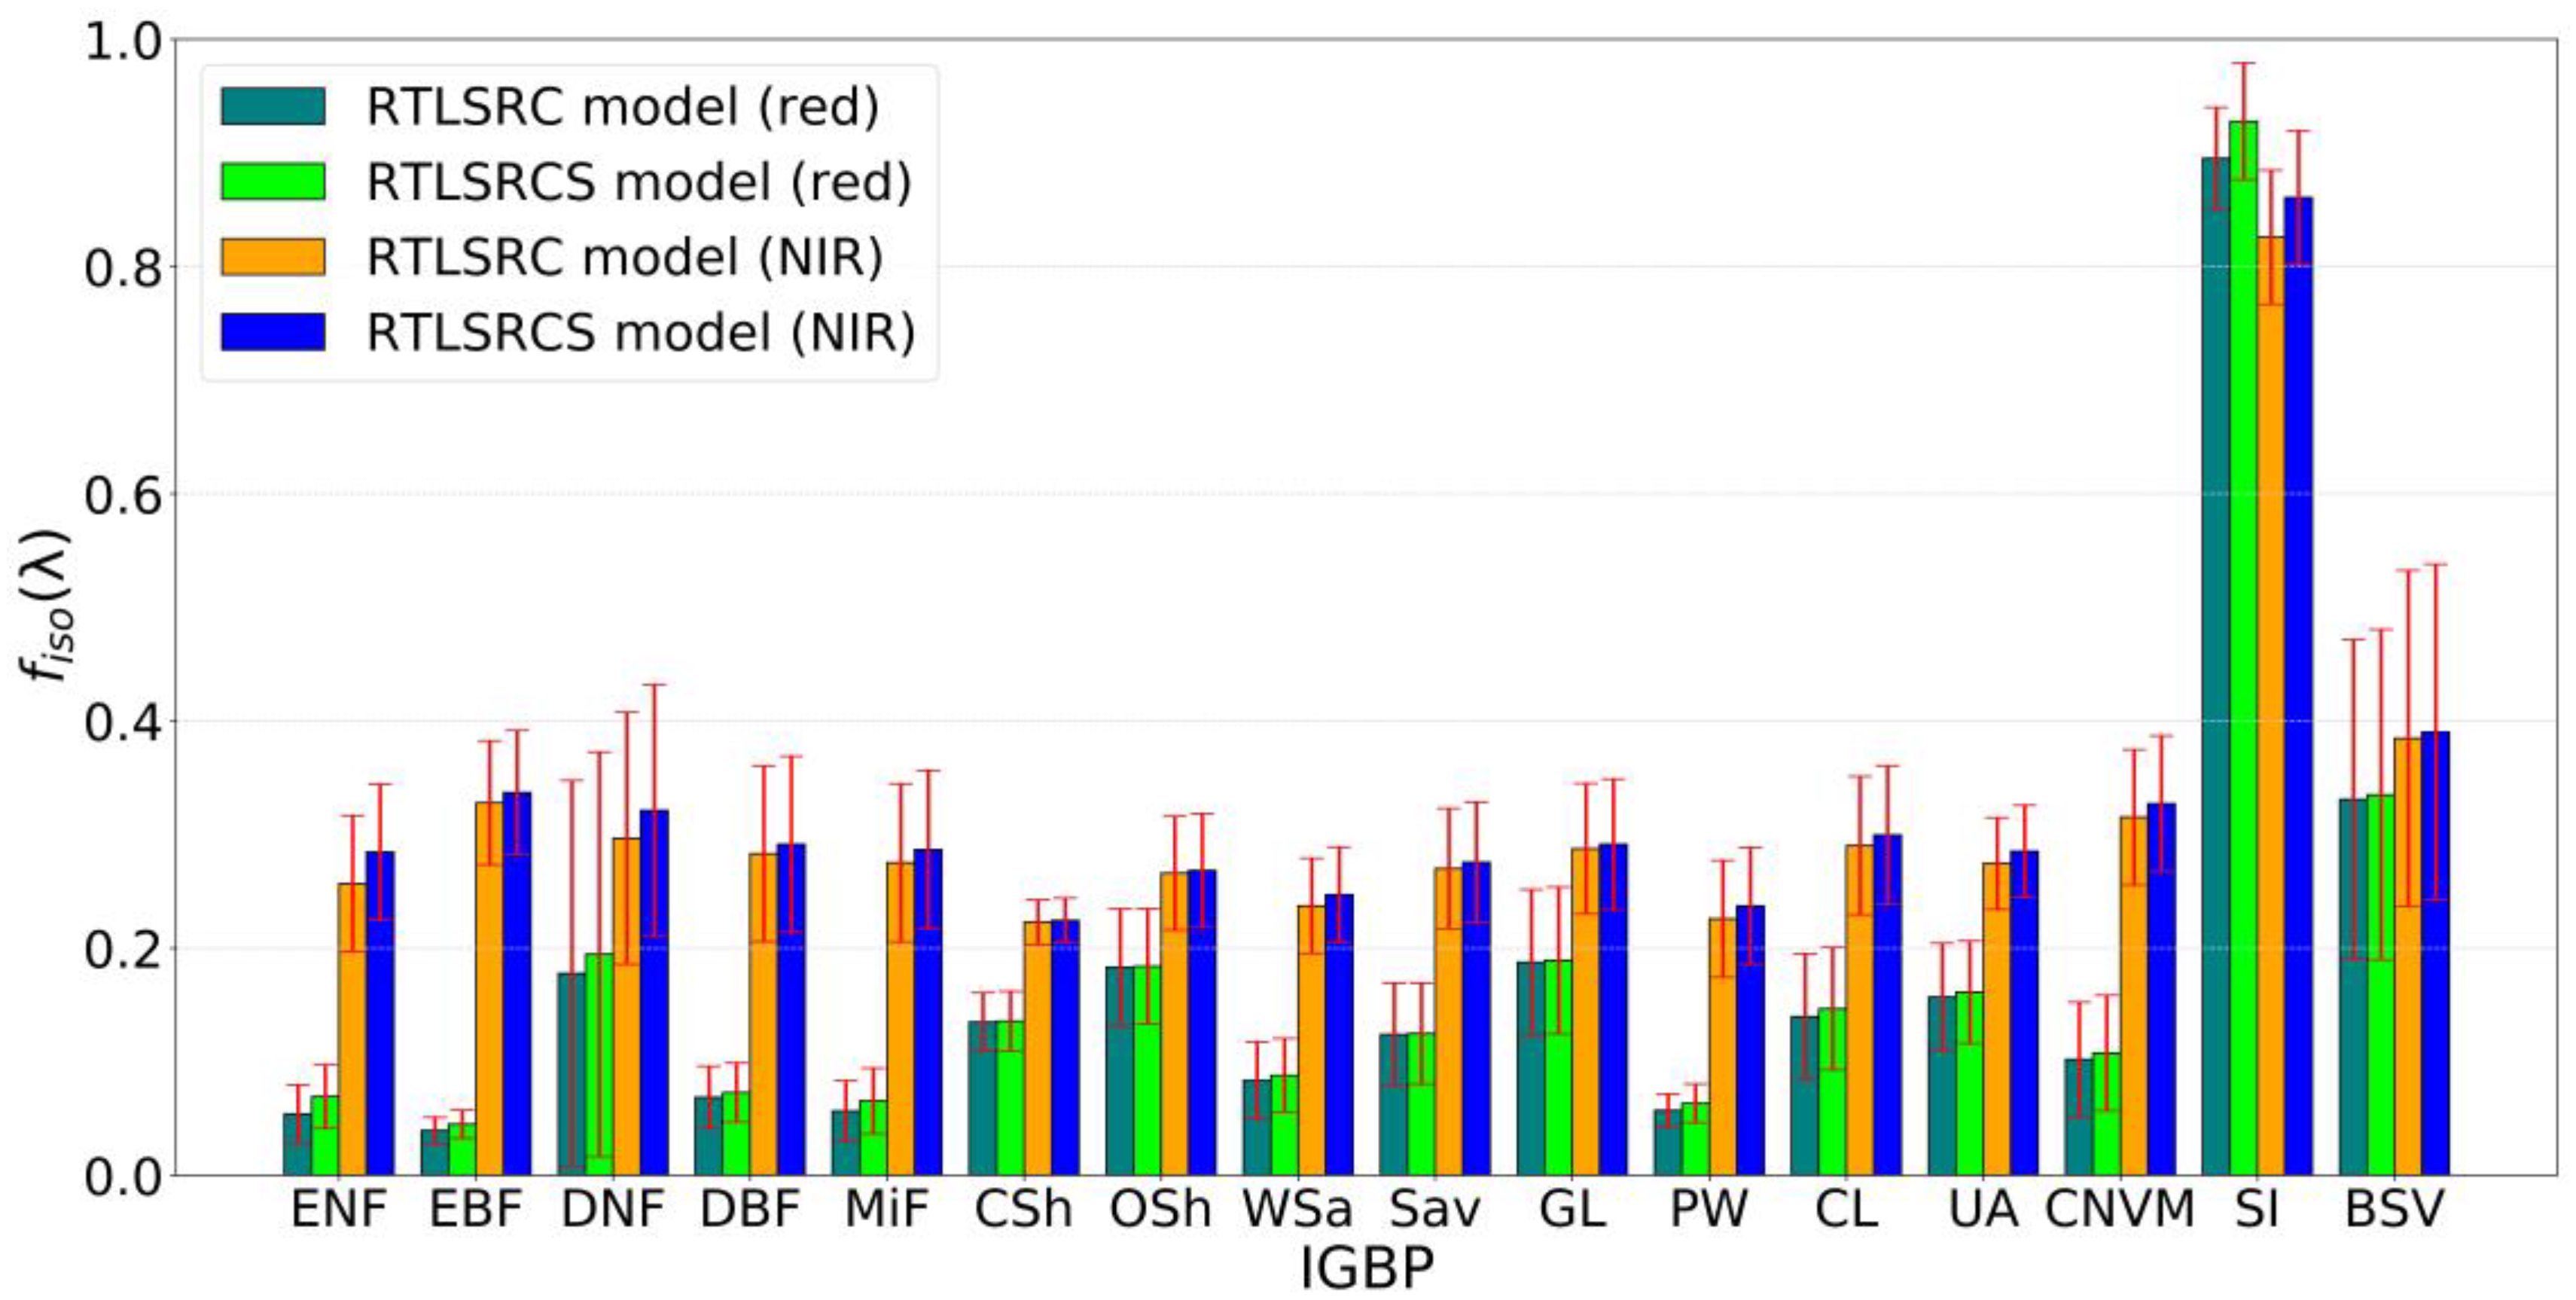
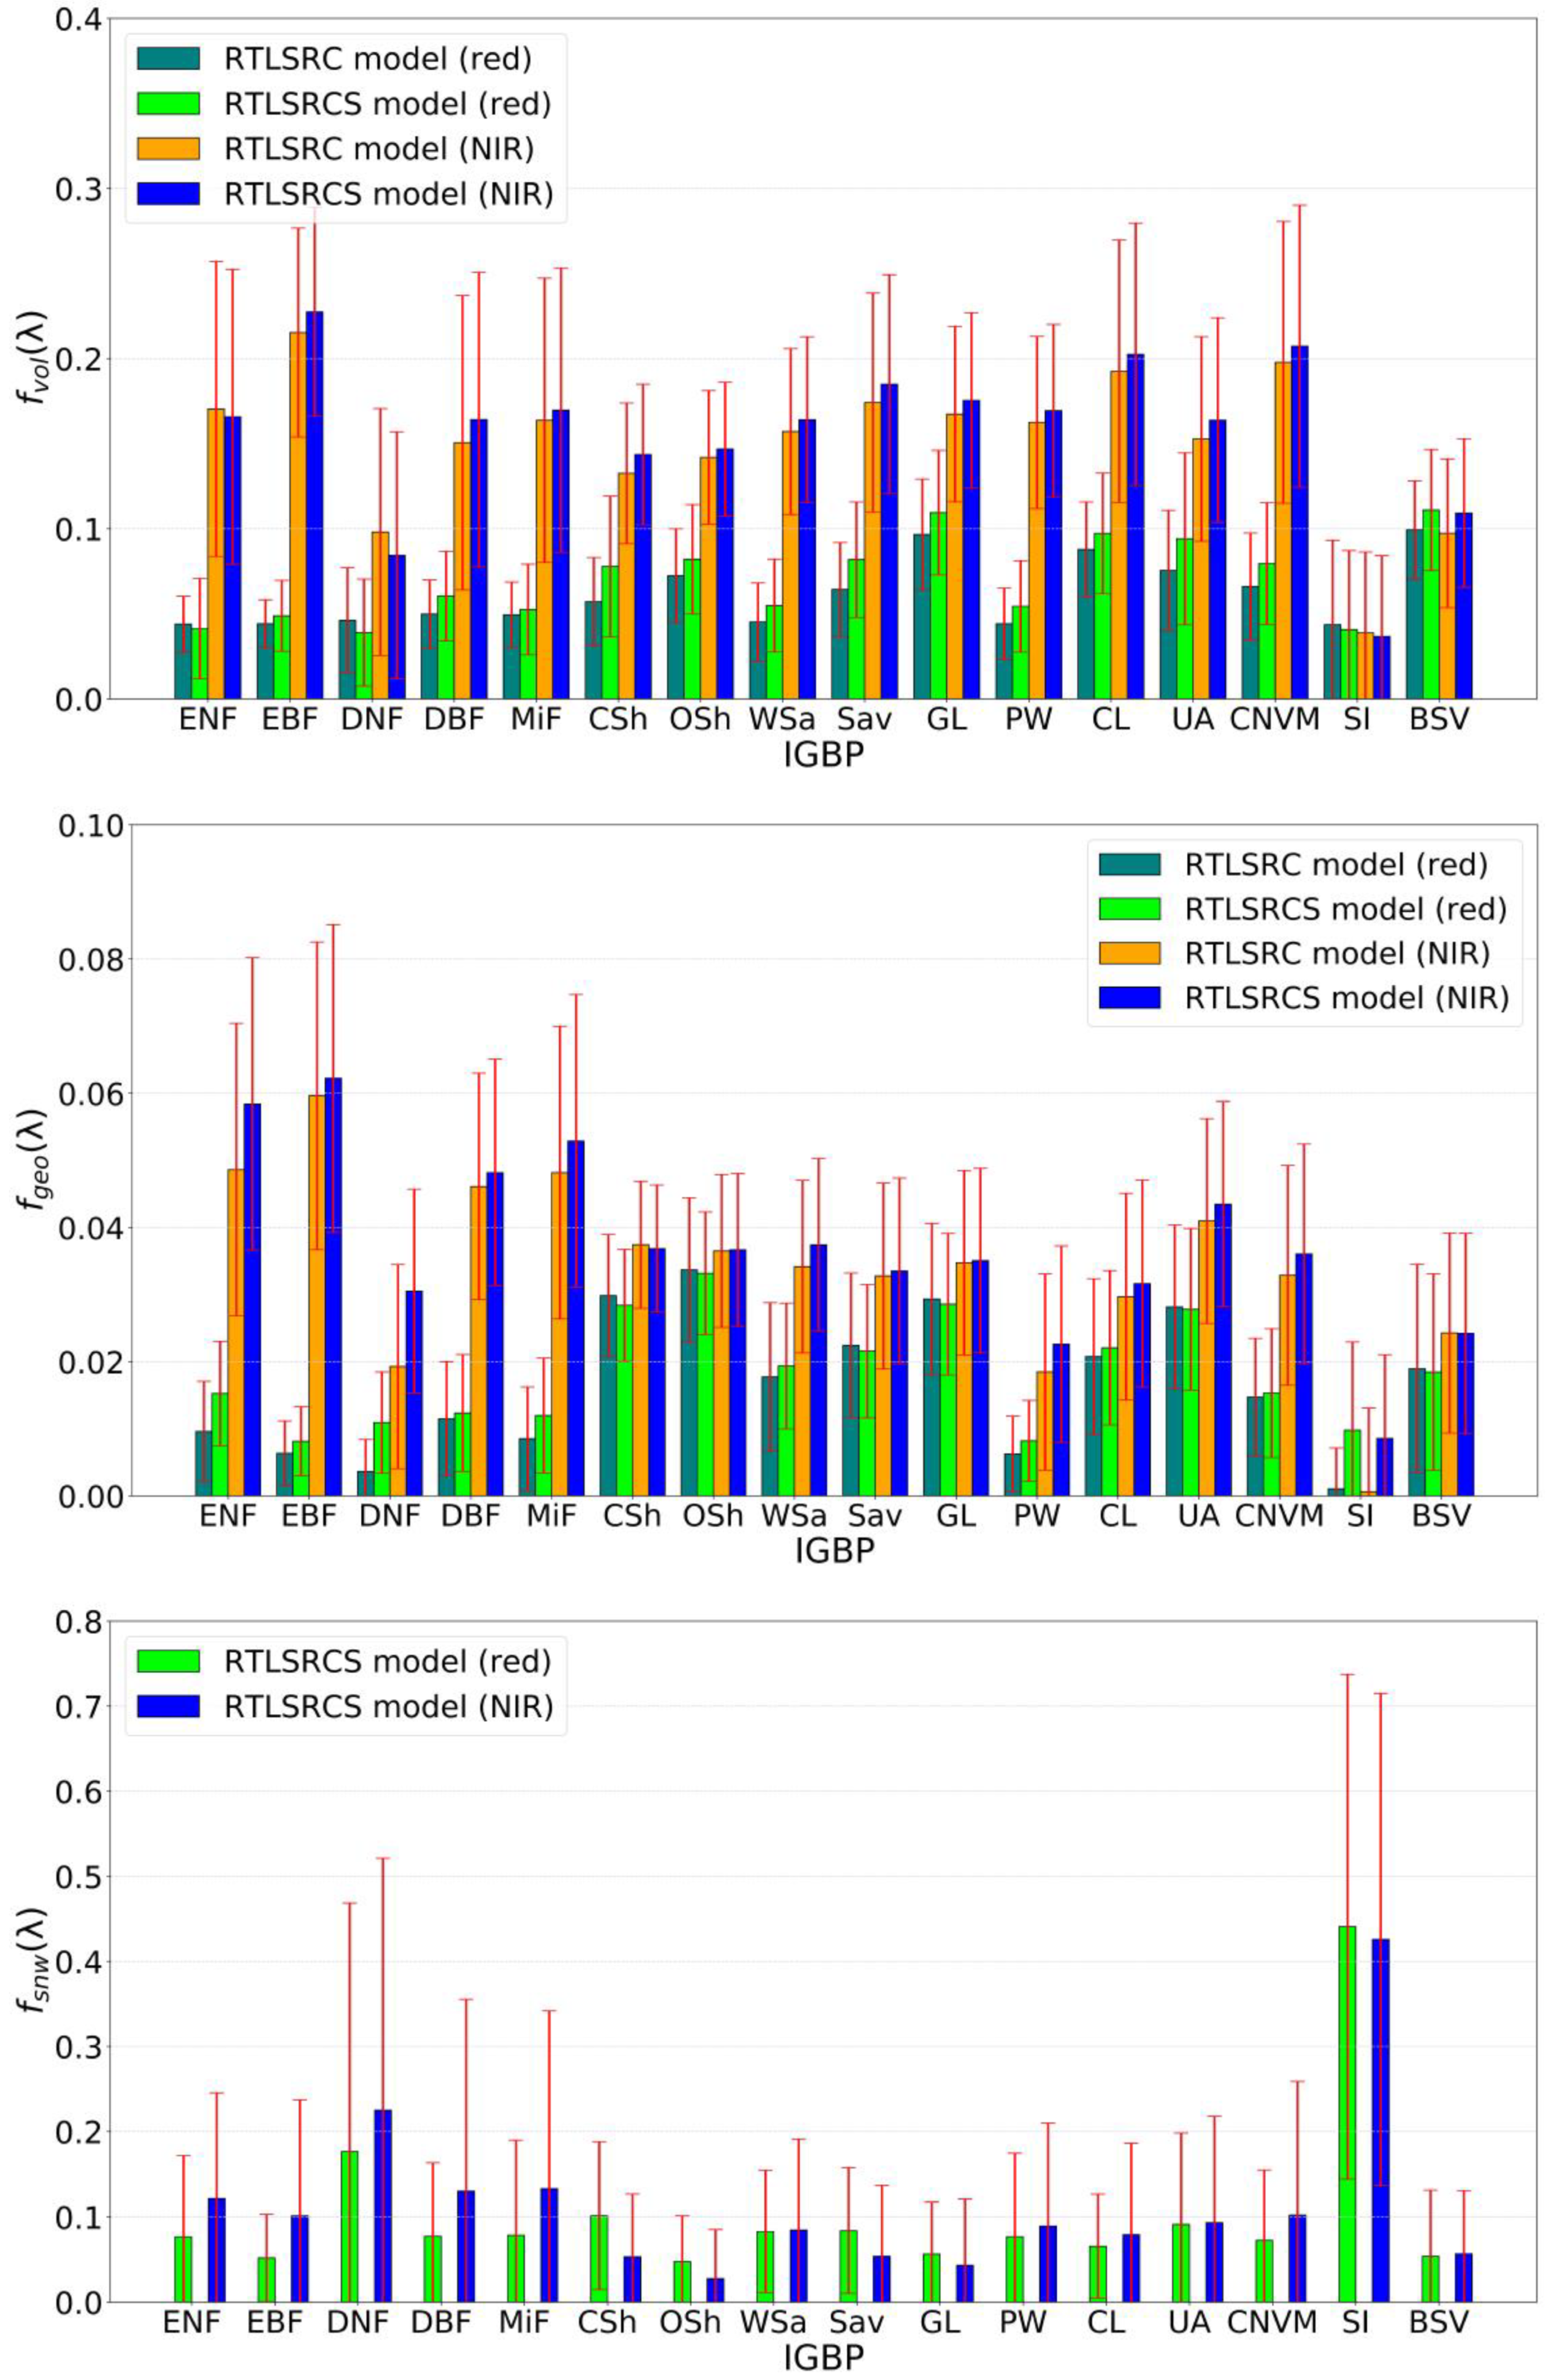
3.2. Analysis of BRDF Parameter Characteristics of the Enhanced Ross-Li Models

We analyze the differences in BRDF parameters between the RTLSRC and RTLSRCS models across 16 IGBP types in Figure 3. For the fiso(λ) parameter, both models exhibit variations for the fiso(λ) parameter. However, there is a high degree of consistency in the fiso(λ) values between these two models, primarily due to the influence of differences in reflectance among various land cover types. The fiso(λ) parameter represents the nadir reflectance (i.e., SZA = 0, VZA = 0, and RAA = 0). The fiso(λ) values from the RTLSRCS model are slightly higher than those from the RTLSRC model, with minimal differences observed. Across both models, the fiso(λ) values in the NIR band are higher than those in the red band, attributed to the influence of higher reflectance in the NIR band, except for SI. Notably, the fiso(λ) values fitted by both models for DNF and BSV exhibit relatively larger variability compared to other land cover types, with standard deviations in the red (NIR) band approximately 0.17 (0.11) and 0.14 (0.15), respectively, while the standard deviations for other land cover types are generally below 0.08. Both models also demonstrate relatively high consistency in their fvol(λ) parameter. The fvol(λ) values from the RTLSRCS model are slightly higher than those from the RTLSRC model, with minimal differences observed. Across both models, the fvol(λ) values in the NIR band are higher than those in the red band, except for SI and BSV. The fvol(λ) values fitted by both models exhibit larger variability in the different bands. The average standard deviation of the fvol(λ) values from the RTLSRC (RTLSRCS) model is approximately 0.03 (0.03) in the red band and approximately 0.05 (0.06) in the NIR band. For the fgeo(λ) parameter, the values from both models generally follow the same patterns as those of the fiso(λ) and fvol(λ) parameters. However, the magnitude of the fgeo(λ) parameter is relatively lower overall compared to the other parameters, typically ranging from 0 to 0.06 for 16 IGBP types. For SI, the results from the RTLSRC model are predominantly close to 0. This suggests that for SI, it may be feasible to consider removing the Kgeo(θs, θv, φ) kernel function, thereby reducing the number of multi-angle observations. This has significant implications for enhancing the efficiency of model inversion while maintaining inversion accuracy. Regarding the fsnw(λ) parameter, its significance persists across various land cover types. The Ksnw(θs, θv, φ) kernel function plays a key role in improving the inversion accuracy of these two models. Among the land cover types, SI demonstrates the highest importance, with the most notable enhancement observed in the RTLSRC model. Substantial improvements are also evident in DNF and BSV. For other land cover types, the range of fsnw(λ) parameter values is generally less than 0.1, particularly in the red band. These results demonstrate that the snow kernel within the Ross-Li model framework plays a role in improving the accuracy of model fitting for various land cover types. The parameter values of fsnw(λ) exhibit significant differences across different land cover types, indicating variations in the efficacy of the snow kernel for improving model accuracy across different land cover types. The fsnw(λ) parameter demonstrates greater importance in land cover types characterized by high reflectance and prominent forward scattering or influenced by snow accumulation. By analyzing the variations in BRDF model parameters across different land cover types, it becomes crucial to select the appropriate combination of kernel functions for each land cover type. This optimization of kernel functions allows for the reduction of multi-angle observation fitting models, thereby enhancing the efficiency of model inversion while ensuring inversion accuracy. For instance, pure snow-covered surfaces may benefit from the utilization of isotropic and snow (i.e., Ksnw(θs, θv, φ)) kernels. Furthermore, analyzing the differences in the retrieval of BRDF parameters by these two models is crucial for establishing the relationship between their kernel parameters and improving the accuracy of the Moderate Resolution Imaging Spectroradiometer (MODIS) MCD43 products. These results also demonstrate the validity and reliability of our previous approach for calibrating MODIS BRDF parameter products (i.e., MCD43A1) [41].

3.3. Comparison of Albedo Retrieval Results Using the Enhanced Ross-Li Models

We compare the differences between the RTLSRC and RTLSRCS models in the inversion of albedo for various land cover types using the globally distributed POLDER BRDF datasets in Figure 4, which uses the RTLSRCS model as ‘reference data’ to assess the differences in the inversion of albedo between the RTLSRC model. This is because the RTLSRCS model has higher accuracy in fitting the globally distributed POLDER datasets, thus theoretically providing higher precision in albedo inversion. Firstly, we examine the disparities between the RTLSRC and RTLSRCS models in the inversion of narrowband albedo. The overall R2 results for albedo inversion by both models demonstrate a very high level of consistency, generally exceeding 0.9, but notable differences exist in the inversion of both BSA and WSA between these two models. While BSA exhibits high consistency across land cover types, with SI showing relatively smaller R2 values, WSA demonstrates significant differences in inversion between the models, particularly notable for ENF, EBF, CSh, WSa, and PW, resulting in lower overall R2 values, particularly in the red band. This may be attributed to the stronger anisotropic characteristics exhibited in the red band. Interestingly, for SI, its results are opposite to other land cover types; the consistency between these two models in BSA inversion for SI is poorer, possibly due to the differences in BRDF characteristics between SI and other land cover types. Regarding the RMSE results, the albedo inversion results from both models demonstrate high accuracy, with overall RMSE values consistently below 0.02, except for SI. In terms of BSA, they demonstrate very high consistency for other land cover types, except for DNF and SI. However, there are notable disparities in the albedo inversion outcomes for WSA, particularly for ENF, EBF, DBF, UA, and SI. The RMSE values are relatively higher, exceeding 0.01, especially in the NIR band. Interestingly, for SI, the consistency in WSA inversion between these two models is superior to that in BSA, which is opposite to other land cover types. Concerning the bias results, there is very high consistency among other land cover types for BSA, except for SI. The RTLSRC model exhibits significant underestimation compared to the RTLSRC model in BSA inversion for this land cover type, underestimating by 0.015 and 0.017 in the red and NIR bands, respectively. For WSA, the RTLSRC model demonstrates a noticeable underestimation compared to the RTLSRC model, particularly in ENF and SI, with an overall underestimation of approximately 0.01. In terms of the NRMSE results, for BSA, there is very high consistency among various land cover types (NRMSE < 2%), except for SI, where the NRMSE value for this land cover type is approximately 4.5%. Concerning WSA, it is similar to other evaluation metrics, showing significant differences in ENF, CSh, and PW (NRMSE = ~4.0%), especially in the red band, with an NRMSE value of approximately 6.0%. Regarding the MRE results, for BSA, there is relatively high consistency among various land cover types (MRE < 3.5%). However, for WSA, there are larger differences in the inversion albedo in the red band, with an MRE value of approximately 9.7% for ENF, while for EBF, MiF, WSa, and GNVM, the MRE values are approximately 5.0%. The discrepancy may be attributed to the fact that WSA is derived from integrating BSA, thus magnifying the disparity between the two models in BSA.
Subsequently, we conducted a T-test on the albedo inverted by these two models to better illustrate the differences in albedo inversion between the two enhanced Ross-Li models in Figure 5a. The overall T values in BSA are essentially close to 0, while for SI, the T value is generally higher, approaching 6.4 in the BSA. Various land cover types exhibit significant differences in WSA, particularly in the red band. Higher T values are predominantly associated with ENF, EBF, UA, and SI, approximately 3.3, 2.6, 2.1, and 4.6, respectively. Regarding the overall p values, in BSA, only SI has a p value less than 0.05 in Figure 5b, while in WSA, the significant p values (p < 0.05) mainly include ENF, EBF, and SI. These results indicate significant differences between the BSA inversion results of these two models in SI and significant differences between the WSA inversion results of the RTLSRC and RTLSRCS models in ENF, EBF, and SI. These findings represent statistically significant differences that cannot be overlooked. In general, the albedo inversions by the RTLSRC and RTLSRCS models exhibit very high consistency for various land cover types, particularly in BSA, except for SI. However, significant differences still exist between these two models, especially in calculating WSA, particularly evident in ENF, EBF, and SI, where the albedo inversions by these two models show significant discrepancies (p < 0.05). Regarding SI, substantial differences are observed between the albedo inversions by these two models, both in characterizing BRDF features and estimating albedo. These differences are significant and cannot be ignored. Therefore, using the RTLSRC model is not recommended for characterizing BRDF features and albedo inversion for SI since this model is not appropriate for this particular land cover type.
Table 2, Table 3 and Table 4 show the comparison results of the RTLSRC and RTLSRCS models for the inversion of shortwave albedo across 16 land cover types. The overall R2 results of these two models are mostly greater than 0.9, except for ENF and CSh in shortwave WSA, indicating very high consistency in shortwave albedo inversion, especially in shortwave BSA and blue-sky albedo, except for SI. Regarding the overall RMSE results, the trends for shortwave broadband albedo and narrowband albedo are generally consistent, with RMSE values approximately less than 0.01, except for SI. The differences between shortwave WSA are relatively larger, while the differences in shortwave BSA inverted by these two models are greater than in shortwave WSA for SI. The bias results of these two models exhibit high consistency, which is similar to the conclusions drawn for narrowband albedo, with overall biases less than 0.01, except for SI. Concerning the NRMSE results, for shortwave BSA and blue-sky albedo, the inversion results of these two models show very high consistency among other land cover types (NRMSE < 3%), except for SI. However, in shortwave WSA, significant differences are observed in ENF, CSh, PW, and UA, with NRMSE values of approximately 8.2%, 6.1%, 5.8%, and 5.5%, respectively. Regarding the MRE results, for shortwave BSA, there is relatively high consistency among various land cover types (MRE < 2.0%). However, in shortwave WSA, there are larger differences in the inverted albedo, with MRE values of approximately 4.4%, 2.4%, and 2.7% for ENF, WSa, and UA, respectively. Then, we further conducted a T-test on the inversion of broadband albedo by these two models to better demonstrate the differences in their inversion results. For shortwave BSA, the p value is less than 0.05 only for SI, indicating a significant difference. However, for shortwave WSA, the results from the RTLSRC model exhibit significant differences (i.e., p < 0.05) compared to the RTLSRCS model in ENF, EBF, CSh, WSa, CL, UA, and SI. It should be noted that for blue-sky albedo, only SI shows a p value less than 0.05, as blue-sky albedo is a linear weighting of shortwave BSA and WSA, and considering that the POLDER BRDF dataset is primarily acquired under clear-sky conditions, the weight of shortwave BSA is greater in computing shortwave blue-sky albedo, resulting in a value closer to shortwave BSA. In summary, the overall results of the RTLSRC and RTLSRCS models for albedo inversion are similar to the conclusions drawn for narrowband albedo. These two models exhibit significant differences in shortwave WSA inversion, such as ENF, WSa, UA, and SI, while they show high consistency in shortwave BSA and blue-sky albedo results, except for SI.

3.4. Comparative Analysis of NBAR Inversion Results from the Enhanced Ross-Li Models

Finally, we further examine the disparities between the RTLSRC and RTLSRCS models in the inversion of the NBAR values across 16 land cover types. Figure 6 illustrates the average values and standard deviation of NBAR values obtained from both the RTLSRC and RTLSRCS models. The NBAR values inverted by these two models exhibit remarkable consistency across various IGBP types, both in terms of average values and standard deviation. However, the consistency of NBAR results between these two models is relatively poor for SI. In general, the RTLSRC model tends to be overestimated compared with the results of the NBAR retrieved by the RTLSRCS model, which is consistent with our previous research findings [41]. To better compare the differences in the inversion of NBAR results across various land cover types between these two models, we further conducted statistical analysis and T-test on both other 15 land cover types (i.e., LC15) and SI. Table 5 presents the comparison results of the RTLSRC and RTLSRCS models for the inversion of NAR values across LC15 and SI. Clearly, the NBAR values inverted by the RTLSRC and RTLSRCS models exhibit very high consistency for LC15, and the statistical results reveal no significant disparities between these two models (p > 0.05). However, overall R2 values of the inverted results from these two models are relatively lower compared to other land cover types for SI (R2 < 0.9), and the RMSE results approximate 0.03. Additionally, the RTLSRC model tends to overestimate compared to the RTLSRCS model, with an overall bias value approximating 0.024. This observation is consistent with our previous comparisons using MODIS data. Furthermore, a T-test was conducted on the NBAR values inverted by these two models, revealing significant statistical differences (p < 0.05). Therefore, the differences in the inverted results from these two enhanced Ross-Li models can be considered negligible across the other 15 land cover types. However, there are significant discrepancies in the NBAR values inverted by these two models for SI (p < 0.05). Specifically, the RTLSRC model tends to overestimate compared to the RTLSRCS model, with a noticeable bias of approximately 0.024. Therefore, it is not recommended to use the RTLSRC model to invert the NBAR value for SI.
We further validated the variations in the inverted NBAR values for SI with respect to SZA in Figure 7, as previously verified using MODIS data. Overall, these findings are consistent with our earlier observations regarding the changes in SZA. Specifically, between SZA = 30° to 55°, the differences in the average NBAR values inverted by these two models are relatively minor for SI, but there is a relatively large variation in standard deviation. Moreover, as the SZA increases, the difference in the inverted NBAR values between these two models gradually decreases. This phenomenon is attributed to the transitional BRDF shape exhibited by SI within the SZA range of 30° to 55°. However, for SZA values ranging from 55° to 74°, the NBAR values obtained from the RTLSRC model are significantly higher than those from the RTLSRCS model. Additionally, as SZA increases, the discrepancy in NBAR values between these two models continues to grow while the overall variation in standard deviation remains relatively small. These findings are largely consistent with our previous research results [41], which attribute this phenomenon to the increasing forward scattering properties of SI with higher SZA, resulting in a deeper bowl-shaped BRDF.

4. Discussion

The BRDF characteristics are key to enhancing the interpretability and applicability of remote sensing across various surface types. In this research, we conducted a comprehensive evaluation of the kernel-driven RTLSRC and RTLSRCS models to assess their effectiveness in characterizing BRDF/Albedo/NBAR characteristics by using the global POLDER BRDF database. The POLDER BRDF database contains inherent uncertainties that warrant further discussion in this study. For the POLDER data, we opted for a 90% coverage rate to ensure pixel uniformity and an adequate dataset. Nevertheless, the coarse spatial resolution of POLDER data, around 6 × 7 km, presents challenges in maintaining the uniformity of pure pixels [5,6]. The constraints of pure pixel uniformity are often difficult to fully satisfy. While these PODER data contain uncertainty to some extent, these uncertainties also affect the assessment of both models [46]. Therefore, this evaluation is fair and can provide compelling references. Due to the coarse spatial resolution of POLDER data, validating the results of albedo and NBAR presents significant challenges [47]. This study utilizes the results inverted by the RTLSRCS model as reference data. Inter-model comparison is also an important reference (e.g., Radiation Transfer Model Intercomparison, RAMI) [48,49]. Additionally, in previous studies, we used ground measurement data to validate the ability of the RTLSR and RTLSRS models to retrieve snow albedo in snow-covered areas [41]. The validation results showed high consistency with the comparison results between the RTLSRCS and RTLSRC models in this study. These findings indicate that inter-model comparison results can provide a certain level of reliability. Therefore, to enhance the accuracy of this assessment, corresponding site observations of albedo and NBAR are considered indispensable [41]. Consequently, in our future research plan, we intend to utilize observational site data to carry out a more comprehensive and systematic evaluation of various versions of the enhanced Ross-Li models.
We selected the enhanced kernel-driven RTLSRC and RTLSRCS models, as they represent the most advanced forms of kernel-driven models currently available and have demonstrated high accuracy across various data sources. These models build upon previous versions of kernel-driven models, such as the RTLSRC model, which includes hotspot correction over the widely used RTLSR model. Secondly, the hotspot-corrected RTLSRC model and RTLSR model exhibit overall consistency in characterizing BRDF/Albedo/NBAR, particularly when ignoring the hotspot direction [36]. Thus, the evaluation results of the RTLSRC model in this paper can substitute for that of the RTLSR model, as our study does not primarily focus on the hotspot direction. The aim of this research is to assess the differences between the enhanced RTLSRC and RTLSRCS models for 16 different land surface types, which will better serve our subsequent analysis of surface reflection characteristics and parameter inversion under mixed-pixel conditions. The reason is that the RTLSRCS model comprehensively includes reflection characteristics of almost all natural objects (e.g., isotropic reflection, soil–vegetation system backward reflection, and strong forward reflection of snow). For the PW surface type, it is possible to improve the characterization of BRDF features. Incorporating the BRDF shape of water into the kernel-driven model could enhance its ability to represent PW surface characteristics. In future research, we will consider focusing on this aspect. Despite these potential limitations, our research results demonstrate that the RTLSRCS model can accurately fit the global POLDER BRDF database across various land surface types. Therefore, in the near future, this model has the potential to enhance many applications, such as mixed-pixel decomposition and surface parameters inversion in snow-covered forests.

5. Conclusions

The RTLSRCS model integrates parameters representing the isotropic reflection of the land surface, describing the backward reflection characteristics of soil and vegetation systems and characterizing the strong forward reflection of snow. Additionally, this model adequately addresses hotspot effects within the KRTC(θs, θv, φ) and KLSRC(θs, θv, φ) functions. Therefore, it can effectively capture the BRDF/Albedo/NBAR features across various land surface types in theory. In this study, we conducted a thorough evaluation of the effectiveness of the kernel-driven RTLSRC and RTLSRCS models in describing BRDF/Albedo/NBAR characteristics by using the global POLDER BRDF database for diverse land cover types. The primary findings of this paper are outlined below:
(1)
Both enhanced Ross-Li models exhibit high fitting accuracy in characterizing the POLDER BRDF characteristics across 16 land cover types. However, for SI, the RTLSRC model demonstrates relatively poor fitting accuracy (RMSE = ~0.056). In contrast, the RTLSRCS model demonstrates a notable enhancement in accuracy compared to the RTLSRC model (RMSE = ~0.030), with the RTLSRCS model reducing the NRMSE values by approximately 2.34%. For DNF and BSV, the RTLSRCS model exhibits noticeable improvements over the RTLSRC model, with the overall NRMSE decreasing by 0.43% and 0.37%, respectively. For other land cover types, the improvement in fitting accuracy of the RTLSRCS model relative to the RTLSRC model is limited. While the RTLSRCS model is suitable for various IGBP types, the accuracy of the RTLSRC model is notably reduced for IGBP types with high reflectance and strong forward reflection characteristics.
(2)
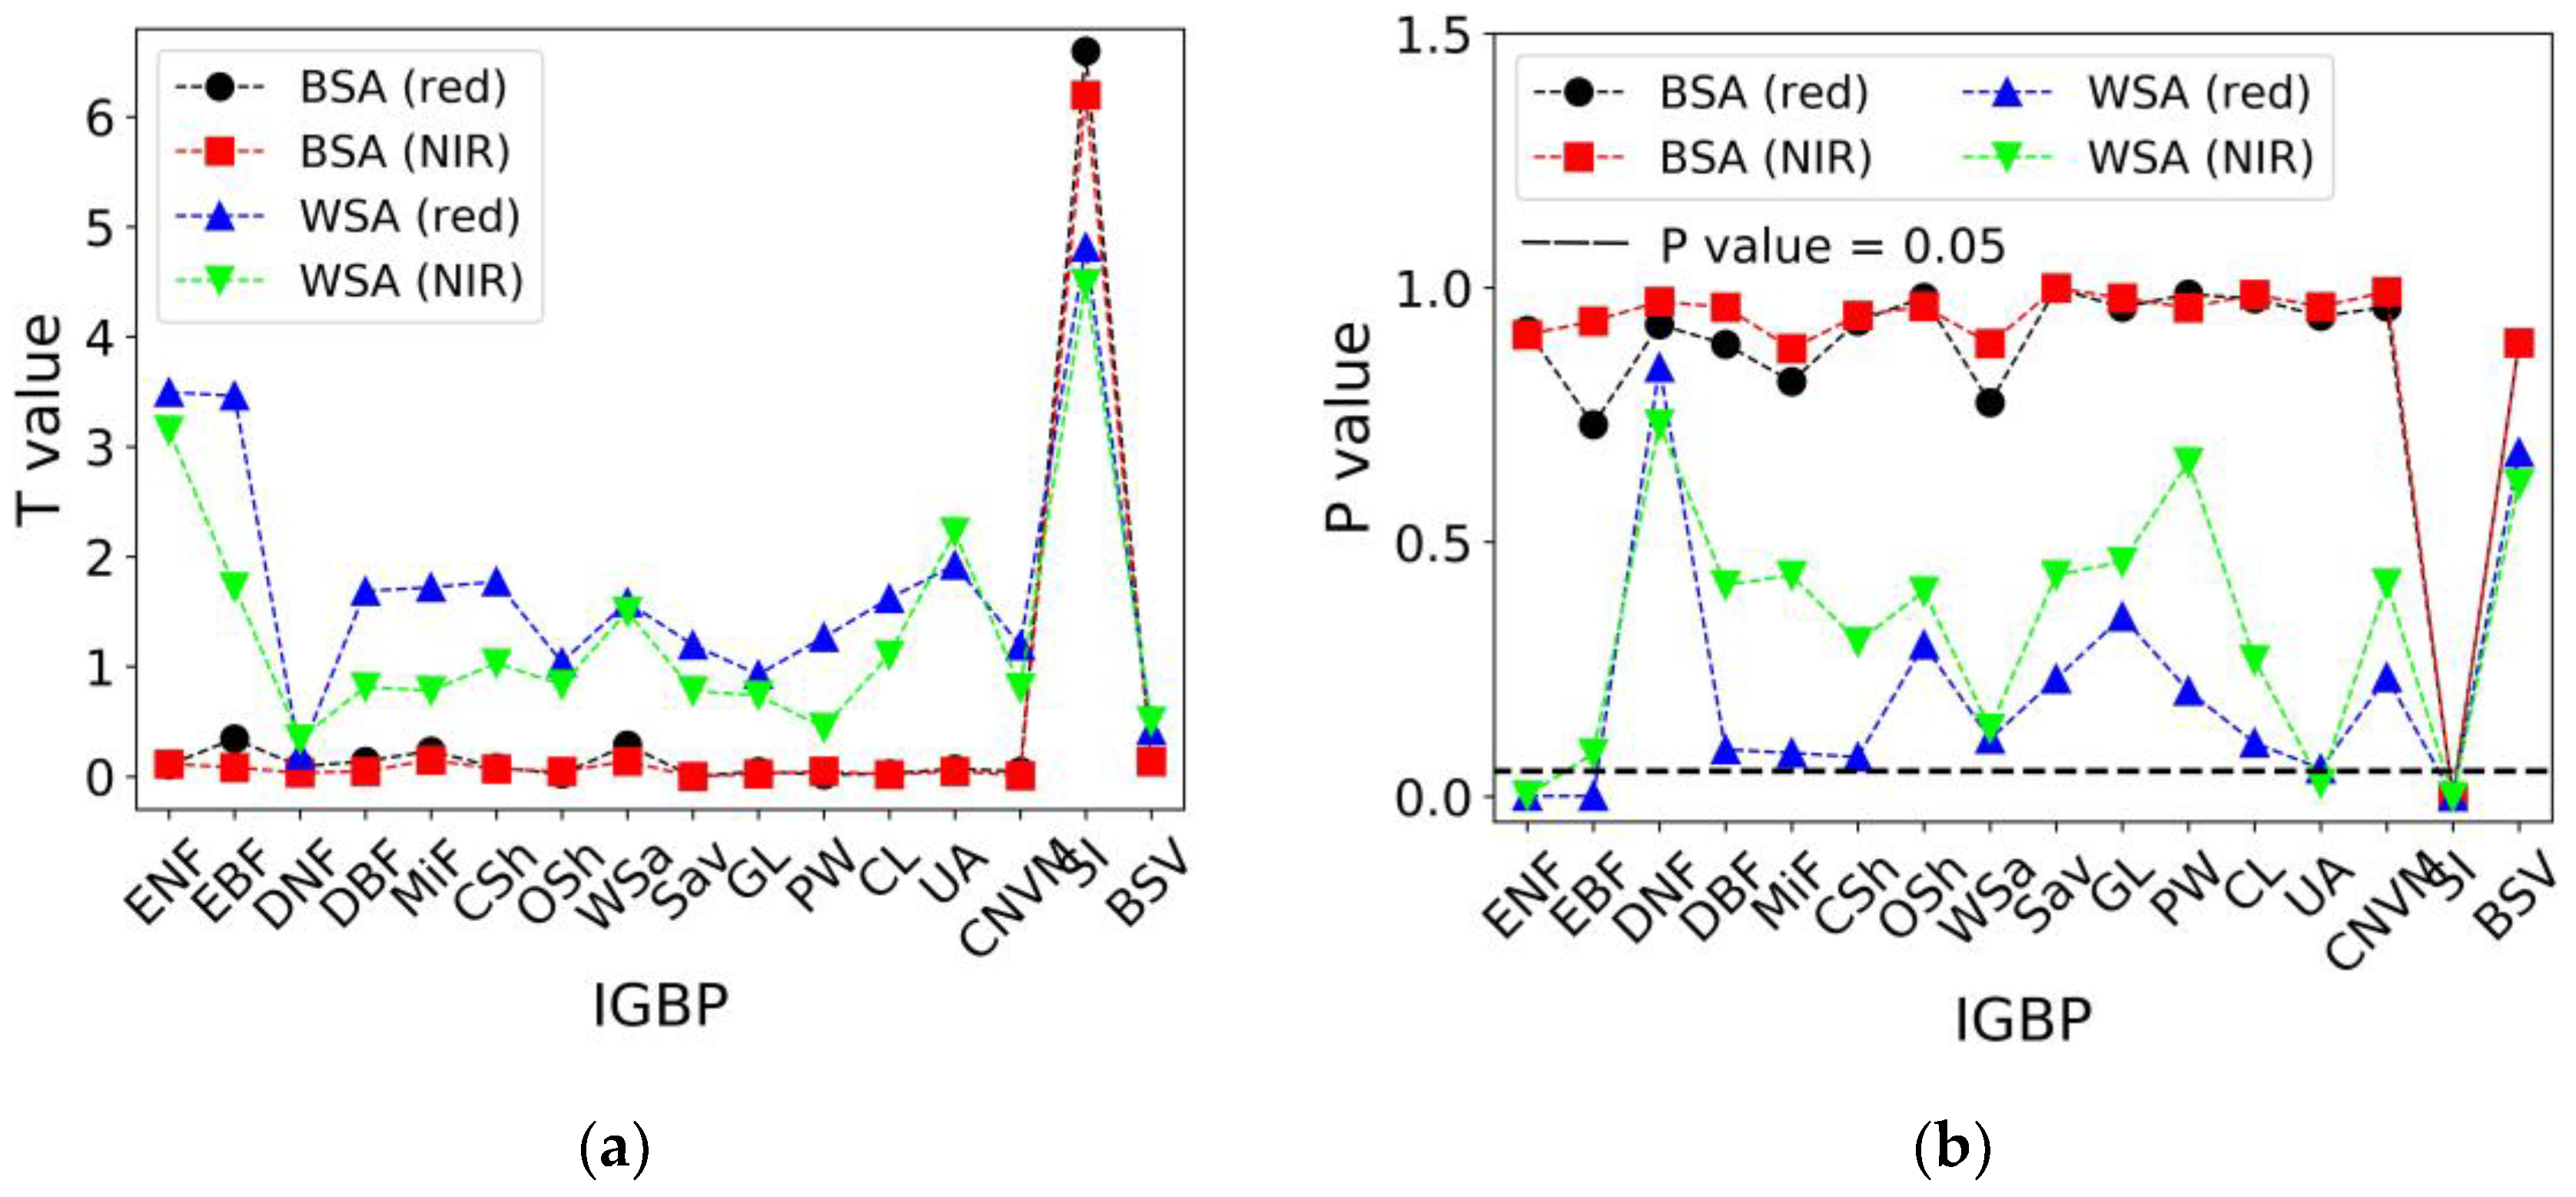
The RTLSRC and RTLSRCS models exhibit highly consistent albedo inversion across various land cover types (R2 > 0.9), particularly in BSA and blue-sky albedo, except for SI. However, significant differences in shortwave WSA inversion persist between these two models for ENF, EBF, Csh, WSa, CL, UA, and SI (p < 0.05), with NRMSE values of approximately 8.2%, 3.7%, 6.1%, 3.4%, 3.0%, 5.5%, and 3.3%, respectively. Additionally, compared to the RTLSRCS model, the RTLSRC model demonstrates a notable underestimation in albedo inversion for SI, with an approximate underestimation of 0.013 in shortwave blue-sky albedo inversion.
(3)
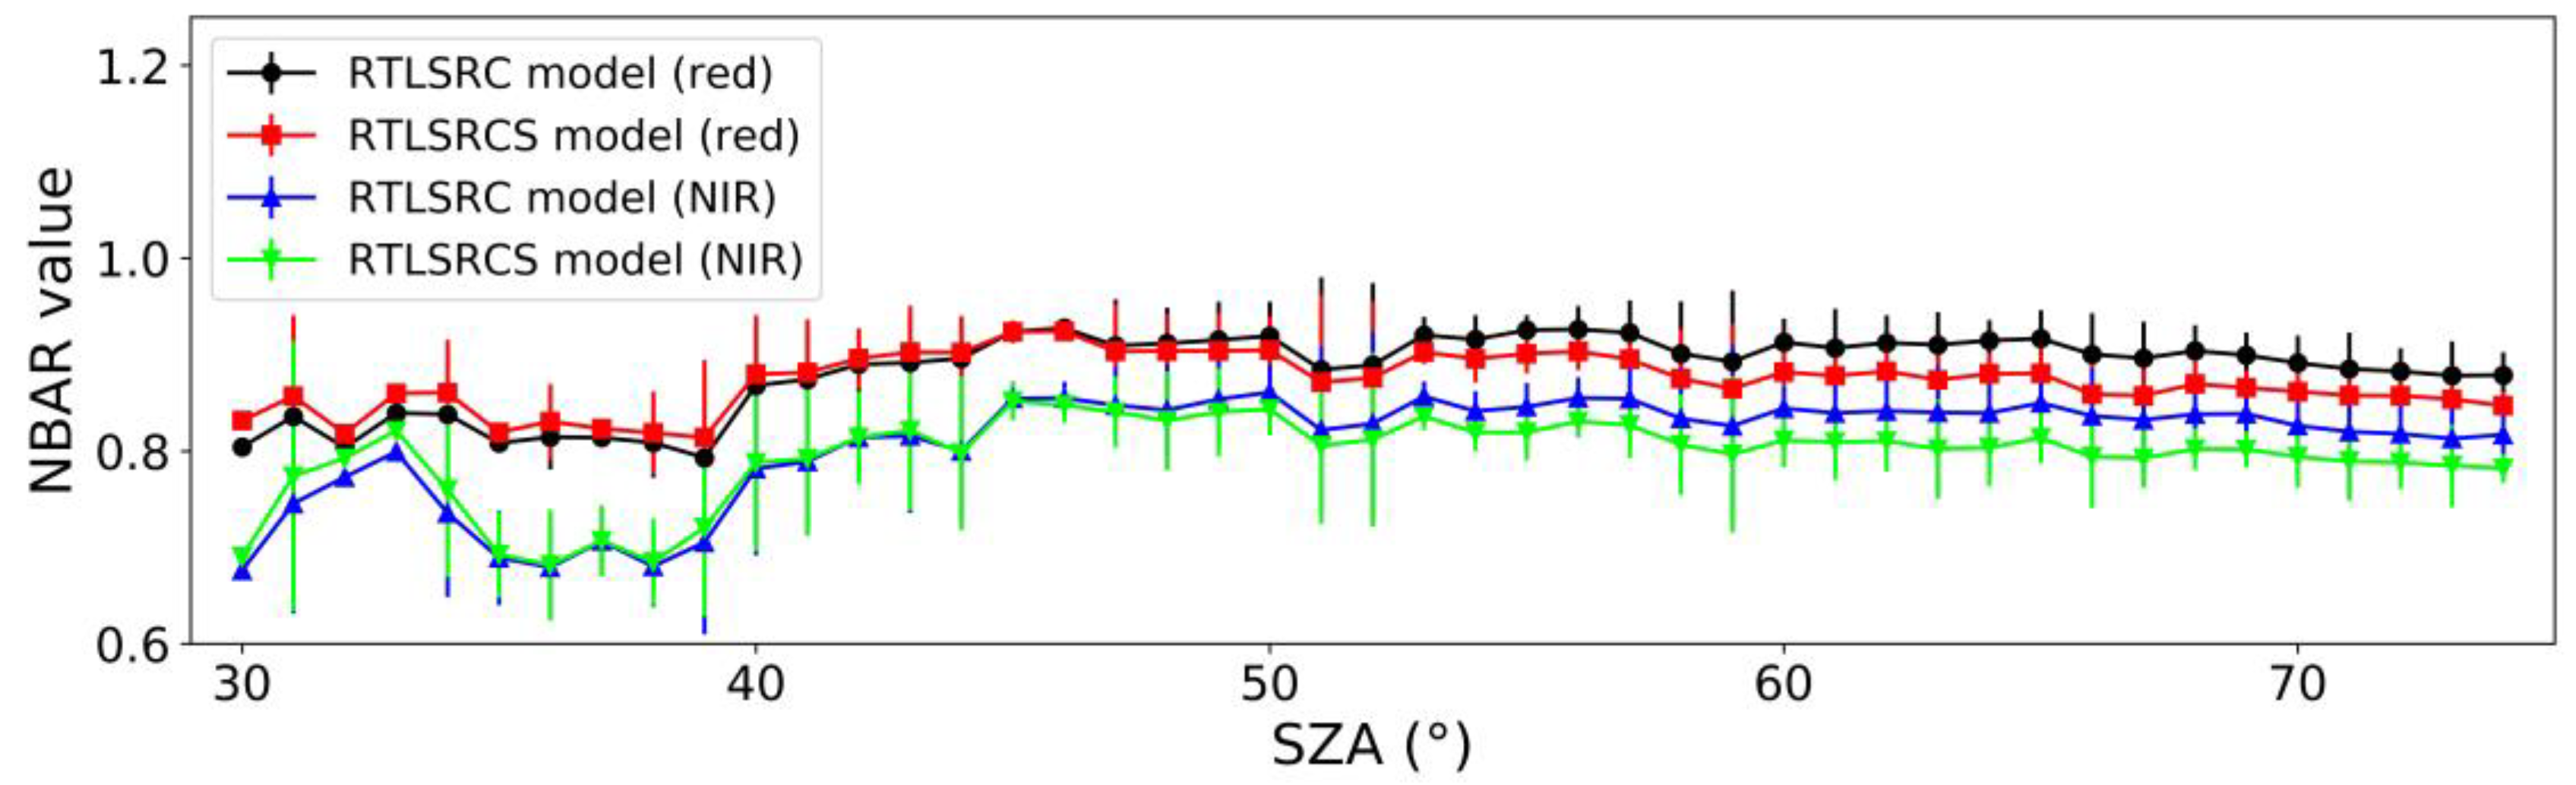
The NABAR values inverted by these two models are nearly identical across the other 15 land cover types. However, the consistency of NBAR results between these two models is relatively poor for SI. Overall, the RTLSRC model tends to overestimate compared to the RTLSRCS model, with a noticeable bias of approximately 0.024. In addition, these two models show significant differences in the inverted NBAR values with varying SZA (p < 0.05). Therefore, the RTLSRCS model is suitable for characterizing the BRDF/Albedo/NBAR characteristics across various IGBP types. Conversely, using the RTLSRC model is not recommended for characterizing BRDF/Albedo/NBAR features for SI, as the model is not suitable for this land cover type.
In summary, this study holds significant scientific importance for understanding the reflective characteristics of different land cover types, angle correction, and remote sensing parameter inversion. Additionally, this study reveals the accuracy of different versions of Ross-Li models in fitting various land cover types and the variation characteristics of BRDF parameters. This study is of significant importance for performing land cover classification and improving the accuracy of satellite BRDF/Albedo/NBAR products (e.g., MODIS).

Author Contributions

Conceptualization, A.D.; Data curation, X.Z. and J.G.; Formal analysis, A.D., and Z.J.; Funding acquisition, A.D.; Investigation, X.Z.; Methodology, A.D., A.K., X.Z., J.G., P.Z., M.Z., H.J. and K.X.; Resources, H.J.; Validation, Z.J., A.K., J.G., P.Z. and M.Z.; Writing—original draft, A.D.; Writing—review and editing, A.D., Z.J., A.K., H.J. and K.X. All authors have read and agreed to the published version of the manuscript.

Funding

This study was partially supported by the National Natural Science Foundation of China (Nos. 42301363, 41971288, 42301364), Anhui Provincial Natural Science Foundation (No. 2308085QD118), Fundamental Research Funds for the Central Universities (Nos. JZ2024HGTB0254, JZ2023HGQA0148), and Open Fund of State Key Laboratory of Remote Sensing Science (No. E06102010A).

Data Availability Statement

The data are available upon request from the corresponding author.

Acknowledgments

The POLDER-3/PARASOL BRDF databases were elaborated by the Laboratoire des Sciences du Climat et del‘Environment (LSCE) and were provided by the POSTEL Service Center.

Conflicts of Interest

The authors declare no conflicts of interest.

References

  1. Jacquemoud, S. Inversion of the PROSPECT + SAIL canopy reflectance model from AVIRIS equivalent spectra, theoretical study. Remote Sens. Environ. 1993, 44, 281–292. [Google Scholar] [CrossRef]
  2. Schaepman-Strub, G.; Schaepman, M.E.; Painter, T.H.; Dangel, S.; Martonchik, J.V. Reflectance quantities in optical remote sensing—Definitions and case studies. Remote Sens. Environ. 2006, 103, 27–42. [Google Scholar] [CrossRef]
  3. Jacquemoud, S. Modeling spectral and bidirectional soil reflectance. Remote Sens. Environ. 1992, 41, 123–132. [Google Scholar] [CrossRef]
  4. Roujean, J.L.; Leroy, M.; Deschamps, P.Y. A bidirectional reflectance model of the earths surface for the correction of remote-sensing data. J. Geophys. Res. Atmos. 1992, 97, 20455–20468. [Google Scholar] [CrossRef]
  5. Ding, A.; Jiao, Z.; Dong, Y.; Qu, Y.; Zhang, X.; Xiong, C.; He, D.; Yin, S.; Cui, L.; Chang, Y. An assessment of the performance of two snow kernels in characterizing snow scattering properties. Int. J. Remote Sens. 2019, 40, 6315–6335. [Google Scholar] [CrossRef]
  6. Ding, A.; Jiao, Z.; Dong, Y.; Zhang, X.; Peltoniemi, J.I.; Mei, L.; Guo, J.; Yin, S.; Chang, Y.; Xie, R. Evaluation of the snow albedo retrieved from the snow kernel improved the Ross-Roujean BRDF model. Remote Sens. 2019, 11, 1611. [Google Scholar] [CrossRef]
  7. Bablet, A.; Vu, P.V.H.; Jacquemoud, S.; Viallefont-Robinet, F.; Fabre, S.; Briottet, X.; Sadeghi, M.; Whiting, M.L.; Baret, F.; Tian, J. MARMIT: A multilayer radiative transfer model of soil reflectance to estimate surface soil moisture content in the solar domain 400–2500 nm. Remote Sens. Environ. 2018, 217, 1–17. [Google Scholar] [CrossRef]
  8. Jiao, Z.; Dong, Y.; Schaaf, C.B.; Chen, J.M.; Román, M.; Wang, Z.; Zhang, H.; Ding, A.; Erb, A.; Hill, M.J.; et al. An algorithm for the retrieval of the clumping index (CI) from the MODIS BRDF product using an adjusted version of the kernel-driven BRDF model. Remote Sens. Environ. 2018, 209, 594–611. [Google Scholar] [CrossRef]
  9. Bréon, F.; Maignan, F. A BRDF-BPDF database for the analysis of Earth target reflectances. Earth Syst. Sci. Data 2017, 9, 31–45. [Google Scholar] [CrossRef]
  10. Gatebe, C.K.; King, M.D. Airborne spectral BRDF of various surface types (ocean, vegetation, snow, desert, wetlands, cloud decks, smoke layers) for remote sensing applications. Remote Sens. Environ. 2016, 179, 131–148. [Google Scholar] [CrossRef]
  11. Li, X.; Strahler, A.H. Geometric-optical bidirectional reflectance modeling of the discrete crown vegetation canopy: Effect of crown shape and mutual shadowing. IEEE Trans. Geosci. Remote Sens. 1992, 30, 276–292. [Google Scholar] [CrossRef]
  12. Ding, A.; Ma, H.; Liang, S.; He, T. Extension of the Hapke model to the spectral domain to characterize soil physical properties. Remote Sens. Environ. 2022, 269, 112843. [Google Scholar] [CrossRef]
  13. Bréon, F.; Vermote, E. Correction of MODIS surface reflectance time series for BRDF effects. Remote Sens. Environ. 2012, 125, 1–9. [Google Scholar] [CrossRef]
  14. He, T.; Liang, S.; Wang, D.; Cao, Y.; Min, F. Evaluating land surface albedo estimation from Landsat MSS, TM, ETM+, and OLI data based on the unified direct estimation approach. Remote Sens. Environ. 2018, 204, 181–196. [Google Scholar] [CrossRef]
  15. Liu, Y.; Wang, Z.; Sun, Q.; Erb, A.M.; Li, Z.; Schaaf, C.B.; Zhang, X.; Román, M.O.; Scott, R.L.; Zhang, Q.; et al. Evaluation of the VIIRS BRDF, Albedo and NBAR products suite and an assessment of continuity with the long-term MODIS record. Remote Sens. Environ. 2017, 201, 256–274. [Google Scholar] [CrossRef]
  16. Jiao, Z.; Hill, M.J.; Schaaf, B.C.; Zhang, H.; Wang, Z.; Li, X. An Anisotropic Flat Index (AFX) to derive BRDF archetypes from MODIS. Remote Sens. Environ. 2014, 141, 168–187. [Google Scholar] [CrossRef]
  17. Dupiau, A.; Jacquemoud, S.; Briottet, X.; Fabre, S.; Viallefont-Robinet, F.; Philpot, W.; Di Biagio, C.; Hébert, M.; Formenti, P. MARMIT-2: An improved version of the MARMIT model to predict soil reflectance as a function of surface water content in the solar domain. Remote Sens. Environ. 2022, 272, 112951. [Google Scholar] [CrossRef]
  18. Hapke, B. Bidirectional reflectance spectroscopy 1. Theory. J. Geophys. Res. 1981, 4, 3039–3054. [Google Scholar] [CrossRef]
  19. Hapke, B. Bidirectional reflectance spectroscopy 7. The single particle phase function hockey stick relation. Icarus 2012, 221, 1079–1083. [Google Scholar] [CrossRef]
  20. Jiang, C.; Fang, H. GSV: A general model for hyperspectral soil reflectance simulation. Int. J. Appl. Earth Obs. Geoinf. 2019, 83, 101932. [Google Scholar] [CrossRef]
  21. Verhoef, W.; Christiaan, V.; Middleton, E.M. Hyperspectral radiative transfer modeling to explore the combined retrieval of biophysical parameters and canopy fluorescence from FLEX-Sentinel-3 tandem mission multi-sensor data. Remote Sens. Environ. 2018, 204, 942–963. [Google Scholar] [CrossRef]
  22. Jacquemoud, S.; Verhoef, W.; Baret, F. PROSPECT+SAIL models, A review of use for vegetation characterization. Remote Sens. Environ. 2009, 1131, 56–66. [Google Scholar] [CrossRef]
  23. Ding, A.; Liang, S.; Jiao, Z.; Ma, H.; Kokhanovsky, A.A.; Peltoniemi, J.I. Improving the asymptotic radiative transfer model to better characterize the pure snow hyperspectral bidirectional reflectance. IEEE Trans. Geosci. Remote Sens. 2022, 60, 4303916. [Google Scholar] [CrossRef]
  24. Kokhanovsky, A.A.; Bréon, F.M. Validation of an analytical snow BRDF model using parasol multi-angular and multispectral observations. IEEE Trans. Geosci. Remote Sens. 2012, 9, 928–932. [Google Scholar] [CrossRef]
  25. Kokhanovsky, A.; Lamare, M.; Di Mauro, B.; Picard, G.; Arnaud, L.; Dumont, M.; Tuzet, F.; Brockmann, C.; Box, J.E. On the reflectance spectroscopy of snow. Cryosphere 2018, 12, 2371–2382. [Google Scholar] [CrossRef]
  26. Stamnes, K.; Tsay, S.C.; Wiscombe, W.; Jayaweera, K. Numerically stable algorithm for discrete-ordinate-method radiative transfer in multiple scattering and emitting layered media. Appl. Opt. 1988, 27, 2502–2509. [Google Scholar] [CrossRef] [PubMed]
  27. Xiong, C.; Shi, J. Simulating polarized light scattering in terrestrial snow based on bicontinuous random medium and monte carlo ray tracing. J. Quant. Spectrosc. Radiat. Transf. 2014, 133, 177–189. [Google Scholar] [CrossRef]
  28. Kimmel, B.W.; Baranoski, G.V.G. A novel approach for simulating light interaction with particulate materials, application to the modeling of sand spectral properties. Opt. Express 2007, 15, 9755–9777. [Google Scholar] [CrossRef] [PubMed]
  29. Yang, Y.; Li, W.S.; Zhang, H. A seven-parameter BRDF model with double-peak characteristic suitable for sandy soil. Math. Probl. Eng. 2018, 2018, 9398608. [Google Scholar] [CrossRef]
  30. Han, Z.; Gu, X.; Zuo, X.; Bi, K.; Shi, S. Semi-empirical models for the bidirectional water-leaving radiance, an analysis of a turbid inland lake. Front. Environ. Sci. 2022, 9, 818557. [Google Scholar] [CrossRef]
  31. Kuusk, A. A two-layer canopy reflectance model. J. Quant. Spectrosc. Radiat. Transf. 2001, 71, 1–9. [Google Scholar] [CrossRef]
  32. Qi, J.; Xie, D.; Yin, T.; Yan, G.; Gastellu-Etchegorry, J.P.; Li, L. LESS, large-scale remote sensing data and image simulation framework over heterogeneous 3D scenes. Remote Sens. Environ. 2018, 221, 695–706. [Google Scholar] [CrossRef]
  33. Chen, S.; Xiao, P.; Zhang, X.; Qi, J.; Yin, G.; Ma, W.; Liu, H. Simulating snow-covered forest bidirectional reflectance by extending hybrid geometric optical–radiative transfer model. Remote Sens. Environ. 2023, 296, 113713. [Google Scholar] [CrossRef]
  34. Jiao, Z.; Ding, A.; Kokhanovsky, A.; Schaaf, C.; Bréon, F.; Dong, Y.; Wang, Z.; Liu, Y.; Zhang, X.; Yin, S.; et al. Development of a snow kernel to better model the anisotropic reflectance of pure snow in a kernel-driven BRDF model framework. Remote Sens. Environ. 2019, 55, 198–209. [Google Scholar] [CrossRef]
  35. Qu, Y.; Liang, S.; Liu, Q.; Li, X.; Feng, Y.; Liu, S. Estimating Arctic sea-ice shortwave albedo from MODIS data. Remote Sens. Environ. 2016, 186, 32–46. [Google Scholar] [CrossRef]
  36. Jiao, Z.; Schaaf, C.B.; Dong, Y.; Román, M.; Hill, M.J.; Chen, J.M.; Wang, Z.; Zhang, H.; Saenz, E.; Poudyal, R.; et al. A method for improving hotspot directional signatures in BRDF models used for MODIS. Remote Sens. Environ. 2016, 186, 135–151. [Google Scholar] [CrossRef]
  37. Dong, Y.; Jiao, Z.; Ding, A.; Zhang, H.; Zhang, X.; Li, Y.; He, D.; Yin, S.; Cui, L. A modified version of the kernel-driven model for correcting the diffuse light of ground multi-angular measurements. Remote Sens. Environ. 2018, 210, 325–344. [Google Scholar] [CrossRef]
  38. Zhang, X.; Jiao, Z.; Dong, Y.; Zhang, H.; Li, Y.; He, D.; Ding, A.; Yin, S.; Cui, L.; Chang, Y. Potential investigation of linking PROSAIL with the Ross-Li BRDF model for vegetation characterization. Remote Sens. 2018, 10, 421–437. [Google Scholar] [CrossRef]
  39. Dong, Y.; Jiao, Z.; Cui, L.; Zhang, H.; Zhang, X.; Yin, S.; Ding, A.; Chang, Y.; Xie, R.; Guo, J. Assessment of the hotspot effect for the PROSAIL model with POLDER hotspot observations based on the hotspot-enhanced kernel-driven BRDF model. IEEE Trans. Geosci. Remote Sens. 2019, 57, 8048–8064. [Google Scholar] [CrossRef]
  40. Wu, S.; Wen, J.; Xiao, Q.; Liu, Q.; Hao, D.; Lin, X.; You, D. Derivation of kernel functions for kernel-driven reflectance model over sloping terrain. IEEE J. Sel. Top. Appl. Earth Obs. Remote Sens. 2019, 12, 396–409. [Google Scholar] [CrossRef]
  41. Ding, A.; Jiao, Z.; Zhang, X.; Dong, Y.; Kokhanovsky, A.A.; Guo, J.; Jiang, H. A practical approach to improve the MODIS MCD43A products in snow-covered areas. J. Remote Sens. 2023, 3, 0057. [Google Scholar] [CrossRef]
  42. Lacaze, R.; Fédèle, E.; Bréon, F.M. POLDER-3/PARASOL BRDF Databases User Manual. 2009. Available online: https://scholar.google.com/scholar_lookup?title=POLDER-3%2FPARASOL%20BRDF%20Databases%20User%20Manual&author=R.%20Lacaze&publication_year=2009 (accessed on 10 April 2024).
  43. Yang, P. Exploring the interrelated effects of soil background, canopy structure and sun-observer geometry on canopy photochemical reflectance index. Remote Sens. Environ. 2022, 279, 113133. [Google Scholar] [CrossRef]
  44. Liang, S. Narrowband to broadband conversions of land surface albedo: I. algorithms. Remote Sens. Environ. 2001, 76, 213–238. [Google Scholar] [CrossRef]
  45. Liang, S. Narrowband to broadband conversions of land surface albedo, II. validation. Remote Sens. Environ. 2003, 84, 25–41. [Google Scholar] [CrossRef]
  46. Jiao, Z.; Zhang, X.; Bréon, F.; Dong, Y.; Schaaf, C.B.; Román, M.; Wang, Z.; Cui, L.; Yin, S.; Ding, A.; et al. The influence of spatial resolution on the angular variation patterns of optical reflectance as retrieved from MODIS and POLDER measurements. Remote Sens. Environ. 2018, 215, 371–385. [Google Scholar] [CrossRef]
  47. Chang, Y.; Jiao, Z.; Zhang, X.; Mei, L.; Dong, Y.; Yin, S.; Cui, L.; Ding, A.; Guo, J.; Xie, R.; et al. Assessment of improved ross-li brdf models emphasizing albedo estimates at large solar angles using polder data. IEEE Trans. Geosci. Remote Sens. 2020, 99, 1–19. [Google Scholar] [CrossRef]
  48. Gobron, N.; Widlowski, J.; Pinty, B. The 4TH Radiation Transfer Model Intercomparison: Using ISO-13528 for Proficiency Testing of Canopy Reflectance Models. J. Geophys. Res. Atmos. 2013, 118, 6869–6890. [Google Scholar] [CrossRef]
  49. Widlowski, J.L.; Pinty, B.; Clerici, M.; Dai, Y.; De Kauwe, M.; De Ridder, K.; Kallel, A.; Kobayashi, H.; Lavergne, T.; Meister, W.N. RAMI4PILPS: An Intercomparison of Formulations for the Partitioning of Solar Radiation in Land Surface Models. J. Geophys. Res. Biogeosciences 2015, 116, 264–265. [Google Scholar] [CrossRef]
Figure 1. The global distribution of the selected POLDER pixels, with red and blue points representing pixels from the 2006 and 2008 POLDER BRDF databases, respectively.
Remotesensing 16 02119 g001
Figure 2. The fitting accuracy of the global POLDER BRDF database for 16 land cover types using the RTLSRC and RTLSRCS models. The metrics include the R2 (a), RMSE (b), NRMSE (c) and MRE (d).
Remotesensing 16 02119 g002
Figure 3. The average values and standard deviation of BRDF parameters for the RTLSRC and RTLSRCS models for 16 land cover types.
Remotesensing 16 02119 g003aRemotesensing 16 02119 g003b
Figure 4. The comparison results of the RTLSRC and RTLSRCS models for the inversion of BSA and WSA across 16 land cover types, with the results from the RTLSRCS model serving as reference data. The metrics include the R2 (a), RMSE (b), bias (c), NRMSE (d) and MRE (e).
Remotesensing 16 02119 g004
Figure 5. The T-test (a) and p value (b) results comparing the RTLSRC and RTLSRCS models for the inversion of BSA and WSA across 16 land cover types, with the results from the RTLSRCS model serving as the reference data.
Remotesensing 16 02119 g005
Figure 6. The average values and standard deviation of NBAR values for the RTLSRC and RTLSRCS models for 16 land cover types.
Remotesensing 16 02119 g006
Figure 7. The variations in the average values and standard deviation of the NBAR values inverted by the RTLSRC and RTLSRCS models vary with the SZA for SI.
Remotesensing 16 02119 g007
Table 1. The number of POLDER pixels, average values and standard deviation of incident-observation geometric conditions, and reflectance in red and NIR bands across 16 IGBP types.
IGBPScreening
Criteria
Number of PixelsSZA (°)VZA (°)RAA (°)RedNIR
Evergreen Needleleaf Forests (ENF)B3 < 0.257948 ± 1545 ± 2 166 ± 170.05 ± 0.020.22 ± 0.04
Evergreen Broadleaf Forests (EBF)B3 < 0.273041 ± 1145 ± 2 181 ± 200.04 ± 0.010.28 ± 0.04
Deciduous Needleleaf Forests (DNF)B3 < 0.633653 ± 1344 ± 3 170 ± 230.18 ± 0.170.29 ± 0.11
Deciduous Broadleaf Forests (DBF)B3 < 0.246642 ± 1245 ± 3 174 ± 210.06 ± 0.020.24 ± 0.06
Mixed Forests (MiF)B3 < 0.247744 ± 1345 ± 2 165 ± 160.05 ± 0.020.23 ± 0.06
Closed Shrublands (CSh)B3 < 0.221239 ± 1345 ± 2 184 ± 180.11 ± 0.020.19 ± 0.02
Open Shrublands (OSh)B3 < 0.4137339 ± 1245 ± 2 184 ± 160.15 ± 0.050.24 ± 0.05
Woody Savannas (WSa)B3 < 0.361840 ± 1144 ± 2 181 ± 190.07 ± 0.020.21 ± 0.04
Savannas (Sav)B3 < 0.349837 ± 844 ± 2 185 ± 180.10 ± 0.040.24 ± 0.05
Grasslands (GL)B3 < 0.488139 ± 1444 ± 2 171 ± 170.16 ± 0.060.26 ± 0.06
Permanent Wetlands (PW)B3 < 0.37841 ± 945 ± 3 176 ± 240.06 ± 0.010.22 ± 0.04
Croplands (CL)B3 < 0.387440 ± 1445 ± 2 171 ± 180.12 ± 0.050.27 ± 0.06
Urban Areas (UA)B3 < 0.363139 ± 1445 ± 2 172 ± 180.13 ± 0.040.24 ± 0.04
Cropland Natural Vegetation Mosaics (CNVM)B3 < 0.327640 ± 1445 ± 2 166 ± 180.09 ± 0.050.29 ± 0.05
Snow and Ice (SI)B1 > 0.494562 ± 1142 ± 3 191 ± 350.91 ± 0.040.84 ± 0.05
Barren or Sparsely Vegetated (BSV)B3 < 0.6160034 ± 1544 ± 1 174 ± 140.31 ± 0.150.36 ± 0.15
Table 2. The comparison results of the RTLSRC and RTLSRCS models for the inversion of shortwave BSA across 16 land cover types, with the results from the RTLSRCS model serving as reference data.
IGBPR2RMSEBiasNRMSE (%)MRE (%)T Valuep Value
ENF0.992 0.002 0.000 1.350 1.202 0.151 0.880
EBF0.997 0.001 0.000 0.838 0.464 0.153 0.879
DNF0.999 0.004 −0.001 0.930 0.911 0.074 0.941
DBF0.995 0.002 0.000 1.583 0.574 0.136 0.892
MiF0.997 0.001 0.000 1.127 0.703 0.272 0.786
CSh0.995 0.001 0.000 1.336 0.402 0.101 0.920
OSh1.000 0.001 0.000 0.351 0.233 0.043 0.966
WSa0.996 0.001 0.000 0.785 0.771 0.273 0.785
Sav0.998 0.001 0.000 0.630 0.373 0.014 0.989
GL1.000 0.001 0.000 0.248 0.220 0.045 0.965
PW0.998 0.001 0.000 0.933 0.458 0.047 0.962
CL0.999 0.001 0.000 0.475 0.366 0.035 0.972
UA0.997 0.001 0.000 0.931 0.560 0.059 0.953
CNVM0.998 0.001 0.000 0.628 0.412 0.037 0.970
SI0.9460.018−0.0144.6711.7906.2290.000
BSV0.999 0.004 −0.001 0.533 0.211 0.138 0.890
Table 3. The comparison results of the RTLSRC and RTLSRCS models for the inversion of shortwave WSA across 16 land cover types, with the results from the RTLSRCS model serving as reference data.
IGBPR2RMSEBiasNRMSE (%)MRE (%)T Valuep Value
ENF0.8510.010−0.0058.1764.3994.6050.000
EBF0.9520.005−0.0023.7061.7482.4060.016
DNF0.999 0.005 −0.003 1.134 1.457 0.263 0.793
DBF0.963 0.007 −0.003 4.668 1.906 1.479 0.140
MiF0.971 0.006 −0.002 3.800 2.156 1.396 0.163
CSh0.8820.006−0.0036.0922.0901.9850.048
OSh0.990 0.004 −0.002 1.925 1.053 1.177 0.239
WSa0.9360.006−0.0033.4212.4462.1990.028
Sav0.962 0.006 −0.002 3.450 1.546 1.507 0.132
GL0.993 0.004 −0.002 1.647 1.207 1.054 0.292
PW0.951 0.005 −0.003 5.769 2.104 0.835 0.405
CL0.9760.006−0.0032.9951.7722.0850.037
UA0.9470.009−0.0055.4512.6682.6370.009
CNVM0.960 0.007 −0.004 3.665 2.033 1.683 0.093
SI0.9630.012−0.0093.2691.2344.5480.000
BSV0.999 0.005 −0.002 0.687 0.827 0.486 0.627
Table 4. The comparison results of the RTLSRC and RTLSRCS models for the inversion of shortwave blue-sky albedo across 16 land cover types, with the results from the RTLSRCS model serving as reference data.
IGBPR2RMSEBiasNRMSE (%)MRE (%)T Valuep Value
ENF0.976 0.003 −0.001 2.512 1.794 0.855 0.393
EBF0.992 0.002 0.000 1.357 0.672 0.404 0.686
DNF0.999 0.004 −0.001 0.890 0.811 0.110 0.913
DBF0.990 0.002 0.000 2.317 0.828 0.262 0.793
MiF0.994 0.002 0.000 1.692 0.925 0.114 0.909
CSh0.981 0.002 −0.001 2.704 0.770 0.542 0.589
OSh0.999 0.001 0.000 0.652 0.401 0.282 0.778
WSa0.989 0.002 0.000 1.217 1.056 0.265 0.791
Sav0.995 0.002 0.000 1.186 0.597 0.303 0.762
GL0.999 0.001 −0.001 0.509 0.421 0.253 0.800
PW0.994 0.002 0.000 1.612 0.712 0.137 0.891
CL0.997 0.002 −0.001 0.970 0.633 0.495 0.621
UA0.992 0.003 −0.001 1.856 0.977 0.672 0.502
CNVM0.993 0.002 −0.001 1.276 0.725 0.437 0.662
SI0.9560.016−0.0134.2321.6515.9800.000
BSV0.999 0.004 −0.001 0.504 0.329 0.207 0.836
Table 5. The comparison results of the RTLSRC and RTLSRCS models for the inversion of NAR values across LC15 and SI, with the results from the RTLSRCS model serving as reference data. LC15 represents the other 15 land cover types, excluding SI.
IGBPBandsR2RMSEBiasNRMSE (%)MRE (%)T Valuep Value
LC15Red0.992 0.003 0.000 1.415 1.267 0.292 0.773
NIR0.999 0.002 0.000 0.675 0.376 0.147 0.884
SIRed0.832 0.030 0.023 8.015 2.933 11.044 0.000
NIR0.882 0.032 0.025 6.450 3.434 10.321 0.000
Disclaimer/Publisher’s Note: The statements, opinions and data contained in all publications are solely those of the individual author(s) and contributor(s) and not of MDPI and/or the editor(s). MDPI and/or the editor(s) disclaim responsibility for any injury to people or property resulting from any ideas, methods, instructions or products referred to in the content.

