Article

Cross-Border Sand and Dust Storms between Mongolia and Northern China in Spring and Their Driving Weather Systems

1
College of Geographical Science, Inner Mongolia Normal University, Hohhot 010022, China
2
International Center for Climate and Environment Sciences, Institute of Atmospheric Physics, Chinese Academy of Sciences, Beijing 100029, China
3
Inner Mongolia Key Laboratory of Remote Sensing & Geography Information System, Inner Mongolia Normal University, Hohhot 010022, China
4
Information and Research Institute of Meteorology, Hydrology and Environment, Ulaanbaatar 15160, Mongolia
*
Author to whom correspondence should be addressed.
Remote Sens. 2024, 16(12), 2164; https://doi.org/10.3390/rs16122164
Submission received: 18 May 2024 / Revised: 11 June 2024 / Accepted: 12 June 2024 / Published: 14 June 2024
(This article belongs to the Section Atmospheric Remote Sensing)

Abstract

:
Sand and dust storms (SDSs) are particularly concerning natural disasters in East Asia. At present, there is still a lack of comprehensive knowledge of the characteristics of the cross-border SDSs between Mongolia and Northern China and the associated weather systems. This study identifies and documents the spring cross-border SDSs between Mongolia and Northern China based on the MODIS AOD map and Himawari-8/9 dust RGB images and analyzes the corresponding weather system types. A total of 76 spring cross-border SDSs were identified during 2000–2023, accounting for 55.1% of the total SDSs in both countries. The vast majority of the cross-border SDSs (86.8%) were related to Mongolian cyclones (MCs). Among them, 53.9% of the cross-border SDSs were mainly driven by Mongolian cyclones alone, and 32.9% were driven by the combination of MCs and cold highs (MC-CH type). Significant differences in the horizontal distribution of the SDSs were observed for different weather types. MCs alone trigger SDSs in the southern halves of the MCs, so the horizontal extent of the SDSs is consistent with that of MCs but larger than that associated with cold fronts. For the MC-CH type, strong winds in the southern flanks of MCs and their rear cold highs jointly drive a large-scale zonally extensive SDS belt. In recent years, particularly in 2021 and 2023, the strong cross-border SDSs have been dominated by the MC–CH type. This study provides a reference for the forecasting and early identification of cross-border SDS disasters.

1. Introduction

Sand and dust storms (SDSs) are extreme weather events characterized by a sudden onset and wide range of impacts, and they pose a serious threat to people’s daily lives, socioeconomic development, and the ecological environment [1]. An SDS is defined at a station when the air visibility on a given day is less than 1000 m, and it can be defined as a regional SDS event if three or more adjacent stations experience an SDS at the same observation time during the same weather process, according to the “National Technical Regulation of Sand and Dust Monitoring (GB/T 20479-2006)” in China [2]. The United Nations General Assembly designated 12 July as the first International Day to Combat SDSs, with the aim of increasing the global awareness of the increasingly serious health and environmental challenges posed by SDSs.
Mongolia and Northern China are the main source areas of SDSs in East Asia [3,4]. Moreover, China has been severely affected by SDSs. Studies have shown that the majority of the SDSs affecting China originate from Mongolia [5,6,7]. Bao et al. [6] reported that, during 1977−2018, approximately 50% of the total spring dust days in China were attributable to cross-border SDSs originating from Mongolia. In particular, in recent years, cross-border SDSs between Mongolia and China have occurred frequently, and their severe impacts on Northern China have attracted considerable attention. For example, the cross-border SDS that occurred on 14–17 March 2021 was the strongest in the present decade in Northern China. This strong cross-border SDS was triggered and driven by a strong Mongolian cyclone (MC) and affected Northwestern, Northern, and Northeastern China [8]. The instantaneous wind speed during this SDS reached 40 m s 1 in Inner Mongolia, and the PM10 concentration reached 9753 μg/m3 in Beijing [9,10]. East Asia also experienced severe SDSs in the spring of 2023. On 19–24 March 2023, a cross-border SDS originating from Mongolia affected an area of more than 4.8 million square kilometers in Northern China and caused serious pollution, with the PM10 concentrations exceeding 2000 μg/m3 in many areas [10]. According to Chen et al. [11], more than 42% of the dust concentration in the Beijing–Tianjin–Hebei region of China originates from source areas within Mongolia. Cross-border SDSs can also affect downstream countries, such as Korea and Japan, causing ecological and environmental problems in these areas [12].
The occurrence of SDSs is closely related to land surface factors, such as the surface temperature, vegetation coverage, snow cover, soil moisture, and surface roughness [13,14,15]. An increase in surface temperature and snowmelt can dry out the soil, thus reducing its resistance to wind erosion. Sparse vegetation and high surface roughness can intensify wind erosion, providing favorable conditions for SDS occurrence [13].
At present, the accuracy of the prediction of cross-border SDSs is still insufficient and cannot meet the disaster reduction and prevention needs of the affected countries [11]. One important reason is the lack of comprehensive knowledge of the characteristics of cross-border SDSs and the driving mechanisms of their weather systems. Meteorological factors have long been recognized as important drivers of the formation of SDS-prone weather conditions. Liu et al. [16] analyzed the weather systems associated with strong SDSs in Northern China and classified the related weather systems into four types based on the near-surface circulation features: the cold front type, MC type, cold high type, and mixed cold front and dry squall line type. Therefore, at the synoptic scale, MCs and cold fronts are the main weather systems causing SDSs in Northern China [16,17,18]. MCs provide not only dynamic conditions and unstable atmospheric conditions for SDSs but also circulation conditions for the long-distance transport of dust. Strong near-ground winds and related dust emissions tend to occur in the southwestern sectors of MCs [19]. Cold fronts are often accompanied by severe cooling and strong near-surface winds, providing dynamic conditions for SDSs. As the cold fronts propagate, the SDS-prone weather conditions also move downstream and affect downwind areas. A cold front not only results in unstable atmospheric stratification but also triggers symmetric instability within the frontal zone, thus transporting dust to high altitudes through strong vertical motion [20]. Yun et al. [17] compared the cold fronts and MCs during SDSs and proposed that MCs have a stronger and more lasting driving impact on SDS-prone weather conditions.
The majority of researchers have investigated SDSs separately in Northern China and Mongolia. Recently, several researchers have studied SDSs from the overall perspective of the Mongolian Plateau. Using Medium-Resolution Imaging Spectrometer (MODIS) data, Zhang and Wang [21] reported that, on the Mongolian Plateau, the area most frequently affected by SDSs is mainly the Gobi Desert region straddling Mongolia and Northern China. Bao et al. [7] analyzed the spatial distribution and affected areas of cross-border SDSs using Himawari-8/9 remote sensing image data. Based on the movement paths of the dust events between neighboring regions, they found that approximately 55% of the dust events in Inner Mongolia originated from Mongolia, while approximately 60% of the dust events in Mongolia developed locally.
To date, there has been no systematic investigation of the cross-border SDSs between Mongolia and Northern China and their driving weather systems. Most related studies, in fact, are confined to individual case analyses. This study mainly uses remote sensing data from Himawari-8/9 dust RGB images and the MODIS AOD and the “Summary table of sand and dust storm weather processes in China from 2000 to 2023” archived by the China Meteorological Administration (CMA) to analyze the key features and corresponding weather systems of the cross-border SDSs between Mongolia and Northern China. What is the occurrence rate of cross-border SDSs out of the total number of SDSs in Mongolia and China? What are the key differences among the primary types of weather systems driving cross-border SDSs? The answers to these questions will provide a basis for the prediction and early identification of cross-border SDS-prone weather conditions. The remainder of this paper is organized as follows: Section 2 introduces the data and methods; Section 3 presents the results, including the identification method for cross-border SDSs, the statistics of cross-border SDSs, and the types of weather systems that drive SDSs; and the final section consists of the concluding remarks and discussion.

2. Materials and Methods

2.1. Data

In this study, the SDS events in Mongolia and Northern China during 2000–2023 are compiled based on the “Summary table of sand and dust storm weather processes in China from 2000 to 2023” archived by the China Meteorological Administration (CMA) [18] and “A dataset of spring sand and dust storm distribution on the Mongolian Plateau” [21]. The SDSs on the Mongolian Plateau were identified based on the “Strong sand and dust storm sequence in China and its supporting dataset” (EB/OL) provided by the Meteorological Data Center of the CMA (https://data.cma.cn/, accessed on 28 March 2023), the text data from news reports on SDSs, and the SDS distribution data obtained with the dust storm detection index [22]. For more details, readers may refer to Zhang and Wang [21].
In this study, the Level-2 aerosol property data from the MODIS instruments onboard both the Terra (MOD04_L2) and Aqua (MYD04_L2) satellites provided the AOD at 550 nm for the period of 2000–2015 [23]. The satellite passes through China at approximately 10:30 am (Terra satellite) and 13:30 am (Aqua satellite) every day, providing data with a spatial resolution of 10 km × 10 km. There are two distinct methods commonly utilized to retrieve the AOD from MODIS data, known as “Dark Target” [24] and “Deep Blue” [24]. The Dark Target algorithm is an AOD retrieval algorithm designed for dense dark vegetation regions. It estimates the AOD by measuring the reflectance of dark surfaces, such as forests, in the visible and short-wave infrared bands. The Deep Blue algorithm was developed to overcome the limitations of the Dark Target algorithm in retrieving the AOD on bright surfaces, such as deserts and urban areas [25]. It uses the high reflectivity of the deep blue band over bright surfaces to estimate the AOD and is suitable for environments with less cloud cover and stronger surface reflection. The combination of the Dark Target and Deep Blue algorithms, which we use in this work, permits the full use of the respective advantages of the two algorithms to ensure the best AOD estimation under different surface types and atmospheric conditions [26]. The data can be downloaded from https://ladsweb.modaps.eosdis.nasa.gov/ (accessed on 5 August 2023). In the MODIS AOD map, high-value AOD (greater than 0.2) areas moving along the steering airflow represent sand and dust [27].
Himawari-8/9 is a new generation of Japanese geostationary meteorological satellites and it provides data from 2016 to 2023 [28]. In this study, we used these data to identify the cross-border SDSs. The Advanced Himawari Imager (AHI) sensor implemented on Himawari-8/9 has 16 bands: 1–3 for visible light, 4–6 for near-infrared light, and 7–16 for infrared light. The spatial resolution is 2 km, and the temporal resolution is 10 min. The SDS was inverted by the Himawari-8/9 far-infrared channel dust RGB method [29]. This method capitalizes on the differences in the reflection and transmission characteristics between dust and other substances, such as clouds and the ground surface, and data are processed for the three infrared channels: first, the bright temperature difference between channels 15 and 13 and channels 13 and 11 is calculated, and then channel 13’s brightness temperature is used for RGB false color synthesis (R: B15 − B13, G: B13 − B11, B: B13), with a Gamma stretch setting of 1/2.5/1, to produce the dust image. Band 13 is more sensitive to dust identification. The data can be downloaded at https://www.data.jma.go.jp/mscweb/en/product/monitor_yellowsand.html (accessed on 23 September 2023).
In this study, we used the European Centre for Medium-Range Weather Forecasts (ECMWF) Reanalysis version 5 (ERA5) dataset [30]. The ERA5 provides data at 0000, 0600, 1200, and 1800 UTC each day. The variables used here included the air temperature, specific humidity, geopotential height, horizontal winds at 850 hPa, 10 m horizontal winds, and sea level pressure (SLP). All data were on a regular latitudinal and longitudinal grid with a horizontal resolution of 0.25° × 0.25°.

2.2. Methods

Fronts are interfaces between air masses with different thermal characteristics, and such interfaces are often associated with abrupt changes in temperature, thus indicating significant weather events, such as cold waves, SDSs, and precipitation. This study adopts the front identification method developed by Berry et al. [31]. They presented an objective method of precisely locating fronts in gridded data based on the work of Hewson et al. [32]. The thermodynamic variable used is the 850 hPa wet bulb potential temperature ( θ w ). With this method, fronts can be divided into three types based on the temperature advection and their movement speed: a warm front with a front speed greater than 1.5 m/s, a cold front with a front speed less than −1.5 m/s, and a quasi-stationary front with a front speed between −1.5 and 1.5 m/s. Based on this method, the positions of cold fronts and their impacts on SDS-prone weather conditions can be clearly characterized. Figure 1 exemplifies the identification of a cold front and its movement process in the 850 hPa θ w field during 1–3 April 2018. This period corresponds to an SDS. As shown in Figure 1a, a cold front appeared at the junction of cold and warm air (purple lines), and the horizontal wind direction ahead of and behind the front clearly changed. As the cold front moved southeastward (Figure 1b), the SDS and its cross-border movement could be clearly observed on the Himawari-8/9 dust monitoring map (Figure 1c–f). The cold front first appeared outside the northeastern border of Mongolia at 0000 UTC on 1 April 2018 and then expanded and moved southeastward, corresponding to a cross-border SDS process. At 1200 UTC on 1 April, the SDS affected the central and southern parts of Inner Mongolia and Northeastern China until 1200 UTC on 2 April, when the SDS diminished (Figure 1f). Figure 1 shows that the strong wind zone corresponds to the SDS location. The SDS is usually located behind the surface cold front [17] and ahead of the 850 hPa cold front (Figure 1c–f) [16].
In this study, we used a cyclone tracking method developed by Hodges [33], which is based on the local maximum relative vorticity at 850 hPa, to identify cyclones. The specific steps of MC tracking are as follows. (1) Select the relative vorticity data (ERA5) at 850 hPa for four time periods (00, 06, 12, and 18 UTC) during the spring of 2000–2023. (2) Apply zonal spherical harmonic analysis to the 850 hPa relative vorticity field at every time point and filter out the planetary waves with wavenumbers less than 5. Then, define the location of the local maximum value in the 850 hPa relative vorticity field as the cyclone center. For more details, readers may refer to [33]. (3) A cyclone generated in the region of Mongolia (42.5–55°N, 85–120°E) with a lifespan of at least 48 h and a movement path exceeding 1000 km is defined as an MC. Figure 2 exemplifies the tracking of an MC and its corresponding cross-border SDS process during 13–14 April 2018. The MC started to form in the central–western part of Mongolia and then developed as it moved eastward (Figure 2a). It increased to ~6.5 × 10⁻⁵ s−1 (at 0000 UTC on 13 April 2018) when it lofted sand and dust (Figure 2c). At 1200 UTC on 13 April, the cyclone intensified to ~7.0 × 10⁻⁵ s−1, and, thus, the extent of the SDS was significantly expanded (Figure 2d). As shown in Figure 2b, strong wind speeds exceeding 25 m/s occurred in the northwestern and southeastern sectors of the MC at 850 hPa, with the strong wind zone corresponding well to the SDS location in Figure 2d. As the MC weakened, the extent of the SDS also diminished.

3. Results

3.1. Identification of Cross-Border SDSs

The steps in the identification of cross-border SDSs between Northern China and Mongolia are as follows. (1) Because the SDS cases in the “Summary table of sand and dust storm weather processes in China from 2000 to 2023” provided by the CMA [18] were identified primarily based on the SDS activity within China (SDSs of the regular type in Table 1), remote sensing data were needed to determine whether they were cross-border events. We conducted a visualization analysis with the MODIS AOD data (2000–2015) and Himawari-8/9 (2016–2023) dust RGB images to obtain the SDS occurrence date. In terms of the movement path and spatial distribution, we identified SDSs originating from Mongolia and crossing into Northern China as cross-border SDS events. As such, 65 out of 125 SDS events were identified as cross-border events (bold regular type in Table 1). (2) Similarly, we examined all SDS cases in “A dataset of spring sand and dust storm distribution on the Mongolian Plateau” [21] via visualization analysis using the MODIS AOD data and Himawari-8/9 dust RGB images and identified cases originating from Mongolia and crossing into Northern China as cross-border SDSs. After excluding the 65 cross-border events that had already been identified in Step (1) (bold regular type in Table 1), we identified 13 additional SDSs (italic type in Table 1), 11 of which were recognized as cross-border SDSs (bold italic type in Table 1). These cross-border SDSs did not meet the SDS standard of affecting an area in China and were often classified as blowing dust by the CMA [21]. (3) Finally, a total of 138 SDSs were identified in Northern China and Mongolia, as listed in Table 1, 76 of which (55.1%) were identified as cross-border SDSs (bold type in Table 1), which were selected to answer our research questions.

3.2. Statistical Characteristics of Cross-Border SDSs

Figure 3a displays the interannual variation in the number of cross-border SDSs. Overall, the number of cross-border SDSs revealed a fluctuating but declining trend, which was consistent with the trend of those within China (Figure 3b). Several high spring SDS frequencies were observed in the first decade of the 21st century. The SDSs had a peak frequency (nine times) in 2006 and a high frequency in 2001 (eight times) and 2010 (eight times). During this period, the spring precipitation in Northern China significantly decreased, and the spring temperature was generally higher than usual. These meteorological conditions were favorable for the frequent occurrence of SDSs [34]. Following 2011, the SDS frequency gradually decreased until 2017 (Figure 3), which was also associated with a significant decrease in the degraded land area in China [35,36].
In the past three years, especially in 2021 and 2023, however, the frequent occurrence of spring SDSs in East Asia has attracted increased interest among the scientific community [8,9,10]. The 10 spring SDSs affecting Northern China in 2021–2023 all originated from Mongolia (see last three rows of Table 1). This highlights the direct impact of cross-border SDSs on the ecological environment in Northern China.

3.3. Different Types of Weather Systems Associated with Cross-Border SDSs

As mentioned previously, the weather systems that cause East Asian SDSs are primarily associated with cold fronts and MCs [16,17]. However, it is noteworthy that MCs and cold fronts are not completely independent. MCs are often followed by near-surface cold highs, and cold fronts usually form between them. Sometimes, either the MC or cold front is strong, while sometimes both are strong. Therefore, the weather systems driving cross-border SDSs can be divided into three types, namely the cold front type, the MC-dominant type, and the MC and cold high combined type (MC-CH). In the cold front type, the development of near-surface strong winds and SDSs is mainly driven by cold fronts, and the intensity of the cold high associated with the cold front is maintained and even strengthens. If the cold high is accompanied by an MC in front of it, the MC is weak during the SDS, with a central pressure above 1000 hPa. In the MC-dominant type, the cyclone intensity is maintained or even strengthened, with a central pressure below 1000 hPa. If there is a cold high behind the cyclone, the strength of the cold high is weak during this process, with the central pressure below 1020 hPa. In the MC-CH type, both the MC and accompanying cold high are maintained and strengthened during the SDS, with the central pressure of the MC being below 1000 hPa and the central pressure of the cold high exceeding 1020 hPa.
Figure 4 shows the statistics of the different types of weather systems for the 76 cross-border SDSs. During the period of 2000–2023, the MC-dominant type contributed to 41 cross-border SDSs, accounting for 53.9% of all 76 cases; the MC-CH type was responsible for 25 SDSs, accounting for 32.9%; the cold front type drove eight cross-border SDSs, accounting for 10.5%; and other weather systems were responsible for only two cases, accounting for 2.6%. It is clear that the vast majority of cross-border SDSs (86.8%) were related to MCs during this period, consistent with the fact that mid-latitude weather disturbances over the Mongolian Plateau are most active in spring. When weather disturbances extended over the western mountains of the Mongolian Plateau, MCs easily form and develop [8,37], thus triggering SDSs under the condition of sufficient sand and dust sources. In addition, the MC-CH type is also a very important weather system driving cross-border SDSs and has become very active in recent years (2021–2023), which may be related to the enhancement of the mid-latitude baroclinic wave amplitudes [8].
We examined two types of MCs, the MC-dominant type and MC-CH type, in terms of the genesis location, movement path, and peak amplitude position, as shown in Figure 5. The MCs mainly originated in the central and western parts of Mongolia due to the dynamic effect of the leeward slopes of the Sayan and Hanggai Mountains [37,38]. The MCs were considered to reach their peak intensity when their relative vorticity reached its maximum value. Most MCs attained their peaks when they reached Eastern Mongolia and Northeastern China. For the MC-dominant type (Figure 5a), the vast majority of the MCs moved eastward, and some moved southeastward and northeastward. At the peak, a considerable number of MCs were ordinary cyclones with relative vorticities below 6 × 10 5 s 1 , accounting for 36.6% (15 out of 41) of all MCs. For the MC-CH type (Figure 5b), the MCs moved eastward and southeastward. At the peak, most cyclones were moderate or strong, with relative vorticities exceeding 6 × 10 5 s 1 , accounting for 84.0% (21 out of 25), and there were fewer ordinary cyclones.

3.4. Different Types of Weather Systems: Three Typical Examples

In this section, we elaborate on the distribution features of near-surface winds and cross-border SDSs controlled by different types of weather systems by analyzing three typical examples.

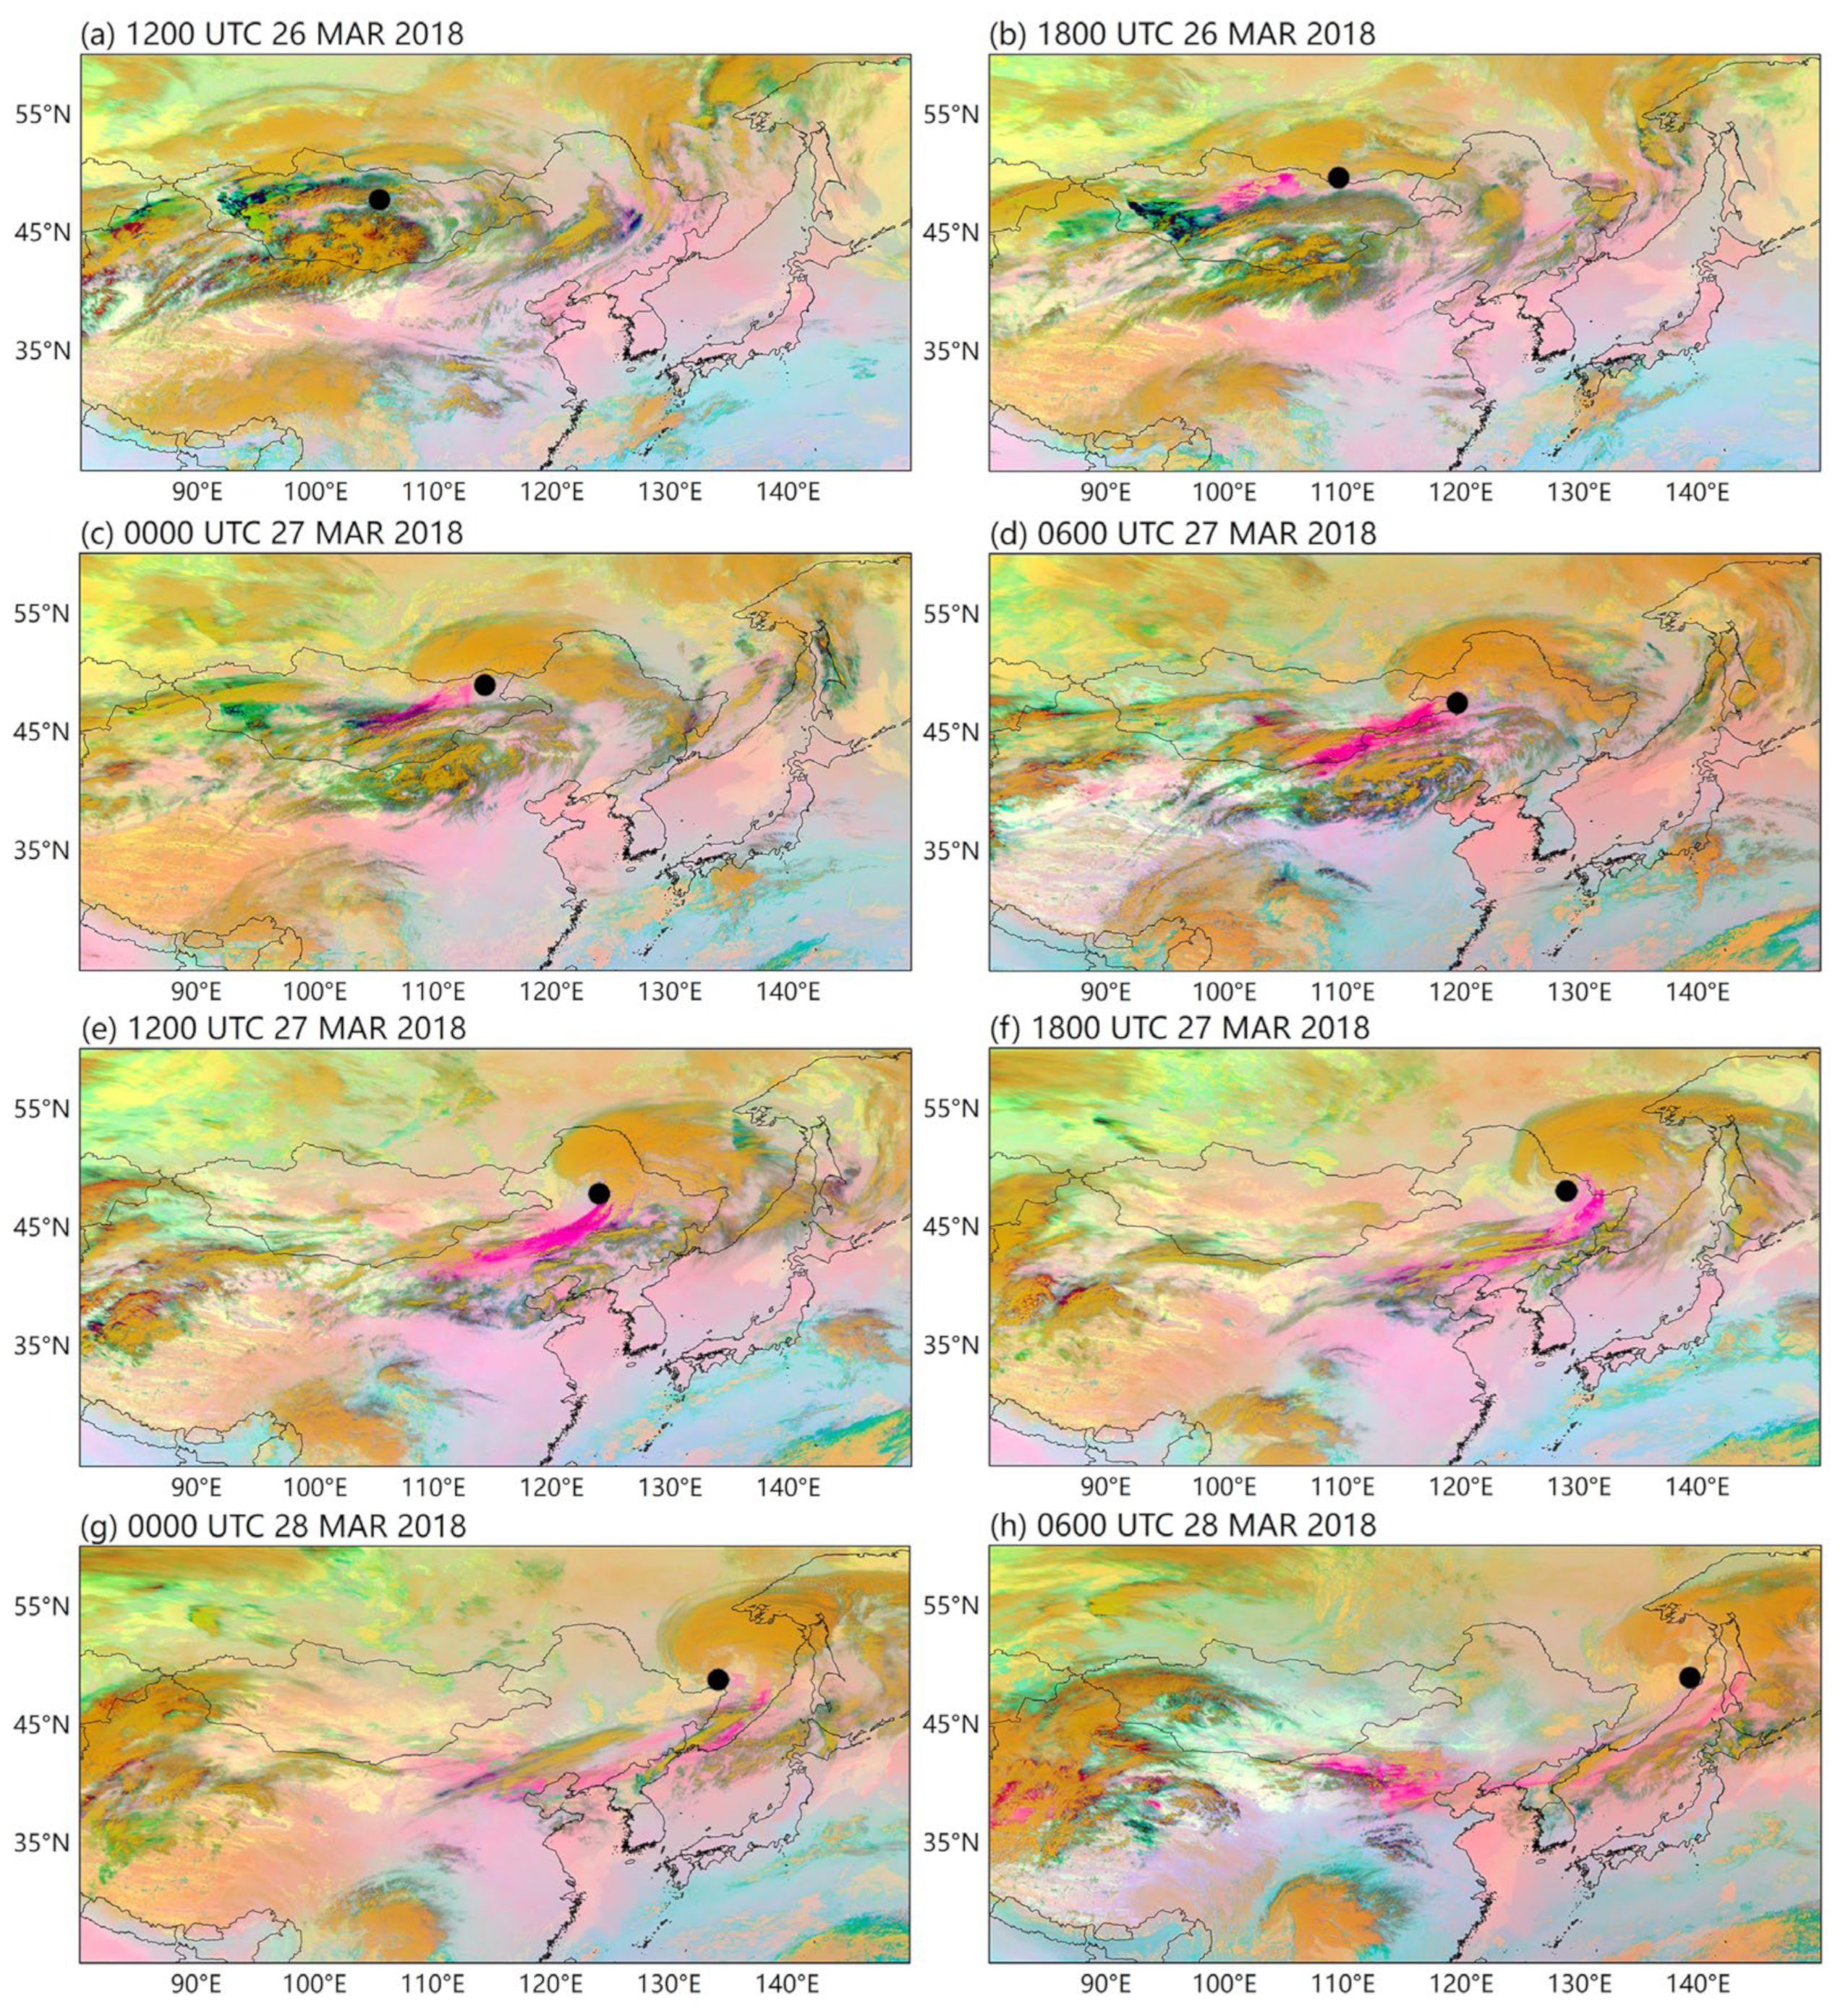
3.4.1. MC-Dominant Type
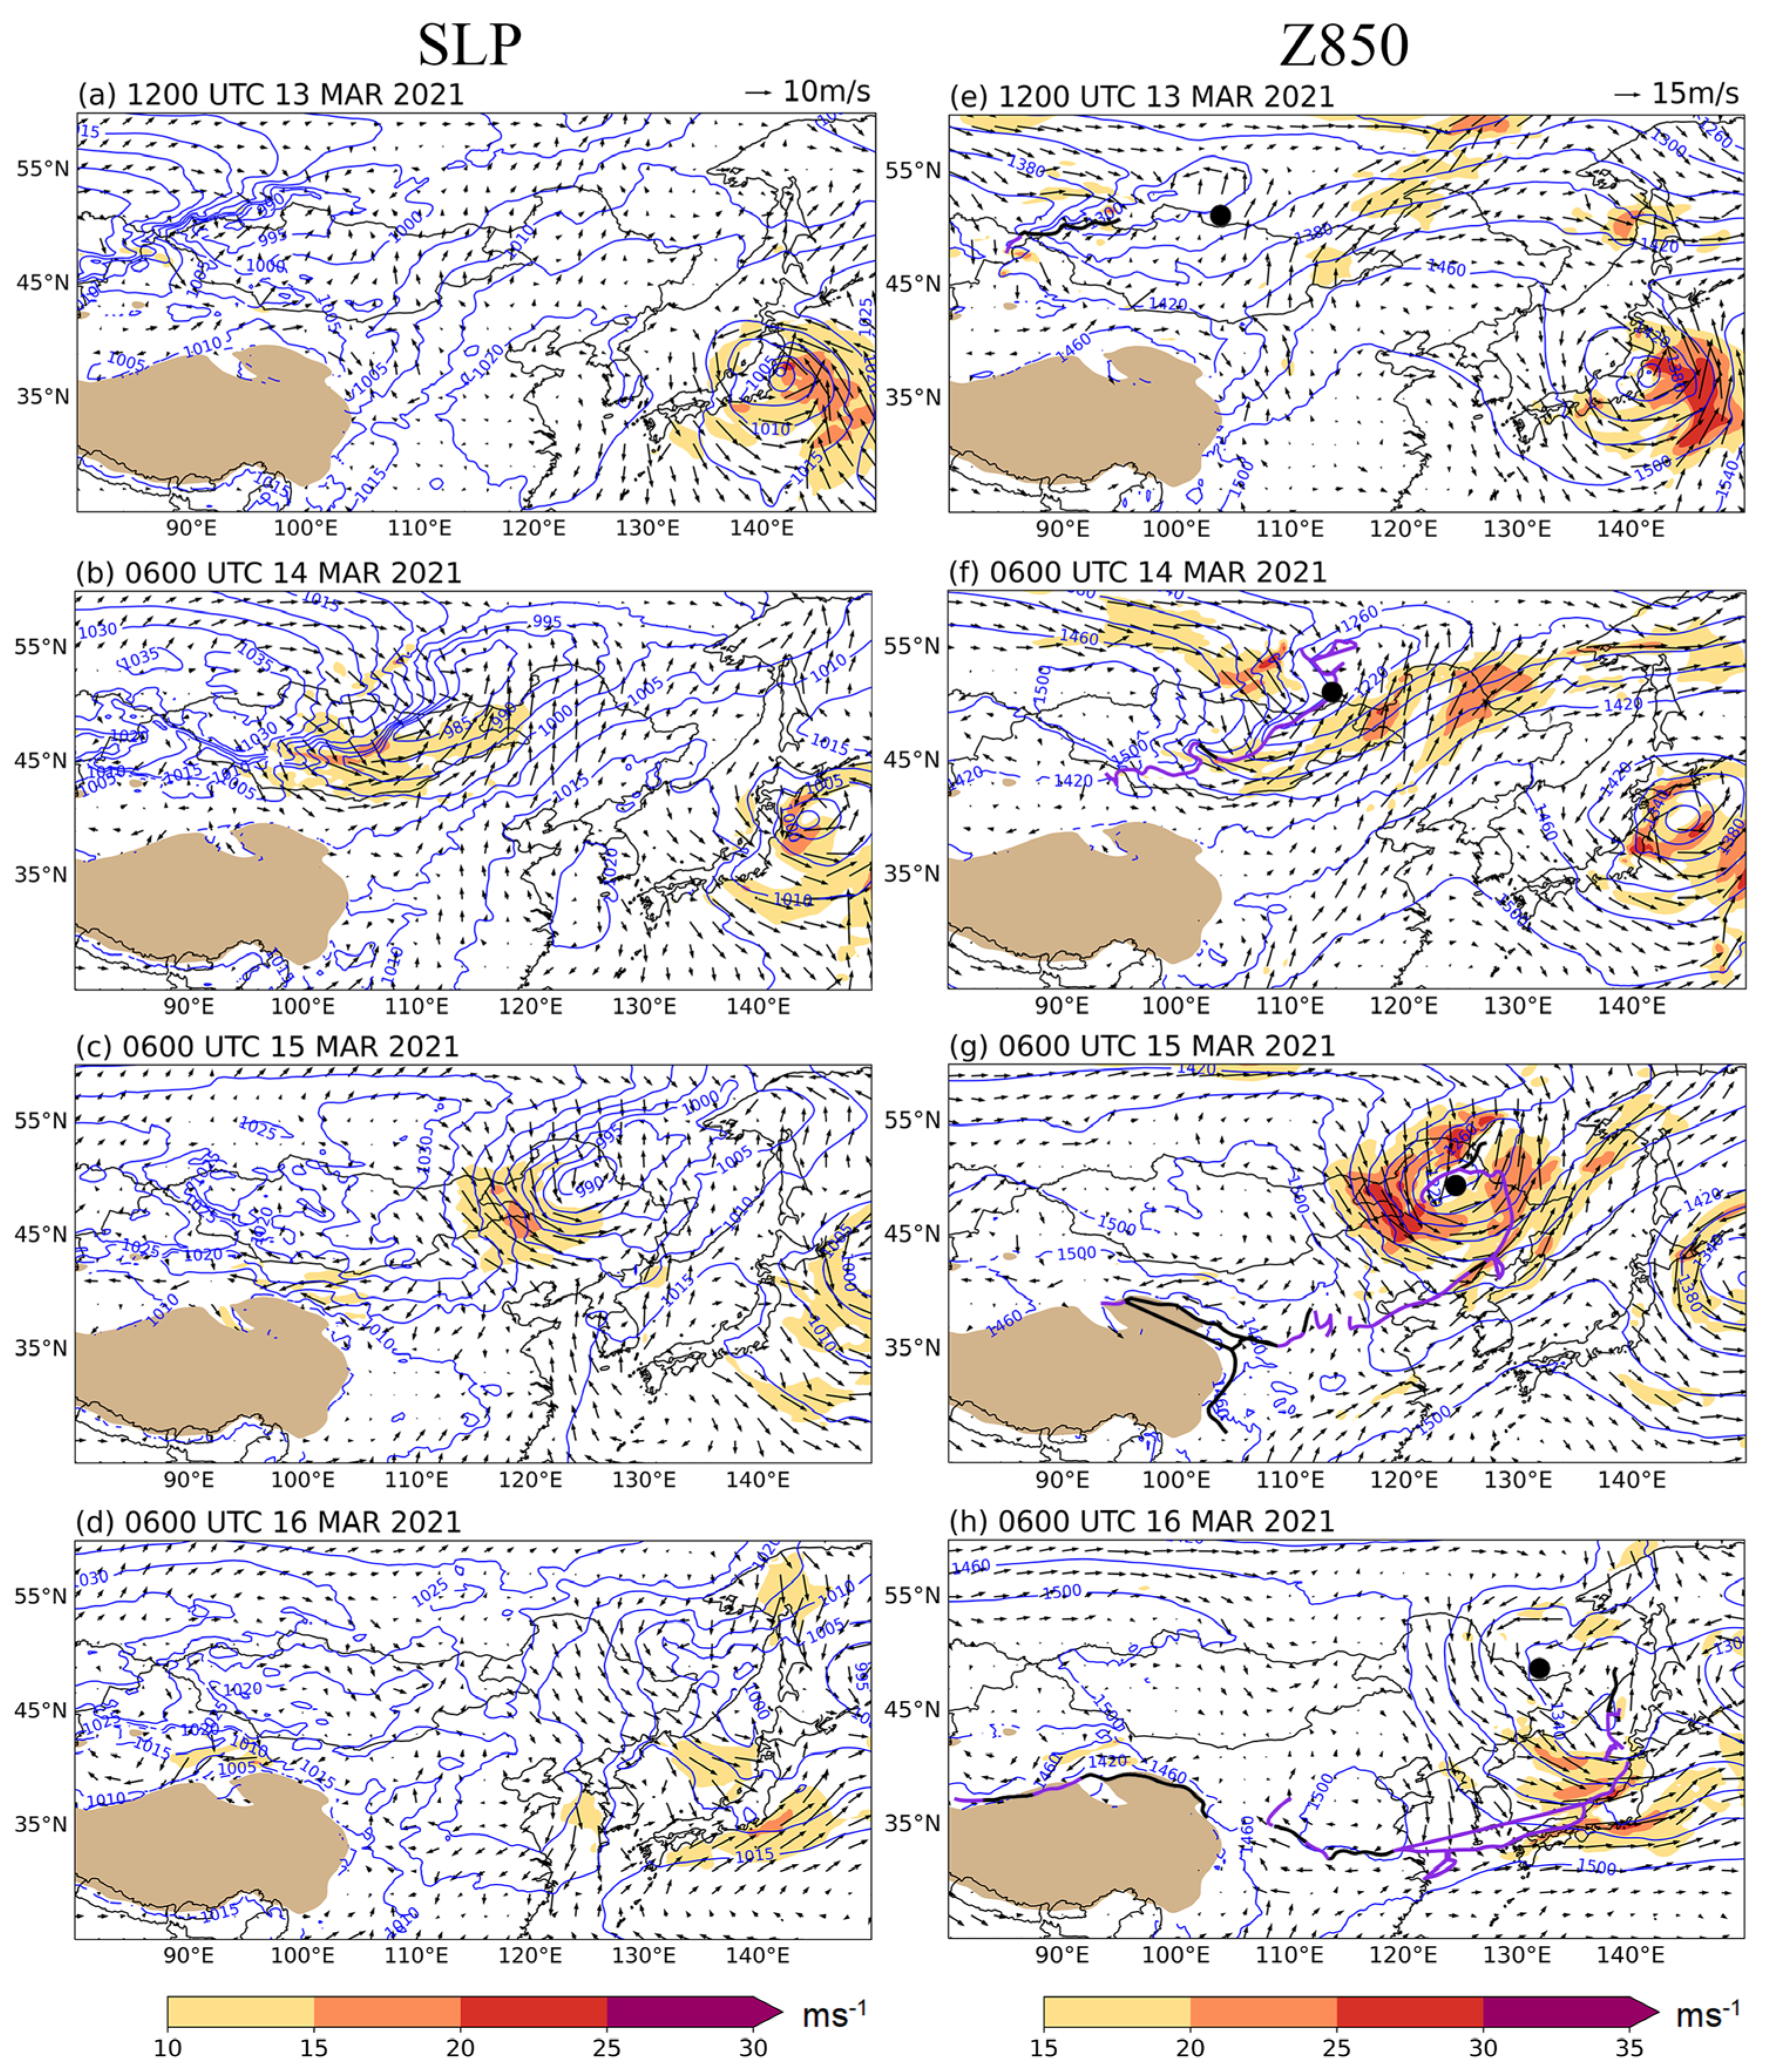
The SDS during 26–28 March 2018 was a typical case triggered by the MC-dominant type. Figure 6 shows the Himawari-8/9 dust monitoring maps, and Figure 7 shows the circulation fields during this SDS. At 1200 UTC on 26 March (Figure 6a), sand and dust (pink) began to rise in Central and Western Mongolia, but the extent was quite limited. At that time, an MC began to form in Northern Mongolia (Figure 7a,e), and the winds in the southwestern sector began to sweep surface dust into the air aloft, providing dynamic conditions for the subsequent SDS (Figure 6b). The MC was in its initial stage and it influenced Western and Central Mongolia. Afterward, the SDS formed in a zonal belt and moved southeastward to reach the border of Mongolia and China (Figure 6c,d), and its movement and expansion were consistent with those of the MC (Figure 7b,f). At this time, the MC was at its developing stage and influenced both Mongolia and Northern China. The MC experienced genesis and development when the air flow passed through the Western Mongolian topography (Figure 7a,b,e,f). This phenomenon can be explained from the perspective of potential vorticity conservation [39]. In an isentropic coordinate system, an inverse relationship between the vorticity and static stability holds if the potential vorticity is conserved. When an air parcel passes across a mountain, the lower isentropes show a terrain-following feature in the leeward slope of the mountain, where it corresponds to reduced static stability [40]. Consequently, the relative vorticity increases in the leeward slope of the mountain. This is why the MC’s genesis and development often occur on the eastern slope of the Western Mongolian topography. At 1200 UTC on 27 March, the MC moved eastward to the Greater Khingan Mountains, and the central pressure deepened to 985 hPa (Figure 7c), reaching its peak intensity. The MC primarily affected Eastern Mongolia, Northern China, and Northeastern China. At this time, the near-surface wind speed increased to 10–15 m s 1 , and the 850 hPa wind speed even increased to 25 m s 1 or above (Figure 7g). Thus, the extent of the strong wind areas was significantly expanded and was highly consistent with the simultaneous SDS range from Eastern Inner Mongolia to Northeastern China (Figure 6e). This indicates that as the cyclone strengthened and moved, it transported dust to an altitude of 850 hPa, resulting in intense and extensive SDS conditions. After 0000 UTC on 28 March, as the cyclone gradually weakened, the wind speed also began to slow (Figure 7d,h), and the extent of the SDS gradually decreased (Figure 6g,h). It is clearly shown in Figure 6 that the MC-dominant type can trigger and drive an SDS in its southwestern and southern sectors, with the horizontal extent matching the MC circulation itself.

3.4.2. MC-CH Type

The SDS that occurred on 13–17 March 2021 was a typical case driven by the MC-CH type. This case has also attracted the attention of researchers [8,9,10]. The SDS characteristics of this case are distinct from those associated with the MC-dominant type. Figure 8 shows the Himawari-8/9 monitoring images, and Figure 9 displays the circulation fields during this type of event. On 13 March, due to cloud cover, it was impossible to distinguish dust (Figure 8a), but the MC had already formed to the northwest of Mongolia (Figure 9a,e), with a central SLP of 990 hPa. At 0600 UTC on 14 March, the SDS appeared in Central and Western Mongolia (Figure 8b). The MC had moved eastward to the central part of Mongolia, and the central pressure had deepened to 985 hPa (Figure 9b). Notably, the cyclone was followed by a strong cold high (Figure 9b,f) with a central SLP pressure of up to 1035 hPa. A cold front formed from the MC’s center to the southern fringe of the cold high. The strong pressure gradient force across and nearby the cold front caused a sharp increase in near-surface winds, and most parts of Mongolia were affected by winds of 10–15 m s 1 , with some areas behind the cold front even experiencing strong winds of 15–20 m s 1 (Figure 9b). The range of sand and dust (Figure 8b) was consistent with the strong near-surface (10 m) wind areas exceeding 10 m s 1 . At 1800 UTC on 14 March, the belt-shaped SDS moved and expanded southward, with an extensive east—west distribution of dust from Northwestern China to Eastern Inner Mongolia (Figure 8c). Clearly, the MC alone was not capable of creating such an extensive dust belt, simply because the horizontal scale of the MC was not particularly large. As shown in Figure 9c,g, both the MC and its rear cold high were strengthened, with their center pressures approaching 980 hPa and 1040 hPa, respectively. The cold high caused strong easterlies and northeasterlies in its southern fringe, while the cyclone had strong westerlies and southwesterlies in its southern half. It is shown Figure 8c that the zonally extensive dust belt, which was driven by the strong winds, was located behind a long arching cold front. Therefore, the MC and its rear cold high, through their strong winds caused by the strong pressure gradient across the cold front, jointly drove the extensive SDS belt. In addition, the strong upward motion jointly generated by the MC and the rear cold high was also favorable for the lofting of dust from the ground to higher altitudes [41,42]. At 0600 UTC on 15 March, this SDS reached the Beijing–Tianjin–Hebei region and Northeastern China (Figure 8d). It was reported that the SDS affected 0.45 million square kilometers at this time [9,10], and the PM10 concentration at some Beijing stations reached 9000 μ g m 3 [8]. At 0600 UTC on 16 March, the cyclone moved eastward and weakened (Figure 9d). Accordingly, the wind speeds at the ground and 850 hPa also weakened (Figure 9d,h). However, the cold high was still maintained on the northern side of the Tibetan Plateau (Figure 9d), along with its quasi-stationary/cold front (Figure 8f,g,h), and caused the SDSs in Northwestern China and Southwestern Mongolia.
This typical case fully demonstrates the important role of the combination of cold highs and MCs in triggering and driving large-scale cross-border SDSs, which is significantly different from the situation of the MC-dominant type.

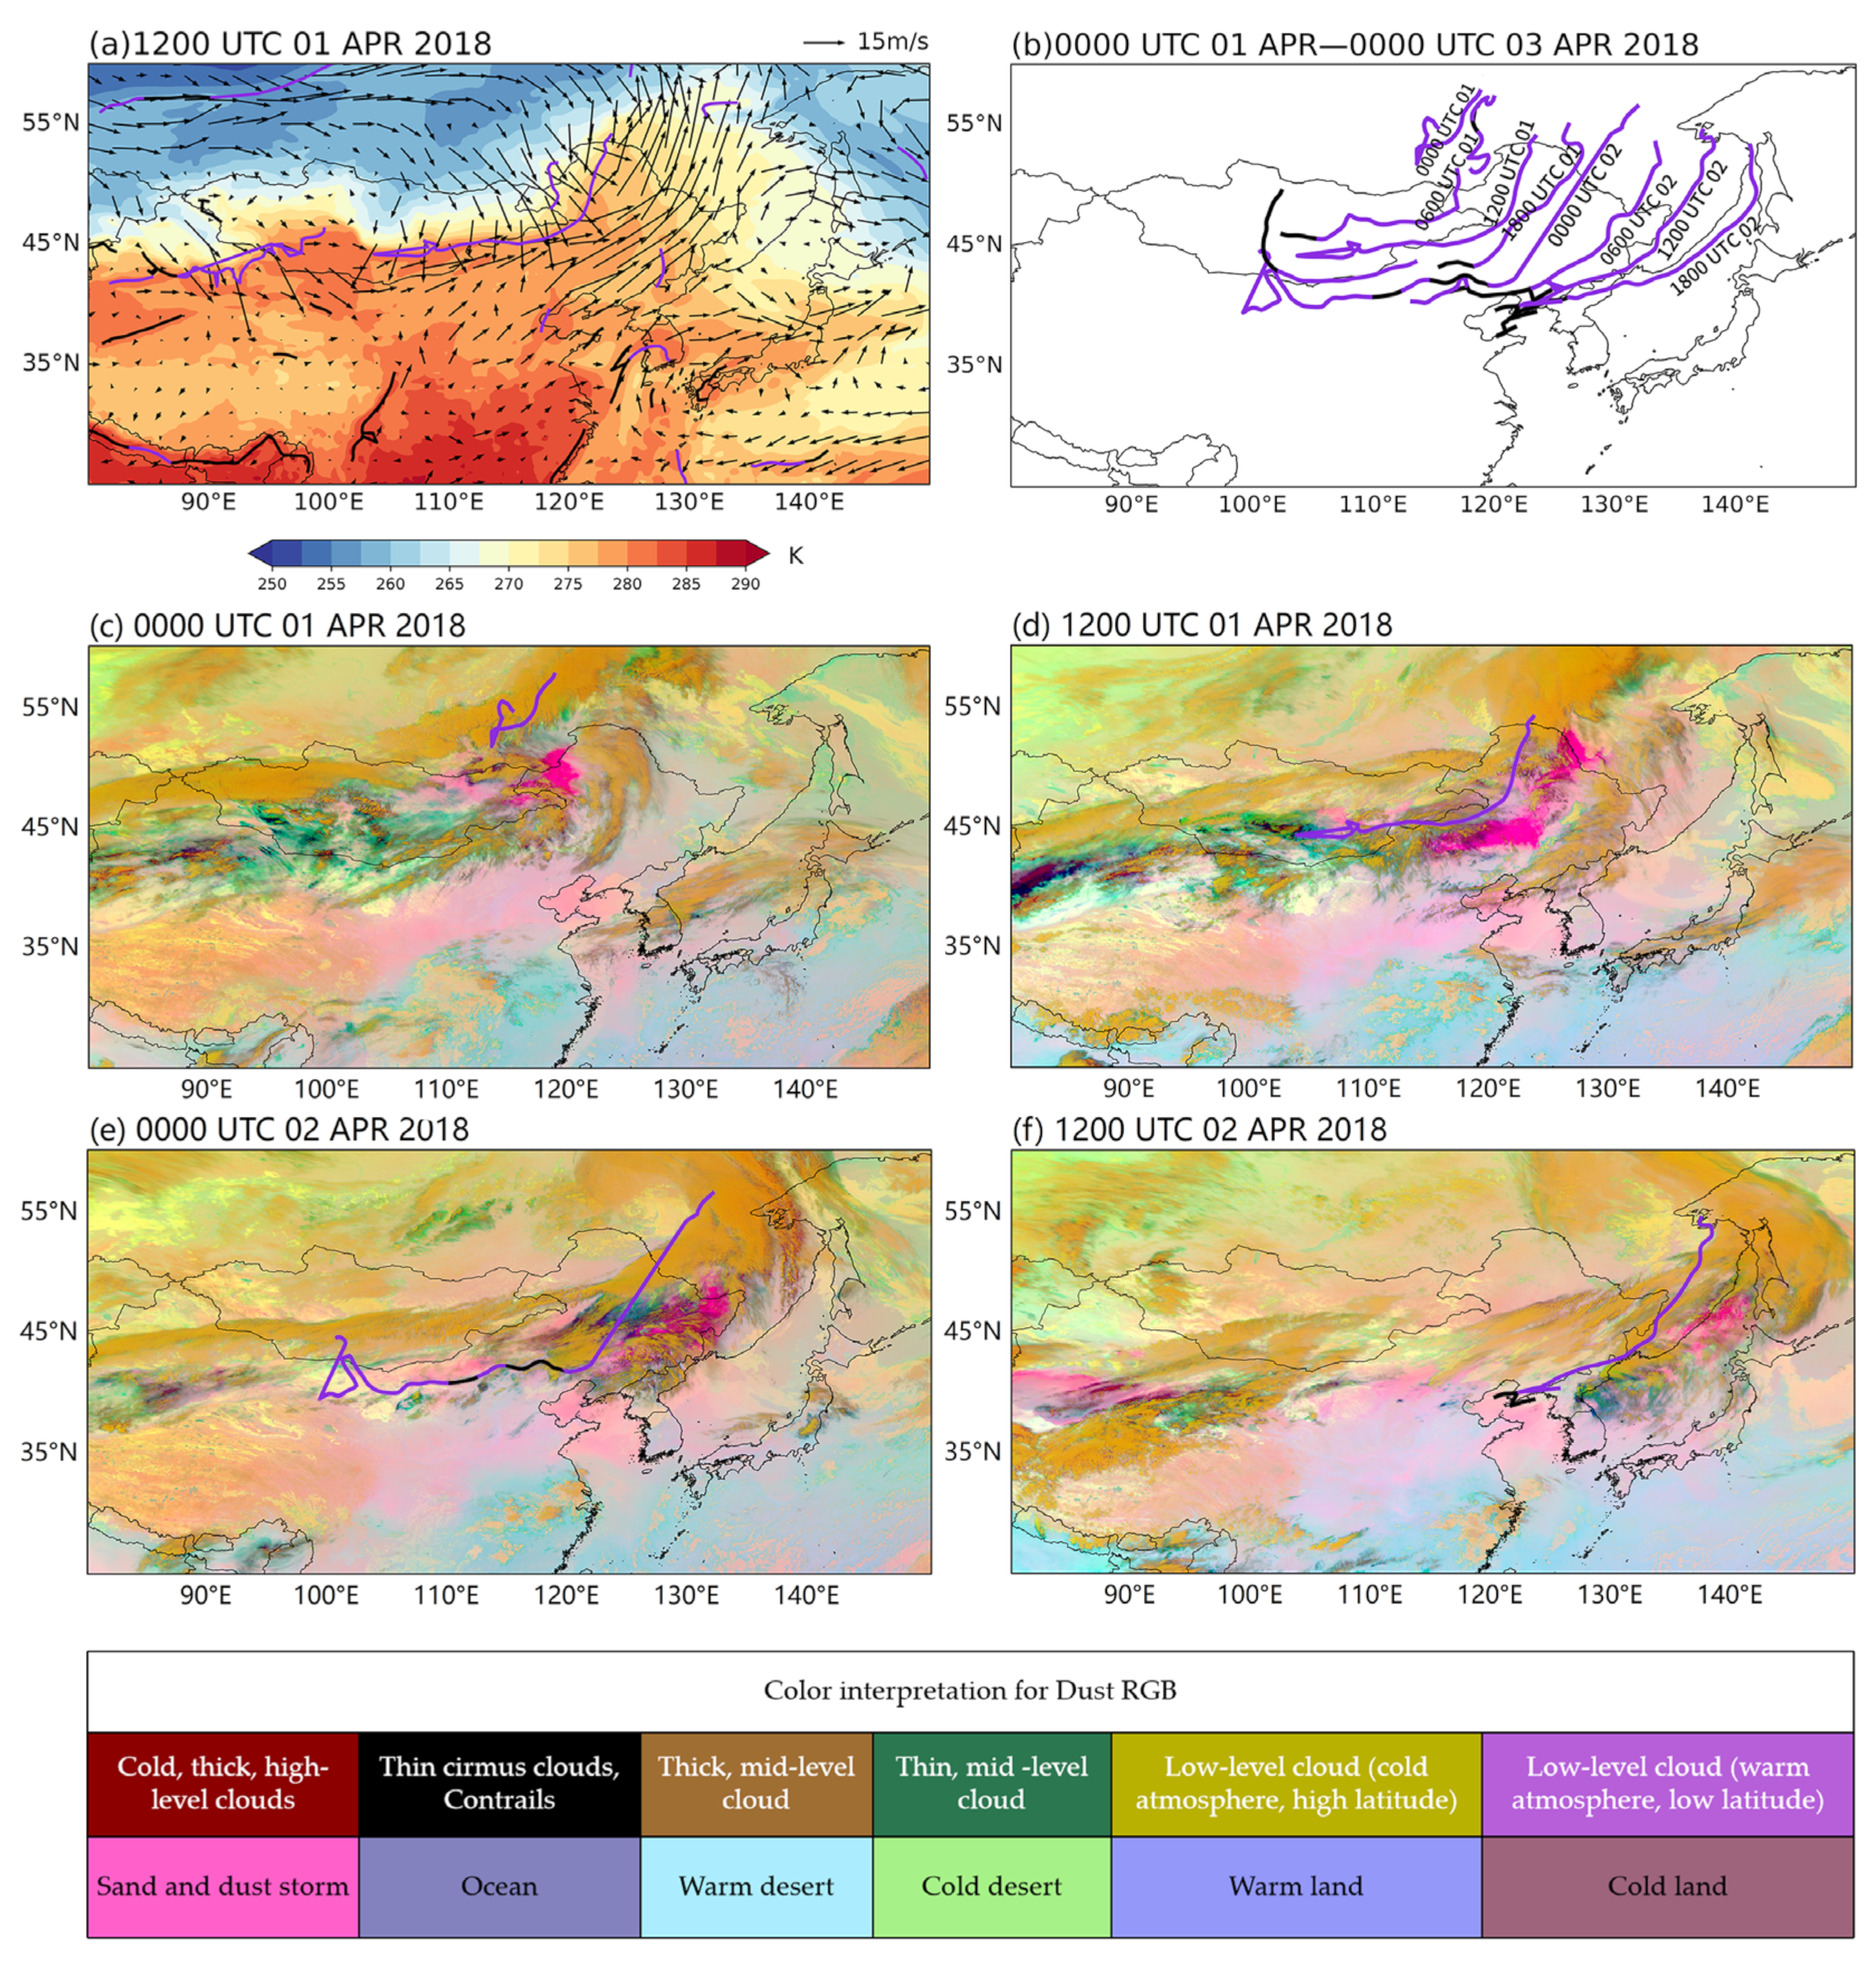
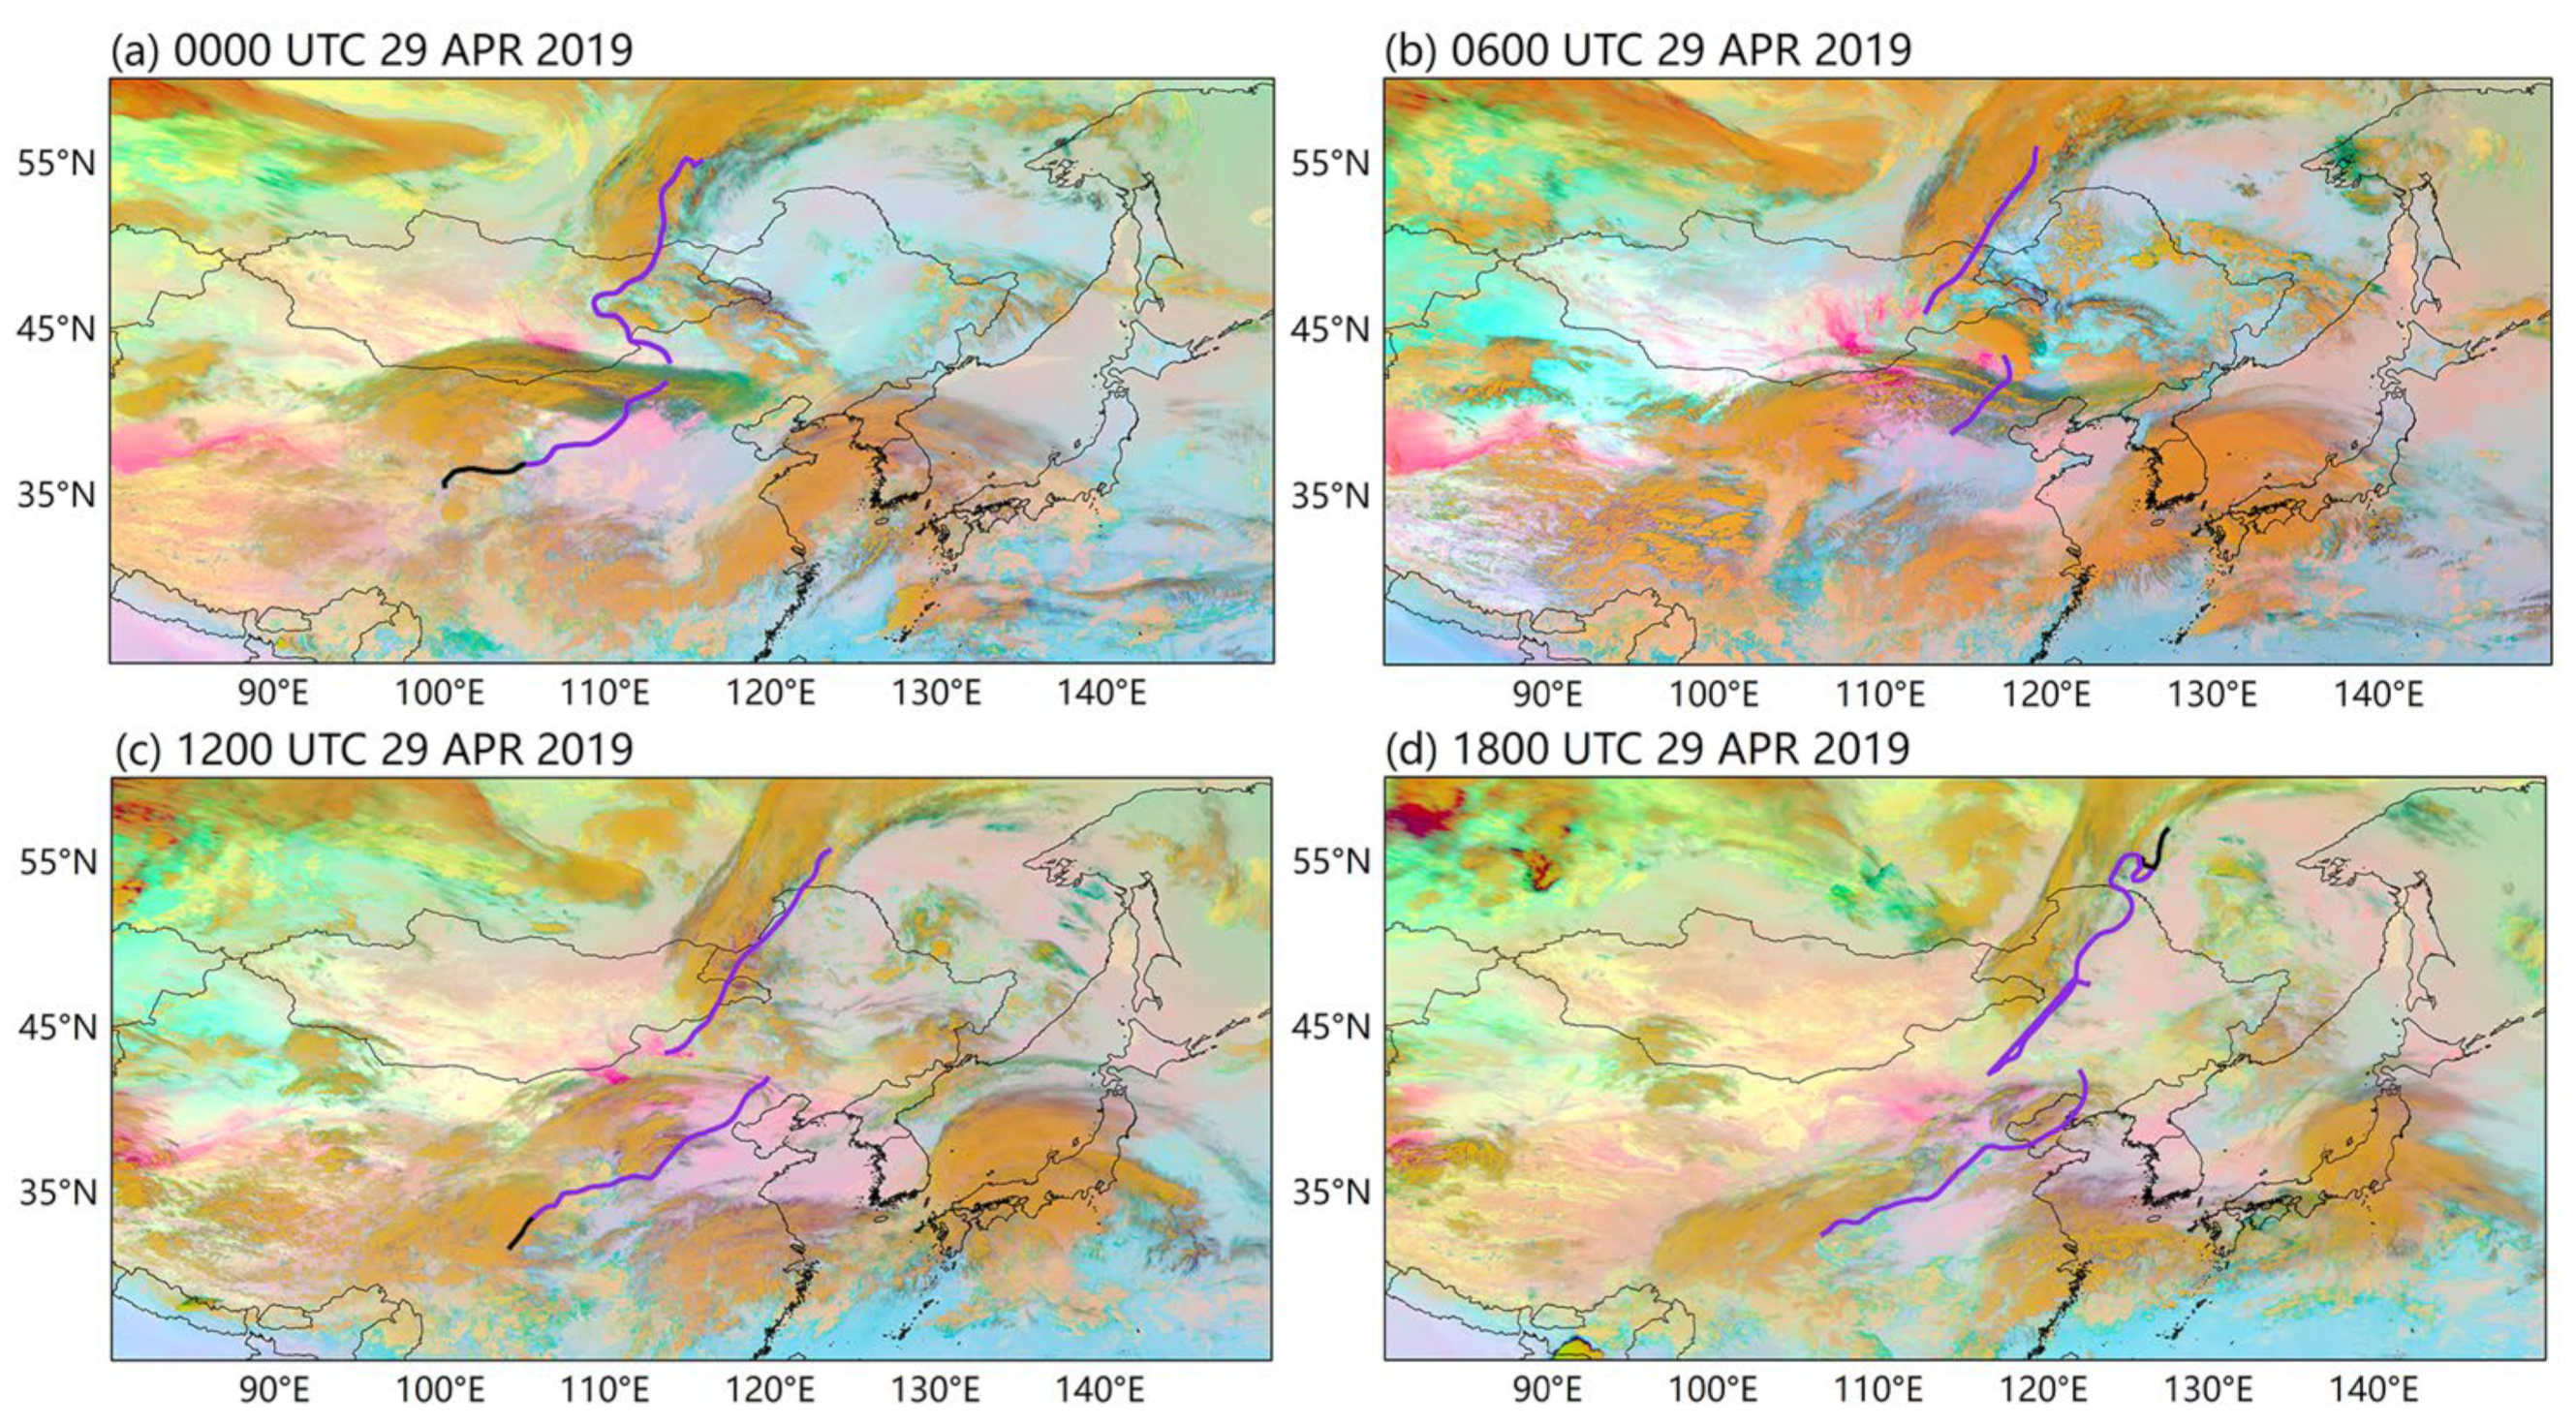
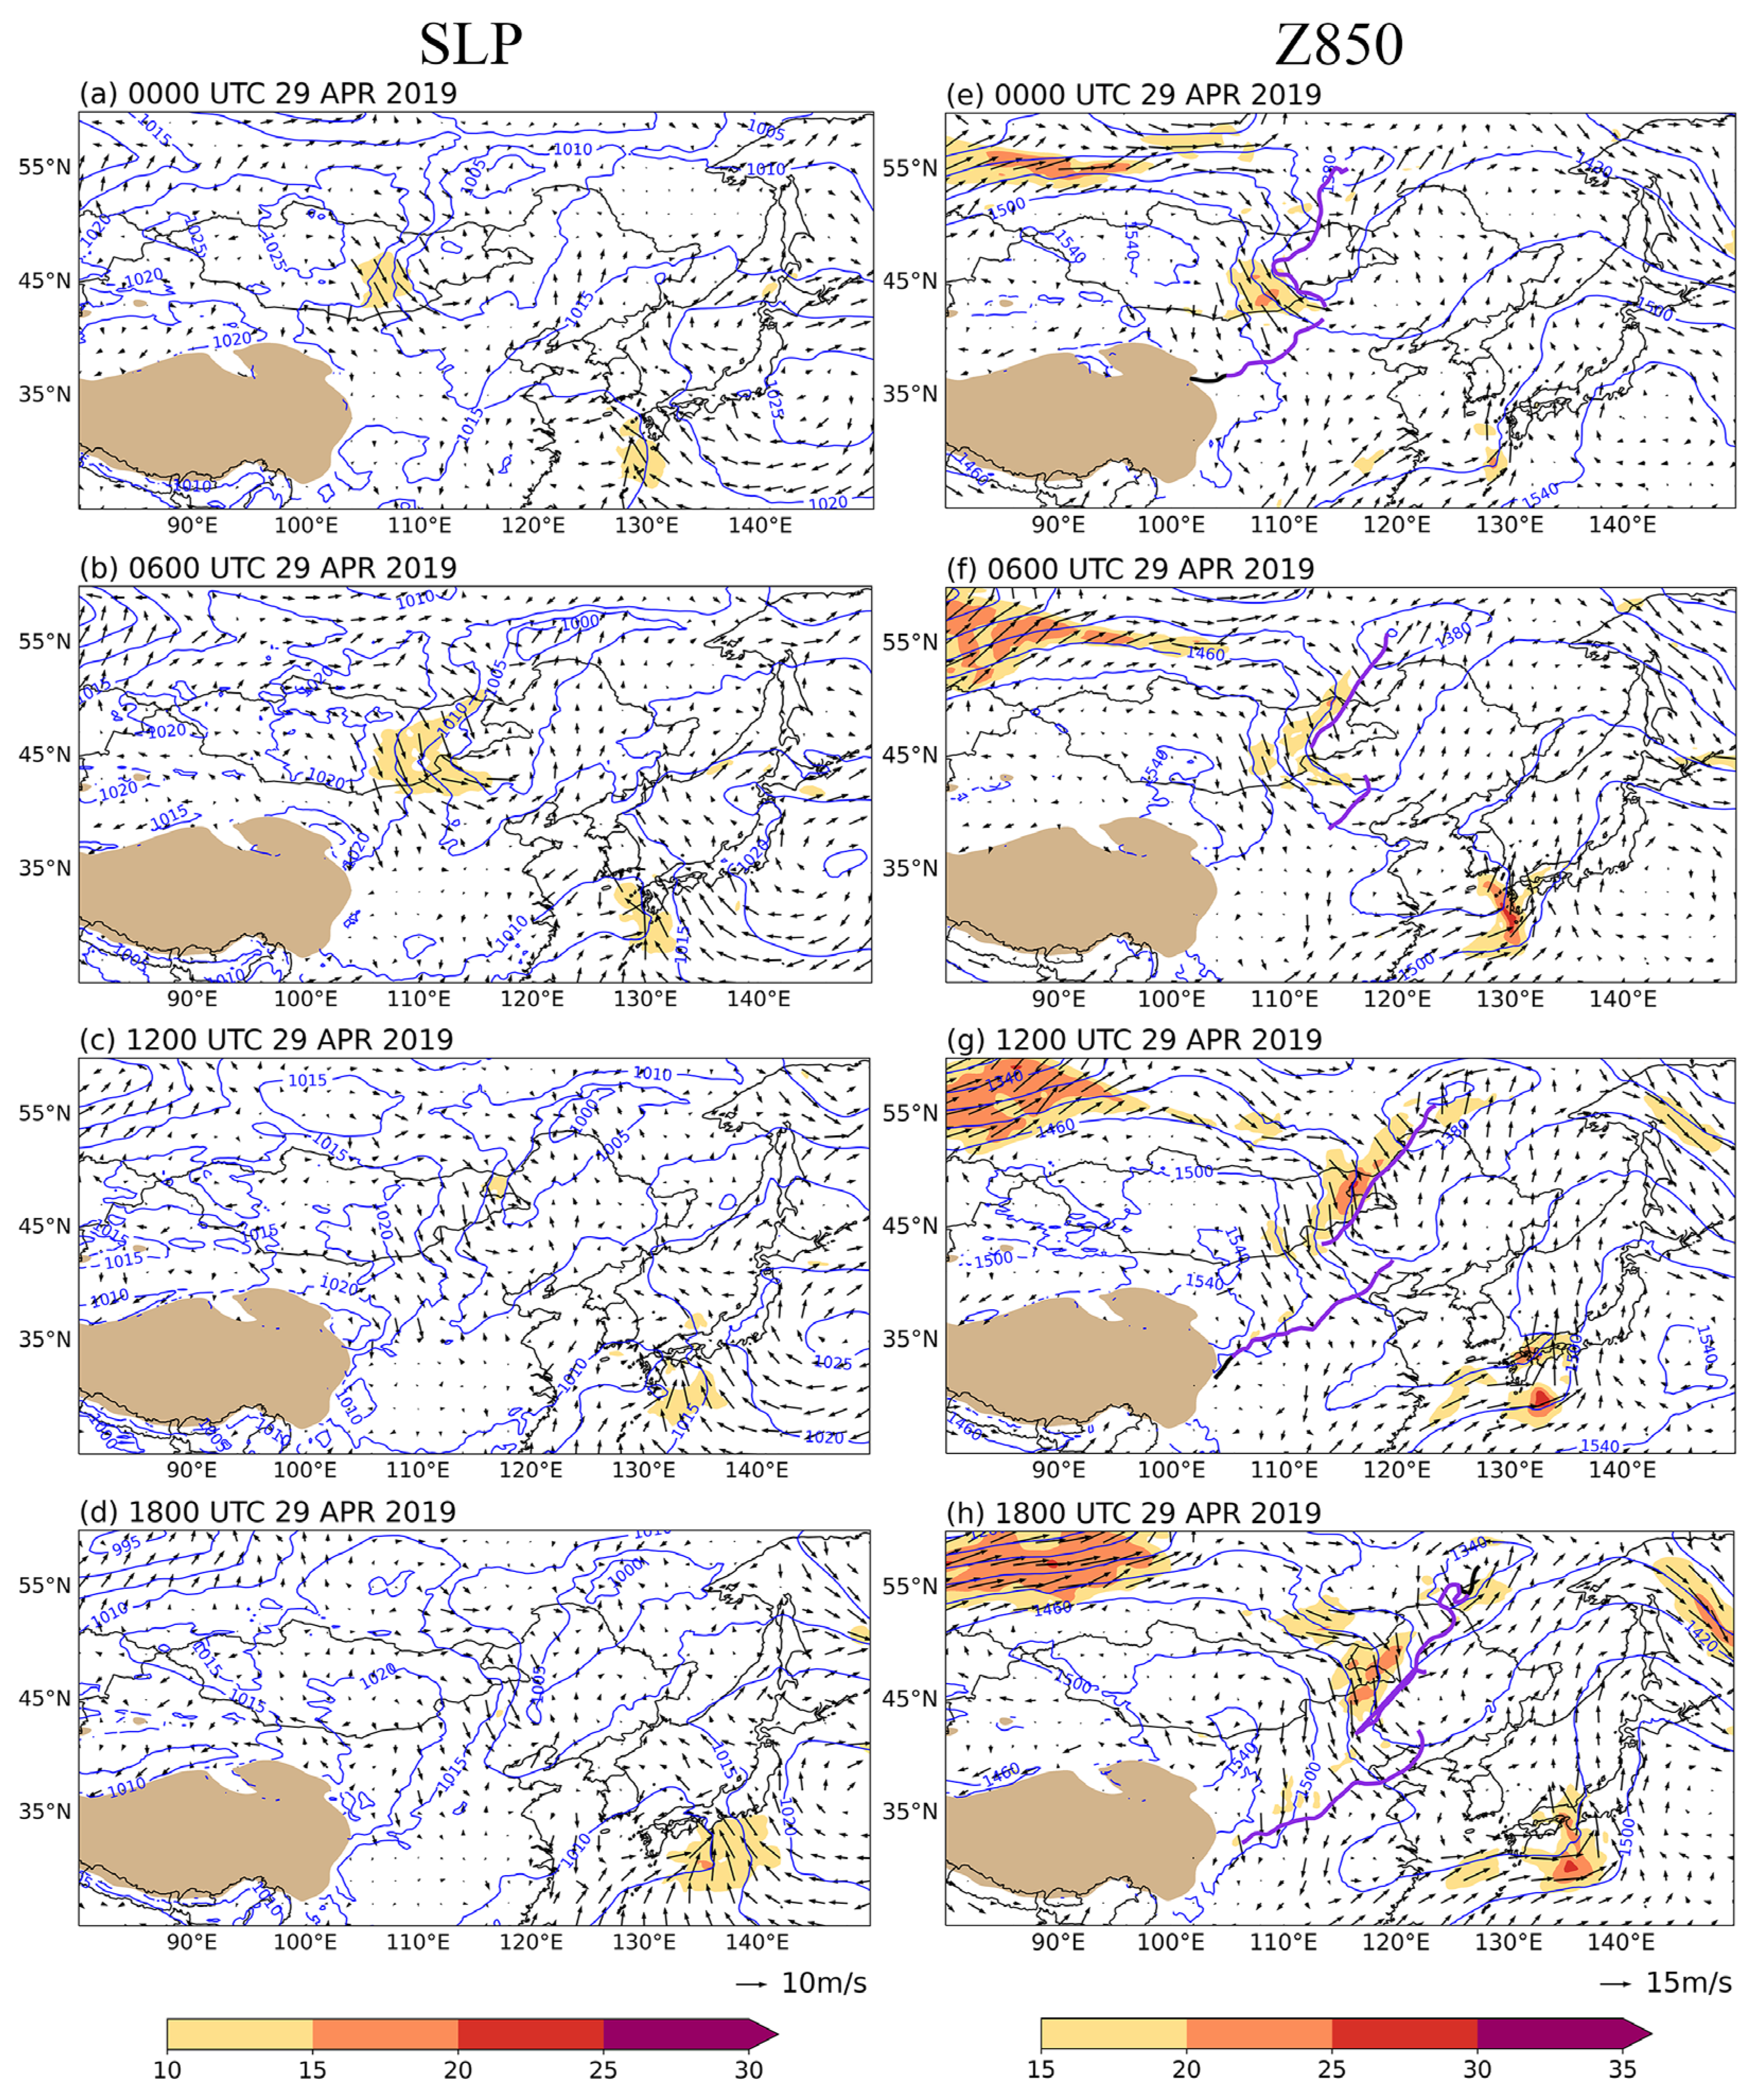
3.4.3. Cold Front Type

The cross-border SDS that occurred on 29 April 2019 was a typical case caused by the cold front type. At 0000 UTC on 29 April, a limited range of sand and dust occurred in the southern Gobi Province of Mongolia, according to the Himawari-8/9 monitoring map (Figure 10a). The sand and dust areas coincided well with the strong wind area behind the cold front (Figure 11a,e), with the 10 m wind speeds reaching 10–15 m s 1 . At this time, a cold high with a central SLP pressure of 1030 hPa entered from Northwestern Mongolia, forming a cold front in its front part. At 0600 UTC on 29 April, the sand and dust areas moved southeastward and expanded (Figure 10b), corresponding to the eastward shift of the cold front (Figure 11f) and the increase in the near-surface wind speed (Figure 11b). The increase in strong winds near the ground was caused not only by the strong pressure gradient at the front edge of the cold high but also by the downward transfer of momentum (corresponding to strong winds) from 850 hPa to near the ground behind the cold front [16]. At 1200 UTC on 29 April, the central pressure of the cold high remained above 1020 hPa (Figure 11c), and the wind speed behind the cold front at 850 hPa remained at its earlier intensity (Figure 11g). As the pressure gradient force weakened, the 10 m wind speed also weakened (Figure 11c), and the extent of the SDS also decreased (Figure 10c). At 1800 UTC on 29 April, the cold high moved southward, and the 10 m wind at the front edge of the cold high decreased below 10 m s 1 (Figure 11d), coinciding with the end of the SDS (Figure 10d). Overall, compared to those associated with the MC-dominant type and MC-CH type, the horizontal extent of the SDS for the cold front type is smaller.
As discussed previously, during the period of 2000–2023, the cold front type contributed to eight cross-border SDSs out of all 76 cases, accounting only for 10.5%. When cold fronts approach the Mongolian Plateau from the west, the Western Mongolian topography plays the role of frontolysis [43]. Therefore, relatively fewer cross-border cold fronts between Mongolia and China were observed in the spring. This is possibly one of the reasons that cold fronts contributed to only 10.5% of the cross-border SDSs.

4. Conclusions and Discussion

In this study, we investigated the key characteristics of the cross-border SDSs between Mongolia and Northern China and the related weather types based on the MODIS AOD data and Himawari-8/9 dust RGB images, the “Summary table of sand and dust storm weather processes in China from 2000 to 2023” and “A dataset of the Mongolian Plateau spring sand and dust storm distribution”, and ERA5 data. The main conclusions are as follows.
(1)
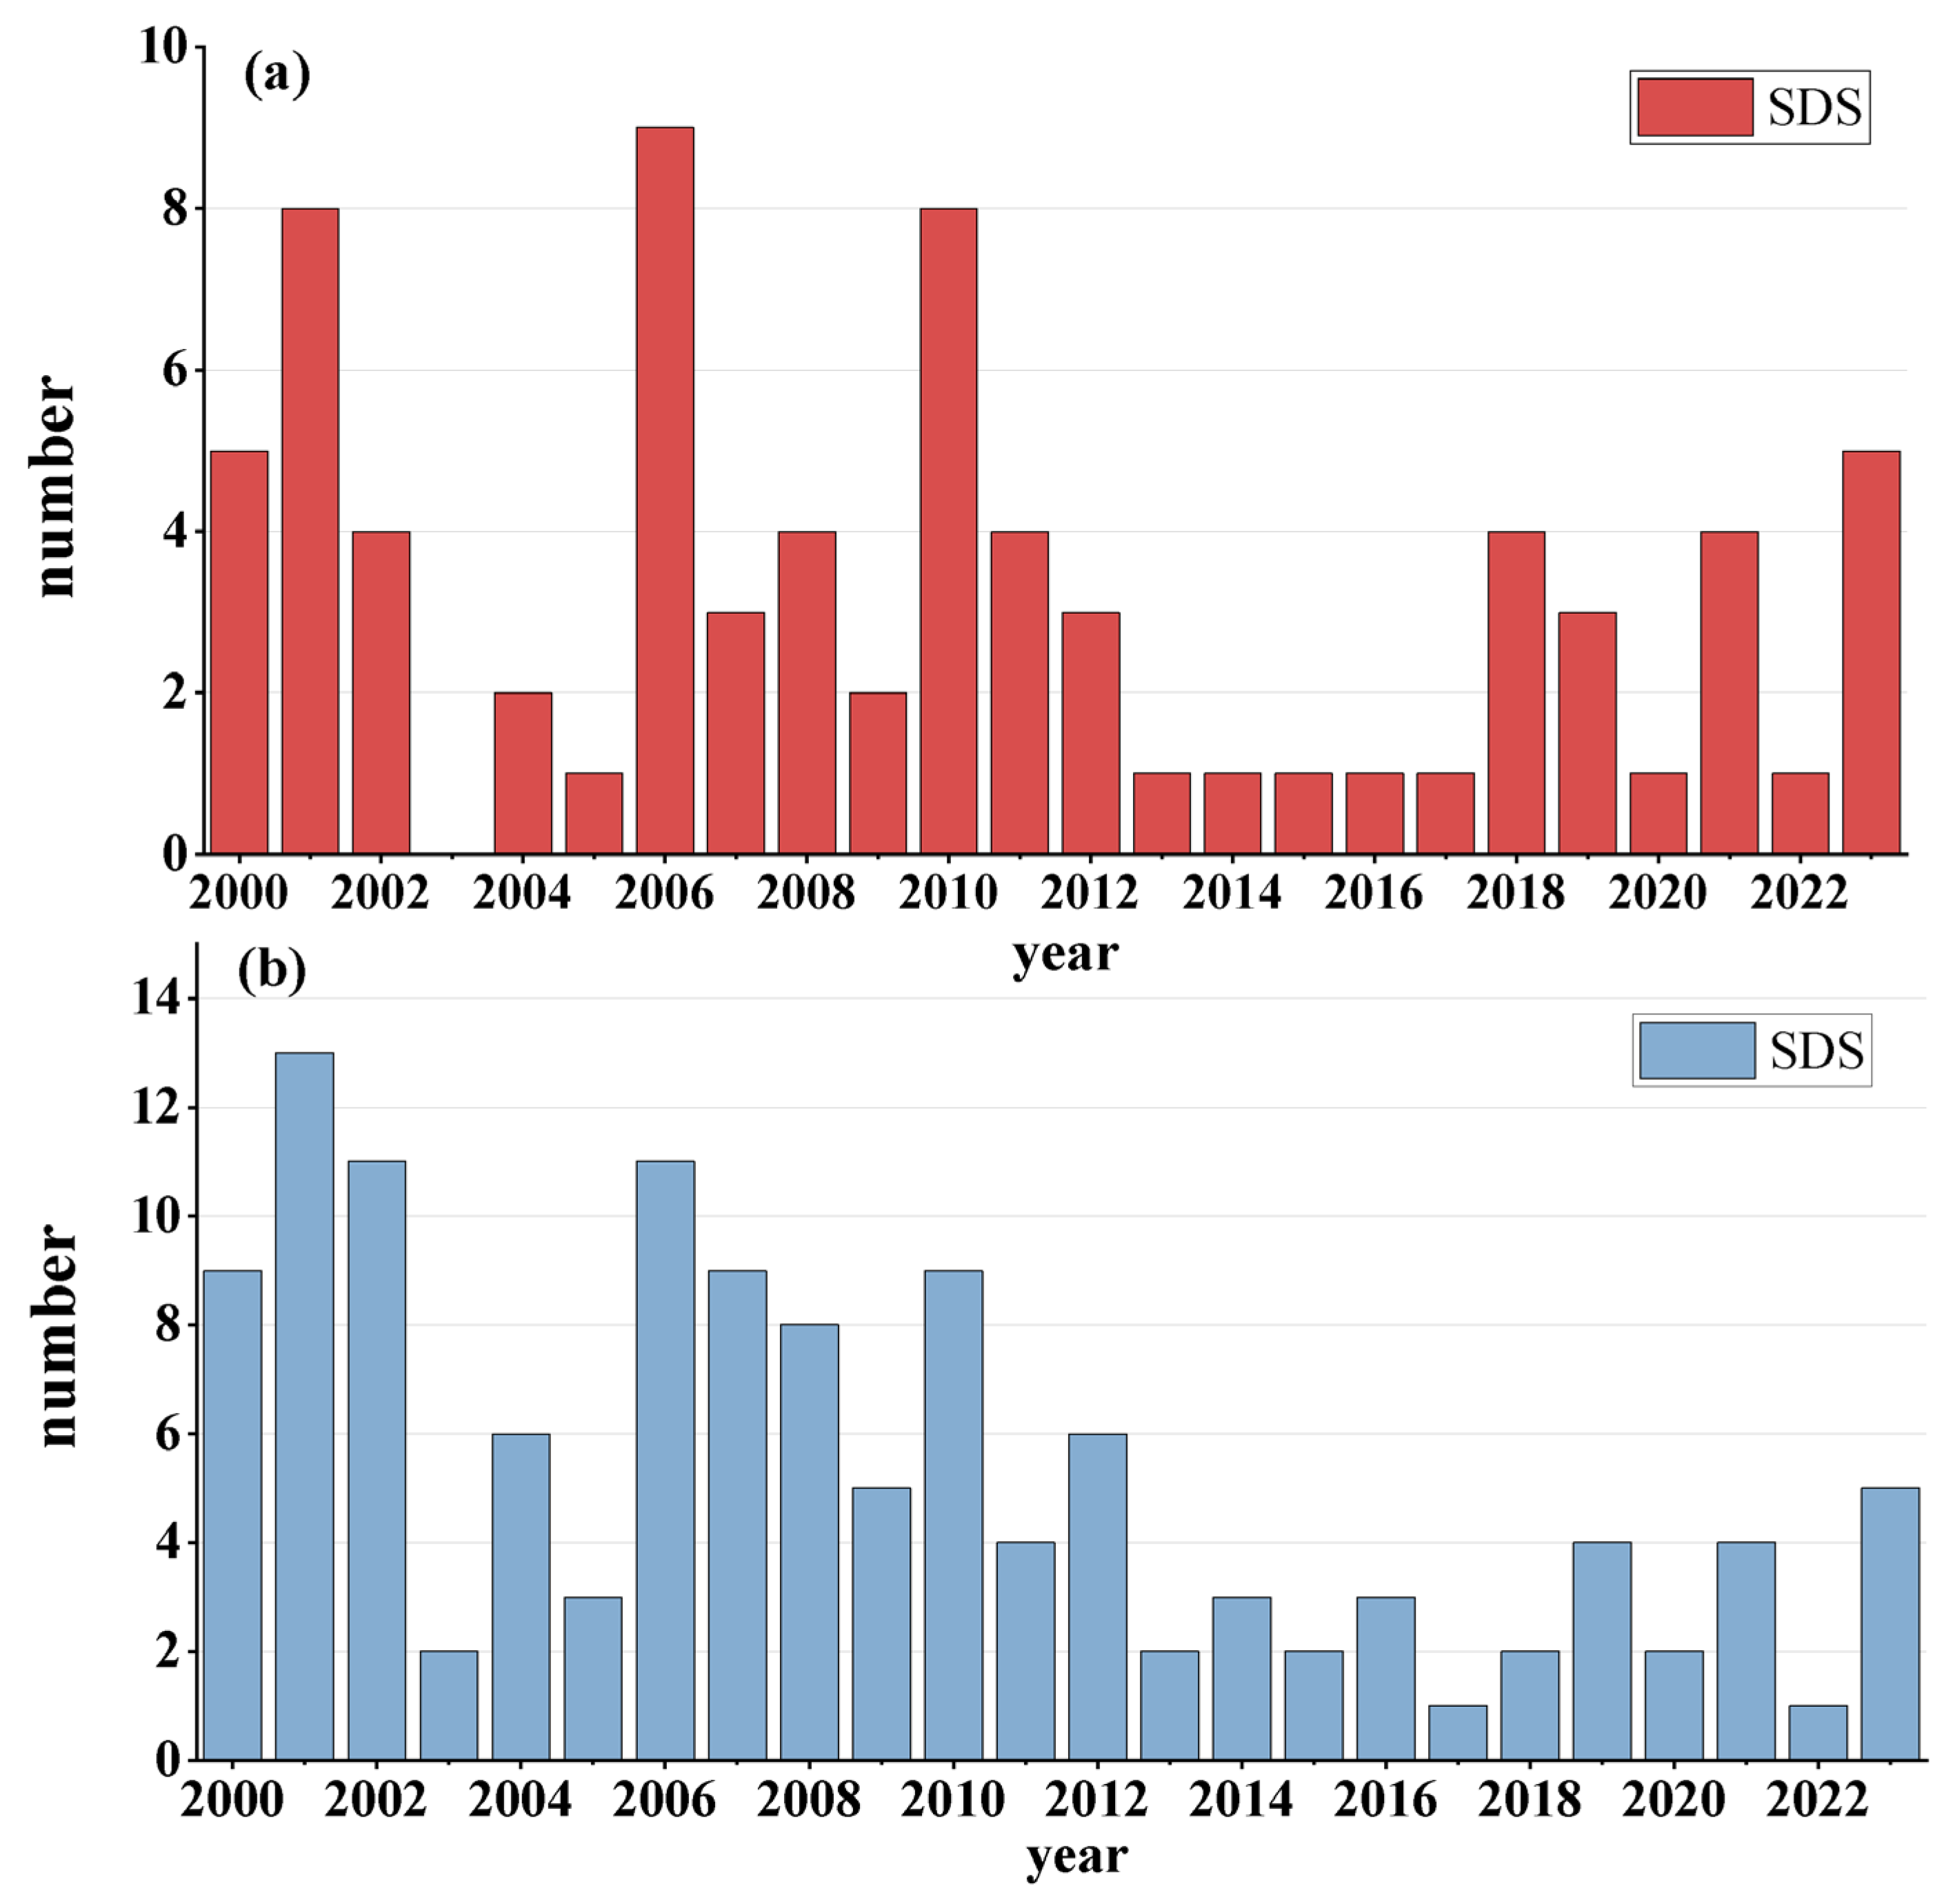
The spring cross-border SDSs between Northern China and Mongolia during 2000–2023 have been identified and documented. There were 76 cross-border SDSs during this period, and their occurrence frequency showed a declining trend with fluctuations. In the first decade of the 21st century, both countries experienced frequent spring SDSs, with as many as nine cross-border SDSs occurring in the spring of 2006. The SDS frequency gradually decreased from 2011 to 2017. In recent years, however, the cross-border SDSs have resumed their frequent activity. During the spring of 2000–2023, cross-border SDSs accounted for 55.1% of the total SDSs that occurred in Northern China and Mongolia.
(2)
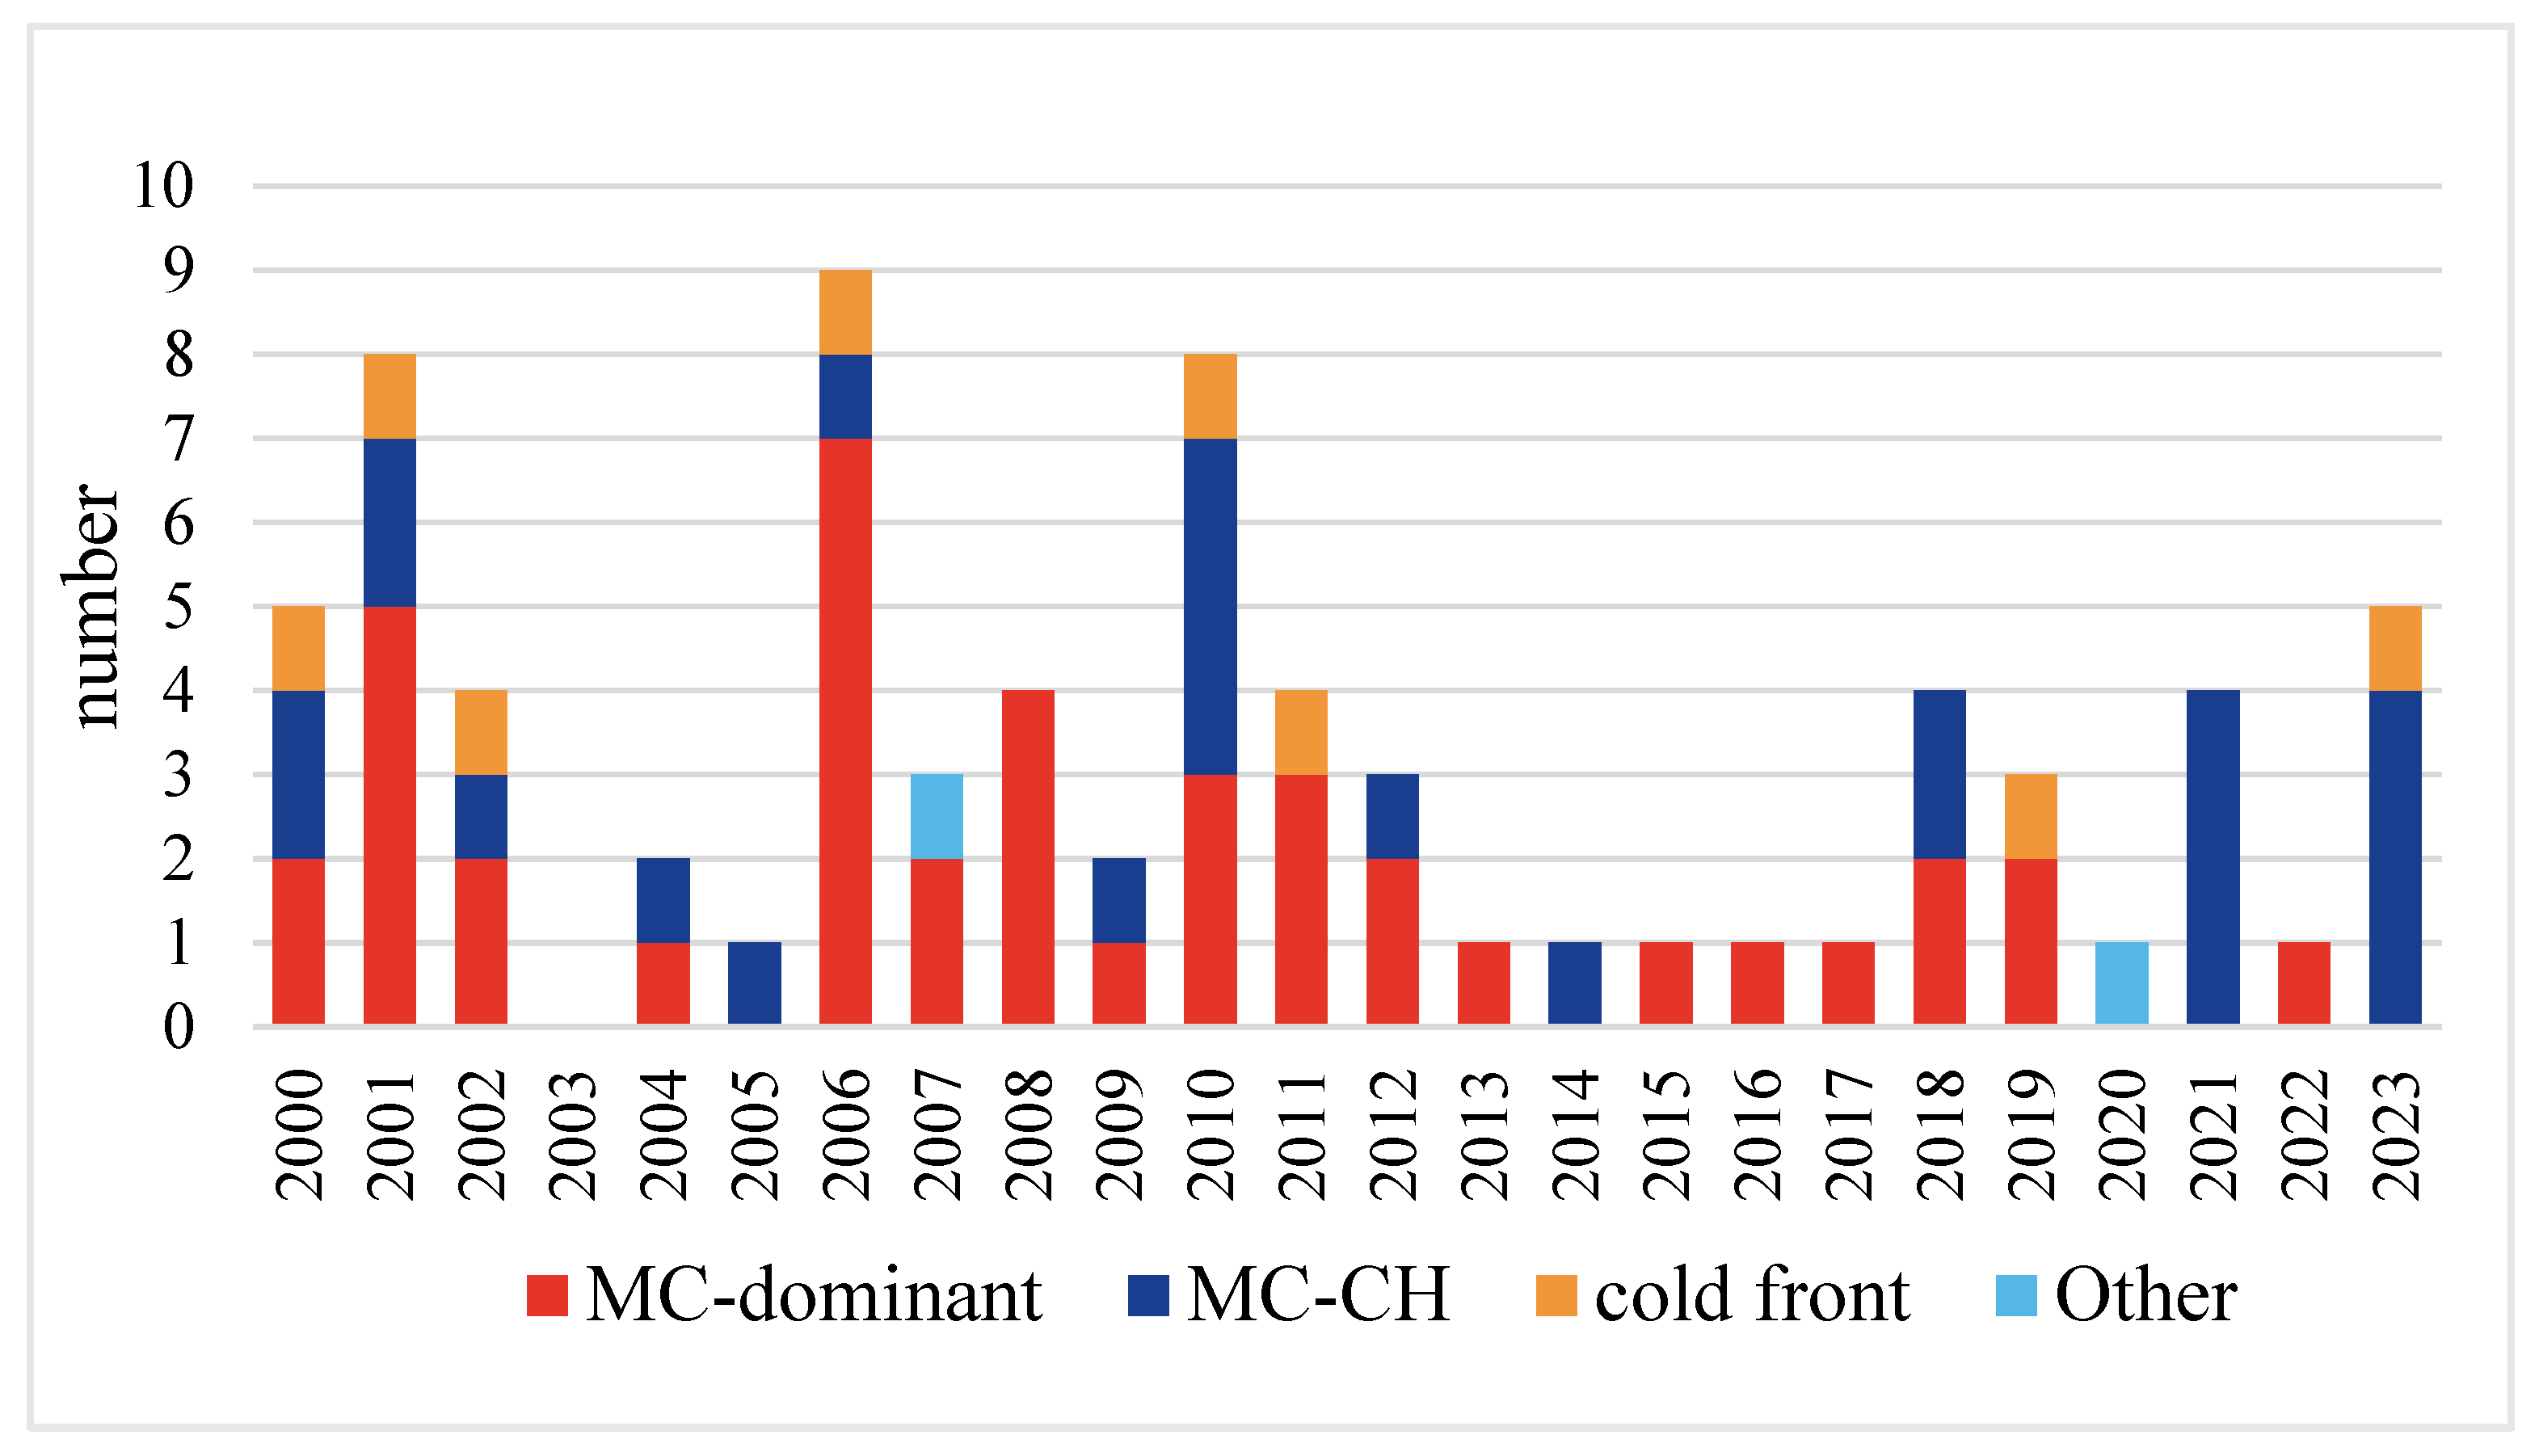
The weather systems that trigger and drive cross-border SDSs can be categorized into three types, namely the MC-dominant type, MC-CH type, and cold front type. Among the total cross-border SDS cases, the MC-dominant type drove 41 SDSs, accounting for 53.9%; the MC-CH type was responsible for 25 SDSs, accounting for 32.9%; the cold front type caused eight SDSs, accounting for 10.5%; and other weather types triggered only two SDSs, accounting for 2.6%.
(3)
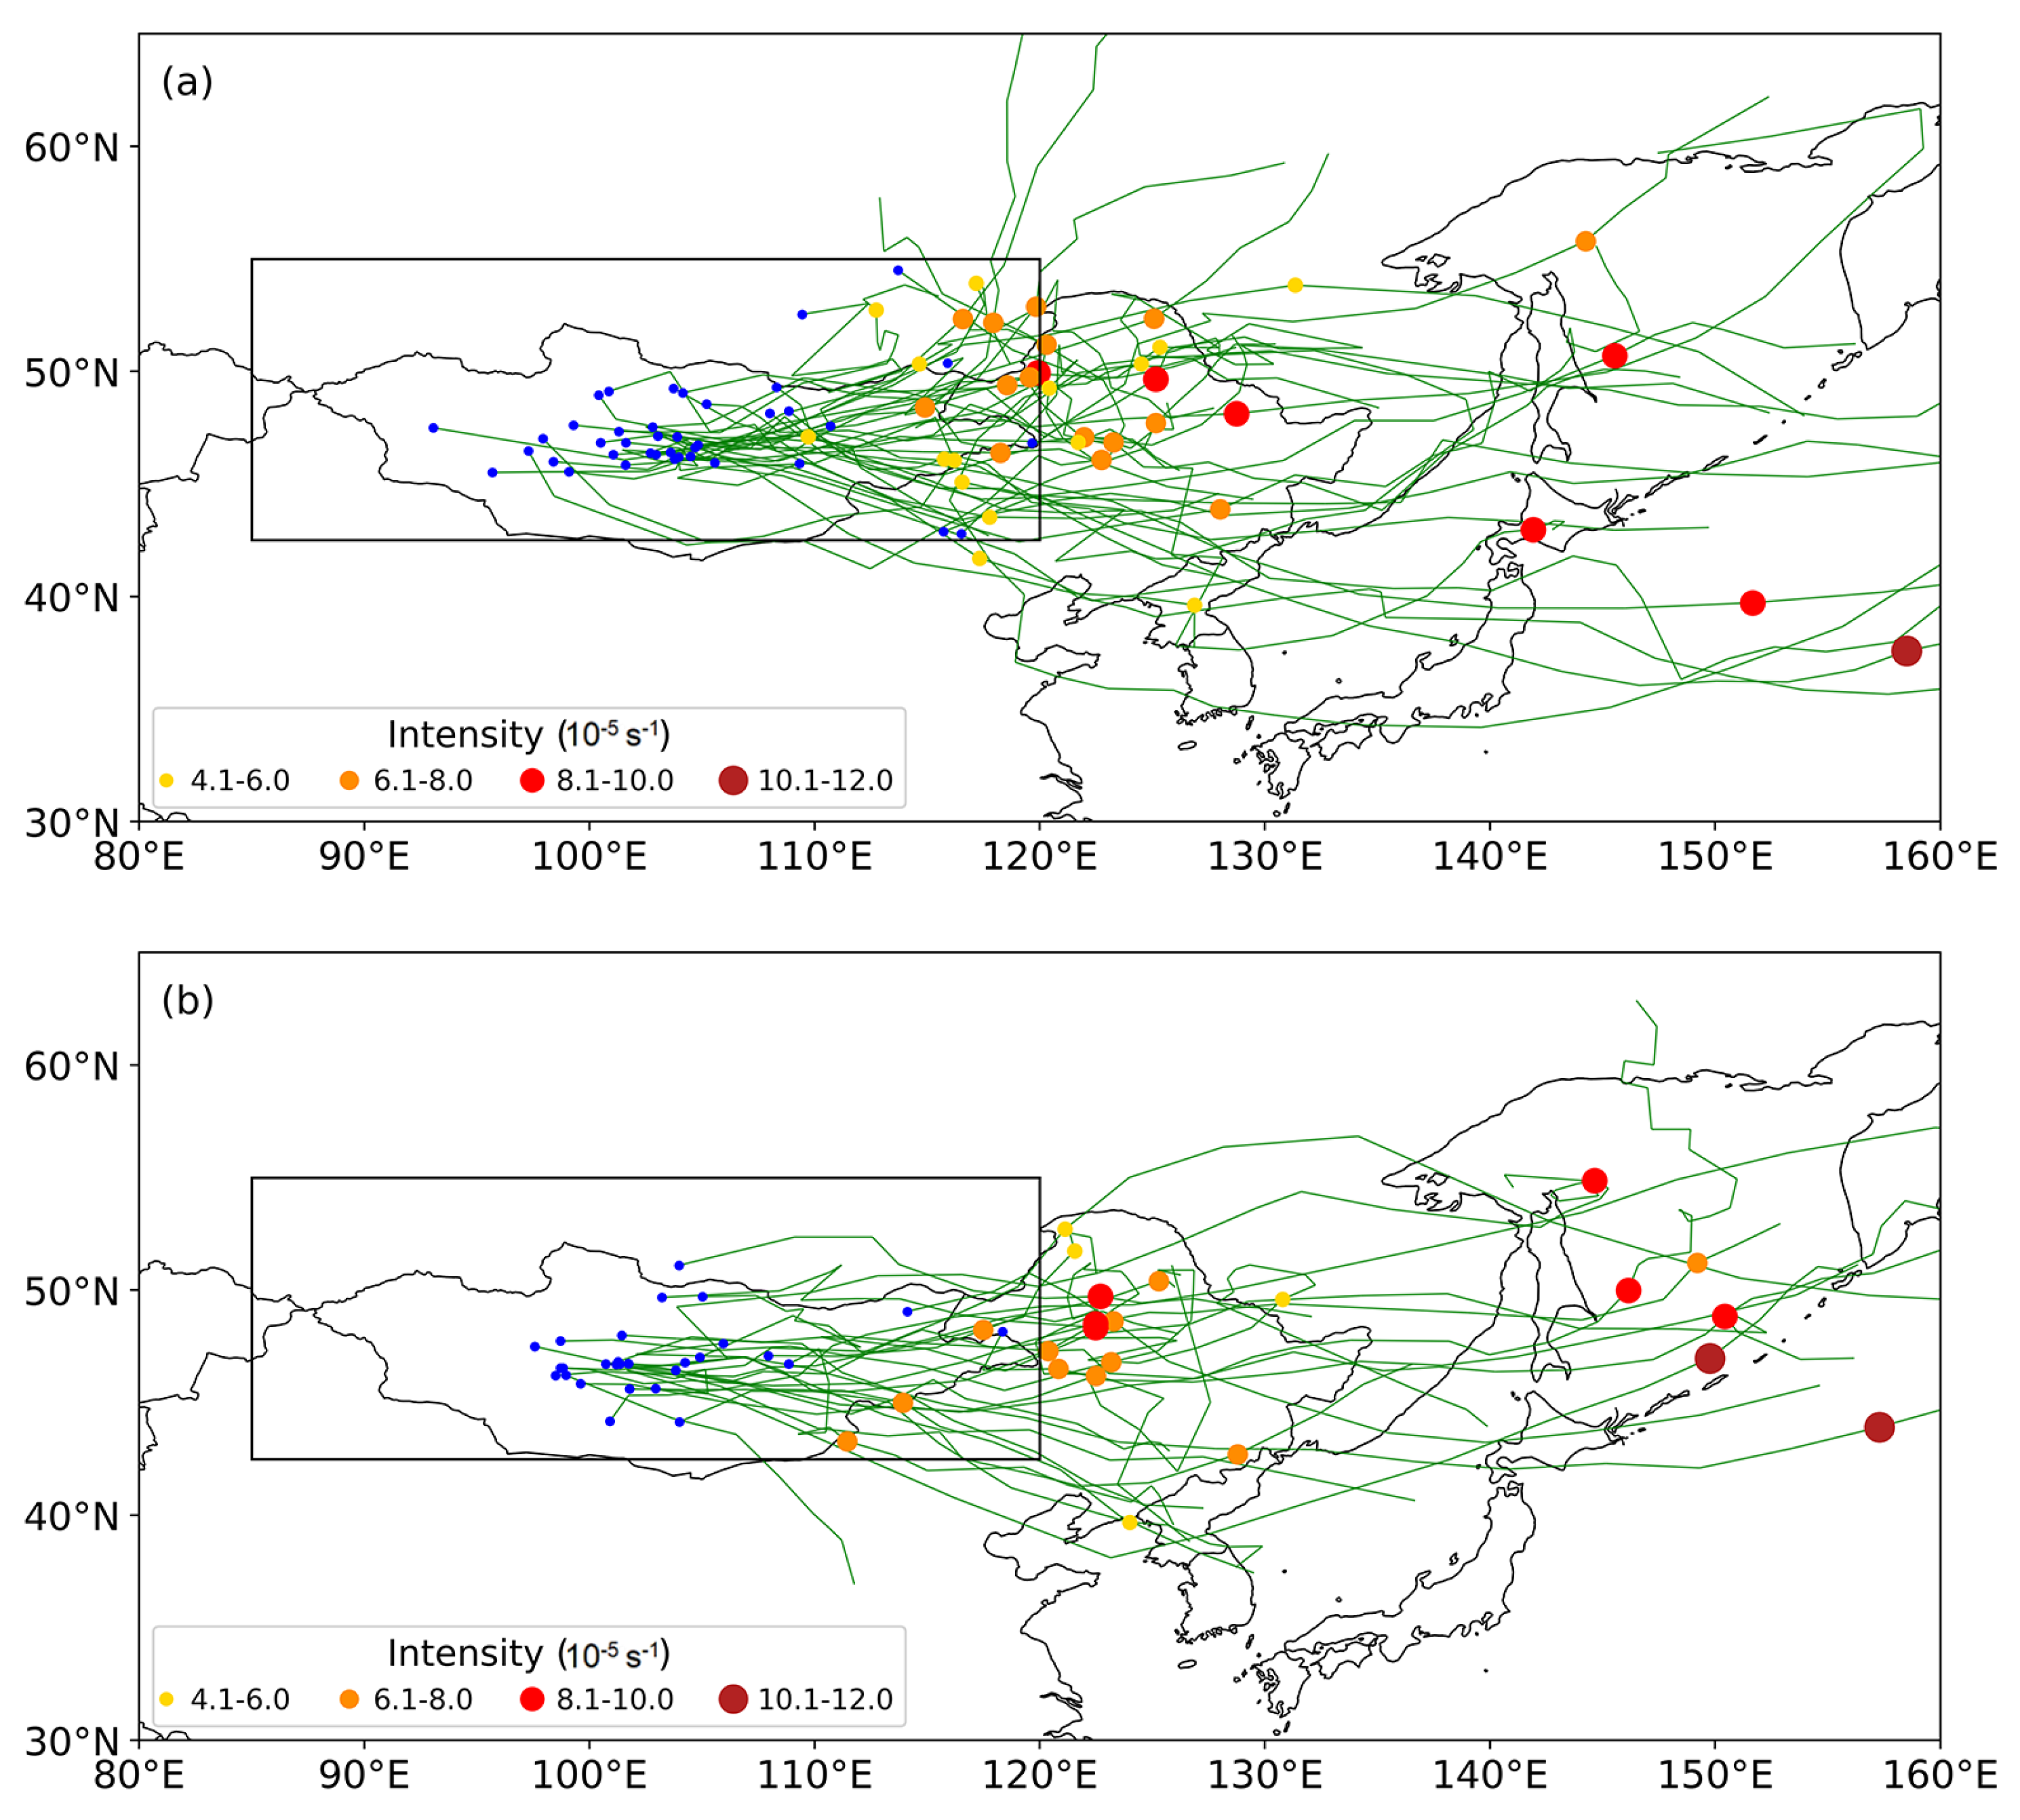
The horizontal distributions of the cross-border SDSs driven by the three types of weather systems are significantly different. The horizontal extent of SDSs associated with cold fronts is relatively limited because the SDS-prone weather conditions are mainly driven by strong winds behind cold fronts. The MC-dominant type often triggers SDSs in the southwestern and southern sectors of the MC, so the sand and dust ranges are consistent with the horizontal scale of the MCs and larger than those associated with cold fronts. The MC-CH type can trigger and drive large-scale SDSs with extensive east—west belts, which are more extensive than those of the MC-dominant type. The strong near-surface winds in the southern flanks of the MCs and their rear cold highs jointly drive such large-scale SDSs.
In the past, SDSs in China and Mongolia were investigated separately, and they have not been systematically studied from the perspective of cross-border phenomena. Although research from this perspective helps us to understand SDSs at the national scale, it is insufficient for a comprehensive understanding of the key features and impacts of cross-border SDSs. In this study, we identified and documented the cross-border SDSs between China and Mongolia during the spring of 2000–2023 based on meteorological observations and satellite remote sensing data. In particular, the high-spatiotemporal-resolution data from the Himawari-8/9 satellite have provided excellent opportunities for the monitoring of SDSs.
This study indicates that the vast majority of cross-border SDSs are related to MCs, accounting for 86.8%. Although previous studies have also emphasized MCs as the main drivers of SDSs in Northern China, these studies have not pointed out that there are different categories of MCs driving SDSs. In the present study, approximately half of the spring cross-border SDSs were driven by the MC-dominant type, while one third were driven by the MC-CH type. We also noticed that the number of cross-border SDSs associated with the MC-CH type has increased in recent years. The MC-CH type is closely associated with an extensive east—west band in the SDS distribution.
Due to the topography effect of the Mongolian Plateau, cyclone genesis and development are very active in Mongolia in the spring. On the other hand, due to the frontolysis effect of the Western Mongolian topography, only 10.5% of the cross-border SDSs were observed to be driven by cold fronts in the spring. Thus, the MC-related weather systems are prevalent in triggering and driving cross-border SDSs. As discussed in Section 3.3, for the MC-CH type, the MCs tend to be stronger in the mature stage, compared to the situation of the MC-dominant type (Figure 5). Thus, we speculate that the dust-affected area of the MC-CH type would also be larger (for example, during 9–13 Apr 2023). Considering that the strong cross-border SDSs in recent years have been dominated by the MC-CH type, this type of weather system deserves further in-depth research.
We also observed that 10 spring SDSs observed in China in the past three years (2021–2023) all originated from Mongolia. This highlights the direct impact of cross-border SDSs on the ecological environment in Northern China. Although the Chinese government has implemented several ecological restoration projects, such as the construction of the Northern China (Three-North) Shelterbelt Program, the extent to which SDS disasters invade from abroad remains serious, and the ecological environment in Northern China is still facing the adverse impacts of cross-border SDSs. This suggests that international cooperation is crucial in preventing and controlling desertification, as well as predicting SDSs.

Author Contributions

Conceptualization, C.B., M.Y. and Z.X.; Formal analysis, A.B. and C.B.; Funding acquisition, M.Y., C.B. and G.P.; Methodology, A.B., C.B. and M.Y.; Project administration, C.B., G.P. and M.Y.; Resources, C.B. and M.Y.; Supervision, C.B., M.Y. and G.P.; Visualization, A.B.; Writing—original draft, A.B. and C.B.; Writing—review and editing, A.B., C.B., M.Y., Z.X. and G.P. All authors have read and agreed to the published version of the manuscript.

Funding

This research was jointly funded by the National Nature Science Foundation of China (Cholaw Bueh, No. 42261144746), the Mongolian Foundation for Science and Technology (Gomboluudev Purevjav, No. NSFC_2_2022/01), the Natural Science Foundation of Inner Mongolia Autonomous Region (Mei Yong, No. 2023LHMS04002), the Key R&D and Achievement Transformation Program of Inner Mongolia Autonomous Region (Mei Yong, No. 2022YFSH0091), the Key scientific research projects and soft science research projects for military civilian integration in Inner Mongolia Autonomous Region (Mei Yong, No. JMRKX202207) and the Special Exchange Program of the Chinese Academy of Sciences—Class B (Cholaw Bueh).

Data Availability Statement

The Himawari-8/9 remote sensing image data can be obtained through https://www.data.jma.go.jp/mscweb/en/product/monitor_yellowsand.html (accessed on 23 September 2023). The MODIS satellite data can be downloaded from https://ladsweb.modaps.eosdis.nasa.gov (accessed on 5 August 2023). The ERA5 data archived by the ECMWF can be downloaded from https://cds.climate.copernicus.eu/#/Home (accessed on 21 May 2023). Other data and codes for this study can be obtained from the corresponding authors upon reasonable request.

Acknowledgments

The authors gratefully acknowledge the Japan Meteorological Agency (JMA) for providing the Himawari-8/9 geostationary meteorological satellite data used in this study. The authors also express their sincere thanks to Michael Reeder (Monash University, Australia) for providing the front tracking code.

Conflicts of Interest

The authors declare no conflicts of interest.

References

  1. Wang, S.; Wang, J.; Zhou, Z.; Shang, K.; Yang, D.; Zhao, Z. Regional characteristics of dust events in China. J. Geogr. Sci. 2003, 13, 35–44. [Google Scholar] [CrossRef]
  2. GB/T 20479-2006; National Technical Regulations of Sand and Dust Storm Monitoring in China. Standardization Administration of China: Beijing, China, 2006.
  3. Shao, Y.; Wang, J. A climatology of Northeast Asian dust events. Meteorol. Z. 2003, 12, 187–196. [Google Scholar] [CrossRef]
  4. An, L.; Che, H.; Xue, M.; Zhang, T.; Wang, H.; Wang, Y.; Zhou, C.; Zhao, H.; Gui, K.; Zheng, Y.; et al. Temporal and spatial variations in sand and dust storm events in East Asia from 2007 to 2016: Relationships with surface conditions and climate change. Sci. Total Environ. 2018, 633, 452–462. [Google Scholar] [CrossRef]
  5. Zhang, K.; Chai, F.; Zhang, R.; Xue, Z. Source, route and effect of Asian sand dust on environment and the oceans. Particuology 2010, 8, 319–324. [Google Scholar] [CrossRef]
  6. Bao, T.; Gao, T.; Nandintsetseg, B.; Yong, M.; Jin, E. Variations in Frequency and Intensity of Dust Events Crossing the Mongolia–China Border. Sola 2021, 17, 145–150. [Google Scholar] [CrossRef]
  7. Bao, C.; Yong, M.; Bueh, C.; Bao, Y.; Jin, E.; Bao, Y.; Purevjav, G. Analyses of the Dust Storm Sources, Affected Areas, and Moving Paths in Mongolia and China in Early Spring. Remote Sens. 2022, 14, 3661. [Google Scholar] [CrossRef]
  8. Bueh, C.; Zhuge, A.; Xie, Z.; Yong, M.; Purevjav, G. The development of a powerful Mongolian cyclone on 14–15 March 2021: Eddy energy analysis. Atmos. Ocean. Sci. Lett. 2022, 15, 100259. [Google Scholar] [CrossRef]
  9. Duan, B.; Liu, X.; Guo, R.; Song, Q.; Di, X.; Duan, M. Cause Analysis on Severe Dust Storm in Northern China on 15 March 2021. J. Arid. Meteorol. 2021, 39, 541–553. [Google Scholar] [CrossRef]
  10. Yin, Z.; Wan, Y.; Zhang, Y.; Wang, H. Why super sandstorm 2021 in North China? Natl. Sci. Rev. 2022, 9, nwab165. [Google Scholar] [CrossRef]
  11. Chen, S.; Zhao, D.; Huang, J.; He, J.; Chen, Y.; Chen, J.; Bi, H.; Lou, G.; Du, S.; Zhang, Y.; et al. Mongolia Contributed More than 42% of the Dust Concentrations in Northern China in March and April 2023. Adv. Atmos. Sci. 2023, 40, 1549–1557. [Google Scholar] [CrossRef]
  12. Qian, Z.; Cai, Y.; Liu, J.; Liu, C.; Li, D.; Song, M. Some advances in dust storm research over China-Mongolia areas. Chin. J. Geophys. 2006, 49, 83–92. [Google Scholar] [CrossRef]
  13. Kurosaki, Y.; Shinoda, M.; Mikami, M.; Nandintsetseg, B. Effects of Soil and Land Surface Conditions in Summer on Dust Outbreaks in the Following Spring in a Mongolian Grassland. Sola 2011, 7, 69–72. [Google Scholar] [CrossRef]
  14. Bao, C.; Yong, M.; Bi, L.; Gao, H.; Li, J.; Bao, Y.; Gomboludev, P. Impacts of Underlying Surface on the Dusty Weather in Central Inner Mongolian Steppe, China. Earth Space Sci. 2021, 8, e2021EA001672. [Google Scholar] [CrossRef]
  15. Yong, M.; Shinoda, M.; Nandintsetseg, B.; Bi, L.; Gao, H.; Wang, Y. Impacts of Land Surface Conditions and Land Use on Dust Events in the Inner Mongolian Grasslands, China. Front. Ecol. Evol. 2021, 9, 664900. [Google Scholar] [CrossRef]
  16. Liu, J.; Qian, Z.; Jiang, X.; Zheng, M. A Study on Weather Types of Super Severe Dust Storms in North China. Plateau Meteorol. 2004, 23, 540–547. (In Chinese) [Google Scholar] [CrossRef]
  17. Yun, J.; Jiang, X.; Meng, X.; Wu, X.; Ying, C. Comparative analyses on some statistic characteristics between cold front and Mongolian cyclone duststorm processes. Plateau Meteorol. 2012, 32, 423–434. [Google Scholar] [CrossRef]
  18. Gao, J.; Ding, T.; Gao, H. Dominant circulation pattern and moving path of the Mongolian cyclone for the severe sand and dust storm in China. Atmos. Res. 2024, 301, 107272. [Google Scholar] [CrossRef]
  19. Takemi, T.; Seino, N. Dust storms and cyclone tracks over the arid regions in east Asia in spring. J. Geophys. Res. Atmos. 2005, 110, D18S11. [Google Scholar] [CrossRef]
  20. He, Z. The synoptic causation analysis of a sandstorm over Henan Province at the end of march 2006. Meteorol. Mon. 2012, 38, 932–942. [Google Scholar] [CrossRef]
  21. Zhang, Y.; Wang, J. A dataset of spring sandstorm distribution on the Mongolian Plateau (2000–2021). China Sci. Data 2023, 8, 123–133. [Google Scholar] [CrossRef]
  22. Jebali, A.; Zare, M.; Ekhtesasi, M.R.; Jafari, R. A new threshold free dust storm detection index based on MODIS reflectance and thermal bands. GIScience Remote Sens. 2021, 58, 1369–1394. [Google Scholar] [CrossRef]
  23. Levy, R.; Hsu, C. MODIS Atmosphere L2 Aerosol Product; NASA MODIS Adaptive Processing System, Goddard Space Flight Center: Greenbelt, MD, USA, 2015. [Google Scholar]
  24. Kaufman, Y.J.; Tanré, D.; Remer, L.A.; Vermote, E.F.; Chu, A.; Holben, B.N. Operational remote sensing of tropospheric aerosol over land from EOS moderate resolution imaging spectroradiometer. J. Geophys. Res. Atmos. 1997, 102, 17051–17067. [Google Scholar] [CrossRef]
  25. Hsu, N.C.; Si-Chee, T.; King, M.D.; Herman, J.R. Aerosol properties over bright-reflecting source regions. IEEE Trans. Geosci. Remote Sens. 2004, 42, 557–569. [Google Scholar] [CrossRef]
  26. Levy, R.C.; Mattoo, S.; Munchak, L.A.; Remer, L.A.; Sayer, A.M.; Patadia, F.; Hsu, N.C. The Collection 6 MODIS aerosol products over land and ocean. Atmos. Meas. Tech. 2013, 6, 2989–3034. [Google Scholar] [CrossRef]
  27. Ginoux, P.; Prospero, J.M.; Gill, T.E.; Hsu, N.C.; Zhao, M. Global-scale attribution of anthropogenic and natural dust sources and their emission rates based on MODIS Deep Blue aerosol products. Rev. Geophys. 2012, 50, RG3005. [Google Scholar] [CrossRef]
  28. Bessho, K.; Date, K.; Hayashi, M.; Ikeda, A.; Imai, T.; Inoue, H.; Kumagai, Y.; Miyakawa, T.; Murata, H.; Ohno, T.; et al. An Introduction to Himawari-8/9— Japan’s New-Generation Geostationary Meteorological Satellites. J. Meteorol. Soc. Jpn. Ser. II 2016, 94, 151–183. [Google Scholar] [CrossRef]
  29. Akihiro, S. Outline of RGB Composite Imagery; Meteorological Satellite Center (MSC): Tokyo, Japan, 2015. [Google Scholar]
  30. Hersbach, H.; Bell, B.; Berrisford, P.; Hirahara, S.; Horányi, A.; Muñoz-Sabater, J.; Nicolas, J.; Peubey, C.; Radu, R.; Schepers, D.; et al. The ERA5 global reanalysis. Q. J. R. Meteorol. Soc. 2020, 146, 1999–2049. [Google Scholar] [CrossRef]
  31. Berry, G.; Reeder, M.J.; Jakob, C. A global climatology of atmospheric fronts. Geophys. Res. Lett. 2011, 38, 1–5. [Google Scholar] [CrossRef]
  32. Hewson, T.D. Objective fronts. Meteorol. Appl. 1998, 5, 37–65. [Google Scholar] [CrossRef]
  33. Hodges, K.I. A General Method for Tracking Analysis and Its Application to Meteorological Data. Mon. Weather. Rev. 1994, 122, 2573–2586. [Google Scholar] [CrossRef]
  34. Zhang, G.; Zhao, S.; Sun, J. Analysis of Climatological Characteristics of Severe Dust Storms in Recent Years in the Northern China. Clim. Environ. Res. 2004, 9, 101–115. [Google Scholar] [CrossRef]
  35. Kimura, R. Validation and application of the monitoring method for degraded land-area-based on a dust erodibility in eastern Asia. Int. J. Remote Sens. 2017, 38, 4553–4564. [Google Scholar] [CrossRef]
  36. Xu, J.; Xiao, Y.; Xie, G.; Wang, Y.; Zhen, L.; Zhang, C.; Jiang, Y. Interregional ecosystem services benefits transfer from wind erosion control measures in Inner Mongolia. Environ. Dev. 2020, 34, 100496. [Google Scholar] [CrossRef]
  37. Shen, J.; Wang, X. Analyses of the weather and climate for Mongolian cyclones. Meteorol. Mon. 1991, 17, 23–27. [Google Scholar]
  38. Chen, S.; Kuo, Y.; Zhang, P.; Bai, Q. Synoptic Climatology of Cyclogenesis over East Asia, 1958–1987. Mon. Weather. Rev. 1991, 119, 1407–1418. [Google Scholar] [CrossRef]
  39. Hoskins, B.J.; McIntyre, M.E.; Robertson, A.W. On the use and significance of isentropic potential vorticity maps. Q. J. R. Meteorol. Soc. 1985, 111, 877–946. [Google Scholar] [CrossRef]
  40. Martin, J.E. Mid-Latitude Atmospheric Dynamics: A First Course; Wiley: Chichester, UK, 2006; pp. 1–324. [Google Scholar]
  41. Takemi, T. Structure and Evolution of a Severe Squall Line over the Arid Region in Northwest China. Mon. Weather. Rev. 1999, 127, 1301–1309. [Google Scholar] [CrossRef]
  42. Xu, C.; Guan, Q.; Lin, J.; Luo, H.; Yang, L.; Tan, Z.; Wang, Q.; Wang, N.; Tian, J. Spatiotemporal variations and driving factors of dust storm events in northern China based on high-temporal-resolution analysis of meteorological data (1960–2007). Environ. Pollut. 2020, 260, 114084. [Google Scholar] [CrossRef]
  43. Lu, K.; Nong, S. Topography and Frontogenesis. Acta Meteorol. Sin. 1995, 53, 513–528. [Google Scholar]
Figure 1. Objective front identification during a cross-border SDS on 1–3 April 2018: (a) 850 hPa wet bulb potential temperature field (shading, K) and horizontal winds (arrows, m/s) and fronts (purple and black lines represent cold and quasi-stationary fronts), (b) movement of cold and quasi-stationary fronts with an interval of 6 h, and (cf) Himawari-8/9 dust monitoring maps with cold and quasi-stationary fronts superimposed. Color interpretation for dust RGB is placed at the bottom.
Remotesensing 16 02164 g001
Figure 2. The MC path and its corresponding cross-border sandstorm process during 13–14 April 2018: (a) MC path (color dots represent cyclone intensity (relative vorticity, 10−5 s−1) and are drawn for every 6 h); (b) 850 hPa geopotential height field (solid blue contours, interval of 40 gpm) and wind field (arrows, ms−1, color shading: strong wind speed, gray shading: topography greater than 3 km); and (cf) Himawari-8/9 dust monitoring maps. Black dots in (cf) represent the center positions of MCs. Color interpretation for dust RGB is placed at the bottom.
Remotesensing 16 02164 g002
Figure 3. (a) Number of cross-border spring SDSs between Mongolia and Northern China and (b) number of spring SDSs in Northern China.
Remotesensing 16 02164 g003
Figure 4. Different types of weather systems that drive cross-border SDSs and their occurrence values.
Remotesensing 16 02164 g004
Figure 5. Movement paths of MCs of the (a) MC-dominant type and (b) MC-CH type. Dots in blue indicate the cyclones’ genesis positions, and dots in other colors indicate the positions and strengths of the MCs at the peak. The MC strength is measured by the relative vorticity ( 10 5 s 1 ).
Remotesensing 16 02164 g005
Figure 6. Himawari-8/9 monitoring images of a cross-border SDS driven by the MC-dominant type during 26–28 March 2018. Black dots represent the center positions of MCs. Color interpretation for dust RGB is the same as in Figure 1.
Remotesensing 16 02164 g006
Figure 7. Lower tropospheric circulation fields during a cross-border SDS process driven by an MC-dominant weather system during 26–28 March 2018: (ad) SLP (blue contours with an interval of 5 hPa) and 10 m horizontal winds (arrows, m s 1 ; shading marks strong winds) and (eh) 850 hPa geopotential height (blue contours with an interval of 5 gpm) and horizontal winds (arrows, ms−1; shading marks 850 hPa strong winds). Gray shading (ah) represents topography greater than 3000 m. Black dots in (eh) represent the center positions of MCs.
Remotesensing 16 02164 g007
Figure 8. As in Figure 6, but for the SDS driven by the MC-CH type during 13–17 March 2021. Black dots indicate the center positions of MCs and purple (black) lines represent cold (quasi-stationary) fronts. Color interpretation for dust RGB is the same as in Figure 1.
Remotesensing 16 02164 g008
Figure 9. As in Figure 7, but for the SDS driven by the MC-CH type during 13–17 March 2021. In (eh), black dots indicate the center positions of MCs and purple (black) lines represent cold (quasi-stationary) fronts.
Remotesensing 16 02164 g009
Figure 10. As in Figure 6, but for the SDS driven by the cold front type on 29 April 2019. Purple (black) lines represent cold (quasi-stationary) fronts. Color interpretation for dust RGB is the same as in Figure 1.
Remotesensing 16 02164 g010
Figure 11. As in Figure 7, but for the SDS driven by the cold front type on 29 April 2019. The purple (black) lines in (eh) represent cold (quasi-stationary) fronts at 850 hPa.
Remotesensing 16 02164 g011
Table 1. SDSs in Northern China and Mongolia from 2000 to 2023. Dates in bold type indicate cross-border SDSs. Dates in regular type correspond to the 125 SDSs identified based on the “Summary table of sand and dust storm weather processes in northern China from 2000 to 2023”, while dates in italic type indicate the 13 additional SDSs supplemented from “A dataset of spring sand and dust storm distribution on the Mongolian Plateau”. See text for details.
YearSDSsDate
20001016–20 March, 21–23 March, 26–27 March, 05–08 April, 07–09 April, 12–14 April, 18–21 April, 23–26 April, 27–29 April, 10–11 May
20011304–06 March, 18–19 March, 21–22 March, 23–25 March, 02–05 April, 05–08 April, 07–10 April, 11–13 April, 22–23 April, 27 April, 28–30 April, 01–02 May, 03–04 May
20021115–17 March, 18–22 March, 24–25 March, 28–30 March, 30–31 March, 01–03 April, 05–09 April, 11 April, 13–17 April, 19–20 April, 21–24 April
2003208–11 April, 15–17 April
2004609–11 March, 26–28 March, 29–30 March, 22–25 April, 07–08 May, 18–19 May
2005327–28 April, 29 April–01 May, 09–10 May
20061109–12 March, 26–28 March, 05–07 April, 08–09 April, 09–11 April, 16–18 April, 21–23 April, 06 May, 10–11 May, 15–18 May, 29–30 May
2007927–28 March, 30–31 March, 31 March–03 April, 13–15 April, 19–20 April, 21–23 April, 08–11 May, 19–21 May, 22–24 May
2008914–15 March, 29–31 March, 17–21 April, 30 April–03 May, 06–08 May, 19–20 May, 26–28 May, 28–29 May, 17 March
2009509–12 March, 14–15 March, 16–19 April, 23–25 April, 28–30 April
20101101–03 March, 11–12 March, 19–22 March, 21–23 March, 28–29 March, 31 March–01 April, 07–08 April, 09 April, 19–20 April, 24–28 April, 05–08 May
2011512–14 March, 17–19 March, 04–05 April, 28–30 April, 10–12 May
2012620–22 March, 29–30 March, 01–02 April, 10–11 April, 18–19 April, 26–27 April
2013308–11 March, 17–18 April, 12–14 May
2014516–18 March, 23–24 April, 26–27 April, 08–09 May, 22–25 May
2015327 March, 31 March–01 April, 27–29 April
2016303–04 March, 30 April–01 May, 10–12 May
2017103–07 May
2018426–30 March, 01–03 April, 04–06 April, 12–15 April
2019619–24 March, 19–21 April, 26–28 April, 28–30 April, 11–12 May, 14–16 May
2020208–10 March, 10–11 April
2021413–18 March, 27 March–01 April, 14–16 April, 06–08 May
2022113–16 March
2023519–24 March, 09–13 April, 18–21 April, 27–29 April, 19–22 May
Disclaimer/Publisher’s Note: The statements, opinions and data contained in all publications are solely those of the individual author(s) and contributor(s) and not of MDPI and/or the editor(s). MDPI and/or the editor(s) disclaim responsibility for any injury to people or property resulting from any ideas, methods, instructions or products referred to in the content.

