
Contribution from the Western Pacific Subtropical High Index to a Deep Learning Typhoon Rainfall Forecast Model


Abstract
1. Introduction
2. Data Sources and Processing
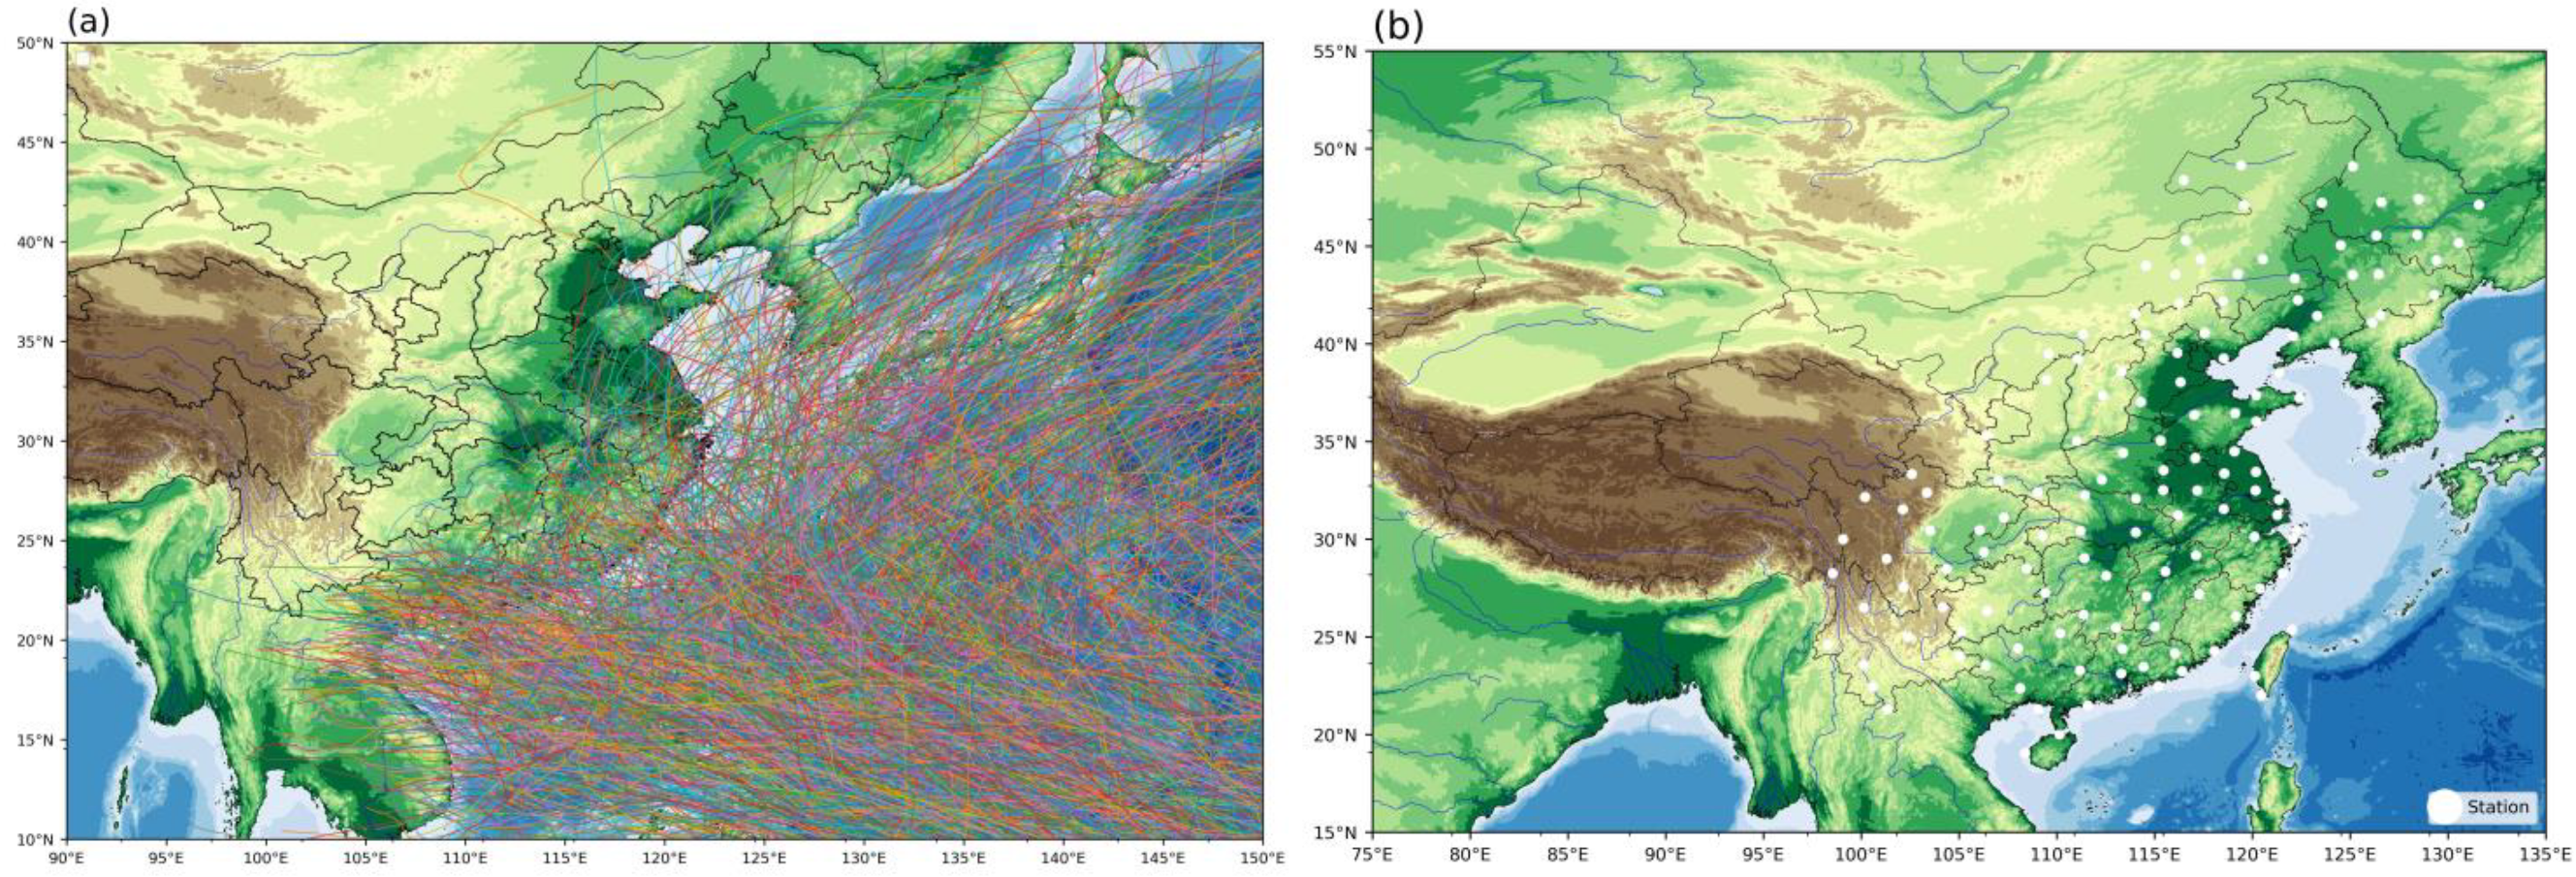
- The CMA tropical cyclone best track dataset provided by the CMA Tropical Cyclone Data Center is used. The dataset provides the latitude (Lat) and longitude (Long) positions of the centers of the studied typhoons at three or six hourly intervals, the minimum pressure at the center of the typhoon (cap), and the maximum wind speed near the center of the typhoon (mws).
- Typhoon-related rainfall data (PREC) are used. The CMA Tropical Cyclone Data Center has compiled the typhoon daily precipitation dataset, which only includes rain recorded in the 133 stations when there was a typhoon impact. This dataset forms the basis of observations for model training and validation in our study.
- The stations’ longitude (Long_sta), latitude (Lat_sta), and altitude (Alt) based on the data provided by the CMA Tropical Cyclone Data Center are used.
- Environmental parameters are based on the ERA5 reanalysis dataset from 1960 to 2023 provided by the ECMWF. The parameters include the 500 hPa geopotential (Z) and zonal winds (u). From ERA5, the area index, intensity index, ridgeline index, and westernmost point of the subtropical high were also calculated. The domain of consideration was north of 10°N and 90°E to 180°.
3. Methods
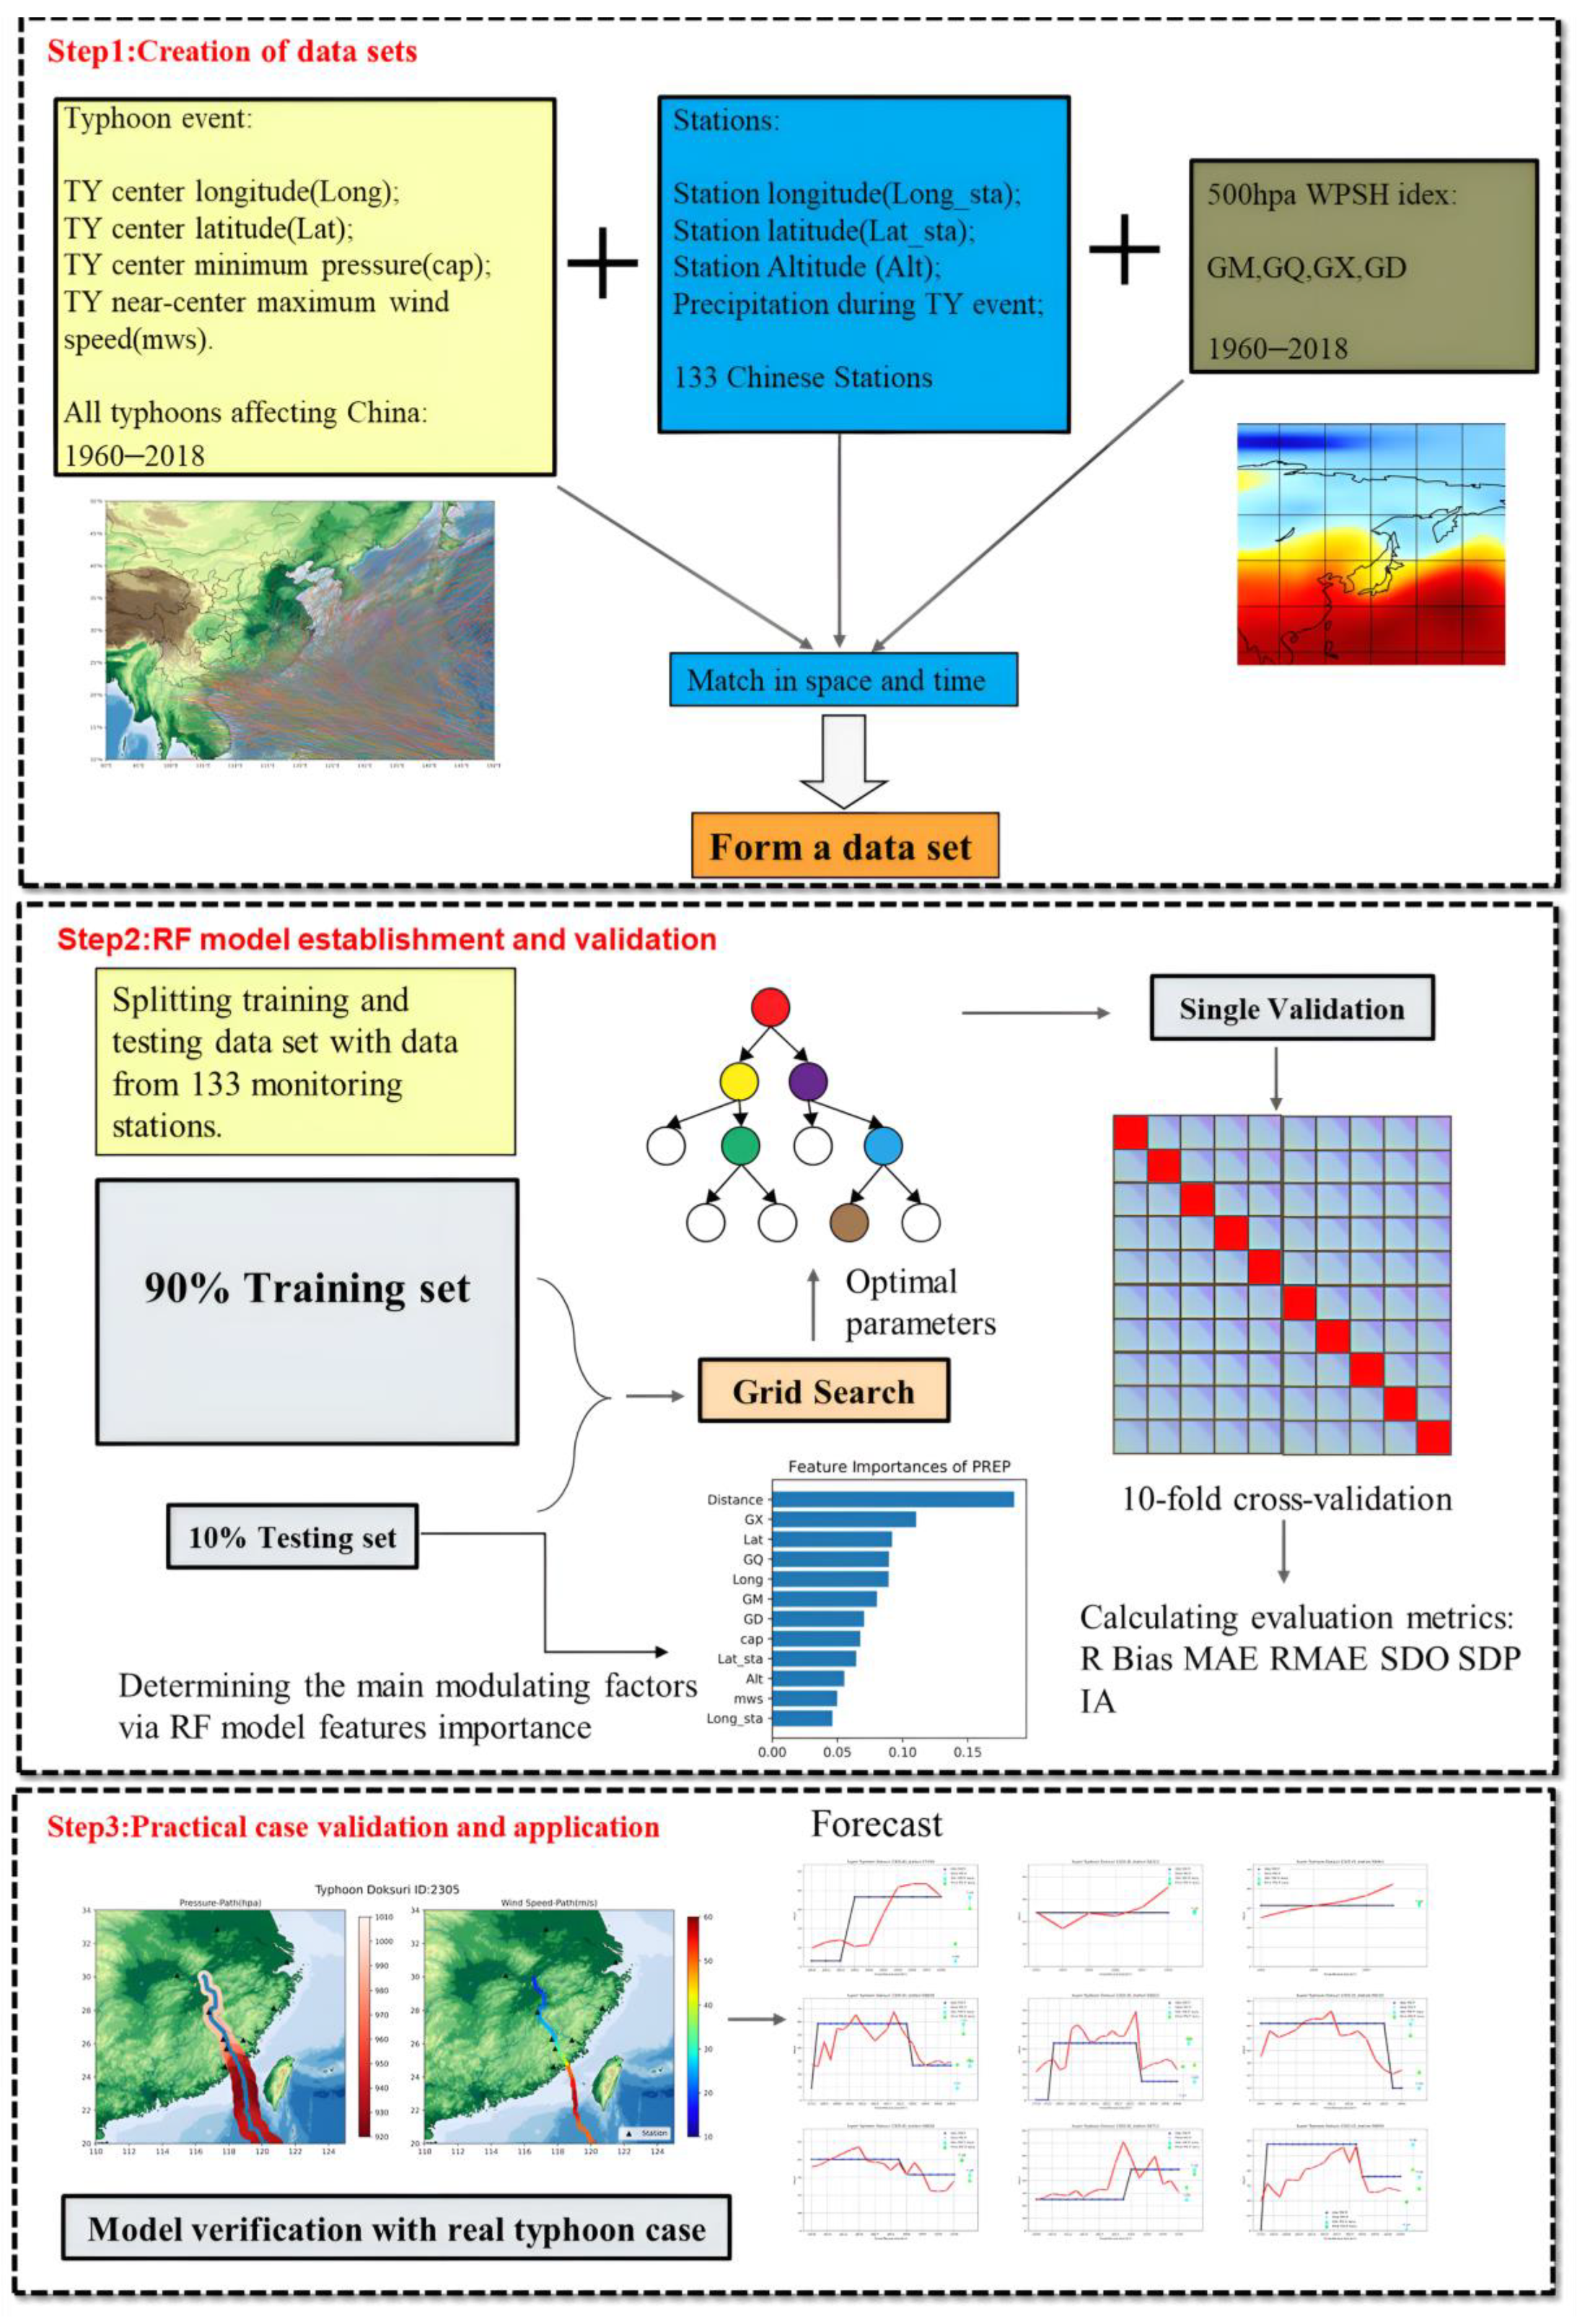
3.1. Model Development and Forecasting Steps
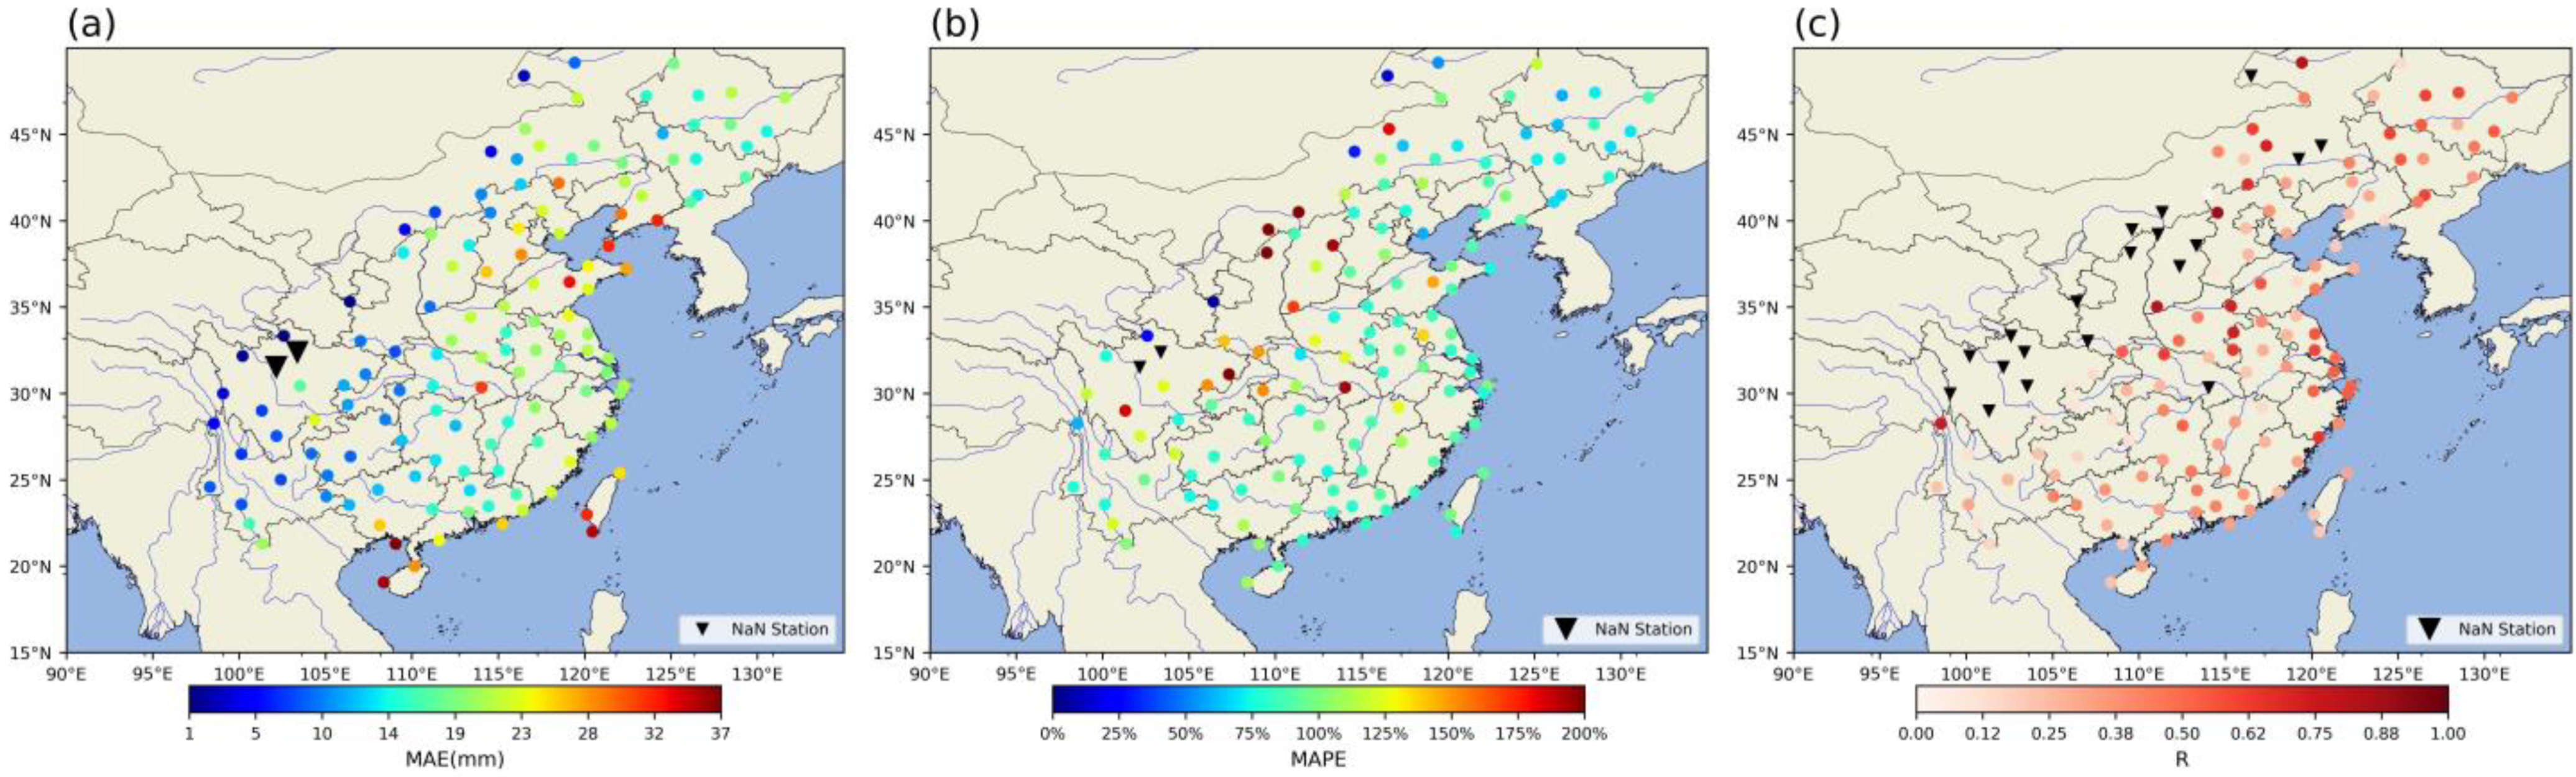
3.2. Model Evaluation
4. Result
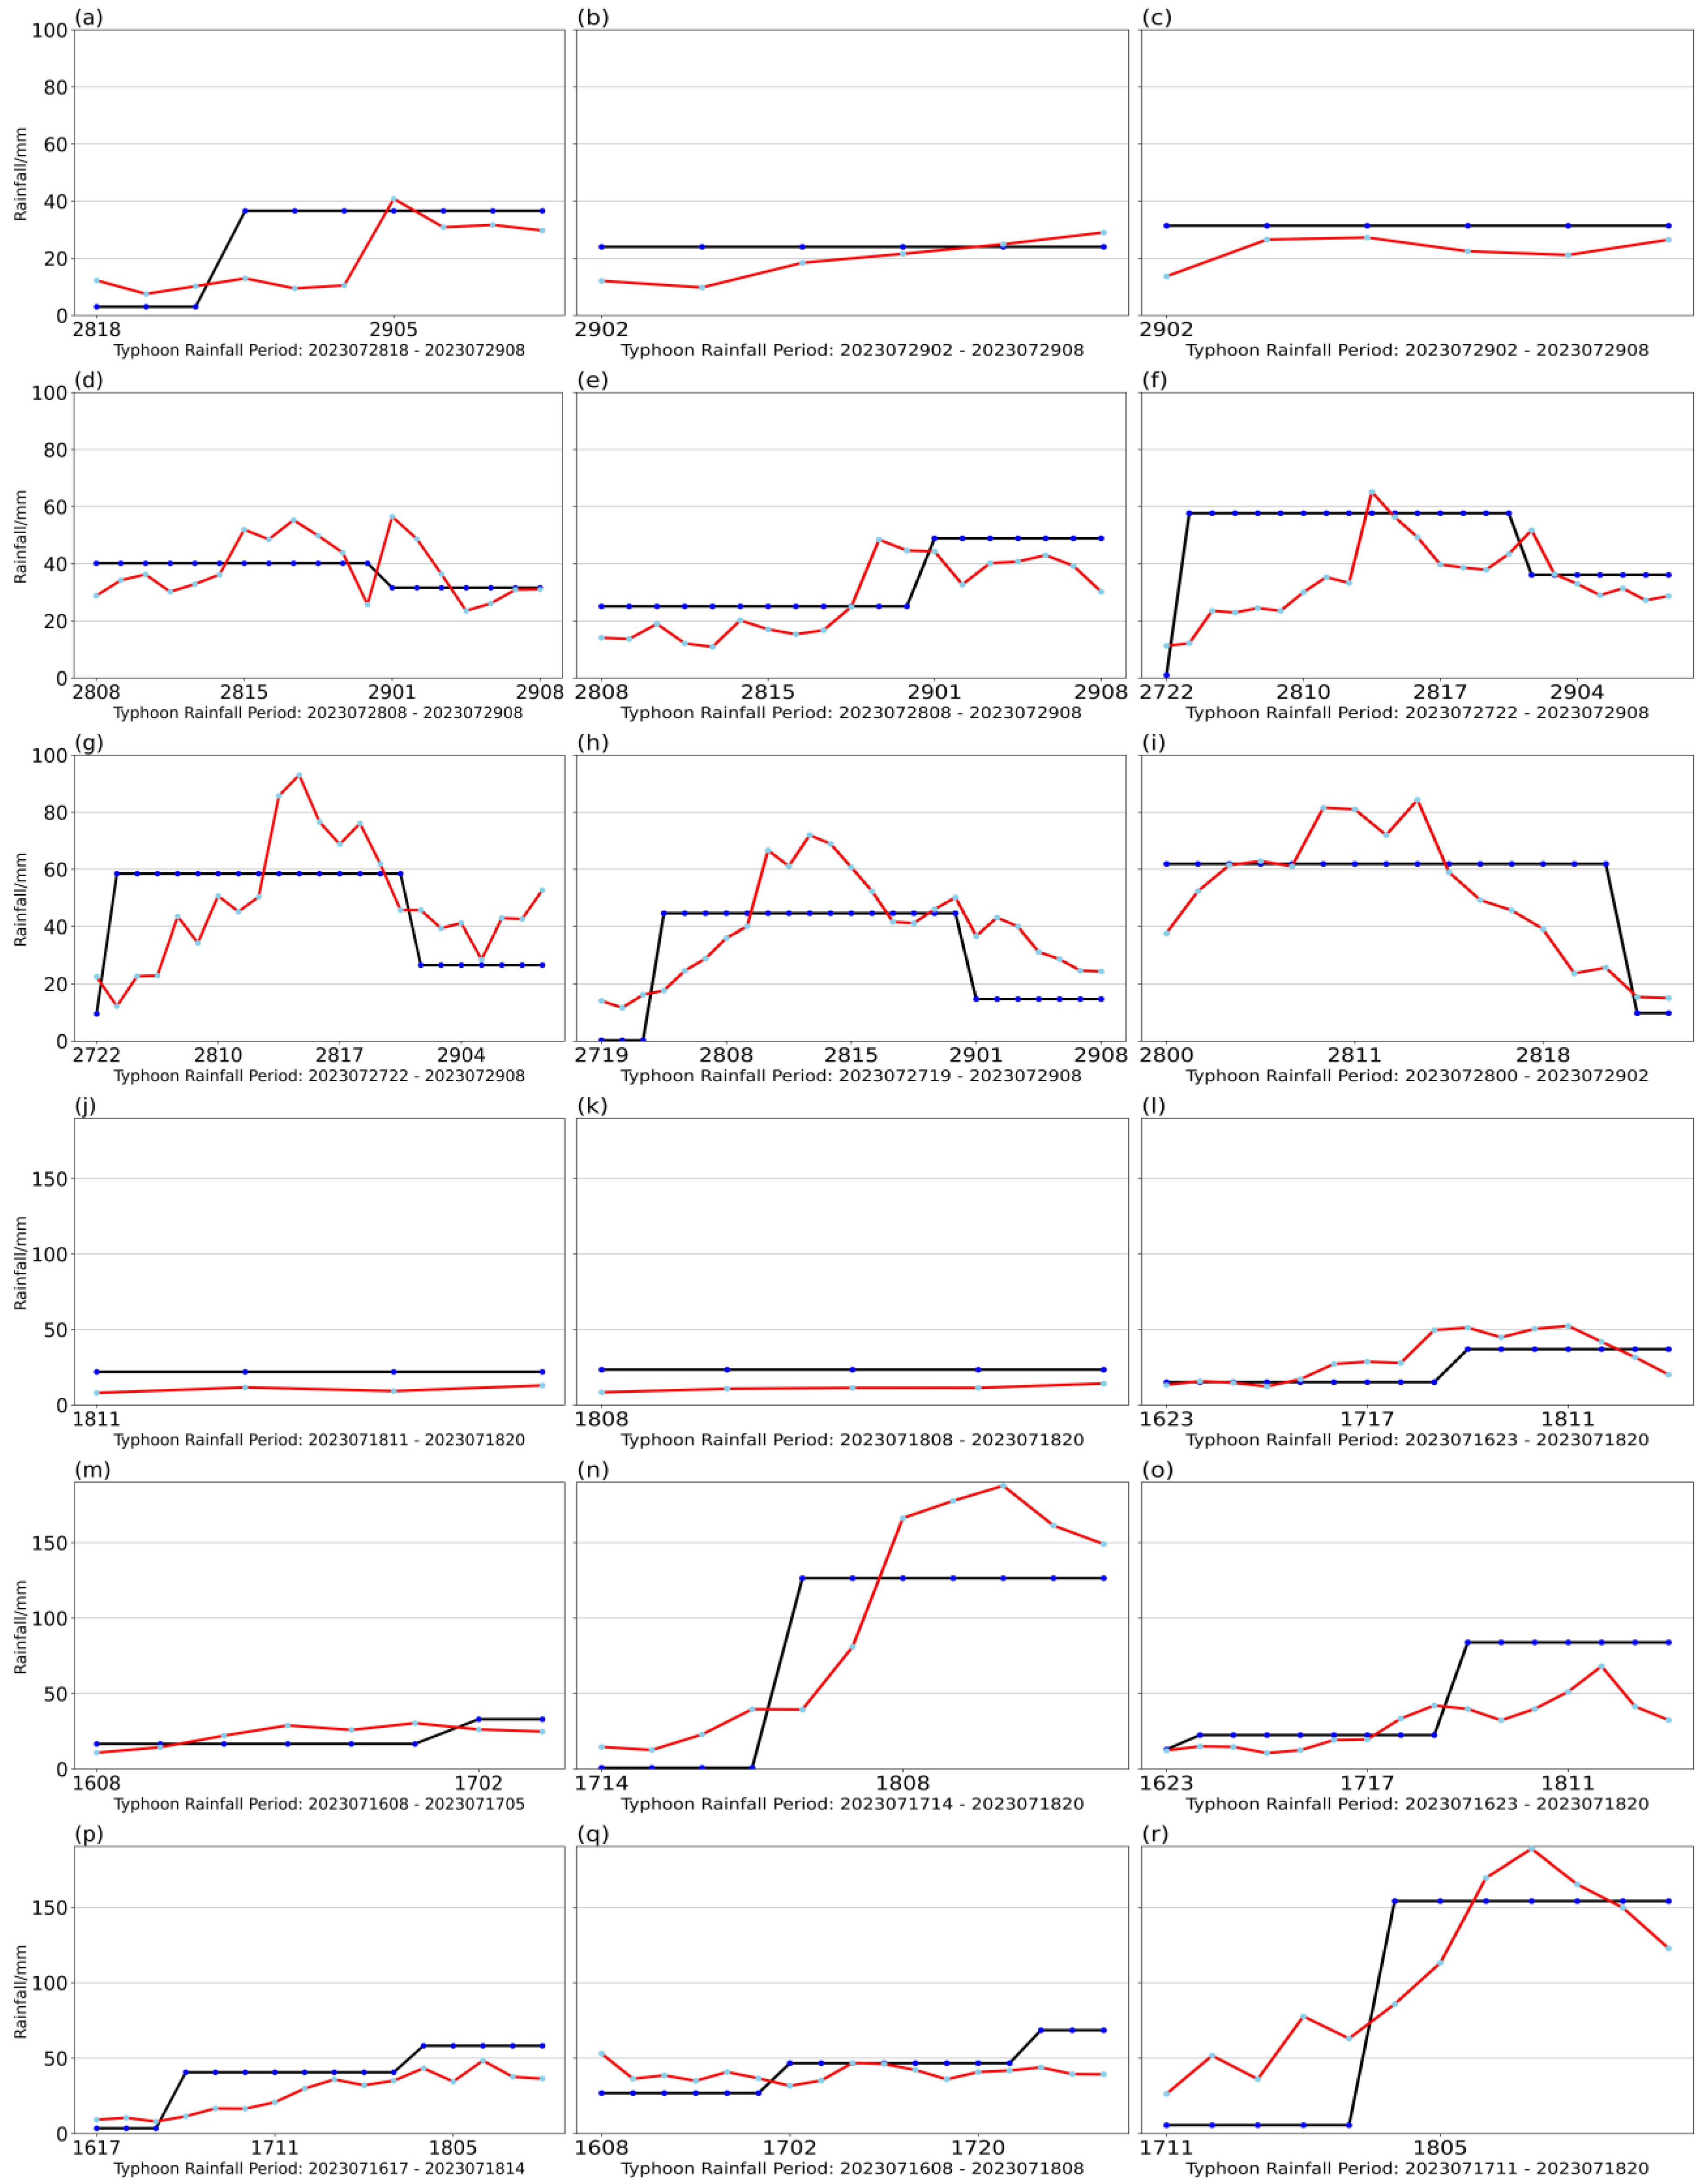
4.1. Cases Study
4.2. Contribution of the Subtropical High
5. Discussion
6. Conclusions
Author Contributions
Funding
Data Availability Statement
Acknowledgments
Conflicts of Interest
Appendix A
Appendix A.1. Matching of Datasets
Appendix A.2. Reliability of the Reconstructed WPSHI Dataset
Appendix A.3. Determination of Hyperparameters of RF Model
Appendix B


| Metric | Definition |
|---|---|
| MAE | |
| RMSE | |
| Bias | |
| R | |
| SDO | |
| SDP | |
| IA |
| MAE (mm) | RMSE (mm) | Bias (mm) | R (Testing Set) * | R (Training Set) | Sdo (mm) | SDo (mm) | IA * | |
|---|---|---|---|---|---|---|---|---|
| Fold_1 | 14.1 | 23.83 | 1.25 | 0.73 | 0.98 | 34.12 | 20.63 | 0.84 |
| Fold_2 | 14.63 | 24.89 | 0.89 | 0.71 | 0.98 | 34.93 | 20.63 | 0.85 |
| Fold_3 | 14.49 | 24.86 | 1.16 | 0.72 | 0.98 | 35.32 | 21.5 | 0.84 |
| Fold_4 | 14.29 | 24.53 | 1.59 | 0.71 | 0.98 | 34.42 | 20.6 | 0.84 |
| Fold_5 | 14.35 | 24.73 | 1.15 | 0.72 | 0.98 | 34.85 | 20.37 | 0.85 |
| Fold_6 | 14.37 | 24.63 | 1.36 | 0.7 | 0.98 | 33.95 | 20.07 | 0.85 |
| Fold_7 | 14.49 | 25.96 | 0.61 | 0.72 | 0.98 | 36.7 | 21.52 | 0.85 |
| Fold_8 | 14.4 | 25.11 | 1.33 | 0.70 | 0.98 | 34.62 | 20.38 | 0.85 |
| Fold_9 | 14.43 | 24.66 | 1.21 | 0.70 | 0.98 | 34.15 | 20.36 | 0.8 |
| Fold_10 | 14.34 | 24.82 | 1.27 | 0.71 | 0.98 | 34.8 | 20.87 | 0.84 |
| Mean | 14.39 | 24.8 | 1.18 | 0.71 | 0.98 | 34.79 | 20.69 | 0.85 |
References
- Hu, C.; Tam, C.Y.; Loi, C.L.; Cheung, K.K.W.; Li, Y.; Yang, Z.L.; Au-Yeung, Y.M.; Fang, X.; Niyogi, D. Urbanization Impacts on Tropical Cyclone Rainfall Extremes-Inferences from Observations and Convection-Permitting Model Experiments Over South China. JGR Atmos. 2023, 128, e2023JD038813. [Google Scholar] [CrossRef]
- Yang, K.; Cai, W.; Huang, G.; Hu, K.; Ng, B.; Wang, G. Increased variability of the western Pacific subtropical high under greenhouse warming. Proc. Natl. Acad. Sci. USA 2022, 119, e2120335119. [Google Scholar] [CrossRef] [PubMed]
- Liu, D.; Xiang, C.; Zhang, L.; Xu, Y.; Luo, Q. Analysis on main characteristics of Typhoon Doksuri (2305) and difficulties in its track and intensity forecast. J. Mar. Meteorol. 2023, 43, 1–10. [Google Scholar] [CrossRef]
- Mei, W.; Xie, X.P. Intensification of landfalling typhoons over the northwest Pacific since the late 1970s. Nat. Geosci. 2016, 9, 753–757. [Google Scholar] [CrossRef]
- Allawi, M.F.; Abdulhameed, U.H.; Adham, A.; Sayl, K.N.; Sulaiman, S.O.; Ramal, M.M.; Sherif, M.; El-Shafie, A. Monthly rainfall forecasting modelling based on advanced machine learning methods. Eng. Appl. Comp. Fluid Mech. 2023, 17, 2243090. [Google Scholar] [CrossRef]
- Schauwecker, S.; Schwarb, M.; Rohrer, M.; Stoffel, M. Heavy precipitation forecasts over Switzerland—An evaluation of bias-corrected ECMWF predictions. Weather Clim. Extrem. 2021, 34, 100372. [Google Scholar] [CrossRef]
- Li, Q.; Liu, B.; Wang, Q.; Wang, Y.; Li, G.; Li, T.; Lan, H.; Feng, S.; Liu, C. Operational Forecast of Rainfall Induced by Landfalling Tropical Cyclones Along Guangdong Coast. J. Trop. Meteorol. 2020, 26, 1–13. [Google Scholar] [CrossRef]
- Ren, J.; Xu, N.; Cui, Y. Typhoon Track Prediction Based on Deep Learning. Appl. Sci. 2022, 12, 8028. [Google Scholar] [CrossRef]
- Lin, Y.H.; Wu, C.C. Remote Rainfall of Typhoon Khanun (2017): Monsoon Mode and Topographic Mode. Mon. Weather Rev. 2021, 149, 733–752. [Google Scholar] [CrossRef]
- Ren, X.; Shao, A.; Liu, W.; Li, L. Improvements on short-term precipitation forecast in Northwest China based on regionally optimized moisture adjustment scheme for convective-scale NWP. Atmos. Res. 2022, 273, 106167. [Google Scholar] [CrossRef]
- Yang, X.; Zhang, F.; Sun, P.; Li, X.; Du, Z.; Liu, R. A Spatial Mapping Model for Tropical Cyclone Precipitation Estimation. Appl. Soft Comput. 2022, 124, 109003. [Google Scholar] [CrossRef]
- Wong, C. How AI is improving climate forecasts. Nature 2024, 628, 710–712. [Google Scholar] [CrossRef] [PubMed]
- Zhang, M.; Yang, Y.; Zhan, C.; Zong, L.; Gul, C.; Wang, M. Tropical cyclone-related heatwave episodes in the Greater Bay Area, China: Synoptic patterns and urban-rural disparities. Weather. Clim. Extremes. 2024, 44, 100656. [Google Scholar] [CrossRef]
- Watson-Parris, D.; Rao, Y.; Olivié, D.; Seland, Ø.; Nowack, P.; Camps-Valls, G.; Stier, P.; Bouabid, S.; Dewey, M.; Fons, E.; et al. ClimateBench v1.0: A Benchmark for Data-Driven Climate Projections. J. Adv. Model. Earth SY 2022, 14, e2021MS002954. [Google Scholar] [CrossRef]
- Oh, S.G.; Park, C.; Son, S.W.; Ko, J.; Shin, K.; Kim, S.; Park, J. Evaluation of Deep-Learning-Based Very Short-Term Rainfall Forecasts in South Korea. Source. Asia-Pac. J. Atmos. Sci. 2023, 59, 239–255. [Google Scholar] [CrossRef]
- Tong, X.; Zhou, W.; Xia, J. Improving Boreal Summer Precipitation Predictions from the Global NMME Through Res34-Unet. Geophys. Res. Lett. 2024, 51, e2023GL106391. [Google Scholar] [CrossRef]
- Bochenek, B.; Ustrnul, Z. Machine Learning in Weather Prediction and Climate Analyses–Applications and Perspectives. Atmosphere 2022, 13, 180. [Google Scholar] [CrossRef]
- Uddin, M.J.; Li, Y.; Sattar, M.A.; Nasrin, Z.M.; Lu, C. Effects of Learning Rates and Optimization Algorithms on Forecasting Accuracy of Hourly Typhoon Rainfall: Experiments with Convolutional Neural Network. Earth Space Sci. 2022, 9, e2021EA00216. [Google Scholar] [CrossRef]
- Uddin, M.J.; Li, Y.; Tamim, M.Y.; Miah, M.B.; Ahmed, S.M.S. Extreme Rainfall Indices Prediction with Atmospheric Parameters and Ocean–Atmospheric Teleconnections Using a Random Forest Model. J. Appl. Meteorol. Clim. 2022, 61, 651–667. [Google Scholar] [CrossRef]
- Huang, F.; Chen, J.; Liu, W.; Huang, J.; Hong, H.; Chen, W. Regional rainfall-induced landslide hazard warning based on landslide susceptibility mapping and a critical rainfall threshold. Geomorphology 2022, 408, 108236. [Google Scholar] [CrossRef]
- Chen, Y.; Yang, Y.; Gao, M. Typhoon-associated air quality over the Guangdong–Hong Kong–Macao Greater Bay Area, China: Machine-learning-based prediction and assessment. Atmos. Meas. Tech. 2023, 16, 1279–1294. [Google Scholar] [CrossRef]
- Sarker, I.H. Machine Learning: Algorithms, Real-World Applications and Research Directions. SN Comput. Sci. 2021, 2, 160. [Google Scholar] [CrossRef] [PubMed]
- Yu, P.S.; Yang, T.C.; Chen, S.Y.; Kuo, C.M.; Tseng, H.W. Comparison of random forests and support vector machine for real-time radar-derived rainfall forecasting. J. Hydrol. 2017, 552, 92–104. [Google Scholar] [CrossRef]
- Huang, M.; Wang, Q.; Jing, R.; Lou, W.; Hong, Y.; Wang, L. Tropical cyclone full track simulation in the western North Pacific based on random forests. J. Wind Eng. Ind. Aerodyn. 2022, 228, 105119. [Google Scholar] [CrossRef]
- Ying, M.; Zhang, W.; Yu, H.; Lu, X.; Feng, J.; Fan, Y.; Zhu, Y.; Chen, D. An overview of the China Meteorological Administration tropical cyclone database. J. Atmos. Ocean. Technol. 2014, 31, 287–301. [Google Scholar] [CrossRef]
- Lu, X.; Yu, H.; Ying, M.; Zhao, B.; Zhang, S.; Lin, L.; Bai, L.; Wan, R. Western North Pacific tropical cyclone database created by the China Meteorological Administration. Adv. Atmos. Sci. 2021, 38, 690–699. [Google Scholar] [CrossRef]
- Song, F.; Leung, L.R.; Lu, J.; Dong, L. Seasonally dependent responses of subtropical highs and tropical rainfall to anthropogenic warming. Nat. Clim. Change 2018, 8, 787–792. [Google Scholar] [CrossRef]
- Choi, W.; Kim, K.Y. Summertime variability of the western North Pacific subtropical high and its synoptic influences on the East Asian weather. Sci. Rep. 2019, 9, 7865. [Google Scholar] [CrossRef] [PubMed]
- Chen, X.; Zhou, T.; Wu, P.; Guo, Z.; Wang, Z. Emergent constraints on future projections of the western North Pacific Subtropical High. Nat. Commun. 2020, 11, 2802. [Google Scholar] [CrossRef]
- Hirata, H.; Kawamura, R. Scale interaction between typhoons and the North Pacific subtropical high and associated remote effects during the Baiu/Meiyu season. JGR Atmos. 2014, 119, 5157–5170. [Google Scholar] [CrossRef]
- Ouyang, S.; Deng, T.; Liu, R.; Chen, J.; He, G.; Leung, J.C.H.; Wang, N.; Liu, S.C. Impact of a subtropical high and a typhoon on a severe ozone pollution episode in the Pearl River Delta, China. Atmos. Chem. Phys. 2022, 22, 10751–10767. [Google Scholar] [CrossRef]
- Rao, C.; Chen, G.; Ran, L. Effects of Typhoon In-Fa (2021) and the western Pacific subtropical high on an extreme heavy rainfall event in central China. JGR Atmos. 2023, 128, e2022JD037924. [Google Scholar] [CrossRef]
- Liu, Y.; Liang, P.; Sun, Y. The Asian Summer Monsoon: Characteristics, Variability, Teleconnections and Projection; Elsevier: Cambridge, MA, USA, 2019; pp. 85–95. [Google Scholar] [CrossRef]
- Bischl, B.; Binder, M.; Lang, M.; Pielok, T.; Richter, J.; Coors, S.; Thomas, J.; Ullmann, T.; Becker, M.; Boulesteix, A.; et al. Hyperparameter optimization: Foundations, algorithms, best practices, and open challenges. WIREs Data Min. Knowl. Discov. 2023, 13, e1484. [Google Scholar] [CrossRef]
- Wang, S.; Li, B.; Li, G.; Li, B.; Li, H.; Jiao, K.; Wang, C. A comprehensive review on the development of data-driven methods for wind power prediction and AGC performance evaluation in wind–thermal bundled power systems. Energy AI 2024, 16, 100336. [Google Scholar] [CrossRef]
- Willmott, C.J. On the validation of models. Phys. Geogr. 1981, 2, 184–194. [Google Scholar] [CrossRef]
- Chen, R.; Zhang, W.; Wang, X. Machine Learning in Tropical Cyclone Forecast Modeling: A Review. Atmosphere 2020, 11, 676. [Google Scholar] [CrossRef]
- Yoshida, N.; Kawamura, R.; Kawano, T.; Mochizuki, T.; Iizuka, S. Remote dynamic and thermodynamic effects of typhoons on Meiyu–Baiu precipitation in Japan assessed with bogus typhoon experiments. Weather Clim. 2023, 41, 100578. [Google Scholar] [CrossRef]
- Zuo, H.; Chen, Y.; Chen, S.; Chen, S.; Li, W.; Zhang, A. The Effect of the Water Tower of Typhoon Mangkhut (2018). Atmosphere 2018, 13, 636. [Google Scholar] [CrossRef]
- Kodama, S.; Satoh, M. Statistical Analysis of Remote Precipitation in Japan Caused by Typhoons in September. J. Meteorol. Soc. Jpn. 2022, 100, 893–911. [Google Scholar] [CrossRef]
- Li, X.; Yang, Y.; Mi, J.; Bi, X.; Zhao, Y.; Huang, Z.; Liu, C.; Zong, L.; Li, W. Leveraging machine learning for quantitative precipitation estimation from Fengyun-4 geostationary observations and ground meteorological measurements. Atmos. Meas. Tech. 2021, 14, 7007–7023. [Google Scholar] [CrossRef]
- Zhao, D.J.; Xu, H.X.; Yu, Y.B.; Chen, L.S. Identification of synoptic patterns for extreme rainfall events associated with landfalling typhoons in China during 1960–2020. Adv. Clim. Chang. Res. 2022, 13, 651–665. [Google Scholar] [CrossRef]
- Yeung, H.Y. “Convective Hot Tower” Signatures and Rapid Intensification of Severe Typhoon Vicente (1208). Trop. Cyclone Res. Rev. 2013, 2, 96–108. [Google Scholar] [CrossRef]
- Liu, L.; Wang, Y. Trends in Landfalling Tropical Cyclone–Induced Precipitation over China. J. Clim. 2020, 33, 2223–2235. [Google Scholar] [CrossRef]
- Su, J.; Ren, G.; Zhang, Y.; Yang, G.; Xue, X.; Lee, R. Changes in extreme rainfall over mainland China induced by landfalling tropical cyclones. Environ. Res. Commun. 2022, 4, 101004. [Google Scholar] [CrossRef]
- Chen, S.; Yang, Y.; Deng, F.; Zhang, Y.; Liu, D.; Liu, C.; Gao, Z. A High-Resolution Monitoring Approach of Canopy Urban Heat Island using Random Forest Model and Multi-platform Observations. Atmos. Meas. Tech. 2022, 15, 735–756. [Google Scholar] [CrossRef]
- Cui, M.; Xiang, C.; Zhang, H.; Xu, Y.; Su, Z. Characteristics of extreme precipitation in Fujian induced by Typhoon Doksuri (2305). J. Mar. Meteorol. 2023, 43, 11–20. [Google Scholar] [CrossRef]
- Xu, H.; Duan, Y.; Li, Y.; Xu, X. Indirect Effects of Binary Typhoons on an Extreme Rainfall Event in Henan Province, China From 19 to 21 July 2021: 1. Ensemble-Based Analysis. J. Geophys. Res.-Atmos. 2022, 127, e2021JD036083. [Google Scholar] [CrossRef]
- Pedregosa, F.; Varoquaux, G.; Gramfort, A.; Michel, V.; Thirion, B.; Grisel, O.; Blondel, M.; Prettenhofer, P.; Weiss, R.; Dubourg, V.; et al. Scikit-learn: Machine learning in Python. J. Mach. Learn. Res. 2011, 12, 2825–2830. [Google Scholar]
- Hersbach, H.; Bell, B.; Berrisford, P.; Hirahara, S.; Horányi, A.; Muñoz-Sabater, J.; Nicolas, J.; Peubey, C.; Radu, R.; Schepers, D.; et al. The ERA5 global reanalysis. Q. J. R. Meteor. Soc. 2020, 146, 730. [Google Scholar] [CrossRef]
- Al Shalabi, L.A.; Shaaban, Z.; Kasasbeh, B. Data Mining: A Preprocessing Engine. J. Comput. Sci. 2006, 2, 735–739. [Google Scholar] [CrossRef]


| MAE (mm) | RMSE (mm) | Bias (mm) | R * | SDo (mm) | SDp (mm) | IA * | |
|---|---|---|---|---|---|---|---|
| Training | 6.85 | 11.27 | 0.53 | 0.97 | 22.05 | 17.25 | 0.97 |
| Test | 18.11 | 29.33 | 1.51 | 0.52 | 21.82 | 13.49 | 0.64 |
| Talim | 19.03 | 25.64 | −2.21 | 0.82 | 42.59 | 43.22 | 0.1 |
| Doksuri | 13.72 | 16.93 | −2.84 | 0.55 | 16.93 | 18.45 | 0.26 |
Disclaimer/Publisher’s Note: The statements, opinions and data contained in all publications are solely those of the individual author(s) and contributor(s) and not of MDPI and/or the editor(s). MDPI and/or the editor(s) disclaim responsibility for any injury to people or property resulting from any ideas, methods, instructions or products referred to in the content. |
© 2024 by the authors. Licensee MDPI, Basel, Switzerland. This article is an open access article distributed under the terms and conditions of the Creative Commons Attribution (CC BY) license (https://creativecommons.org/licenses/by/4.0/).
Share and Cite
Fang, Z.; Cheung, K.K.W.; Yang, Y. Contribution from the Western Pacific Subtropical High Index to a Deep Learning Typhoon Rainfall Forecast Model. Remote Sens. 2024, 16, 2207. https://doi.org/10.3390/rs16122207
Fang Z, Cheung KKW, Yang Y. Contribution from the Western Pacific Subtropical High Index to a Deep Learning Typhoon Rainfall Forecast Model. Remote Sensing. 2024; 16(12):2207. https://doi.org/10.3390/rs16122207
Chicago/Turabian StyleFang, Zhou, Kevin K. W. Cheung, and Yuanjian Yang. 2024. "Contribution from the Western Pacific Subtropical High Index to a Deep Learning Typhoon Rainfall Forecast Model" Remote Sensing 16, no. 12: 2207. https://doi.org/10.3390/rs16122207
APA StyleFang, Z., Cheung, K. K. W., & Yang, Y. (2024). Contribution from the Western Pacific Subtropical High Index to a Deep Learning Typhoon Rainfall Forecast Model. Remote Sensing, 16(12), 2207. https://doi.org/10.3390/rs16122207