Article

Three-Dimensional Rockslide Analysis Using Unmanned Aerial Vehicle and LiDAR: The Castrocucco Case Study, Southern Italy

by
Antonio Minervino Amodio
1,
Giuseppe Corrado
2,
Ilenia Graziamaria Gallo
3,*,
Dario Gioia
1,
Marcello Schiattarella
2,
Valentino Vitale
1 and
Gaetano Robustelli
3
1
Istituto di Scienze del Patrimonio Culturale, Consiglio Nazionale delle Ricerche (ISPC–CNR), Tito Scalo, 85050 Potenza, Italy
2
Dipartimento delle Culture Europee e del Mediterraneo (DiCEM), Basilicata University, 75100 Matera, Italy
3
Department of Biology, Ecology and Earth Sciences (DiBEST), University of Calabria, 87036 Arcavacata di Rende, Italy
*
Author to whom correspondence should be addressed.
Remote Sens. 2024, 16(12), 2235; https://doi.org/10.3390/rs16122235
Submission received: 10 May 2024 / Revised: 14 June 2024 / Accepted: 16 June 2024 / Published: 19 June 2024

Abstract

:
Rockslides are one of the most dangerous hazards in mountainous and hilly areas. In this study, a rockslide that occurred on 30 November 2022 in Castrocucco, a district located in the Italian municipality of Maratea (Potenza province) in the Basilicata region, was investigated by using pre- and post-event high-resolution 3D models. The event caused a great social alarm as some infrastructures were affected. The main road to the tourist hub of Maratea was, in fact, destroyed and made inaccessible. Rock debris also affected a beach club and important boat storage for sea excursions to Maratea. This event was investigated by using multiscale and multisensor close-range remote sensing (LiDAR and SfM) to determine rockslide characteristics. The novelty of this work lies in how these data, although not originally acquired for rockslide analysis, have been integrated and utilized in an emergency at an almost inaccessible site. The event was analyzed both through classical geomorphological analysis and through a quantitative comparison of multi-temporal DEMs (DoD) in order to assess (i) all the morphological features involved, (ii) detached volume (approximately 8000 m3), and (iii) the process of redistributing and reworking the landslide deposit in the depositional area.

1. Introduction

High-relief rocky coasts are important geomorphological features on the Tyrrhenian side of Southern Italy with a wide range of features depending on rock type, tectonics, and climate changes [1,2]. Geological hazard along rocky coasts, constituting 52% of the global shoreline [3], is largely associated with rock and/or regolith failures, which may significantly affect coastal infrastructures, roads, and human activity. Natural hazard on the rocky coast is likely going to worsen with rising global sea-level and coastal population growth [4,5,6,7].
The active cliff recession and the relative mass movement can be a relevant process of slope evolution as a result of the wave and weathering action of severe meteomarine events, but the high relief of fault-related slopes and widespread mesoscale fractures and faults are the main predisposing factors of diffuse rockfall phenomena in the carbonate morphostructures of the Tyrrhenian coast of southern Italy [8,9,10,11]. Basal erosion is a key factor of cliff instability but rainfall, water infiltration and groundwater may act as driving and triggering mechanisms of slope failures in the upper part of the cliff slope [3,12,13].
A further factor of instability is related to the presence of carbonate rock cliffs that also account for chemical weathering through the activity of karst processes. The stability of a rocky coastal slope is significantly influenced by several geological features like rock strength lithology [14], fracture and fault patterns, strata attitude, and the intersections between these discontinuities [15,16]. Further, as cliff retreat proceeds, attention needs to be given to the stress release jointing that results from confining pressure decrease.
These issues are generally addressed in landslide monitoring through various approaches which can be divided according to the disciplines (geotechnics, hydrology, remote sensing, etc.) for which the results are employed, as explicitly stated in [17]. For example, geotechnical observations are conducted with inclinometers, extensometers, dilatometers, and other similar devices. This equipment and techniques have high accuracy (up to submillimeters), yet the expected changes are only relative and at a specific location [18]. Geodetic and photogrammetric techniques for measurement are often utilized, allowing for the interpretation of the displacements and deformations of the area of interest over time [19].
The costly expenses and difficulties associated with LiDAR equipment (e.g., high weight and occlusion areas) forced the scientific community to research alternate methodologies, such as structure from motion (SfM) for the production of topographic models [20]. SfM was developed at the end of the 1970s [21] and is now widely acknowledged [22]. This technique, coupled with multiview stereo (MVS) algorithms, allows for the 3D automatic reconstruction of surfaces without requiring the user’s past knowledge [23]. Using SfM, different outputs can be obtained, including a very dense point cloud (point density depends on camera and flight plane parameters), orthophotos, and DEMs. SfM has recently become an effective tool for obtaining detailed information on the spatial and temporal distribution of different types of geomorphological processes such as gully erosion [24,25,26,27], fluvial dynamics [28], coastal retreat [29,30,31] and mass wasting [32,33].
The use of both UAV photogrammetry and LiDAR is well documented in landslide literature due to their ability to reduce fieldwork efforts and enhance safety conditions in landslide data collection and analysis. These technologies allow to obtain significant results in terms of characterization, mapping, and modelling [34,35,36,37,38], enabling the monitoring of temporal and spatial dynamics in landslide processes (Ref. [39] and references therein). Turning specifically to rock landslides, UAV photogrammetry and LiDAR are particularly useful for detecting source areas, extracting discontinuity and joint families, computing the volumes of involved rock masses, and modeling block trajectories [40,41,42,43,44].
In this work, a landslide event occurred on 30 November 2022 in Castrocucco (in the Maratea municipality, Potenza province) was analyzed through classical geomorphological analysis supported by a quantitative comparison of multi-temporal DEMs.
Our study is focused on the coastal area of the Serra di Castrocucco where the rocky coast is characterized by an indented shoreline featuring narrow headlands and bays. At the southernmost tip, a pocket beach is backed by bedrock cliffs, whereas the top of the fault slope is featured by a medieval fortified village (i.e., “Castello” historical site, Figure 1). The archaeological site is edged by a 25 m high scarp that, on 30 November 2022, experienced a rock failure that mobilized a large volume of calcareous bedrock in the Castrocucco area (Maratea municipality, Potenza province).
The aim of the paper is analyzing the failure conditions, the failure evolution of the run-out mass on the slope and the evaluation of the involved volume. It was analyzed through classical geomorphological analysis supported by a quantitative comparison of multi-temporal DEMs. In this regard, pre- and post-event data were compared through three different datasets: (i) 2013 LiDAR data; (ii) 2018 drone data; and (iii) 2022 drone data.
Pre- and post-event high-resolution 3D models allowed us to carefully assess the sequence of events that helped to identify the largest mobilized volume of bedrock, which subsequently fragmented into several boulders, damaging the main access route to Maratea and impacting the local economy.
Our study is not based on innovative methods for data processing and acquisition, but it aims at exploiting a well-established and widely recognized approach documented in the literature [45,46,47]. Nevertheless, the novelty of this work lies in how these data, not originally acquired for rockslide analysis, have been integrated and utilized in an emergency at an almost inaccessible site. The results of this study may provide useful information for developing more effective strategies for risk mitigation, particularly because a thorough analysis of rock failure and its rapid evolution, as well as the distribution and size of rock fragments, are key factors for future simulations aimed at preventing the undersizing of protective infrastructure.

2. Geological and Geomorphological Setting

The study area is located on the Calabria–Basilicata boundary along the Tyrrhenian side of the southern Apennines fold and thrust belt. Its backbone consists of Mesozoic to Miocene carbonates that are tectonically overlain by ophiolitic nappes [48,49]. Neogene to Quaternary extension in the Tyrrhenian back-arc basin Sea and shortening in the Apennines were driven by the roll back of the west-dipping Apulian–Ionian slab (Ref. [50] and references therein). This enabled the development of a series of Tyrrhenian coastal grabens during the Early Quaternary [51,52,53,54,55] outlining a coastal perimeter similar to the current one. The Middle Pleistocene marked a significant change as the southern Apennines experienced a marked regional-scale uplift inferred from late-Quaternary-raised marine terraces [56,57,58,59,60,61,62]. In this framework, the coastal strip between Maratea, in the north, and Scalea, in the south, consists of an indented coastline featuring narrow headlands and bays, among which is the Castrocucco headland. It is located in the municipality of Maratea (Potenza province) on the border of Calabria region, and is part of the largest Serra di Castrocucco ridge, a rocky backbone consisting of Meso-Cenozoic carbonates [48]. The high-relief rocky coast preserves sequences of stair-like terraces and/or the relative sea level change proxies resulting from the interaction between eustatic sea level fluctuations and the tectonic uplift trend which affected the study area (Ref. [60] and references therein). The features of the slopes of the Castrocucco headland, but more generally the Serra di Castrocucco ones, are similar in shape to many carbonate fault scarps of the Apennines. They are characterized by straight profiles with slope angles ranging between about 25° and 35°, both those cut in bedrock and those partly or entirely formed of the slope breccia accumulated during slope replacement processes of the originally steep cliffs (Ref. [63] and references therein). The lower slopes of the south-western side of Serra di Castrocucco ridge feature an overall composite profile that is suggestive of a polycyclic evolution. It shows a marked concavity that ends around a few meters a.s.l. where active and/or inactive sea-cliff is noticed. Specifically, the Castrocucco headland is characterized by an indented profile with two marked planar concavity in the lower slope (Figure 1b). Here, remnants of a tidal notch at 35–40 m a.s.l., lithophaga holes with an upper limit at +20 m a.s.l. and, to the east, an abrasion platform blanketed by slope breccia are found [64].
The present-day form of the rocky headland is definitely related to factors inherited from past environmental conditions, characterized by different relative sea-level and climate changes [60,64,65], which interact with steep scarp recession through gravity-controlled cliff retreat and slope replacement from below, leading to transient straight rock/debris slopes with a typical rectilinear profile [66,67]. Nowadays, the segmented slope profile of the Castrocucco headland is clearly affected by mass movements that involve both near-vertical rocky cliff and hanging slope breccias. As a matter of fact, at the beginning of the 2000s, a rockfall affected the cliff onto which the “Castello” historical site is located, causing the long-time closure of the Statal Road 18 “Tirrena Inferiore”. Then, the same cliff experienced the huge landslide on 30 November 2022.

The Castrocucco Event

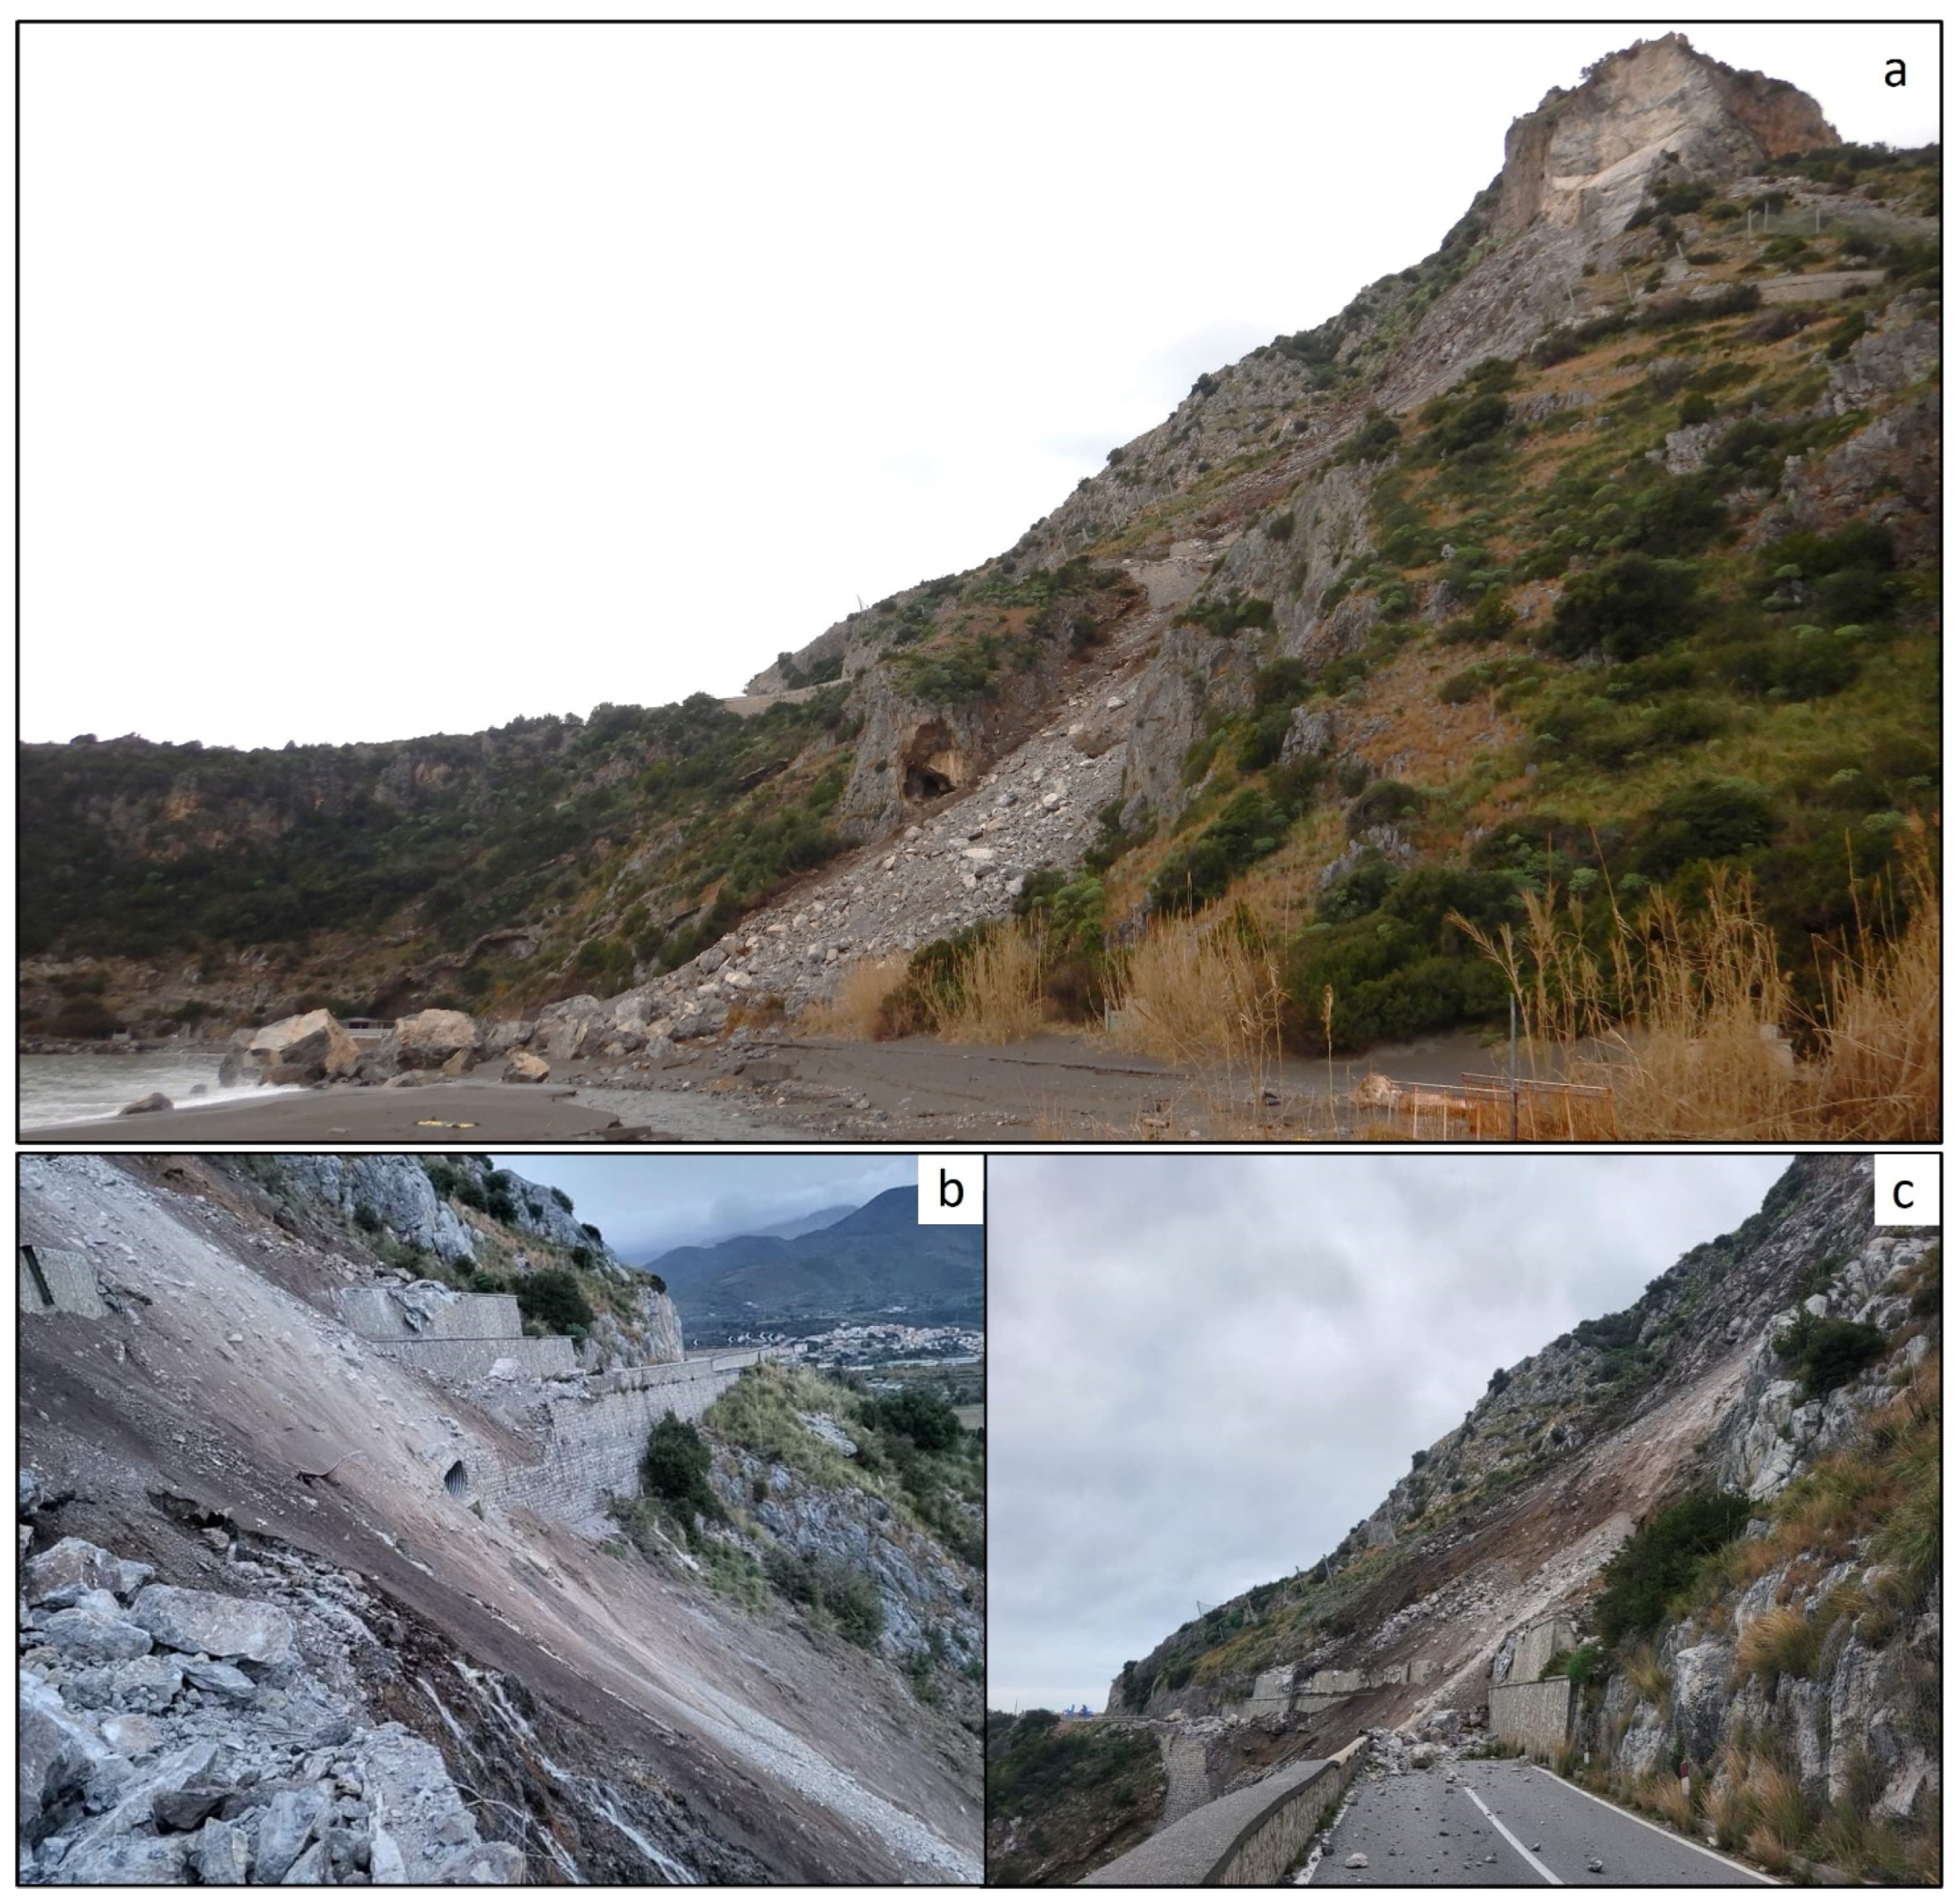
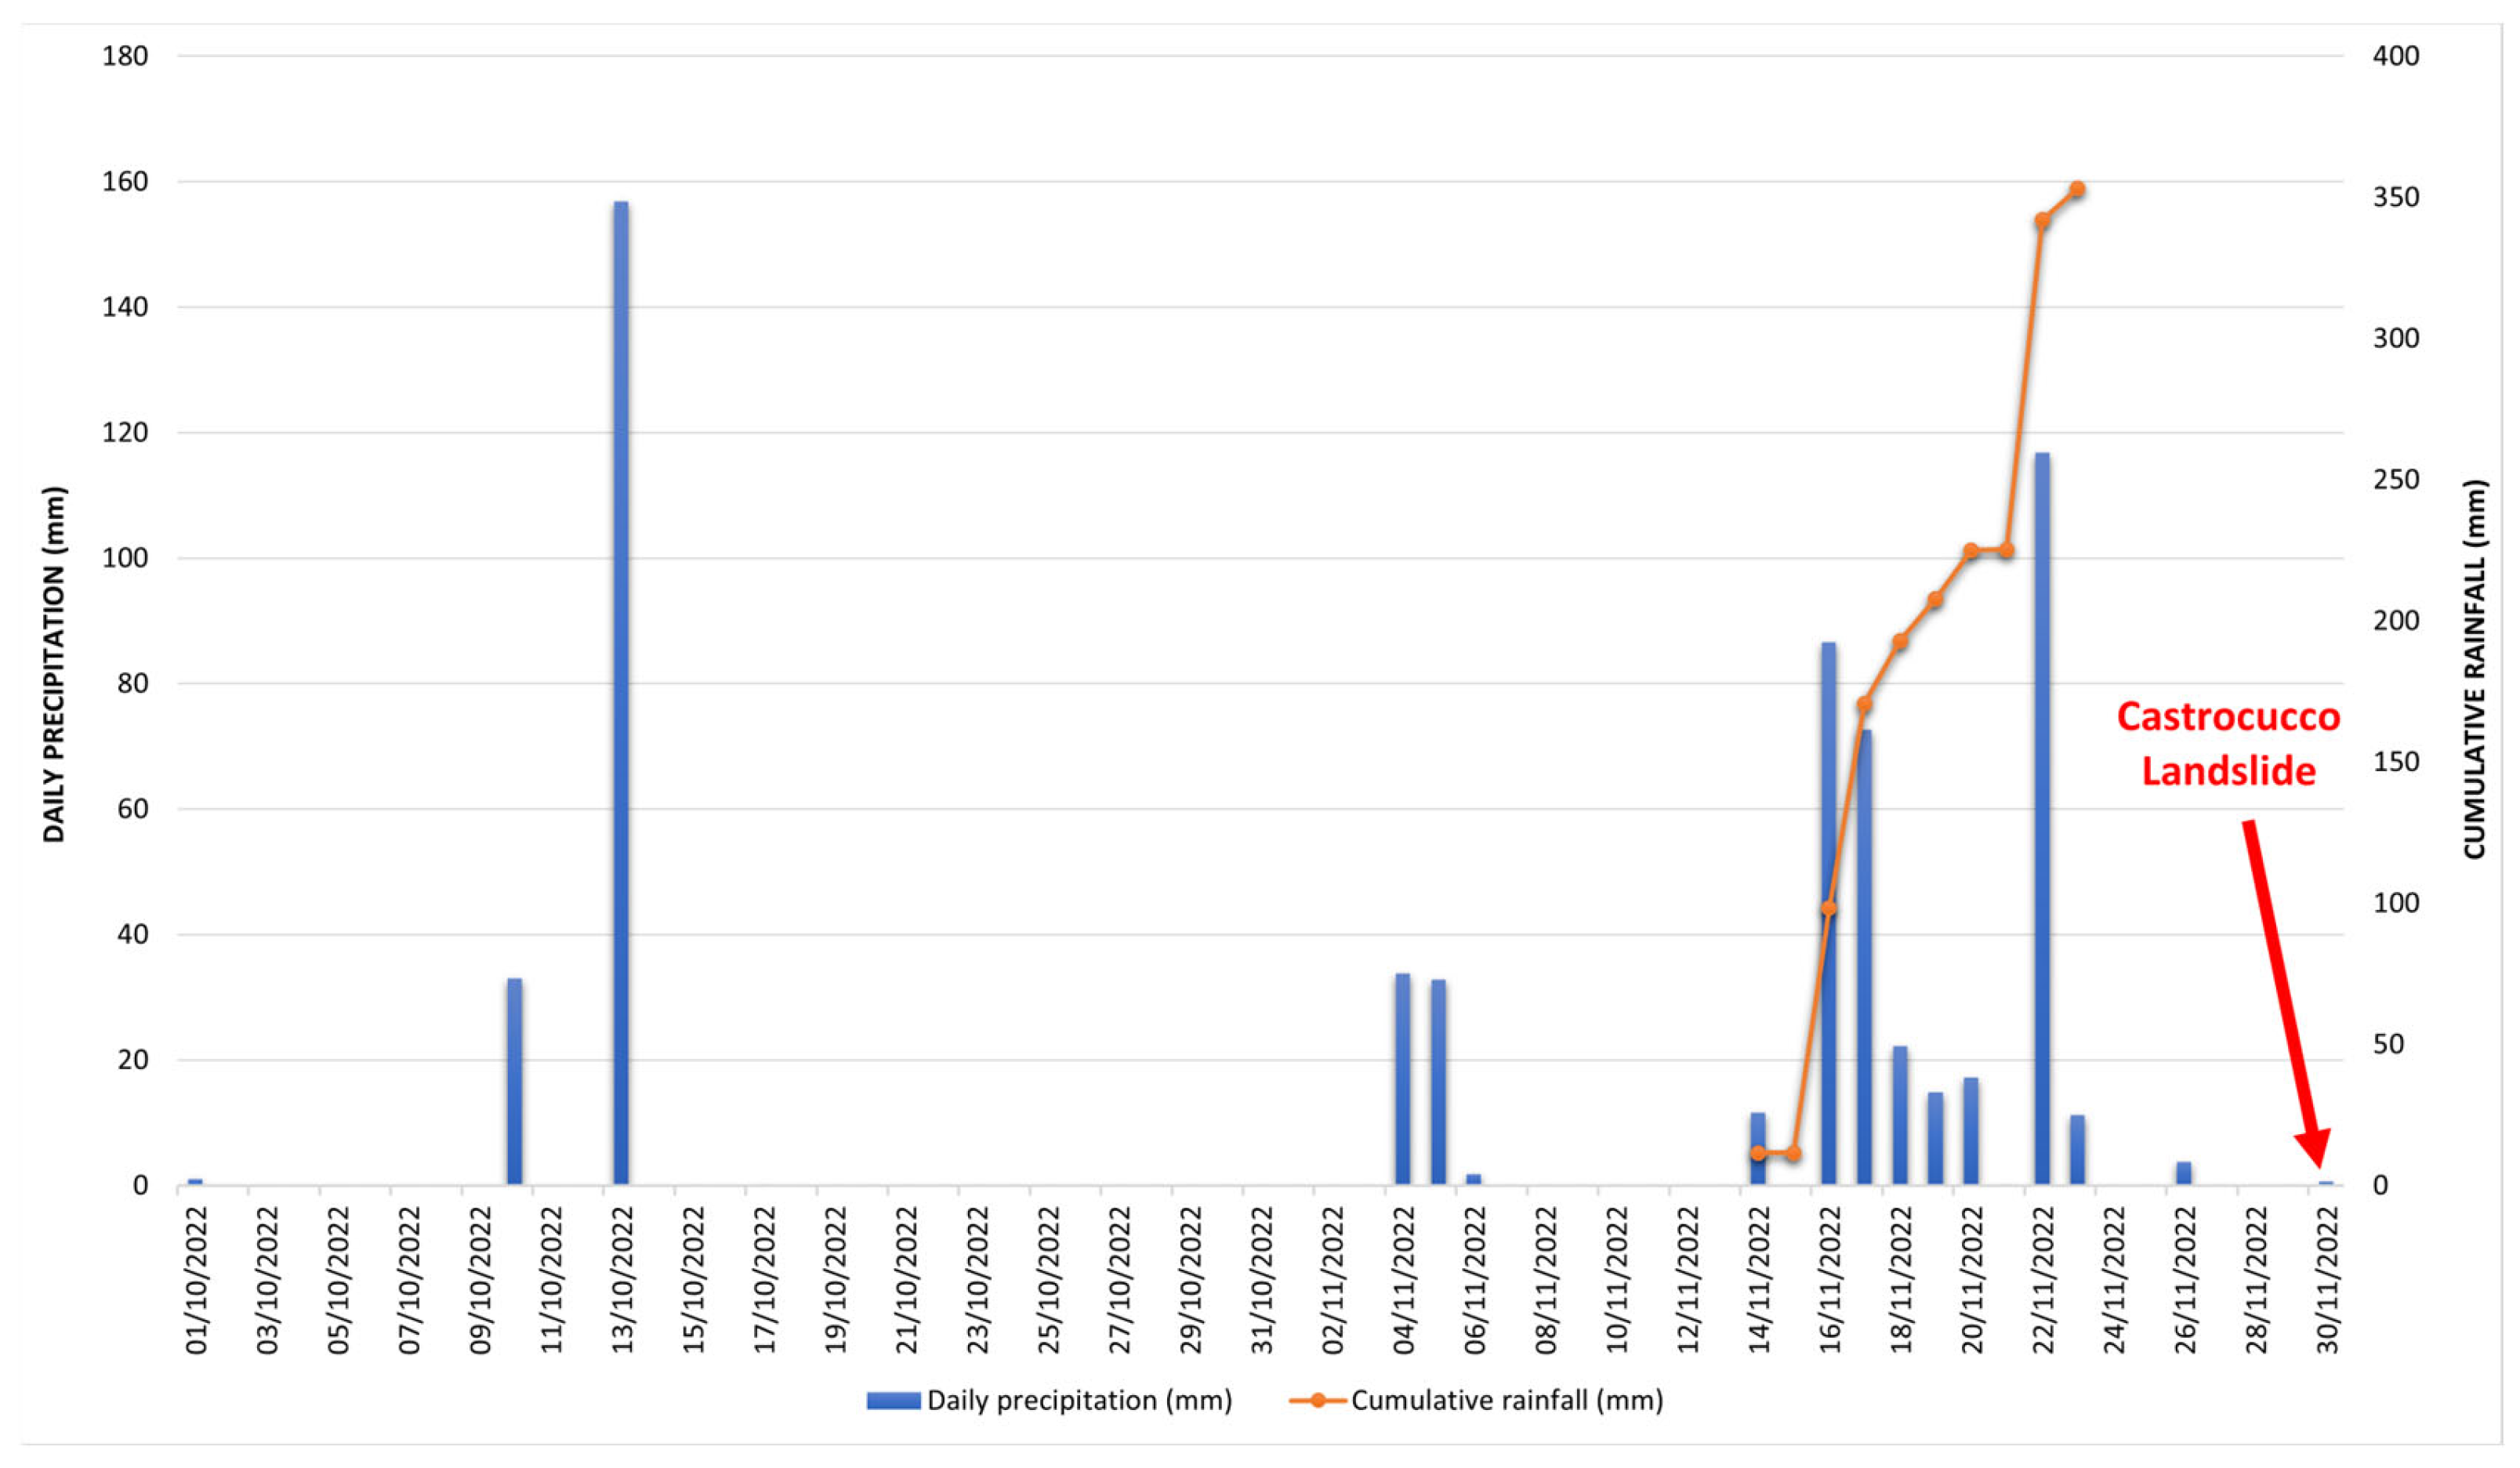
At approximately 4.00 a.m. on 30 November 2022, a landslide occurred at Castrocucco headland (Figure 2). The event developed on a high, steep, rocky scarp of 25 m and involved several thousand cubic meters of Triassic dolomitic limestones. Data provided by the Civil Protection of the Basilicata Region (https://www.protezionecivile.gov.it/en/minister/, accessed on 1 December 2022) indicate that the event occurred after a no-rain period of a week that followed a severe multi-day rainfall event of about 350 mm. Such an event culminated in the ca 120 mm daily rainfall of November 22 (Figure 3).
The State Road SS18 “Tirrena Inferiore” in the middle of the slope, connecting to the Maratea tourist hub, was destroyed and a boat storage for sea excursions was made inaccessible due to debris accumulation on the Castrocucco Beach. Fortunately, no fatalities occurred, but the event caused a great social and economic impact as the road was closed for eight months, forcing people to a 30 km deviation. The slope instability is also confirmed by the presence of pre-existing protection measures such as dynamic barriers and draped meshes destroyed during the 2022 event. They were installed after two minor rockfall events occurred on 19 and 26 December 2006, in which several hundred of cubic meters were involved, strongly damaging the SS18 road which remained closed for 6 months.

3. Materials and Methods

In this work, pre-existing remote sensing data were integrated with new in situ data. In particular, pre-event data consist of LiDAR and UAV surveys acquired in 2013 and 2018, respectively, while the new in situ data are derived from a UAV field survey conducted immediately after the event (December 2022). Remote sensing data were complemented by field observations and multi-temporal interpretation of aerial photos and orthophotos carried out from 1991 to 2022 to figure out the most likely landslide dynamics.
After undergoing a pre-processing phase, the data acquired in this study were compared with those from 2013 and 2018, allowing for an estimation of the volumetric differences between the different acquisitions. In support of the geomorphological interpretation of the event, a set of the main discontinuities was extracted from the 3D models derived by the UAV survey.
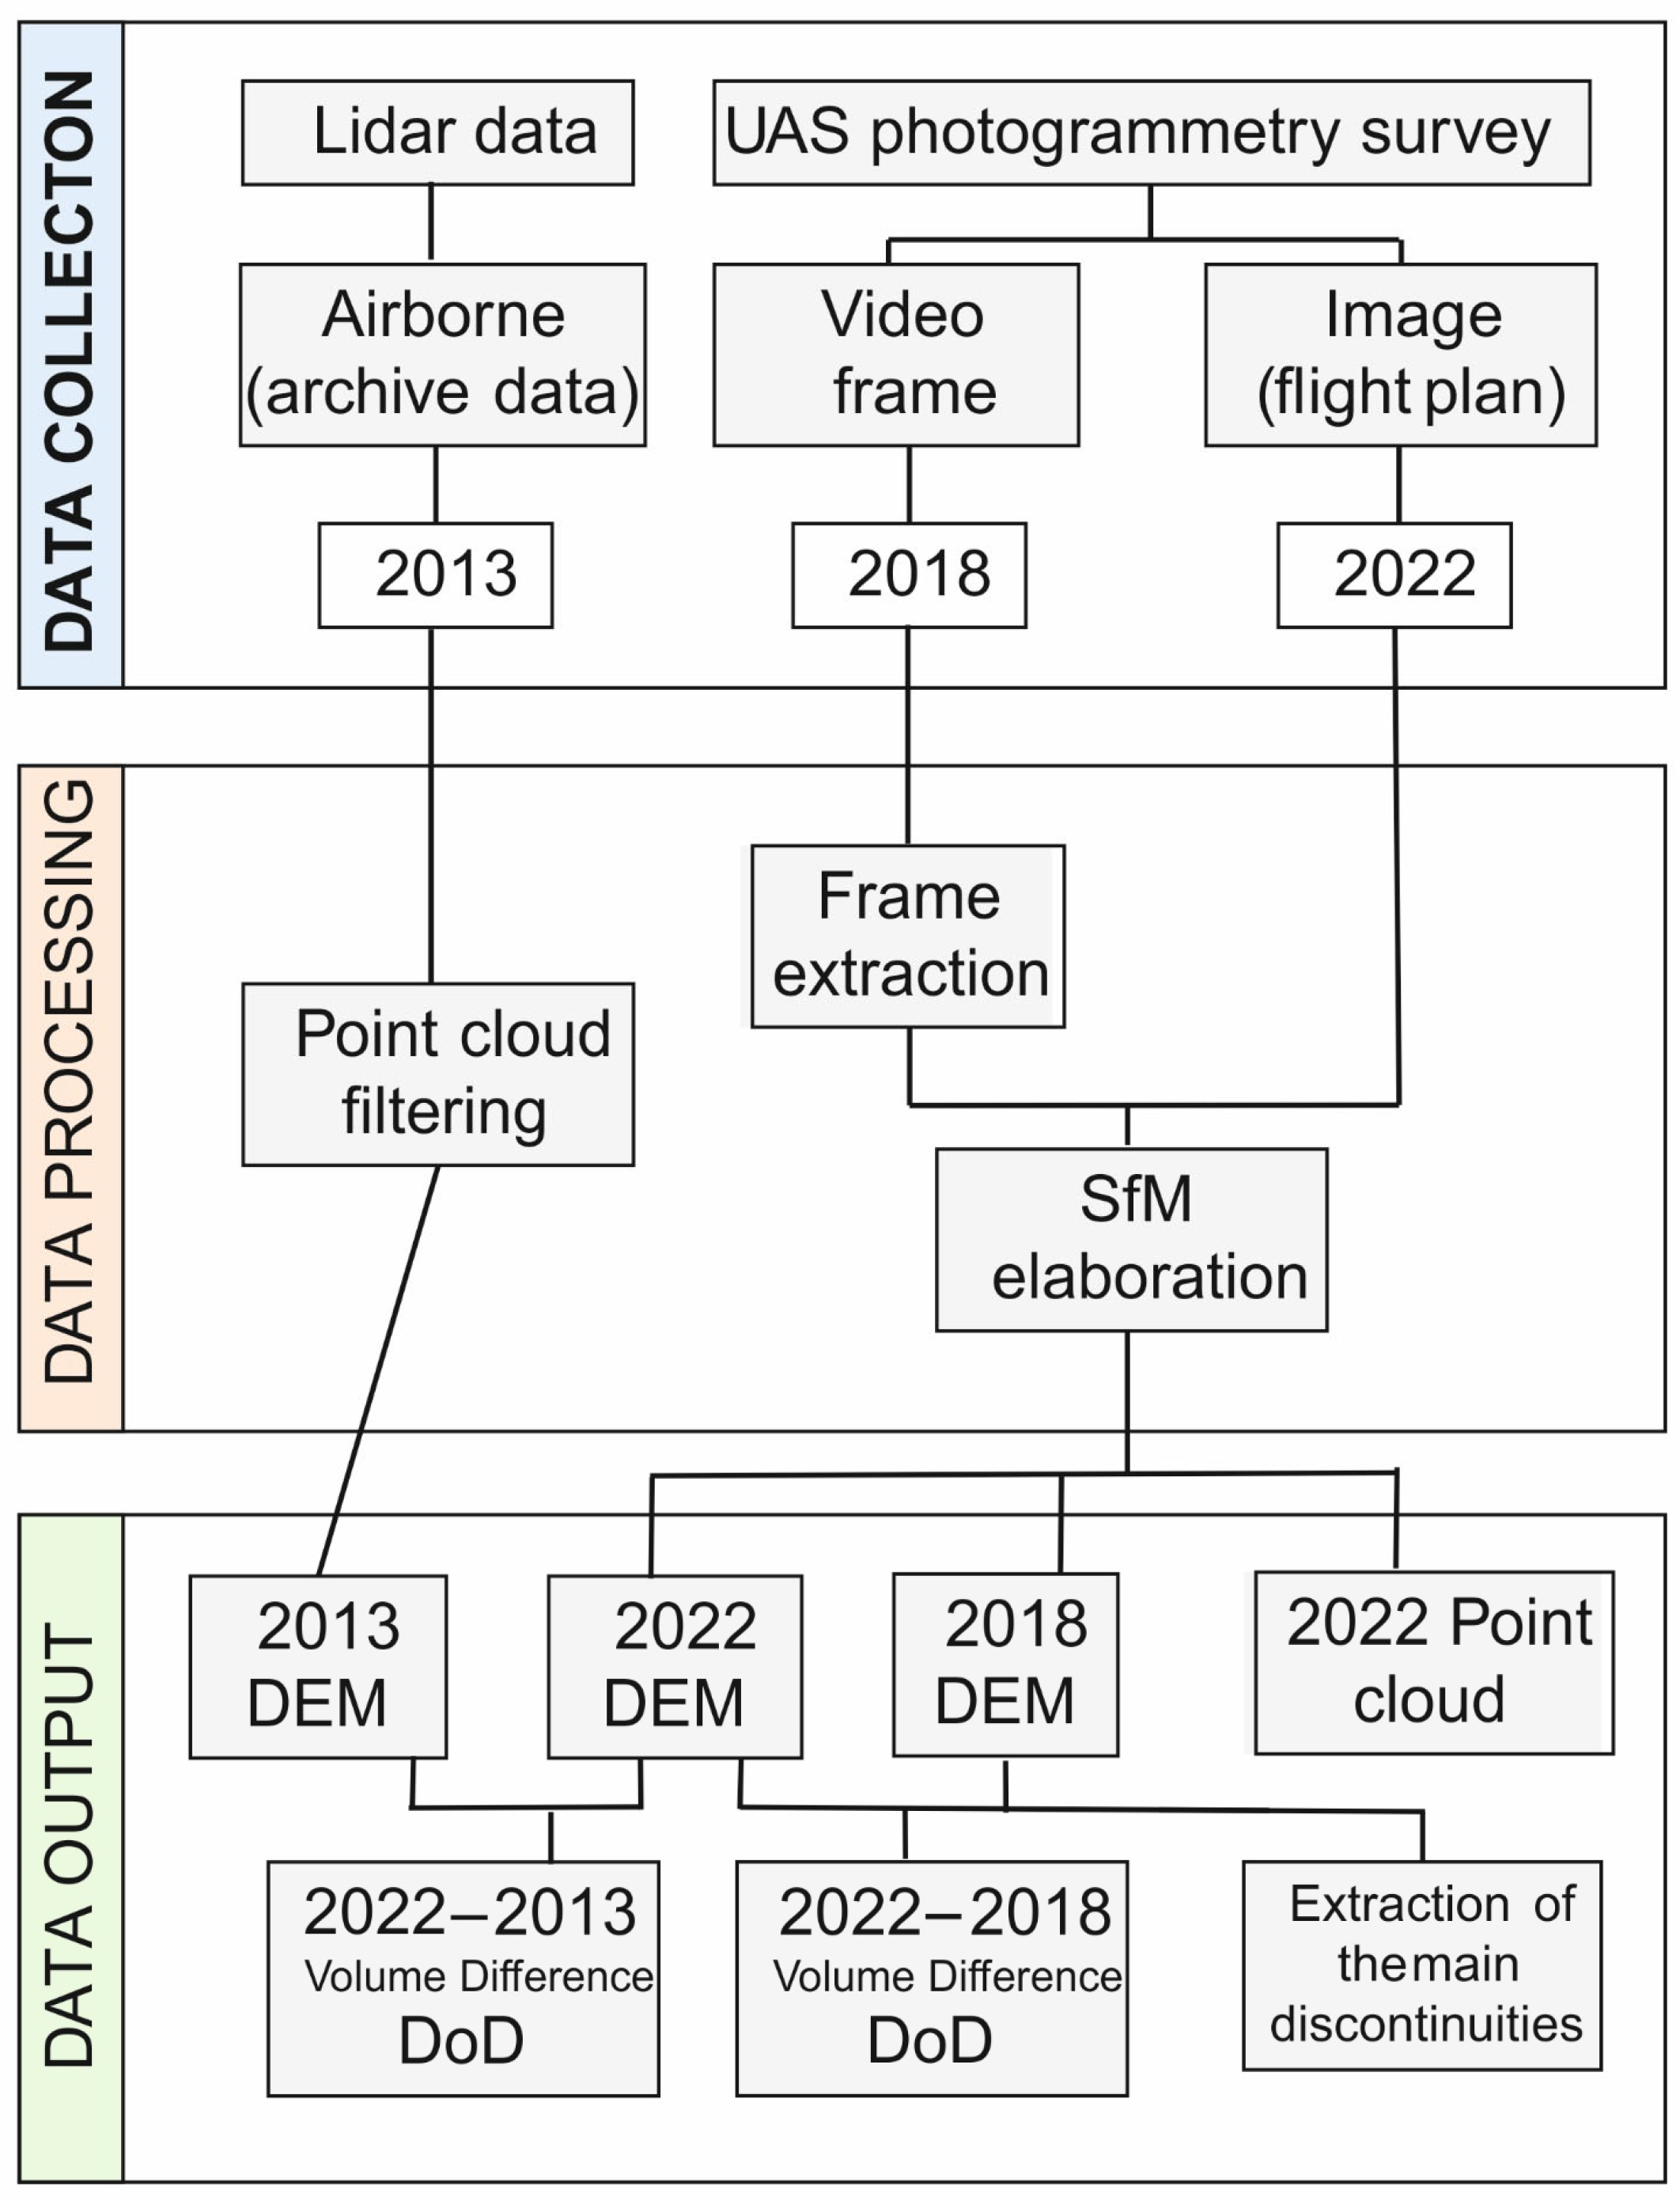
Figure 4 shows the workflow used for data acquisition and processing. Details about each phase of the work are provided in the following paragraphs.

3.1. Data Collection

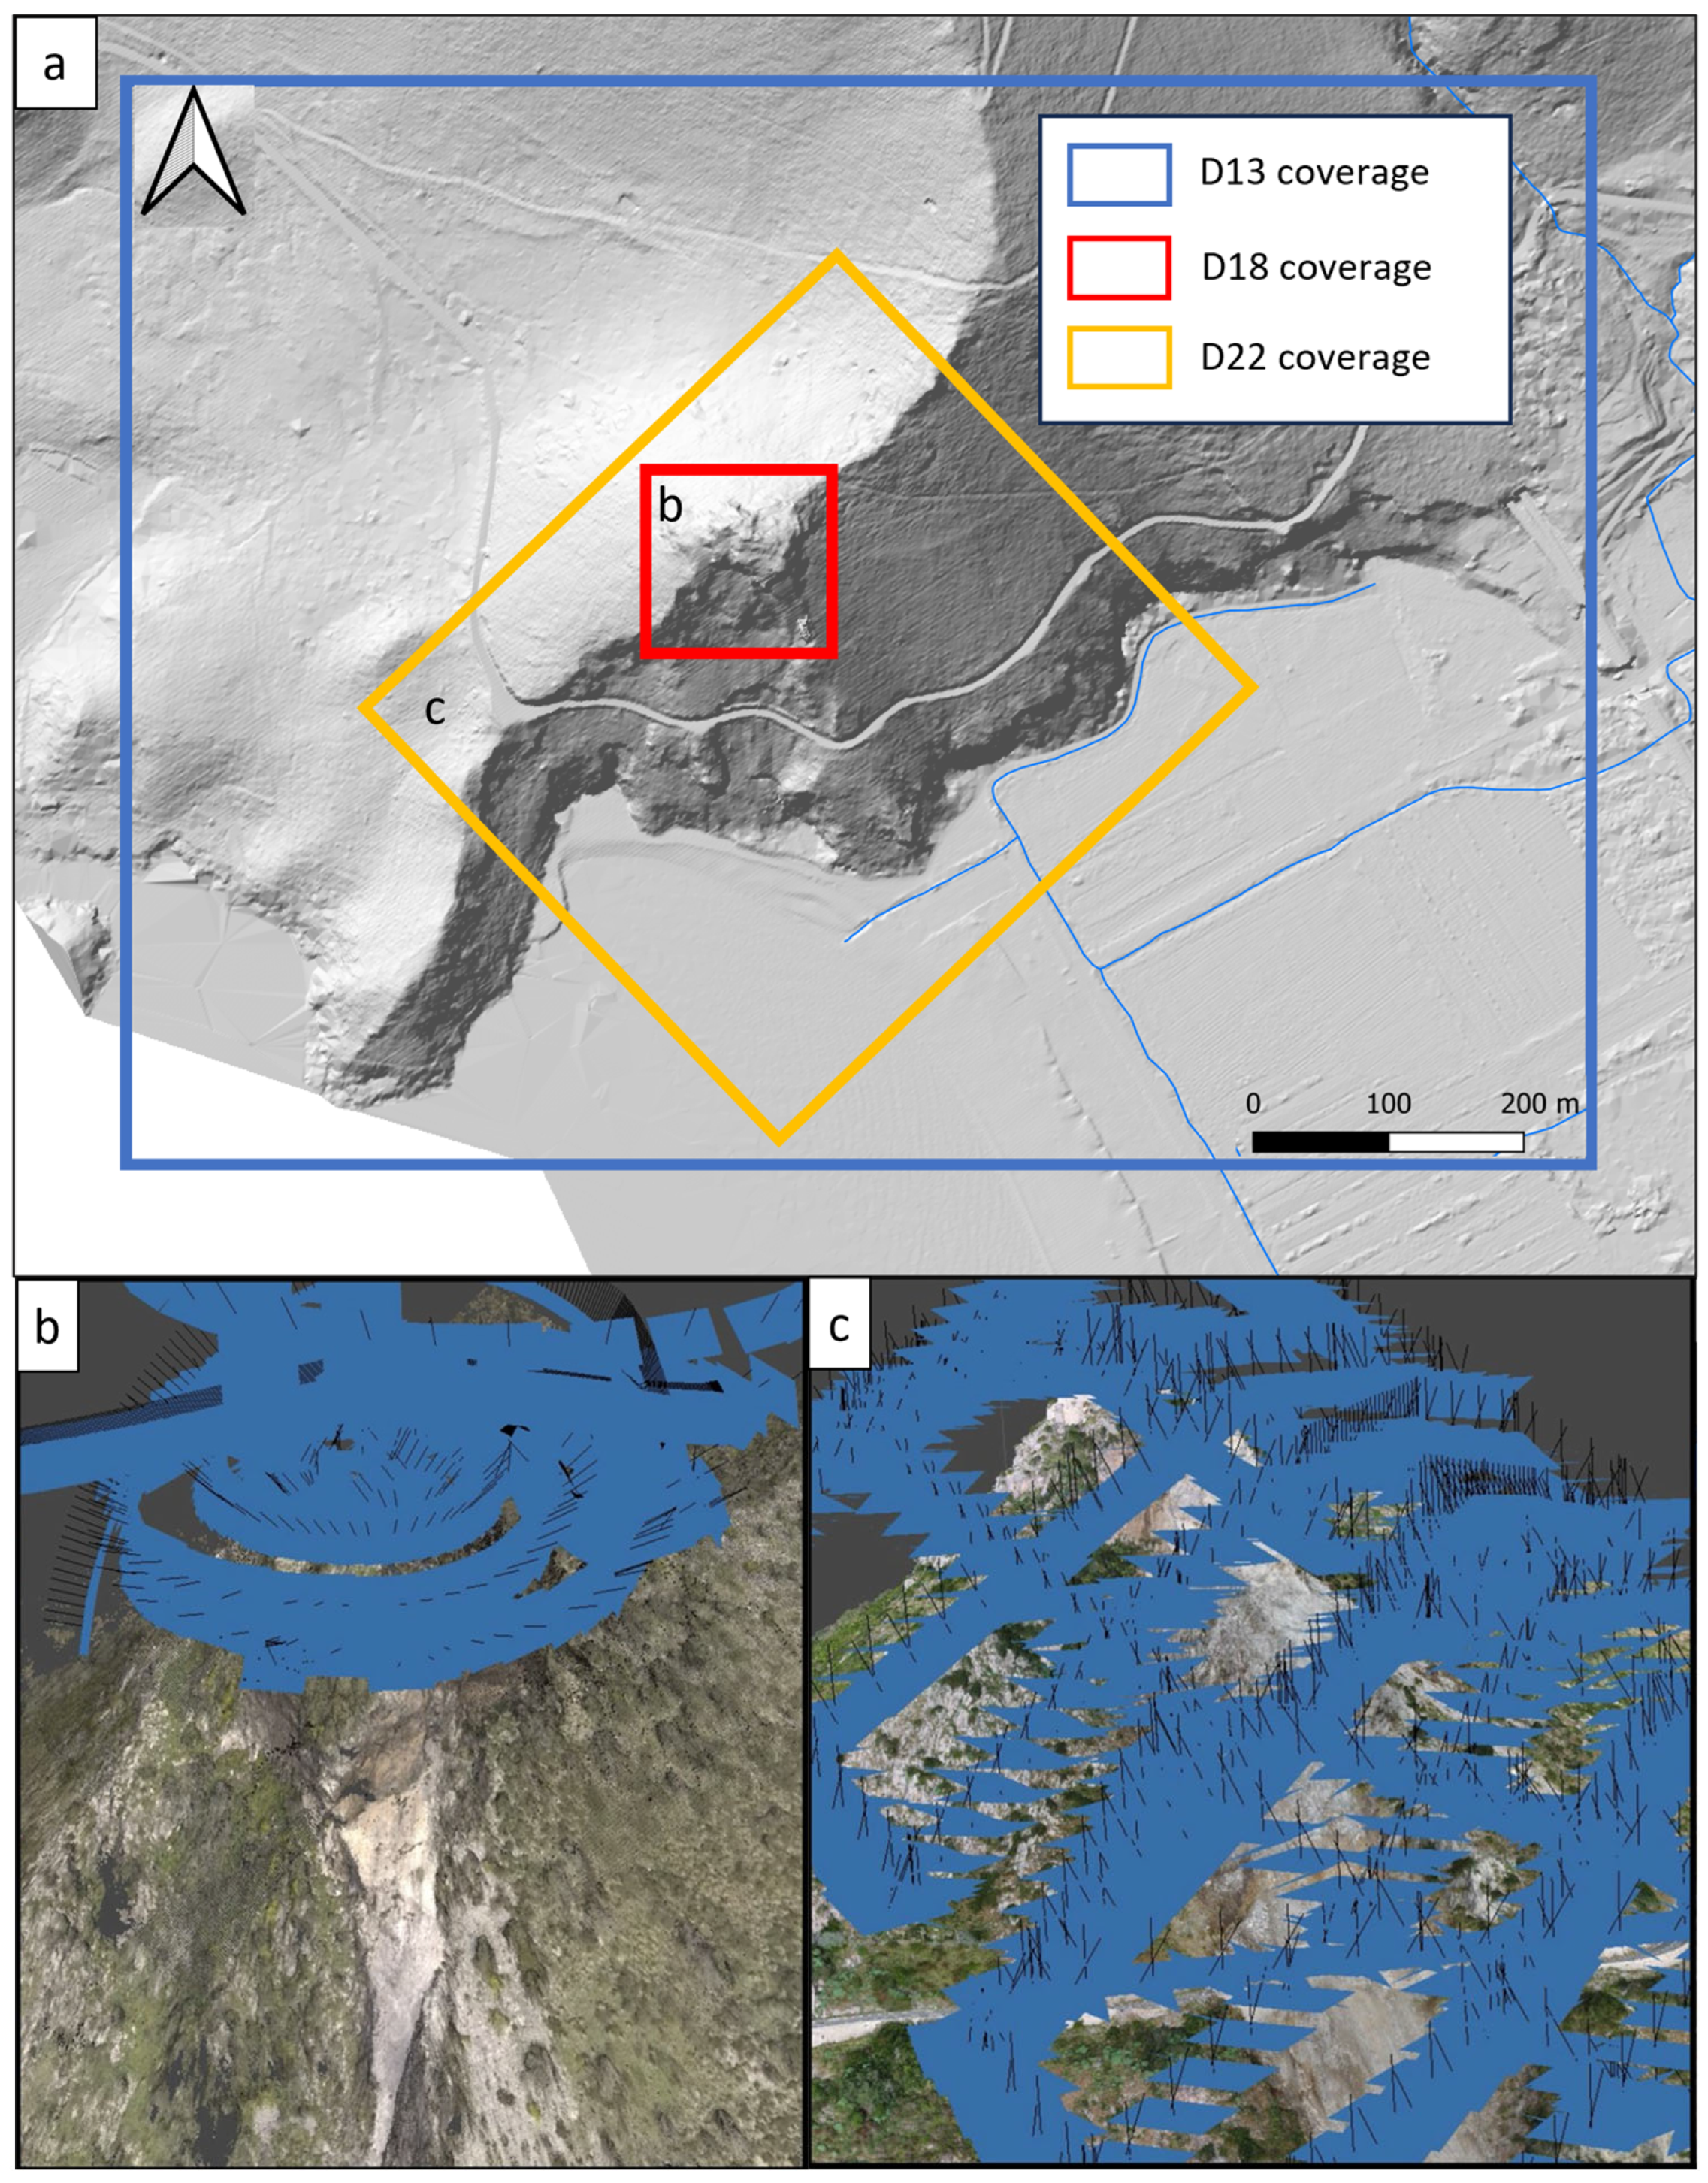
As mentioned above, multitemporal data were acquired and compared to explore the evolution of the high-relief slope. The coverage of the three datasets utilized in this work is shown in Figure 5.
The 2013 data (D13) were obtained through a request in the Basilicata Region. Specifically, an airborne LiDAR survey, which is freely available as digital terrain models (DTMs) and digital surface models (DSMs) at a resolution of 1 m. To obtain better results, we processed the raw point cloud data of the study area in order to obtain a higher-resolution DEM.
The 2018 data (D18) were collected thanks to an UAV survey realized by the Institute of Heritage Science of Potenza aimed at acquiring a video of the “Castello” historical site. The survey of the cliff edging the “Castello” historical site provided a great benefit to our work as it covered the rock failure detachment area. To obtain a 3D model, approximately 3000 frames with a resolution of 1920 × 1080 pixels were extracted from the original video (Figure 5b).
The 2022 post-event data (D22) were acquired using a DJI Mavic Pro drone developed by Da-Jiang Innovations (DJI, China). Approximately 1500 photos were taken at a constant altitude of 80 m above the ground; a flight plan was used to do this, taking into account the elevation differences along the slope (Figure 5c). To this aim, a DEM (freely available at the Basilicata Region Geoportal—RSDI) with a cell resolution of 5 m was implemented within the flight plan. In addition, for the optimal orientation of the 3D model, Ground Control Points (GCPs) were acquired by using a precision GNSS (Trimble TSC5).

3.2. Data Processing

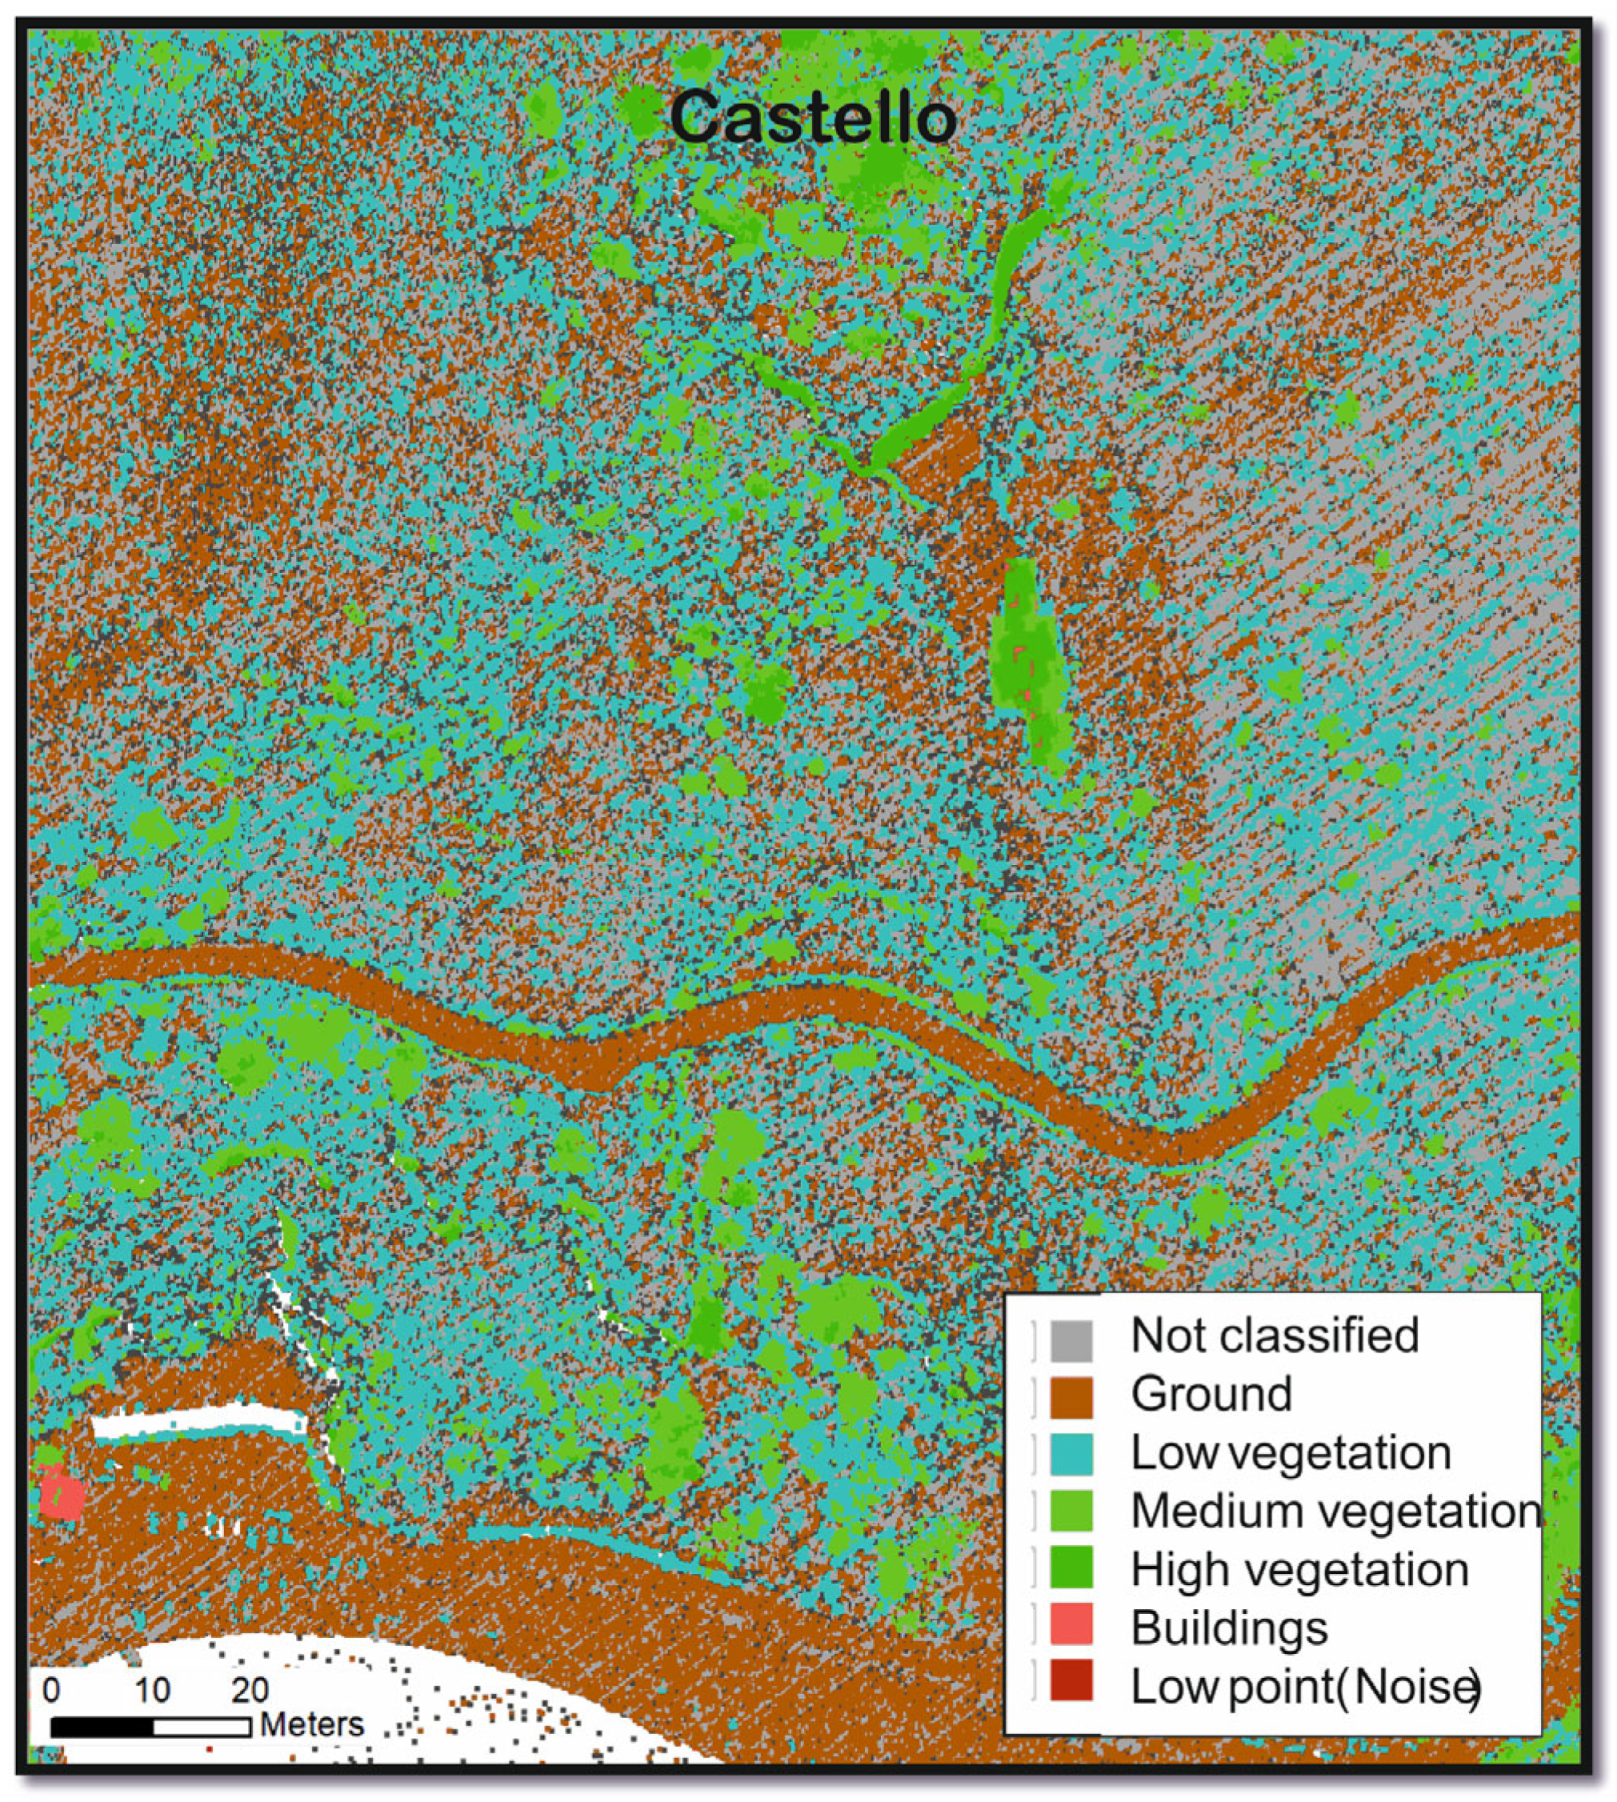
To obtain an accurate estimation of the involved rock volume, the D13 LIDAR survey was classified to extract a point cloud consisting solely of “ground” points. The point cloud classification was carried out using Cloud Compare 2.13 software, particularly the qCanupo plugin, which allowed the original point cloud to be divided into the following 7 classes (Figure 6): (1) Not classified; (2) Ground; (3) Low Vegetation; (4) Medium vegetation; (5) High vegetation; (6) Buildings; and (7) Noise.
The data processing used for the 2018 and 2022 data is the same; in particular, through the SfM algorithm (Agisoft Metashape 1.7.4 software), it was possible to achieve the following: (i) reconstruct the position of the photos at the time of the shooting; (ii) insert de GCP for model orientation; (iii) generate the dense point cloud; and (iv) construct the DEM and orthophoto.
Before executing the Difference of DEMs (DoDs), the point clouds were exported in LAS format. However, the three datasets have different characteristics, especially in terms of point density. Table 1 shows the characteristics of the datasets at the end of photogrammetric processing (for D18 and D22) and point cloud filtering (D13).
There are two main differences in the data elaboration between 2018 and 2022. The first one is the location of the photos at the time of shooting. The 2022 survey shows a well-structured flight plan, whereas the 2018 photos are featured by an inhomogeneous distribution driven by the trajectory of the video capture (Figure 5b,c).
The second difference regards the orientation of the models; therefore, the 2022 ground targets were measured with GNSS and then implemented in the Agisoft Metashape 1.7.4 software to improve the accuracy of the 3D model. Due to the absence of ground markers for the 2018 survey, fixed and clearly visible points from the 2022 orthophoto were used to orient the model in space, while the elevation information was aligned to the DEM of 2022. Finally, to obtain the best possible overlap (and the lowest possible error), point clouds D18 and D22 were aligned (keeping D22 fixed) using the “aligns two clouds by picking” tool in Cloud Compare 2.13 software.

3.3. Rockslide Analysis and Volume Difference

To reconstruct the event kinematics, the main discontinuities characterizing the involved rocky cliff were extracted using the D18 pre-event 3D point cloud. A semi-automatic approach was preliminarily used with the Facets plugin in the Cloud Compare 2.13 software. Facets enables the segmentation of massive 3D point clouds into individual planar elements, calculating their dip and dip direction, and reporting the extracted data in stereograms. To perform the segmentation, the Kd-Tree algorithm was used. It segments the point cloud into sub-cells, identifying basic planar objects and gradually combining them into polygons based on a planeity threshold. Such an approach is widely spread in the scientific literature concerning rock landslides, thus supporting its reliability and effectiveness [68,69,70,71], particularly in those cases where the study area is not easily accessible. The automatic extraction of the main discontinuities from the pre-event 3D point cloud supports the identification and extraction of the main discontinuities of the unstable block and the slope stability assessment. The volume difference between the D18 model and the D22 model was utilized to estimate the volume of the detached block. This approach was chosen because both datasets are derived from the same technique (photogrammetry) and exhibit a similar density of points per square meter (as indicated in Table 1). Conversely, the comparison between the D13 LiDAR-derived model and the D22 model aimed to estimate the volume associated with the entire rockslide.
To quantify the volume differences, a DEM was created by computing the DoD. Starting from the LAS data managed in the Cloud Compare 2.13 software, the DEMs were constructed. Subsequently, the Geomorphic Change Detection (GCD) tool [72] was employed to perform the DoD. This tool not only provides a map of the distribution of volume changes but also offers insights into the volume quantities involved and the associated errors.

4. Results and Discussion

The workflow presented in this paper is based on the geomorphological analysis of near-surface multisensor and multitemporal remote sensing data aimed at obtaining information on the kinematics and volume involved in a huge rockslide at Castrocucco di Maratea in November 2022. The dataset used in addition to the data obtained from UAVs (D18 and D22) also consists of a point cloud dated 2013 (D13). Details concerning the dynamics of the rockslide evolution and volume estimation are outlined in the paragraphs below.

4.1. Rockslide Dynamic and Evolution

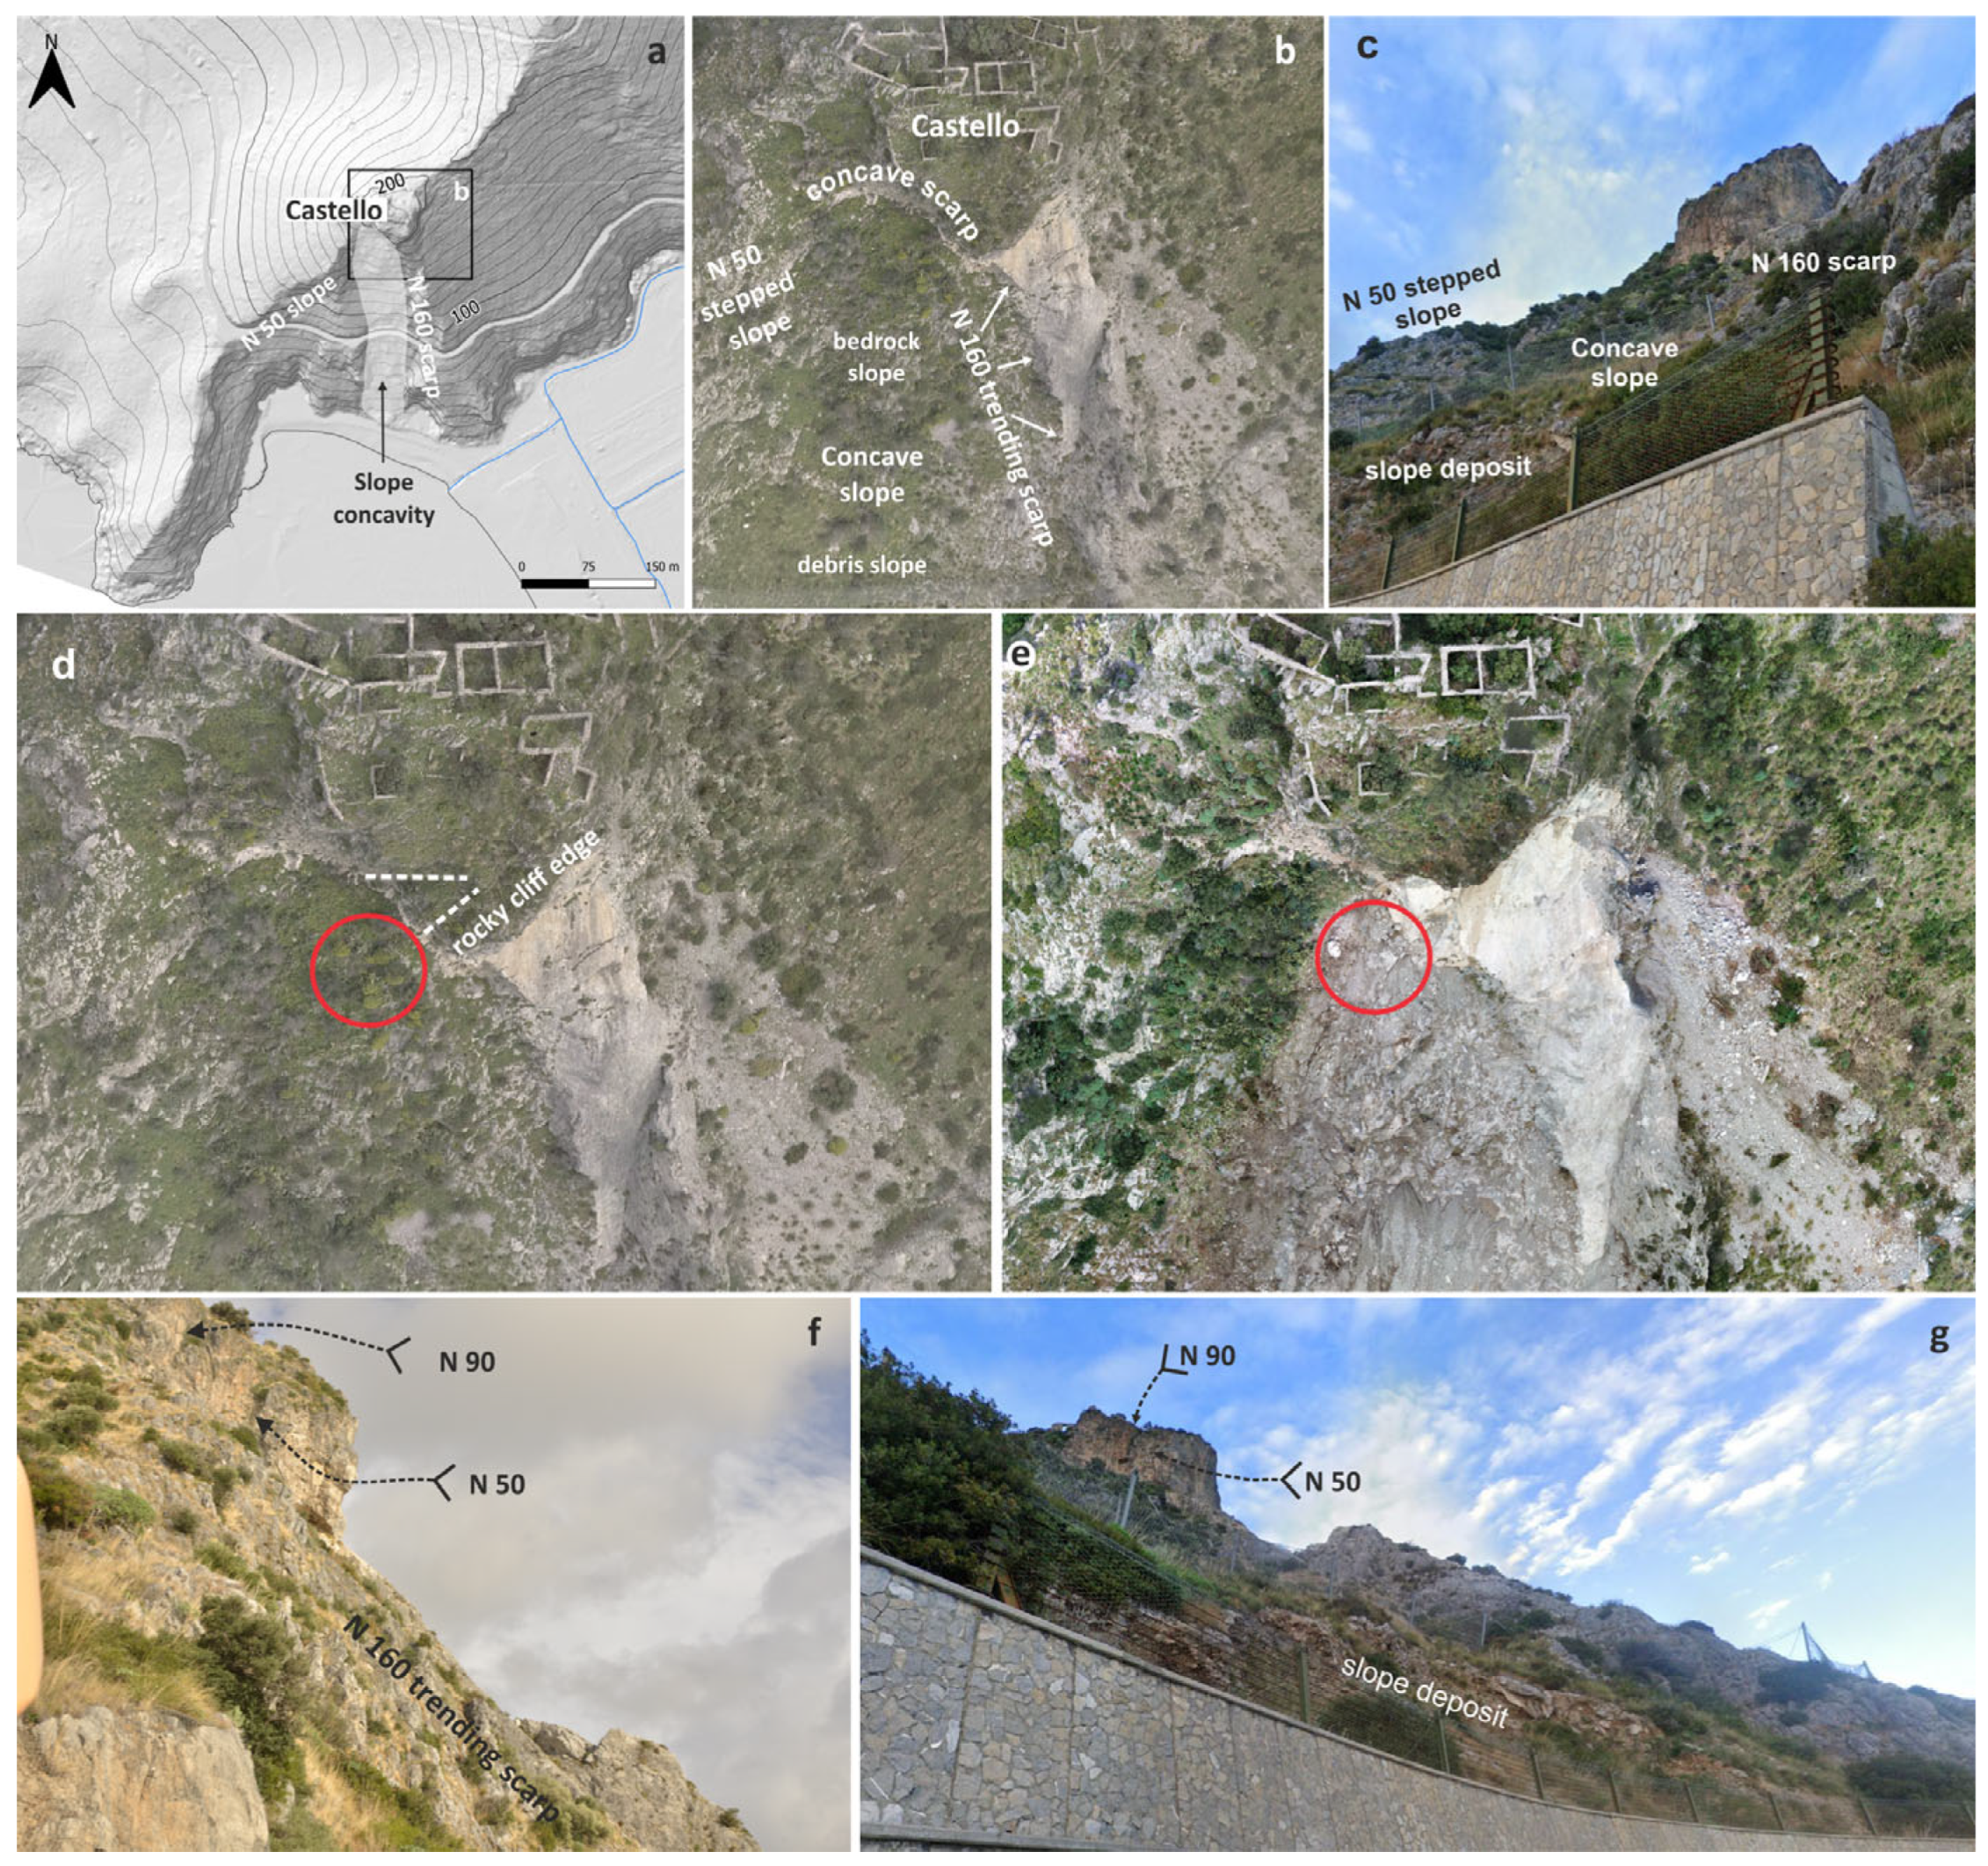
A possible interpretation of the Maratea landslide movement was performed by integrating different datasets from stereo pairs of aerial photographs, orthophotos and high-resolution topography data obtained from D18 and D22. Analysis of the images highlights a N160°-striking, meters-high scarp that assumes a concave shape just to the southwest of the “Castello” historical site and joins westward to a N50°-trending stepped, rock slope (Figure 7a–c). Such morphological features confine an apparent concave-up slope in plan form (whitish area in Figure 7a) consisting of an upper-bedrock-slope grading downward in a debris slope (Figure 7b).
The evidence of movement markers is evident at the south-eastern tip of the concave scarp affecting the concave bedrock slope (Figure 7b; red circles in Figure 7d,e). It appears to be inconsistent with the movement of the rock block that involved the high, steep, rocky cliff edging the “Castello” historical site to the SW (Figure 7e). Moreover, the aerophotogrammetric analysis highlighted the presence of scarps and fracturing approximately oriented N90 and N50 (dashed lines and arrows in Figure 7d,f,g) that affected the rocky cliff (Figure 7e) at the intersection point between the N160-trending and concave scarps (Figure 7b).
Based on the above, it is reasonable to assume a first sliding down the N90 and N50 discontinuities of a wedge-shaped block, which caused a decrease in the overall stability of the rocky cliff edge. The release of material played a key role in controlling the kinematic freedom of the potentially unstable main rock block, fostering its later failure. In this regard, the literature data widely claimed that large rock failures are preceded by minor detachments that play a key role in controlling both the long-term stability of rock slopes and their kinematics [73,74,75,76,77].
The ensuing kinematic freedom and the orientation of discontinuities (Figure 8) ultimately define the shape and size of the main rock block at the SW edge of the “Castello” historical site, which moved in an SSE direction through early planar sliding. Once it reached the ca. N160°-striking scarp, the morphological step acted as a pivot promoting first a tilting and then a toppling-type motion. Afterwards, the rock mass dramatically impacted the lower slope, enhancing the original concave shape just upstream the State Road SS18. The resulting fragmentation and comminution of the rock mass impacted the SS18 road below, as well as the lower slope. Further, the debris coverage, blanketing almost the whole slope, later experienced a debris and earth slide. This was very noticeable at the foot of the slope.
Surely, a predisposing factor that could have increased the instability of the rocky cliff is the chemical weathering in opened fractures caused by water infiltration. The dissolution and chemical weathering of carbonate rocks can greatly affect their mechanical properties, accelerate the rate of deterioration of the rock and ultimately lead to early failure under external stresses [78].
Also, karstic processes result in the formation of clay minerals within fractures, thus reducing shear strengths. This, coupled with the presence of water in the open joints of rock masses, exerts key controls on stability, both through a direct outward force and by decreasing the effective stress and the shear strength on failure surfaces [79].

4.2. Volume Estimation/DoD Analysis

In this study, two DoD considering two different pre-event data were carried out.
Table 2 shows the data obtained from the DoD between D22 and D13. It can be seen that the lower volume is 32,652 m3 while the raising volume is 15,013 m3. As can be seen in the calculation of the errors, the “total net volume difference” has an error of 20.96%. This overestimation of the lost volume is due to the difference between the features of the D22 and D13 models. In particular, the two models were acquired with different techniques and resolutions (Table 1). Certainly, the accuracy of DoD could be strongly affected by the alignment of the point clouds and by the quality of the DEMs used [47]; the absence of information regarding D13 acquisition and data processing may introduce some uncertainties in this first DoD calculation. Despite these uncertainties, the D13 model was used since it was the only available pre-event data covering the entire area affected by the rockslide. Additionally, the discrepancies in the lost volume may also be related to problems during the phase of the point cloud classification of D22 model.
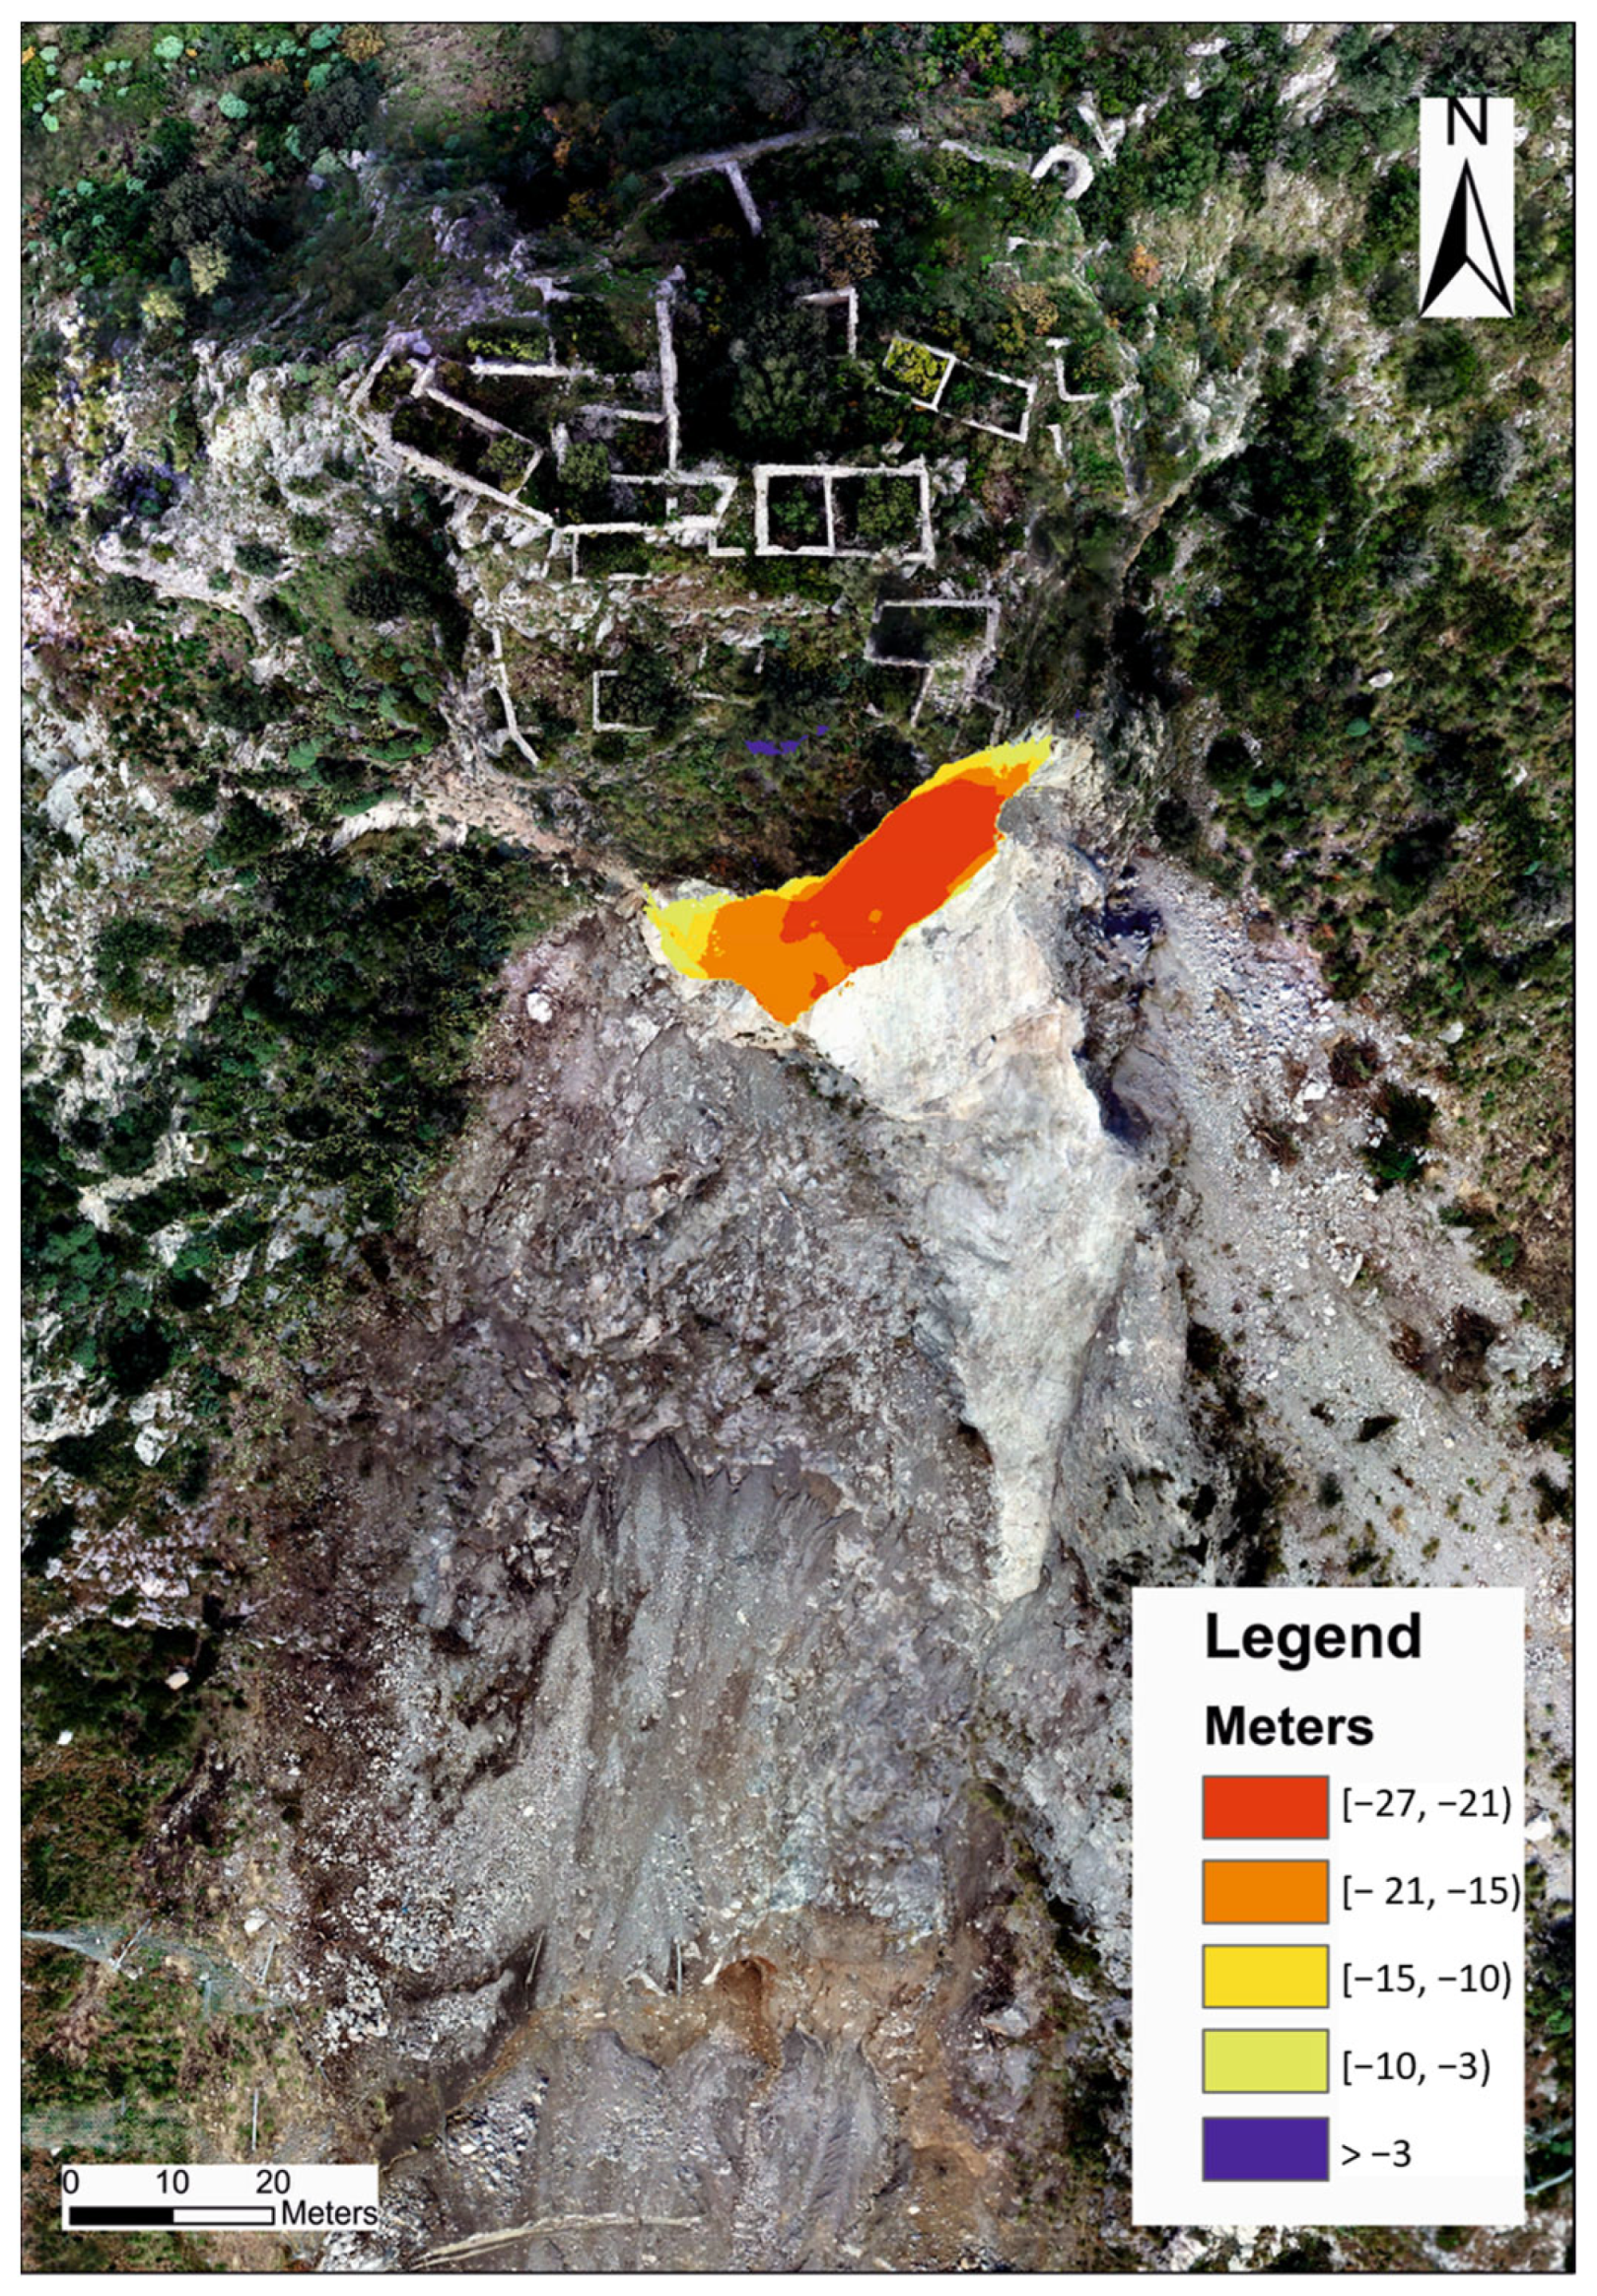
In order to estimate the volume of the main block detached from the 25 m scarp, another DoD between D22 and D18, focusing on the upper part of the slope, was carried out. Detailed data of the resulting elevation changes are shown in Table 3. It can be seen that the volume calculated for the main block is about 8000 m3, and that errors are low except for “total volume of surface raising” due to the different growth of the vegetation.
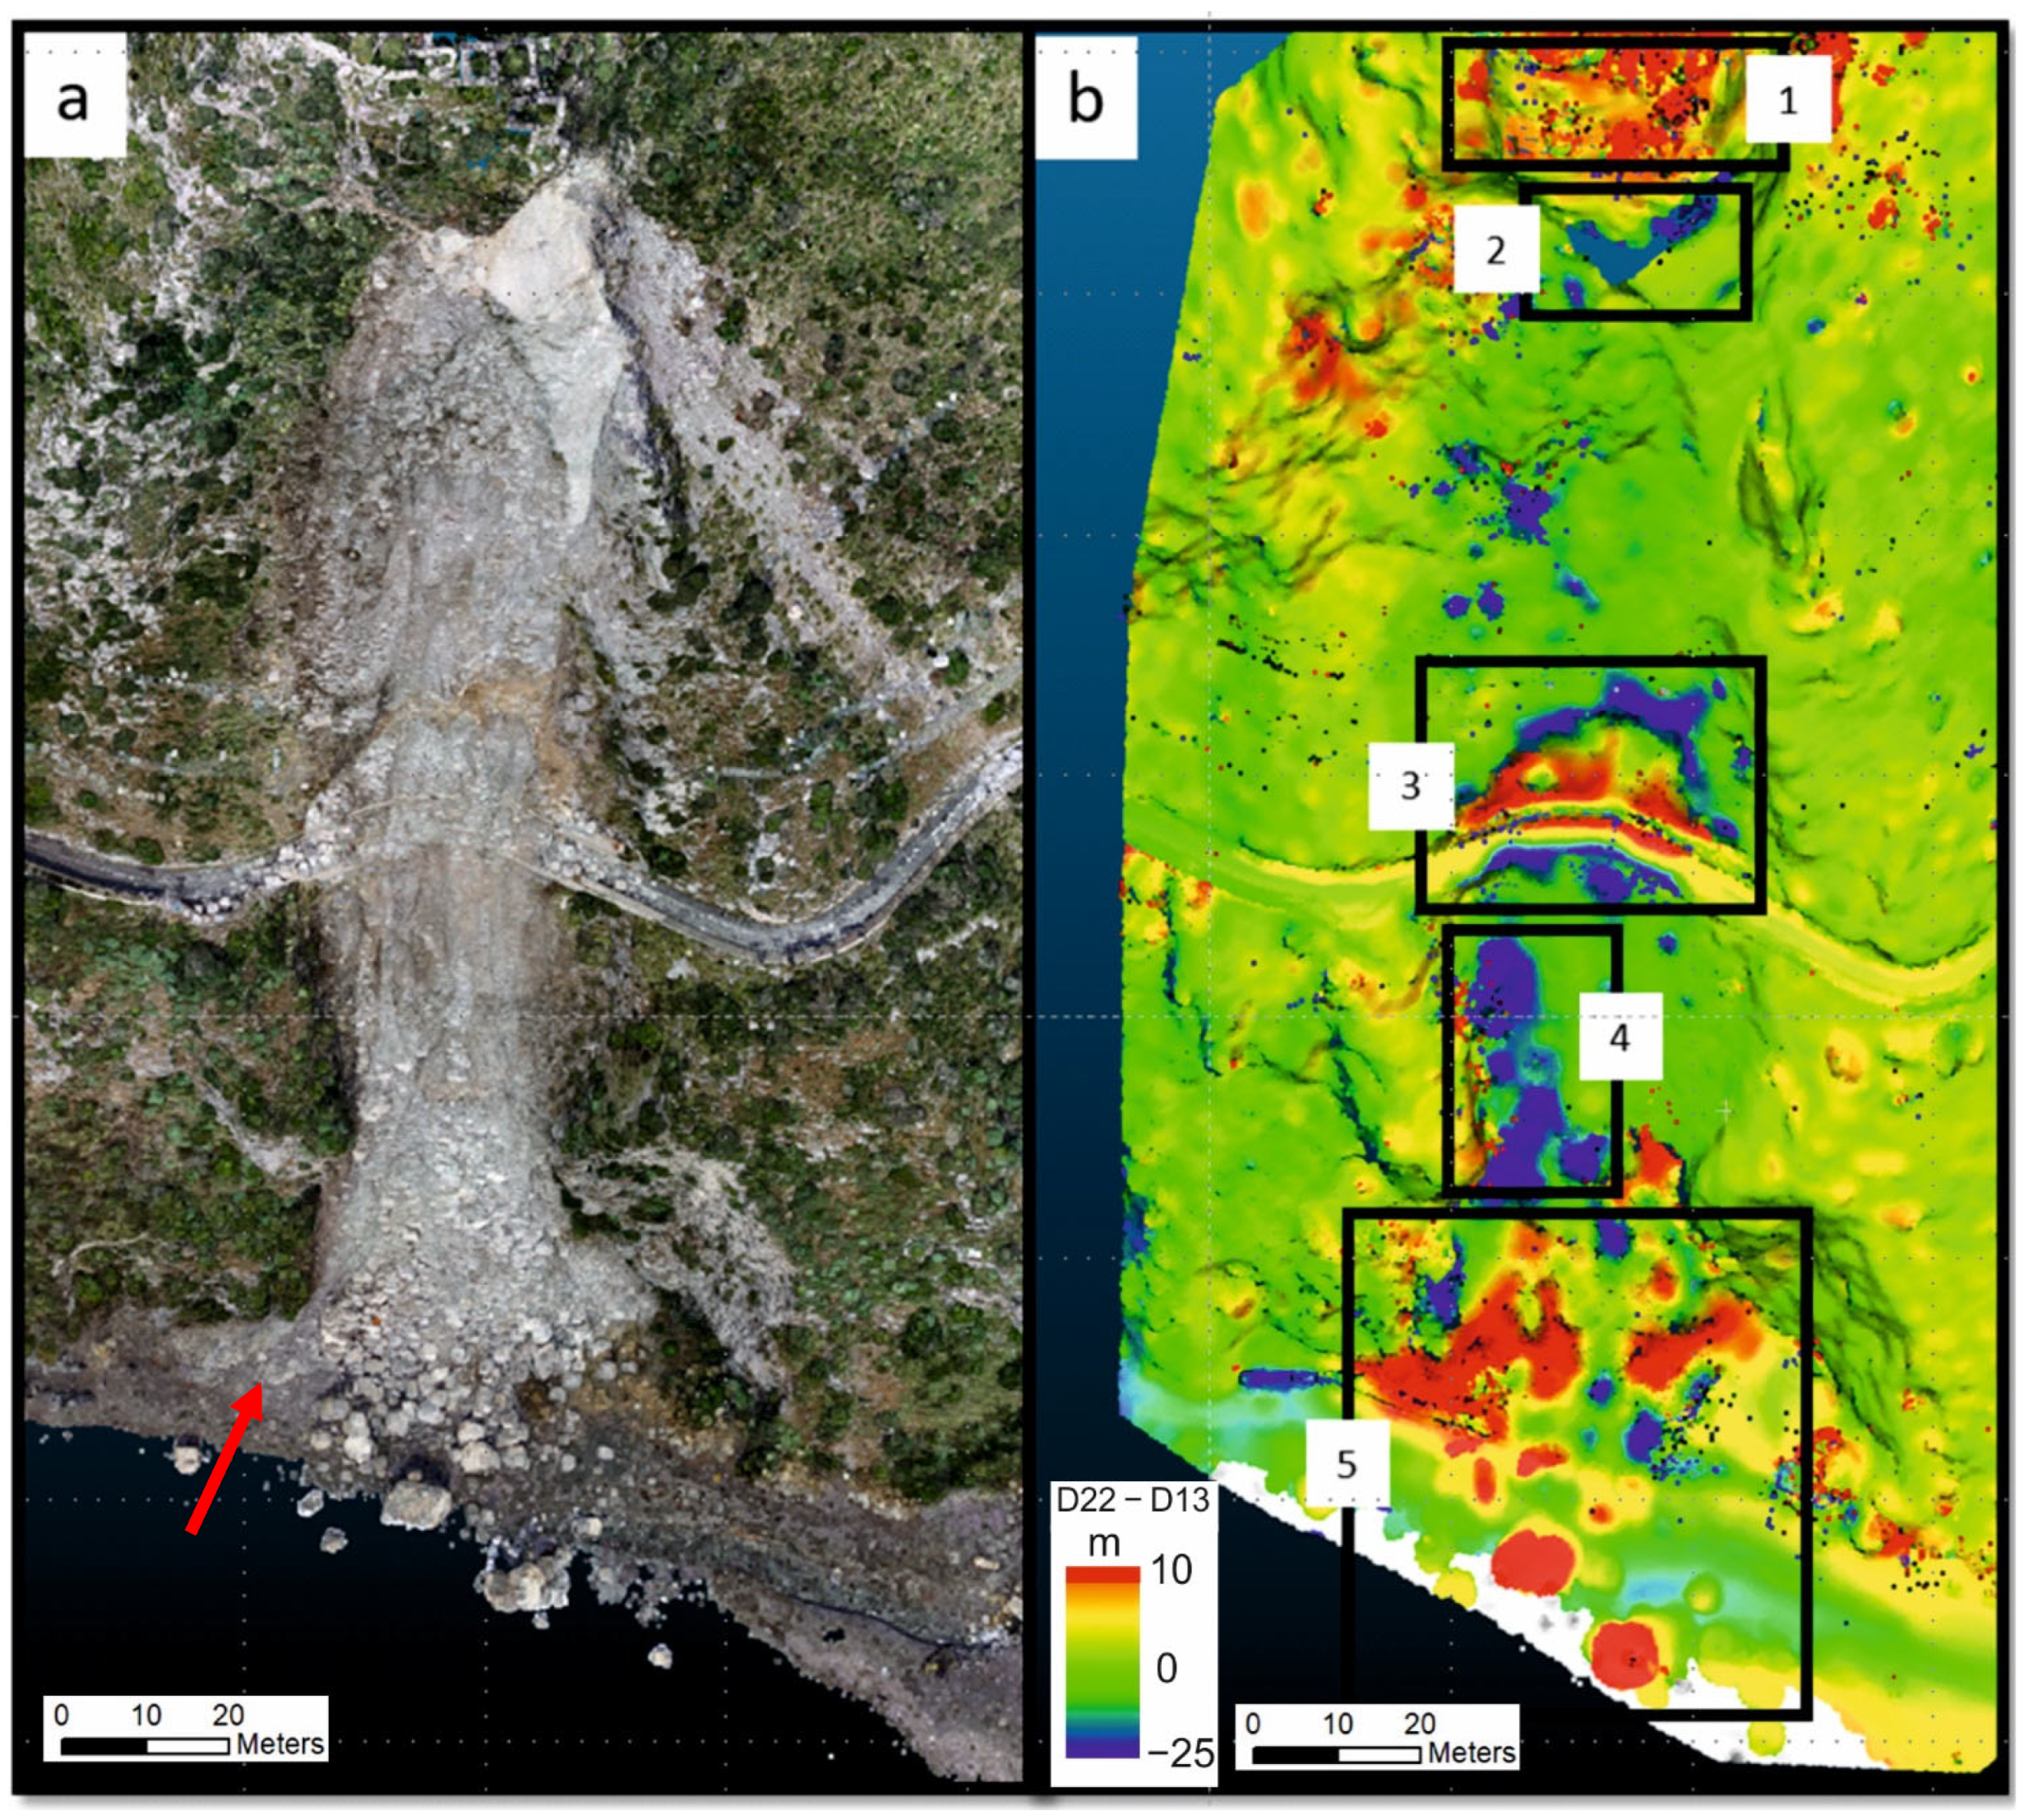
The DoD between D22 and D13 clearly shows the volume change caused by the movement of the rockslide; in particular, the red and blue areas indicate the accumulation and subtraction of material, respectively (Figure 9). To better analyze the results of the volume difference, the study area was divided into five sectors.
The sector at the top of the slope (“Castello” historical site–frame 1 in Figure 9b) is characterized by a positive difference showing an area of accumulation. The high resolution of the 3DPC obtained from the D22 field survey allowed us to discern that, in this sector, vegetation is widely spread. Furthermore, as LiDAR technology works with a laser beam emission (with wavelengths ranging between infrared and ultraviolet) backscattered by a spot on the object, one of its major advantages is the ability to penetrate the vegetation. In particular, the near-infrared wavelength can pass through the gaps of the foliage and reach the ground. The first step of the data processing was to classify the D13 point cloud in order to obtain only the ground points. Such an elaboration is useful to filter the points corresponding to the vegetation. For this reason, it was possible to assume that the positive volume difference in sector 1 can be attributed to the presence of vegetation cover. Therefore, these points have not been included in the volume calculation. In frame 2 (Figure 9b), the main rock block detachment area is shown as missing points while frame 3 in Figure 9b shows the presence of an area in erosion and an area in accumulation on the road. In particular, the blue area to the north of the road highlights a pre-existing concave depression, onto which the main impact of the rock block has probably occurred, enhancing the original concave shape on the slope and demolishing the exterior side of the road. Frame 4 in Figure 9b shows erosion, probably due to secondary impacts to later debris slide/flow events affecting the western side of the frame (Figure 9a), and then, the area of deposition (frame 5 in Figure 9b) characterized by the presence of the larger blocks that reached the beach.
The DoD between D22 and D18 (Figure 10) suggested that the volume of the entire large block was approximately 8000 m3 of limestone (Figure 11).
Despite the difference in ground information (Table 1) given by the three-point clouds used in this work, we wish to emphasize how the integration of data of a different nature (LiDAR and SfM), acquired at different heights and with a different resolution, is useful for the reconstruction of the evolution of the territory. This approach provides an approximate estimation of the total volumes involved, especially when high-resolution datasets are not available.
In particular, as shown above, it can be seen that the entirety of the volumetry detached from the slope derives from a large block at the top of the slope.

5. Conclusions

UAV technology proved to be quite effective and versatile for data collection in areas with difficult access. In this study, rockslide modeling was performed using quantitative analysis of the pre- and post-event DoD of a different nature (LiDAR and SfM), acquired at different heights and with a different resolution. The comparison between the two datasets allowed us to reconstruct a complex event that started as a rockslide, evolving into a rock topple with typical rebounding and bouncing and then avalanching along the slope. Our results highlighted that the heavy rainfall of the previous days was a relevant predisposing factor in combination with the high fracturing of the rock mass that influenced the shear strength limit in the joints.
Such an approach has proven to be a more effective approach than DEM of Difference (DoD) for the analysis of rockslide phenomena at a slope scale. Our approach has great potential to define the geomorphological features of rockslides and can furnish basic data for more advanced applications such as fracture system delineation or the simulation of block fall trajectories. In this context, numerical simulations could provide valuable insights for a quantitative hazard assessment by accurately reproducing the paths followed by real blocks and estimating their speed, energy, heights of rebound, impacts and stopping points.

Author Contributions

Conceptualization, A.M.A., G.C., I.G.G., D.G., M.S. and G.R.; methodology, A.M.A., I.G.G. and D.G.; software, A.M.A. and I.G.G.; validation, G.C., D.G., M.S. and G.R.; investigation, A.M.A., G.C., I.G.G., D.G. and G.R.; data curation, A.M.A., I.G.G., D.G. and V.V.; writing—original draft preparation, A.M.A., G.C. and I.G.G.; writing—review and editing, G.C., D.G., M.S. and G.R.; supervision, D.G., M.S. and G.R. All authors have read and agreed to the published version of the manuscript.

Funding

This research received no external funding.

Data Availability Statement

The raw data supporting the conclusions of this article will be made available by the authors on request.

Acknowledgments

We thank Federica Lucà for providing valuable insights during the investigation and for reviewing and editing the manuscript.

Conflicts of Interest

The authors declare no conflicts of interest.

References

  1. Iadanza, C.; Trigila, A.; Vittori, E.; Serva, L. Landslides in coastal areas of Italy. Geol. Soc. Spec. Publ. 2009, 322, 121–141. [Google Scholar] [CrossRef]
  2. Lazzari, M.; Gioia, D.; Anzidei, B. Landslide inventory of the Basilicata region (Southern Italy). J. Maps 2018, 14, 348–356. [Google Scholar] [CrossRef]
  3. Young, A.P.; Carilli, J.E. Global distribution of coastal cliffs. Earth Surf. Process. Landf. 2019, 44, 1309–1316. [Google Scholar] [CrossRef]
  4. Gornitz, V. Global coastal hazards from future sea level rise. Glob. Planet. Change 1991, 3, 379–398. [Google Scholar] [CrossRef]
  5. Dawson, R.J.; Dickson, M.E.; Nicholls, R.J.; Hall, J.W.; Walkden, M.J.A.; Stansby, P.K.; Mokrech, M.; Richards, J.; Zhou, J.; Milligan, J.; et al. Integrated analysis of risks of coastal flooding and cliff erosion under scenarios of long term change. Clim. Change 2009, 95, 249–288. [Google Scholar] [CrossRef]
  6. Brown, S.; Nicholls, R.J.; Hanson, S.; Brundrit, G.; Dearing, J.A.; Dickson, M.E.; Gallop, S.L.; Gao, S.; Haigh, I.D.; Hinkel, J.; et al. Shifting perspectives on coastal impacts and adaptation. Nat. Clim. Change 2014, 4, 752–755. [Google Scholar] [CrossRef]
  7. Allen; Barros, V.; Broome, J.; Cramer, W.; Christ, R.; Church, J.; Clarke, L.; Dahe, Q.; Dasgupta, P.; Dubash, N.; et al. Climate Change 2014: Synthesis Report; IPCC: Geneva, Szwitzerland, 2014. [Google Scholar]
  8. Cirillo, D.; Zappa, M.; Tangari, A.C.; Brozzetti, F.; Ietto, F. Rockfall Analysis from UAV-Based Photogrammetry and 3D Models of a Cliff Area. Drones 2024, 8, 31. [Google Scholar] [CrossRef]
  9. Cappadonia, C.; Cafiso, F.; Ferraro, R.; Martinello, C.; Rotigliano, E. Analysis of the Rockfall Phenomena Contributing to the Evolution of a Pocket Beach Area Using Traditional and Remotely Acquired Data (Lo Zingaro Nature Reserve, Southern Italy). Remote Sens. 2023, 15, 1401. [Google Scholar] [CrossRef]
  10. Pennetta, M.; Russo, E.L. Landslides in sea cliffs area along the Capri Coast (Gulf of Naples, Italy). In Proceedings of the Landslide Science and Practice: Complex Environment; Springer: Berlin/Heidelberg, Germany, 2013; pp. 119–127. [Google Scholar]
  11. Ferlisi, S.; Cascini, L.; Corominas, J.; Matano, F. Rockfall risk assessment to persons travelling in vehicles along a road: The case study of the Amalfi coastal road (southern Italy). Nat. Hazards 2012, 62, 691–721. [Google Scholar] [CrossRef]
  12. Prémaillon, M.; Regard, V.; Dewez, T.J.B.; Auda, Y. GlobR2C2 (Global Recession Rates of Coastal Cliffs): A global relational database to investigate coastal rocky cliff erosion rate variations. Earth Surf. Dynam. 2018, 6, 651–668. [Google Scholar] [CrossRef]
  13. Richards, K.; Lorriman, N. Basal erosion and mass movement. In Slope Stability: Geotechnical Engineering Geomorphology; Anderson, M.G., Richards, K.S., Eds.; John Wiley Sons: New York, NY, USA, 1987; pp. 331–357. [Google Scholar]
  14. Schiattarella, M.; Giannandrea, P.; Corrado, G.; Gioia, D. Landscape planning-addressed regional-scale mapping of geolithological units: An example from Southern Italy. J. Maps 2024, 20, 2303335. [Google Scholar] [CrossRef]
  15. Sunamura, T. Geomorphology of Rocky Coasts; Wiley: Hoboken, NJ, USA, 1992; Volume 3. [Google Scholar]
  16. Bray, M.J.; Hooke, J.M. Prediction of Soft-Cliff Retreat with Accelerating Sea-Level Rise. J. Coast. Res. 1997, 13, 453–467. [Google Scholar]
  17. Auflič, M.J.; Herrera, G.; Mateos, R.M.; Poyiadji, E.; Quental, L.; Severine, B.; Peternel, T.; Podolszki, L.; Calcaterra, S.; Kociu, A.; et al. Landslide monitoring techniques in the Geological Surveys of Europe. Landslides 2023, 20, 951–965. [Google Scholar] [CrossRef]
  18. Kovanič, Ľ.; Štroner, M.; Urban, R.; Blišťan, P. Methodology and Results of Staged UAS Photogrammetric Rockslide Monitoring in the Alpine Terrain in High Tatras, Slovakia, after the Hydrological Event in 2022. Land 2023, 12, 977. [Google Scholar] [CrossRef]
  19. Florkowska, L.; Bryt-Nitarska, I.; Gawałkiewicz, R.; Kruczkowski, J. Monitoring and assessing the dynamics of building deformation changes in landslide areas. Buildings 2020, 10, 3. [Google Scholar] [CrossRef]
  20. Sarro, R.; Riquelme, A.; García-Davalillo, J.C.; Mateos, R.M.; Tomás, R.; Pastor, J.L.; Cano, M.; Herrera, G. Rockfall simulation based on UAV photogrammetry data obtained during an emergency declaration: Application at a cultural heritage site. Remote Sens. 2018, 10, 1923. [Google Scholar] [CrossRef]
  21. Ullman, S. The Interpretation of Visual Motion; The MIT Press: Cambridge, MA, USA, 1979. [Google Scholar] [CrossRef]
  22. Abellan, A.; Derron, M.H.; Jaboyedoff, M. “Use of 3D point clouds in geohazards” special issue: Current challenges and future trends. Remote Sens. 2016, 8, 130. [Google Scholar] [CrossRef]
  23. James, M.R.; Robson, S. Straightforward reconstruction of 3D surfaces and topography with a camera: Accuracy and geoscience application. J. Geophys. Res. Earth Surf. 2012, 117, 03017. [Google Scholar] [CrossRef]
  24. Pineux, N.; Lisein, J.; Swerts, G.; Bielders, C.L.; Lejeune, P.; Colinet, G.; Degré, A. Can DEM time series produced by UAV be used to quantify diffuse erosion in an agricultural watershed? Geomorphology 2017, 280, 122–136. [Google Scholar] [CrossRef]
  25. Peter, K.D.; d’Oleire-Oltmanns, S.; Ries, J.B.; Marzolff, I.; Ait Hssaine, A. Soil erosion in gully catchments affected by land-levelling measures in the Souss Basin, Morocco, analysed by rainfall simulation and UAV remote sensing data. Catena 2014, 113, 24–40. [Google Scholar] [CrossRef]
  26. Salesa, D.; Minervino Amodio, A.; Rosskopf, C.M.; Garfì, V.; Terol, E.; Cerdà, A. Three topographical approaches to survey soil erosion on a mountain trail affected by a forest fire. Barranc de la Manesa, Llutxent, Eastern Iberian Peninsula. J. Environ. Manag. 2020, 264, 110491. [Google Scholar] [CrossRef] [PubMed]
  27. Gioia, D.; Amodio, A.M.; Maggio, A.; Sabia, C.A. Impact of land use changes on the erosion processes of a degraded rural landscape: An analysis based on high-resolution DEMs, historical images, and soil erosion models. Land 2021, 10, 673. [Google Scholar] [CrossRef]
  28. Özcan, O.; Akay, S.S. Modeling morphodynamic processes in meandering rivers with UAV-based measurements. In Proceedings of the International Geoscience and Remote Sensing Symposium (IGARSS), Valencia, Spain, 22–27 July 2018; pp. 7886–7889. [Google Scholar]
  29. Mancini, F.; Dubbini, M.; Gattelli, M.; Stecchi, F.; Fabbri, S.; Gabbianelli, G. Using unmanned aerial vehicles (UAV) for high-resolution reconstruction of topography: The structure from motion approach on coastal environments. Remote Sens. 2013, 5, 6880–6898. [Google Scholar] [CrossRef]
  30. Di Paola, G.; Minervino Amodio, A.; Dilauro, G.; Rodriguez, G.; Rosskopf, C.M. Shoreline Evolution and Erosion Vulnerability Assessment along the Central Adriatic Coast with the Contribution of UAV Beach Monitoring. Geosciences 2022, 12, 353. [Google Scholar] [CrossRef]
  31. Amodio, A.M.; Di Paola, G.; Rosskopf, C.M. Monitoring Coastal Vulnerability by Using DEMs Based on UAV Spatial Data. ISPRS Int. J. Geo-Inf. 2022, 11, 155. [Google Scholar] [CrossRef]
  32. Lazzari, M.; Gioia, D. UAV images and historical aerial-photos for geomorphological analysis and hillslope evolution of the Uggiano medieval archaeological site (Basilicata, southern Italy). Geomat. Nat. Hazards Risk 2017, 8, 104–119. [Google Scholar] [CrossRef]
  33. Gallo, I.G.; Martínez-Corbella, M.; Sarro, R.; Iovine, G.; López-Vinielles, J.; Hérnandez, M.; Robustelli, G.; Mateos, R.M.; García-Davalillo, J.C. An Integration of UAV-Based Photogrammetry and 3D Modelling for Rockfall Hazard Assessment: The Cárcavos Case in 2018 (Spain). Remote Sens. 2021, 13, 3450. [Google Scholar] [CrossRef]
  34. Al-Rawabdeh, A.; He, F.; Moussa, A.; El-Sheimy, N.; Habib, A. Using an Unmanned Aerial Vehicle-Based Digital Imaging System to Derive a 3D Point Cloud for Landslide Scarp Recognition. Remote Sens. 2016, 8, 95. [Google Scholar] [CrossRef]
  35. França Pereira, F.; Sussel Gonçalves Mendes, T.; Jorge Coelho Simões, S.; Roberto Magalhães de Andrade, M.; Luiz Lopes Reiss, M.; Fortes Cavalcante Renk, J.; Correia da Silva Santos, T. Comparison of LiDAR- and UAV-derived data for landslide susceptibility mapping using Random Forest algorithm. Landslides 2023, 20, 579–600. [Google Scholar] [CrossRef]
  36. Han, L.; Duan, P.; Liu, J.; Li, J. Research on Landslide Trace Recognition by Fusing UAV-Based LiDAR DEM Multi-Feature Information. Remote Sens. 2023, 15, 4755. [Google Scholar] [CrossRef]
  37. Jaboyedoff, M.; Derron, M.-H. Chapter 7—Landslide analysis using laser scanners. In Developments in Earth Surface Processes; Tarolli, P., Mudd, S.M., Eds.; Elsevier: Amsterdam, The Netherlands, 2020; Volume 23, pp. 207–230. [Google Scholar]
  38. Peng, D.; Xu, Q.; Liu, F.; He, Y.; Zhang, S.; Qi, X.; Zhao, K.; Zhang, X. Distribution and failure modes of the landslides in Heitai terrace, China. Eng. Geol. 2018, 236, 97–110. [Google Scholar] [CrossRef]
  39. Sun, J.; Yuan, G.; Song, L.; Zhang, H. Unmanned Aerial Vehicles (UAVs) in Landslide Investigation and Monitoring: A Review. Drones 2024, 8, 30. [Google Scholar] [CrossRef]
  40. Agüera-Vega, F.; Carvajal-Ramírez, F.; Martínez-Carricondo, P.; Sánchez-Hermosilla López, J.; Mesas-Carrascosa, F.J.; García-Ferrer, A.; Pérez-Porras, F.J. Reconstruction of extreme topography from UAV structure from motion photogrammetry. Measurement 2018, 121, 127–138. [Google Scholar] [CrossRef]
  41. Massaro, L.; Forte, G.; De Falco, M.; Rauseo, F.; Santo, A. Rockfall source identification and trajectory analysis from UAV-based data in volcano-tectonic areas: A case study from Ischia Island, Southern Italy. Bull. Eng. Geol. Environ. 2024, 83, 75. [Google Scholar] [CrossRef]
  42. Sturzenegger, M.; Keegan, T.; Wen, A.; Willms, D.; Stead, D.; Edwards, T. LiDAR and Discrete Fracture Network Modeling for Rockslide Characterization and Analysis. In Proceedings of the Engineering Geology for Society and Territory—Volume 6; Springer International Publishing: Cham, Switzerland, 2015; pp. 223–227. [Google Scholar]
  43. Xu, Q.; Ye, Z.; Liu, Q.; Dong, X.; Li, W.; Fang, S.; Guo, C. 3D Rock Structure Digital Characterization Using Airborne LiDAR and Unmanned Aerial Vehicle Techniques for Stability Analysis of a Blocky Rock Mass Slope. Remote Sens. 2022, 14, 3044. [Google Scholar] [CrossRef]
  44. Žabota, B.; Berger, F.; Kobal, M. The Potential of UAV-Acquired Photogrammetric and LiDAR-Point Clouds for Obtaining Rock Dimensions as Input Parameters for Modeling Rockfall Runout Zones. Drones 2023, 7, 104. [Google Scholar] [CrossRef]
  45. Baldo, M.; Bicocchi, C.; Chiocchini, U.; Giordan, D.; Lollino, G. LIDAR monitoring of mass wasting processes: The Radicofani landslide, Province of Siena, Central Italy. Geomorphology 2009, 105, 193–201. [Google Scholar] [CrossRef]
  46. Burns, W.J.; Coe, J.A.; Kaya, B.S.; Ma, L. Analysis of Elevation Changes Detected from Multi-Temporal LiDAR Surveys in Forested Landslide Terrain in Western Oregon. Environ. Eng. Geosci. 2010, 16, 315–341. [Google Scholar] [CrossRef]
  47. Gatter, R.; Cavalli, M.; Crema, S.; Bossi, G. Modelling the dynamics of a large rock landslide in the Dolomites (eastern Italian Alps) using multi-temporal DEMs. PeerJ 2018, 2018, e5903. [Google Scholar] [CrossRef]
  48. Iannace, A.; Vitale, S.; D’Errico, M.; Mazzoli, S.; Staso, A.; Macaione, E.; Messina, A.; Reddy, S.; Zamparelli, V.; Zattin, M.; et al. The carbonate tectonic units of northern Calabria (Italy): A record of Apulian palaeomargin evolution and Miocene convergence, continental crust subduction and exhumation of HP-LT rocks. J. Geol. Soc. 2007, 164, 1165–1186. [Google Scholar] [CrossRef]
  49. Patacca, E.; Scandone, P. Late thrust propagation and sedimentary response in the thrust-belt—Foredeep system of the Southern Apennines (Pliocene-Pleistocene). In Anatomy of an Orogen: The Apennines and Adjacent Mediterranean Basins; Vai, G.B., Martini, I.P., Eds.; Springer: Dordrecht, The Netherlands, 2001; pp. 401–440. [Google Scholar] [CrossRef]
  50. Faccenna, C.; Becker, T.W.; Lucente, F.P.; Jolivet, L.; Rossetti, F. History of subduction and back arc extension in the Central Mediterranean. Geophys. J. Int. 2001, 145, 809–820. [Google Scholar] [CrossRef]
  51. Caiazzo, C.; Ascione, A.; Cinque, A. Late Tertiary–Quaternary tectonics of the Southern Apennines (Italy): New evidences from the Tyrrhenian slope. Tectonophysics 2006, 421, 23–51. [Google Scholar] [CrossRef]
  52. Brancaccio, L.; Cinque, A.; Romano, P.; Rosskopf, C.; Russo, F.; Santangelo, N.; Santo, A. Geomorphology and neotectonic evolution of a sector of the Tyrrhenian flank of the Southern Apennines (Region of Naples, Italy). Z. Für Geomorphol. 1991, 82, 47–58. [Google Scholar]
  53. Aiello, G.; Amato, V.; Aucelli, P.P.C.; Barra, D.; Corrado, G.; Di Leo, P.; Di Lorenzo, H.; Jicha, B.; Pappone, G.; Parisi, R.; et al. Multiproxy study of cores from the Garigliano Plain: An insight into the Late Quaternary coastal evolution of Central-Southern Italy. Palaeogeogr. Palaeoclimatol. Palaeoecol. 2021, 567, 110298. [Google Scholar] [CrossRef]
  54. Amato, V.; Aucelli, P.P.C.; Corrado, G.; Di Paola, G.; Matano, F.; Pappone, G.; Schiattarella, M. Comparing geological and Persistent Scatterer Interferometry data of the Sele River coastal plain, southern Italy: Implications for recent subsidence trends. Geomorphology 2020, 351, 106953. [Google Scholar] [CrossRef]
  55. Corrado, G.; Amodio, S.; Aucelli, P.P.C.; Incontri, P.; Pappone, G.; Schiattarella, M. Late Quaternary geology and morphoevolution of the Volturno coastal plain, southern Italy. Alp. Mediterr. Quat. 2018, 31, 23–26. [Google Scholar]
  56. Filocamo, F.; Romano, P.; Di Donato, V.; Esposito, P.; Mattei, M.; Porreca, M.; Robustelli, G.; Russo Ermolli, E. Geomorphology and tectonics of uplifted coasts: New chronostratigraphical constraints for the Quaternary evolution of Tyrrhenian North Calabria (southern Italy). Geomorphology 2009, 105, 334–354. [Google Scholar] [CrossRef]
  57. Ferranti, L.; Antonioli, F.; Mauz, B.; Amorosi, A.; Dai Pra, G.; Mastronuzzi, G.; Monaco, C.; Orrù, P.; Pappalardo, M.; Radtke, U.; et al. Markers of the last interglacial sea-level high stand along the coast of Italy: Tectonic implications. Quat. Int. 2006, 145–146, 30–54. [Google Scholar] [CrossRef]
  58. Santoro, E.; Mazzella, M.E.; Ferranti, L.; Randisi, A.; Napolitano, E.; Rittner, S.; Radtke, U. Raised coastal terraces along the Ionian Sea coast of northern Calabria, Italy, suggest space and time variability of tectonic uplift rates. Quat. Int. 2009, 206, 78–101. [Google Scholar] [CrossRef]
  59. Caputo, R.; Bianca, M.; D’Onofrio, R. Ionian marine terraces of southern Italy: Insights into the Quaternary tectonic evolution of the area. Tectonics 2010, 29, TC4005. [Google Scholar] [CrossRef]
  60. Cerrone, C.; Di Donato, V.; Mazzoli, S.; Robustelli, G.; Soligo, M.; Tuccimei, P.; Ascione, A. Development and deformation of marine terraces: Constraints to the evolution of the Campania Plain Quaternary coastal basin (Italy). Geomorphology 2021, 385, 107725. [Google Scholar] [CrossRef]
  61. Lucà, F.; Brogno, A.; Tripodi, V.; Robustelli, G. Terrace Morpho-Sedimentary Sequences on the Sibari Plain (Calabria, Southern Italy): Implication for Sea Level and Tectonic Controls. Geosciences 2022, 12, 211. [Google Scholar] [CrossRef]
  62. Gioia, D.; Corrado, G.; Minervino Amodio, A.; Schiattarella, M. Uplift rate calculation based on the comparison between marine terrace data and river profile analysis: A morphotectonic insight from the Ionian coastal belt of Basilicata, Italy. Geomorphology 2024, 447, 109030. [Google Scholar] [CrossRef]
  63. Ascione, A.; Cinque, A. Fault scarps in the southern apennines: Origin, age and tectonic significance. Alp. Mediterr. Quat. 1997, 10, 285–291. [Google Scholar]
  64. Cerrone, C.; Ascione, A.; Robustelli, G.; Tuccimei, P.; Soligo, M.; Balassone, G.; Mormone, A. Late Quaternary uplift and sea level fluctuations along the Tyrrhenian margin of Basilicata—Northern Calabria (southern Italy): New constraints from raised paleoshorelines. Geomorphology 2021, 395, 107978. [Google Scholar] [CrossRef]
  65. Mattei, G.; Caporizzo, C.; Corrado, G.; Vacchi, M.; Stocchi, P.; Pappone, G.; Schiattarella, M.; Aucelli, P.P.C. On the influence of vertical ground movements on Late-Quaternary sea-level records. A comprehensive assessment along the mid-Tyrrhenian coast of Italy (Mediterranean Sea). Quat. Sci. Rev. 2022, 279, 107384. [Google Scholar] [CrossRef]
  66. Kirkby, M.J. A Model for the Evolution of Regolith-Mantled Slope. In Models in Geomorphology; Woldenberg, M.D., Ed.; George Allen and Unwin: Crows Nest, Australia, 1985; pp. 213–237. [Google Scholar]
  67. Selby, M.J. Hillslope Materials and Processes; Oxford University Press: Oxford, UK, 1993; p. 466. [Google Scholar]
  68. Dewez, T.J.B.; Girardeau-Montaut, D.; Allanic, C.; Rohmer, J. FACETS: A cloudcompare plugin to extract geological planes from unstructured 3d point clouds. Int. Arch. Photogramm. Remote Sens. Spat. Inf. Sci. 2016, XLI-B5, 799–804. [Google Scholar] [CrossRef]
  69. Monsalve, J.J.; Pfreundschuh, A.; Soni, A.; Ripepi, N. Automated Discontinuity Extraction Software Versus Manual Virtual Discontinuity Mapping: Performance Evaluation in Rock Mass Characterization and Rockfall Hazard Identification. Min. Metall. Explor. 2021, 38, 1383–1394. [Google Scholar] [CrossRef]
  70. Verrucci, L.; Forte, G.; De Falco, M.; Tommasi, P.; Lanzo, G.; Franke, K.W.; Santo, A. Instantaneous limit equilibrium back analyses of major rockslides triggered during the 2016–2017 central Italy seismic sequence. Nat. Hazards Earth Syst. Sci. 2023, 23, 1177–1190. [Google Scholar] [CrossRef]
  71. Schilirò, L.; Massaro, L.; Forte, G.; Santo, A.; Tommasi, P. Analysis of Earthquake-Triggered Landslides through an Integrated Unmanned Aerial Vehicle-Based Approach: A Case Study from Central Italy. Remote Sens. 2024, 16, 93. [Google Scholar] [CrossRef]
  72. Wheaton, J.M.; Brasington, J.; Darby, S.E.; Sear, D.A. Accounting for uncertainty in DEMs from repeat topographic surveys: Improved sediment budgets. Earth Surf. Process. Landf. 2010, 35, 136–156. [Google Scholar] [CrossRef]
  73. Angeli, M.-G.; Pasuto, A.; Silvano, S. A critical review of landslide monitoring experiences. Eng. Geol. 2000, 55, 133–147. [Google Scholar] [CrossRef]
  74. Stead, D.; Eberhardt, E.; Coggan, J.S. Developments in the characterization of complex rock slope deformation and failure using numerical modelling techniques. Eng. Geol. 2006, 83, 217–235. [Google Scholar] [CrossRef]
  75. Rosser, N.; Lim, M.; Petley, D.; Dunning, S.; Allison, R. Patterns of precursory rockfall prior to slope failure. J. Geophys. Res. Earth Surf. 2007, 112, F04014. [Google Scholar] [CrossRef]
  76. Nishii, R.; Matsuoka, N. Monitoring rapid head scarp movement in an alpine rockslide. Eng. Geol. 2010, 115, 49–57. [Google Scholar] [CrossRef]
  77. Donati, D.; Stead, D.; Borgatti, L. The Importance of Rock Mass Damage in the Kinematics of Landslides. Geosciences 2023, 13, 52. [Google Scholar] [CrossRef]
  78. Niazi, F.; Llamas, A.; Fekadu, F. Impact of Chemical Weathering on Microstructures and Mechanical Properties of Karstic Limestone. Géotech. Lett. 2021, 11, 281–293. [Google Scholar] [CrossRef]
  79. Chowdhury, R.; Flentje, P.; Bhattacharya, G. Geotechnical Slope Analysis; CRC Press: Boca Raton, FL, USA, 2010. [Google Scholar] [CrossRef]
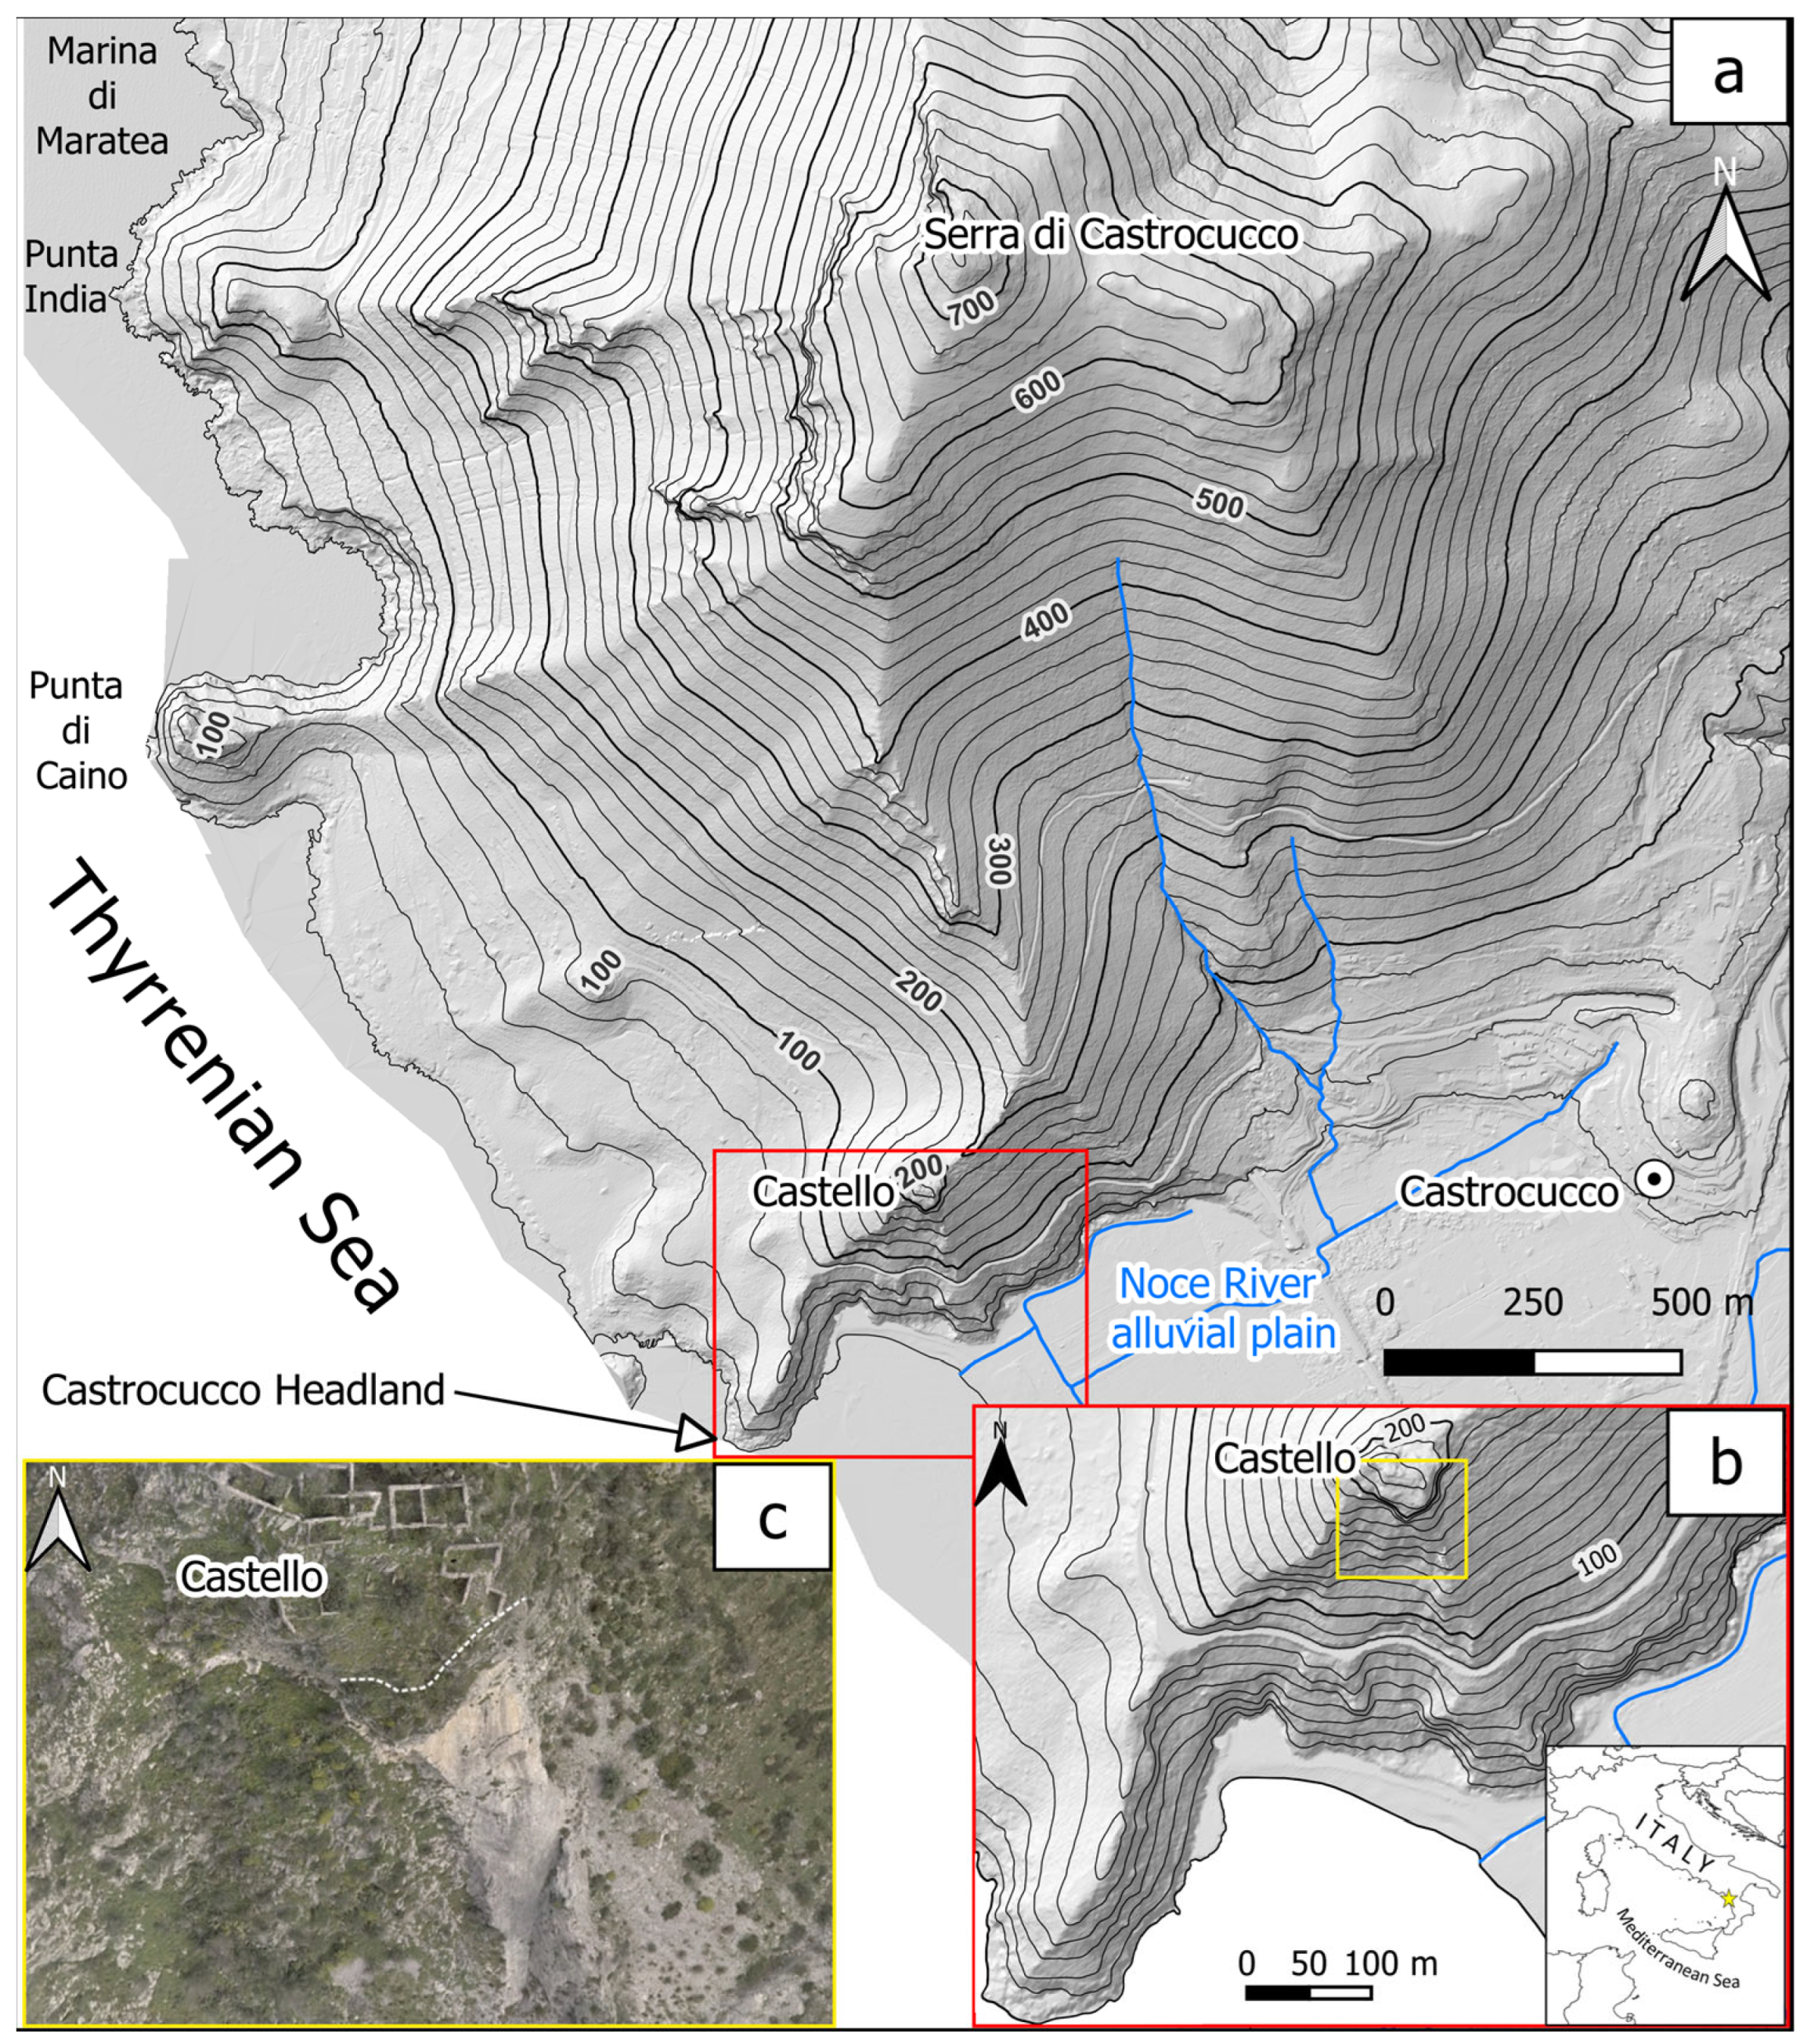
Figure 1. (a) Hillshade and 20 m contour map of the Serra di Castrocucco ridge and (b) close-up map of the Castrocucco headland with 10 m contour lines. (c) The white dashed line highlights the landslide scar on a pre-2022 orthophoto (2018).
Remotesensing 16 02235 g001
Figure 2. (a) Overview of the Castrocucco landslide that, on 30 November 2022, hit the State Road SS18 (b,c) https://www.lecronachelucane.it/2022/12/03/frana-in-castrocucco-di-maratea-il-fate-presto-non-esiste-poiche-e-vasta-larea-con-predisposizione-alla-instabilita/, accessed on 3 December 2022), one of the main roads leading to the tourist town of Maratea, causing its 8-month closure.
Remotesensing 16 02235 g002
Figure 3. Record of daily and cumulative rainfall from “Castrocucco” pluviometer station (111 m s.l.m., about 7 km north of the landslide site), provided by the Civil Protection of Basilicata Region.
Remotesensing 16 02235 g003
Figure 4. Acquisition, processing and output flowchart.
Remotesensing 16 02235 g004
Figure 5. Outlines of the dataset coverage (a). Flight plan in figures (b,c) refers to 2018 and 2022 surveys, respectively.
Remotesensing 16 02235 g005
Figure 6. D13 classified point cloud.
Remotesensing 16 02235 g006
Figure 7. Shaded relief, topography (a), ortophoto from D18 point cloud (b square in a), and view from the SSE (c) of the main morphological features of the landslide area; close-up views of ortophoto from D18 (d) and D22 (e) point clouds showing the area (red circles) affected by the movement of a wedge-shaped area bounded by N50 and N90 discontinuities (white dashed lines in (d)) which promote the later failure of the main block; (f,g) views from the SS18 State Road of N50 and N90 discontinuities affecting the westernmost sector of the cliff edge prior the 30 November 2022 event.
Remotesensing 16 02235 g007
Figure 8. Kinematic analysis for the main block sliding. The discontinuity pattern was extracted by the D18 point cloud using the Cloud Compare 2.13 software. Parameters: Slope dip: 45°; Slope Dip Direction: 195; Friction Angle: 30°. The orange area highlights the critical zone, where the intersections of the two sets of discontinuities (fault planes and joints) have the potential for planar and wedge-type failure. The plot suggests a SW orientation of the direction of sliding.
Remotesensing 16 02235 g008
Figure 9. Maratea rockslide: (a) ortophoto (from D22 point cloud), with the red arrow indicating later debris/earth flow events, and (b) DoD volume difference obtained between 2022 and 2013.
Remotesensing 16 02235 g009
Figure 10. DoD between D22 and D18.
Remotesensing 16 02235 g010
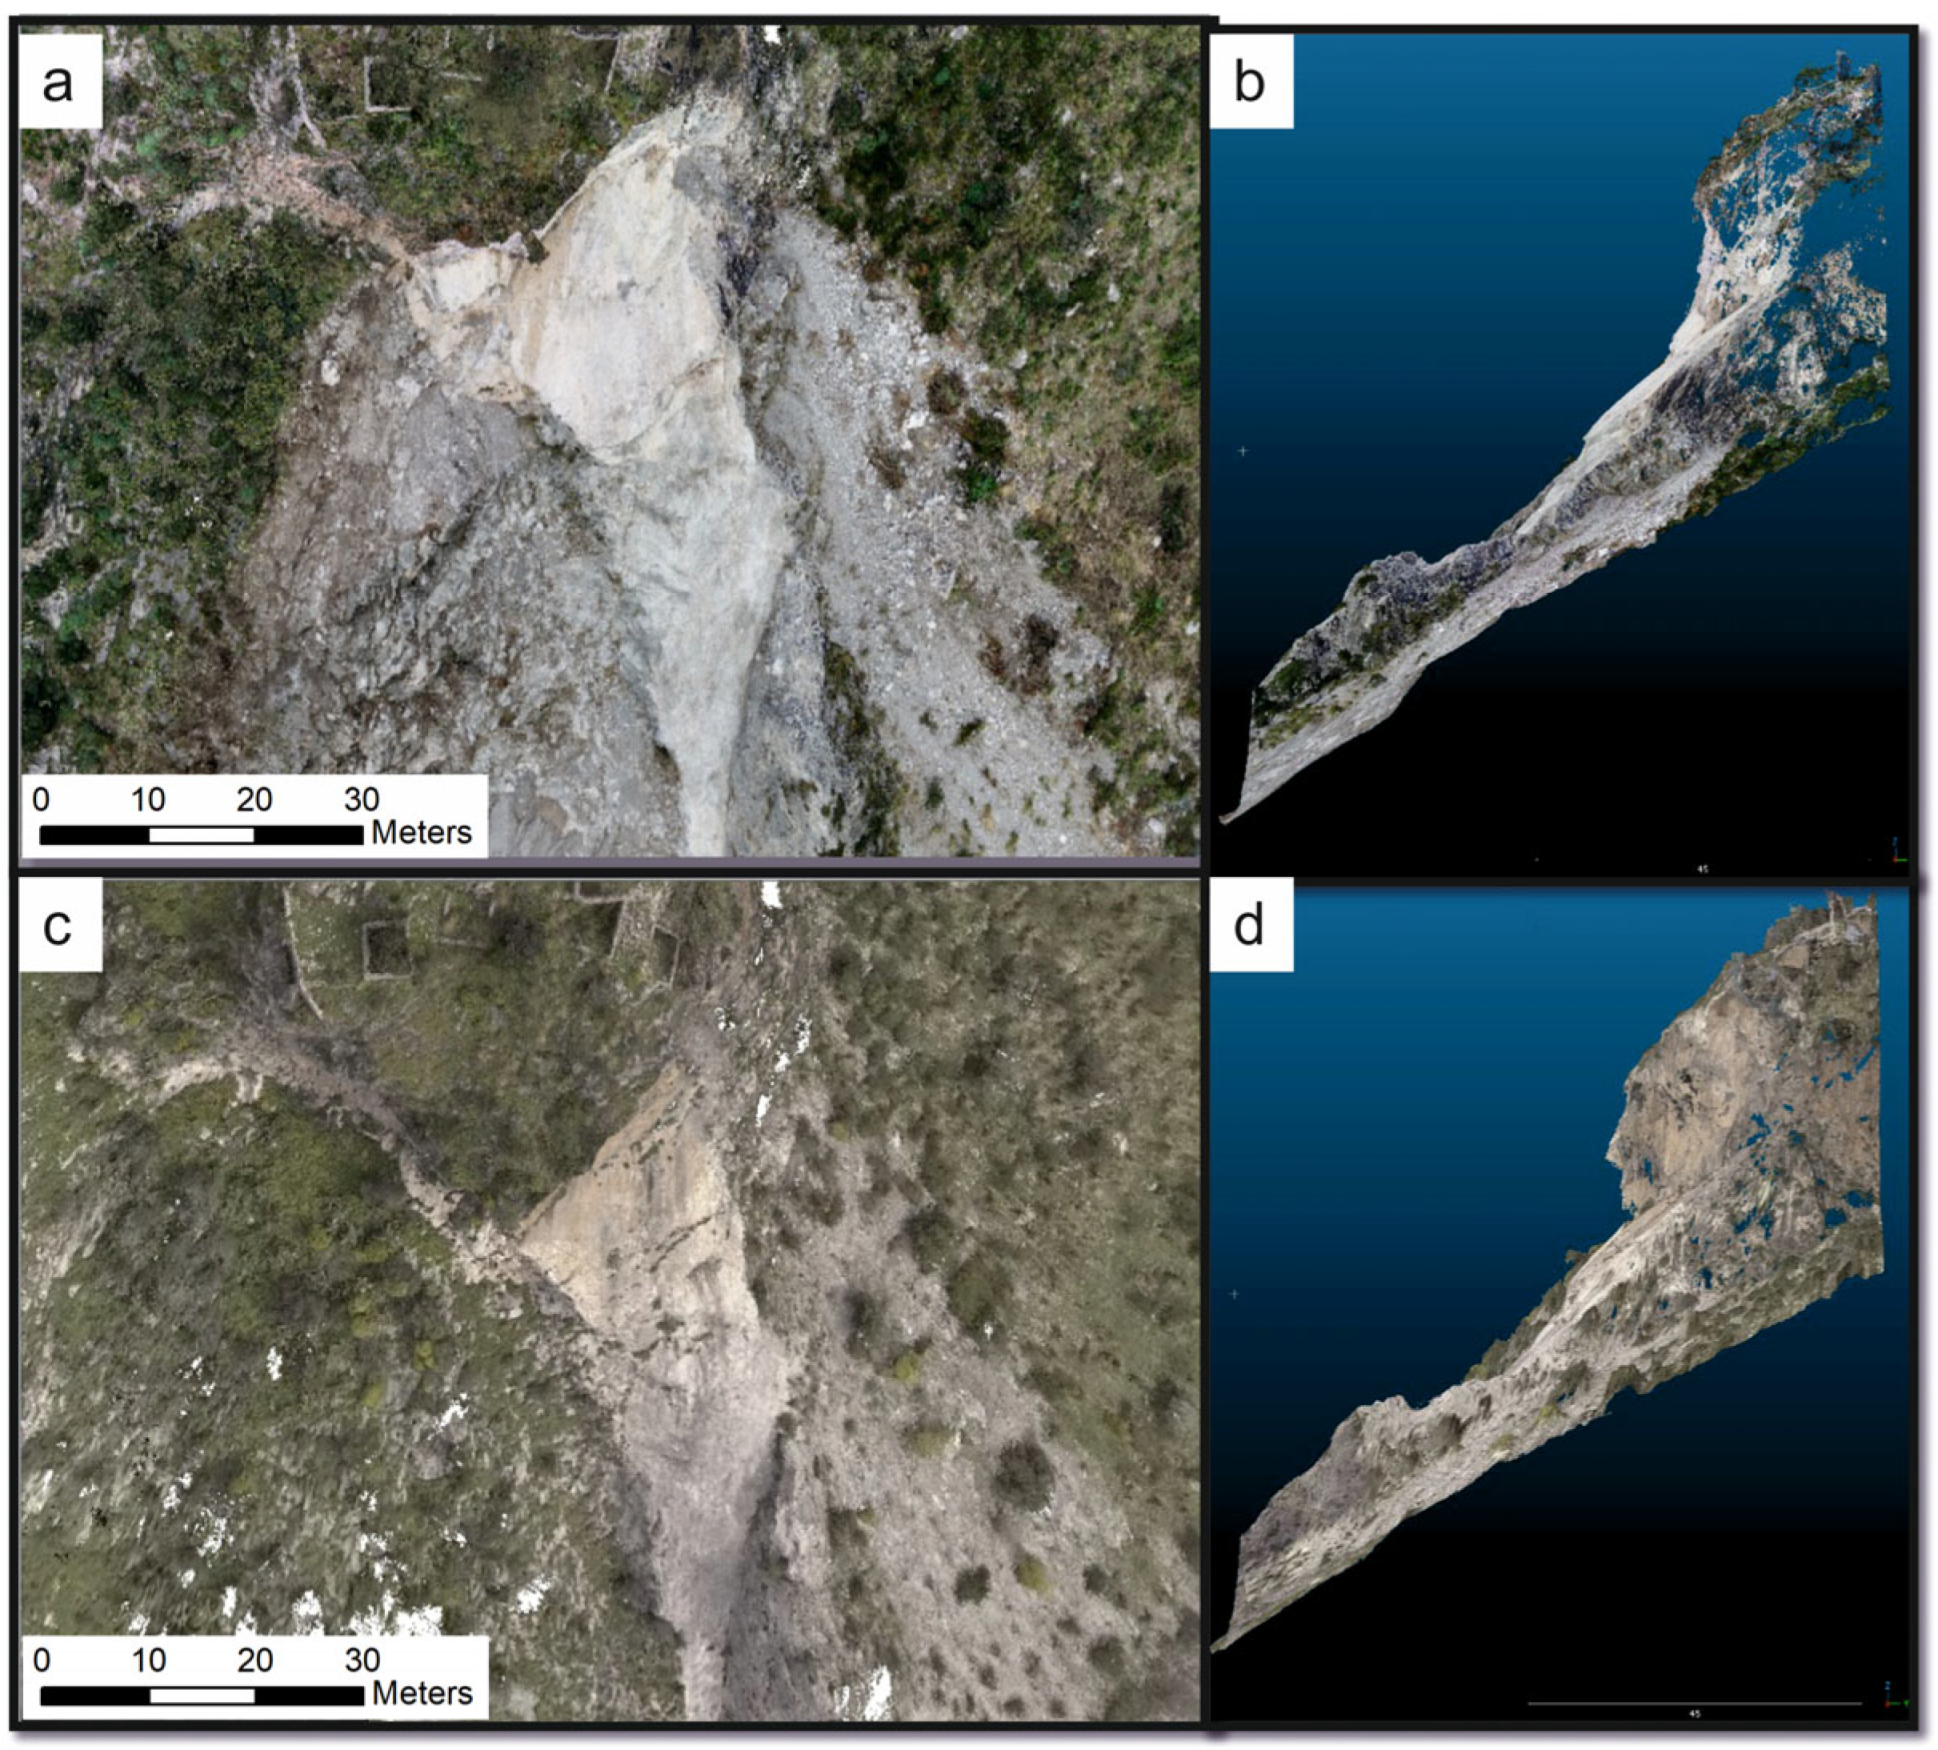
Figure 11. Comparison between D22 (a,b) and D18 (c,d) models.
Remotesensing 16 02235 g011
Table 1. Dataset.
Table 1. Dataset.
DatasetDate of
Acquisition
Point Number
for m2
Abbreviation
for the Text
LiDAR dataset201312D13
UAV 20182018117D18
UAV 20222022152D22
Table 2. DoD analysis derived from D22 and D13 datasets.
AttributeRawThresholderError Volume% Error
AREA
Total Area of Surface Lowering (m2)17,019.3015,633.26
Total Area of Surface Raising (m2)11,147.109837.15
Total Area of Detectable Change (m2)NA25,470.44
Total Area of Interest (m2)28,166.4NA
Percent of Area of Interest with Detectable ChangeNA90.43%
VOLUMETRIC
Total Volume of Surface Lowering (m3)32,652.4532,512.48±3126.669.62%
Total Volume of Surface Raising (m3)15,013.6814,889.14±1967.4313.21%
Total Volume of Difference (m3)47,666.1347,401.63±5094.0910.75%
Total Net Volume Difference (m3)−17,638.76−17,623.34±3694.15−20.96%
Table 3. DoD analysis derived from D22 and D18 datasets.
AttributeRawThresholderError Volume% Error
AREA
Total Area of Surface Lowering (m2)2323.522116.04
Total Area of Surface Raising (m2)690.38462.19
Total Area of Detectable Change (m2)NA2578.23
Total Area of Interest (m2)3013.90NA
Percent of Area of Interest with Detectable ChangeNA85.40%
VOLUMETRIC
Total Volume of Surface Lowering (m3)7652.017630.22±423.215.55%
Total Volume of Surface Raising (m3)394.39371.49±92.4424.88%
Total Volume of Difference (m3)8046.48001.71±515.656.44%
Total Net Volume Difference (m3)−7257.62−7258.73±433.19−5.97%
Disclaimer/Publisher’s Note: The statements, opinions and data contained in all publications are solely those of the individual author(s) and contributor(s) and not of MDPI and/or the editor(s). MDPI and/or the editor(s) disclaim responsibility for any injury to people or property resulting from any ideas, methods, instructions or products referred to in the content.