Abstract
Currently, the global shift towards green energy is at the forefront of efforts introducing a new era, thus rendering exploration for critical raw materials essential. To this purpose, the utilization of advanced machine learning methods in remote sensing has emerged as a rapid and cost-effective approach. This study proposes a new methodology, utilizing Sentinel-2 satellite data, to distinguish ferronickel (Fe-Ni-) laterite from bauxite across pre-mining, mining, and post-mining occurrences worldwide. Both ores contain mineral raw materials such as nickel, iron, cobalt, and alumina and their discrimination is generally macroscopically challenging, especially when their locations are often in geographical proximity. The proposed method is based on Support Vector Machines (SVM) classification using spectral signatures of known Fe-Ni-laterite and bauxite-bearing pixels in Greece, Cuba, and Jamaica. The highest classification accuracies are obtained by combining b12 with b6 or b7 spectral bands. Comparisons with specific ore mineralogies show that b6 and b7 are strongly linked to the ferric phase, while b12 is mainly associated with the argillic mineralogies, the latter probably being the key discriminating factor between the two ores. From laboratory chemical analyses, we also establish that b12 and b6 or b7 are strongly associated with Al2O3 and Fe2O3 content correspondingly. The proposed method is accurate, it has reduced prospection costs, and it can facilitate the initial screening of broad areas by automatically characterizing whether an ore is bauxite or Fe-Ni-laterite. This underscores the methodology’s significance in ore differentiation and exploration within the context of green energy endeavors.
Keywords:
Fe-Ni-laterite; bauxite; linear SVM classification; Sentinel-2; outcrop; open-pit; stockpile; ores 1. Introduction
Raw materials, both metals and minerals, are considered essential for the energy transition and for economic development and growth. Despite the current obstacles in their exploitation, their increasing demand is particularly important for the development of modern environmentally friendly technologies, such as renewable energy sources, which require larger quantities of mineral resources than traditional energy production from fuels [1]. Therefore, there is an urgent need to identify and exploit primary and secondary deposits (from landfills, depleted ore deposits, etc.) [2,3,4]. The list of critical raw materials, published in 2023, includes aluminum and bauxite (combined for consistency), gallium, cobalt, and nickel [5]. Nickel has been added to the list as a strategic raw material in accordance with the Collecting Societies Act [5,6,7].
Bauxites are residual formations formed in tropical or subtropical climates by the weathering of aluminosilicate-rich, iron-poor, and generally quartz-free rocks [8]. These rocks consist mainly of the alumina hydrates minerals gibbsite, boehmite, and diaspore, mixed with goethite and hematite, kaolinite, and small amounts of anatase or rutile and ilmenite. Besides aluminum production, bauxite mining is the main source of gallium, which is necessary for the electronics, infrared circuit, and diode laser industries. On the other hand, Fe-Ni-laterites are also products of intense weathering of ultramafic rocks, showing strong enrichment in Fe2O3, Ni, and Co and exhibiting depletion in SiO2. They are mainly composed of goethite, hematite, serpentine, chlorite, smectite, talc, and quartz. The mining of Fe-Ni-laterite is the most important source of ferronickel and the second most important source of Ni and Co, which are two of the twelve metals required to produce lithium-ion batteries. In addition, cobalt is used to produce magnetic, wear-resistant, and high-strength alloys.
During recent decades, geologic remote sensing has become an important tool for mineral exploration, ore identification, mapping, and the continuous monitoring of mining operations [9,10,11,12,13,14].
The introduction of the MultiSpectral Instrument (MSI) aboard the ESA’s twin Sentinel-2 missions in 2015 and 2017, acquiring information in 13 spectral bands in the Visible–Near-Infrared (VNIR) and Shortwave Infrared (SWIR) part of the electromagnetic spectrum, has added significant new capabilities in terms of repeat time, spatial resolution, and spectral information compared to the previous ASTER and Landsat series [10,15,16]. For example, Sentinel-2 provides nine spectral bands in the VNIR, while ASTER has three and Landsat has five VNIR spectral bands. This provides important additional information for searching for iron-bearing minerals [15,16,17,18,19,20,21,22].
Machine learning (ML) is rapidly gaining ground in lithology and mineral identification [9,10,11,15,18,23,24,25,26,27,28]. In particular, the Support Vector Machine (SVM) classification method has been applied to ASTER data for the prediction of gold ore deposits [29,30], for lithological discriminations, and for rock and mineral alteration mapping. Several studies also combine satellite data such as ASTER or Landsat 8 OLI [9] with other in situ measurements, such as chemical and geophysical analyses, for mineralization detection, alteration mapping, or the enhancement of existing geologic maps.
In particular, concerning Fe-Ni-laterite and/or bauxite detection and characterization, several processing techniques have been proposed using Earth Observation (EO) data, such as band ratios (BRs), Principal Component Analysis (PCA) applied to ASTER and Sentinel-2 data [31,32,33], sub-pixel-based classification techniques on hyperspectral data such as Linear Spectral Unmixing (LSU) [32,34], and various regression methods on Sentinel-2 data [21,35,36]. Other studies have focused on the use of reflectance spectroscopy techniques and Spectral Indices in order to recognize general categories of Fe-Ni-laterite or bauxite-related mineral assemblages, such as iron-bearing minerals and/or iron oxides [19,21,22].
However, the distinction between Fe-Ni-laterite and bauxite ores using remote sensing techniques is a challenging task and, to our knowledge, until now it has been relatively poorly studied. The main methods proposed in the literature are BRs, LSU, or classification applied to Sentinel-2, ASTER and Hyperion data [31,32,34,37].
The aim of this study is to propose a novel methodology that effectively discriminates Fe-Ni-laterites from bauxites across three different distinct occurrences on the Earth’s surface: outcrops, open-pit mines, and stockpiles, using cost-free Sentinel-2 satellite data. This discrimination is achieved by employing a linear SVM classifier designed for utilizing both Sentinel-2 VNIR and SWIR spectral bands. The results are combined with in situ and laboratory investigations (mineralogical and chemical analyses) in order to establish spectral band relations to specific mineralogical and chemical compositions of the two ores.
The deployment of the proposed innovative approach during the phase of the first screening of broad areas may effectively allow the detection and characterization of an ore, whether this is a bauxite or a Fe-Ni-laterite deposit (exhibiting similar characteristics) by exploiting the significant advantages offered by satellite imaging, such as the wide spatial coverage and the spectral information provided beyond the capabilities of the human eye (e.g., NIR/SWIR wavelengths). This initial screening may lead to a first sorting of broad areas of interest (as is conducted by conventional methods, such as geophysical prospection) to be potential bauxite ore or Fe-Ni-laterite ore, before conducting thorough fieldwork, sampling, mineralogical, and chemical analyses in the laboratory. Consequently, the proposed method contributes to reducing prospection costs, fieldwork expenses, capex, etc. Furthermore, the proposed approach may be used for monitoring excavation activities in open-pit mines.
The novelty of this study lies in (i) the use of Sentinel-2 data; (ii) the proposed methodology; (iii) the fact that this study is conducted on three different ore occurrences worldwide, namely pre-mining, mining, and post-mining; and (iv) the establishment of relations between specific Sentinel-2 spectral bands with mineral and chemical compositions.
2. Materials and Methods
2.1. Site Description
This study focuses on the differentiation of Fe-Ni-laterites from bauxites during pre-mining (outcrops), mining (open-pit mines), and post-mining (stockpiles) stages (Table 1). The studied sites were chosen from different geographic locations and geological frameworks without introducing any selection preference error. The only conditions in the selection were (a) the satellite data availability, (b) the lack of vegetation cover within pixels where the ore exists (classic objective difficulties in any geological remote sensing applications), and (c) the knowledge of the existence of the ore within a pixel in order to implement the method (which is often extremely difficult, especially in the case of locating outcrops). The Fe-Ni-laterite and bauxite outcrop sites considered are located in Central Greece (Mt Pateras) for bauxite and in Cuba (Moa Bay) for Fe-Ni-laterite (Figure 1g and Figure 2b, respectively, and Figure S1g and Figure S2b, respectively). The open-pit Fe-Ni-laterite mine sites (Tsouka, Nisi, Kopaida) as well as the bauxite site (Patitira) are located in Central Greece (Figure 1e,f and Figure S1e,f). An additional open-pit bauxite mine is located in Cuba (Moa Bay) (Figure 2b and Figure S2b). Finally, the stockpiles of Fe-Ni-laterite mining concentrates are in Central Greece (Triveio grinding plant) (Figure 1f and Figure S1f), while the bauxite stockpiles are located in Central Greece (Stylida, Itea) (Figure 1d–h and Figure S1d–h) and in Jamaica (Figure 2c and Figure S2c–e).

Table 1.
Sites (with their corresponding abbreviated names used in the text) and types of occurrences of the studied ores. Their locations are presented in Figure 1, Figure 2, Figures S1 and S2.
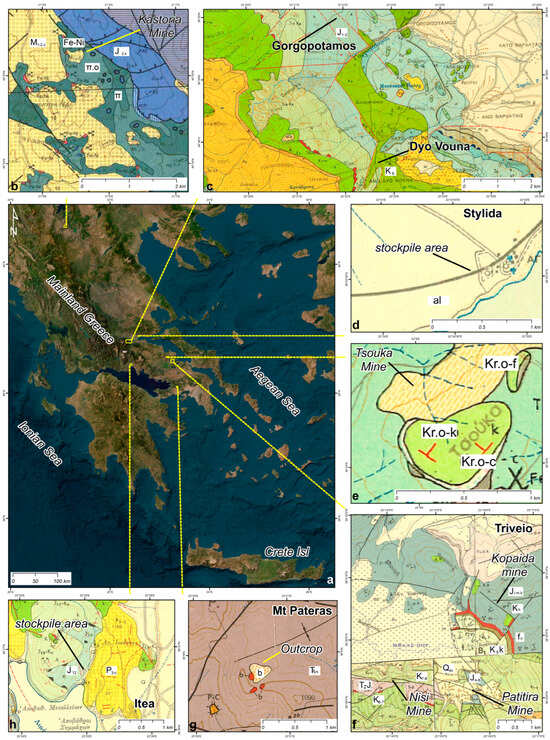
Figure 1.
Location of the studied ore occurrences in Greece and relative geologic map extracts. (a) Site locations in Greece (yellow squares); (b) Kastoria open-pit mine; (c) Gorgopotamos and Dyo-Vouna open-pit mines; (d) Stylida stockpiles, (e) Tsouka Fe-Ni-laterite open-pit mine; (f) Nisi and Kopaida Fe-Ni-laterite open-pit mines, Patitira bauxite open-pit mine and Triveio Fe-Ni-laterite grinding plant; (g) Mt Pateras bauxite outcrop; (h) Itea stockpile area. For each sub-image, the background image corresponds to the extract of the geological map of the area; in (b): M1-2.c: molassic conglomerates, π and π.o: peridotites–ophiolites, Fe-Ni: Fe-Ni-laterite deposits, J2-cih: Jurassic limestones; in (c) J1-2: Late Jurassic limestones, K6: Late Cretaceous limestones; in (d): al: alluvia; in (e): Kr.o-c: Late Cretaceous conglomerates, Kr.o-f: Late Cretaceous flysch, Kr.o-k: Late Cretaceous limestones; in (f): Ji-m.k: Early Jurassic limestones, Kh: Cretaceous silica limestones, fn: Fe-Ni-laterite deposits, K6-k: Late Cretaceous limestones, K7-8: Late Cretaceous limestones; Ts-Ji: Triassic limestones and dolomites, J4-8: Late Jurassic limestones, K6-7: Late Cretaceous limestones, Qsc: Quaternary scree; in (g): Trm: Late Triassic limestones and dolomites, b: bauxite outcrop; and in (h): J12: Late Jurassic limestones, P3-c: alluvia.
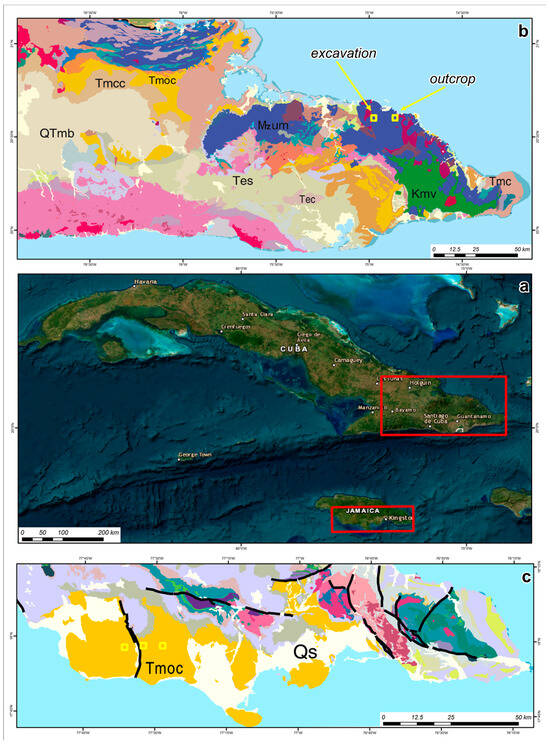
Figure 2.
Location of the studied ore occurrences in Cuba and Jamaica and relative geologic maps. (a) Site locations (red squares); (b) open-pit mines and outcrops in Moa Bay (Cuba); (c) bauxite stockpiles in Jamaica (Jam1, Jam2, and Jam3 in yellow squares). For each sub-image (b,c), the background image corresponds to the extract of the geologic maps of the areas (modified by [38,39]): Tmcc: Tertiary–Miocene mixed clastic and carbonate rocks, Tmc: Tertiary–Miocene limestone, mark, and calcarenite, Tmoc: Tertiary–Upper Oligocene limestone and marl, Tec: Tertiary–Eocene limestone containing igneous debris, Tes: Tertiary–Eocene mixed clastic and lesser carbonate rocks, Qs: Quaternary undifferentiated surficial deposits, QTmb: Quaternary–Pliocene artificial fill deposits, Kmv: Early Cretaceous metavolcanic and metavolcanic clastic rocks, and Mzum: Mesozoic or older ultramafic rocks.
Finally, three additional sites in Greece are used for the validation of the proposed methodology, namely the “Kastoria” Fe-Ni-laterite open-pit mine in Northern Greece and the “Dyo-Vouna” and “Gorgopotamos” bauxite mines in Central Greece (Figure 1b,c and Figure S1b,c).
2.1.1. Ore geology and Ore Beneficiation Plants
- 1.
- Fe-Ni-laterites
The Fe-Ni-laterite deposits in Central Greece are located within “the Sub-pelagonian” or the “Eastern Greece tectono-metamorphic” unit [40]. The main characteristics of the unit are the segments of a Triassic ophiolite suite and a Cretaceous flint formation aged just before the Cenomanian transgression sediments that overlay the Fe-Ni-laterite ores. The Fe-Ni-mineralization is considered to be related with the weathering of the ultramafic lithologies of that ophiolite segments [41,42,43,44,45,46,47,48]. The specific characteristics of each study area in Central Greece are described here below.
The Tsouka deposit (Figure 1e and Figure S1d) is developed on serpentinized ultramafic ophiolites of the sub-pelagonian zone [40]. The deposit is overlain by yellowish thin limestones, marly limestones with roudists and clay intercalations of Cenomanian age. Usually, the upper part of the deposit is pisolitic whilst the lower is massive. Nickel content increases from the top strata towards the bottom ones while iron content increases towards the top. At the lowest part of the formation, a silcrete horizon of variable thickness and extent is observed [45,48,49].
The Nisi deposit (Figure 1f and Figure S1f) is developed on karstified dolomitic limestones. It is overlain by yellow-to-black, thin-to-medium-bedded, marly limestones with clay layers of Cenomanian age. At the upper part, the Fe-Ni-laterite may coexist with a bauxite layer which, at present, has been mined [42,43,44,45,47,48,50].
The Kopaida deposit (Figure 1f) is located within the Kopaida basin (Figure S1f). In the southeast part of the basin, most of the Fe-Ni-laterite deposit lies within the basin and only a small part extends to its eastern fringes. Upper Cretaceous limestones are widespread in the area and conformably overlie the ferronickel deposits, which, in turn, lie unconformably on Upper Triassic–Lower Jurassic limestones. The Quaternary lake deposits that cover the area of Kopaida consist of Upper Pleistocene clays and marls [50].
The Fe-Ni-laterite stockpiles are located at a grinding and ore beneficiation and homogenization plant (named hereafter Triveio) under LARCO GMMSA management (Figure 1f). Ore beneficiation includes magnetic separation, homogenization, and stocking the Fe-Ni-rich ore in piles, in order to be transported to the metallurgical plant. For the needs of the current study, the spectral signatures of the pixels that represent the high-grade, homogenized Fe-Ni-ore have been considered.
The Kastoria open-pit mines, which were used for validation purposes, are located near to the Greek–Albanian borders (Figure 1b and Figure S1b). High-grade (up to 1.6% Ni) Fe-Ni-laterite ore is quarried in open-pit mines. The study area consists of Triassic–Jurassic limestones overlain tectonically by ultramafic formations (eventually lateritized) followed by the post-orogenic (Neogene) sediments of the Mesohellenic Trough. The Fe-Ni-laterite ore consists of Fe-oxides–hydroxides, chlorite, serpentinite, chromite, calcite, and talc [43].
The Fe-Ni-laterite deposit of Moa Bay in Cuba (Figure 2b and Figure S2a,b) has been developed over serpentinized peridotites and harzburgites of an ophiolite suite along the NE coast of the island [51,52,53,54,55]. The Moa Bay Fe-Ni-laterites are weathering products of hydrated ultramafic rocks of the Moa–Baracoa ophiolitic massif. This massif forms the eastern part of the Mayarí–Baracoa ophiolitic belt in northeastern Cuba [56]. The deposit is classified as an oxide type [57]. It is mined via opencut and comprises several mines. Outcrops in proximity to the mining areas (e.g., Cbo, Figure 2b and Figure S2b) as well as the open-pit mining areas of the uppermost horizons of the deposit (e.g., Cb3, Figure 2b and Figure S2a) have been exposed after the vegetation was removed.
- 2.
- Bauxites
The bauxite deposits in Central Greece lay on karstic carbonate rocks, usually limestones and rarely dolomites (karst bauxites). When the laterization process takes place at the expense of alumina-enriched mafic rocks, bauxitogenesis occurs. In that case, the aluminosilicate minerals of the outer zone of the parent rocks are transformed, under tropical conditions, into aluminum oxides by breaking the Al2O3 and SiO2 bond. The subsequent removal of SiO2 results in the desilication and the enrichment in aluminum of the outer crust of the rock. Afterwards, the weathering, transportation, trapping, or deposition of that aluminum-rich, lateritic material on karstic carbonates results in the formation of karst bauxite deposits, like the Greek ones. Discrimination between bauxite and Fe-Ni-laterite ore is difficult due to their mineralogical similarities with Fe-oxide–hydroxide enrichment, while no boundary lines have been defined. The world-class Greek bauxite deposits, located mainly in the Parnassos–Ghiona geotectonic unit, are hosted within karst carbonate rocks and are of different ages [57]. Those bauxite formations are named B1, B2, and B3 (from the oldest to the youngest) and are intercalated with shallow-water limestones within the Late Jurassic to Cretaceous sedimentary calcareous sequences. Intense tectonism has affected those bauxite deposits, producing overthrusting, faulting, and disruption of the continuity of the bauxite ore bodies, facilitating the meteoric fluid circulation and mineral deposition. The B3 formation (or horizon) is the most exploitable due to its high content in alumina [58,59]. The specific characteristics of each study site are described here below.
The bauxite outcrop is located at Mt Pateras, which forms an extension of Mt Parnitha (Figure 1g and Figure S1g). The deposits are interposed between Upper Triassic limestones. The deposit is mainly boehmitic and presents a high content in Cr, Ni, U, and Th [60]. The Patitira bauxite open-pit mine is located next to the Nisi Fe-Ni-laterite ore mine (Figure 1f and Figure S1f). The bauxite ore bodies are lens-shaped, developed on karstic dolomitic limestones [41].
Concerning the bauxite stockpiles, two locations are considered in Central Greece. The Itea stockpiles and transport area are located at the Gulf of Itea on the northern coast of the Gulf of Corinth (Figure 1h and Figure S1h). The Stylida stockpiles are in a private bauxite logistics terminal, belonging to ELMIN S.A., situated about 6.5 km west of Stylis Port on the north side of Maliakos Gulf (Figure 1d and Figure S1d).
The Dyo-Vouna and Gorgopotamos open-pit mines, which were used for validation purposes, are located at the southeastern of the Spercheios River basin in Central Greece (Figure 1c and Figure S1c). The study area primarily consists of clastic formations of the Parnassus (-Ghiona) unit and the Subpelagonian Zone [40]. The Parnassus (-Ghiona) unit consists of a neritic sequence of carbonates aged from the Upper Triassic to Upper Cretaceous. This sequence is interrupted by numerous bauxitic horizons, two of which are predominantly exploited. Bauxite ore in the region contains boehmite, diaspore, and hydrargillite as its primary minerals [61].
Finally, concerning the bauxite ores in Jamaica, their main parent material is volcanic ash of Miocene age [62] and they are of karstic type (Figure S1g). Volcanic ash weathers to form a ferruginous Al-rich soil typically containing less than 5% silica. Ores typically exhibit 40% and 50% alumina and are mined from open-pits. Three stockpile areas of Jamaican bauxites are considered in this study (Jam1, Jam2, and Jam3; see locations in Figure 2c and Figure S2c–e).
2.1.2. Ore Mineralogy and Chemistry
- 1.
- Fe-Ni-laterites
The main ore type composition of the studied Fe-Ni-laterite deposits is similar. Ferric minerals hematite and goethite, with quartz, calcite, and chlorite smectite, serpentinite and talc, along with chromite constitute the ore mineralogy [45]. Hematite and goethite are the main components of the pisoids and the ground mass. Quartz is mainly found in the form of clastic fragments, preferably in the ground mass and less in the pisoids. Chromite, due to its resistance to weathering, occurs in the form of clastic grains, is scattered in the ground mass or often forms the core of the pisolites of the ore. Phyllosilicate minerals are scattered mainly in the ground mass and lesser in pisolitic structures. Moreover, a number of other mineral phases may exist, such as magnetite, maghemite, ilmenite, pyrite–marcasite, chalcophanite, bravoite, nepuite, tachovite, gypsum, bastnaesite, and anatase along with the manganese minerals cryptomelas, asvolane, and lithiophorite [50].
Greek laterites can be distinguished into three general mineralogical types: limonitic, saprolitic (garnieritic), and intermediate. Saprolitic laterites are rich in magnesium and silicon oxides and poor in iron (Fe < 12% and MgO > 25%), with nickel contents ranging from 1 to 3%. Limonitic ore is rich in iron oxides with a high iron content (Fe < 15–32% and MgO < 10%) and a nickel content of 1–2%. Sometimes they are also called hematitic, when hematite is the major ferric mineral phase. Finally, the “intermediate” type of laterite ores demonstrates traditional features between exhibiting limonitic and garnieritic types, such as Fe2O3 12–15% and MgO 25–35% [63].
The Fe-Ni-laterite ore of Moa Bay in Cuba is characterized by a ferricrete layer which overlays the limonite layer that consists of goethite, maghemite, hematite, gibbsite, and Mn-Ni-Co-oxyhydoxides. The limonite layer overlays the saprolite. The saprolite consists of lizardite, goethite, magnetite, maghemite, chromite, and Mn-Ni-Co-oxyhydoxides [51,52]. Finally, the bedrock is underlain by the saprolite layer and consists of serpentinized peridotite and hartzburgite. The area is characterized by high rainfall and low relief, which enhance the rock weathering and leaching of chemical elements [54,55]. The Mn-Ni-Co-oxides occur at the base of the limonite zone as veins and coatings or concretions along fractures [53]. The Ni and Co occur in goethite (0.3–4.5 wt%; 0.1–1.7 wt%), maghemite (0.5–8 wt%; 1.1 wt%), and lithophorite (up to 12 wt%; 6 wt%) [53].
- 2.
- Bauxites
The main aluminum minerals of the Greek bauxites are diaspore and boehmite, found in pisolithic forms together with small amounts of hematite pisolites. Furthermore, small quantities of goethite, kaolinite, rutile, and anatase participate in the ore. The mineralogical composition of the bauxite deposits in Parnassos and Ghiona consists of 20–50% diaspore, 10–30% boehmite, 20–25% hematite, 1–5% calcite, 1–5% kaolinite, 1–2% quartz, and 0.5–2% anatase [64]. When iron in the parent rock is increased, then mixed deposit types of ferric bauxite and typical low-iron, high-aluminum bauxite are formed. Fe-oxides result in a red color in bauxites. Out of the three bauxite horizons in Mt Parnassos and Mt Giona, the Al-richest is the uppermost mined, but despite the lower alumina contents, the intermediate horizon is also exploitable.
The main minerals of the Jamaica karstic bauxite ore are goethite, hematite, gibbsite, boehmite along with clay minerals kaolinite and halloysite. Minor mineral phases include quartz, chlorite, montmorillonite, muscovite, garnet, anatase, rutile, calcite, collophane, apatite, ilmenite, magnetite, chromite, zircon, tourmaline, titanite, feldspars, sulfides, and several hydrous manganese-bearing minerals [65,66].
2.2. Materials
2.2.1. Spaceborne Data
The ESA’s spaceborne platform Sentinel-2 hosts the MultiSpectral Instrument (MSI) onboard, which initially (before atmospheric corrections applied to Level 1C products) comprised 13 spectral bands covering the VNIR and the SWIR part of the electromagnetic spectrum (440 nm to 2200 nm) with variable spatial resolution from 10 to 60 m [67]. In order to cover all study areas, seven Sentinel-2A, atmospherically corrected Level 2A images were used, acquired on 08.06.2018, 02.07.2020, 31.08.2020, 27.07.2021, 04.04.2021, 26.09.2021, and 27.12.2022. All images used in this study were acquired during the spring/summer months, except from one image which was acquired in December due to data availability limitations (Table S1).
2.2.2. Laboratory Analyses
For the assessment of the spaceborne data results, three samples from the Tsouka Fe-Ni-laterite deposit (representing three different types of Fe-Ni-laterites within the same deposit) and two samples from the Patitira bauxite deposit were collected for laboratory analysis. The XRF and chemical analyses of the Tsouka and Patitira samples were performed by LARCO GMMSA while the XRD analyses were conducted at the Laboratory of Economic Geology and Geochemistry of the National and Kapodistrian University of Athens. The analysis results are provided in Figure S3 for the XRD analyses and Tables S2 and S3 for the XRF analyses. The XRD analysis results of the three collected samples exhibited the following mineralogy:
- In the Kopaida open-pit mine, the minerals that are present are goethite, quartz, calcite, montmorillonite, antigorite, or lizardite (Figure S3a);
- A Ni-rich bauxite ore sample was obtained from the contact between the lowermost part of the bauxite laterite ore and the carbonate basement from the Patitira open-pit mine. The minerals identified are boehmite, diaspore, hematite, anatase, kaolinite, goethite, quartz, allophane, and calcite (Figure S3b);
- The Tsouka open-pit mine samples are composed mostly of quartz, hematite, antigorite, calcite, clinochrysotile, actinolite, talc, goethite, montmorillonite, lizardite, and orthochrysotile (Figure S3c).
Additional chemical analyses from the studied ore deposits, that are available in the bibliography, have also been considered [41,43,50,51,54,58,62,68,69,70,71]. Chemical analytical data obtained from the literature and used in the framework of the current work are presented in Tables S4 and S5.
2.2.3. Auxiliary Data
Additional auxiliary data were also used in order to provide information on the selection of Sentinel-2 pixels containing bauxite and/or Fe-Ni-laterite. In particular, the following were used:
- Drillhole data of Tsouka, Nisi, and Kopaida Fe-Ni-laterite, including lithological descriptions, were collected from LARCO GMMSA. The drillhole data combined with the topographic data were used for the selection of Fe-Ni-laterite pixels in the Sentinel-2 images;
- Topographic data within the Tsouka, Nisi, and Kopaida Fe-Ni-laterite open-pit mines, measured at the acquisition dates of the Sentinel-2 images (Table S1), were also collected by LARCO GMMSA;
- The geologic maps that cover both Fe-Ni-laterite and bauxite outcrop areas. For the Greek sites, the geologic maps that were used are published by the Greek Institute of Geology and Mineral Exploration (EAGME, former IGME) at a 1:50,000 scale. For the Cuba sites, a digitized geologic map was used, presented in [72], issued from the geological map of Cuba compiled from the Geological Map of Cuba 1:500,000 [73]. The geologic maps were used for the Fe-Ni-laterite/bauxite pixel selections when no other external data were available (e.g., drillholes);
- Google Earth was used as complementary information for the location of Fe-Ni-laterite and bauxite stockpiles at the Triveio laterite grinding factory and the bauxite transport zones of Itea, Stylida, and the three Jamaica sites.
2.3. Methodology
The general flowchart of the methodological steps followed in this study is presented in Figure 3.
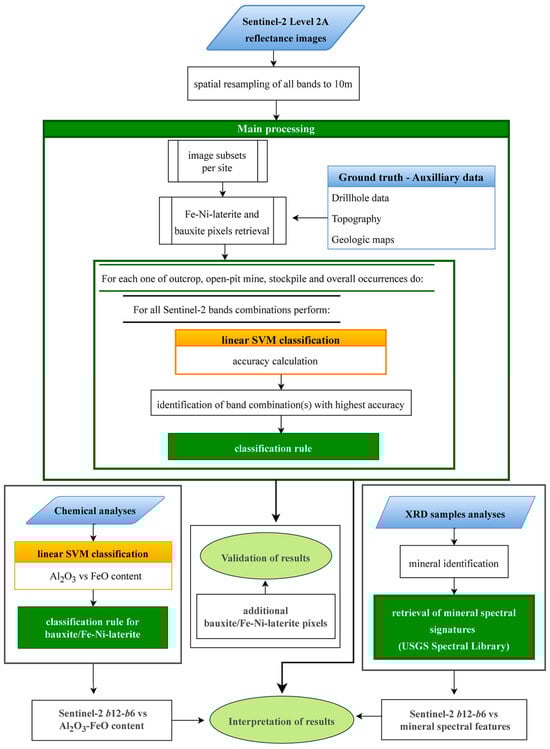
Figure 3.
Flowchart of the methodology followed in this study (see text for further explanation).
2.3.1. Satellite Data Pre-Processing
The Sentinel-2 images used in this study were acquired at the Level 2A processing level. The Level 2A product provides atmospherically corrected Surface Reflectance (SR) images with 12 spectral bands [74]. All spectral bands were resampled to 10 m spatial resolution (for notational simplification, hereafter, instead of writing, e.g., “band 1” and “band 2”, we write , , respectively). From the initial Sentinel-2 Level 2A datasets, thirteen subset images were extracted that cover all study areas (Table S1).
2.3.2. Main Processing
1. Pixel selection
The locations of the retrieved Fe-Ni-laterite and bauxite pixels are presented in Figure 4. All selected pixels include no vegetation cover and were retrieved from the “inner” areas of the associated bauxite and Fe-Ni-laterite sites, so that they were as far as possible from the adjacent lithologies and thus minimize mixture issues. Specifically, concerning the outcrop sites, (a) bauxite pixels on Mt Pateras (Figure 4a) were selected based on the georeferenced 1:50,000 geological map of the area on which the outcrops are indicated, and (b) Fe-Ni-laterite pixels in the Cuba area were selected in proximity and outside of the exploitation sites (Figure 4b). Concerning the Fe-Ni-laterite open-pit mines, the pixels within Tsouka (Figure 4e), Nisi (Figure 4d), Kopaida (Figure 4c), and Kastoria (Figure 4m) were selected based on (i) the altitude where each drillhole intersects the topography at the acquisition date of the corresponding Sentinel-2 image, (ii) the lithographic description, and (iii) the chemical analysis of the drillhole samples. As for the Patitira, Gorgopotamos, and Dyo-Vouna bauxite exploitations, the pixels were selected based on the drillholes that intersect the topography (Figure 4f,n,o, correspondingly). Finally, for the Triveio (Fe-Ni-laterite stockpiles) (Figure 4g) and the bauxite stockpile locations (Figure 4h,j–l), the corresponding pixels were visually selected on the images. The total number of pixels used per study area is shown in Table 2.
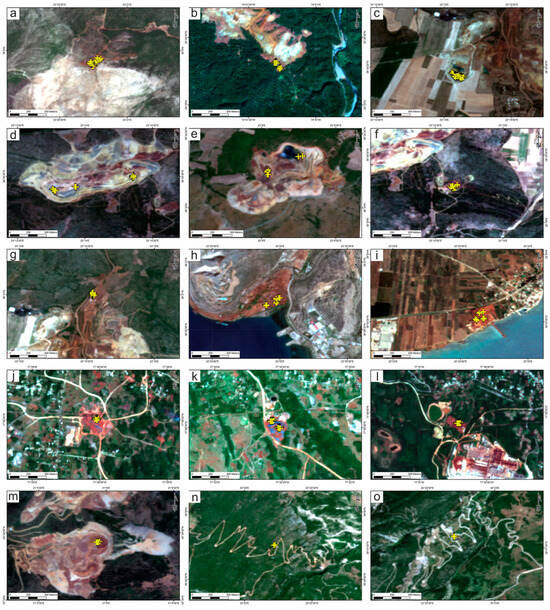
Figure 4.
Pixel locations (yellow crosses) within the Sentinel-2 image extract for each site (a) Mt Pateras bauxite outcrop; (b) Cuba Fe-Ni-laterite outcrop and open-pit mine; (c) Kopaida Fe-Ni-laterite open-pit mine; (d) Nisi Fe-Ni-laterite open-pit mine; (e) Tsouka Fe-Ni-laterite open-pit mine; (f) Patitira bauxite open-pit mine; (g) Triveio Fe-Ni-laterite stockpiles; (h) Itea bauxite stockpiles; (i) Stylida bauxite stockpiles; (j–l) Jamaica bauxite stockpiles; (m) Kastoria Fe-Ni-laterite open-pit mine; (n) Gorgopotamos bauxite open-pit mine; (o) Dyo-Vouna bauxite open-pit mine. The background images are the true color composites of the extracts of the Sentinel-2 images used in this study.
Table 2.
Number of Fe-Ni-laterite/bauxite pixels retrieved from each study area and total number of pixels (in bold) used in this study per lithology and per category.
2. Classification of pixels as Fe-Ni-laterite or bauxite
The main idea was to determine the pair of spectral bands so that all the available bauxite and Fe-Ni-laterite samples, represented as points in the respective two-dimensional scatter plot, could be separated from each other. To this end, all pairs of spectral bands , were considered, and for each one of them the associated two-dimensional scatter plot was produced, where both Fe-Ni-laterite and bauxite pixels were represented as points ( is on the -axis and on the -axis). More specifically, if , are the spectral signatures (-dimensional vectors) of the available pixels, then, in the scatter plot associated with the pair of spectral bands , the available pixels were represented by the points (two-dimensional vectors) , .
Then, a classification was performed using 10-fold cross-validation (see, e.g., [75]), and the percentage of the correctly classified pixels was computed. After that, the combination of bands that corresponded to the highest classification accuracy was selected (correctly classifies as many samples as possible). The above procedure was applied for each one of the three occurrences (outcrop, open-pit mine, and stockpile).
For several pairs of spectral bands, we observed that the points that corresponded to Fe-Ni-laterite pixels and those that corresponded to bauxite pixels were linearly separable. Therefore, a classification rule that was based on the definition of a straight line that separates the Fe-Ni-laterite from the bauxite pixels was established. To this purpose, the linear Support Vector Machine (SVM) approach was selected (see, e.g., [76]).
It is worth noting here that the slope of the separating line associated with a classifier is indicative of the degree of significance of each feature (in our case, values at and bands) in the discrimination of the points from the two classes. Specifically, a slope close to zero (the line is almost parallel to the -axis) indicates that the classification rule is based almost exclusively on the -axis feature. On the other hand, a very large slope (separating line is almost parallel to the -axis) indicates that the classification is based almost exclusively on the -axis feature. In all intermediate cases, both features are significant in class discrimination. More precisely, as the slope value increases from 0 () to 1 (), the -axis feature becomes more and more significant in the discrimination of the data from the two classes. However, the -axis feature remains more significant than the -axis feature for the class discrimination task. The situation is reversed as slope varies from 1 to very large values.
In order to measure the classifier performance, the 10-fold cross-validation procedure was also adopted [75] since it gives a more accurate indication of the generalization ability of the classifier; that is, on how reliably the classifier responses to new unknown data (data that have not been used for its design).
3. Classification rule for each ore occurrence and overall rule
After the establishment of the best combination(s) of pairs of spectral bands, the SVM classification was performed (i) considering all available Fe-Ni-laterite/bauxite pixels from all three occurrences (this case is called hereafter the “overall” SVM classification) and (ii) considering the available Fe-Ni-laterite/bauxite pixels of each occurrence separately. The accuracy and the linear equation defining the separating line associated with the classification rule were defined for each one of the above cases.
4. Performance evaluation
In order to evaluate (test) the proposed methodology, ten additional pixels, different from those used for the establishment of the classification rules, were retrieved. Specifically, four pixels were retrieved from the Kastoria Fe-Ni-laterite open-pit mine, two pixels were retrieved from Gorgopotamos, and four pixels were retrieved from the Dyo-Vouna bauxite open-pit mines. The most general (and thus most strict) overall SVM classification rule was applied to each one of the ten pixels, and the accuracy percentage was calculated.
3. Results
3.1. Fe-Ni-Laterite and Bauxite Pixel Spectral Signatures
The Fe-Ni-laterite/bauxite average spectral signatures (with their corresponding min and max values) for each occurrence and site are presented in Figure 5a–c. Although they do not correspond to real pixel signatures, they show the average “spectral behavior” of the ore in each site. These representations facilitate the comparison among different types of occurrences (outcrop, open-pit mine, stockpile).
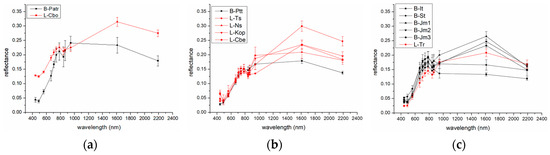
Figure 5.
Fe-Ni-laterite/bauxite average pixel spectral signatures per category and site. L and B suffixes within site names correspond to Fe-Ni-laterite and bauxite, respectively. (a) Outcrops (B-Patr= Mt Pateras, L-Cbo = Cuba); (b) open-pit mines (B-Ptt = Patitira; L-Ts = Tsouka, L-Ns = Nisi, L-Kop = Kopaida, L-Cbe = Cuba); and (c) stockpiles (B-It = Itea, B-St = Stylida, B-Jm1 = Jam-1, B-Jm2 = Jam-2, B-Jm3 = Jam-3). Fe-Ni-laterite signatures are shown with red lines and bauxite ones with black lines. The symbols in each signature (different for each site) indicate the reflectance values at the Sentinel-2 band central wavelength positions. The bars for each reflectance value represent the corresponding minimum and maximum reflectance values.
3.1.1. Outcrops
Overall, the Fe-Ni-laterite and bauxite spectral signatures from outcrops (Figure 5a) present a similar spectral pattern. The Fe-Ni-laterite spectral signatures are more uniform than the corresponding bauxite ones, the latter presenting higher variability in , between and . Furthermore, as seen in Figure 5a, the average reflectance values of bauxite between are lower than those of Fe-Ni-laterite, especially in , , and (~0.04 for bauxite, ~0.13 for Fe-Ni-laterite), and a steeper positive slope is observed between in the bauxite spectra than in the Fe-Ni-laterite ones. Finally, the and bauxite reflectance values are lower than the Fe-Ni-laterite corresponding ones.
3.1.2. Open-Pit Mines
The spectral signatures of Fe-Ni-laterite (Nisi, Kopaida, Tsouka and Cbe) and bauxite (Patitira) pixels in open-pit mines are shown in Figure 5b. One can observe that although the overall Fe-Ni-laterite/bauxite spectral patterns are similar, there are certain local spectral differences both between the Fe-Ni-laterite and bauxite spectra as well as among Fe-Ni-laterite spectra from different sites.
In particular, concerning Fe-Ni-laterite/bauxite spectra, the bauxite spectral signatures seem to be more uniform than Fe-Ni-laterite ones, especially compared with Nisi and Kopaida. The bauxite average reflectance values are lower than the Fe-Ni-laterite corresponding ones in , , , and (Figure 5b), while concerning the other bands, their values are similar. Furthermore, the and centered absorption features, observed in all cases, seem to be less pronounced in bauxites than in Fe-Ni-laterites (except from Kopaida). Concerning the Fe-Ni-laterite spectra from the four open-pit sites, Nisi and Kopaida present higher variability than Tsouka and Cbe (Figure 5b). Furthermore, the reflectance values in are lower than 0.20 in all cases. However, the positive slope between is steeper in Tsouka and Cbe than in Nisi and Kopaida. In addition, Tsouka shows the highest reflectance values in and among all Fe-Ni-laterite sites. Finally, the absorption feature is less pronounced in Tsouka and Cbe than in Nisi and Kopaida, but the one seems to be of similar magnitude for all four sites.
3.1.3. Stockpiles
The average spectral signatures of Fe-Ni-laterite/bauxite stockpiles are presented in Figure 5c. Although the overall spectral patterns of both the Fe-Ni-laterite and bauxite spectra are similar, there are local differences among bauxite spectra from different sites. More specifically, concerning the Fe-Ni-laterite/bauxite spectra, the main difference between them is that Fe-Ni-laterite reflectance values are generally lower than the corresponding bauxite ones in and and higher in (Figure 5c).
Concerning bauxite spectra from different sites, the reflectance values from to in Stylida and Jam-1 spectra are higher than the other ones. In particular, for Jam-1, this is also observed for to but with higher variability. Furthermore, Itea and Stylida present the lowest slopes between . It is worth noting here that the average Stylida spectrum shows an additional feature in (a negative slope between and and a positive slope between and ), which is not observed in the other sites. Moreover, all sites present absorption features in and . Comparing the three Jamaica sites, Jam-1 presents the highest values among the three sites with the exception of . Overall, comparing all sites, the highest reflectance values for are observed in Stylida and the highest values between in Jam-1, and as for , both Jam-1 and Jam-2 show high reflectance.
3.2. Classification Results
3.2.1. Band Combination Selection
Figure 6 shows the classification results for each pair of spectral bands, when all the available Fe-Ni-laterite/bauxite samples are taken into consideration. Specifically, the entry of the table depicts the percentage of classification accuracy achieved by the linear SVM classifier, utilizing the 10-fold cross-validation methodology. It can be seen that the best performance is achieved for the band combinations and , with , , and performing slightly less accurately than them.
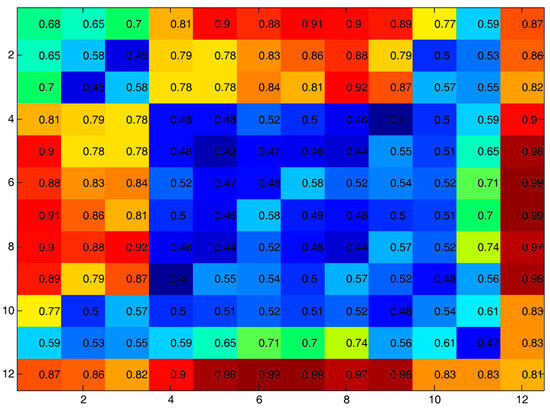
Figure 6.
Classification accuracies for each pair of spectral bands for the case of all available Fe-Ni-laterite/bauxite samples are taken into consideration. The -axis and -axis correspond to the band number. The color palette varies from high accuracy values (brown-dark red) to low accuracy values (dark blue) (accuracy values are shown). The matrix is symmetric and its entry holds the accuracy associated when the pair of the bands is considered.
Correspondingly, Figure 7 shows the classification results for each pair of spectral bands separately for the open-pit mines, outcrop, stockpiles, and overall categories achieved by the linear SVM classifier paradigm.
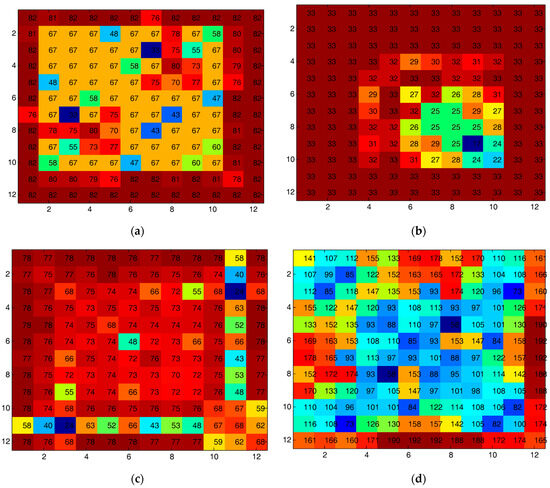
Figure 7.
Classification performance associated with each pair of spectral bands for (a) open-pit mines (total number of samples: 82), (b) outcrops (total number. of samples: 33), (c) stockpiles (total number of samples: 78), and (d) overall (total number of samples: 193) occurrences. The element of each matrix is the classification performance achieved by the linear SVM classifier when applied on the scatter plot associated with the and bands. The browner (resp. bluer) the color of a cell, the larger (resp. smaller) the associated classification performance (accuracy values are shown for each pair combination). All the above matrices are symmetric.
Considering the outcrop, open-pit mine, and stockpile occurrences separately, Figure 7a–c shows that there are several spectral band pair combinations that achieve the highest performance (that is, they classify correctly all samples). This happens at the highest degree for the outcrop case. Nevertheless, considering the more demanding overall case, where all Fe-Ni-laterite/bauxite samples from all three occurrences are considered simultaneously, in Figure 7d it can be seen that only a few spectral band pairs achieve the highest performance. Specifically, these pairs are , , , , and .
3.2.2. Classification Rules
Here, we focus on the spectral combination that achieves the highest classification performance by considering all available Fe-Ni-laterite/bauxite samples, that is, and . As an example, the scatter plots -vs.- for each category separately (outcrop, open-pit mine, and stockpile) and overall, along with their associated separating lines resulted from the SVM framework, are considered (Figure 8). Similar results are obtained for the pair.
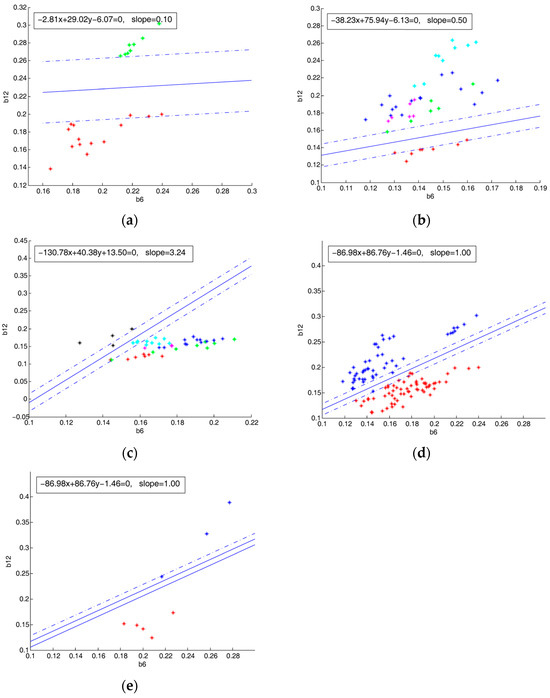
Figure 8.
Scatter plots of (-axis) versus (-axis) for the (a) outcrop, (b) open-pit mine, and (c) stockpile categories, and (d) overall: all Fe-Ni-laterite/bauxite pixels from training sets and (e) Fe-Ni-laterite/bauxite pixels of the three validation sites (test set), along with (i) their associated separating lines (solid blue lines) with their corresponding equations and slopes, and (ii) the lines that define the margin in each case (dotted blue lines), as resulting from the SVM framework. In plot (a): bauxite pixels are denoted with red points; Fe-Ni-laterite pixels with green points. In plot (b): bauxite pixels are denoted with red points; Fe-Ni-laterite pixels are denoted with green points for Nisi, blue for Kopaida, cyan for Tsouka, and magenta for Cbe. In plot (c): black points correspond to Fe-Ni-laterite stockpiles; bauxite pixels are denoted with red points for Itea, green points for Stylida, blue points for Jam-1, cyan points for Jam-2, and magenta points for Jam-3 stockpiles. In plot (d), Fe-Ni-laterite points are denoted with blue and bauxite points with red. In plot (e), Fe-Ni-laterite points are denoted with blue and bauxite points with red.
The equations of the separating lines provided in Figure 8a–c specify the associated classification rules. For example, the classification rule for an open-pit mine can be thus stated explicitly as follows: for a given pixel with and values equal to and , respectively, classify as “Fe-Ni-laterite”, if . Otherwise, classify it as “Bauxite”. The classification rules for the other two cases can be similarly stated.
The same rationale applies for the overall case (Figure 8d), where the Fe-Ni-laterite and bauxite points are nearly linearly separated. It is noted that the bauxite pixels form one group while the Fe-Ni-laterite pixels form two distinct groups, namely one group including the Fe-Ni-laterite outcrop points of the Cbo site and one including all the other sites and occurrences.
Overall, bauxites are well differentiated from Fe-Ni-laterites using the -vs.- rule in all cases, both within each category and overall. It must be noted here that the slope of the separating line increases from outcrops () to open-pit mines () and finally to stockpiles (), indicating an increasing role of in the differentiation of the two ores. Thus, the classification in the outcrops is based (almost) exclusively on while the classification in the open-pit mines is based on both and , with being more significant. The same applies to the case of stockpiles, where here becomes slightly more significant than .
It is worth noting that the slope of the separating line for the overall Fe-Ni-laterite/bauxite points () is almost the same as the corresponding one for the stockpiles (both and are significant, with being slightly more significant than ). This is due to the fact that the separation in the case of the stockpiles is more demanding compared with the other two categories (in contrast to the two other categories, although all points are correctly classified, the margin is smaller and there are points that lie within the margin). Therefore, in the overall case, the SVM will be mostly influenced by the less clearly separated case, which is the stockpile.
The total accuracy of the results for -vs.- is presented in Table 3. It can be observed that the proposed methodology achieves perfect discrimination between Fe-Ni-laterites and bauxites for open-pit mines and outcrops, and almost perfect discrimination in the case of stockpiles. Furthermore, it is worth highlighting that the proposed methodology achieves a very high accuracy score even when the total number of Fe-Ni-laterite and bauxite pixels from all sites/occurrences is considered. The same accuracy results are also obtained for -vs.-.
Table 3.
Accuracies achieved by the linear SVM classification applied to the and reflectance values of Fe-Ni-laterite and bauxite pixels for each category and for the total number of Fe-Ni-laterite/bauxite pixels. The first three lines refer to pixels used for the establishment of the classification rules (training data) (the overall accuracy on the training pixels is shown in the fourth line), while the last line refers to the test data (see Section 3.2.3).
3.2.3. Performance Evaluation
Using ten additional pixels from different ore sites than those used in the implementation of the method, namely four from the Kastoria Fe-Ni-laterite open-pit mine, two from the Gorgopotamos bauxite open-pit mine, and four from the Dyo-Vouna bauxite open-pit mine, we applied the overall SVM classification rule for each pixel, utilizing the -vs.- band combination. The achieved accuracy was 100%, meaning that all ten pixels were correctly classified. The associated scatter plot with the classification rule line is presented in Figure 8e.
4. Discussion
4.1. Spectral Features and Fe-Ni-Laterite/Bauxite Mineralogy
In this section, the classification results are discussed in terms of mineralogy based on the spectral features observed in Fe-Ni-laterite/bauxite spectral signatures (Figure 5) and the spectral signatures of Fe-Ni-laterite and bauxite mineralogy. According to the XRD analyses of samples retrieved from the Fe-Ni-laterite and bauxite open-pit mines in Greece, as described in Section 2.2.2, the minerals detected (i) only in the Fe-Ni-laterite samples are chromite, montmorillonite, talc, antigorite, chrysotile, lizardite, and chlorite, and (ii) those detected only in the bauxite samples are diaspore, kaolinite, anatase, allophone, and gibbsite. The minerals detected in both ore samples are goethite hematite, quartz, and calcite (Figure S3, Table S5). Figure 9 presents the spectral signatures of the detected minerals, resampled to Sentinel-2 spectral bands, with the exception of boehmite, whose spectrum was not available in spectral databases. Examples of characteristic spectral features in specific band areas that produced the best classification results are presented in Figure S4.
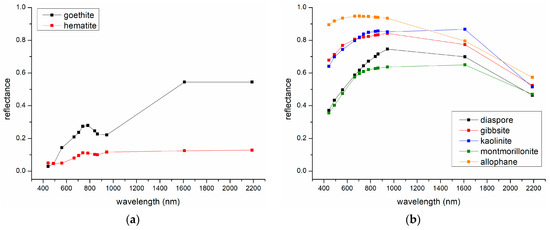
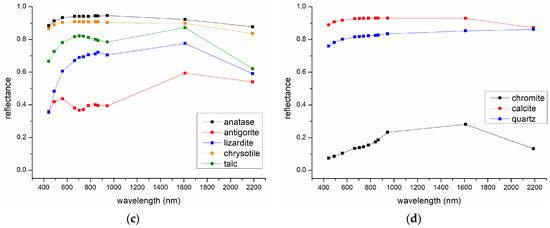
Figure 9.
Spectral signatures of the main mineralogy of Fe-Ni-laterites and bauxites, as obtained from the United States Geological Survey Spectral Library [77], resampled to the 12 Sentinel-2 bands: (a) goethite and hematite; (b) diaspore, gibbsite, kaolinite, montmorillonite and allophane; (c) anatase, antigorite, lizardite, chrysotile, and talc; and (d) chromite, calcite, and quartz.
As described in Section 3.1, the main common spectral characteristics of all Fe-Ni-laterite/bauxite spectra are (i) an absorption feature centered in , (ii) a reflectance feature centered mainly in and/or (bauxite open-pit mines), (iii) an absorption feature centered in (all Fe-Ni-laterite/bauxite spectra), and (iv) a negative slope between and (except from the Nisi Fe-Ni-laterite open-pit mine, and the Itea and Stylida bauxite stockpiles, where this feature is minor) (Figure 5). Considering that in the classification procedure, the highest accuracies were obtained for the band combinations -vs.- and -vs.-, focus is given to the aforementioned (ii) and (iv) features.
- The 700–800 nm reflectance feature: among the spectral signatures of all minerals detected by the XRD sample analyses (Figure 9), this reflectance feature is a common ferric feature [78] and it is observed only in goethite and hematite spectra (Figure 9a). In particular, a high reflectance feature centered in for hematite and in for goethite was observed. Therefore, these reflectance features can be related to the presence of hematite and goethite correspondingly, which are common in both ores and which can be clearly seen in Figure S4a,b.
- The 1600–2200 nm spectral area: among the spectral signatures of the minerals detected by the XRD analyses of the exploitation’s samples (Figure 9), a negative slope between and () is observed in the spectral signatures of several minerals (Figure 9b–d). These minerals are (i) OH-bearing minerals with various chemical compositions, namely Al-OH bearing minerals such as diaspore, kaolinite, and montmorillonite; Mg-OH bearing minerals (talc); chlorites (clinochlore); and serpentines such as antigorite, chrysotile, and lizardite; (ii) chromite; (iii) anatase; (iv) quartz; and (v) calcite. This feature is related to various absorption features within the 2000–2200 nm spectral area of the original spectra of the aforementioned non-ferric minerals, the wavelength position of which depends on each specific mineral chemical composition [78] (e.g., Figures S5c–f and S4). With the exception of calcite and quartz (and hematite and goethite), this type of mineralogy differs between Fe-Ni-laterites and bauxites (Table S6). In particular, Fe-Ni-laterites are composed of montmorillonite, chromite, talc, clinochlore, antigorite, chrysotile, and lizardite, while bauxites are composed of diaspore, gibbsite, kaolinite, anatase, and allophane. Therefore, seems to be generally related to the Fe-Ni-laterite/bauxite non-ferric mineral phases (Figure S4c–f). The full spectra of all minerals detected in the open pits of both ores are presented in Figure S5.
Considering the above, in terms of mineralogy, the most accurate Fe-Ni-laterite/bauxite classification, namely -vs.-), involves (i) ferric minerals, namely hematite and goethite, which are common to both ores and are linked to the bands; and (ii) all the other non-ferric minerals (except quartz and calcite), which are mainly argillic and different in bauxite and Fe-Ni-laterite, and are linked to . In addition, the classification accuracy assessment shows that all band combinations including show high scores () (Figure 6). On the other hand, band combinations including or show variable scores ranging from 0.5 to 0.99, and the highest score was observed when combined with . This indicates that the Fe-Ni-laterite/bauxite non-ferric minerals, mainly argillic, seem to be the most important in the differentiation of the two ores and not the ferric phase, which is common in both mineralogies. Considering that bauxite exhibits a higher content of non-ferric minerals (mainly in the form of Al-oxide/hydroxides, namely diaspore, gibbsite, and boehmite and less so as kaolinite and anatase), these minerals may be the key factor that differentiates bauxite from Fe-Ni-laterite in all occurrences.
4.2. Classification Rules and Fe-Ni-Laterite/Bauxite Chemistry in Open Pits
In order to examine potential relations between classification rules and ore chemistry in open-pit mines, the same approach as the -vs.- Fe-Ni-laterite/bauxite reflectance scatter plot is adopted. More specifically, the scatter plot of Al2O3-vs.-Fe2O3 is produced from the chemical analyses from the samples of current and previous studies (provided in Tables S2–S5) and the linear SVM approach is performed in order to define the line that separates bauxite from Fe-Ni-laterite points, which, in turn, defines the classification rule. The result is presented in Figure 10.

Figure 10.
Scatter plot of Al2O3-vs.-Fe2O3 content (in %) ( and -axis, respectively) from analyzed Fe-Ni-laterite and bauxite field samples from the current and previous studies (Tables S2–S5). The line that separates the Fe-Ni-laterite from bauxite chemical compositions is shown in blue (it has been extracted via the SVM rationale) with its corresponding equation and slope. The dotted lines delineate the margins. Red points correspond to bauxite samples and blue points correspond to Fe-Ni-laterite samples.
Note that the value of the slope of the resulting line is equal to , which indicates that both Al2O3 and Fe2O3 content are significant in separating bauxite from Fe-Ni-laterite, with Al2O3 being more significant than Fe2O3. Recalling that the slopes of the separating lines concerning the outcrop, open-pit mine, and stockpile cases are , , and , respectively (see Results and Figure 8), the slope corresponding to the chemical content line is close to that of the line corresponding to the open-pit mine (Figure 8b). This also indicates that (1) Fe2O3 content is related to the reflectance values and (2) Al2O3 content is related to the reflectance values, which is also consistent with the mineral spectral analysis (see Figure S3 and Table S6) where it is shown that Al-bearing minerals (mainly in the form of Al-oxide/hydroxides, namely diaspore, gibbsite, and boehmite, and less so for kaolinite and anatase) may be the key factor that differentiates bauxite from Fe-Ni-laterite in all occurrences.
4.3. Advantages and Limitations of the Method
It is important to note that the chemical composition of both Fe-Ni-laterites and bauxites can vary significantly depending on the specific deposit’s geological history and degree of weathering and alteration the rocks have undergone; therefore, the composition of both ores can vary from one deposit to another. The proposed classification method on Sentinel-2 is a global method and in principle, it can be applied to any (potential) Fe-Ni-laterite/bauxite deposit worldwide (either for the detection of a potential deposit or for monitoring mining activities). This is because the establishment of the classification rule is based on data collected from different known deposits around the world. In addition, this method is accurate, fast, and cost-effective.
However, certain limitations were encountered in the present study. Specifically, difficulties were encountered in collecting vegetation-free relatively “pure” Fe-Ni-laterite and bauxite pixels due to the Sentinel-2 10 m spatial resolution and the often dense vegetation cover. This is the reason why the available Fe-Ni-laterite/bauxite data points in this study are rather limited (overall 100 bauxite and 93 Fe-Ni-laterite points) as well as the number of test points (10 points). Moreover, when considering the open-pit mine and the stockpile cases individually, a class imbalance issue has also arisen (meaning that the population of one class is significantly larger than the one of the other classes), which may affect the accuracy of their associated classification rules.
As shown by the experimental results, although the spatial resolution of Sentinel-2 is rather low (10 m) for this type of study, the available spectral information seems to be adequate and sufficient enough to distinguish pixels containing bauxite from pixels containing Fe-Ni-laterite using the SVM classification method. However, additional data points collected and utilized from other sites worldwide would solidify the general spread pattern of the two classes in the overall -vs.- or -vs.- scatter plots and their corresponding classification rules.
Future investigations could include the potential of this methodology on hyperspectral sensors with various spatial resolutions (e.g., EnMAP, PRISMA, EMIT, or close-range cameras). For example, it would be interesting to consider the case of satellite hyperspectral data, where the spectral resolution is higher but the spatial resolution is lower (e.g., 30 m in the case of EnMAP and PRISMA, 60 m in the case of EMIT). High spectral resolution will allow the association of specific bands with specific mineralogy (and potentially with additional chemical content), but lower spatial resolution will induce mixture issues, which will need further consideration. On the other hand, in the case of close-range hyperspectral imaging data, with both high spatial and spectral resolution, these issues are expected to be addressed more successfully.
5. Conclusions
In this paper, a novel, accurate, fast, and cost-effective SVM classification-based methodology, applied on Sentinel-2 data, is proposed for the automatic discrimination between Fe-Ni-laterites and bauxites. It can be applied to any Fe-Ni-laterite/bauxite deposit worldwide, either for a first screening of broad areas/surfaces that leads to a first sorting of the areas of interest or for monitoring mining activities. Three different types of surface occurrences (outcrops, open-pit mines, and stockpiles) are considered in study areas located in Greece, Cuba, and Jamaica. The results show that the Sentinel-2 spectral band pairs and provide the best discrimination between Fe-Ni-laterites and bauxites. Comparisons with ore mineralogy show that bands and are linked to ferric oxides while band is linked to non-ferric minerals (mainly in the form of Al-oxide/hydroxides). Furthermore, the study of the relation between spectral bands and chemical compositions, namely Fe2O3 and Al2O3 content, reveals that bands and are correlated with Fe2O3 content, while band is more correlated with Al2O3 content (at least in open pits). The analysis of the results show that the Fe-Ni-laterite/bauxite non-ferric minerals, mainly Al-bearing, seem to be the key factor that differentiates Fe-Ni-laterite from bauxite in all occurrences.
Future investigations include the utilization of (satellite and/or close-range) hyperspectral data using machine learning methods in various mining activities, such as resource exploration, ore differentiation, and optimization of mining short-term objectives, within the context of green energy endeavors.
Supplementary Materials
The following supporting information can be downloaded at: https://www.mdpi.com/article/10.3390/rs16132295/s1, Figure S1: Locations of the studied ore occurrences in Greece; Figure S2: Locations of the studied ore occurrences in Cuba and Jamaica; Figure S3: X-ray powder diffraction (XRD) pattern of Fe-Ni-laterite ore samples in Kopaida, Patitira, and Tsouka open-pit mines; Figure S4: Examples of spectral features of characteristic Fe-Ni-laterite/bauxite minerals; Figure S5: Original spectral signatures of bauxite/Fe-Ni-laterite minerals, as retrieved from the USGS Spectral Library Version 7; Table S1: Sentinel-2 data acquisition dates and corresponding study areas that are covered by each dataset; Table S2: Chemical analysis results (Energy-Dispersive XRF) of the samples from the Tsouka, Kopaida, and Patitira open-pit mines (wt%); Table S3: Chemical analysis results (Energy-Dispersive XRF) for Al2O3 and Fe2O3total content (wt%) of six samples from Mt Pateras bauxite outcrop; Table S4: Al2O3 and Fe2O3total contents (wt%) of bauxite ores, retrieved from the literature; Table S5: Al2O3 and Fe2O3total contents (wt%) of Fe-Ni-laterite ores, retrieved from the literature; Table S6: Bauxite and Fe-Ni-laterite mineralogy as detected by the XRD analyses of exploitation samples. Refs. [41,43,50,51,54,58,62,68,69,70,71,77].
Author Contributions
Conceptualization, A.A., O.S. and K.K.; methodology, A.A., O.S. and K.K.; formal analysis and investigation, A.A., O.S. and K.K.; material preparation, data collection, and analysis, A.A., O.S., K.K. and C.V.; bibliography, A.A.; writing—original draft preparation, A.A., O.S., K.K., E.V. and C.V.; writing—review and editing, O.S., K.K., E.V., C.V. and E.G.; supervision, O.S. All authors participated in the editing process of the manuscript. All authors have read and agreed to the published version of the manuscript.
Funding
This research received no external funding.
Data Availability Statement
The original contributions presented in the study are included in the article and Supplementary Material, further inquiries can be directed to the corresponding author.
Acknowledgments
We thank the late Athanasios Apostolikas (ex-Head of Exploration GMM S.A. LARCO) for his permission to use the LARCO GMMSA’s data.
Conflicts of Interest
Author Emil Georgiou is employed by the company TITAN Cement Company S.A. The remaining authors declare that the research was conducted in the absence of any commercial or financial relationships that could be construed as a potential conflict of interest.
References
- Ayres, R.; Peiró, T.L. Material efficiency: Rare and critical metals. Philos. Trans. R. Soc. A 2013, 371, 20110563. [Google Scholar] [CrossRef] [PubMed]
- The Role of Critical Minerals in Clean Energy Transitions. Available online: https://www.iea.org/reports/the-role-of-critical-minerals-in-clean-energy-transitions (accessed on 15 April 2024).
- Minerals for Climate Action: The Mineral Intensity of the Clean Energy Transition. Available online: https://www.commdev.org/wp-content/uploads/pdf/publications/MineralsforClimateActionTheMineralIntensityoftheCleanEnergyTransition.pdf (accessed on 15 April 2024).
- The Growing Role of Minerals and Metals for a Low Carbon Future. Available online: https://documents1.worldbank.org/curated/en/207371500386458722/pdf/117581-WP-P159838-PUBLIC-ClimateSmartMiningJuly.pdf (accessed on 15 April 2024).
- Study on the Critical Raw Materials for the EU 2023: Final Report. Available online: https://data.europa.eu/doi/10.2873/725585 (accessed on 15 April 2024).
- COM(2023) 160-Proposal for a Regulation of the European Parliament and of the Council Establishing a Framework for Ensuring a Secure and Sustainable Supply of Critical Raw Materials. Available online: https://single-market-economy.ec.europa.eu/publications/european-critical-raw-materials-act_en#details (accessed on 15 April 2024).
- RMIS Roadmap 2021: A Mid-Term Progress Report, Roadmap and Analysis of Knowledge Management Options for the Raw Materials Information System (RMIS). Available online: https://op.europa.eu/en/publication-detail/-/publication/6bfa5652-6ea5-11ec-9136-01aa75ed71a1/language-en (accessed on 15 April 2024). [CrossRef]
- Herrington, R.; Mondillo, N.; Boni, M.; Thorne, R.; Tavlan, M. Bauxite and Nickel-Cobalt Lateritic Deposits of the Tethyan Belt. In Tectonics and Metallogeny of the Tethyan Orogenic Belt, 1st ed.; Richards, J.P., Ed.; Society of Economic Geologists: Littleton, CO, USA, 2016; Volume 19, pp. 349–387. [Google Scholar]
- Pour, A.B.; Rahmani, O.; Parsa, M. Editorial for the Special Issue: “Multispectral Remote Sensing Satellite Data for Mineral and Hydrocarbon Exploration: Big Data Processing and Deep Fusion Learning Techniques”. Minerals 2023, 13, 193. [Google Scholar] [CrossRef]
- Shirazi, A.; Hezarkhani, A.; Pour, A.B.; Shirazy, A.; Hashim, M. Neuro-Fuzzy-AHP (NFAHP) Technique for Copper Exploration Using Advanced Spaceborne Thermal Emission and Reflection Radiometer (ASTER) and Geological Datasets in the Sahlabad Mining Area, East Iran. Remote Sens. 2022, 14, 5562. [Google Scholar] [CrossRef]
- Liu, C.; Liu, X.; Hou, M.; Wu, S.; Wang, L.; Feng, J.; Qiu, C. Machine Learning and EPCA Methods for Extracting Lithology–Alteration Multi-Source Geological Elements: A Case Study in the Mining Evaluation of Porphyry Copper Ores in the Gondwana Metallogenic Belt. Minerals 2023, 13, 858. [Google Scholar] [CrossRef]
- Son, Y.S.; You, B.W.; Bang, E.S.; Cho, S.J.; Kim, K.E.; Baik, H.; Nam, H.T. Mapping Alteration Mineralogy in Eastern Tsogttsetsii, Mongolia, Based on the WorldView-3 and Field Shortwave-Infrared Spectroscopy Analyses. Remote Sens. 2021, 13, 914. [Google Scholar] [CrossRef]
- Savitri, K.P.; Hecker, C.; van der Meer, F.D.; Sidik, R.P. VNIR-SWIR infrared (imaging) spectroscopy for geothermal exploration: Current status and future directions. Geothermics 2021, 96, 102178. [Google Scholar] [CrossRef]
- Bishop, C.; Rivard, B.; De Souza Filho, C.; van der Meer, F. Geological remote sensing. Int. J. Appl. Earth Obs. Geoinf. 2018, 64, 267–274. [Google Scholar] [CrossRef]
- Sekandari, M.; Masoumi, I.; Pour, A.B.; Muslim, A.M.; Rahmani, O.; Hashim, M.; Zoheir, B.; Pradhan, B.; Misra, A.; Aminpour, S.M. Application of Landsat-8, Sentinel-2, ASTER and WorldView-3 Spectral Imagery for Exploration of Carbonate-Hosted Pb-Zn Deposits in the Central Iranian Terrane (CIT). Remote Sens. 2020, 12, 1239. [Google Scholar] [CrossRef]
- Van der Werff, H.M.A.; Van der Meer, F. Sentinel-2 for Mapping Iron Absorption Feature Parameters. Remote Sens. 2015, 7, 12635–12653. [Google Scholar] [CrossRef]
- Sykioti, O.; Ganas, A.; Vasilatos, C.; Kypritidou, Z. Investigating the capability of Sentinel-2 and Worldview-3 VNIR satellite data to detect mineralized zones at an igneous intrusion in the Koutala islet (Lavreotiki, Greece) using laboratory mineralogical analysis, reflectance spectroscopy and spectral indices. Bull. Geol. Soc. Greece 2023, 59, 175–213. [Google Scholar] [CrossRef]
- Tompolidi, A.M.; Sykioti, O.; Koutroumbas, K.; Parcharidis, I. Spectral Unmixing for Mapping a Hydrothermal Field in a Volcanic Environment Applied on ASTER, Landsat-8/OLI, and Sentinel-2 MSI Satellite Multispectral Data: The Nisyros (Greece) Case Study. Remote Sens. 2020, 12, 4180. [Google Scholar] [CrossRef]
- Ge, W.; Cheng, Q.; Jing, L.; Wang, F.; Zhao, M.; Ding, H. Assessment of the Capability of Sentinel-2 Imagery for Iron-Bearing Minerals Mapping: A Case Study in the Cuprite Area, Nevada. Remote Sens. 2020, 12, 3028. [Google Scholar] [CrossRef]
- El Atillah, A.; El Abidine El Morjani, Z.; Souhassou, M. Use of the Sentinel-2A Multispectral Image for Litho-Structural and Alteration Mapping in Al Glo’a Map Sheet (1/50,000) (Bou Azzer–El Graara Inlier, Central Anti-Atlas, Morocco). Artif. Satell. 2019, 54, 73–96. [Google Scholar] [CrossRef]
- Ibrahim, E.; Barnabé, P.; Ramanaidou, E.; Pirard, E. Mapping mineral chemistry of a lateritic outcrop in New Caledonia through generalized regression using Sentinel-2 and field reflectance spectra. Int. J. Appl. Earth Obs. Geoinf. 2018, 73, 653–665. [Google Scholar] [CrossRef]
- Van der Meer, F.D.; Van der Werff, H.M.A.; Van Ruitenbeek, F.J.A. Potential of ESA’s Sentinel-2 for geological applications. Remote Sens. Environ. 2014, 148, 124–133. [Google Scholar] [CrossRef]
- Hajaj, S.; El Harti, A.; Jellouli, A.; Pour, A.B.; Himyari, S.M.; Hamzaoui, A.; Hashim, M. Evaluating the Performance of Machine Learning and Deep Learning Techniques to HyMap Imagery for Lithological Mapping in a Semi-Arid Region: Case Study from Western Anti-Atlas, Morocco. Minerals 2023, 13, 766. [Google Scholar] [CrossRef]
- Abedini, M.; Ziaii, M.; Timkin, T.; Pour, A.B. Machine Learning (ML)-Based Copper Mineralization Prospectivity Mapping (MPM) Using Mining Geochemistry Method and Remote Sensing Satellite Data. Remote Sens. 2023, 15, 3708. [Google Scholar] [CrossRef]
- Kodikara, G.R.L.; McHenry, L.J.; Van der Meer, F.D. Application of deep learning and spectral deconvolution for estimating mineral abundances of zeolite, Mg-sulfate and montmorillonite mixtures and its implications for Mars. Planet. Space Sci. 2022, 223, 105579. [Google Scholar] [CrossRef]
- Bachri, I.; Hakdaoui, M.; Raji, M.; Benbouziane, A.; Si Mhamdi, H.S. Identification of Lithology Using Sentinel-2A Through an Ensemble of Machine Learning Algorithms. Int. J. Appl. Geospat. Res. 2022, 13, 1–17. [Google Scholar] [CrossRef]
- Shirmard, H.; Farahbacksh, E.; Muller, D.R.; Chandra, R. A review of machine learning in processing remote sensing data for mineral exploration. Remote Sens. Environ. 2022, 268, 112750. [Google Scholar] [CrossRef]
- Pal, M.; Rasmussen, T.; Porwal, A. Optimized Lithological Mapping from Multispectral and Hyperspectral Remote Sensing Images Using Fused Multi-Classifiers. Remote Sens. 2020, 12, 77. [Google Scholar] [CrossRef]
- Shebl, A.; Abdellatif, M.; Hissen, M.; Abdelaziz, M.I.; Csámer, Á. Lithological mapping enhancement by integrating Sentinel 2 and gamma-ray data utilizing support vector machine: A case study from Egypt. Int. J. Appl. Earth Obs. Geoinf. 2021, 105, 102619. [Google Scholar] [CrossRef]
- Xu, K.; Wang, X.; Kong, C.; Feng, R.; Liu, G.; Wu, C. Identification of hydrothermal alteration minerals for exploring gold deposits based on SVM and PCA using ASTER data: A case study of Gulong. Remote Sens. 2019, 11, 3003. [Google Scholar] [CrossRef]
- Bruno, R.; Kasmaeeyazdi, S.; Tinti, F.; Mandanici, E.; Balomenos, E. Spatial Component Analysis to Improve Mineral Estimation Using Sentinel-2 Band Ratio: Application to a Greek Bauxite Residue. Minerals 2021, 11, 549. [Google Scholar] [CrossRef]
- Sarkar, D.; Sur, P. Targeting the bauxite rich pockets from lateritic terrain utilizing ASTER data: A case study from Kabirdham District, Chhattisgarh, India. J. Earth Syst. Sci. 2021, 130, 189. [Google Scholar] [CrossRef]
- Guha, A.; Singh, V.K.; Parveen, R.; Kumar, V.K.; Jeyaseelan, A.T.; Dhanamjaya Rao, E.N. Analysis of ASTER data for mapping bauxite rich pockets within high altitude lateritic bauxite, Jharkhand, India. Int. J. Appl. Earth Obs. Geoinf. 2013, 21, 184–194. [Google Scholar] [CrossRef]
- Babu, M.J.R. Mapping of Aluminous Rich Laterite Depositions through Hyper Spectral Remote Sensing. Int. J. Geosci. 2018, 9, 93–105. [Google Scholar] [CrossRef]
- Kasmaeeyazdi, S.; Mandanici, E.; Balomenos, E.; Tinti, F.; Bonduà, S.; Bruno, R. Mapping of Aluminum Concentration in Bauxite Mining Residues Using Sentinel-2 Imagery. Remote Sens. 2021, 13, 1517. [Google Scholar] [CrossRef]
- Anifadi, A.; Sykioti, O.; Koutroumbas, K.D.; Vassilakis, E. A Novel Spectral Index for Identifying Ferronickel (Fe–Ni) Laterites from Sentinel 2 Satellite Data. Nat. Resour. Res. 2022, 31, 1203–1224. [Google Scholar] [CrossRef]
- Kusuma, K.N.; Ramakrishnan, D.; Pandalai, H.S. Spectral pathways for effective delineation of high-grade bauxites: A case study from the Savitri River Basin, Maharashtra, India, using EO-1 Hyperion data. Int. J. Remote Sens. 2012, 33, 7273–7290. [Google Scholar] [CrossRef]
- Pushcharovsky, Y. Mapa Geologico de la Republica de Cuba, 1st ed.; Academy of Sciences of Cuba and USSR; Academia de Ciencias de Cuba Instituto de Suelos, Instituto cubano de Geodesia y Cartografia: Havana, Cuba, 1985; scale 1:250,000, 42 sheets. [Google Scholar]
- Mitchell, S.F.; Abbott, R.N.; Bhalai, S.; Dwyer, S.T.; Edwards, C.P.; Mohamed, A.; Ferguson, N.; Harris, N.; Harrypersad, S.; Hepburn, O.; et al. Revision of Jamaican lithostratigraphic nomenclature decided at a stratigraphic workshop of the Jamaican Stratigraphic Committee at the 60th Anniversary of the Geological Society of Jamaica. Caribb. J. Earth Sci. 2016, 48, 37–45. Available online: http://caribjes.com/CJESpdf/Mitchell-et-al-2016-StratigraphicCommissionReportJamaica.pdf (accessed on 16 April 2024).
- Papanikolaou, D.I. The Geology of Greece, 1st ed.; Springer Nature: Cham, Switzerland, 2021; 345p. [Google Scholar]
- Kalatha, S.; Perraki, M.; Economou-Eliopoulos, M.; Mitsis, I. On the Origin of Bastnaesite-(La,Nd,Y) in the Nissi (Patitira) Bauxite Laterite Deposit, Lokris, Greece. Minerals 2017, 7, 45. [Google Scholar] [CrossRef]
- Kalatha, S.; Economou-Eliopoulos, M. Framboidal pyrite and bacterio-morphic goethite at transitional zones between FeNi laterites and limestones: Evidence from Lokris, Greece. Ore Geol. Rev. 2015, 65, 413–425. [Google Scholar] [CrossRef]
- Eliopoulos, D.G.; Economou-Eliopoulos, M. Geochemical and mineralogical characteristics of Fe–Ni- and bauxitic-laterite deposits of Greece. Ore Geol. Rev. 2000, 16, 41–58. [Google Scholar] [CrossRef]
- Economou-Eliopoulos, M.; Apostolikas, A.; Eliopoulos, D.; Maglaras, K. Precious and rare earth element distribution in Ni-laterite deposits Lokris area, Central Greece. In Mineral Deposits Research and Exploration, 1st ed.; Papunen, H., Ed.; CRC Press: Boca Raton, FL, USA, 1997; pp. 411–413. [Google Scholar]
- Alevizos, G. Mineralogy, Geochemistry and Origin of the Sedimentary Fe-Ni Ores of Lokris. Ph.D. Thesis, Technical University of Crete, Crete, Greece, 1997. [Google Scholar]
- Valeton, I.; Biermann, M.; Reche, R.; Rosenberg, F. Genesis of nickel laterites and bauxites in Greece during the Jurassic and Cretaceous, and their relation to ultrabasic parent rocks. Ore Geol. Rev. 1987, 2, 359–404. [Google Scholar] [CrossRef]
- Antoniades, P.A.; Vgenopoulos, A.G. Study of the bauxitic Ni-laterite north of Kokkino area, Lokris. Miner. Wealth 1987, 65, 51–60. [Google Scholar]
- Albandakis, N.D. The nickel-bearing iron-ores in Greece. In Proceedings of the UNESCO IGSP 169 International Symposium on Metallogeny Mafic Ultramafic Complexes, Athens, Greece, 9–11 October 1980. [Google Scholar]
- Christidis, G.E.; Skarpelis, Ν. Clay Mineralogy of the Sedimentary Iron-Nickel Ore of Agios Ioannis, NE Boeotia: New Data and Implication for Diagenetic Modifications. Bull. Geol. Soc. Greece 2010, 43, 2553–2561. [Google Scholar] [CrossRef][Green Version]
- Apostolikas, A.G. The Iron Nickel Deposit of Kopaida Basin in Biotia Prefecture. Ph.D. Thesis, Technical University of Crete, Crete, Greece, 2007. [Google Scholar] [CrossRef]
- Aiglsperger, T.; Proenza, J.A.; Lewis, J.F.; Labrador, M.; Svojtka, M.; Rojas-Purón, A.; Longo, F.; Ďurišová, J. Critical metals (REE, Sc, PGE) in Ni laterites from Cuba and the Dominican Republic. Ore Geol. Rev. 2016, 73, 127–147. [Google Scholar] [CrossRef]
- Roqué-Rosell, J.; Mosselmans, J.F.W.; Proenza, J.A.; Labrador, M.; Gali, S.; Atkinson, K.D.; Quinn, P.D. Sorption of Ni by “lithiophorite–asbolane” intermediates in Moa Bay lateritic deposits, eastern Cuba. Chem. Geol. 2010, 275, 9–18. [Google Scholar] [CrossRef]
- Proenza, J.A.; Tauler, E.; Melgarejo, J.C.; Gali, S.; Labrador, M.; Marrero, N.; Perez-Nelo, N.; Rojas Puron, A.L.; Blanco-Moreno, J.A. Mineralogy of oxide and hydrous silicate Ni-laterite profiles in Moa Bay area, northeast Cuba. In Mineral Exploration and Research—Digging Deeper 2, 1st ed.; Andrew, C.J., Ed.; Irish Association of Economic Geology: Galway, Ireland, 2007; pp. 1389–1392. [Google Scholar]
- De Oliveira, S.M.B.; De Moya Partiti, C.S.; Enzweiler, J. Ochreous laterite: A nickel ore from Punta Gorda, Cuba. J. South Am. Earth Sci. 2001, 14, 307–317. [Google Scholar] [CrossRef]
- De Vletter, D.R. How cuban nickel ore was formed: A lesson in laterite genesis. Eng. Min. J. 1955, 156, 84–87. Available online: https://archive.org/details/sim_engineering-and-mining-journal_1955-10_156_10/page/n89/mode/2up (accessed on 16 April 2024).
- Marchesi, C.; Garrido, C.J.; Godard, M.; Proenza, J.A.; Gervilla, F.; Blanco-Moreno, J. Petrogenesis of highly depleted peridotites and gabbroic rocks from the Mayarı’–Baracoa Ophiolitic Belt (eastern Cuba). Contrib. Miner. Petrol. 2006, 151, 717–736. [Google Scholar] [CrossRef]
- Gleeson, S.A.; Butt, C.R.M.; Elias, M. Nickel Laterites: A Review. SEG Discov. 2003, 54, 1–18. [Google Scholar] [CrossRef]
- Mondillo, N.; Di Nuzzo, M.; Kalaitzidis, S.; Boni, M.; Santoro, L.; Balassone, G. Petrographic and geochemical features of the B3 bauxite horizon (Cenomanian-Turonian) in the Parnassos-Ghiona area: A contribution towards the genesis of the Greek Karst bauxites. Ore Geol. Rev. 2022, 143, 104759. [Google Scholar] [CrossRef]
- Economou-Eliopoulos, M.; Kontou, M.; Megremi, I. Biogeochemical Redox Processes Controlling the Element Cycling: Insights from Karst-Type Bauxite, Greece. Minerals 2022, 12, 446. [Google Scholar] [CrossRef]
- Economopoulou-Kyriakopoulou, N. A Comparative Geochemical and Mineralogical study of Bauxitic horizons in central Greece. Ph.D. Thesis, National Technical University of Athens, Athens, Greece, 1991. [Google Scholar] [CrossRef]
- Mertzanis, A.; Karetsos, G.; Smyrni, V.; Efthimiou, G.; Zakinthinos, G. National Park of Iti: Environmental and geomorphological impacts from the mining activity (Greece). Bull. Geol. Soc. Greece 2007, 40, 1833–1844. [Google Scholar] [CrossRef]
- Young, N.J.; Coley, M.D.; Greenaway, A.M. Mineralogical investigations of Jamaican hematite-rich and goethite-rich bauxites using XRD and solid state 27Al and 31P MAS NMR spectroscopy. J. Geochem. Explor. 2019, 200, 54–76. [Google Scholar] [CrossRef]
- Zevgolis, E.N.; Daskalakis, K.A. The Nickel Production Methods from Laterites and the Greek Ferronickel Production among Them. Mater. Proc. 2021, 5, 104. [Google Scholar] [CrossRef]
- Tsirambides, A.; Filippidis, A. Metallic Mineral Resources of Greece. Cent. Eur. J. Geosci. 2012, 4, 641–650. [Google Scholar] [CrossRef]
- Comer, J.B. Genesis of Jamaican bauxite. Econ. Geol. 1974, 69, 1251–1264. [Google Scholar] [CrossRef]
- Patterson, S.H.; Kurtz, H.F.; Olson, J.C.; Neeley, C.L. World Bauxite Resources, 1st ed.; USGS, Ed.; USGS: Reston, VA, USA, 1986; Volume 1076-B, pp. B1–B151. [Google Scholar] [CrossRef]
- Sentinel-2 Mission Guide. Available online: https://sentinels.copernicus.eu/web/sentinel/missions/sentinel-2 (accessed on 23 April 2024).
- Henry, K.E.; Coley, M.D.; Greenaway, A.M. The dissolution of phosphorus from Jamaican bauxites under low temperature Bayer conditions. Hydrometallurgy 2018, 179, 132–140. [Google Scholar] [CrossRef]
- Komnitsas, K.; Petrakis, E.; Pantelaki, O.; Kritikaki, A. Column Leaching of Greek Low-Grade Limonitic Laterites. Minerals 2018, 8, 377. [Google Scholar] [CrossRef]
- Madourie, M.A. A Comparative Analysis between Portuguese and Jamaican Bauxite Rocks: Their Geo-Economic Potential for the Aluminum Industry. Ph.D. Thesis, University of Porto, Porto, Portugal, 2013. [Google Scholar]
- Samouhos, M.; Godelitsas, A.; Nomikou, C.; Taxiarchou, M.; Tsakiridis, P.; Zavašnik, J.; Gamaletsos, P.N.; Apostolikas, A. New insights into nanomineralogy and geochemistry of Ni-laterite ores from central Greece (Larymna and Evia deposits). Geochemistry 2019, 79, 268–279. [Google Scholar] [CrossRef]
- Stanek, K.P.; Maresch, W.V.; Pindell, J.L. The geotectonic story of the northwestern branch of the Caribbean Arc: Implications from structural and geochronological data of Cuba. In The origin and Evolution of the Caribbean Plate, 1st ed.; James, K.H., Lorente, M.A., Pindell, J.L., Eds.; Geological Society: London, UK, 2009; Volume 328, pp. 361–398. [Google Scholar] [CrossRef]
- Perez Othon, J.; Yarmoliuk, V.A. Mapa Geologica de Cuba; Republica de Cuba, Ministerio de la Industria Basica, Centro de Investigaciones Geologicas: La Habana, Cuba, 1985; Available online: https://ufdc.ufl.edu/AA00068221/00001 (accessed on 16 April 2024).
- Sentinel-2 Online. Level 2A. Available online: https://sentinels.copernicus.eu/web/sentinel/user-guides/sentinel-2-msi/product-types/level-2a (accessed on 23 April 2024).
- Refaeilzadeh, P.; Tang, L.; Liu, H. Cross-Validation. In Encyclopedia of Database Systems, 1st ed.; Liu, L., Özsu, M.T., Eds.; Springer: Boston, MA, USA, 2009; pp. 532–538. [Google Scholar] [CrossRef]
- Theodoridis, S.; Koutroumbas, K.D. Pattern Recognition, 4th ed.; Academic Press: San Diego, CA, USA, 2021; pp. 77–88. [Google Scholar]
- Kokaly, R.F.; Clark, R.N.; Swayze, G.A.; Livo, K.E.; Hoefen, T.M.; Pearson, N.C.; Wise, R.A.; Benzel, W.M.; Lowers, H.A.; Driscoll, R.L.; et al. USGS Spectral Library Version 7, 1st ed.; Data Series 1035; U.S. Geological Survey: Reston, VA, USA, 2017; 61p. [Google Scholar] [CrossRef]
- Clark, R.N.; Roush, T.L. Reflectance Spectroscopy Quantitative Analysis Techniques for Remote Sensing Applications. J. Geophys. Res. 1984, 89, 6329–6340. [Google Scholar] [CrossRef]


Disclaimer/Publisher’s Note: The statements, opinions and data contained in all publications are solely those of the individual author(s) and contributor(s) and not of MDPI and/or the editor(s). MDPI and/or the editor(s) disclaim responsibility for any injury to people or property resulting from any ideas, methods, instructions or products referred to in the content. |
© 2024 by the authors. Licensee MDPI, Basel, Switzerland. This article is an open access article distributed under the terms and conditions of the Creative Commons Attribution (CC BY) license (https://creativecommons.org/licenses/by/4.0/).