Abstract
Technologies and scientific progress are of major importance in monitoring cultural heritage (CH). Studies of CH preservation play a crucial role in understanding human history, inheriting splendid nations’ cultures, and safeguarding cultural diversity. The scientific community and the countries must lead a battle to maintain and preserve CH. The possibilities in the search for underground objects (using non-invasive methods) that have been forgotten are presented. This article presents the results of research conducted in the area of the Citadel in Lviv (Ukraine) and an execution site of the Second World War (Kazimierz Biskupi, Poland). This research makes it possible to highlight the problem of researching to find and adequately commemorate objects and events that are essential elements of the CH of Ukraine and Poland. The proposed non-invasive methods allow the designation of protection zones of historical and cultural significance.
1. Introduction
The application of non-invasive methods is advisable when monitoring territories of historical and cultural purpose [1,2], and, therefore, the possible new discovery of underground objects [3], which in turn can affect the total area of the object and the protection zone.
We propose to divide objects of historical and cultural importance into three main groups: (1) subterranean historical and cultural objects; (2) terrestrial historical and cultural objects; (3) landscape historical and cultural objects.
Subterranean historical and cultural objects include archaeological and historical monuments in the forms of remains of buildings [4], structures, material features of economic and cultural activities, burial mounds [5], underground burials, cultural layers [6,7], and underground passages [8]. An obvious feature of these objects is that they are hidden under the surface of the earth, masked by vegetation, often damaged or covered by monuments and other consequences of further cultural and economic activity.
Terrestrial historical and cultural objects are historical and archaeological monuments or remains, relatively well-preserved structures, buildings, manors [9] and palace ensembles [10], and sites of historical settlements [11]. In some cases, only high security ensures that the object is classified as a terrestrial type, not a subterranean type.
Landscape historical and cultural objects include monuments of garden and park architecture and sites of territory, the unique landscapes of which were formed by humans intentionally or unintentionally during the historical development of social, economic, and cultural activities. Landscape historical and cultural objects [12,13] also include areas of territories associated with important moments of national and world history. It should be noted that subterranean objects are often associated with landscape historical and cultural objects.
The following classification features of lands of historical and cultural purpose can be distinguished: (1) the age of the object of historical and cultural significance; (2) the preservation of the monument; (3) the significance of the monument; (4) the use of the monument; (5) the saturation of the territory with historical and cultural objects. The given classification of objects and lands of historical and cultural purpose ensures the formation of a system of indicators and the selection of appropriate monitoring methods that determine the essential features of the monitoring of lands of this category compared to the monitoring of lands of other categories. This article will describe two cases from group one (subterranean historical and cultural objects). Hidden objects, and in some cases forgotten ones, pose a challenge to researchers. New documents or witness accounts or the need to commemorate objects that we know exist but whose exact location is unknown may contribute to the start of the investigation.
2. Historical Background
The purpose of these studies was to determine the boundaries of the historical and cultural heritage for two sites (Figure 1): (1) the ensemble of defensive structures of the Citadel in the city of Lviv, using additional modern remote methods, such as satellite radar interferometry; (2) Kazimierz Biskupi Forest, where Sonderkommando units executed Jewish people from the surrounding communities and ghettos from late 1940 onwards [14,15]. For this purpose, non-invasive and remote methods have been proposed.
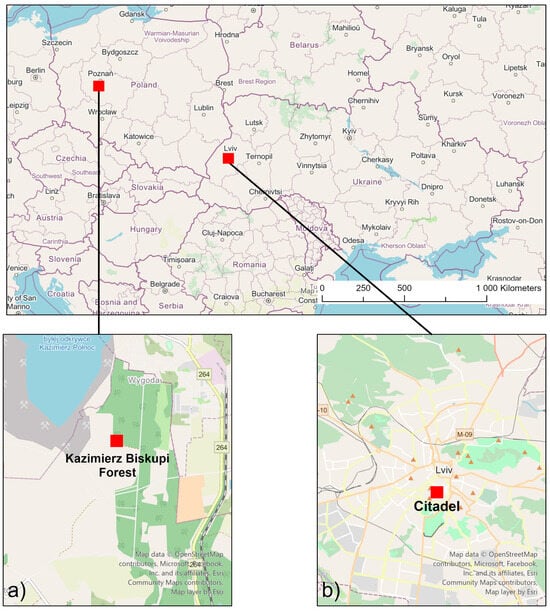
Figure 1.
Map of the study area. (a) Location of the study area in Poland—Kazimierz Biskupi Forest; (b) area in Ukraine—Citadel in the city of Lviv [© ESRI basemaps, OpenStreetMap—Open Database License].
In the case of studying historical sites in Ukraine (Lviv Citadel), the initial stage of the research involved preparing documentation with graphical support to include the Lviv Citadel in the list of historical and cultural heritage sites, which would provide state support and protection to this memorial site. This stage was implemented in 2013, and the Lviv Citadel was included in the register of monuments of national importance. The first stage of territory research was based on the analysis of archival aerial photographs from 1944. The second stage of research relies on the use of spaceborne radar data to detect and study underground structures in more detail and to refine the historical boundary of the object.
In the case of the study of memorial sites in Poland (Kazimierz Biskupi), the start of prospecting research was designed to prepare documentation that will result in the preparation of a new war graves register in the public database of the Governor of Greater Poland. Under current law in Poland, local governments are obligated to maintain war graves and cemeteries [16].
2.1. Citadel in the City of Lviv
There is an assumption that the boundaries of the Citadel in the city of Lviv defined in 2010 do not correspond to reality when taking into account underground facilities.
Underground passages and premises under the Citadel belong to recent times—the 19th century. However, there are no exact plans of them. But, considering the numerous ventilation wells, the Kalicha and Vronovsky Mountains, on which the Citadel was built, must be riddled with underground cavities. In Soviet times, there were even rumors that the central telegraph and post office could be moved to the Citadel in case of war. Those residents of Lviv who had to visit the subterrains of the Citadel as part of their service claimed that there was an entire underground city there. Unfortunately, both Austrian and Russian military archives still consider information about the Citadel subterrain as secret data.
Figure 2 depicts a schematic plan of the territory created by Soviet military forces in 1944 immediately after the liberation from the Wehrmacht army, with photographic documentation of military barracks buildings and four Maximilian towers that have survived to this day.
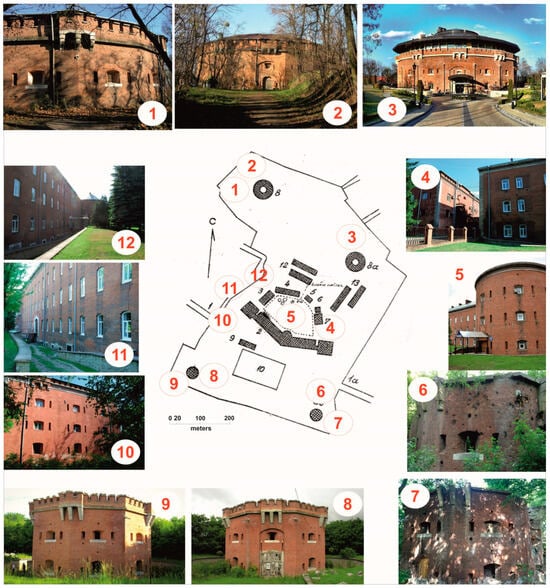
Figure 2.
Photographic documentation of the historical buildings of Lviv Citadel that have survived to the present day.
Tower (1,2) is currently used as storage premises for the Stefanyk City Scientific Library. Tower (3) is utilized as the five-star Citadel Inn Hotel. Towers (6,7) are abandoned in a semi-ruined state. Towers (8,9) are utilized as warehouses for a private company. The former military barracks buildings (4–6,10–12) are used as premises for a bank.
2.2. Kazimierz Biskupi Forest Massacre
During the Second World War, the Polish and mostly Jewish populations were exterminated in the commune. Approximately 8000 Jews were killed in the forests of Kazimierz Biskupi, in the area of today’s municipality of Kazimierz Biskupi—in a revue called Wygoda—Las Krężel [17]. The most efficient methods of killing were tested in the forest, among them driving people into a pit filled with burnt lime and then pouring water over it [18,19]. Jews from nearby ghettos who had already been gassed with combustion gases were also brought to the forest. After the end of the war, two matzevot were brought to the execution site and replaced by a larger memorial in 1980. In 2002, thanks to the Council for the Protection of Memory of Struggle and Martyrdom in Warsaw, another tombstone was erected deep in the forest. Currently, there are one monument and three gravestones at the execution site. Based on an analysis of the material collected during the investigations carried out after the end of the war in order to clarify and punish the guilty, an attempt was made to locate new and, so far, uncommemorated burial sites.
3. Materials and Methods
3.1. Radar Interferometry: Citadel in the City of Lviv
It is known that among non-invasive methods, geophysical methods provide the most accurate results. However, there are cases like the Lviv Citadel and its underground passages where the use of ground-based invasive or non-invasive methods is impossible. This is because the exact map of the underground passages of the Lviv Citadel has been classified in Ukraine since World War II, and conducting archaeological or ground-based non-invasive research in this area to determine the underground connections is prohibited. For analysis and assumptions regarding the identification of these elements from a historical and cultural value perspective, the only effective remote method remains radar interferometry.
The interferometric mode refers to repeated radar surveys of the same terrain site with the following conditions: sounding with identical equipment with the same parameters; sounding from closely spaced orbit points, the distance between which is called the interferometric basis. There are longitudinal, transverse, and temporal interferometric bases that characterize the relative positions of radar signals in time and space. Different types of interferometric bases are used to solve various tasks: longitudinal—to detect moving objects, transverse—to build digital models of the terrain, temporal—to detect changes in objects, and shifts of the earth’s surface.
Radar space imaging is performed in ultra-short-wave (ultra-high-frequency) ranges, which are divided into X, C, S, and L ranges. This study used images from the Sentinel-1A satellite operating in the C-band.
A complex interferogram is created by complex conjugate multiplication of two aligned SLC images, giving:
where (…) ∗ denotes a complex conjugate; m, s—of the main image and additional image (such an image from a series that, during processing, will be compared with the main image). Here, a scheme for performing a repeated pass is provided. An interferometric phase ψms for one pixel is equal to
where the difference of interferometric ranges consists of the flat-earth phase—φflat, topographical and φtopo, deformation φdefo parts, φatmo—atmospheric phase (signal delay by the atmosphere), φscat—scattering phase, and φnoise—noise. Errors in the parameters of the orbit of the main and additional surveys are called φorb.
The basis of interferometric processing is the phase difference of reflected signals, the result of which is the elevation of one reflected element of the surface relative to another. The method of determining subsidence (uplift) of the earth’s surface and structures is based on the determination of interferograms from a series of 36 images by the Persistent Scatterers (PS) Interferometry method.
Considering that the territory of the research object is built up and covered with vegetation, the development of this method was carried out in ENVI SARscape 5.2 software.
The input data were 36 radar data archives obtained from the free Sentinel—Copernicus data geoportal. The images were obtained with a frequency of one month from January 2020 to December 2022, inclusive.
The first step of this research was the construction of interferograms based on the 36 images and the determination of the extremes of vertical displacements in the territory of the Lviv Citadel over three years. The next step was to analyze the obtained data in combination with the modern urban planning situation and other research results. The last step was the analysis of the selected points of the largest vertical displacements and the formulation of conclusions and recommendations.
Applying this technique, it was possible to investigate the territory of the historical place, the Lviv Citadel, for the subsidence of the earth’s surface, to determine possible underground passageways, the existence of which is definitely known. Taking into account the historical events that took place in this area, other reasons for land subsidence are also possible. Radar interferometry methods are used to study many areas related to vertical displacements of the earth’s surface [20,21,22,23]. This includes research on volcanic processes, geodynamic processes in cities, research on landslide processes, the consequences of earthquakes, etc. [24,25,26,27,28,29]. In addition to all this, radar interferometry is also used for the study of objects of historical and cultural heritage.
A significant number of scientists abroad are engaged in the study of the possibility of applying methods of space radar monitoring for lands of historical and cultural purpose in general and for the objects themselves in particular. In Ukraine, this topic is currently new.
Paper [30] discusses the principles of advanced approaches of differential radar interferometry and their application for monitoring structural and soil deformations at historical and cultural heritage sites. Then, the advantages and problems of these approaches are analyzed, followed by a discussion of the choice of radar interferometry systems for various archaeological studies.
Study [31,32] reviews the possibilities of real aperture radar (RAR) interferometry applied to structural vibration monitoring as an alternative to high-resolution methodology for the integration of classical methods with the non-destructive investigation of cultural heritage. The paper demonstrates the effectiveness of the proposed approach for the presented spectral properties and variation in displacements of the oscillatory structures.
In work [33], satellite radar interferometry was successfully applied as a remote sensing tool to provide information on both the spatial and temporal evolution of surface displacements and the interaction with existing structures/infrastructure in cities. The following case studies of remote sensing programs were shown. First, a complementary approach to conventional methods was developed to provide integrated systems to better investigate soil instabilities, for example, landslides. In this regard, radar interferometry can offer a valuable contribution to the characterization of landslide kinematics, allowing for the most accurate information on slope failure mechanisms, including boundaries, states of activity, causative factors, and temporal evolution. Subsequently, the potential of interferometric products for the structural condition monitoring of human-made structures such as buildings, linear infrastructure (roads and bridges), and dams was demonstrated. Historical DInSAR data allowed us to investigate the structural characteristics of these exposed elements as an indicator of their vulnerability, which is a powerful tool to complement classical analysis.
Polarimetric Synthesized Aperture Radar Interferometry (Pol-InSAR) is interferometry between all possible polarization channels at each end of the baseline. With the help of polarimetric interferometry, it is possible to realize a combination of properties of the final structure and spatial information. In article [34], the authors investigated the application of these three approaches to the classification of the earth’s relief based on the results of the evaluation of fully polarimetric SIR-C/X-SAR interferometric data. The potential of Pol-InSAR for land cover classification was demonstrated.
An article by Ukrainian scientists [35] provides the results of deformation monitoring in Zakarpattia Oblast, performed by the radar interferometry method. According to the results of the study, 26 pairs of interferograms of the Carpathian model training ground site were processed for the period 2016–2018. Based on the results of these works, a general map of the vertical displacements of the earth’s surface of the Carpathian training ground site was built. According to the indicators of vertical displacements of the earth’s surface, the territory was classified into 3 zones. The effectiveness of using interferometry data for a detailed analysis of the mode and dynamics of dangerous geological processes has been confirmed. These studies are of great importance, and, with a high resolution and an appropriate processing algorithm, provide reasonable results and conclusions, which, in combination with lithological–stratigraphic, geomorphological, and structural–tectonic studies, can be used to predict dangerous geological processes and minimize their negative impact on nature and people.
Paper [36] investigated the capabilities of the radar interferometry technique for determining external vibration in very large and massive historic masonry bridges. This innovative non-contact method has been used successfully in several works for the dynamic identification of concrete and sometimes brick slender structures, but has rarely been used for large, massive masonry structures. For this purpose, an external vibration study was carried out on a masonry bridge located in Polignano a Mare, a city in southern Italy, using both radar interferometry and traditional accelerometric techniques. A comparison of the results obtained by the two experimental methods highlighted the effectiveness of radar interferometry for determining at least the first natural frequencies of a massive masonry bridge.
Article [37] provides an overview of the results of diagnostic and monitoring activities carried out in recent years using satellite radar interferometry (2011–2016) and on-site measurements (2017–2019) in the historic city of Gubbio, Italy. The study aims to contribute to the understanding of the potential of remote sensing technologies in measuring complex phenomena of deformation in historic buildings, such as those caused by soil–structure interactions and earthquakes. Authors consider the monumental Consoli Palace and the city walls as case studies. The research activity was carried out within the framework of the European project HERACLES, which was funded under Horizon 2020 and aimed at proposing new diagnostic monitoring solutions to increase the resilience of historical and cultural heritage to various types of hazards. Special attention is focused on the cross-correlation of satellite radar interferometry results and in situ structural monitoring data aimed at achieving engineering meaningful results that support decision-making and proactive intervention.
In articles [38,39], there is described the use of the radar interferometry technique to study the depth of subsidence caused by the collapse of a mine cavity in the Lviv region of Ukraine, and an example of the use of satellite radar data to study the vertical displacements of an object of historical and cultural heritage, namely the Zvenigorod hillfort in Ukraine. Preliminary studies were carried out on the territory of the settlement to determine the possible underground rooms of the Zvenigorod castle, of which only the foundation remained, as well as possible underground passages between the objects of the settlement.
Ground Conductivity Meter: Poland Case
The conductivity method (slingram electromagnetic method, or GCM—Ground Conductivity Meter) simultaneously provides three different pieces of information: (1.) the distribution of the apparent resistivity of the ground, (2.) the apparent magnetic susceptibility, and (3.) the characteristic signatures for buried metallic objects in the ground [40]. The first type of information is, in principle, obtainable by any electrical method (e.g., ERT). The other two are specific only to the conductivity method, which allows for somewhat broader interpretative possibilities [41]. This specific geophysical method is designed for high-resolution investigation of shallow layered structures in the frame of agriculture, forestry, archaeology, criminology, road inspection, and civil engineering [42]. The most common application of this method, like other shallow electromagnetic methods, is general and contaminated groundwater studies [43].
The measuring instrument consists of at least two coils, between which a distance s is maintained. These coils constitute two sets: a transmitting set, designated Tx, and a receiving set, designated Rx [44]. Depending on the type of device, these may be single coils or, as in the present case, sets of coils placed at fixed distances inside a special tubular structure [CMD Explorer; Short Guide 2016]. A low-frequency current is generated in the transmitting coil, generating an alternating magnetic field, HP. The generated magnetic field enters the rock medium, generating eddy currents in the medium, which then generate secondary magnetic induction. The secondary magnetic field generated in the medium is measured by a second coil or set of receiving coils. The result of the measurements is usually a two-dimensional representation of the electromagnetic properties mentioned earlier. The depth range is determined primarily by the distance of the magnetic dipoles, and the conductivity maps mostly show no frequency-dependent differences [45].
There is a relationship between the conductivity of the medium and the magnetic field strength generated in the transmitting coil, HP, and measured in the receiving coil, HS. The relationship is represented by the following equation:
In that equation, σα is the apparent conductivity of the medium, HP is the magnetic field amplitude of the transmitting coil, HS is the magnetic field amplitude of the receiving coil, ω represents the circular frequency of the current in the transmitting coil, μ0 is the magnetic permeability of the vacuum, and s is the distance between the centers of the transmitting and receiving coils.
In addition to the value of the electrical conductivity of the ground, the in-phase component is also measured. The measured parameter in phase is a relative quantity, given in dimensionless units (ppt—thousandths). The in-phase value is proportional to the real part of the secondary magnetic field. The measured value of the in phase is most often used to indicate areas of increased magnetic susceptibility [46].
Conductometric surveys in the area of the Kazimierz Biskupi Forest were carried out in 2022 using a CMD MiniExplorer 6L conductivity meter made by the Czech company GF Instruments [47]. The surveys were carried out in several regular test plots in the forest area. The result of the data compilation are maps of the distribution of conductivity and the in-phase parameter at six depths (25 cm, 50 cm, 80 cm, 110 cm, 160 cm, and 230 cm below ground surface) [48,49].
During a phase of comprehensive and structured review, we applied a detailed sorting and filtering approach to the collected data, which was vital for identifying and removing irregularities, particularly individual spikes. This step was crucial to guarantee that the data set used in further analyses was as accurate as possible. Following this stringent purification, we utilized a 1D inversion process employing the Occam algorithm [50], renowned for its effectiveness in handling intricate geophysical inversion tasks. Before the inversion process, conductivities were converted to resistivities. The goal was to establish a foundation of qualitative interpretation for the data management and analysis procedures. In the inversion process, we adopted a nuanced approach wherein each data point received individual attention. Rather than treating them as a collective set, each point was processed independently. This method highlights the unique value and importance of each data fragment. After completing this stage of inversion, we systematically interpolated the data. This essential step aided in creating detailed maps of resistivity distribution. It is important to note that these maps were carefully crafted to align with the sounding depths previously used to measure apparent conductivity [51].
The areas for the geophysical survey were selected based on an analysis of archival material obtained as part of the investigation conducted by the Commission for the Prosecution of Nazi Crimes after the end of the Second World War. Field sketches were found in the archives, which were made during a field inspection in September 1945 in the area where the executions took place (Figure 3). One eyewitness was also present during the field inspection. The sketch contained precise information on the location of the execution sites—the mass graves.
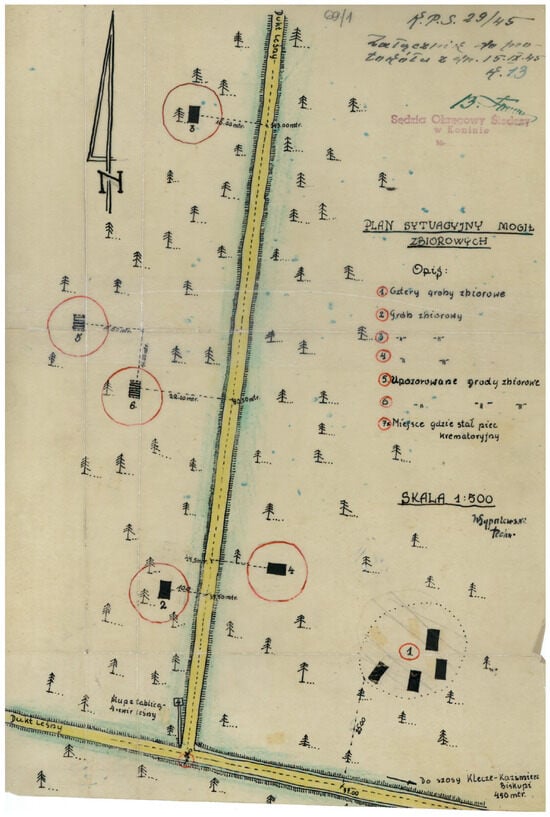
Figure 3.
A survey sketch made on the basis of a field inspection in September 1945. Red circles with numbering mark the locations of the mass graves [© Institute of National Remembrance].
During the field visit in May 2022, the six locations of the burials marked in 1945 were reconstructed. During the GPS survey, it turned out that the two sites numbered 2 and 4 in the sketch are not currently commemorated. Monuments have been erected at the remaining sites 1, 3, 5, and 6. These are both the first commemorations (numbers 3, 5, and 6) and the 2002 commemoration (number 1). It is also surprising that the graves numbered 6 (Figure 4A) and 5 on the sketch are described as fake mass graves. It has not been possible to establish why the areas numbered 2 and 4 on the sketches have not been commemorated. And the graves described as posed (6 and 5) are marked with memorials. In the case of site numbers 2 (Figure 4B) and 4, depressions were noted in the field. A survey grid based on GPS measurements was established for these sites.
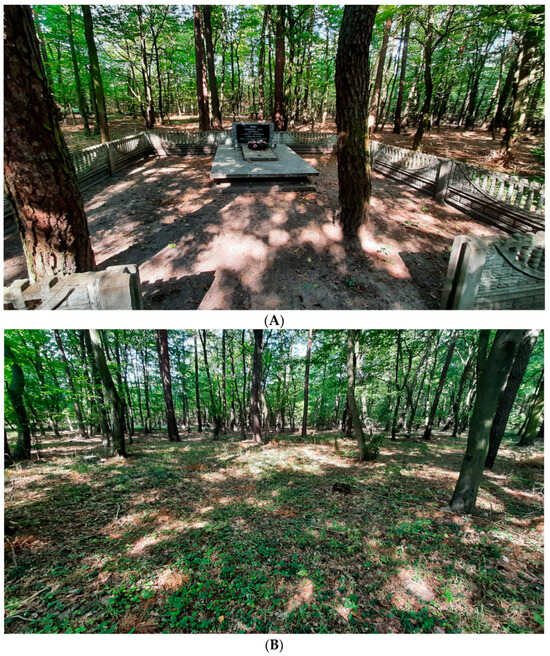
Figure 4.
Photographs taken in May 2022 in Krążel Forest: (A) victims’ memorial marked in sketch with number 6; (B) area marked in sketch with number 2. Photos: S. Różycki.
Similar approaches in the search for burials (based on document analysis, and consecutively, geophysical surveys) are known in the solving of so-called cold cases [52,53], and the search for missing persons [54]. The geophysical prospecting method based on the conductivity EM meter provided positive findings [55].
Additional material in the form of an archival aerial photograph acquired by the Luftwaffe in 1942 and an up-to-date orthophoto from 2021 were also used (Figure 5). These were used for combined visual analysis in ArcGIS Pro software (ArcGIS Pro v.3.0, ESRI, Inc., Redlands, CA, USA).
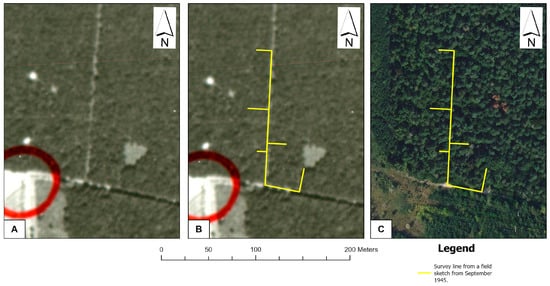
Figure 5.
Execution site in the Krążel Forest: (A) part of an aerial photo taken in 1942 (© NARA); (B) part of an aerial photo taken in 1942 with survey line from a field sketch from September 1945 (© NARA); (C) recent orthophoto (2021) with survey line from a field sketch from September 1945 [© Head Office of Geodesy and Cartography in Poland].
4. Results
4.1. Citadel in the City of Lviv
The ensemble of defensive structures Citadel—the site of the concentration camp “Stalag-328”—was included in the list of objects of cultural heritage of the Lviv region by order of the Ministry of Culture of Ukraine No. 957/0/16-10, dated 25 October 2010. By this, it entered into the State Register of Immovable Monuments of Ukraine in the category of national significance, type of object—monument of history, architecture, and urban planning. At the same time, the boundaries of the object of historical and cultural heritage were defined as it was described in the post-war plan of the NKVD, when the Soviet authorities determined the scope of Nazi crimes on the territory of the POW concentration camp.
But from historical literary sources, written testimonies of eyewitnesses, and a partial natural survey of the territory, it is reliably known that under the territory of the Citadel defensive structures, underground passages were laid as early as Austrian times. They connected the four Maximilian towers of infrastructure facilities with the barracks building and possibly were connected with a network of other underground passageways that existed under Lviv City. Figure 6 shows a modern plan of the territory of the Lviv Citadel at a 1:2000 scale with the boundaries of the historical and cultural heritage object, which is included in the register of monuments.
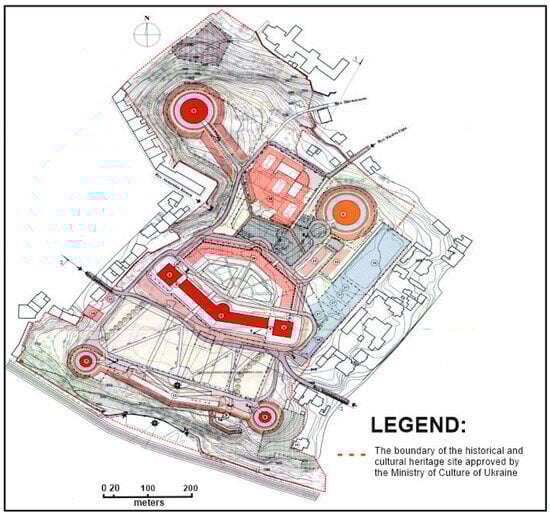
Figure 6.
The plan of the territory of the Lviv Citadel with the marked boundary of the object of historical and cultural heritage (thickened red line).
From the survey of the territory, it is known for certain that one underground passage ends in the middle of the northern slope of the object, where there is a bricked-up exit. It is also known as a part of the underground passage near the southern right Maximilian tower. It existed for a long time in the form of a sinkhole, until it was filled in by the city authorities to avoid accidents of rubble or the suffocation of children who may climb into the underground passage out of curiosity.
Currently, there is no free access to the towers for field research except for the destroyed southern right Maximilian tower. It is unlikely that the entrances to the dungeons have remained to this day; most likely, they were bricked up during Soviet times.
Satellite radar images were processed in ENVI SARScape 5.2 software (NV5, Hollywood, FL, USA). These images were acquired in C-range with VV+VH polarization and Wideswath (IW) interferometric mode. In this case, the bandwidth of each image is 250 km.
Sentinel-1A images are available in three levels of processing: Level-0, Level-1, and Level-2. Our input data have the first level of processing. Level 1 data are publicly available products designed for most data users. Level-1 products are produced as Single Look Complex (SLC) and Ground Range Detected (GRD).
After receiving the interferograms, we determined the extremes of vertical displacements, i.e., the points at which the subsidence of the earth’s cover is the largest and smallest. Since we were interested only in the study of the subsidence of the surface as a result of the detection of cavities, we immediately rejected the points with minimal vertical displacements. There were 24 points of maximum land cover displacements. The range of vertical ground displacements at these points varies from 17 to 36 cm. Since the visual component for this territory in the images from the Sentinel-1 satellite is quite poor due to the low spatial resolution of the data of this system, we decided to export these points to MapInfo GIS (Pitney Bowes, Troy, NY, USA) for further analysis. For this purpose, we referenced in this software a modern space image of the GeoEye-1 satellite obtained in 2021 and a modern topographical plan of the territory at scale 1:2000. When points were transferred from a space image, their exact location was obtained for further analysis (Figure 7).
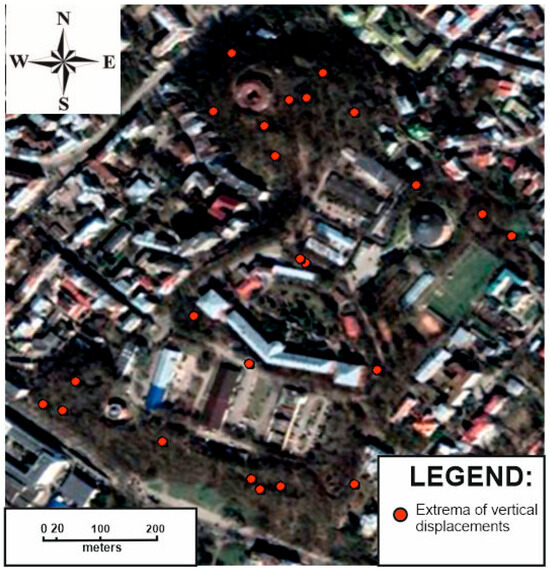
Figure 7.
Space image of GeoEye-1 satellite obtained in 2021 with the points of largest vertical displacements [© map data ©2023 Google].
However, it should be noted that during the existence of the Stalag-328 POW concentration camp in the territory of the Lviv Citadel during the Second World War, mass shootings and the burning of the bodies of prisoners of war were carried out by the Nazis. These facts are definitely known from historical sources and archives.
Considering these facts, significant subsidence of the earth’s surface could also occur in those places where these war crimes actually took place. For the analysis of similar cases, the previous work of part of the authors’ team was used [56], where, based on the interpretation of the data of an archival aerial photograph of 1944, possible places of mass graves in the territory of the Citadel were determined. A topographical plan with the locations of possible burials was also attached to the rest of the data. The points with maximum vertical displacement were also plotted on this plan for the analysis (Figure 8).
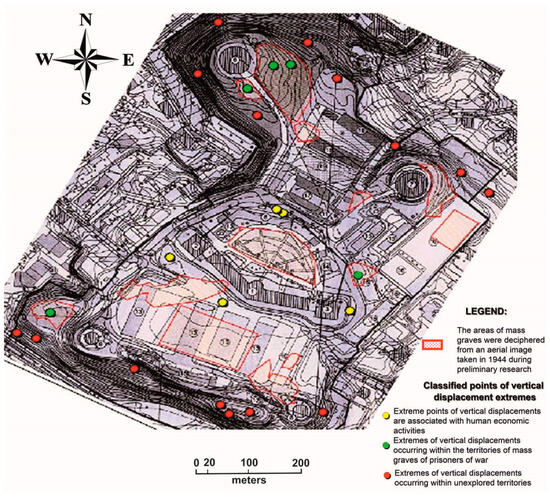
Figure 8.
Topographical plan with marked polygonal objects of possible fraternal burials (pink background outlined with red lines) with the points of largest vertical displacements.
As can be seen from Figure 8, four points actually fall into the places of possible mass graves, so it can be assumed that significant indicators of vertical displacements of the earth are caused by still-subsiding soils. By the way, in these areas, subsidence indicators range from 17 to 19 cm, which are the smallest values of all points. These points are marked in the figure in green.
A part of the points, with values of subsidence 18–22 cm, lays on the built-up area in the middle of the object. There are asphalt and tile cover and office premises on this territory. Additionally, work on the development of this area and certain repair work are frequently being conducted, so we also rejected these points, because most likely such indicators in these five points are related to the mentioned reason. These points are marked in yellow in the figure.
There are 15 points left around the Maximilian towers in the undeveloped area where the soil actually remained from the time of the Second World War without additional human intervention. At these points, the largest displacements were from 20 to 36 cm. In Figure 8, these points are marked in red, and it can be assumed by analyzing their location that they may belong to the surface of underground passages that subside over time.
By connecting all these points together, a possible network of underground passages is obtained, which connects the Maximilian towers and goes beyond the boundaries of the ensemble of defensive structures. The interconnected points of maximum vertical displacements are shown in red lines in Figure 9. These points can also be connected crosswise so that they pass through the barracks building with which, in our opinion, the Maximilian towers should be connected. However, since it is difficult to judge the nature of vertical displacements in the built-up area, we will omit it at this stage of the research.
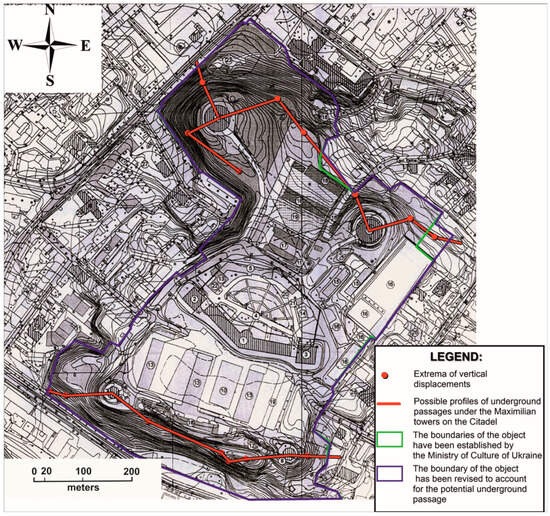
Figure 9.
Topographical plan showing the possible profiles of underground passages under the Maximilian towers on the Citadel, which go beyond the established boundaries of the historical and cultural heritage site.
As can be seen from the figure, the red lines, which possibly repeat the approximate profiles of underground connections between the infrastructure objects of the defense structures ensemble, in four places go beyond the established boundaries of the object of historical and cultural heritage. According to the obtained results, these boundaries should be clarified, according to which the buffer of the object’s protection zone should be changed, and, therefore, the territory’s definition as lands of historical and cultural purpose should be changed.
4.2. Kazimierz Biskupi Forest
Electromagnetic measurements employing the slingram method were meticulously executed at two designated research sites nestled within the confines of the Krążel Forest, proximate to Kazimierz Biskupi. The primary research ambit encompassed a larger expanse, characterized by locales suspected to harbor potential mass graves, delineated by deep entrenchments prominently marked as site 1 in Figure 3. Conversely, a more confined research domain, denoted as site 2 within the same illustration, was specifically targeted for the detection of ashes arising from the incineration of bodies.
Each research area underwent exhaustive scrutiny; we employed a dense grid pattern comprising both parallel and perpendicular profiles. However, the initial survey area presented unique challenges; here, profile lengths varied due to terrain impediments such as dense shrubbery. Although traversing these obstacles proved physically viable, maintaining consistent measurement geometry was an uphill task, fraught with the risk of introducing measurement artifacts. Despite these obstacles, profiles in both study areas were meticulously spaced approximately 0.5 m apart.
The measurements were meticulously conducted with a temporal step of 0.5 s, culminating in an average spatial resolution of approximately 0.5 m in the field. The dimensions of the exploration polygons diverged between the two sites, with the first research area, primarily focused on the localization of burial ditches, expansively spanning 35 m by 20 m. Meanwhile, the second polygon, dedicated to the meticulous search for traces of ashes, occupied a more constrained footprint, measuring 12 m by 20 m in size.
Maps of conductivity distribution at the two most representative depths for each area will be presented. The depths chosen are 80 cm and 160 cm below the ground surface. The shallowest depth at which we expected to detect anomalies from mass graves was half a meter below the surface. However, after a thorough analysis of the data from individual measurement points, significant changes in conductivity were concentrated in the layer between 70 and 90 cm below the surface. Unfortunately, due to the limited depth range of the instrument used, we were unable to definitively determine the bottom of the structure in both cases.
They are summarized in Figure 10, for the area covering the possible presence of mass graves, and Figure 11 for the second of the surveyed polygons.
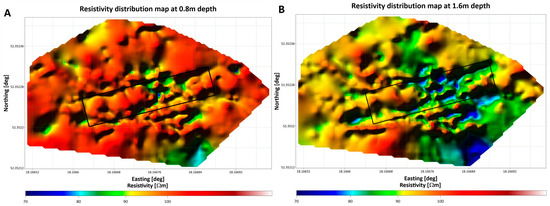
Figure 10.
Resistivity distribution map of the research polygon 1 (tombs) at 80 cm BGS (A), and 160 cm BGS (B). The black rectangle marks the hypothetical location of the mass grave.
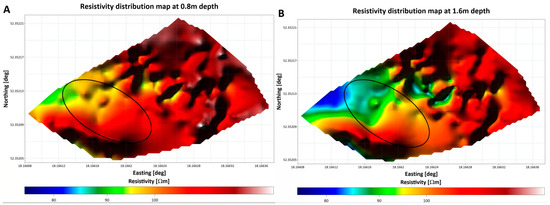
Figure 11.
Resistivity distribution map on the research polygon 2 (ashes) at 80 cm BGS (A), and 160 cm BGS (B). The black ellipse marks the hypothetical location of the area where the ashes were scattered.
Analyzing the results obtained for the area of potential mass graves (Figure 10), a decrease in average resistivity with depth is evident. In addition, a local minimum of resistivity located approximately in the central part of the study area, and continuing southward, is evident. To a slightly lesser extent, a structure with reduced resistivity similar to a wide ditch in the NNW–SSE alignment is noticeable. This structure is weakly marked on the distribution of resistivity at a depth of 80 cm below the ground surface (Figure 10A), while it is much more pronounced for the results obtained at greater depths, as shown, for example, by the distribution of resistivity at a depth of 160 cm below the surface (Figure 10B).
In the second polygon, it is clear that the average electrical resistivity of the area is higher. Moreover, there is a region of low resistivity in the western part (refer to Figure 11A), which, similarly to the earlier scenario, becomes more prominent in resistivity maps at greater depths, such as 160 cm beneath the surface (see Figure 11B). Additionally, the orientation of this low-resistivity wedge towards the southeast can be observed.
In both of the examined cases, the resistivity scale depicted in the figures is quite limited. It is important to note that the area exhibits minimal variation in resistivity, thus requiring a distinct demarcation between low and high areas of local resistivity. Therefore, to accurately portray these variations, it was necessary to emphasize the distinctions between the regions with minimal and maximal resistivity values. Additionally, the homogeneous nature of the subsurface materials made it challenging to interpret the resistivity data. By refining the resistivity scale and enhancing the contrast between low and high resistivity zones, we were able to identify potential anomalies more clearly. This method was crucial in identifying subsurface anomalies, even when the signals were faint, providing valuable insights despite the limited depth range of the instrument.
5. Discussion
Both innovative remote methods and terrestrial non-invasive research provide additional opportunities for the study of immovable monuments of historical and cultural purpose. Satellite radar interferometry belongs to such methods. Implementing the processing of a series of space images obtained from the Sentinel-1A satellite over three years, it was possible to additionally investigate the territory of the ensemble of defensive structures of the Citadel in Lviv, which is included in the list of objects of historical and cultural heritage. There are doubts that the boundary of the object, determined in 2010 on the basis of the Soviet plan-scheme of the post-war years, does not quite correspond to reality, and the area of the object is actually larger due to the network of underground passages. Thirty-six images were used in the study. With the help of the obtained interferograms, it was possible to determine the extremes of vertical displacements of the earth in the studied area. After rejecting the indicators of the smallest displacements, only the maximum displacements were left. There were 24 points of such displacements. The vertical displacements of the earth at these points ranges from 17 to 36 cm. After conducting additional research, it was possible to reject four points that fall into places designated as areas of mass graves, and five points that are inside the territory of the object in the built-up area. There was an assumption that vertical displacements in the built-up area arose as a result of certain repair works. Thus, 15 points remained, located around the Maximilian towers in the undeveloped area and probably related to the above-ground soil of the underground passages. The location of three of these points in places where there is knowledge of underground passages as a result of a field survey of the territory only strengthens the assumption. Thus, the points of the largest vertical displacements were connected, and it was assumed that the network of underground passages runs approximately in this way. This network in at least four places goes beyond the defined boundaries of the object of historical and cultural heritage, which may indicate the need to revise these boundaries and, accordingly, increase the area of the territory that can be defined as lands of historical and cultural purpose.
In the case of the Krążel Forest in Poland, field surveys were carried out to expand the protection zone, which included World War II execution sites. Non-invasive surveys based on conductometer surveys were proposed.
Summarizing the obtained resistivity result should be contrasted with geological and historical knowledge. The study area is dominated by sands, which are characterized by rather high resistivities. Arranged fairly regularly, in the first case studied, quasi-linear anomalies of reduced resistivity may correspond to mass graves. If supplemented with information on the manner of mass murder carried out at this site, using calcium oxide quenching, the remains of biological material may give a lower-resistivity image. The anomalies detected correspond to sites that were indicated as mass graves on sketches made after the end of the war by prosecution commissions.
In the second case under examination, focused on the identification of ash storage sites, a similar geological setting was encountered as in the previous case. The investigation targeted areas within the high-resistivity quaternary sands. Notably, within this geological context, local reductions in resistivity were observed, coinciding with the sought-after objects associated with ash storage.
In the case of searching for mass graves, the use of an EM instrument that simultaneously provided magnetic susceptibility and conductivity properties [47] allowed us to determine the location of two burials. Measurements in Poland were made using the electromagnetic slingram method. Using this method, the distribution of resistivity was determined, and we supported the interpretation with the in-phase parameter. To gain a comprehensive understanding of the area, it is recommended to supplement these findings with magnetic gradiometer surveys [57,58]. Such surveys can help pinpoint magnetic anomalies, facilitating correlation with resistivity distribution results [59]. However, given the inherent limitations of the described method, it is advisable to conduct a reconnaissance of Electrical Resistivity Tomography (ERT) profiles. Ground-Penetrating Radar (GPR) profiles could also prove useful in this case [60].
Similarly, for the case under investigation in Ukraine, it is proposed to conduct ERT measurements. Emphasis should be placed on executing extensive profiles with wider measurement intervals, initially. Subsequently, in areas showing promise, detailed surveys with closely spaced electrodes should be carried out to capture finer subsurface details and anomalies. This phased approach allows for a more comprehensive exploration of the subsurface characteristics, enhancing the overall understanding of the geological and archaeological features within the region.
6. Conclusions
The selection of methods in the presented article was dictated by both the specific field conditions and the availability of technology. The selected research sites are characterized by the same historical period, and the main objective of the study was to present various non-invasive prospecting techniques for detecting underground objects. The obtained results make it possible to start a discussion on extending adequate commemoration to the identified sites. The presented example of a burial site in the Krążel Forest is one of many undocumented Holocaust sites in Poland, which also exist in Ukraine—there are hundreds of graves, some with as few as a dozen victims. The research undertaken makes it possible to highlight the problem of researching to find and properly commemorate them. The proposed non-invasive methods allowed the designation of protection zones of historical–cultural significance in both Poland and Ukraine.
Author Contributions
Conceptualization, B.C., S.R. and S.O.; methodology, B.C., S.R. and S.O.; software, L.B. and S.O.; validation, B.C., L.B., S.O. and S.R.; formal analysis, L.B. and S.O.; investigation, B.C., S.R. and S.O.; resources, L.B.; data curation, L.B.; visualization, S.R. and S.O.; writing—original draft preparation, S.R., B.C. and S.O. All authors have read and agreed to the published version of the manuscript.
Funding
This work was supported by the Polish National Agency for Academic Exchange within the project “Development of strategic cooperation between Warsaw University of Technology and Lviv Polytechnic National University in the field of geomatics” agreement number BPI/PST/2021/1/00044/U/00001.
Data Availability Statement
The data from Head Office of Geodesy and Cartography (Poland) are available publicly. The photographs available in the National Archives and Records Administration are shared on a public domain basis. The data can be requested from the corresponding author.
Conflicts of Interest
The authors declare no conflicts of interest.
References
- Olivito, R.S.; Porzio, S.; Scuro, C.; Carnì, D.L.; Lamonaca, F. Inventory and monitoring of historical cultural heritage buildings on a territorial scale: A preliminary study of structural health monitoring based on the CARTIS approach. Acta IMEKO 2021, 10, 57–69. [Google Scholar] [CrossRef]
- Agapiou, A.; Lysandrou, V.; Alexakis, D.D.; Themistocleous, K.; Cuca, B.; Argyriou, A.; Hadjimitsis, D.G. Cultural heritage management and monitoring using remote sensing data and GIS: The case study of Paphos area, Cyprus. Comput. Environ. Urban Syst. 2015, 54, 230–239. [Google Scholar] [CrossRef]
- Yang, J. The underground luxury of a Western Han Marquis: Major discoveries from the tomb of the Marquis of Haihun in Nanchang. Asian Archaeol. 2019, 2, 65–102. [Google Scholar] [CrossRef]
- Grinzato, E.P.G.B.; Bison, P.G.; Marinetti, S. Monitoring of ancient buildings by the thermal method. J. Cult. Herit. 2002, 3, 21–29. [Google Scholar] [CrossRef]
- Ardelean, A.C.; Sărășan, A.; Bălărie, A.; Akmatov, K.; Tabaldiev, K.; Wehrheim, R. Above ground and underground–An integrated approach of the burial mounds within the Suusamyr plateau, Kyrgyzstan. Archaeol. Res. Asia 2023, 35, 100463. [Google Scholar] [CrossRef]
- Varriale, R.; Parise, M.; Genovese, L.; Leo, M.; Valese, S. Underground Built Heritage in Naples: From Knowledge to Monitoring and Enhancement. In Handbook of Cultural Heritage Analysis; D’Amico, S., Venuti, V., Eds.; Springer: Cham, Switzerland; Berlin, Germany, 2022. [Google Scholar] [CrossRef]
- Mu, B.G.; Zhang, Y.; Yu, Y.J.; Petropoulos, E. Biomass material amendment maintained the structure of underground cultural relics by decreasing the variation of soil water content. Appl. Ecol. Environ. Res. 2022, 20, 801–814. [Google Scholar] [CrossRef]
- Rodríguez-Gonzálvez, P.; Nocerino, E.; Menna, F.; Minto, S.; Remondino, F. 3D surveying & modeling of underground passages in WWI fortifications. The International Archives of the Photogrammetry. Remote Sens. Spat. Inf. Sci. 2015, 40, 17–24. [Google Scholar]
- Yang, J.; You, Y.; Ye, X.; Lin, J. Cultural heritage sites risk assessment based on RS and GIS—Takes the Fortified Manors of Yongtai as an example. Int. J. Disaster Risk Sci. 2023, 88, 103593. [Google Scholar] [CrossRef]
- Nistor, S.; Machat, C.; Majaru, A.R. Romania: Follow-up on Roşia Montana and the Preservation of its Cultural and Natural Heritage/First Results in Safeguarding the Transylvanian Saxon Architectural Heritage/The Threats to and the Protection of the Architectural Heritage of Manor Estates. Herit. Risk 2014, 122–131. [Google Scholar]
- Castagnetti, C.; Cosentini, R.M.; Lancellotta, R.; Capra, A. Geodetic monitoring and geotechnical analyses of subsidence induced settlements of historic structures. Struct. Health Monit. 2017, 24, e2030. [Google Scholar] [CrossRef]
- Marignani, M.; Rocchini, D.; Torri, D.; Chiarucci, A.; Maccherini, S. Planning restoration in a cultural landscape in Italy using an object-based approach and historical analysis. Landsc. Urban Plan. 2008, 84, 28–37. [Google Scholar] [CrossRef]
- Fry, G. From objects to landscapes in natural and cultural heritage management: A role for landscape interfaces. In Landscape Interfaces: Cultural Heritage in Changing Landscapes; Springer: Dodrecht, The Netherlands, 2003. [Google Scholar]
- Leszczyński, K. Eksterminacja Ludności na Ziemiach Polskich Wcielonych do Rzeszy; Wydawnictwo Zachodnie: Poznań, Poland, 1962. [Google Scholar]
- Grzywacz, M. Pole eksperymentalne Warthegau. Glossy do pewnych wypowiedzi Edyty Stein. Zesz. Nauk. Cent. Badań Im. Edyty Stein 2014, 11, 185–197. [Google Scholar] [CrossRef]
- Szymoniczek, J. Instytucjonalizacja współpracy w zakresie grobownictwa wojennego. Rocz. Pol.-Niem./Dtsch.-Pol. Jahrb. 2015, 23, 88–103. [Google Scholar] [CrossRef]
- Epstein, C. Germanization in the Warthegau: Germans, Jews and Poles and the Making of a ‘German’ Gau. In Heimat, Region, and Empire. The Holocaust and Its Contexts; Szejnmann, C.W., Umbach, M., Eds.; Palgrave Macmillan: London, UK, 2012. [Google Scholar] [CrossRef]
- Piskorski, J.M. From Munich through Wannsee to Auschwitz: The Road to the Holocaust*: Translated by Piotr górecki. J. Hist. Soc. 2007, 7, 155–175. [Google Scholar] [CrossRef]
- Glowacka-Penczynska, A.; Kawski, T.; Medykowski, W. The First to Be Destroyed: The Jewish Community of Kleczew and the Beginning of the Final Solution; Academic Studies Press: Boston, MA, USA, 2015. [Google Scholar]
- Tapete, D.; Fanti, R.; Cecchi, R.; Petrangeli, P.; Casagli, N. Satellite radar interferometry for monitoring and early-stage warning of structural instability in archaeological sites. J. Geophys. Eng. 2012, 9, S10–S25. [Google Scholar] [CrossRef]
- Tapete, D.; Casagli, N.; Luzi, G.; Fanti, R.; Gigli, G.; Leva, D. Integrating radar and laser-based remote sensing techniques for monitoring structural deformation of archaeological monuments. J. Archaeol. Sci. 2013, 40, 176–189. [Google Scholar] [CrossRef]
- Wasowski, J.; Bovenga, F. Investigating landslides and unstable slopes with satellite multi temporal interferometry: Current issues and future perspectives. Eng. Geol. 2014, 174, 103–138. [Google Scholar] [CrossRef]
- Zeni, G.; Bonano, M.; Casu, F.; Manunta, M.; Manzo, M.; Marsella, M.; Pepe, A.; Lanari, R. Long-term deformation analysis of historical buildings through the advanced SBAS-DInSAR technique: The case study of the city of Rome, Italy. J. Geophys. Eng. 2011, 8, S1–S12. [Google Scholar] [CrossRef]
- Buckley, S.N.; Rosen, P.A.; Hensley, S.; Tapley, B.D. Land subsidence in Houston, Texas, measured by radar interferometry and constrained by extensometers. J. Geophys. Res. 2003, 108, 2542. [Google Scholar] [CrossRef]
- Chen, F.; Lin, H.; Zhou, W.; Hong, T.; Wang, G. Surface deformation detected by ALOS PALSAR small baseline SAR interferometry over permafrost environment of Beiluhe section, Tibet Plateau, China. Remote Sens. Environ. 2013, 138, 10–18. [Google Scholar] [CrossRef]
- Cigna, F.; Osmanoğlu, B.; Cabral-Cano, E.; Dixon, T.H.; Ávila-Olivera, J.A.; Garduño-Monroy, V.H.; DeMets, C.; Wdowinski, S. Monitoring land subsidence and its induced geological hazard with Synthetic Aperture Radar Interferometry: A case study in Morelia, Mexico. Remote Sens. Environ. 2012, 117, 146–161. [Google Scholar] [CrossRef]
- Glisic, B.; Inaudi, D.; Posenato, D.; Figini, A.; Casanova, N. Monitoring of heritage structures and historical monuments using long-gage fiber optic interferometric sensors—An overview. In Proceedings of the 3rd International Conference on Structural Health Monitoring of Intelligent Infrastructure-SHMII-3, Vancouver, BC, Canada, 13–16 November 2007. [Google Scholar]
- Giannico, C.; Ferretti, A.; Alberti, S. Satellite Radar interferometry: A new monitoring tool for cultural heritage sites. In Proceedings of the International Conference: Built Heritage 2013. Monitoring Conservation and Management, Milan, Italy, 18–20 November 2013; pp. 655–662. [Google Scholar]
- Parcharidis, I.; Foumelis, M.; Pavlopoulos, K.; Kourkouli, P. Ground deformation monitoring in cultural heritage areas by time series SAR interferometry: The case of ancient Olympia site (western Greece). In Proceedings of the ESA FRINGE Workshop, Frascati, Italy, 30 November–4 December 2009. [Google Scholar]
- Zhou, W.; Chen, F.; Guo, H. Differential Radar Interferometry for Structural and Ground Deformation Monitoring: A New Tool for the Conservation and Sustainability of Cultural Heritage Sites. Sustainability 2015, 7, 1712–1729. [Google Scholar] [CrossRef]
- Luzi, G.; Monserrat, O.; Crosetto, M. The potential of coherent radar to support the monitoring of the health state of buildings. Res. Nondestruct. Eval. 2012, 23, 125–145. [Google Scholar] [CrossRef]
- Luzi, G. Radar Interferometry for Cultural Heritage Monitoring. In Proceedings of the 11th International Conference on Non-Destructive Investigations and Microanalysis for the Diagnostics and Conservation of Cultural and Environmental Heritage—ART-2014, Madrid, Spain, 11–13 June 2014. [Google Scholar]
- Di Martire, D.; Infante, D.; Ramondini, M.; Calcaterra, D. The Contribution of Satellite Radar Interferometry for Land Management Activities. In Proceedings of the Critical Thinking in the Sustainable Rehabilitation and Risk Management of the Built Environment, Iași, Romania, 7–9 November 2019. [Google Scholar]
- Zhen, Y.; Ruliang, Y. Application of polarimetric synthetic aperture radar interferometry for land cover classification. In Proceedings of the 2002 IEEE Radar Conference (IEEE Cat. No.02CH37322), Long Beach, CA, USA, 25 April 2002; pp. 459–463. [Google Scholar] [CrossRef]
- Uglitskih, E.; Vyzhva, S.; Ivanik, O. Vertical displacement monitoring of Zakarpattya region territory based on radar interferometry data. Visnyk Taras Shevchenko Natl. Univ. Kyiv Geol. 2020, 4, 94–99. [Google Scholar] [CrossRef]
- Camassa, D.; Castellano, A.; Fraddosio, A. Ambient vibration tests of a historical masonry bridge by means of radar interferometry. In Proceedings of the 2022 IEEE International Workshop on Metrology for Living Environment (MetroLivEn), Cosenza, Italy, 25–27 May 2022. [Google Scholar] [CrossRef]
- Cavalagli, N.; Kita, A.; Falco, S.; Trillo, F.; Costantini, M.; Ubertini, F. Satellite radar interferometry and in-situ measurements for static monitoring of historical monuments: The case of Gubbio, Italy. Remote Sens. Environ. 2019, 235, 111453. [Google Scholar] [CrossRef]
- Trevoho, I.; Chetverikov, B.; Babiy, L.; Malanchuk, M. Monitoring of displacements and deformations of the earth’s surface near the Stebnyk city using radar images of Sentinel-1. Geod. Cartogr. 2020, 69, 85–96. [Google Scholar] [CrossRef]
- Chetverikov, B. Research of the DEM of the Zvenyhorod Hillfort for priority areas for the analysis of vertical displacements. In Proceedings of the GeoTerrace-2022: International Scientific and Technical Conference of Young Scientists, Lviv, Ukraine, 3–5 October 2022. [Google Scholar]
- Tabbagh, A. What is the best coil orientation in the slingram electromagnetic prospecting method? Archaeometry 1986, 28, 185–196. [Google Scholar] [CrossRef]
- Klityński, W.; Oryński, S.; Nguyen Dinh, C. The Potential Use of Ground Conductivity Meters to Identify the Location of Seepages—Case Study of the Maniów Levee Near Krakow, Poland. Geosciences 2020, 10, 97. [Google Scholar] [CrossRef]
- Kamm, J.; Becken, M.; Pedersen, L.B. Inversion of slingram electromagnetic induction data using a Born approximation. Geophysics 2013, 78, 1942–2156. [Google Scholar] [CrossRef]
- Oryński, S.; Okoń, M.; Klityński, W. Very Low Frequency Electromagnetic Induction Surveys in Hydrogeological Investigations; Case Study from Poland. Acta Geophys. 2016, 64, 2322–2336. [Google Scholar] [CrossRef][Green Version]
- McNeill, J.D. Electrical Conductivity of Soils and Rocks; Technical Note TN-5; Geonics Limited: Mississauga, ON, Canada, 1980. [Google Scholar]
- Klityński, W.; Oryński, S.; Nguyen Dinh, C. Application of the conductive method in the engineering geology: Ruczaj district in Kraków, Poland, as a case study. Acta Geophys. 2019, 67, 1791–1798. [Google Scholar] [CrossRef]
- McNeill, J.D. Electromagnetic Terrain Conductivity Measurement at Low Induction Numbers; Technical Note TN-6; Geonics Limited: Mississauga, ON, Canada, 1980. [Google Scholar]
- Bonsall, J.; Fry, R.; Gaffney, C.; Armit, I.; Beck, A.; Gaffney, V. Assessment of the CMD Mini-Explorer, a New Low-frequency Multi-coil Electromagnetic Device, for Archaeological Investigations. Archaeol. Prospect. 2013, 20, 219–231. [Google Scholar] [CrossRef]
- Beamish, D. Low induction number, ground conductivity meters: A correction procedure in the absence of magnetic effects. J. Appl. Geophys. 2011, 75, 244–253. [Google Scholar] [CrossRef]
- Chtouki, M.; Nguyen, F.; Garré, S. Optimizing phosphorus fertigation management zones using electromagnetic induction, soil properties, and crop yield data under semi-arid conditions. Environ. Sci. Pollut. Res. 2023, 30, 106083–106098. [Google Scholar] [CrossRef]
- Constable, S.C.; Parker, R.L.; Constable, C.G. Occam’s inversion: A practical algorithm for generating smooth models from electromagnetic sounding data. Geophysics 1987, 52, 289–300. [Google Scholar] [CrossRef]
- Oryński, S.; Kowalczyk, S.; Owoc, B. Ground penetrating radar and magnetic gradient distribution approach for subsurface investigation of solution pipes in post-glacial settings. Open Geosci. 2023, 15, 20220484. [Google Scholar] [CrossRef]
- Pringle, J.K.; Ruffell, A.; Wisniewski, K.D.; Davenward, B.; Heaton, V.; Hobson, L. Historic child homicide burial search in rural woodland. Forensic Sci. Int. 2023, 8, 100324. [Google Scholar] [CrossRef]
- Wisniewski, K.D.; Cooper, N.; Heaton, V.; Hope, C.; Pirrie, D.; Mitten, A.J.; Pringle, J.K. The Search for “Fred”: An Unusual Vertical Burial Case. J. Forensic. Sci. 2019, 64, 1530–1539. [Google Scholar] [CrossRef]
- Molina, C.M.; Wisniewski, K.D.; Salamanca, A.; Saumett, M.; Rojas, C.; Gómez, H.; Pringle, J.K. Monitoring of simulated clandestine graves of victims using UAVs, GPR, electrical tomography and conductivity over 4–8 years post-burial to aid forensic search investigators in Colombia, South America. Forensic Sci. Int. 2024, 355, 111919. [Google Scholar] [CrossRef]
- Thiesson, J.; Dabas, M.; Flageul, S. Detection of resistive features using towed slingram electromagnetic induction instruments. Archaeol. Prospect. 2009, 16, 103–109. [Google Scholar] [CrossRef]
- Chetverikov, B.; Babiy, L. Methods of creation of historical situation plan concentration camp “Stalag-328”(Citadel) in Lviv(Ukraine) on the base archival aerial image. Modern Achievem. Geod. Sci. Prod. 2014, 28, 71–73. [Google Scholar]
- Bevan, B. The search for graves. Geophysics 1991, 56, 1310–1319. [Google Scholar] [CrossRef]
- Buck, S.C. Searching for graves using geophysical technology: Field tests with ground penetrating radar, magnetometry, and electrical resistivity. J. Forensic Sci. 2003, 48, JFS2002165. [Google Scholar] [CrossRef]
- Bondar, K.; Fassbinder, J.W.E.; Didenko, S.V.; Hahn, S. Rock magnetic study of grave infill as a key to understanding magnetic anomalies on burial ground. Archaeol. Prospect. 2021, 29, 139–156. [Google Scholar] [CrossRef]
- Martin, J.M.; Everett, M.E. A methodology for the self-training and self-assessing of new GPR practitioners: Measuring diagnostic proficiency illustrated by a case of a historic African-American cemetery for unmarked graves. Archaeol. Prospect. 2023, 30, 311–325. [Google Scholar] [CrossRef]


Disclaimer/Publisher’s Note: The statements, opinions and data contained in all publications are solely those of the individual author(s) and contributor(s) and not of MDPI and/or the editor(s). MDPI and/or the editor(s) disclaim responsibility for any injury to people or property resulting from any ideas, methods, instructions or products referred to in the content. |
© 2024 by the authors. Licensee MDPI, Basel, Switzerland. This article is an open access article distributed under the terms and conditions of the Creative Commons Attribution (CC BY) license (https://creativecommons.org/licenses/by/4.0/).