Article

Effects of Soil Moisture and Atmospheric Vapor Pressure Deficit on the Temporal Variability of Productivity in Eurasian Grasslands

1
College of Grassland Agriculture, Northwest A&F University, Yangling 712100, China
2
State Key Laboratory of Soil Erosion and Dryland Farming on Loess Plateau, Northwest A&F University, Yangling 712100, China
*
Author to whom correspondence should be addressed.
Remote Sens. 2024, 16(13), 2368; https://doi.org/10.3390/rs16132368
Submission received: 7 June 2024 / Revised: 21 June 2024 / Accepted: 24 June 2024 / Published: 28 June 2024
(This article belongs to the Special Issue Mapping Essential Elements of Agricultural Land Using Remote Sensing)

Abstract

:
The grasslands in high-latitude areas are sensitive to climate warming and drought. However, the drought stress effect on the long-term variability of grassland productivity at the continental scale still hinders our understanding. Based on aboveground net primary production (ANPP) surveys, satellite remote sensing Normalized Difference Vegetation Index (NDVI), and meteorological data, we comprehensively analyzed three Aridity metrics and their effect on ANPP in Eurasian grassland from 1982 to 2020. Our results showed that the ANPP had an overall uptrend from 1982 to 2020, increasing most in the Tibetan Plateau alpine steppe subregion (TPSSR). Among three Aridity indicators, vapor pressure deficit (VPD) had an overall uptrend, while the trend of Aridity and soil moisture (SM) was insignificant from 1982 to 2020. Soil drought had negative effects on ANPP for all Eurasian grassland, while the atmospheric VPD had a positive effect on ANPP for TPSSR and the Mongolian Plateau steppe subregion (MPSSR), but a negative effect for the Black Sea–Kazakhstan steppe subregion (BKSSR) which was the driest subregion. SM had been the predominant driving factor for the interannual variability of ANPP in MPSSR since 1997. The increasing VPD had facilitated grassland productivity in alpine grasslands due to its cascading effect with an increasing temperature after 2000. The cascading effects networks of climate factors—drought factors (VPD, Aridity, and SM)—ANPP (CDA–CENet) indicated that SM was the predominant driving factor of the interannual variability of ANPP in MPSSR and BKSSR, and the dominance of SM had enhanced after the year 1997. The inhibitory effect of VPD on ANPP transformed into a facilitating effect after 1997, and the facilitating effect of SM is weakening in TPSSR.

1. Introduction

Grassland ecosystems cover about 40% of the terrestrial ecosystems and are mainly distributed in arid, semiarid, and alpine regions [1]. Grassland ecosystems provide a wide range of ecosystem services, such as biodiversity maintenance, carbon sequestration, and livestock [2]. As a core of ecosystem service, aboveground net primary production (ANPP) determines ecosystem properties and plays a vital role in quantifying the photosynthetic uptake of carbon by ecosystems [3,4]. With climate drought, the degradation and vulnerability of grassland ecosystems is widespread and accelerating in many parts of the world but also profoundly affects the biogeographic patterns in ANPP [1,2]. A large body of research has seen studies carried out on the impact of diverse Aridity metrics on productivity at the leaf [5], site [6], and regional scales [7], and suggested that drought changes involve the multidimensional mechanism of productivity responses to climate change. Nonetheless, research examining the temporal variance of ANPP with multi-dimensional drought over macro-grassland ecosystems and across relatively long periods is also rare, a lack of knowledge that will severely limit our comprehensive understanding of the grassland ecosystem carbon–water cycle under continued warming.
Droughts are the most widespread and influential stressors on vegetation growth in grassland ecosystems [8,9]. According to the physiology of plant responses to drought, vegetation productivity variability is physiologically regulated by a balance between soil water supply for plant root–soil and water demand for leaf stomata [10]. Aridity [calculated as 1 − (precipitation/potential evapotranspiration)] is a popular indicator of climate change in dryland and affects plant productivity [8,11]. However, it has been suggested that the Aridity could be problematic in depicting land surface drought changes, being too simplistic to characterize the complexity of drought [12]. The amount of moisture present in the soil, also known as soil moisture (SM), plays a crucial role in determining the ability of roots to uptake water and transport nutrients [13,14]. The atmospheric vapor pressure deficit (VPD) reflects the degree of atmospheric drought and plant evaporation pressure that regulates the changes in leaf stomatal aperture and conductance [15]. Under soil and atmospheric water deficit conditions, plants will directly reduce water loss by shrinking or closing the stomata, thus jointly regulating metabolic processes such as transpiration, photosynthesis, and respiration [16]. In addition, soil and atmospheric moisture have become essential parameters for remote sensing and terrestrial ecosystem models to assess and predict future productivity changes [17,18]. However, there is still a great deal of uncertainty in assessing and predicting future grassland productivity variability.
Numerous studies have found that the inter-annual variance in productivity was attributed to VPD with SM and their interactions in terrestrial ecosystems [10,15]. The physiological and ecological mechanisms were differences in photosynthesis response to soil drought and atmospheric Aridity across species and ecosystems [19], resulting in multiple temporal patterns of increase, decrease, and insignificant responses of productivity with VPD and SM [20,21]. In semi-arid ecosystems, SM could be more important than VPD in driving interannual variability of carbon uptake [22,23]. In the Tibetan Plateau, VPD controlled interannual variability in productivity from 1982 to 2011 [24]. Notably, the variability in productivity was a diverging response of productivity to VPD under wet and dry conditions in the Northern Hemisphere [25]. In previous studies, VPD has been strongly coupled with SM due to a land–atmosphere cascading relationship and has been shown to regulate plant photosynthesis directly because it controls the amount of water that can be utilized by plant roots [26,27]. Earth atmospheric VPD is currently undergoing a global increase and an imbalance in SM allocation, a trend that is predicted to continue as global warming continues [28,29] and, thus, it is critical to the grassland ecosystem water–carbon cycle. Despite the growing awareness and concern, the mechanisms of increasing VPD and SM on ANPP have lacked comprehensive understanding at continental scales.
The Eurasian grassland is the typical macro-grassland ecosystem and plays a vital role in global grassland carbon storage [30]. In this region, complex climates, variable topography, and abundant soils combine to shape spatially continuous arid, semi-arid, and alpine grassland ecosystems, including a wide variety of plant species types [31]. In previous studies, although there have been some reports on temperate steppes [32], the alpine steppes of the Qinghai-Tibet Plateau [33], and the desert steppes of Central Asia [34] in the steppe region of Eurasia, most have only focused on the effects of single SM or VPD on productivity in typical regions. Therefore, revealing the temporal variation mechanisms in ANPP response to SM and VPD is of great significance for a comprehensive understanding of the water–carbon coupling cycle of the macro-grassland ecosystem.
To investigate how SM and VPD influence ANPP at the continental scale, we integrated field surveys of aboveground biomass, long-term remote sensing Normalized Difference Vegetation Index (NDVI), soil moisture, and meteorological datasets from 1982 to 2020 in Eurasian grasslands. We used the least square method and Bayesian structural equation modeling (SEM) to answer the following questions: (1) What is the temporal trend of ANPP and Aridity metrics (Aridity, SM, and VPD) under climate change?; (2) What is the temporal variation of ANPP with Aridity metrics?; (3) How do climate drivers and Aridity metrics directly and indirectly affect ANPP in different subregions and periods?

2. Materials and Methods

2.1. Study Area

The Eurasian grasslands, with the widest distribution, the largest carbon storage, and the richest plant species, are representative of global grasslands. Complex interactions of the Indian monsoon, temperate continental climate, Mediterranean climate, and East Asian monsoon results in large gradients in climate factors in this region. There are three distinct subregions distributed: the Black Sea–Kazakhstan steppe subregion (BKSSR), the Tibetan Plateau alpine steppe subregion (TPSSR), and the Mongolian Plateau steppe subregion (MPSSR) (Figure 1a). Each subregion is influenced by different climate types, resulting in typical arid, semi-arid, and alpine grasslands.
As for the BKSSR, it is in the interior of the Eurasia continent far from the oceans, and thereby temperate continental climate dominate the climate with hot summers and cold winters [35]. The MAP ranged from 98 to 815 mm and MAT between 5 and 9 °C. Furthermore, commonly found desert plants are Salsola praecox, Anabasis spp., Artemisia spp., Tamarix spp., etc. In this subregion, grasslands are subject to degradation and thus have attracted much attention from scientists and government decision-makers [36].
The MPSSR is influenced by the combination of the East Asian monsoon and the continental climate with significant annual variations in temperature and precipitation. The mean annual precipitation ranges from 60 to 662 mm, and the mean annual temperature is between −6 and 6.3 °C. Furthermore, the species types includes Stipa klemenzii, S. krylovii, S. grandis, and S. baicalensis, etc., with distributed meadow, typical, and desert steppes, respectively [37].
The TPSSR is the highest and largest alpine grassland in the world. Indian and East Asian monsoons shape a warm and humid climate, which is essential for vegetation change and reproduction. Furthermore, the MAP ranges from 80 to 1100 mm, and the MAT is between −8.34 and 8.57 °C. There are diverse vegetation types including alpine meadows, steppes, and desert grasslands [38].

2.2. Data Collection

2.2.1. The Field ANPP Observation Data

We collected the field ANPP observations data using field surveys, literature collection, and publicly available database downloads. Specifically, we obtained 267 ANPP observation data from the published literature [39]. We have also collected 510 ANPP observations data from the Ministry of Agriculture of China and the Oak Ridge National Laboratory database. In the growing season, we directly obtained 81 ANPP observations data from field surveys across the grassland transect of China. All this ANPP data were obtained using the harvesting method during the peak growing season and were used to construct an inversion model of long-term ANPP in Eurasian grasslands.

2.2.2. GIMMS and MODIS NDVI Products

The third-generation Advanced Very High-Resolution Radiometer (AVHRR) Global Inventory Modelling and Mapping Studies (GIMMS, version number 3g.v1) (https://iridl.ldeo.columbia.edu/SOURCES/.NASA/.ARC/.ECOCAST/.GIMMS/.NDVI3g/.v1p0/, accessed on 6 June 2024) and Moderate Resolution Imaging Spectroradiometer (MODIS) (https://lpdaacsvc.cr.usgs.gov, accessed on 6 June 2024) NDVI datasets have been widely used for detecting regional and global scale vegetation activity and are extensively utilized to estimate vegetation productivity [40,41]. The GIMMS NDVI 3g.v1 data products provide 0.083° spatial resolution and twice-a-month temporal resolution, and the MODIS NDVI (MOD13A2) data provide 1 km spatial resolution and 16-day temporal resolution. For the consistency of spatial and temporal scale, we used arithmetic averaging to obtain annual averages, and the bilinear interpolation to resample the MODIS NDVI raster image to the same spatial resolution of GIMMS NDVI data. The processing of GIMMS and MODIS NDVI has been corrected to reduce the effects of residual clouds, improve radiometric sensitivity and atmospheric correction, and reduce geometric distortions [42,43]. The temporal coverage of GIMMS NDVI 3gv1 is from 1981 to 2015, while MODIS is from 2000 to present. To analyze long-term vegetation dynamics, we combined GIMMS and MODIS NDVI products to build the empirical mode between NDVI and their corresponding field ANPP observation data at the sites.

2.2.3. Long-Term ANPP Data

The growing season integrated NDVI is a more direct measure of the interannual variability of vegetation activity, and therefore, commonly estimates primary production [44]. We used 39-year (1982–2020) NDVIint data from the satellite-based MODIS and GIMMS sensor. We analyzed and found that MODIS NDVIint is generally low overall compared with GIMMS NDVIint range from 2004 to 2013 (Figure 2a). To eliminate the overall bias and obtain long-term NDVIint data from 1982 to 2020, we combined coincident periods of MODIS NDVIint and GIMMS NDVIint and constructed a linear relationship (R2 = 0.93) during 2004–2013 (Figure 2b). Then, we recalibrated the MODIS NDVIint based on GIMMS NDVIint and produced long-term NDVIint from 1982 to 2020 in Eurasian grasslands.
NDVIint is highly correlated to primary production and is usually applied to estimate quantities of ANPP in grassland [45], and for this, we constructed the estimation model based on the relationship between measurements of ANPP and NDVIint. An exponential estimation model of measured ANPP and NDVIint was derived as follows: ANPP = 24.20   e 0.47   NDVI int   ( R 2 = 0.61 ,   n = 858 ,   p   <   0.01 ) (Figure 2c). With this estimation model, long-term ANPP was produced for the Eurasian grasslands from 1982 to 2020.

2.2.4. Climate Data

Monthly meteorological data spatial resolution of 0.5° for 1982–2020 was derived from the Climatic Research Unit (CRU) gridded Time Series (TS), version CRU TS 4.06 (https://catalogue.ceda.ac.uk/uuid/e0b4e1e56c1c4460b796073a31366980, accessed on 6 June 2024) [46]. The weather databases for this research included temperature, precipitation, actual vapor pressure (AVP), and potential evapotranspiration (PET). The CRU annual precipitation (AP) and PET datasets were also employed to calculate the Aridity (1 − AP/PET) [8]. We have also used temperature to calculate saturation vapor pressure (SVP), according to the following equation: SVP = 6.112   ×   e ( 16.67 × AT ) / ( AT + 243.5 ) , and then calculated vapor pressure difference (VPD) using the equation VPD = SVP AVP [28], which was used in our analyses to reveal the drought effect on ANPP.

2.2.5. Soil Moisture Datasets

The Global Land Evaporation Amsterdam Model (GLDAS) is a set of algorithms dedicated to the estimation of root-zone SM. The GLEAM v3.7a was used to produce datasets of terrestrial root-zone SM, including a 39-year data set spanning 1982–2020 (https://www.gleam.eu/, accessed on 6 June 2024) [47]. The GLDAS SM dataset is extensively used for large-scale climate studies, hydrological applications, or research on land–atmosphere feedback [48,49].

2.3. Data Analysis

We calculated the annual value of ANPP, precipitation, temperature, radiation, wind speed, and SM to explore the temporal variation across the entire study area. The long-term trends of ANPP, Aridity, SM, and VPD time series from 1982 to 2020 were analyzed using an ordinary least squares (OLS) regression model:
y = α + β t + ξ
where t was the year from 1982 to 2020, y was ANPP, Aridity, SM, and VPD per year, α was the intercept, β was the slope, and ξ was the residual of the model. The significance level of these trends was determined at a probability of 95% using t-tests.
We further used the OLS regression model to perform the correlations of ANPP with Aridity, SM, and VPD at each 15-year moving window over the period 1982–2020.
The structural equation models (SEM) are an effective method for indicating a theoretical cascading effects network. We performed SEM to evaluate the effects of SM, VPD, and Aridity on ANPP. The optimal model was determined by the low RMSEA (<0.08), the standard of the χ2-test (p > 0.05), and the comparative fit index (CFI) (>0.9). The SEM was run in the AMOS 18.0 software (IBM, Chicago, IL, USA). The analysis of regression was performed using Sigmaplot13.2 software. The spatial patterns of ANPP, Aridity, SM, and VPD were drawn using ArcGIS 10.8 software.

3. Results

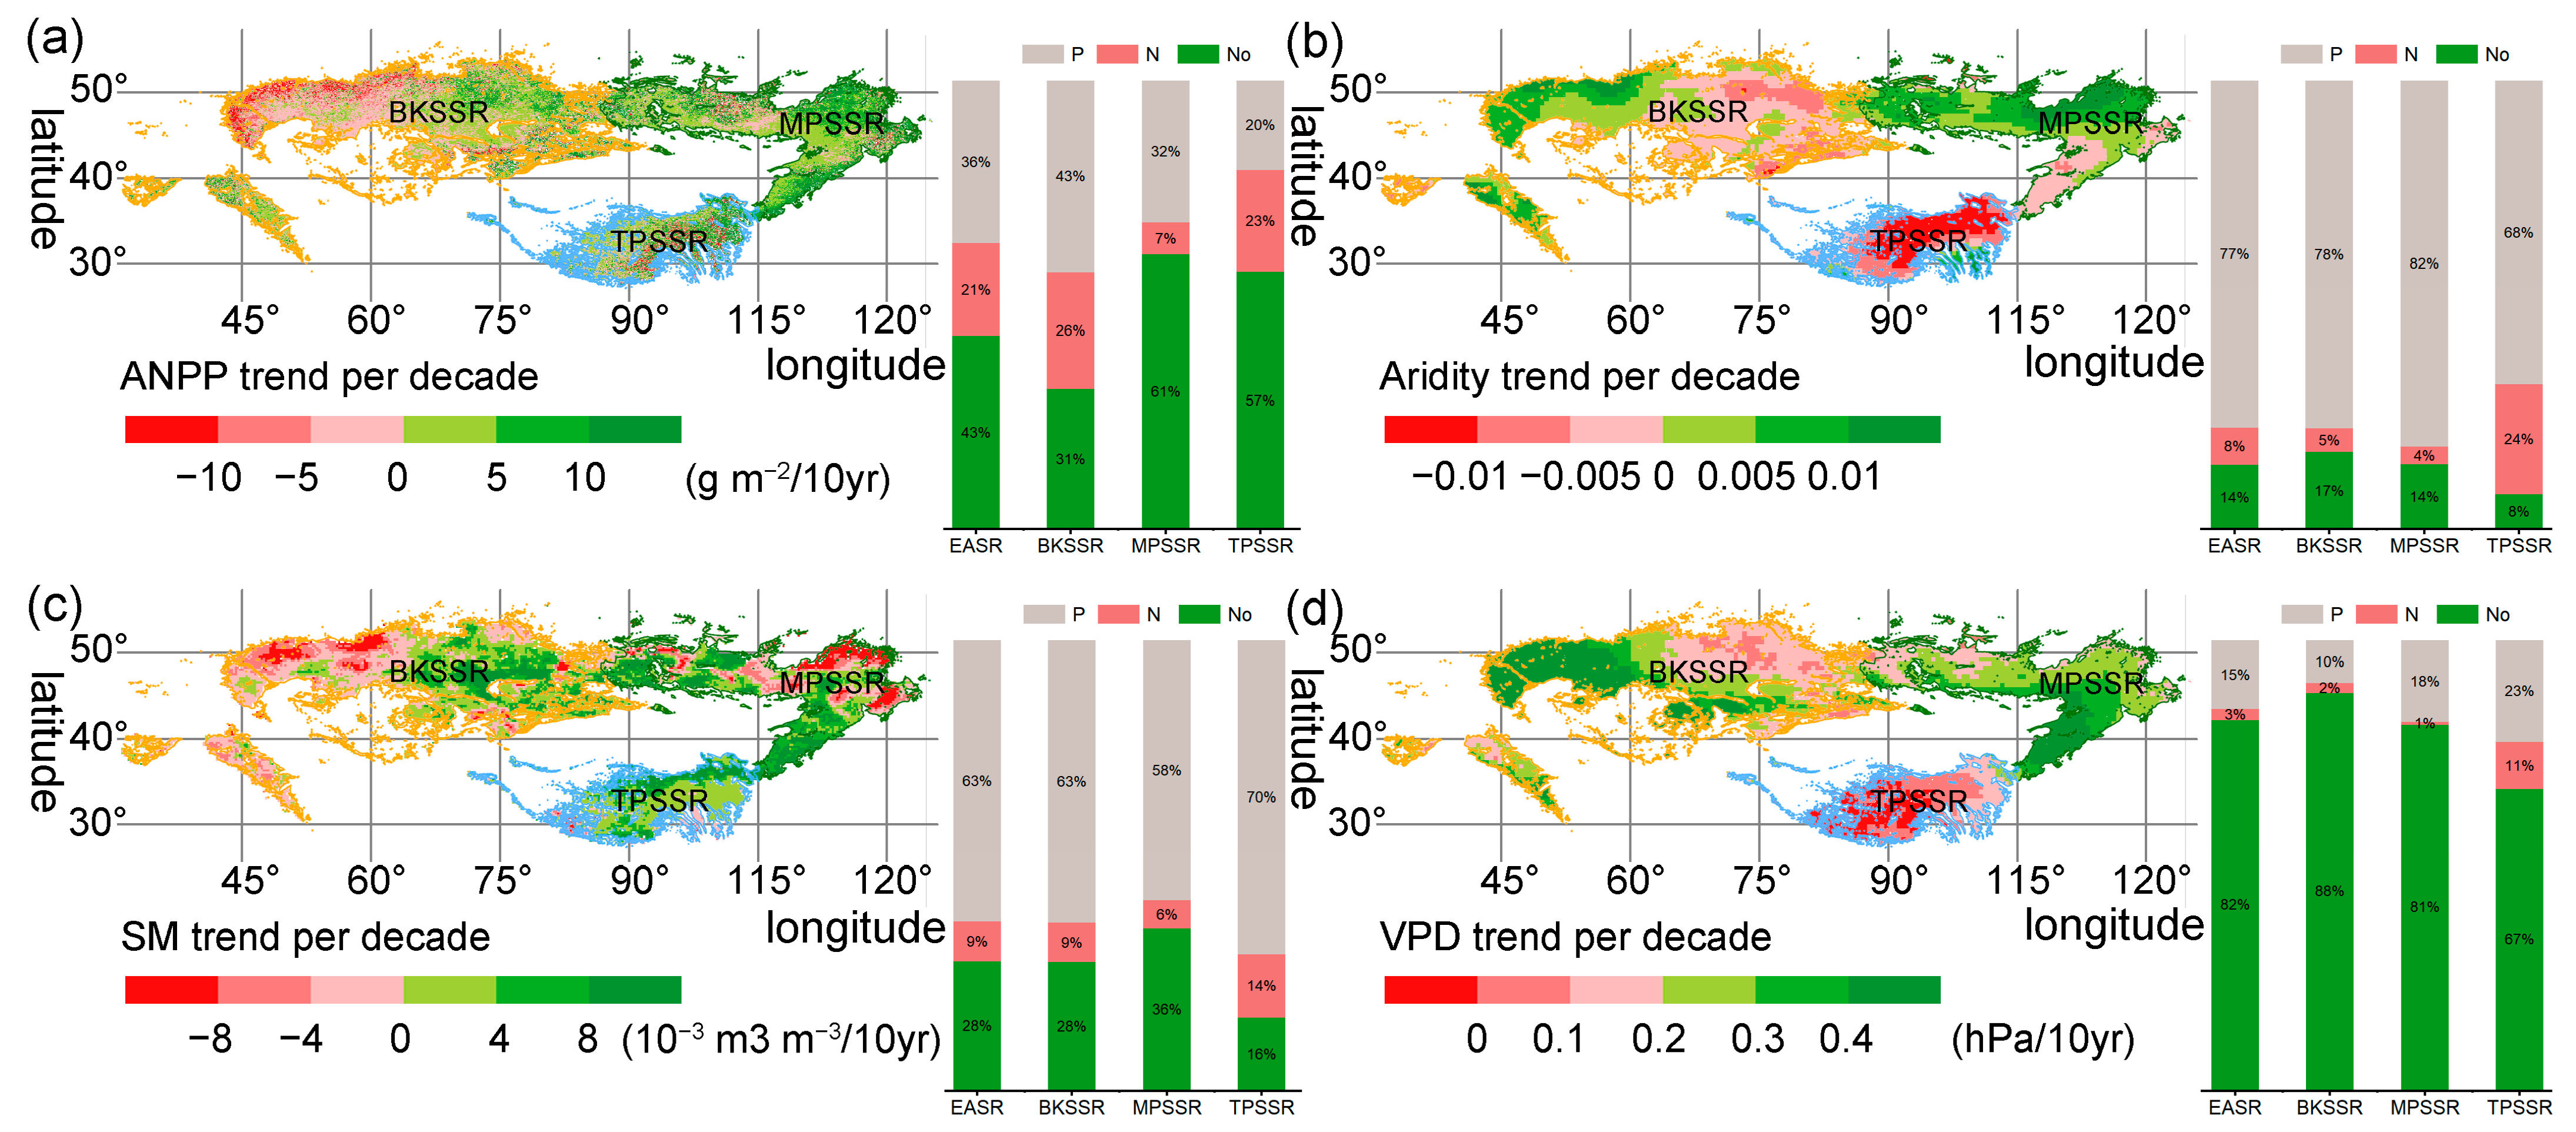
3.1. The Spatial Pattern and Magnitude of ANPP

Our results showed that the ANPP varied significantly across the entire Eurasian grasslands (SD: 60.3; CV: 60.8%) (Figure 1b). The average values of ANPP were 99.2 g m−2 yr−1, in a range from 26.1 to 599.6 g m−2 yr−1 (Figure 1b). ANPP was ordered in the subregion: TPSSR (107.0 g m−2 yr−1) > MPSSR (100.8 g m−2 yr−1) > BKSSR (95.8 g m−2 yr−1) (Figure 1c). The ANPP of alpine grasslands was higher than temperate grasslands. Our result concluded that ecosystem productivity of less than 99.2 g m−2 yr−1 accounts for about 80% of the area. Furthermore, the frequency distribution of ANPP had a positive skewness (1.96). The skewness of the frequency distribution of ANPP in BKSSR (2.3) was higher than MPSSR (1.7) and TPSSR (1.4).
Overall, we found higher ANPP with increasing latitude in the high and low elevations, against lower ANPP along longitudes at high and low elevations (Figure 1d,e). Furthermore, ANPP had no clear distribution pattern along MAP and MAT gradients (Figure 1f). ANPP gradually decreased with VPD, whereas it gradually increased with SM (Figure 1g).

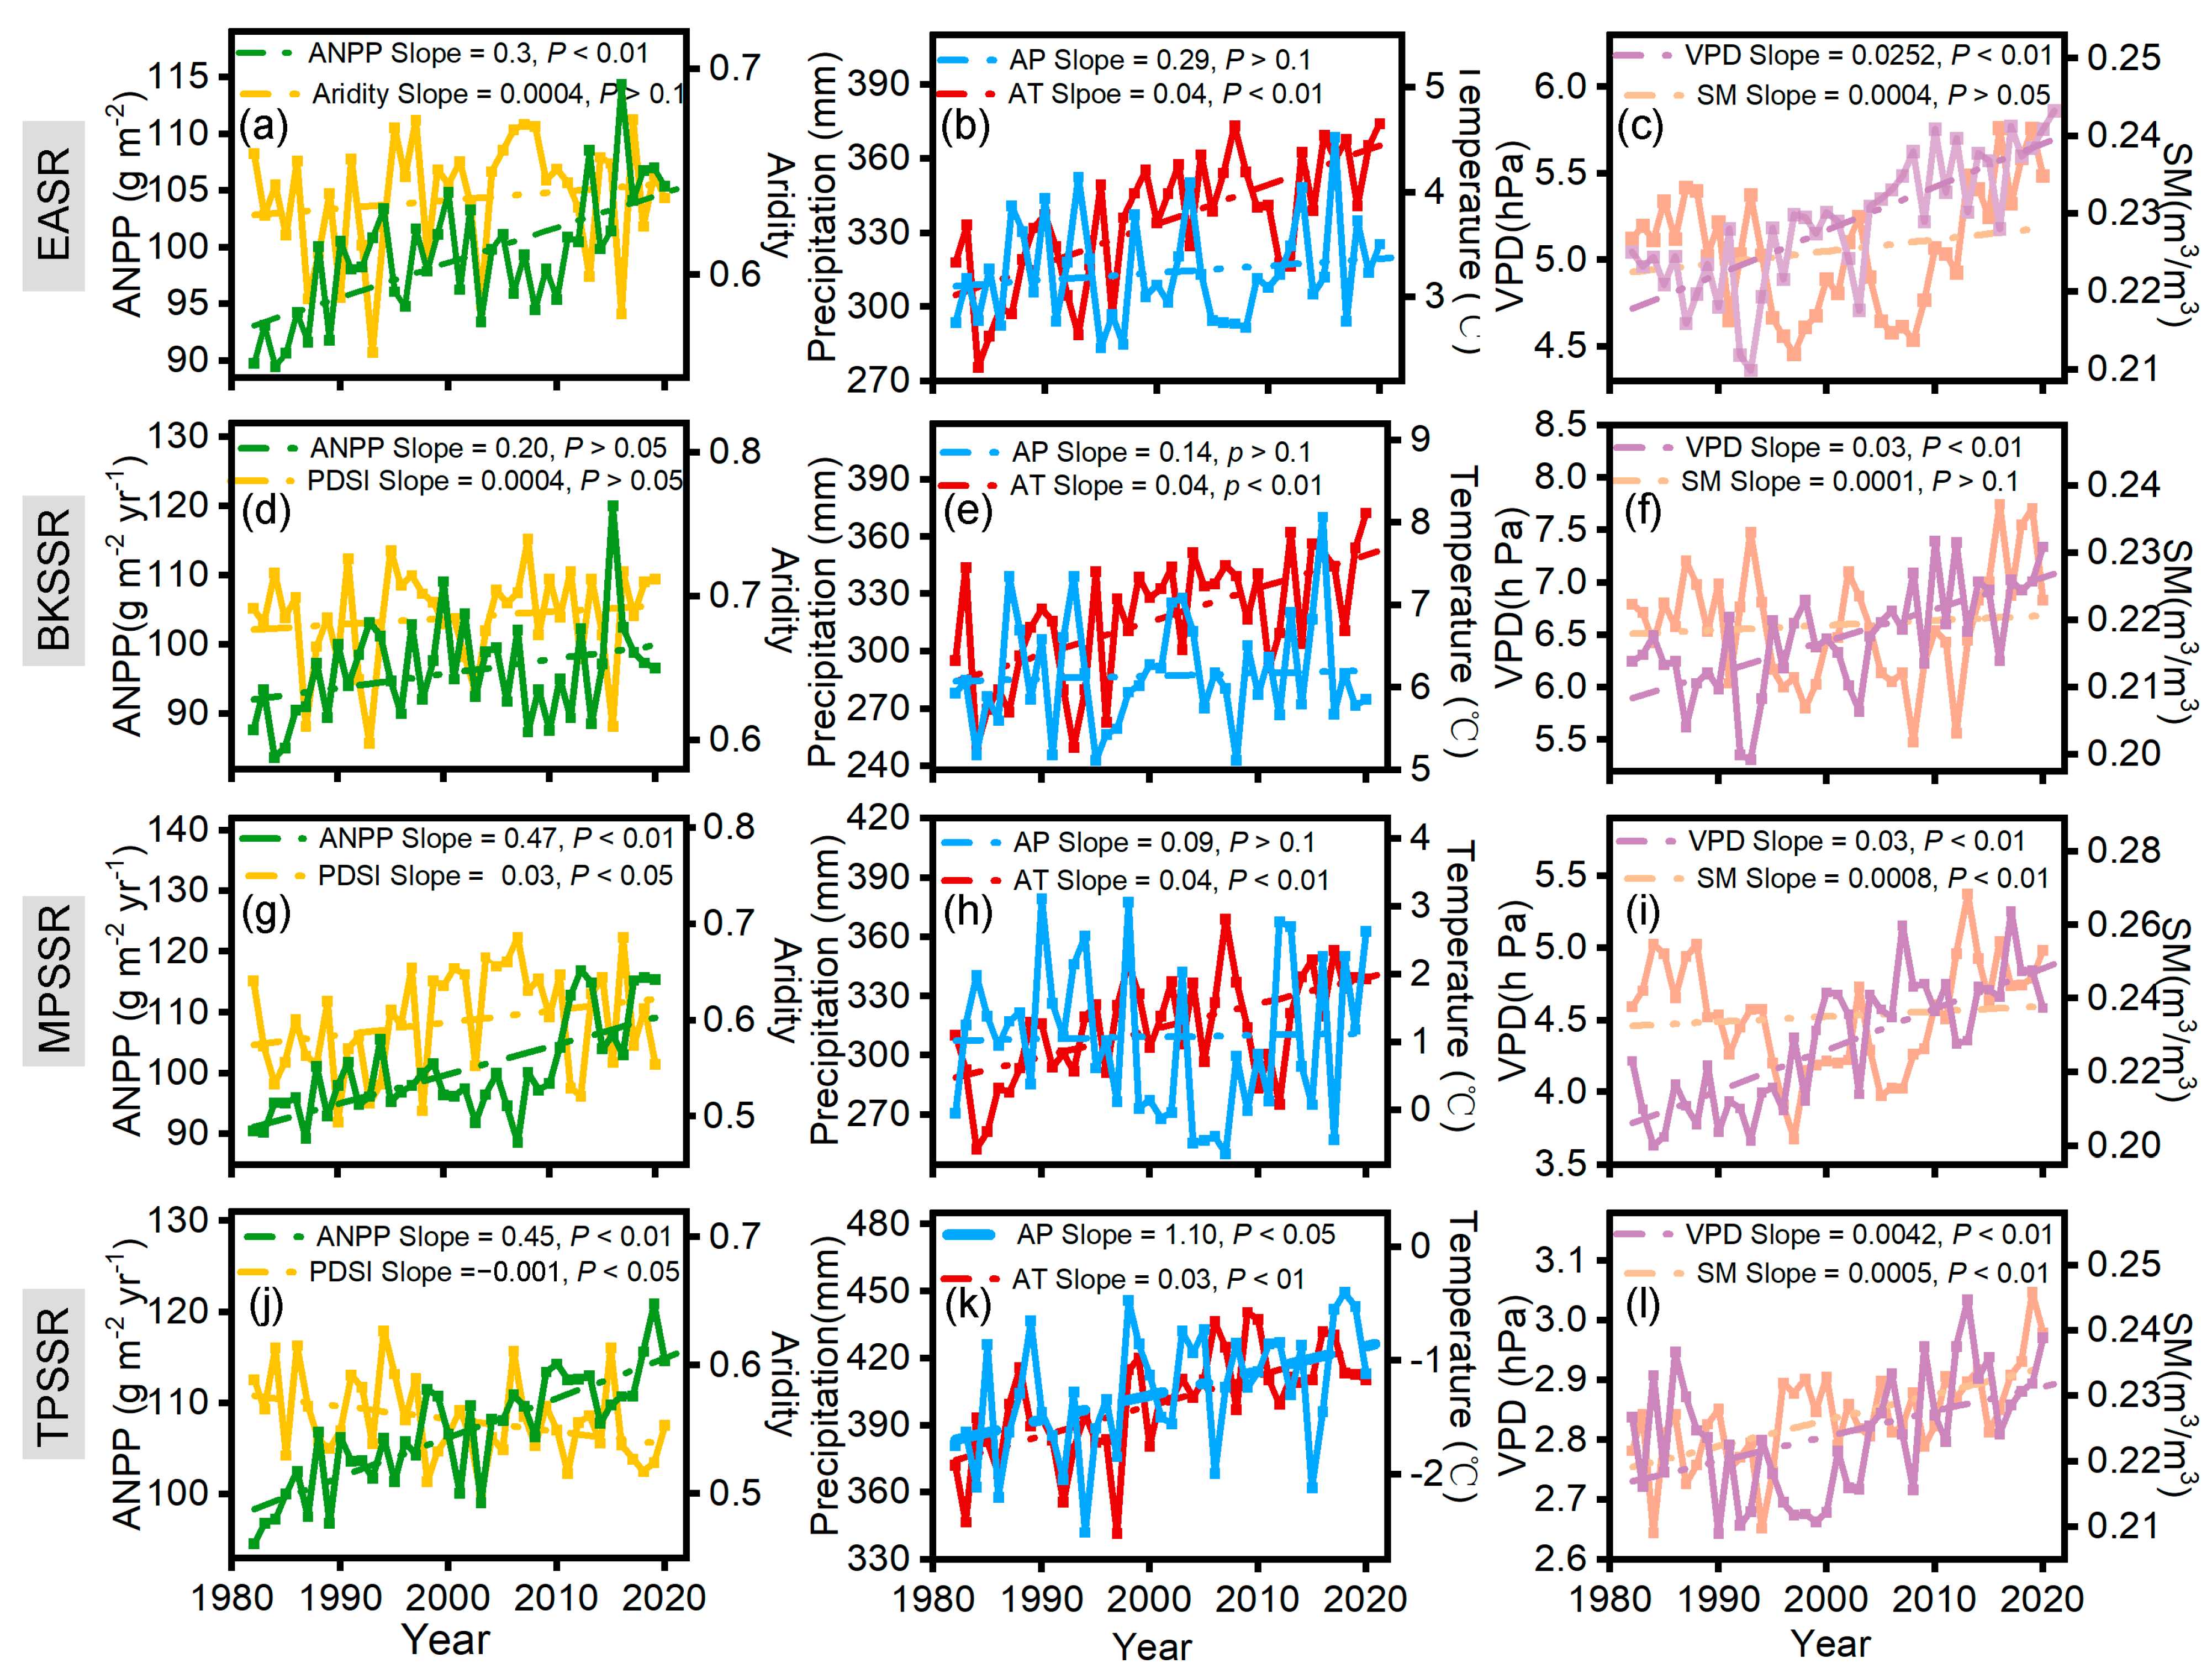
3.2. Temporal Trends of ANPP and Drought Metrics in Eurasian Grasslands

Here, we investigated the long-term trends of ANPP and their drivers for the period 1982 to 2020 in the entire region and three subregions (Figure 3). The ANPP showed an increasing trend in the entire region, which was 0.33 ± 0.045 g m−2 yr−2 (R2 = 0.48, p < 0.001; Figure 3a). The ANPP increase rate of TPSSR was the fastest (Slope = 0.54, R2 = 0.51, p < 0.001) (Figure 3j), while the trend of BKSSR was not significant (p > 0.05) (Figure 3d). The ANPP showed the most extensive statistically significant increasing (Mann–Kendall test, p < 0.05) area of EASR (42%), BKSSR (31%), MPSSR (60%), and TPSSR (57%), respectively (Figure 4a).
The trend in Aridity showed no significant increase in the entire EASR (Figure 3b), while VPD showed a significant increasing trend (Figure 3c). The temporal dynamic of Aridity did not show a significant trend in BKSSR (Figure 3e), while a significant increasing and decreasing trend in MPSSR and TPSSR could be seen, respectively (Figure 3h,k). The temporal dynamic of VPD was a significantly increasing trend in three subregions (Figure 3f,i,l). Analyses of the changes in VPD also continually showed similar widespread increasing trends in most areas (Figure 4d). On the contrary, most areas of AI and SM showed the most extensive statistically non-significant change trend in EASR and its subregion (Figure 4b,c).

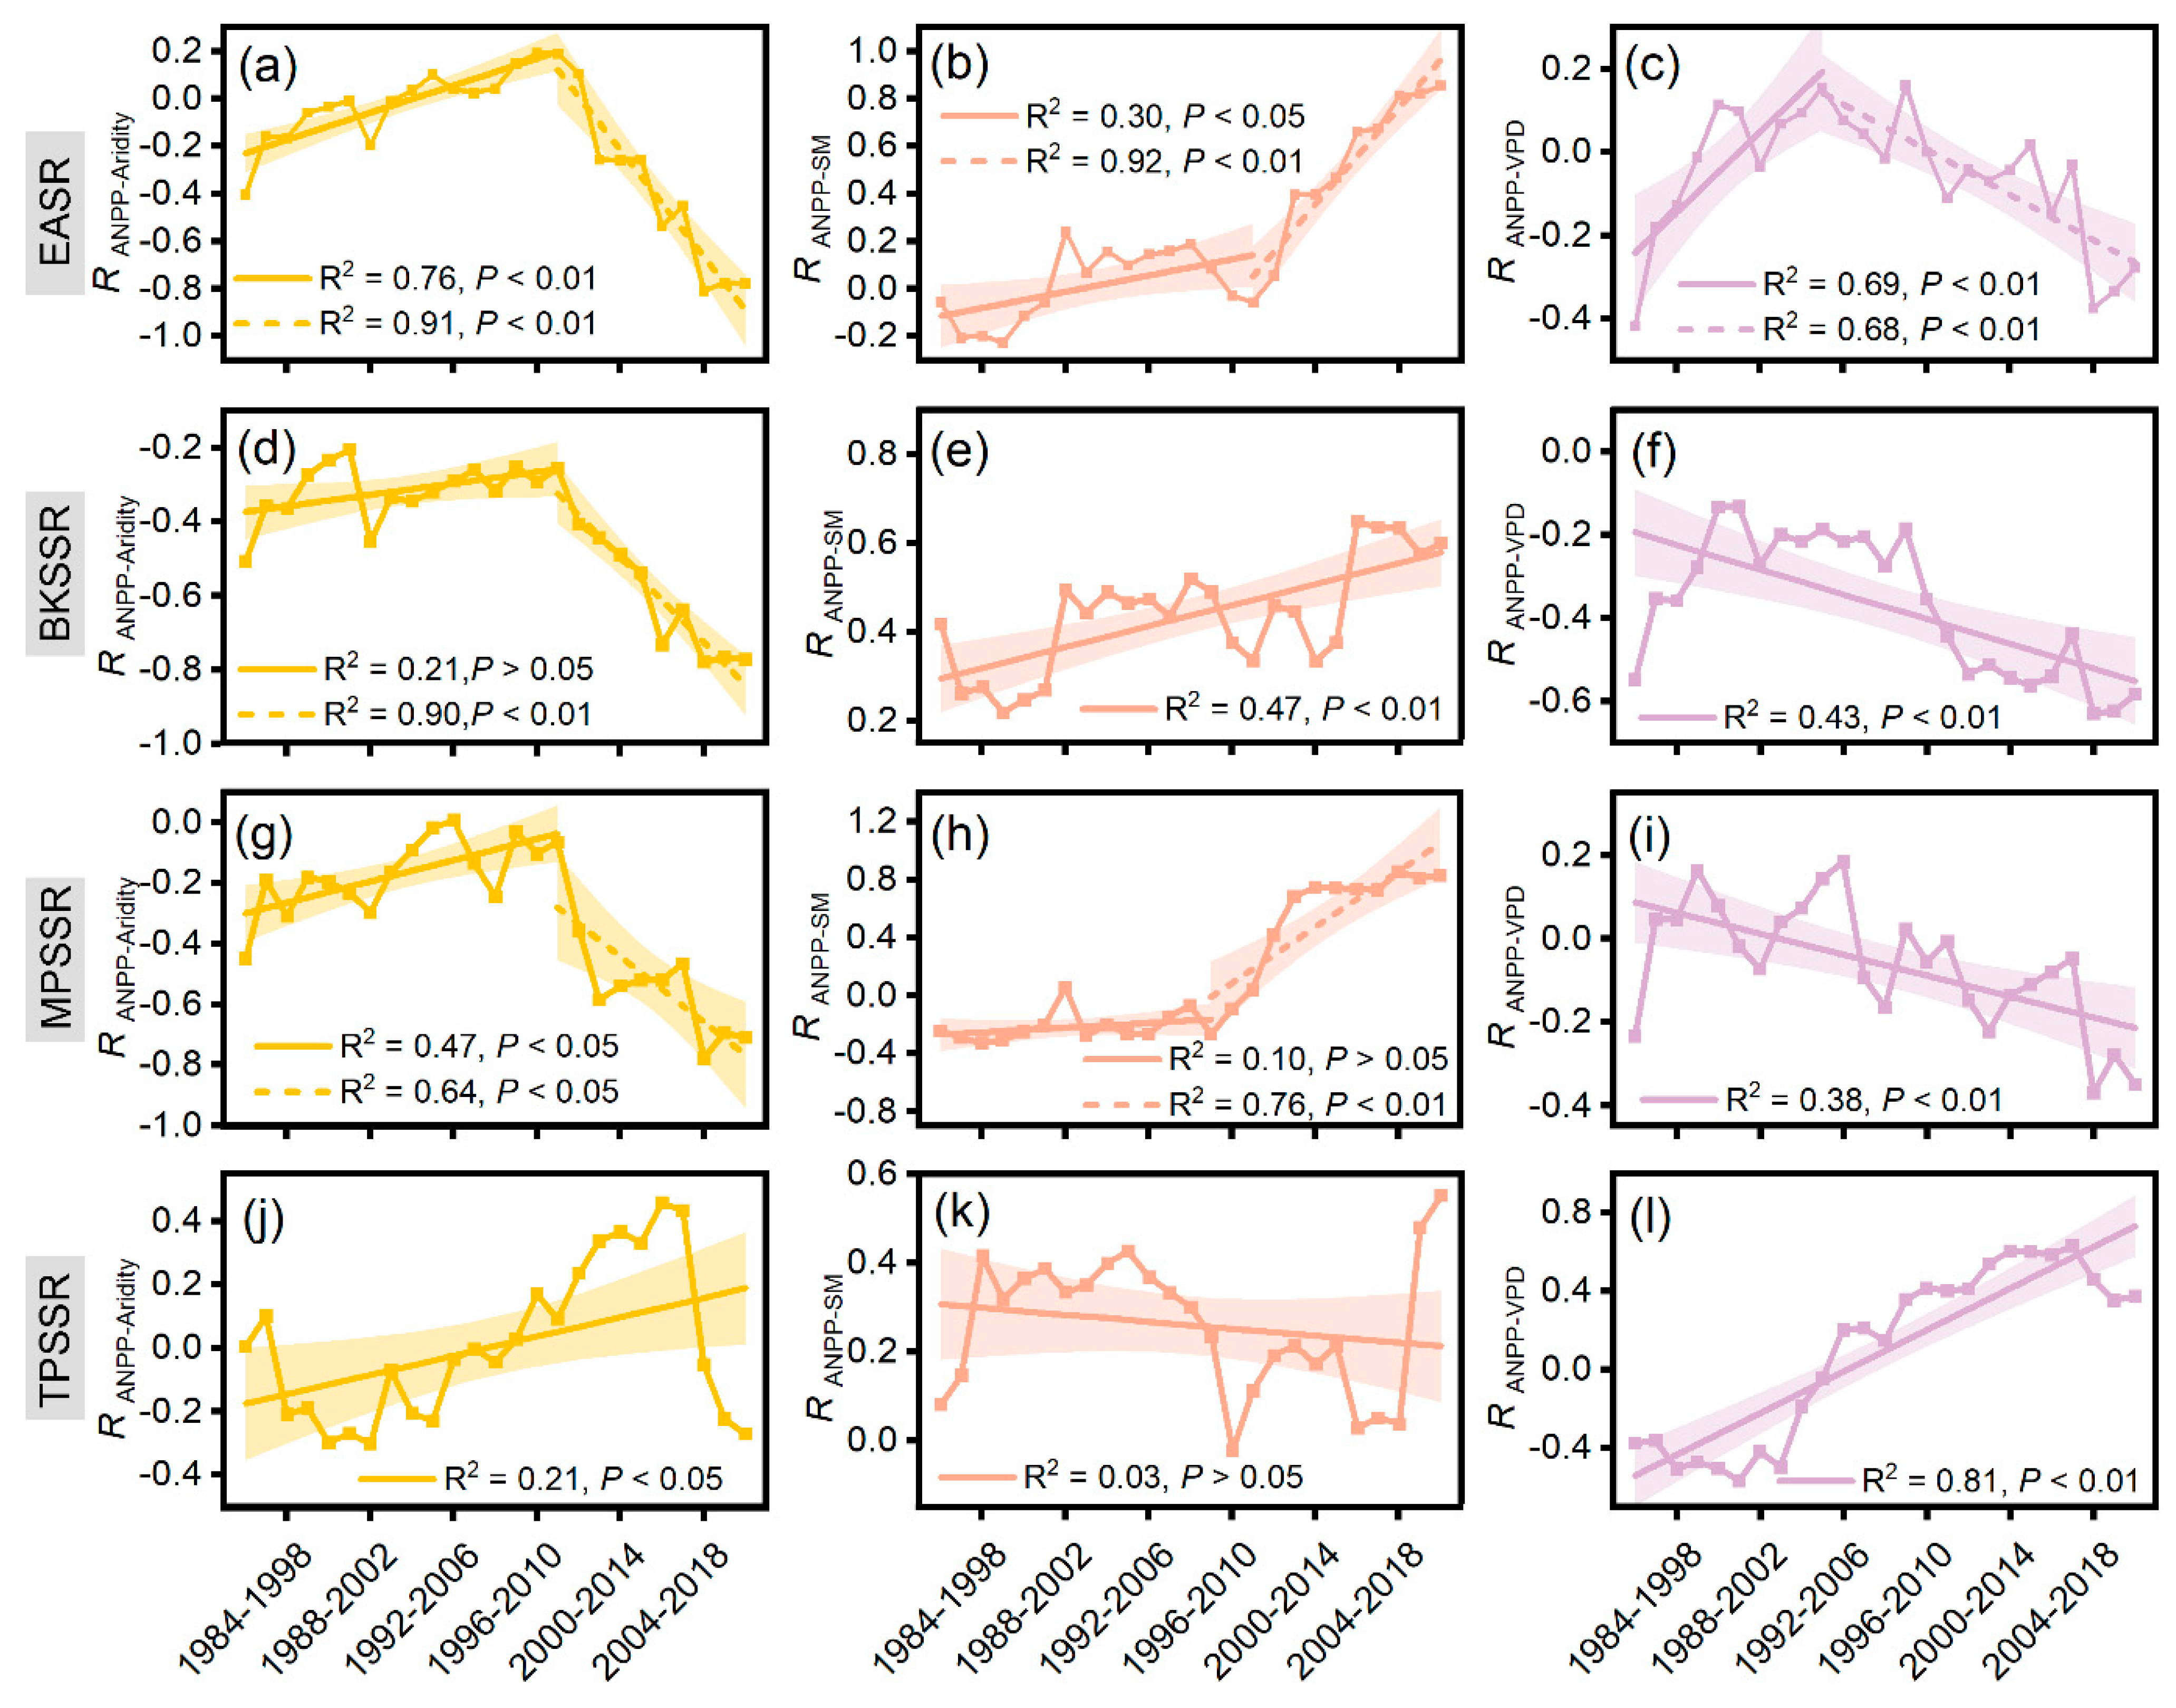
3.3. The Temporal Variation Pattern in ANPP with Drought Metrics

In the last four decades, the inter-annual variability of ANPP had multiple correlations with Aridity metrics in EASR and three subregions (Figure 5). We found a non-significant correlation of ANPP with Aridity in the whole grassland region (Figure 5a), while there was a linear increase in temporal variation in ANPP with SM and VPD (Figure 5b,c). In three subregions, the temporal variation pattern in ANPP response to different drought metrics was not consistent. Specifically, the temporal variation in ANPP showed a contrasting pattern with Aridity and SM, while there was a non-significant correlation with VPD in BKSSR (Figure 5a–c). This result showed that soil and climate drought have negative effects on productivity, while atmospheric drought has no significant effect on productivity in desert grasslands. The temporal variation in ANPP showed a linear increase pattern with SM and VPD, while there was a non-significant correlation with Aridity in MPSSR and TPSSR (Figure 5a–c). This result showed that productivity has contrasting effects on soil and atmospheric drought in alpine and temperate grasslands.

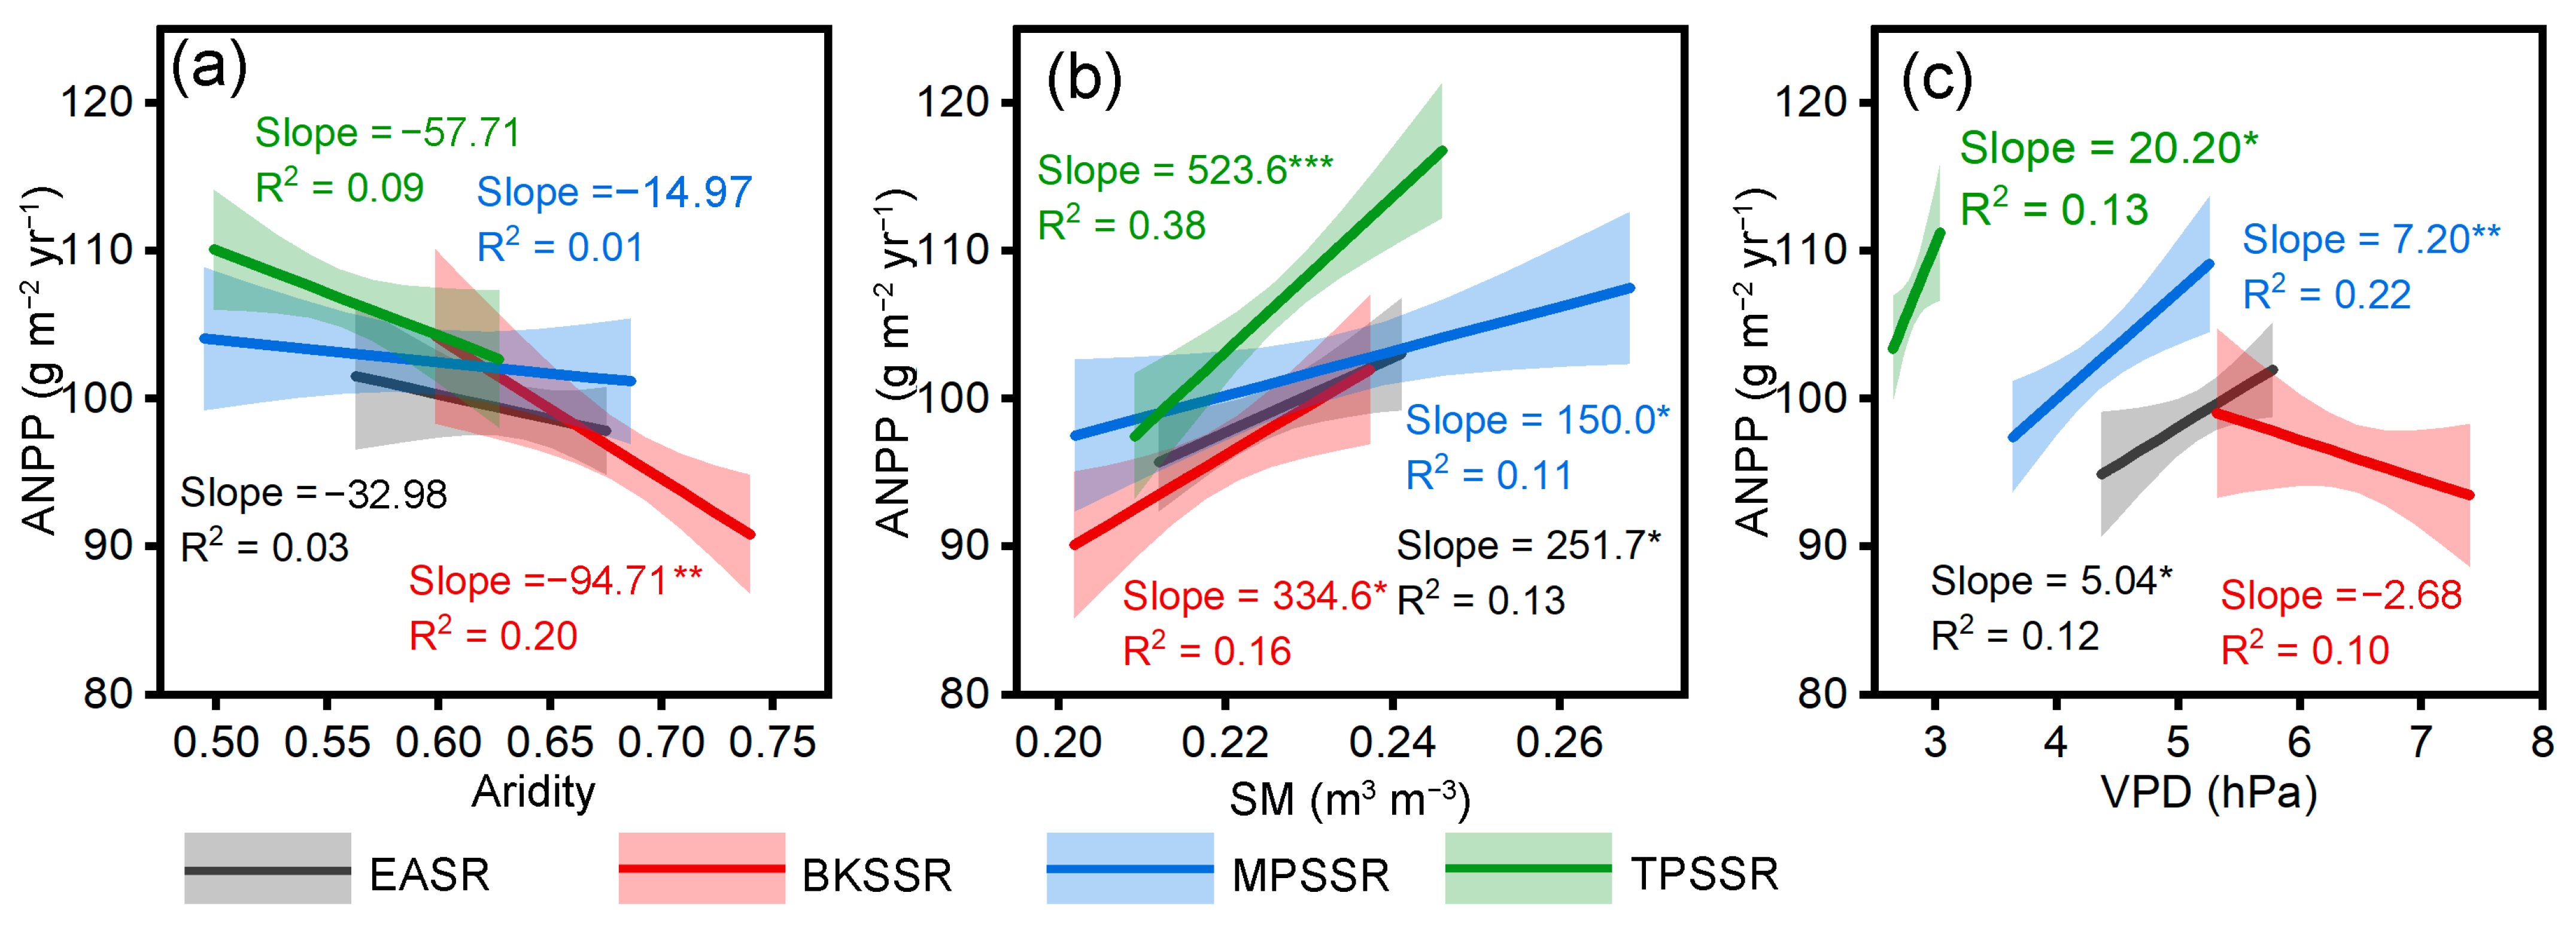
3.4. Effects of Drought Metrics Change on ANPP during 1982–2020

To assess the impact of drought metrics on Eurasian grassland ANPP, we calculated correlation coefficients using the least squares method over the whole and subregion study period and in each 15-year moving window. We found that the trend of correlation of ANPP with Aridity and SM demonstrated a decadal-scale regime shift from the period of 1982–1997 to 1997–2020 on whole Eurasian grasslands (Figure 6a,b). Nevertheless, the trend of the effect of VPD on ANPP shifts in the periods 1982–1991 and 1991–2020 (Figure 6c). The interannual ANPP was positively correlated to SM across most parts of the moving window. The intensity of the impact of SM on ANPP showed an initial decrease and subsequent increase pattern with the movement of the time window, with the lowest correlation appearing around the 1997–2011 window (Figure 6b). This result showed that soil moisture facilitated vegetation productivity and has become increasingly important with climate warming after 1997. In contrast to the correlation between ANPP and SM, Aridity and VPD were negatively correlated to interannual ANPP across most parts of the moving window. The negative correlation between ANPP and Aridity and VPD exhibited a concave-up model with the movement of the time window and showed the lowest negative correlation around the 1997–2011 and 1991–2005 windows, respectively (Figure 6c). This pattern indicated that the inhibition of climate and atmospheric drought on grassland growth has also gradually been increasing after 1991 and 1997, respectively.
In the three subregions, the correlation between ANPP and drought metrics was not consistent with change patterns in the whole Eurasian grassland. In BKSSR, the correlation between ANPP and Aridity showed a similar pattern with the whole region (Figure 6d), while the positive and negative correlation of SM and VPD showed a linear increase and decrease trend, respectively (Figure 6e,f). In MPSSR, the effects of Aridity and SM on grassland productivity had a similar pattern over the whole region of the Eurasian grassland (Figure 6g,h), while the negative effect of VPD showed a linear decreasing pattern (Figure 6i). Compared with other subregions, the pattern in the correlation of ANPP with Aridity, SM, and VPD was very different and more complex in TPSSR (Figure 6j–l). Specifically, the effect of VPD on grassland growth was favorable in most moving windows and the correlation continued to increase in TPSSR, indicating a tendency toward more intense positive effects of VPD on alpine grassland growth (Figure 6l). In addition, the negative effect of Aridity on ANPP has continued to weaken (Figure 6j), while the positive effect of SM has shown no significant trend in the past four decades (Figure 6k).
To further reveal the comprehensive effects of soil and atmospheric drought on the temporal variation in ANPP, we constructed the Cascading Effects Networks of Climate factors (AP, AT, and wind speed)—Drought factors (VPD, AI, and SM)—ANPP (CDA—CENet) in the whole and subregions of the Eurasian grasslands at three time periods (Figure 7). We found that SM dominated the temporal variation in ANPP, while the effects of VPD on ANPP were not significant in the whole Eurasian grasslands (Figure 7a). The positive effect of SM on ANPP is increasing, while the negative effect of VPD is decreasing (Figure 7e,i).

4. Discussion

4.1. Long-Term Trend and Temporal Variations in ANPP in Eurasian Grasslands

We found an increasing trend of ANPP in the entire region from 1982 to 2020, especially in the TPSSR areas (Figure 3j). Our findings are consistent with recent studies of global greening [42,50]. Previous studies showed that grassland productivity was significantly increasing in Central Eurasia [51]. Furthermore, the increasing trend of ANPP has been widely reported in subregions of the Eurasian grasslands, such as the Tibetan Plateau [52,53], the Central Asian [7,54], and Mongolian Plateau [55]. In this study, we identified the trends and differences in productivity in the subregion of EASR. The increased productivity of grassland ecosystems implies that the region will provide a lot of ecological well-being including biodiversity preservation, carbon storage, biodiversity preservation, and the production of livestock forage.
In grassland ecosystems, drought was the dominant factor affecting productivity [56]. AI, VPD, and SM as drought metrics have been increasingly employed in diverse representations of water balance between supply and demand for different land surface processes [12]. We found that Aridity was a significant decreasing trend in MPSSR and TPSSR (Figure 3h,k). Interestingly, VPD is an increasing trend in BKSSR, MPSSR, and TPSSR, respectively (Figure 3f,i,l). Increasing the Aridity forecast for grassland ecosystems could reduce the carbon sink due to water constraints [57]. Meanwhile, CO2 enrichment and nitrogen deposition can counteract the negative effects of drought [58]. Drought does not always lead to a decrease in grassland ecosystem productivity. Pronounced warming occurring on the alpine grasslands is expected to increase atmospheric Aridity but could also facilitate alpine grassland growth [24]. The increase in drought has not limited the reduction in productivity of the North American grasslands [59]. Hence, there is an increasing consensus that drought should be estimated using a more effective metric to depict the water balance for different grassland ecosystems.
We have also explored the temporal variation in productivity along drought metrics (Aridity, SM, and VPD) at the subregion in EASR. There was a discrepancy in the degree of correlation of ANPP with VPD changes in three subregions (Figure 3). Our analysis found that atmospheric drought has a positive effect on alpine grassland productivity. These findings are consistent with earlier reports based on eddy covariance observations and model simulations in Tibetan Alpine Grasslands from 1982 to 2011 [24]. We suggest that the continued increase in atmospheric drought will play an important role in alpine grassland productivity. Here, we confirmed this strong relationship between ANPP and VPD across the Tibetan grassland. The likely mechanism is that high temperatures will promote VPD and plant growth, and then increase canopy stomatal conductance and facilitate soil water absorption by cutting down solar radiation reaching the soil surface [60]. However, the ANPP has a significant correlation with Aridity and SM, while there is no significant correlation with VPD in temperate grasslands. Previous studies have reported that precipitation is an essential factor limiting temperate vegetation growth, not temperature [30]. Furthermore, the correlation between SM and ANPP is stronger than that of Aridity. SM affects plant growth more directly than precipitation by plant physiological regulations of transpiration and soil nutrients [61]. This reveals the multifaceted characteristics of drought effect on temporal variation in ANPP on the continental scale.

4.2. Cascading Effects Networks of Factors Influencing Temporal Variations in ANPP

The respective effects of soil and atmospheric drought on ecosystem production are controversial but essential for understanding the terrestrial carbon–water coupling cycle in response to dryness stress [21,25]. However, most studies have analyzed the relationship of productivity with soil and atmospheric dryness separately and rarely explored the cascading networks of multi-factors [18,27]. Part of the uncertainty associated with VPD’s and SM’s impacts on productivity relates to the difficulty of disentangling from radiation, temperature, and other climate drivers [62]. Interestingly, we found the correlation of ANPP with Aridity and SM shifted around 1997 years (Figure 6). The inhibitory effect of Aridity on productivity has been increasing rapidly after 1997 (Figure 6a), while the positive effect of SM has continued to increase in the past four decades in EASR (Figure 6b). However, the tendency of correlation between ANPP and VPD initially increased and then decreased with the moving windows (Figure 6c), indicating that VPD caused a decisive inhibition of grassland plant growth. In Eurasia dryland, the soil moisture dominated the growth of vegetation, and the dominance of SM stress was enhanced. Global warming alters thermodynamic processes by increasing atmospheric and soil drought in drylands [63]. These changes can increase evaporation and decrease precipitation in the Eurasian grasslands [64]. Precipitation is the main source of water uptake by soil plant roots in grassland ecosystems, and therefore a major factor limiting productivity [30]. We reconfirmed the stronger positive effects of SM on productivity variability at the continental scale in whole Eurasian grasslands.
In three subregions, the VPD, SM, and Aridity exerted different roles in regulating the temporal variation in ANPP in different periods (Figure 7). The temporal variation in ANPP was mainly controlled by the SM in the three subregions. A positive effect of SM was seen on the ANPP, while a negative effect of VPD in BKSSR and MPSSR was demonstrated (Figure 7b,c). The inhibitory effect of VPD on ANPP was weakened, while the facilitating effect of SM was weakened and enhanced in BKSSR and MPSSR, respectively (Figure 7f,g,j,k). Numerous evidence suggests that stomatal conductance decreases with increasing VPD in most species and results in a cascade of subsequent impacts including reduced plant growth and photosynthesis [15]. This negative effect becomes increasingly important due to the role of atmospheric Aridity in promoting grassland productivity [24]. BKSSR and MPSSR are composed of desert, typical, and meadow steppe types and are characterized by xerophytic, mesoxerophytes, and mesophytes species [31]. SM is directly supplied to plant roots for absorption and utilization, which is conducive to the absorption of soil nutrients and the accumulation of organic matter in dryland ecosystems [23,65]. The root and leaf structures of species determines that soil drought is more sensitive to the effects of atmospheric drought on productivity in temperate grassland [9,15].
Interestingly, the inhibitory effect of VPD on ANPP transformed into a facilitating effect in TPSSR after 1997, and the facilitating effect of SM weakened (Figure 7h–l). In alpine grasslands, the lower temperature, a short growing season, and a barren nutrient shortage attributed to the lower productivity. Precipitation was not a limiting factor in the productivity of alpine grasslands [30]. The increase in soil moisture was not conducive to the absorption and utilization of soil nutrients, which would affect respiration and inhibit the accumulation of biomass [33,66]. A significant positive correlation existed between VPD and temperature, which is beneficial for plant photosynthesis and promotes increased productivity [28,67]. In alpine grasslands, other factors such as soil nutrients [68], microbial activity [69], and potential community change can also modulate vegetation growth [70]. The cascading network of multiple factors leads to VPD promoting vegetation productivity. The nonlinear response of SM and VPD has been well documented, but their regulation of productivity in different regions is still highly controversial. For grassland ecosystems, future research should pay more attention to the impact of soil moisture and atmospheric drought on productivity in macro-ecosystems, and the critical thresholds for the state transition.

5. Conclusions

By combining ANPP surveys, satellite remote sensing NDVI, and meteorological data, we contribute to revealing the temporal variations and controls of ANPP in Eurasian grasslands. Our results showed that the mean values of ANPP were 99.2 g m−2 yr−1, in a range from 26.1 to 599.6 g m−2 yr−1. The ANPP saw an overall uptrend in Eurasian grasslands from 1982 to 2020. The ANPP increase rate in TPSSR was the fastest, while the trend in BKSSR was not significant. From the perspective of the relationships between ANPP and drought metrics, soil and climate drought had negative effects on ANPP in desert grasslands, while soil and atmospheric drought had contrasting effects on ANPP in temperate and alpine grasslands. We have also found that the correlation of ANPP with Aridity and SM shifted around the year 1997, while the effect of VPD on ANPP shifted around 1991. Considering all drought metrics in different periods, we concluded that SM was the predominant driving factor of the temporal variation in ANPP over the whole Eurasian grasslands, and the dominance of SM stress was enhanced from the period of 1982–1997 to 1997–2020. It is important to note that the inhibitory effect of VPD on ANPP transformed into a facilitating effect in TPSSR after 1997, and the facilitating effect of SM weakened. Our findings would help to identify whether grassland productivity is controlled by SM or VPD at the continental scale, and therefore, where efforts to enhance our understanding and ability to predict future climate change impacts on grassland ecosystems.

Author Contributions

Conceptualization, T.Z. and Z.W.; Software, Y.L.; Formal analysis, Y.Z.; Data curation, L.Y. All authors have read and agreed to the published version of the manuscript.

Funding

This study was supported by the National Natural Science Foundation of China (32201344), China Postdoctoral Science Foundation (2023M742858), and the Startup Research Program of Northwest A&F University (2452021105).

Data Availability Statement

The data that support the findings of this study are available on request from the corresponding author. The data are not publicly available due to privacy or ethical restrictions.

Conflicts of Interest

The authors declare no conflicts of interest.

References

  1. Bardgett, R.D.; Bullock, J.M.; Lavorel, S.; Manning, P.; Schaffner, U.; Ostle, N.; Chomel, M.; Durigan, G.; Fry, E.L.; Johnson, D.; et al. Combatting global grassland degradation. Nat. Rev. Earth Environ. 2021, 2, 720–735. [Google Scholar] [CrossRef]
  2. Bai, Y.; Cotrufo, M.F. Grassland soil carbon sequestration: Current understanding, challenges, and solutions. Science 2022, 377, 603–608. [Google Scholar] [CrossRef] [PubMed]
  3. Knapp, A.K.; Ciais, P.; Smith, M.D. Reconciling inconsistencies in precipitation-productivity relationships: Implications for climate change. New Phytol. 2016, 214, 41–47. [Google Scholar] [CrossRef] [PubMed]
  4. Piao, S.; Wang, X.; Wang, K.; Li, X.; Bastos, A.; Canadell, J.G.; Ciais, P.; Friedlingstein, P.; Sitch, S. Interannual variation of terrestrial carbon cycle: Issues and perspectives. Glob. Change Biol. 2020, 26, 300–318. [Google Scholar] [CrossRef] [PubMed]
  5. Lopez, J.; Way, D.A.; Sadok, W. Systemic effects of rising atmospheric vapor pressure deficit on plant physiology and productivity. Glob. Change Biol. 2021, 27, 1704–1720. [Google Scholar] [CrossRef]
  6. Steger, D.N.; Peters, R.L.; Blume, T.; Hurley, A.G.; Balanzategui, D.; Balting, D.F.; Heinrich, I. Site matters—Canopy conductance regulation in mature temperate trees diverges at two sites with contrasting soil water availability. Agric. For. Meteorol. 2024, 345, 109850. [Google Scholar] [CrossRef]
  7. Wu, L.; Ma, X.; Dou, X.; Zhu, J.; Zhao, C. Impacts of climate change on vegetation phenology and net primary productivity in arid Central Asia. Sci. Total Environ. 2021, 796, 149055. [Google Scholar] [CrossRef] [PubMed]
  8. Berdugo, M.; Delgado-Baquerizo, M.; Soliveres, S.; Hernandez-Clemente, R.; Zhao, Y.; Gaitan, J.J.; Gross, N.; Saiz, H.; Maire, V.; Lehman, A.; et al. Global ecosystem thresholds driven by aridity. Science 2020, 367, 787–790. [Google Scholar] [CrossRef]
  9. Konings, A.G.; Williams, A.P.; Gentine, P. Sensitivity of grassland productivity to aridity controlled by stomatal and xylem regulation. Nat. Geosci. 2017, 10, 284–288. [Google Scholar] [CrossRef]
  10. Gupta, A.; Rico-Medina, A.; Cano-Delgado, A.I. The physiology of plant responses to drought. Science 2020, 368, 266–269. [Google Scholar] [CrossRef]
  11. Kefi, S.; Genin, A.; Garcia-Mayor, A.; Guirado, E.; Cabral, J.S.; Berdugo, M.; Guerber, J.; Sole, R.; Maestre, F.T. Self- organization as a mechanism of resilience in dryland ecosystems. Proc. Natl. Acad. Sci. USA 2024, 121, e2305153121. [Google Scholar] [CrossRef]
  12. Lian, X.; Piao, S.; Chen, A.; Huntingford, C.; Fu, B.; Li, L.Z.X.; Huang, J.; Sheffield, J.; Berg, A.M.; Keenan, T.F.; et al. Multifaceted characteristics of dryland aridity changes in a warming world. Nat. Rev. Earth Environ. 2021, 2, 232–250. [Google Scholar] [CrossRef]
  13. Vargas Zeppetello, L.R.; Trevino, A.M.; Huybers, P. Disentangling contributions to past and future trends in US surface soil moisture. Nat. Water 2024, 2, 127–138. [Google Scholar] [CrossRef]
  14. Stocker, B.D.; Zscheischler, J.; Keenan, T.F.; Prentice, I.C.; Penuelas, J.; Seneviratne, S.I. Quantifying soil moisture impacts on light use efficiency across biomes. New Phytol. 2018, 218, 1430–1449. [Google Scholar] [CrossRef]
  15. Grossiord, C.; Buckley, T.N.; Cernusak, L.A.; Novick, K.A.; Poulter, B.; Siegwolf, R.T.W.; Sperry, J.S.; McDowell, N.G. Plant responses to rising vapor pressure deficit. New Phytol. 2020, 226, 1550–1566. [Google Scholar] [CrossRef]
  16. Konings, A.G.; Rao, K.; Steele-Dunne, S.C. Macro to micro: Microwave remote sensing of plant water content for physiology and ecology. New Phytol. 2019, 223, 1166–1172. [Google Scholar] [CrossRef]
  17. Liu, L.; Gudmundsson, L.; Hauser, M.; Qin, D.; Li, S.; Seneviratne, S.I. Soil moisture dominates dryness stress on ecosystem production globally. Nat. Commun. 2020, 11, 4892. [Google Scholar] [CrossRef]
  18. Lu, H.; Qin, Z.; Lin, S.; Chen, X.; Chen, B.; He, B.; Wei, J.; Yuan, W. Large influence of atmospheric vapor pressure deficit on ecosystem production efficiency. Nat. Commun. 2022, 13, 1653. [Google Scholar] [CrossRef]
  19. Cernusak, L.A.; Goldsmith, G.R.; Arend, M.; Siegwolf, R.T.W. Effect of Vapor Pressure Deficit on Gas Exchange in Wild-Type and Abscisic Acid-Insensitive Plants1. Plant Physiol. 2019, 181, 1573–1586. [Google Scholar] [CrossRef]
  20. Fu, Z.; Ciais, P.; Prentice, I.C.; Gentine, P.; Makowski, D.; Bastos, A.; Luo, X.; Green, J.K.; Stoy, P.C.; Yang, H.; et al. Atmospheric dryness reduces photosynthesis along a large range of soil water deficits. Nat. Commun. 2022, 13, 989. [Google Scholar] [CrossRef]
  21. Humphrey, V.; Berg, A.; Ciais, P.; Gentine, P.; Jung, M.; Reichstein, M.; Seneviratne, S.I.; Frankenberg, C. Soil moisture-atmosphere feedback dominates land carbon uptake variability. Nature 2021, 592, 65–69. [Google Scholar] [CrossRef]
  22. Chen, N.; Song, C.; Xu, X.; Wang, X.; Cong, N.; Jiang, P.; Zu, J.; Sun, L.; Song, Y.; Zuo, Y.; et al. Divergent impacts of atmospheric water demand on gross primary productivity in three typical ecosystems in China. Agric. For. Meteorol. 2021, 307, 108527. [Google Scholar] [CrossRef]
  23. Kannenberg, S.A.; Anderegg, W.R.L.; Barnes, M.L.; Dannenberg, M.P.; Knapp, A.K. Dominant role of soil moisture in mediating carbon and water fluxes in dryland ecosystems. Nat. Geosci. 2024, 17, 38–43. [Google Scholar] [CrossRef]
  24. Ding, J.; Yang, T.; Zhao, Y.; Liu, D.; Wang, X.; Yao, Y.; Peng, S.; Wang, T.; Piao, S. Increasingly Important Role of Atmospheric Aridity on Tibetan Alpine Grasslands. Geophys. Res. Lett. 2018, 45, 2852–2859. [Google Scholar] [CrossRef]
  25. Zhong, Z.; He, B.; Wang, Y.-P.; Chen, H.W.; Chen, D.; Fu, Y.H.; Chen, Y.; Guo, L.; Deng, Y.; Huang, L.; et al. Disentangling the effects of vapor pressure deficit on northern terrestrial vegetation productivity. Sci. Adv. 2023, 9, eadf3166. [Google Scholar] [CrossRef]
  26. Schweiger, A.H.; Zimmermann, T.; Poll, C.; Marhan, S.; Leyrer, V.; Berauer, B.J. The need to decipher plant drought stress along the soil-plant-atmosphere continuum. Oikos 2023, 2023, e10136. [Google Scholar] [CrossRef]
  27. Zhang, Y.; Zhang, Y.; Lian, X.; Zheng, Z.; Zhao, G.; Zhang, T.; Xu, M.; Huang, K.; Chen, N.; Li, J.; et al. Enhanced dominance of soil moisture stress on vegetation growth in Eurasian drylands. Natl. Sci. Rev. 2023, 10, nwad108. [Google Scholar] [CrossRef]
  28. Yuan, W.; Zheng, Y.; Piao, S.; Ciais, P.; Lombardozzi, D.; Wang, Y.; Ryu, Y.; Chen, G.; Dong, W.; Hu, Z.; et al. Increased atmospheric vapor pressure deficit reduces global vegetation growth. Sci. Adv. 2019, 5, eaax1396. [Google Scholar] [CrossRef]
  29. Zhou, S.; Williams, A.P.; Lintner, B.R.; Berg, A.M.; Zhang, Y.; Keenan, T.F.; Cook, B.I.; Hagemann, S.; Seneviratne, S.I.; Gentine, P. Soil moisture-atmosphere feedbacks mitigate declining water availability in drylands. Nat. Clim. Change 2021, 11, 38–44. [Google Scholar] [CrossRef]
  30. Zhang, T.; Yu, G.; Chen, Z.; Hu, Z.; Jiao, C.; Yang, M.; Fu, Z.; Zhang, W.; Han, L.; Fan, M.; et al. Patterns and controls of vegetation productivity and precipitation-use efficiency across Eurasian grasslands. Sci. Total Environ. 2020, 741, 140204. [Google Scholar] [CrossRef]
  31. Zhang, T.; Chen, Z.; Jiao, C.; Zhang, W.; Han, L.; Fu, Z.; Sun, Z.; Liu, Z.; Wen, Z.; Yu, G. Using the dynamics of productivity and precipitation-use efficiency to detect state transitions in Eurasian grasslands. Front. Ecol. Evol. 2023, 11, 1189059. [Google Scholar] [CrossRef]
  32. Dong, J.; Wu, L.; Zeng, W.; Xiao, X.; He, J. Analysis of spatial-temporal trends and causes of vapor pressure deficit in China from 1961 to 2020. Atmospheric Res. 2024, 299, 107199. [Google Scholar] [CrossRef]
  33. Xu, M.; Zhang, T.; Zhang, Y.; Chen, N.; Zhu, J.; He, Y.; Zhao, T.; Yu, G. Drought limits alpine meadow productivity in northern Tibet. Agric. For. Meteorol. 2021, 303, 108371. [Google Scholar] [CrossRef]
  34. Yu, T.; Jiapaer, G.; Bao, A.; Zheng, G.; Zhang, J.; Li, X.; Yuan, Y.; Huang, X.; Umuhoza, J. Disentangling the relative effects of soil moisture and vapor pressure deficit on photosynthesis in dryland Central Asia. Ecol. Indic. 2022, 137, 108698. [Google Scholar] [CrossRef]
  35. Zhang, C.; Lu, D.; Chen, X.; Zhang, Y.; Maisupova, B.; Tao, Y. The spatiotemporal patterns of vegetation coverage and biomass of the temperate deserts in Central Asia and their relationships with climate controls. Remote Sens. Environ. 2016, 175, 271–281. [Google Scholar] [CrossRef]
  36. Zhao, Y.; Wang, J.; Zhang, G.; Liu, L.; Yang, J.; Wu, X.; Biradar, C.; Dong, J.; Xiao, X. Divergent trends in grassland degradation and desertification under land use and climate change in Central Asia from 2000 to 2020. Ecol. Indic. 2023, 154, 110737. [Google Scholar] [CrossRef]
  37. Li, Z.; Li, Z.; Tong, X.; Zhang, J.; Dong, L.; Zheng, Y.; Ma, W.; Zhao, L.; Wang, L.; Wen, L.; et al. Climatic humidity mediates the strength of the species richness-biomass relationship on the Mongolian Plateau steppe. Sci. Total Environ. 2020, 718, 137252. [Google Scholar] [CrossRef]
  38. Han, D.; Hu, Z.; Wang, X.; Wang, T.; Chen, A.; Weng, Q.; Liang, M.; Zeng, X.; Cao, R.; Di, K.; et al. Shift in controlling factors of carbon stocks across biomes on the Qinghai-Tibetan Plateau. Environ. Res. Lett. 2022, 17, 074016. [Google Scholar] [CrossRef]
  39. Yang, Y.; Fang, J.; Fay, P.A.; Bell, J.E.; Ji, C. Rain use efficiency across a precipitation gradient on the Tibetan Plateau. Geophys. Res. Lett. 2010, 37, L15702. [Google Scholar] [CrossRef]
  40. Wang, Y.; Xue, K.; Hu, R.; Ding, B.; Zeng, H.; Li, R.; Xu, B.; Pang, Z.; Song, X.; Li, C.; et al. Vegetation structural shift tells environmental changes on the Tibetan Plateau over 40 years. Sci. Bull. 2023, 68, 1928–1937. [Google Scholar] [CrossRef]
  41. Zeng, X.; Hu, Z.; Chen, A.; Yuan, W.; Hou, G.; Han, D.; Liang, M.; Di, K.; Cao, R.; Luo, D. The global decline in the sensitivity of vegetation productivity to precipitation from 2001 to 2018. Glob. Change Biol. 2022, 28, 6823–6833. [Google Scholar] [CrossRef] [PubMed]
  42. Chen, C.; Park, T.; Wang, X.; Piao, S.; Xu, B.; Chaturvedi, R.K.; Fuchs, R.; Brovkin, V.; Ciais, P.; Fensholt, R.; et al. China and India lead in greening of the world through land-use management. Nat. Sustain. 2019, 2, 122–129. [Google Scholar] [CrossRef] [PubMed]
  43. Chen, J.M.; Ju, W.; Ciais, P.; Viovy, N.; Liu, R.; Liu, Y.; Lu, X. Vegetation structural change since 1981 significantly enhanced the terrestrial carbon sink. Nat. Commun. 2019, 10, 4259. [Google Scholar] [CrossRef] [PubMed]
  44. Maurer, G.E.; Hallmark, A.J.; Brown, R.F.; Sala, O.E.; Collins, S.L. Sensitivity of primary production to precipitation across the United States. Ecol. Lett. 2020, 23, 527–536. [Google Scholar] [CrossRef] [PubMed]
  45. Hu, Z.; Liang, M.; Knapp, A.; Xia, J.; Yuan, W. Are regional precipitation-productivity relationships robust to decadal-scale dry period? J. Plant Ecol. 2022, 15, 711–720. [Google Scholar] [CrossRef]
  46. Harris, I.; Osborn, T.J.; Jones, P.; Lister, D. Version 4 of the CRU TS monthly high-resolution gridded multivariate climate dataset. Sci. Data 2020, 7, 109. [Google Scholar] [CrossRef] [PubMed]
  47. Martens, B.; Miralles, D.G.; Lievens, H.; van der Schalie, R.; de Jeu, R.A.M.; Fernandez-Prieto, D.; Beck, H.E.; Dorigo, W.A.; Verhoest, N.E.C. GLEAM v3: Satellite-based land evaporation and root-zone soil moisture. Geosci. Model Dev. 2017, 10, 1903–1925. [Google Scholar] [CrossRef]
  48. Forzieri, G.; Alkama, R.; Miralles, D.G.; Cescatti, A. Satellites reveal contrasting responses of regional climate to the widespread greening of Earth. Science 2017, 356, 1140–1144. [Google Scholar] [CrossRef]
  49. Schumacher, D.L.; Keune, J.; van Heerwaarden, C.C.; de Arellano, J.V.-G.; Teuling, A.J.; Miralles, D.G. Amplification of mega-heatwaves through heat torrents fuelled by upwind drought. Nat. Geosci. 2019, 12, 712–717. [Google Scholar] [CrossRef]
  50. Piao, S.; Wang, X.; Park, T.; Chen, C.; Lian, X.; He, Y.; Bjerke, J.W.; Chen, A.; Ciais, P.; Tommervik, H.; et al. Characteristics, drivers and feedbacks of global greening. Nat. Rev. Earth Environ. 2020, 1, 14–27. [Google Scholar] [CrossRef]
  51. Gao, Q.; Schwartz, M.W.; Zhu, W.; Wan, Y.; Qin, X.; Ma, X.; Liu, S.; Williamson, M.A.; Peters, C.B.; Li, Y. Changes in Global Grassland Productivity during 1982 to 2011 Attributable to Climatic Factors. Remote Sens. 2016, 8, 384. [Google Scholar] [CrossRef]
  52. Xiong, Q.; Xiao, Y.; Liang, P.; Li, L.; Zhang, L.; Li, T.; Pan, K.; Liu, C. Trends in climate change and human interventions indicate grassland productivity on the Qinghai-Tibetan Plateau from 1980 to 2015. Ecol. Indic. 2021, 129, 108010. [Google Scholar] [CrossRef]
  53. Zha, X.; Niu, B.; Li, M.; Duan, C. Increasing Impact of Precipitation on Alpine-Grassland Productivity over Last Two Decades on the Tibetan Plateau. Remote Sens. 2022, 14, 3430. [Google Scholar] [CrossRef]
  54. Su, Y.; Chen, S.; Li, X.; Ma, S.; Xie, T.; Wang, J.; Yan, D.; Chen, J.; Feng, M.; Chen, F. Changes in vegetation greenness and its response to precipitation seasonality in Central Asia from 1982 to 2022. Environ. Res. Lett. 2023, 18, 104002. [Google Scholar] [CrossRef]
  55. Yin, C.; Luo, M.; Meng, F.; Sa, C.; Yuan, Z.; Bao, Y. Contributions of Climatic and Anthropogenic Drivers to Net Primary Productivity of Vegetation in the Mongolian Plateau. Remote Sens. 2022, 14, 3383. [Google Scholar] [CrossRef]
  56. Maestre, F.T.; Benito, B.M.; Berdugo, M.; Concostrina-Zubiri, L.; Delgado-Baquerizo, M.; Eldridge, D.J.; Guirado, E.; Gross, N.; Kefi, S.; Le Bagousse-Pinguet, Y.; et al. Biogeography of global drylands. New Phytol. 2021, 231, 540–558. [Google Scholar] [CrossRef]
  57. Brookshire, E.N.J.; Weaver, T. Long-term decline in grassland productivity driven by increasing dryness. Nat. Commun. 2015, 6, 7148. [Google Scholar] [CrossRef] [PubMed]
  58. Yang, Y.; Roderick, M.L.; Zhang, S.; McVicar, T.R.; Donohue, R.J. Hydrologic implications of vegetation response to elevated CO2 in climate projections. Nat. Clim. Change 2019, 9, 44–48. [Google Scholar] [CrossRef]
  59. Hufkens, K.; Keenan, T.F.; Flanagan, L.B.; Scott, R.L.; Bernacchi, C.J.; Joo, E.; Brunsell, N.A.; Verfaillie, J.; Richardson, A.D. Productivity of North American grasslands is increased under future climate scenarios despite rising aridity. Nat. Clim. Change 2016, 6, 710–714. [Google Scholar] [CrossRef]
  60. Schwaerzel, K.; Zhang, L.; Montanarella, L.; Wang, Y.; Sun, G. How afforestation affects the water cycle in drylands: A process-based comparative analysis. Glob. Change Biol. 2020, 26, 944–959. [Google Scholar] [CrossRef]
  61. Yao, Y.; Liu, Y.; Zhou, S.; Song, J.; Fu, B. Soil moisture determines the recovery time of ecosystems from drought. Glob. Change Biol. 2023, 29, 3562–3574. [Google Scholar] [CrossRef]
  62. Li, D.; An, L.; Zhong, S.; Shen, L.; Wu, S. Declining coupling between vegetation and drought over the past three decades. Glob. Change Biol. 2024, 30, e17141. [Google Scholar] [CrossRef] [PubMed]
  63. Shen, Z.; Zhang, Q.; Singh, V.P.; Pokhrel, Y.; Li, J.; Xu, C.-Y.; Wu, W. Drying in the low-latitude Atlantic Ocean contributed to terrestrial water storage depletion across Eurasia. Nat. Commun. 2022, 13, 1849. [Google Scholar] [CrossRef] [PubMed]
  64. Schneider, T.; Bischoff, T.; Haug, G.H. Migrations and dynamics of the intertropical convergence zone. Nature 2014, 513, 45–53. [Google Scholar] [CrossRef]
  65. Cates, A.M.; Jilling, A.; Tfaily, M.M.; Jackson, R.D. Temperature and moisture alter organic matter composition across soil fractions. Geoderma 2022, 409, 115628. [Google Scholar] [CrossRef]
  66. Dai, L.; Fu, R.; Guo, X.; Du, Y.; Zhang, F.; Cao, G. Soil Moisture Variations in Response to Precipitation Across Different Vegetation Types on the Northeastern Qinghai-Tibet Plateau. Front. Plant Sci. 2022, 13, 854152. [Google Scholar] [CrossRef]
  67. Zhang, T.; Chen, Z.; Zhang, W.; Jiao, C.; Yang, M.; Wang, Q.; Han, L.; Fu, Z.; Sun, Z.; Li, W.; et al. Long-term trend and interannual variability of precipitation-use efficiency in Eurasian grasslands. Ecol. Indic. 2021, 130, 108091. [Google Scholar] [CrossRef]
  68. Kou, D.; Yang, G.; Li, F.; Feng, X.; Zhang, D.; Mao, C.; Zhang, Q.; Peng, Y.; Ji, C.; Zhu, Q.; et al. Progressive nitrogen limitation across the Tibetan alpine permafrost region. Nat. Commun. 2020, 11, 3331. [Google Scholar] [CrossRef] [PubMed]
  69. Liu, Y.; He, N.; Wen, X.; Xu, L.; Sun, X.; Yu, G.; Liang, L.; Schipper, L.A. The optimum temperature of soil microbial respiration: Patterns and controls. Soil Biol. Biochem. 2018, 121, 35–42. [Google Scholar] [CrossRef]
  70. Cheng, C.; He, N.; Li, M.; Xu, L.; Sun, O.J. Spatial assembly of grassland communities and interrelationships with productivity. Funct. Ecol. 2023, 37, 1221–1231. [Google Scholar] [CrossRef]
Figure 1. Ensemble mean of ANPP in Eurasian grasslands during 1982–2020. (a) Spatial distribution of the ANPP, (b) frequency distribution of the ANPP, (c) mean ANPP in the entire region and three subregions (BKSSR, MPSSR, and TPSSR), (d) variations in ANPP along elevation and longitude gradients, (e) variations in ANPP along elevation and latitude gradients, (f) variations in ANPP along MAP and MAT gradients, and (g) variations in ANPP along SM and VPD gradients.
Remotesensing 16 02368 g001
Figure 2. The temporal dynamic of NDVIint and its relationship with measured ANPP. (a) The temporal dynamic of GIMMS_NDVIint and MODIS_NDVIint from 1982 to 2020 in entire Eurasian grasslands. (b) The relationships between ANPP GIMMS_NDVIint and MODIS_NDVIint from 2004 to 2013. (c) Regression function between NDVIint and measured ANPP. The black curves represent regression function. The shadings represent the 95% confidence of regression analysis. The R2 represents the degree of explanation of the variable, respectively.
Remotesensing 16 02368 g002
Figure 3. Interannual dynamic of ANPP (a,d,g,j), Aridity (b,e,h,k), and VPD (c,f,i,l) in EASR (ac), BKSSR (df), MPSSR (gi), and TPSSR (jl), respectively. The solid curves represent regression function.
Remotesensing 16 02368 g003
Figure 4. Spatial distribution of trend in ANPP (a), Aridity (b), SM (c), and VPD (d) in EASR from 1982 to 2020. The green, red, and gray colors represent positive, negative, and nonsignificant trends, respectively. Significance was set at p < 0.05.
Remotesensing 16 02368 g004
Figure 5. The temporal variations of ANPP with Aridity (a), SM (b), and VPD (c). The shadings represent the 95% confidence of regression analysis. The R2 represents the degree of explanation of the variable, and *, **, *** represent significance at p = 0.05, p = 0.01, and p = 0.001 levels, respectively.
Remotesensing 16 02368 g005
Figure 6. Temporal dynamic of the correlation coefficients between ANPP and Aridity (1 − AI) (a,d,g,j), soil moisture (SM) (b,e,h,k) and vapor pressure deficit (VPD) (c,f,i,l) with 15-year moving windows during 1982–2020 in Eurasian grasslands. The solid and dotted lines indicate the linear regression over different periods. A statistical probability of p < 0.05 determined significance. The shading represented the regression analysis confidence range (5th and 95th percentiles).
Remotesensing 16 02368 g006
Figure 7. Structural equation models of climate factors (AP, AT, U_wind, V_wind) and water cycle (SM, Aridity, VPD) on spatial variation of aboveground net primary production (ANPP) for EASR (a,e,i), BKSSR (b,f,g), MPSSR (c,j,k), and TPSSR (d,h,l). Solid and dashed arrows represented the positive or negative effects in fitted structural equation models, respectively. The widths of the arrows indicated the strength of the relationships. The percentage (R2) indicated the degrees of explanation of variables, and *, **, and *** represented a significant relationship at p = 0.05, p = 0.01, and p = 0.001 levels, respectively.
Remotesensing 16 02368 g007
Disclaimer/Publisher’s Note: The statements, opinions and data contained in all publications are solely those of the individual author(s) and contributor(s) and not of MDPI and/or the editor(s). MDPI and/or the editor(s) disclaim responsibility for any injury to people or property resulting from any ideas, methods, instructions or products referred to in the content.

