Article

Unraveling the Impacts of River Network Connectivity on Ecological Quality Dynamics at a Basin Scale

1
Research and Development Center for Watershed Environmental Eco-Engineering, Beijing Normal University, Zhuhai 519087, China
2
State Key Laboratory of Water Environment Simulation, School of Environment, Beijing Normal University, Beijing 100875, China
3
Key Laboratory of Coastal Water Environmental Management and Water Ecological Restoration of Guangdong Higher Education Institutes, Beijing Normal University, Zhuhai 519087, China
4
Department of Geographic Science, Faculty of Arts and Sciences, Beijing Normal University, Zhuhai 519087, China
5
Instrumentation and Service Center for Science and Technology, Beijing Normal University, Zhuhai 519087, China
6
Department of Statistics, Faculty of Arts and Sciences, Beijing Normal University, Zhuhai 519087, China
7
State Key Laboratory of Lake Science and Environment, Nanjing Institute of Geography and Limnology, Chinese Academy of Sciences, Nanjing 210008, China
8
USDA-ARS Hydrology and Remote Sensing Laboratory, Beltsville, MD 20705, USA
*
Author to whom correspondence should be addressed.
Remote Sens. 2024, 16(13), 2370; https://doi.org/10.3390/rs16132370
Submission received: 15 May 2024 / Revised: 14 June 2024 / Accepted: 24 June 2024 / Published: 28 June 2024

Abstract

:
The ecological quality of river basins is significantly influenced by the complex network of river structures and their connectivity. This study measured the temporal and spatial variability of ecological quality, as reflected by remote sensing ecological indices (RSEI), and examined their responses to river network connectivity (RNC). In total, 8 RNC indices, including river structure of river density (Dr), water surface ratio (Wr), edge-node ratio (β), and network connectivity (γ), and node importance indices of betweenness centrality (BC), PageRank (PG_R), out_degree centrality (Out_D), and in_closeness centrality (In_C), were generated at the subbasin scale. Our results highlighted the significance of RNC in influencing both the values and variability of RSEI, and the extent of this influence varied across different time periods. Specifically, three distinct clusters can be extracted from the temporal variability of RSEI, representing wet, near-normal, and dry years. The river structure index of γ significantly influenced the spatial patterns of subbasin RSEIs, particularly in wet years (R2 = 0.554), whereas β displayed a pronounced U-shape correlation with subbasin RSEIs in dry years (R2 = 0.512). Although node importance indices did not correlate directly with subbasin RSEI levels, as the river structure indices did, they significantly positively affected temporal variability of subbasin RSEIs (EI_SD_t). Higher values of PG_R, Out_D, and In_C were associated with increased subbasin RSEI variability. Based on these correlations, we developed RNC-based RSEI and EI_SD_t models with high adjusted coefficients of determination to facilitate the assessment of ecosystem quality. This study provides essential insights into ecosystem dynamics related to river connectivity within a basin and offers valuable guidance for effective watershed management and conservation efforts aimed at enhancing ecological resilience and sustainability.

1. Introduction

The ecological quality of a river basin represents a complex interplay of spatial and temporal dynamics influenced by the intricate structure and multi-scale processes inherent in riverine ecosystems. Within the basin, the quality of ecological habitats varies significantly [1,2,3]. Crucial factors such as land use patterns, vegetation cover, and substrate composition shape these habitats and determine their ecological health [4,5]. Moreover, the connectivity and interdependence between different habitat types within the basin further complicate the picture, as disturbances or alterations in one area can have cascading effects throughout the entire ecosystem [5,6,7,8]. Understanding the complexities of river structurer impacts on ecology is essential for preserving the health and resilience of riverine ecosystems and ensuring the sustainability of basin for future generations.
There are various methodologies to effectively quantify the ecological quality and assess its variability. Field surveys provide in-depth, site-specific data through direct measurements and observations of water, soil, and plants, allowing for detailed characterization of ecological conditions, habitat structures, and species distributions within the sampling locations [9,10,11]. Although invaluable for ground-truthing and validating data from other sources, these surveys are time consuming and may not provide real-time status updates. Ecological modeling techniques conduct analyses of historical documents to trace ecological changes, offering insights into long-term trends and dynamics [3,12,13]. However, these methods often require substantial amounts of ecological and environmental monitoring data to accurately capture the complexities of ecosystem processes and their responses to various factors over time. Recently, remote sensing has increasingly incorporated these traditional methods due to its capacity to deliver comprehensive, high-resolution data over vast areas with high return frequency. The Remote Sensing Ecological Index (RSEI) is a commonly used indicator that effectively reflects the quality and stability of ecosystems, serving as a reliable measure of their capacity to withstand disturbances and maintain equilibrium [14,15,16,17]. Integrating vegetation health, land cover change, water quality, and biodiversity indices, the RSEI offers a comprehensive assessment of ecosystem dynamics. Through the analysis of temporal variability, the RSEI can capture both long-term trends and short-term fluctuations [18,19]. This temporal dimension helps identify ecological changes over time, encompassing seasonal variations, trends in land cover change, and responses to environmental stressors. Additionally, the spatial variability of RSEI aids in pinpointing localized changes and hotspots of ecological degradation, thereby facilitating targeted conservation efforts [18,20,21].
The significance of hydrological processes on ecological conditions has garnered increasing attention in recent years [22,23,24]. Water cycles can significantly impact soil–vegetation dynamics, controlling fundamental ecological patterns and processes [25,26]. River network connectivity (RNC), which refers to the degree of interconnectedness among rivers and streams within a watershed, emerges as a crucial hydrological factor that shapes ecological characteristics and influences diverse ecosystems [27,28]. Properly connected rivers are primary pathways for nutrients, sediment, and organic matter transport and essential migration of aquatic species, promoting important processes such as nutrient cycling and the migration of aquatic species [7,29,30]. This ensures the continued health and sustainability of populations within the ecosystem. The RNC serves as a natural defense mechanism against the impact of floods. By shaping dynamic basins, connected river networks act as natural buffers, reducing the severity of flooding events, mitigating sedimentation, and improving water quality downstream. Mitchell et al., in their study on landscape connectivity and ecosystem conservation, emphasized that connectivity enhances ecosystem quality by facilitating adaptation to environmental changes and disturbances, such as climate change and habitat loss [31].
This study addresses a critical gap in current research by directly investigating the relationship between RNC and regional ecological quality. While previous studies have acknowledged the importance of RNC [25,26,27], few have directly linked it to ecological quality, despite its significant influence on water supply and key ecological processes, such as nutrient transport and sediment dynamics. Quantifying the relationship between RNC and ecological quality offers valuable insights for understanding the spatial and temporal variability in ecological conditions within riverine ecosystems and for evaluating the impacts of human-induced changes in connectivity on these ecosystems. As a significant tributary subbasin of the Yellow River Basin, a thorough understanding of the relationship between RNC and ecological quality is urgently needed to support ongoing ecological restoration efforts in the Dawen River Basin [32]. Insights derived from historical correlation quantification analyses can assist managers in accurately identifying regions experiencing substantial shifts in ecological quality and in assessing the hydrological dynamic impacts on watersheds. Moreover, these analyses will enable the evaluation of potential ecological changes resulting from RNC-related restoration programs.
Therefore, this study seeks to answer two scientific questions: (1) how do RNC indices impact the ecological quality of riverine ecosystems within the Dawen River Basin, and (2) how do these impacts vary over time? The objectives of our study were (1) to explore the spatial and temporal changes of RSEI in the Dawen River Basin; (2) to identify the main RNC indices influencing RSEI over time; and (3) to quantify the impacts of RNC on ecological quality through numerical models. By addressing these objectives, we sought to provide valuable insights into evidence-based management and conservation strategies aimed at preserving and enhancing the health of riverine ecosystems in basins.

2. Materials and Methods

2.1. Study Area

The Dawen River Basin, located in Shandong Province, is one of the most important tributaries of the Yellow River’s lower segment and is distinguished by its uncommon east-to-west flow direction in China (Figure 1a, 117°13′27″–117°14′9″ E, 36°3′46″–36°4′32″ N). This river traverses the majority of nine counties, including Dongping County, Pingyin County, Feicheng County, Ningyang County, Daiyue District, Taishan District, Laiwu District, Gangcheng District, and Xintai County. The total length of its main branches reaches 184 km (Figure 1b, Stream Level 6), and the basin covers an area of 8402 km2. This region is characterized by high mountains and steep slopes in the east and relatively flat terrain in the west. The predominant soil types are brown loam and brown soil, known for their friable consistency and shallow depth. The basin falls within the warm temperate continental monsoon climate category, with an average annual rainfall of 709 mm (1956–2016), heavily affected by monsoon patterns [33,34]. Rainfall is primarily accumulated during the summer months, frequently intense, and less in other seasons.
The predominant land use in this area is agriculture, covering more than 58% of the total land area, as calculated based on land use data from 2020 (Figure 1c). Water resources within the Dawen River Basin are considerably more abundant compared to the entire Shandong region. However, the basin’s natural hydrology is increasingly disrupted due to extensive human activities, including the construction of numerous water infrastructure projects along the river, as well as the effects of climate change. The lack of comprehensive knowledge about the basin’s hydrology and its interactions with climate and ecological dynamics can significantly compromise the ecological integrity of the area.

2.2. Data Collection

In this study, two types of remotely sensed data were collected for river connectivity and RSEI data generation, including the 12.5 m Digital Elevation Model (DEM) and Landsat imagery. We collected the DEM of Advanced Land Observing Satellite-Phased Array-Type L-Band Synthetic Aperture Radar (ALOS-PALSAR) from the Data Center for Resources and Environmental Sciences (https://www.resdc.cn/data.aspx?DATAID=337, accessed on 23 April 2022). The Landsat 5 and Landsat 8 data had a spatial resolution of 30 m × 30 m from 2003 to 2021 and were downloaded from the United States Geological Survey (USGS, https://earthexplorer.usgs.gov, accessed on 19 October 2022). The selection of the image needs to meet the following two criteria: (1) the images captured during the months of July through October, coinciding with peak vegetation growth, to facilitate requisite vegetation index computations; (2) images exhibiting cloud cover below 4%. Based on these two criteria, we selected images on 15 September 2003, 23 September 2006, 30 August 2009, 21 September 2011, 26 September 2013, 2 October 2015, 3 July 2017, 27 September 2019, and 16 September 2021 (Table 1).
We also collected the land use/land cover (LULC) of 2020 (Figure 1c) from the Land Use Land Cover Remote Sensing Monitoring Dataset for China (CNLUCC) from the Data Center for Resources and Environmental Sciences (http://www.resdc.cn, accessed on 21 March 2022). The CNLUCC dataset was compiled through visual interpretations of satellite imagery and classified into 25 subcategories. The accuracy of the dataset was verified through field surveys conducted over the study period with the average classification accuracy exceeding 90%, confirming the reliability of the CNLUCC data for subsequent analyses [35]. In our study, we reclassified the 25 subcategories in the CNLUCC data into six main land use categories, as Figure 1c suggested, and used it for RNC index generation.

2.3. Remotely Sensed Data Analyses

2.3.1. The RSEI Index

The Remote Sensing Ecological Index (RSEI) is a normalized ecological assessment index derived from the integration of greenness, humidity, dryness, and warmth through principal component analysis [36]. In this study, the RSEI value was calculated during the growing season of vegetation. It can be formulated as a function that incorporates the four indicators:
R S E I = f ( N D V I , W E T , N D B S I , L S T )
In which, the Normalized Difference Vegetation Index (NDVI), Wetness index (WET), Dryness index (NDBSI), and land surface temperature (LST) represent the factors of greenness, humidity, warmth, and dryness, respectively.
The NDVI is an indicator constructed based on the spectral characteristics of vegetation, specifically the red-edge region, and normalized to remove dimensional constraints. The NDVI can be expressed as:
N D V I = ( ρ N I R ρ R e d ) ( ρ N I R + ρ R e d )
where ρ N I R , ρ R e d are the reflectance of the near-infrared (NIR) and red light (RED) bands for each pixel, respectively.
WET refers to the moisture component in the Tasseled Cap Transformation (TCT), which effectively reflects the moisture content in the soil. For the TM and OLI sensors, their calculation formulas are as follows, respectively:
WET = 0.0315 × ρ Blue + 0.2021 × ρ Green + 0.3102 × ρ Red + 0.1594 × ρ NIR 0.6806 × ρ   SWIR 1 0.6109 × ρ   SWIR 2
WET = 0.1511 × ρ Blue + 0.1973 × ρ Green + 0.3283 × ρ Red + 0.3406 × ρ NIR   0.7117 × ρ   SWIR 1 0.4559 × ρ   SWIR 2
where ρ Blue ,   ρ G r e e n   are the reflectance of blue and green bands for each pixel, respectively, ρ   SWIR 1   a n d   ρ   SWIR 2 are reflectance of short-wave infrared.
The NDBSI is selected to synthesize the Built-up Index (IBI) with the Soil Index (SI) to characterize the desiccating effect of land cover and buildings on the land surface [37]. The normalized difference bare soil index is selected as the presentation of the dryness index. The function is as follows:
N D B S I = ( I B I + S I ) / 2
where the IBI can be calculated based on Landsat data:
I B I = ( ( 2.0 * ρ   SWIR 1 / ( ρ   SWIR 1 + ρ NIR ) ) ( ρ NIR / ( ρ NIR + ρ Red ) + ρ Green / ( ρ Green + ρ   SWIR 1 ) ) ) ( ( 2.0 * ρ   SWIR 1 / ( ρ   SWIR 1 + ρ NIR ) ) + ( ρ NIR / ( ρ NIR + ρ Red ) + ρ Green / ( ρ Green + ρ   SWIR 1 ) ) )
S I = ( ( ρ   SWIR 1 + ρ Red ) ( ρ NIR + ρ Blue ) ) ( ( ρ   SWIR 1 + ρ Red ) + ( ρ NIR + ρ Blue ) )
Heat is represented by the LST. At present, various scholars have developed different algorithms for land surface temperature inversion based on the thermal infrared (NIR) bands of various sensors, such as OLI and MODIS. In this study, we generated the surface temperature based on the radiation transfer equation as follows:
L S T = K 2 ln ( ( K 1 L T ) + 1 )
in this formula, K2 and K1 represent the thermal infrared band radiance constants for each sensor. K1 values of 607.76 and 774.89 were selected for Landsat 5 and 8, respectively, and K2 values of 1260.56 and 1321.08, respectively. LT represents the blackbody radiance, which is calculated according to the method developed by Qin et al. [38].
Given the variations in dimensions and magnitudes among the four indicators, normalization of each indicator is required as a preliminary step. Subsequently, principal component analysis (PCA) was conducted on the normalized indicators, focusing on extracting the first principal component (PC1). This PC1 was then utilized to represent the initial ecological index RSEI0. It can be expressed as follows:
R S E I 0 = 1 P C 1 ( N D V I , W E T , N D B S I , L S T )
The ecological quality index was then normalized:
R S E I = ( R S E I 0 _ i R S E I 0 _ min ) ( R S E I 0 _ max + R S E I 0 _ min )
The resulting RSEI ranged from 0 to 1. Usually, a higher RSEI indicates better ecological conditions, whereas a lower value indicates poorer conditions. The classification standards were established as follows: 0–0.2 is very poor, 0.2–0.4 is poor, 0.4–0.6 is fair, 0.6–0.8 is good, and 0.8–1.0 is excellent.

2.3.2. River Network Connectivity

The quantification of RNC was based on the stream networks derived from the DEM for the Dawen River Basin, utilizing the Strahler method [39] with the Stream Order module of ArcGIS Pro 3.1 (ESRI Company, Redlands, CA, USA). First, we applied a sink-filling algorithm to remove depressions from the DEM, ensuring continuous water flow across the terrain. Next, we calculated the flow direction for each cell in the DEM using the Deterministic 8-neighbor algorithm, followed by computing flow accumulation to quantify the potential water flow through each cell based on upstream contributions. We then applied a threshold of flow accumulation exceeding 10,000 to identify significant streams and channels and finally used stream ordering to classify the stream network. The generated network was visually verified against high-resolution images from Google Earth and the ArcGIS basemap, achieving an accuracy of 83%.
Six main stream branches were selected with a total length of 4563 km. A total of 298 nodes were generalized from the confluence points of rivers from which hydrological connectivity metrics were generated. The characteristics and interconnectedness of river systems were then encapsulated through three dimensions: volume, structural linkage, and node importance (Table 2). In our analysis, the concepts of river density (Dr), water surface ratio (Wr), the ratio of edges to nodes (β), and network connectivity (γ) were also selected to serve to elucidate the structural interconnections within the river system. Additionally, indicators related to node importance were also generated to understand the interconnectedness of hydrological systems. They were node betweenness centrality (BC), Pagerank (PG_R), out_degree centrality (Out_D), and in_closeness centrality (In_C), which were used to evaluate the critical points in the hydrological network that influence water flow, distribution, and quality across the landscape.

2.4. Effects of River Network Connectivity on RSEI

The impacts of RNC on RSEI were analyzed at the subbasin scale. To achieve this, we delineated the subbasins within the Dawen River Basin using flow accumulation models in ArcGIS Pro 3.2.0, setting the threshold for flow accumulation at greater than 20,000. In total, 18 subbasins were obtained based on the criteria. Then, we calculated the average of RSEI and the average values of RNC (Dr, Wr, β, γ, BC, PG_R, In_C, In_D) at the subbasin scale to facilitate subsequent statistical analyses. Since the RSEI showed high temporal variations, we also tested possible clusters based on temporal heterogeneity through hierarchical cluster analysis (HCA). A dendrogram was generated from the HCA, offering a visual summary of the clustering process [40]. It illustrates the arrangement of clusters, highlighting a stepwise simplification of the original dataset’s complexity.
The statistical significance of the RNC indicators for ecological quality was assessed through both linear and second-order polynomial correlations. These coefficients typically quantify the relationship of averaged RSEI (EI_a) and RSEI clusters with river structure characteristics and node importance indices at the subbasin scale. The p-value determines the statistical correlation between two variables. Our research considered p-values less than 0.05 to be indicative of significant correlations. We also developed RNC-based ecological quality models employing stepwise multiple linear regression coupled with the “leave-one-out” cross-validation technique. The independent variables in the model were also checked with variable inflation factor (VIF), and variables with VIF exceeding 5 were removed from the stepwise linear regression models [41,42]. Model performance was assessed using the adjusted coefficient of determination (Radj2) and the Nash-Sutcliffe Efficiency (NSE), and the ratio of the root mean square error to the standard deviation of the observed data (RSR). A model is generally deemed to perform adequately if the NSE exceeds 0.5 and the RSR is below 0.7 [43,44]. All geospatial analyses were conducted in ArcGIS Pro 3.2.0 (ESRI, Redlands, CA, USA), and statistical analyses were performed in R 4.3.2.

3. Results

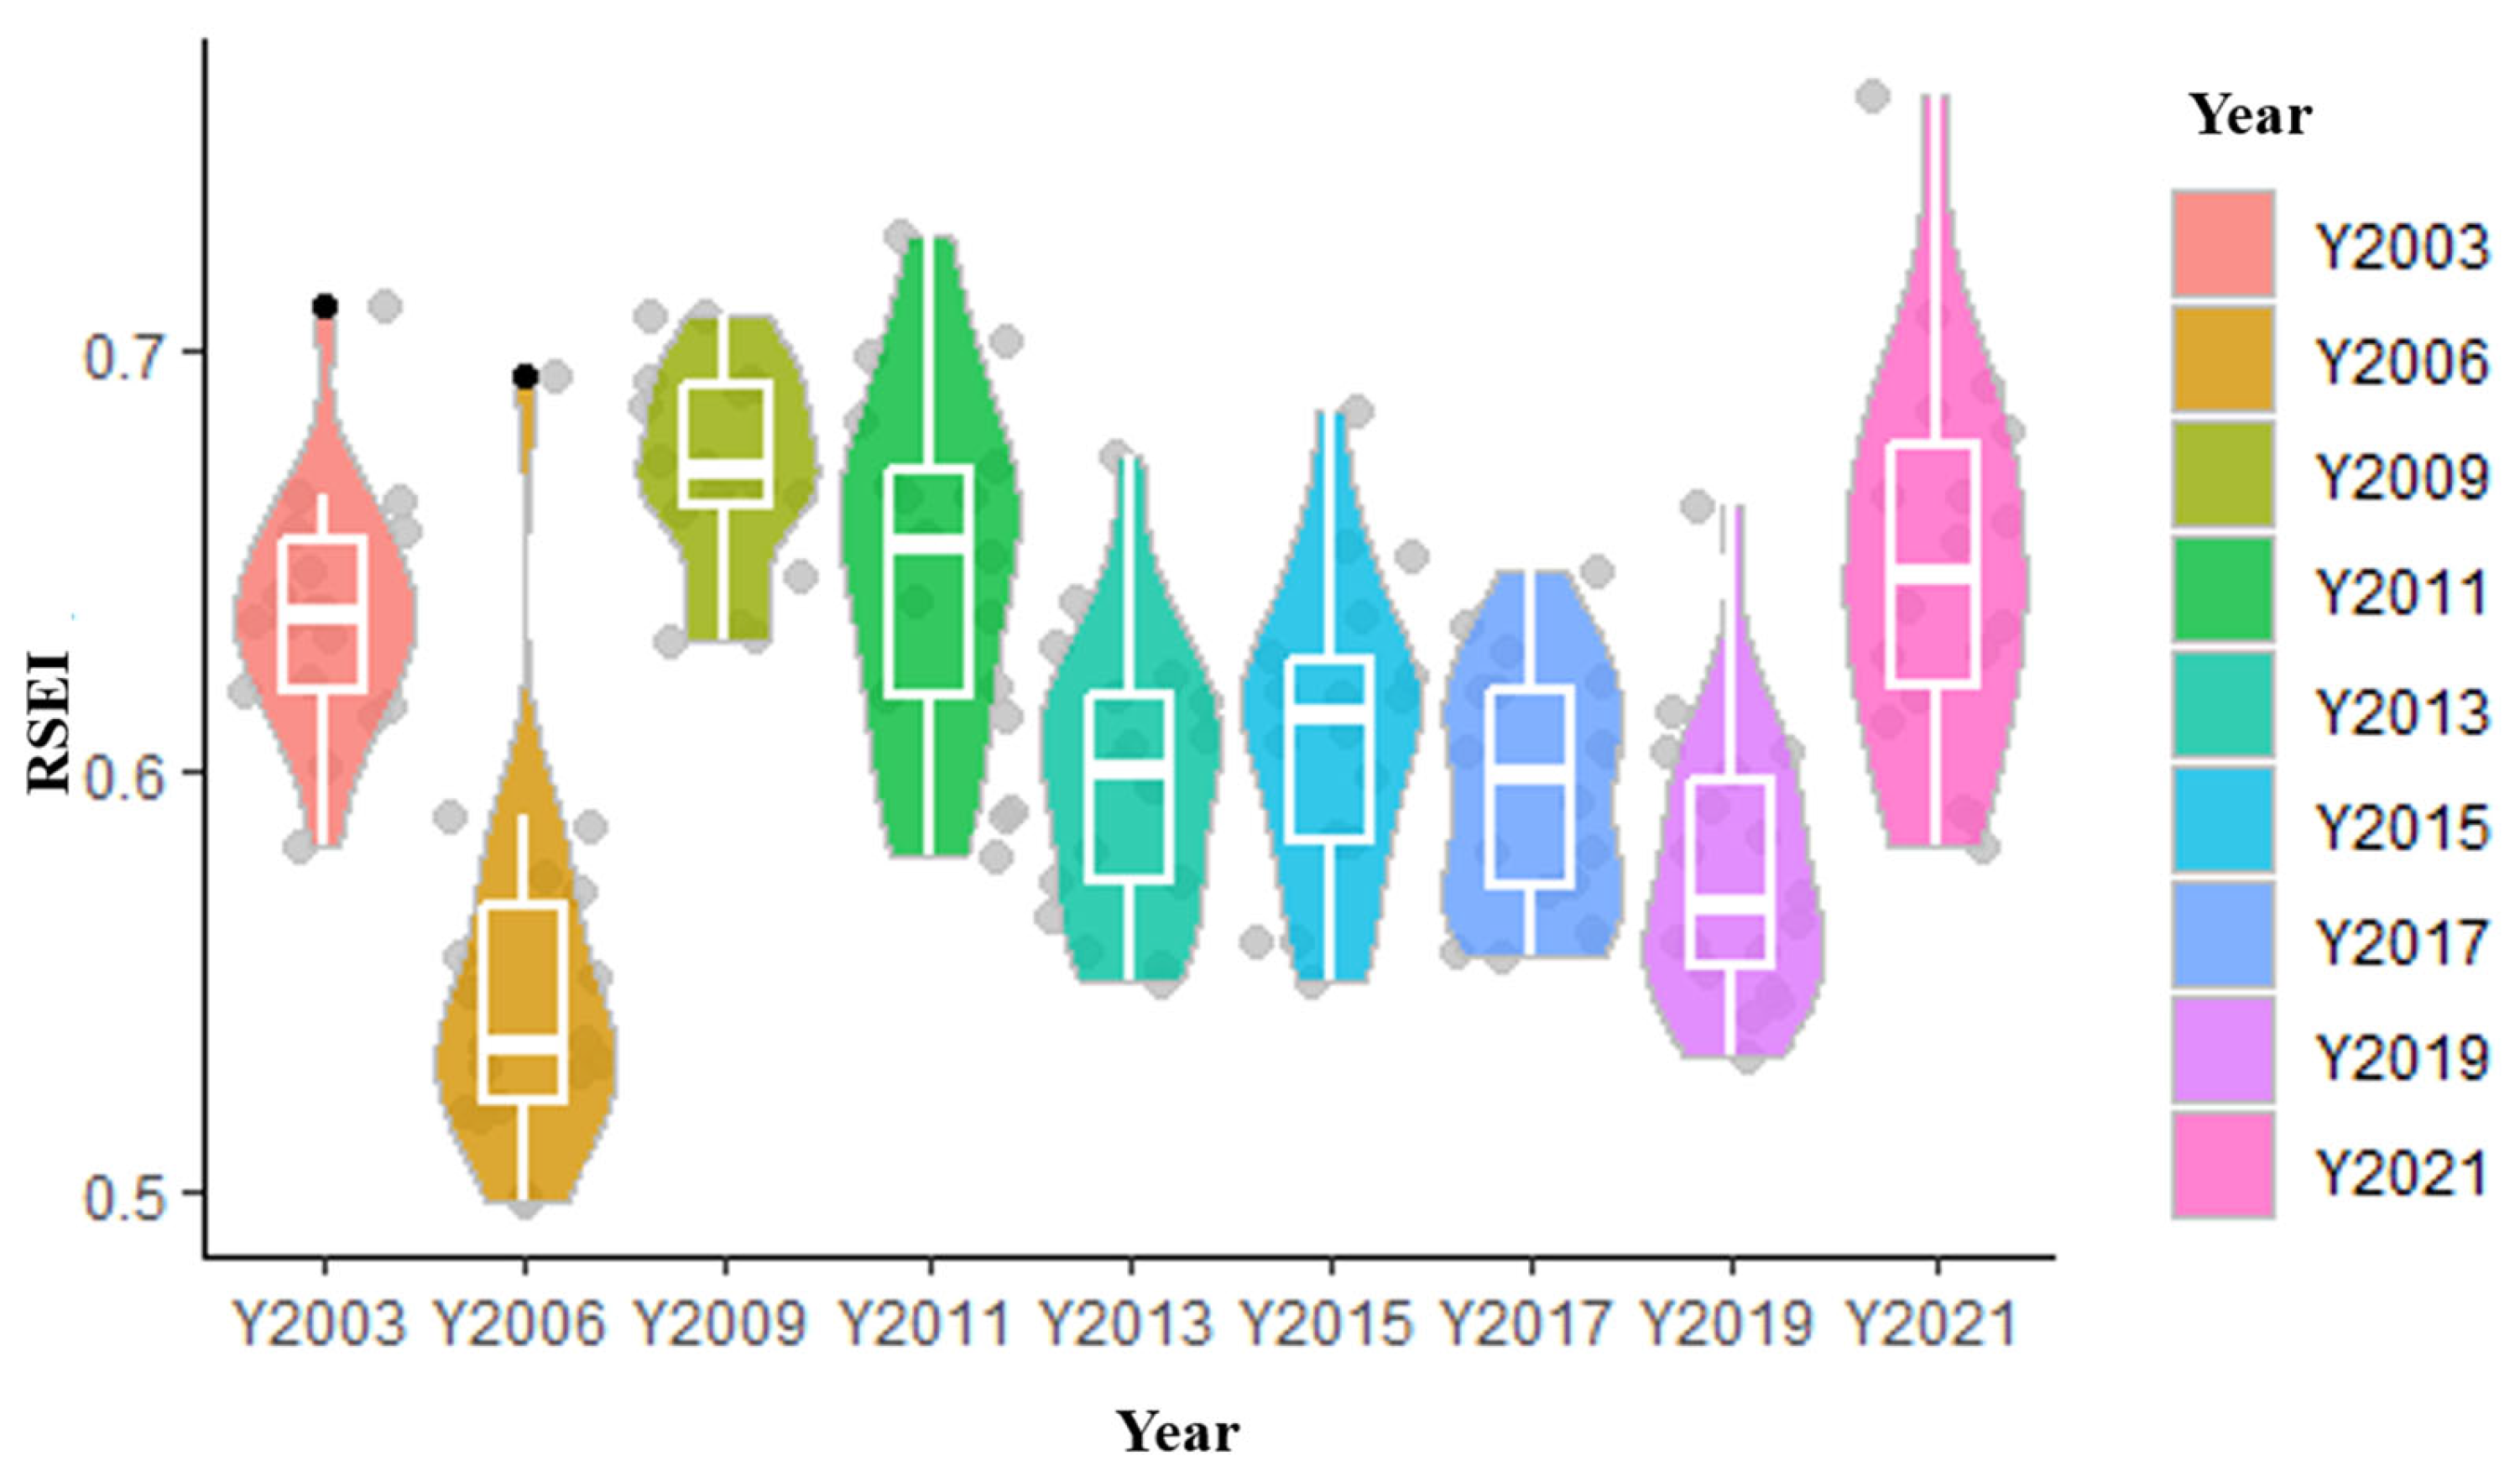
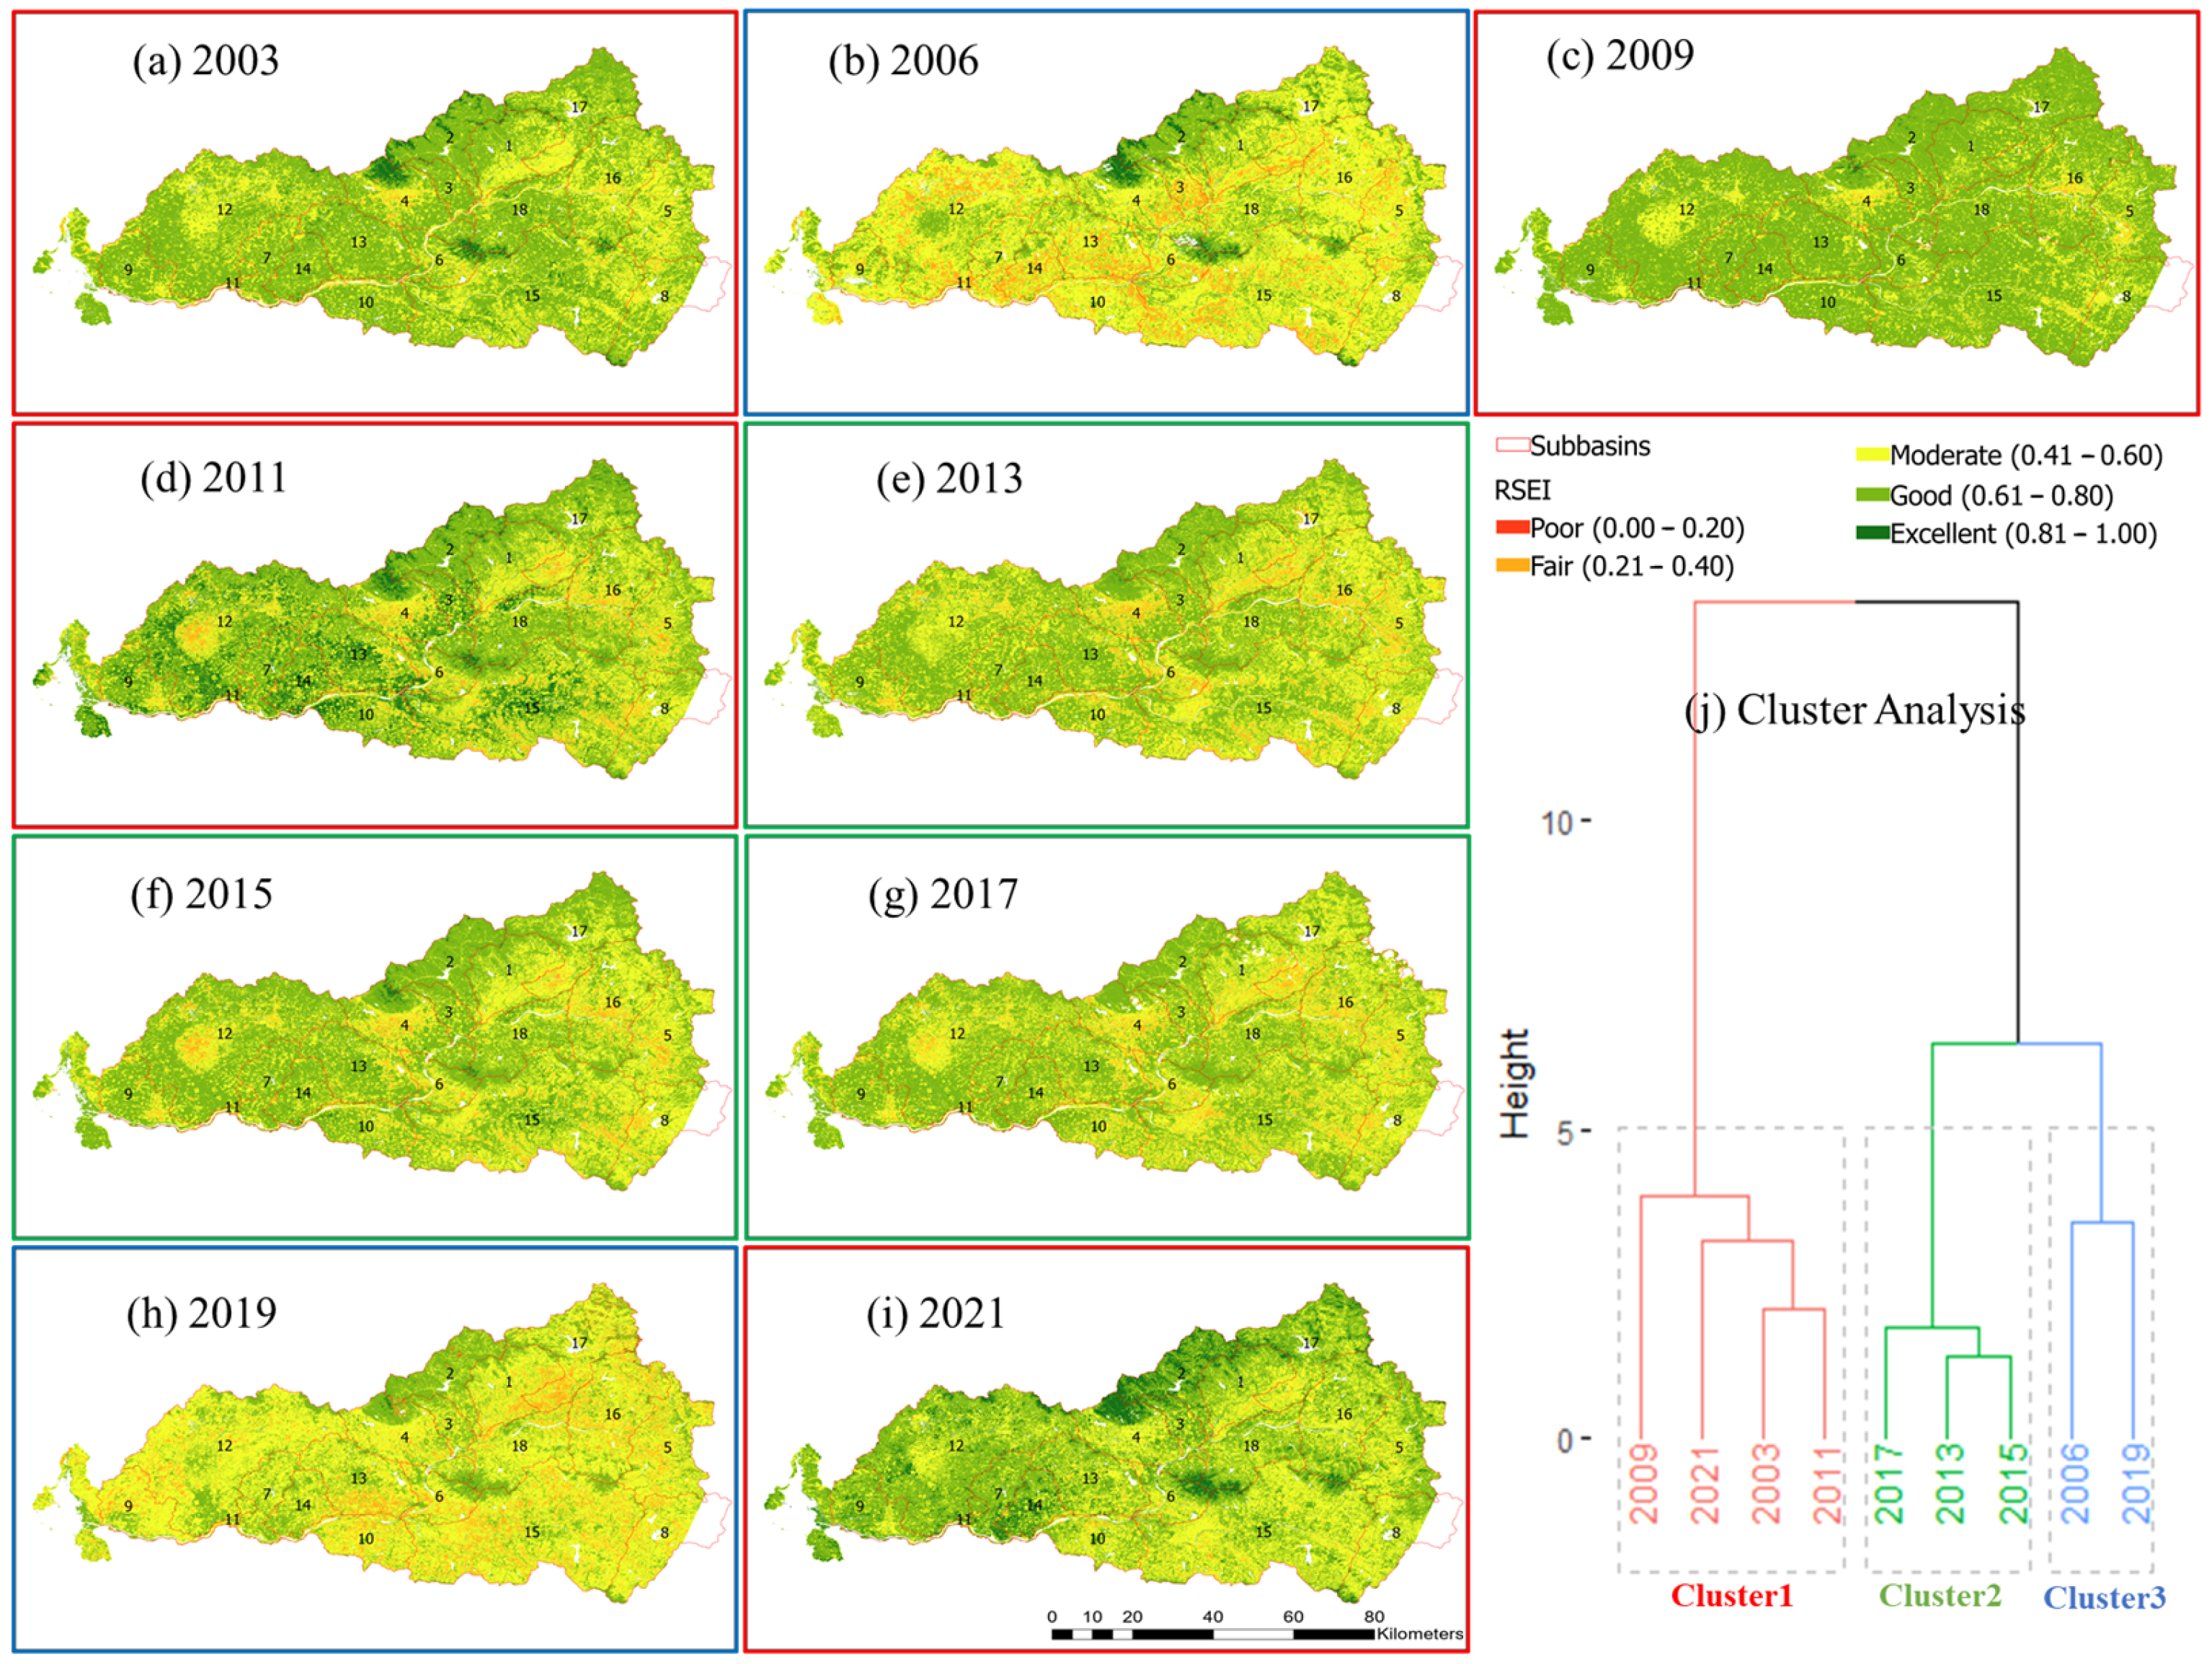
3.1. Spatial and Temporal Distribution of RSEIs in the Basin

Between 2003 and 2021, the average subbasin RSEIs of the Dawen River Basin ranged from 0.549 to 0.672, indicating notable fluctuations in ecological quality on an annual basis. However, there were no apparent temporal trends over time (p > 0.05). Instead, the subbasin RSEI values exhibited three distinct levels from 2003 to 2021 (Figure 2). We observed extremely low subbasin RSEI values during the years 2006 and 2019 compared to other years, falling below 0.580. These two years also displayed significant spatial variability, as illustrated by the expanded distribution in 2006 and 2019 (Figure 2). Conversely, 2003, 2009, 2011, and 2021 stood out with high mean subbasin RESI values, all exceeding 0.630. Except for RSEIs in 2021, the spatial variability in other years of this cluster was relatively small, demonstrated by the narrower distribution range in Figure 2. Other years, including 2013, 2015, and 2017, exhibited a moderate level of mean subbasin RSEI at 0.601 among the three clusters.
Using HCA, the subbasin RSEI dataset was effectively separated into three clusters. Cluster 1 comprised the years 2003, 2009, 2011, and 2021; Cluster 2 consisted of 2013, 2015, and 2017; and Cluster 3 encompassed 2006 and 2019 (Figure 3j). This clustering aligned with the three levels visually discerned in the dataset (Figure 2). During 2006 and 2019, the Dawen River Basin typically exhibited higher percentages of “poor”, “fair”, and “moderate” subbasin RSEI ratings (EI_C3), with more than 50% of the areas (69.3% in 2006 and 62.9% in 2019) falling into these categories (Figure 3b,h). Years 2013, 2015, and 2017 in Cluster 2 showed moderated subbasin RSEI values (EI_C2) among the above three clusters (Figure 3e–g). Specifically, high proportions of ‘poor’ to ‘fair’ ecological conditions were found in subbasins 5 and 16 and the middle of subbasin 4, located in the urban areas of Laiwu, Gangcheng, and Taishan districts, respectively. Conversely, subbasin RSEIs in 2003, 2009, 2011, and 2021 in Cluster 1 (EI_C1) were characterized by predominantly ‘good’ ecological conditions across the watershed (Figure 3a,c,d,i). Notably, in the middle of the watershed, subbasin 6, located in Taiyue county, as well as northern subbasins 3 and 4, exhibited high proportions of good and excellent conditions.

3.2. Spatial Differences of RNC in the Basin

In the Dawen River Basin, the four river structure indexes of Dr, Wr, β, and γ were recorded as 0.316, 0.183, 1.922, and 0.781, respectively. When examining the subbasin scale, the Dr index varied between 0.233 and 0.470. The highest Dr values were observed in subbasins situated along the main branches, specifically subbasins 11, while the lowest were noted in subbasins positioned at the basin’s terminus, such as subbasins 2, 8, and 17 (Figure 4a). The range of Wr values was from 0.05 to 0.411, with subbasin 11 exhibiting the highest and subbasin 2 displaying the lowest (Figure 4b). β values demonstrated minimal variation, spanning from 1.670 to 2.000, with the peak value identified in subbasins 2, 4, and 14 (Figure 4c). The pattern of spatial variability for γ connectivity displayed the highest in subbasins 2, 3, and 14, and the lowest in subbasins 12 and 15, with relatively large subbasins along the main stream (Figure 4d).
In terms of node importance metrics, spatial variations differed from river structure indices. For instance, subbasin 2 showed the highest β and γ values, respectively, but exhibited moderated to low values of node importance metrics. Furthermore, the spatial patterns of these four variables were also not uniform due to low and insignificant correlations between these metrics (Spearman correlations, p > 0.05). BC exhibited a broad range, from 0.00034 to 0.01254, with the subbasins close to the center of the watershed showing relatively high BC values (Figure 4e). For example, subbasin 6, located centrally within the watershed, showed the highest BC value. However, the other three index values in subbasin 6 were relatively low. The highest PG_R and In_C values were observed in subbasins 10 and 14, suggesting their substantial influence within the network due to the efficient dissemination of information or resources (Figure 4f,h). Additionally, subbasins 7, 11, and 14, situated in the main branch of the Dawen River, displayed relatively high Out_D values (Figure 4g).

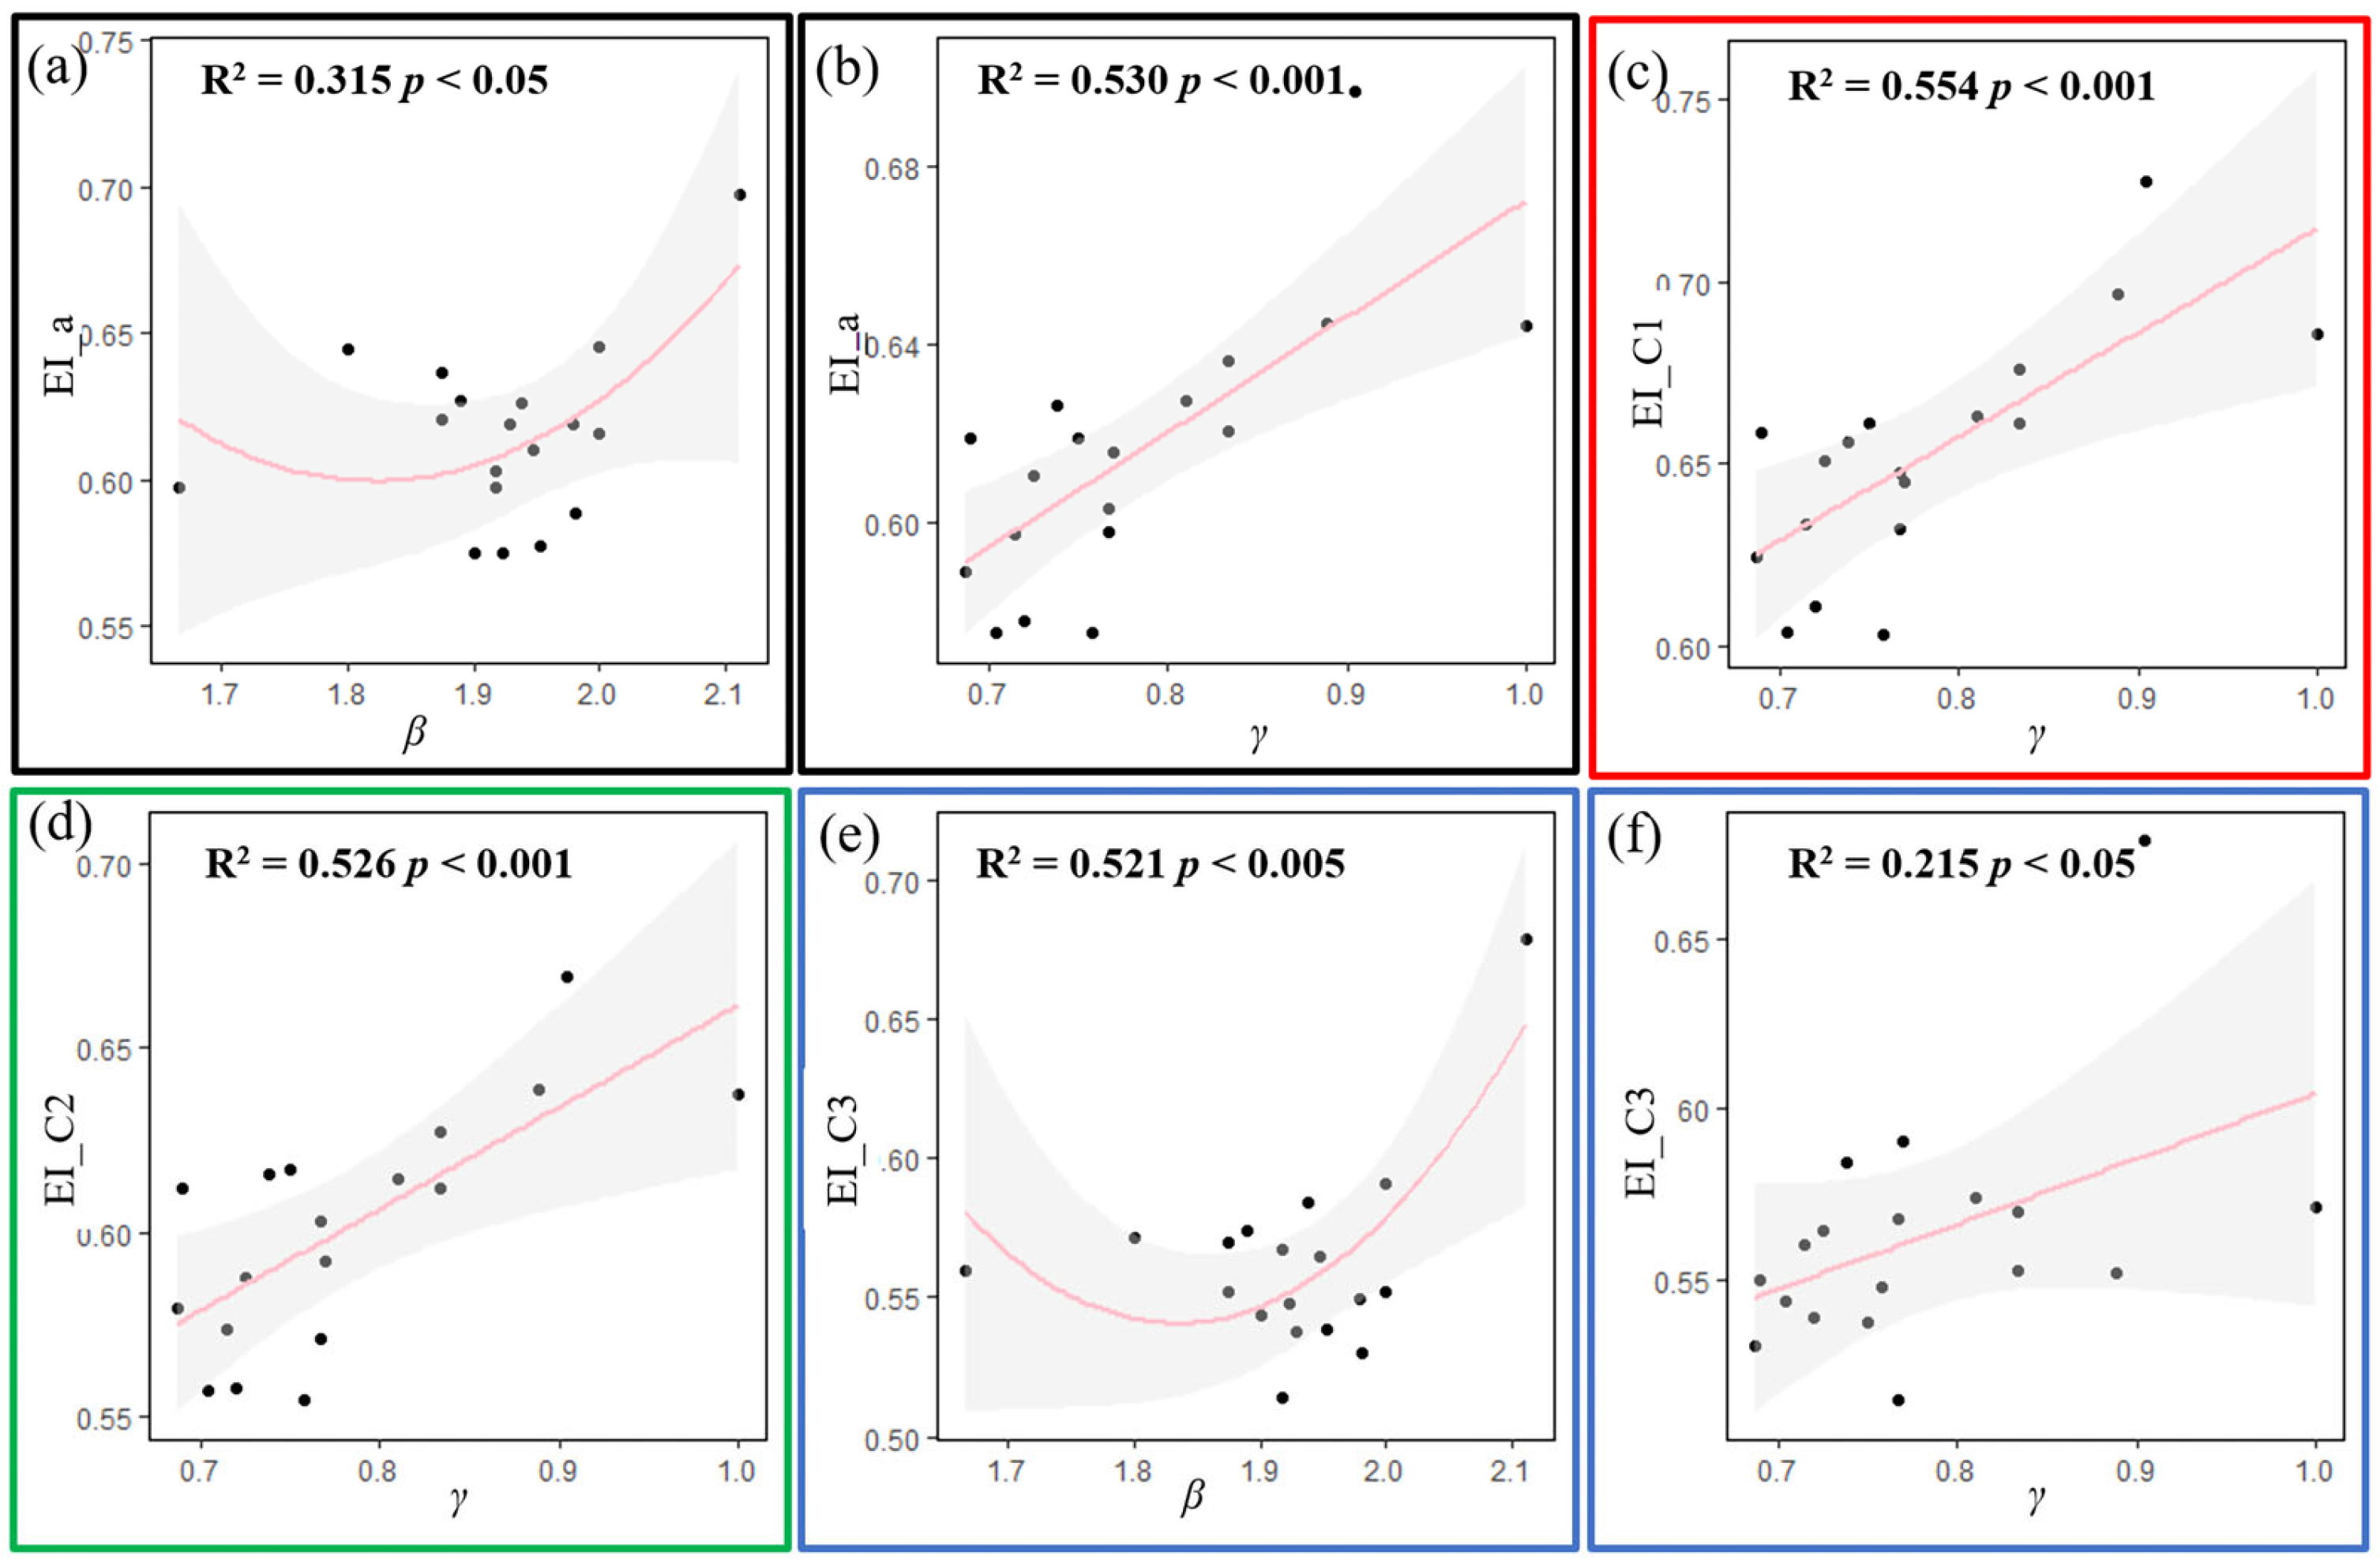
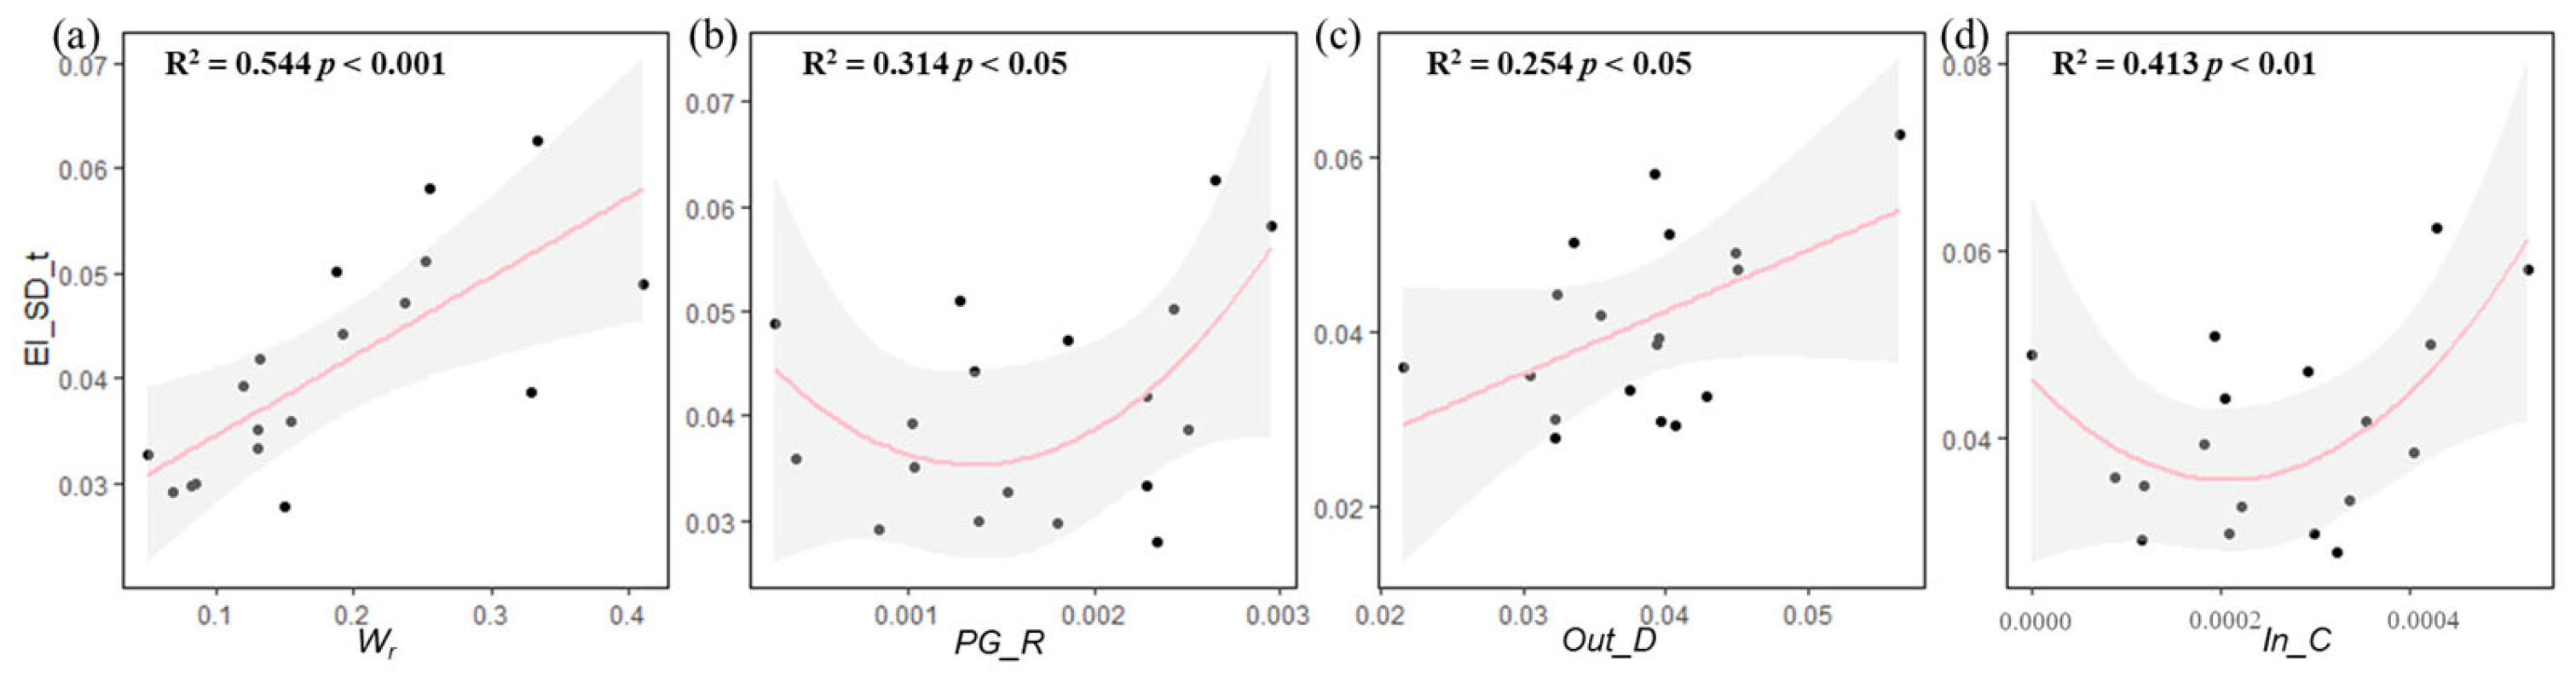
3.3. Impacts of RNC on Ecological Quality and Stability

The impacts of the RNC on ecological quality were examined through linear and second-order polynomial correlations. Generally, we observed a relatively high positive relationship between the river structure of γ and average subbasin RSEIs (RSEI_a, Figure 5b, R2 = 0.530, p < 0.001), as well as a U-shape relationship between β and RSEI_a (Figure 5a, R2 = 0.315, p < 0.05). Furthermore, when specific to different clusters, we found that the influences of RNC on the subbasin RSEIs varied across different clusters. The impacts of γ on subbasin RSEIs were most pronounced in Cluster 1 (EI_C1) with the highest R2 of 0.554 (Figure 5c), followed by Cluster 2 (EI_C2) (Figure 5d). However, we did not find significant relationships between the other RNC indices and EI_C1 and EI_C2. For Cluster 3, although the γ index showed less impact on EI_C3 (Figure 5f), we also found a significant U-shape relationship between β and EI_C3. The EI_C3 initially decreased with the increase of β, reaching a minimum when β was around 1.9, after which EI_C3 increased (Figure 5e).
We also examined the influence of RNC on ecosystem stability, as reflected by the standard deviation of temporal subbasin RSEIs (EI_SD_t). Wr displayed the highest influence on EI_SD_t, which can explain 54.4% of the variability of EI_SD_t. Moreover, our data suggest greater influences of node importance indices on ecosystem stability than on the levels of RSEIs (Figure 6). Node importance indices, including PG_R, Out_D, and In_C, were all significantly related to EI_SD_t. Out_D exhibited a significantly positive relationship with EI_SD_t (R2 = 0.254, p < 0.05), suggesting increased temporal ecosystem stability with higher outflow rivers (Figure 6c). PG_R and In_C showed U-shaped correlations with EI_SD_t (Figure 6b,d). Temporal ecosystem stability increased when PG_R was larger than 0.0015 or when In_C was larger than 0.0002.
Given the robust relationships observed between RNC indices and subbasin RSEI values and variability, we developed RNC-based models to predict the ecological quality and stability of the Dawen River Basin (Table 3). The index of γ emerged as the most influential indicator for EI_a (Figure 5b) and was also one of the indicators for the RNC-derived EI_a model. By combining γ and β, the model prediction explained 57.8% of the variability in subbasin RSEIs. Temporal stability could also be effectively simulated by RNC indicators. By incorporating In_C and Wr, the model explained 57.5% of the temporal ecological stability of the Basin. Additionally, we developed a separate RNC-based model for Cluster 3 due to the different indicator behaviors in this cluster. Based on the RNC indices of γ, β, Out_D, and PG_R, the model explained 57.7% of the variability.

4. Discussion

4.1. Temporal Variability of Ecological Quality

Although RSEI values did not exhibit significant upward or downward trends over time, the dataset could be divided into three clusters due to the distinctive differences in subbasin RSEI levels, likely associated with wet, near-normal, and dry years in the Dawen River Basin. Year 2003, 2009, 2011, and 2021 in Cluster 1 were considered wet years with above-average rainfall of more than 750 mm (the rainfall data was collected from http://www.shandong.gov.cn/col/col305195/, accessed on 21 April 2023). The years 2013, 2015, and 2017 in Cluster 2 were deemed near-normal years, with rainfall around 600 mm. Conversely, the years 2006 and 2019 in Cluster 3 were identified as dry years, with rainfall amounts of 574 mm and 543 mm across the entire basin, respectively, representing a 19.0% and 23.4% reduction compared to the annual average rainfall. Wet years enhance water availability in rivers, lakes, wetlands, and soil moisture. Adequate water supply is crucial for ecosystem functioning and sustainability, providing essential services that support life, biodiversity, and human well-being, especially in a region with a water shortage like Shandong Province [45,46]. This effect would be particularly significant in regions facing water scarcity, similar to this province [47]. Consequently, regions experiencing overall high ecological quality would be anticipated during wet years in the studied basin. Conversely, drought conditions not only directly lead to the loss of water, and river connectivity, but also result in deteriorating water quality, increased forest mortality, and changes in the intensity and configuration of interspecific interactions [48,49,50]. All of these factors can ultimately contribute to the deterioration of ecological quality.
As for the RSEI indices, drought conditions can significantly affect the components that measure greenness (NDVI), wetness (WET), dryness (NDBSI), and heat (LST) [15,51]. During drought years, reduced rainfall leads to lower soil moisture and water availability, adversely affecting vegetation health and coverage [50,52]. This decline in vegetation cover can be captured through remote sensing as a decrease in NDVI [52,53]. Moreover, drought conditions can elevate land surface temperatures and alter surface albedo, further influencing the indices of LST and WET values in RSEI values [54,55]. In 2006, the basin experienced significantly reduced rainfall levels, especially pronounced in the early part of August and deteriorating further post-September. The reduction in rainfall reached a critical point in September, with rainfall levels plummeting to approximately 76% below normal, as detailed in a report accessible at http://slyzx.sdwr.org.cn/lygl/201906/t20190606_2262952.html (accessed on 6 June 2019). This drastic decrease in rainfall severely impacted agricultural productivity and plant health within the basin [56]. The NDVI in 2006 was 28% lower than the basin’s average, while the LST in 2006 was 20% higher than the basin’s average, resulting in a high proportion of areas with low ecological quality. Similarly, a high agricultural drought disaster risk was reported in the basin in 2019 [57], which could have led to relatively low NDVI values and subsequent low RSEI scores indicative of stressed ecological conditions.
Although we tried to collect images within a narrow time frame, specifically from late August to early October, there was still one year with exceptionally high cloud cover during those months. Therefore, we had to extend our date range further back to July 2017. This broader date range could potentially impact the estimation of RSEI values, possibly causing relatively low NDVI values [58]. However, according to seasonal variation studies, RSEI values showed the least differences between summer and autumn compared to other seasons [59], which suggests that July could be an alternative choice for RSEI estimation. Meanwhile, the estimated RSEI values in 2017 fell within the range for the study period, further demonstrating their relative reliability. Nevertheless, we must acknowledge the potential for uncertainties raised by seasonal variations. Further studies with more advanced statistical corrections could help minimize the impact of seasonal variations on the analysis.

4.2. Effects of RNC on Spatial Patterns of Ecological Quality

Given the evidence of distinct variations in RSEI under different hydrological conditions, it is imperative to mitigate the impact of climate fluctuations on ecosystems. An effective strategy is to enhance our understanding and optimize the dynamics of water supply and hydrological connectivity, which can be achieved through the study of RNC [11,27]. In our study, RNC showed significant correlations with RESI, with the magnitude of this influence varying across wet, near-normal, and dry periods. The indicators of river structure revealed a stronger influence on spatial patterns of ecological quality, as evidenced by the significant correlations between β and γ and subbasin RSEI indicators when compared to the correlations between node importance and the subbasin RSEIs. The γ values signify the extent of connectivity among river chains within the network, serving as an indicator of the network’s complexity [60]. The increasing complexity of river networks plays a vital role in managing water resources by capturing and storing excess rainfall, thus reducing the risks associated with flooding and erosion while also supporting groundwater recharge and maintaining steady river flow [61,62,63]. Furthermore, the intricate network of channels and tributaries allows for uninterrupted water flow, facilitating the exchange of water, nutrients, and sediments across different landscapes [64]. Peng et al. observed a high and positive correlation between γ and water quality, suggesting that increased network complexity contributes to improved water quality [60]. This, in turn, can positively impact ecological quality, as healthier water systems provide better habitats for aquatic organisms and support overall ecosystem functioning. Thus, enhancing the complexity of river networks can have significant benefits for both water quality and ecological quality.
Furthermore, higher β values indicate a more developed river network with a greater number of rivers compared to nodes. Previous research has suggested that increased β values generally favor better ecological quality [28,63,64,65]. However, our study revealed that the relationship between β values and ecological quality levels were more significant during dry years. This finding is logical because, during dry years, lower water levels may limit ecological health, and thus, increased river inflows and outflows could help by providing additional water supply to meet the basic requirements of the ecosystem [66]. However, the relationship was not linear. When the β value was around 1.8, the ecological quality reached a minimum. This U-shaped relationship between β and EI_C3 may further complicate the impacts of river structure on ecosystems, suggesting the need for a more nuanced understanding of these relationships.

4.3. Effects of RNC on Temporal Variability of Ecological Quality

The river structure of Wr did not directly determine the spatial patterns of subbasin RSEIs over the basin, but it plays a significant role in affecting the temporal variability of subbasin RSEIs. Wr serves as an important indicator that governs the regulatory and storage functions within river networks [67,68,69]. It can exert a considerable influence on vegetation growth [70], as evidenced by the strong correlations between Wr and the variability of NDVI in this study (R2 = 0.666). This relationship has also been corroborated by previous studies, such as Aguilar et al., who highlighted the pronounced sensitivity of vegetation distribution to water surface levels [71]. Their findings revealed a close linkage between increasing NDVI statistics and rising water table levels, with R2 around 0.75.
Furthermore, we observed that the impacts of node importance indicators were more pronounced on the temporal variability of subbasin RSEIs than on the spatial patterns of subbasin RSEIs. Indices such as PG_R, Out_D, and In_C were either linearly or polynomially related to RSEI_SD. One plausible explanation for the relationships is the nodes with high PG_R, Out_D, and In_C play critical roles in facilitating water flow [72]. The Dawen River Basin experiences high variability in rainfall amounts across seasons, with high levels in summer and lower levels in other seasons. Nodes exhibiting higher values of PG_R, Out_D, and In_C are characterized by a greater number of rivers and a higher proportion of river outflows [73]. These types of nodes demonstrate an enhanced capacity to supply water to surrounding areas, ensuring a continuous water supply to and impact the basin [74]. Therefore, subbasins with a higher proportion of these nodes are expected to exhibit more stable responses to climate variability or other disturbances in terms of ecological quality.

4.4. Implications of RNC Application on Basin Management

From 2003 to 2021, the RSEI_a values in the Dawen River Basin remained within the range of 0.55 to 0.67, indicating ecological conditions ranging from fair to good. This range suggests a generally acceptable level of ecological protection within the basin throughout the observed period. Situated in northern China, the Dawen River Basin holds significant importance as a part of the Lower Yellow River Basin. However, the landscape of the basin has undergone substantial transformations due to both natural phenomena and human activities in recent decades. Recognizing these alterations, several ecological restoration programs, including wastewater treatment, agricultural land, and forest restoration, have been implemented and have shown some effectiveness since 2017 [32]. Furthermore, ongoing efforts, such as wetland restoration, continue to address ecosystem rehabilitation needs. These restoration programs may induce changes in the river network structure, which may further influence ecological quality in the long run. Therefore, it is necessary to consider the importance of river structures and connected nodes in evaluating the effectiveness of ecological restoration efforts.
By utilizing an RNC-based model, we can forecast the long-term average ecosystem quality and evaluate the effectiveness of restoration initiatives following modifications to the river structure. Basin managers and policymakers must adopt strategies that prioritize ecological resilience while considering the potential risks associated with increased complexity in river networks. First, our model can predict the long-term subbasin RSEI values using RNC parameters, such as γ, and identify critical subbasins influenced by drought conditions using RNC parameters, including γ, β, Out_D, and PG_R. This predictive approach empowers decision-makers to allocate resources and implement targeted interventions where they are most needed. Second, our analysis underscores the importance of nodes within river networks, as they closely correlate with the temporal variability of RSEIs. Nodes with a greater number of outgoing rivers may experience more pronounced effects from changes in ecological quality. Therefore, these nodes may require special attention, particularly during extreme hydrological conditions, such as periods of severe drought or heavy rainfall. For these nodes, additional water supply may be necessary to maintain ecological quality during dry years, while measures to prevent excessive flow may be essential to mitigate flood risks during wet periods in nodes characterized by high PG_R, Out_D, and In_C values.

5. Conclusions

This study provides a comprehensive analysis of how river network connectivity characteristics impact the spatial and temporal patterns of ecological quality RSEIs on the subbasin scale. Our results revealed that the subbasin RSEIs from 2003 to 2021 could be discernibly divided into three clusters, more likely grouped according to annual rainfall amounts. Higher average RSEIs were observed in wet years, and lower averages were found in dry years. River structures, such as edge-node ratio β and connectivity γ, exerted significant influences on the spatial patterns of RSEIs at the subbasin scale. Interestingly, the γ showed higher correlations with EI_C1 during wet periods, possibly due to its association with river complexity. Higher γ values indicate increased complexity, which can mitigate flooding risks and enhance water exchange, thus improving ecological quality. Conversely, the β exhibited stronger correlations with RSEI during dry periods, indicating the increased importance of water supply to surrounding areas for ecological sustainability under drought conditions. Although node importance indices and water surface ratio Wr demonstrated insignificant correlations with subbasin RSEI values, they notably influenced RSEI variability over time, as denoted by EI_SD_t. Specifically, EI_SD_t increased with Wr and Out_D. We also found a U-shaped correlation between PG_R and In_C and temporal variability of RSEIs, indicating that both extremely high and low values of PG_R and In_C were associated with significant fluctuations in RSEIs over time.
This study highlights that RNC not only affects the ecological condition of a basin but also impacts its temporal variability, emphasizing the importance of complex river structures and key nodes. Regional RNC-based RSEI and EI_SD_t models were developed, facilitated the evaluation of RSEI levels over different subbasins, and identifyied those with significant variations. This study can significantly enhance the efficiency of regional ecological management by providing insights into the dynamics of ecological quality under varying hydrological conditions and the role of river network connectivity in shaping these dynamics.

Author Contributions

Conceptualization, B.C., Z.R. and G.W.M.; methodology, B.C., X.L. and L.X.; validation, X.L. and L.X.; formal analysis, C.Z., L.X. and X.L.; data curation, C.Z. and X.M.; writing—original draft preparation, X.L.; writing—review and editing, X.L., B.C., Q.W., Z.R. and G.W.M.; visualization, X.L. and X.M.; supervision, X.L. and B.C.; project administration, X.L. and B.C. All authors have read and agreed to the published version of the manuscript.

Funding

This research was funded by the Key Technology Research and Development Program of Shandong Province (2021CXGC011201), the Key Project of National Natural Science Foundation of China (42330705, U2243208, U1901212), the National Natural Science Foundation of China (42206170), the National Key Technologies Research and Development Program (2021YFC3101701), and the GuangDong Basic and Applied Basic Research Foundation (2021A1515110830).

Data Availability Statement

Data will be available on request.

Conflicts of Interest

The authors declare no conflicts of interest.

References

  1. Harvey, J.W.; Gooseff, M.N. River Corridor Science: Hydrologic Exchange and Ecological Consequences from Bedforms to Basins. Water Resour. Res. 2015, 51, 6893–6922. [Google Scholar] [CrossRef]
  2. Wohl, E.; Lane, S.N.; Wilcox, A.C. The Science and Practice of River Restoration. Water Resour. Res. 2015, 51, 5974–5997. [Google Scholar] [CrossRef]
  3. Lee, S.; McCarty, G.W.; Moglen, G.E.; Li, X.; Wallace, C.W. Assessing the Effectiveness of Riparian Buffers for Reducing Organic Nitrogen Loads in the Coastal Plain of the Chesapeake Bay Watershed Using a Watershed Model. J. Hydrol. 2020, 585, 124779. [Google Scholar] [CrossRef]
  4. Steel, E.A.; Hughes, R.M.; Fullerton, A.H.; Schmutz, S.; Young, J.A.; Fukushima, M.; Muhar, S.; Poppe, M.; Feist, B.E.; Trautwein, C. Are We Meeting the Challenges of Landscape-Scale Riverine Research? A Review. Living Rev. Landsc. Res. 2010, 4, 1–60. [Google Scholar] [CrossRef]
  5. Stephens, C.M.; Lall, U.; Johnson, F.M.; Marshall, L.A. Landscape Changes and Their Hydrologic Effects: Interactions and Feedbacks across Scales. Earth-Sci. Rev. 2021, 212, 103466. [Google Scholar] [CrossRef]
  6. Li, X.; Cai, Y.; Liu, Z.; Mo, X.; Zhang, L.; Zhang, C.; Cui, B.; Ren, Z. Impacts of River Discharge, Coastal Geomorphology, and Regional Sea Level Rise on Tidal Dynamics in Pearl River Estuary. Front. Mar. Sci. 2023, 10, 1065100. [Google Scholar] [CrossRef]
  7. Shao, X.; Fang, Y.; Cui, B. A Model to Evaluate Spatiotemporal Variations of Hydrological Connectivity on a Basin-Scale Complex River Network with Intensive Human Activity. Sci. Total Environ. 2020, 723, 138051. [Google Scholar] [CrossRef] [PubMed]
  8. Liu, C.; Chen, Y.; Fang, G.; Zhou, H.; Huang, W.; Liu, Y.; Wang, X.; Li, Z. Hydrological Connectivity Improves the Water-Related Environment in a Typical Arid Inland River Basin in Xinjiang, China. Remote. Sens. 2022, 14, 4977. [Google Scholar] [CrossRef]
  9. Summers, J.K. Ecological Condition of the Estuaries of the Atlantic and Gulf Coasts of the United States. Environ. Toxicol. Chem. 2001, 20, 99–106. [Google Scholar] [CrossRef] [PubMed]
  10. Cornell, H.V. Unsaturation and Regional Influences on Species Richness in Ecological Communities: A Review of the Evidence. Ecoscience 1999, 6, 303–315. [Google Scholar] [CrossRef]
  11. Cui, B.; Li, X.; Zhang, K. Classification of Hydrological Conditions to Assess Water Allocation Schemes for Lake Baiyangdian in North China. J. Hydrol. 2010, 385, 247–256. [Google Scholar] [CrossRef]
  12. Li, X.; Cui, B.; Yang, Q.; Lan, Y. Impacts of Water Level Fluctuations on Detritus Accumulation in Lake Baiyangdian, China. Ecohydrology 2016, 9, 52–67. [Google Scholar] [CrossRef]
  13. Yang, Q.; Almendinger, J.E.; Zhang, X.; Huang, M.; Chen, X.; Leng, G.; Zhou, Y.; Zhao, K.; Asrar, G.R.; Srinivasan, R.; et al. Enhancing SWAT Simulation of Forest Ecosystems for Water Resource Assessment: A Case Study in the St. Croix River Basin. Ecol. Eng. 2018, 120, 422–431. [Google Scholar] [CrossRef]
  14. Xu, C.; Li, B.; Kong, F.; He, T. Spatial-Temporal Variation, Driving Mechanism and Management Zoning of Ecological Resilience Based on RSEI in a Coastal Metropolitan Area. Ecol. Indic. 2024, 158, 111447. [Google Scholar] [CrossRef]
  15. Peng, L.; Wu, H.; Li, Z. Spatial–Temporal Evolutions of Ecological Environment Quality and Ecological Resilience Pattern in the Middle and Lower Reaches of the Yangtze River Economic Belt. Remote. Sens. 2023, 15, 430. [Google Scholar] [CrossRef]
  16. Li, J.; Pei, Y.; Zhao, S.; Xiao, R.; Sang, X.; Zhang, C. A Review of Remote Sensing for Environmental Monitoring in China. Remote. Sens. 2020, 12, 1130. [Google Scholar] [CrossRef]
  17. Xu, H.Q. A Remote Sensing Urban Ecological Index and Its Application. Acta Ecol. Sin. 2013, 33, 7853–7862. [Google Scholar]
  18. Lu, J.; Guan, H.; Yang, Z.; Deng, L. Dynamic Monitoring of Spatial-Temporal Changes in Eco-Environment Quality in Beijing Based on Remote Sensing Ecological Index with Google Earth Engine. Sens. Mater. 2021, 33, 4595–4606. [Google Scholar] [CrossRef]
  19. Ji, J.; Wang, S.; Zhou, Y.; Liu, W.; Wang, L. Studying the Eco-Environmental Quality Variations of Jing-Jin-Ji Urban Agglomeration and Its Driving Factors in Different Ecosystem Service Regions from 2001 to 2015. IEEE Access 2020, 8, 154940–154952. [Google Scholar] [CrossRef]
  20. Hu, X.; Xu, H. A New Remote Sensing Index for Assessing the Spatial Heterogeneity in Urban Ecological Quality: A Case from Fuzhou City, China. Ecol. Indic. 2018, 89, 11–21. [Google Scholar] [CrossRef]
  21. Zheng, Z.; Wu, Z.; Chen, Y.; Yang, Z.; Marinello, F. Exploration of Eco-Environment and Urbanization Changes in Coastal Zones: A Case Study in China over the Past 20 Years. Ecol. Indic. 2020, 119, 106847. [Google Scholar] [CrossRef]
  22. Porporato, A.; D’Odorico, P.; Laio, F.; Ridolfi, L.; Rodriguez-Iturbe, I. Ecohydrology of Water-Controlled Ecosystems. Adv. Water Resour. 2002, 25, 1335–1348. [Google Scholar] [CrossRef]
  23. Hannah, D.M.; Wood, P.J.; Sadler, J.P. Ecohydrology and Hydroecology: A “New Paradigm”? Hydrol. Process. 2004, 18, 3439–3445. [Google Scholar] [CrossRef]
  24. Elosegi, A.; Sabater, S. Effects of Hydromorphological Impacts on River Ecosystem Functioning: A Review and Suggestions for Assessing Ecological Impacts. Hydrobiologia 2013, 712, 129–143. [Google Scholar] [CrossRef]
  25. Rodriguez-Iturbe, I. Ecohydrology: A Hydrologic Perspective of Climate-Soil-Vegetation Dynamics. Water Resour. Res. 2000, 36, 3–9. [Google Scholar] [CrossRef]
  26. Ahn, S.R.; Kim, S.J. Assessment of Integrated Watershed Health Based on the Natural Environment, Hydrology, Water Quality, and Aquatic Ecology. Hydrol. Earth Syst. Sci. 2017, 21, 5583–5602. [Google Scholar] [CrossRef]
  27. Zhao, Y.; Wei, Y.; Wu, B.; Lu, Z.; Fu, L. A Connectivity-Based Assessment Framework for River Basin Ecosystem Service Management. Curr. Opin. Environ. Sustain. 2018, 33, 34–41. [Google Scholar] [CrossRef]
  28. Zhang, X.; Li, F.; Yong, Z. Impact of Changes in River Network Structure on Hydrological Connectivity of Watersheds. Ecol. Indic. 2023, 146, 109848. [Google Scholar] [CrossRef]
  29. Amoros, C.; Bornette, G. Connectivity and Biocomplexity in Waterbodies of Riverine Floodplains. Freshw. Biol. 2002, 47, 761–776. [Google Scholar] [CrossRef]
  30. Xie, C.; Cui, B.; Xie, T.; Yu, S.; Liu, Z.; Chen, C.; Ning, Z.; Wang, Q.; Zou, Y.; Shao, X. Hydrological Connectivity Dynamics of Tidal Flat Systems Impacted by Severe Reclamation in the Yellow River Delta. Sci. Total Environ. 2020, 739, 139860. [Google Scholar] [CrossRef] [PubMed]
  31. Mitchell, M.G.E.; Bennett, E.M.; Gonzalez, A. Linking Landscape Connectivity and Ecosystem Service Provision: Current Knowledge and Research Gaps. Ecosystems 2013, 16, 894–908. [Google Scholar] [CrossRef]
  32. Li, K.; Hou, Y.; Fu, Q.; Randall, M.T.; Andersen, P.S.; Qiu, M.; Skov-Petersen, H. Integrating Decision-Making Preferences into Ecosystem Service Conservation Area Identification: A Case Study of Water-Related Ecosystem Services in the Dawen River Watershed, China. J. Environ. Manag. 2023, 340, 117972. [Google Scholar] [CrossRef] [PubMed]
  33. Li, Y.; Zhao, L.; Zhang, Z.; Li, J.; Hou, L.; Liu, J.; Wang, Y. Research on the Hydrological Variation Law of the Dawen River, a Tributary of the Lower Yellow River. Agronomy 2022, 12, 1719. [Google Scholar] [CrossRef]
  34. Yao, T.; Zhao, Q.; Li, X.Y.; Shen, Z.T.; Ran, P.Y.; Wu, W. Spatiotemporal Variations of Multi-Scale Drought in Shandong Province from 1961 to 2017. Water Sci. Technol. Water Supply 2021, 21, 525–541. [Google Scholar] [CrossRef]
  35. Wang, J.; Bao, Z.; Elmahdi, A.; Zhang, J.; Wang, G.; Liu, C.; Wu, H. Enhancing Land Cover Mapping in Mixed Vegetation Regions Using Remote-Sensing Evapotranspiration. IEEE Trans. Geosci. Remote. Sens. 2024, 62, 4407322. [Google Scholar] [CrossRef]
  36. Xiong, Y.; Xu, W.; Lu, N.; Huang, S.; Wu, C.; Wang, L.; Dai, F.; Kou, W. Assessment of Spatial–Temporal Changes of Ecological Environment Quality Based on RSEI and GEE: A Case Study in Erhai Lake Basin, Yunnan Province, China. Ecol. Indic. 2021, 125, 107518. [Google Scholar] [CrossRef]
  37. Liu, Y.; Meng, Q.; Zhang, L.; Wu, C. NDBSI: A Normalized Difference Bare Soil Index for Remote Sensing to Improve Bare Soil Mapping Accuracy in Urban and Rural Areas. Catena 2022, 214, 106265. [Google Scholar] [CrossRef]
  38. Qin, Z.; Karnieli, A.; Berliner, P. A Mono-Window Algorithm for Retrieving Land Surface Temperature from Landsat TM Data and Its Application to the Israel-Egypt Border Region. Int. J. Remote. Sens. 2001, 22, 3719–3746. [Google Scholar] [CrossRef]
  39. Strahler, A.N. Quantitative Analysis of Watershed Geomorphology. Eos Trans. Am. Geophys. Union 1957, 38, 913–920. [Google Scholar]
  40. Hamid, A.; Bhat, S.A.; Bhat, S.U.; Jehangir, A. Environmetric Techniques in Water Quality Assessment and Monitoring: A Case Study. Environ. Earth Sci. 2016, 75, 321. [Google Scholar] [CrossRef]
  41. Daoud, J.I. Multicollinearity and Regression Analysis. J. Phys. Conf. Ser. 2018, 949, 012009. [Google Scholar] [CrossRef]
  42. Shrestha, N. Detecting Multicollinearity in Regression Analysis. Am. J. Appl. Math. Stat. 2020, 8, 39–42. [Google Scholar] [CrossRef]
  43. Moriasi, D.N.; Arnold, J.G.; Van Liew, M.W.; Binger, R.L.; Harmel, R.D.; Veith, T.L. Model Evaluation Guidelines for Systematic Quantification of Accuracy in Watershed Simulations. Trans. ASABE 2007, 50, 885–900. [Google Scholar] [CrossRef]
  44. Li, X.; McCarty, G.W.; Karlen, D.L.; Cambardella, C.A. Topographic Metric Predictions of Soil Redistribution and Organic Carbon in Iowa Cropland Fields. Catena 2018, 160, 222–232. [Google Scholar] [CrossRef]
  45. Wu, P.; Tan, M. Challenges for Sustainable Urbanization: A Case Study of Water Shortage and Water Environment Changes in Shandong, China. Procedia Environ. Sci. 2012, 13, 919–927. [Google Scholar] [CrossRef]
  46. Hao, L.; Sun, G.; Liu, Y.; Gao, Z.; He, J.; Shi, T.; Wu, B. Effects of Precipitation on Grassland Ecosystem Restoration under Grazing Exclusion in Inner Mongolia, China. Landsc. Ecol. 2014, 29, 1657–1673. [Google Scholar] [CrossRef]
  47. Gong, Z.; Zhao, S.; Gu, J. Correlation Analysis between Vegetation Coverage and Climate Drought Conditions in North China during 2001–2013. J. Geogr. Sci. 2017, 27, 143–160. [Google Scholar] [CrossRef]
  48. Mosley, L.M. Drought Impacts on the Water Quality of Freshwater Systems; Review and Integration. Earth-Sci. Rev. 2015, 140, 203–214. [Google Scholar] [CrossRef]
  49. Lake, P.S. Ecological Effects of Perturbation by Drought in Flowing Waters. Freshw. Biol. 2003, 48, 1161–1172. [Google Scholar] [CrossRef]
  50. Senf, C.; Buras, A.; Zang, C.S.; Rammig, A.; Seidl, R. Excess Forest Mortality Is Consistently Linked to Drought across Europe. Nat. Commun. 2020, 11, 6200. [Google Scholar] [CrossRef]
  51. Luo, M.; Zhang, S.; Huang, L.; Liu, Z.; Yang, L.; Li, R.; Lin, X. Temporal and Spatial Changes of Ecological Environment Quality Based on RSEI: A Case Study in Ulan Mulun River Basin, China. Sustainability 2022, 14, 13232. [Google Scholar] [CrossRef]
  52. Wang, H.; Li, Z.; Cao, L.; Feng, R.; Pan, Y. Response of NDVI of Natural Vegetation to Climate Changes and Drought in China. Land 2021, 10, 966. [Google Scholar] [CrossRef]
  53. Ding, Y.; He, X.; Zhou, Z.; Hu, J.; Cai, H.; Wang, X.; Li, L.; Xu, J.; Shi, H. Response of Vegetation to Drought and Yield Monitoring Based on NDVI and SIF. Catena 2022, 219, 106328. [Google Scholar] [CrossRef]
  54. Caioni, C.; Silvério, D.V.; Macedo, M.N.; Coe, M.T.; Brando, P.M. Droughts Amplify Differences between the Energy Balance Components of Amazon Forests and Croplands. Remote. Sens. 2020, 12, 525. [Google Scholar] [CrossRef]
  55. Yin, D.; Roderick, M.L.; Leech, G.; Sun, F.; Huang, Y. The Contribution of Reduction in Evaporative Cooling to Higher Surface Air Temperatures during Drought. Geophys. Res. Lett. 2014, 41, 7891–7897. [Google Scholar] [CrossRef]
  56. Niu, B.; Li, X.; Li, F.; Wang, Y.; Hu, X. Vegetation Dynamics and Its Linkage with Climatic and Anthropogenic Factors in the Dawen River Watershed of China from 1999 through 2018. Environ. Sci. Pollut. Res. 2021, 28, 52887–52900. [Google Scholar] [CrossRef] [PubMed]
  57. Yang, W.; Zhang, L.; Liang, C. Agricultural Drought Disaster Risk Assessment in Shandong Province, China. Nat. Hazards 2023, 118, 1515–1534. [Google Scholar] [CrossRef]
  58. Zhang, J.; Zhang, P.; Deng, X.; Ren, C.; Deng, M.; Wang, S.; Lai, X.; Long, A. Study on the Spatial and Temporal Trends of Ecological Environment Quality and Influencing Factors in Xinjiang Oasis. Remote. Sens. 2024, 16, 1980. [Google Scholar] [CrossRef]
  59. Huang, S.; Li, Y.; Hu, H.; Xue, P.; Wang, J. Assessment of Optimal Seasonal Selection for RSEI Construction: A Case Study of Ecological Environment Quality Assessment in the Beijing-Tianjin-Hebei Region from 2001 to 2020. Geocarto Int. 2024, 39, 2311224. [Google Scholar] [CrossRef]
  60. Peng, S.; Wu, P.; Lu, Y.; Chen, L.; Wang, Z.; Lu, Y. Influence of River Structure and Hydrodynamics on Water Quality in the Upper Taihu Basin, China. J. Clean. Prod. 2024, 453, 142262. [Google Scholar] [CrossRef]
  61. Cui, Y.; Xiao, R.; Zhang, M.; Wang, C.; Ma, Z.; Xiu, Y.; Wang, Q.; Guo, Y. Hydrological Connectivity Dynamics and Conservation Priorities for Surface-Water Patches in the Yellow River Delta National Nature Reserve, China. Ecohydrol. Hydrobiol. 2020, 20, 525–536. [Google Scholar] [CrossRef]
  62. Huang, S.L.; Lee, Y.C.; Budd, W.W.; Yang, M.C. Analysis of Changes in Farm Pond Network Connectivity in the Peri-Urban Landscape of the Taoyuan Area, Taiwan. Environ. Manag. 2011, 49, 915–928. [Google Scholar] [CrossRef] [PubMed]
  63. Zeng, B.; Li, Y.; Yao, J.; Tan, Z. The Characteristics and Evolution of Structural and Functional Connectivity in a Large Catchment (Poyang Lake) during the Past 30 Years. Remote. Sens. 2023, 15, 3335. [Google Scholar] [CrossRef]
  64. Yu, Z.; Wang, Q.; Xu, Y.; Lu, M.; Lin, Z.; Gao, B. Dynamic Impacts of Changes in River Structure and Connectivity on Water Quality under Urbanization in the Yangtze River Delta Plain. Ecol. Indic. 2022, 135, 108582. [Google Scholar] [CrossRef]
  65. Deng, X.; Xu, Y.; Han, L. Impacts of Human Activities on the Structural and Functional Connectivity of a River Network in the Taihu Plain. L. Degrad. Dev. 2018, 29, 2575–2588. [Google Scholar] [CrossRef]
  66. Bond, N.R.; Lake, P.S.; Arthington, A.H. The Impacts of Drought on Freshwater Ecosystems: An Australian Perspective. Hydrobiologia 2008, 600, 3–16. [Google Scholar] [CrossRef]
  67. Deng, X.; Xu, Y.; Han, L.; Yang, M.; Yang, L.; Song, S.; Li, G.; Wang, Y. Spatial-Temporal Evolution of the Distribution Pattern of River Systems in the Plain River Network Region of the Taihu Basin, China. Quat. Int. 2016, 392, 178–186. [Google Scholar] [CrossRef]
  68. Parsons, M.; Thoms, M.C. Patterns of Vegetation Greenness during Flood, Rain and Dry Resource States in a Large, Unconfined Floodplain Landscape. J. Arid Environ. 2013, 88, 24–38. [Google Scholar] [CrossRef]
  69. Sims, N.C.; Colloff, M.J. Remote Sensing of Vegetation Responses to Flooding of a Semi-Arid Floodplain: Implications for Monitoring Ecological Effects of Environmental Flows. Ecol. Indic. 2012, 18, 387–391. [Google Scholar] [CrossRef]
  70. Chandrasekar, K.; Sesha Sai, M.V.R.; Roy, P.S.; Dwevedi, R.S. Land Surface Water Index (LSWI) Response to Rainfall and NDVI Using the MODIS Vegetation Index Product. Int. J. Remote. Sens. 2010, 31, 3987–4005. [Google Scholar] [CrossRef]
  71. Aguilar, C.; Zinnert, J.C.; Polo, M.J.; Young, D.R. NDVI as an Indicator for Changes in Water Availability to Woody Vegetation. Ecol. Indic. 2012, 23, 290–300. [Google Scholar] [CrossRef]
  72. Lee, F.; Simon, K.S.; Perry, G.L.W. River Networks: An Analysis of Simulating Algorithms and Graph Metrics Used to Quantify Topology. Methods Ecol. Evol. 2022, 13, 1374–1387. [Google Scholar] [CrossRef]
  73. Joo, H.; Kim, H.S.; Kim, S.; Sivakumar, B. Complex Networks and Integrated Centrality Measure to Assess the Importance of Streamflow Stations in a River Basin. J. Hydrol. 2021, 598, 126280. [Google Scholar] [CrossRef]
  74. Liu, H.; Niu, T.; Yu, Q.; Yang, L.; Ma, J.; Qiu, S.; Wang, R.; Liu, W.; Li, J. Spatial and Temporal Variations in the Relationship between the Topological Structure of Eco-Spatial Network and Biodiversity Maintenance Function in China. Ecol. Indic. 2022, 139, 108919. [Google Scholar] [CrossRef]
Figure 1. Location of Dawen River Basin and stream orders of the Dawen River. (a) shows the location of the Dawen River Basin in China; (b) presents the elevation of the basin along with the stream orders (the numbers in the subbasins are their IDs); (c) depicts the land use/land cover of the basin in 2020 (LULC2020). Note: Agr. is agricultural land; For. is forest land; Gra. is Grassland; OpW. is open water; ImpL. is impervious land; and Bar. is bare land.
Remotesensing 16 02370 g001
Figure 2. Temporal variations of Remote Sensing Ecological Indices (RSEIs) of subbasins from 2003 to 2021 in the Dawen River Watershed. The gray dots are subbasin RSEI values.
Remotesensing 16 02370 g002
Figure 3. Spatial variations of Remote Sensing Ecological Indices (RSEIs) across the Dawen River Watershed, with panel (j) presenting a cluster analysis grounded in the subbasin mean RSEI database. Panels (ai) are the watershed’s RSEIs from 2003 to 2021. Images within the red border in panels (a) through (i) are associated with Cluster 1, those within the green border correspond to Cluster 2, and those within the blue border correspond to Cluster 3.
Remotesensing 16 02370 g003
Figure 4. Spatial variations of river structure and node importance. Panels (ad) are spatial variations of river structure indices and Panels (eh) are spatial variations of node importance indices. Note: Dr is the River density; Wr is the Water surface ratio; β is the Edge-node ratio; γ is the Network connectivity; BC is the Betweenness centrality; PG_R is the Pagerank; Out_D is the out_degree centrality; In_C is the in_closeness centrality.
Remotesensing 16 02370 g004
Figure 5. Impacts of RNC (β: Edge-node ratio; γ: Network connectivity) on average RSEIs (EI_a) and RSEI clusters (EI_C1, EI_C2, and EI_C3) in Dawen River Basin. Images within the black border in panels (a,b) are associated with mean RSCI, the one within the red border in panel (c) correspond to Cluster 1, the one within the green border in panels (d) correspond to Cluster 2, and those within the blue border in panels (e,f) correspond to Cluster 3. In this figure, we only present the index with statistically significant correlations.
Remotesensing 16 02370 g005
Figure 6. The relationships between the standard deviations of temporal RSEIs (EI_SD_t) with (a) Wr, Water surface ratio, (b) PG_R, Pagerank, (c) Out_D, out_degree centrality, and (d) In_C, in_closeness centrality) in Dawen River Basin. In this figure, we only present the index with statistically significant correlations.
Remotesensing 16 02370 g006
Table 1. The basic information for the collected images.
TimeTypeCould Cover
15 September 2003Landsat 51.00%
23 September 2006Landsat 54.00%
30 August 2009Landsat 51.00%
21 September 2011Landsat 50.00%
26 September 2013Landsat 80.44%
2 October 2015Landsat 80.22%
3 July 2017Landsat 83.53%
27 September 2019Landsat 81.13%
16 September 2021Landsat 82.64%
Table 2. Formulas and identification of the indicators of river network connectivity.
CharacteristicsIndicatorsFormulasIdentification
River structureRiver density (Dr) km/km2 D r = L A The total length of all the streams and rivers in a drainage basin divided by the total area of the drainage basin.
Water surface ratio (Wr) W r = A w A The proportion of the total area covered by water bodies, such as rivers, lakes, reservoirs, and wetlands, within a defined geographic area.
Edge-node ratio (β) β = t k The ratio of edges (connections or links) to nodes (points) in a network.
Network connectivity (γ) γ = t 3 k 2 The ratio of the actual number of edges (or river segments) in to the maximum possible number of edges between nodes in a fully connected network.
Node importanceBetweenness centrality (BC) B C ( i ) = s , t i   n s t i N s t It measures how often each graph node appears on a shortest path between the two nodes in the graph.
Pagerank (PG_R) P G _ R = 1 d N + d A d O u t _ D + s N At each node in the graph, the next node is chosen with probability ‘Follow Probability’ from the set of successors of the current node.
Outdegree centrality (Out_D) The fraction of nodes its outgoing edges are connected to.
In_closeness centrality (In_C) I n _ C ( i ) = n i N 1 2 1 C i The inverse sum of the distance from a node to all other nodes in the graph.
Note: L is the total river length, km; A is the area of the study region, km2; t is the number of river reaches; Aw is the total area of the rivers and lakes under the mean water level and was derived from the land use type of openwater in land use/land cover of map, km2; k is the number of nodes; ni is the number of reachable nodes from node i (not counting i); Ci is the sum of distances from node i to all reachable nodes; nst(i) is the number of shortest paths from s to t that pass through node i, and Nst is that the total number of shortest paths from s to t; d is the damping factor, typically set to 0.85; A’ is the transpose of the adjacency matrix of the network; s is the scalar sum of the PageRank scores for pages with no links.
Table 3. River Network Connectivity (RNC)-based ecological models for Dawen River Basin.
RNC-Based Ecological Model R a d j 2 NSERSE
E I _ a = 0.207 + 0.107 × β + 0.259 × γ 0.5780.6360.604
E I _ S D _ t = 0.0221 + 21.467 × I n _ C + 0.0713 × W r 0.5750.6250.613
E I _ C 3 = 0.0966 + 0.321 × γ + 0.278 × β 2.578 × O u t _ D 16.967 × P G _ R 0.5770.6760.569
Note: β is the Edge-node ratio; γ is the Network connectivity; In_C is the in_closeness centrality; Wr is the Water surface ratio; Out_D is the outdegree centrality; PG_R is the Pagerank.
Disclaimer/Publisher’s Note: The statements, opinions and data contained in all publications are solely those of the individual author(s) and contributor(s) and not of MDPI and/or the editor(s). MDPI and/or the editor(s) disclaim responsibility for any injury to people or property resulting from any ideas, methods, instructions or products referred to in the content.

