Article

Impact of Fragmentation on Carbon Uptake in Subtropical Forest Landscapes in Zhejiang Province, China

by
Jiejie Jiao
1,2,
Yan Cheng
3,
Pinghua Hong
4,
Jun Ma
5,
Liangjin Yao
2,
Bo Jiang
2,
Xia Xu
1 and
Chuping Wu
2,*
1
State Key Laboratory of Subtropical Silviculture, School of Environmental and Resources Science, Zhejiang A & F University, Lin’an 311300, China
2
Zhejiang Hangzhou Urban Ecosystem Research Station, Zhejiang Academy of Forestry, Hangzhou 310023, China
3
Hangzhou Immigration Inspection Station, Hangzhou 311223, China
4
Yuhang Ecological and Environmental Monitoring Station of Hangzhou, Hangzhou 311100, China
5
Ministry of Education Key Laboratory for Biodiversity Science and Ecological Engineering, School of Life Sciences, Fudan University, Shanghai 200433, China
*
Author to whom correspondence should be addressed.
Remote Sens. 2024, 16(13), 2393; https://doi.org/10.3390/rs16132393
Submission received: 22 May 2024 / Revised: 25 June 2024 / Accepted: 28 June 2024 / Published: 29 June 2024

Abstract

:
Global changes cause widespread forest fragmentation, which, in turn, has given rise to many ecological problems; this is especially true if the forest carbon stock is profoundly impacted by fragmentation levels. However, the way in which forest carbon uptake changes with different fragmentation levels and the main pathway through which fragmentation affects forest carbon uptake are still unclear. Remote sensing data, vegetation photosynthesis models, and fragmentation models were employed to generate a time series GPP (gross primary productivity) dataset, as well as forest fragmentation levels for forest landscapes in Zhejiang province, China. We analyzed GPP variation with forest fragmentation levels and identified the relative importance of the phenology (carbon uptake period—CUP) and physiology (maximum daily GPP—GPPmax) control pathways of GPP under different fragmentation levels. The results showed that the normalized mean annual GPP data of highly fragmented forests during the period from 2000 to 2018 were significantly higher than those of other fragmentation levels, while there was almost no significant difference in the annual GPP trend of forest landscapes with all fragmentation levels. Moreover, the percentage area of the control variable, GPPmax, gradually increased with fragmentation levels; the mean GPPmax between 2000 and 2018 of high-level fragmentation was higher than that of other fragmentation levels. Our results demonstrate that the carbon uptake capacity per unit area was enhanced in highly fragmented forest areas, and the maximum photosynthetic capacity (physiology-based process) played an important role in controlling carbon uptake, especially in highly fragmented forest landscapes. Our study calls for a better and deeper understanding of the potential of forest carbon uptake, and it is necessary to explore the mechanism by which forest fragmentation changes the vegetation photosynthetic process.

1. Introduction

Forests are a key component in terrestrial ecosystems [1]; globally, they play an important role in providing a variety of ecological services for mankind, such as absorbing and storing carbon, maintaining soil and water, and purifying air [2,3,4]. However, the world’s terrestrial biomes have been significantly affected by human-induced global changes [5]. The global forest area has shrunk by about one-third since the 1850s [6], most of which was induced by natural disturbances and the expansion of the agricultural and urban industries [7]. The rapid and vast loss of forest results in the splitting of spatially contiguous distributed forest landscape into small patches, leading to worldwide forest fragmentation [8]. Considering that some key functions of forests can be damaged by fragmentation through the degradation of vegetation biomass and biodiversity [9,10], it is necessary to comprehensively understand the impacts of forest fragmentation on ecosystems.
A series of ecological problems, particularly carbon loss and the intensification of the greenhouse effect, are directly induced by forest fragmentation [11,12,13]. Several studies have indicated that human activities induce more forest edge areas, aggravating frag-mentation and decreasing carbon storage [14,15]. However, carbon uptake is also proven to be enhanced in highly fragmented forests [16,17]. The complex variation in carbon up-take under different fragmentation levels proposes a demand for assessing the relationship and the influence pathway between forest fragmentation and vegetation carbon up-take, which can enhance our insights into the future carbon uptake potential of forests in the context of widespread forest fragmentation. In particular, in the context of intense land use caused by urbanization, forests show a high degree of fragmentation [8]. In addition to the direct impact of forest area change on vegetation carbon sequestration, it is unclear how forest distribution patterns affect forest carbon sequestration; this will greatly limit the effectiveness of urban forest management and ecological conservation measures, and will also limit our understanding of regional carbon cycle dynamics.
A number of methods have been used to measure forest fragmentation levels, with the patch or class level’s fragmentation-related landscape pattern metrics being adopted by most studies to quantify the levels of forest fragmentation [12,16,18]. However, these approaches have neglected the fact that forest fragmentation is a landscape-scale issue containing complex spatial processes [19]. Although there are some hierarchical approaches, which are based on spatial processes, to measuring the levels of forest fragmentation [20,21,22], these were mainly used to estimate the status of forest fragmentation, and have rarely been used to study the impacts of fragmentation on ecological functions due to the difficulty of accessing field observation data for relevant fragmentation levels. In reality, the classification results of the fragmentation levels from these methods may have great potential in studies investigating the ecological effects of forest fragmentation, particularly those with the assistance of the remote sensing approach, to estimate ecological function indicators at large spatial scales.
The processes of forest carbon uptake can be simply summarized as the absorption of atmospheric carbon dioxide by plants through photosynthesis [23]; gross primary productivity (GPP), a direct measurement of the total amount of carbon assimilated by vegetation, is generally considered as a reflection of vegetation carbon uptake. In addition, the vegetation carbon stock is highly related to the accumulation of annual GPP over a long period, which is mainly controlled by two factors—the carbon uptake period (CUP) and the maximum daily GPP (GPPmax), which are associated with vegetation phenology and physiology, respectively [24,25]. Both of these factors are affected by the climate and soil nutrient change caused by forest fragmentation [26,27,28]; therefore, detecting the variation in CUP and GPPmax under different fragmentation levels is crucial for explaining the pathway or the mechanism of the impact of fragmentation on forest carbon uptake.
In this study, forest landscapes in Zhejiang province, China, were selected as the study area in which to examine the relationship between forest fragmentation and GPP. Multiple sources of remote sensing data were applied to calculate forest fragmentation levels and to simulate vegetation GPP. We have proposed a basic assumption that the GPP and its two components—CUP and GPPmax—vary between forest fragmentation levels. Based on the analysis of the variation in GPP, CUP, and GPPmax with fragmentation levels, we would like to answer the following two scientific questions: (1) How does forest carbon uptake change with different fragmentation levels? (2) What is the main pathway affecting forest carbon uptake under different fragmentation levels?

2. Materials and Methods

2.1. Study Area

Zhejiang province, China, which extends across 27.03°–31.18°N and 118.02°–123.17°E, was selected as the study area (Figure 1). The forest coverage of Zhejiang province is about 59.4%, most of which is distributed in the mountains and hills. The subtropical monsoon climate is the dominant climate of Zhejiang province; it has hot, rainy summers and cold, dry winters, and has obvious characteristics of seasonal change. The mean annual temperature of Zhejiang is between 15 and 18 °C, while the average annual precipitation ranges between 980 and 2000 mm. The growing season usually starts in March and ends in October. The evergreen broadleaf forests and mixed coniferous–broadleaf forests are the main vegetation types of the study area (Figure 1); there are more than thirty tree species in the forest landscapes of Zhejiang province.
In this study, the tropical forest landscapes of Zhejiang were selected as the study area primarily for the following reasons: on the one hand, Zhejiang has a developed economy, whereby urbanization and other human activities in Zhejiang have caused drastic land use changes. In addition, Zhejiang has a large forest area and a high forest coverage; these two factors result in the distribution pattern of subtropical forests in Zhejiang containing all types of forest fragmentation, as well as having typical gradients of forest frag-mentation. On the other hand, Zhejiang has turned to the stage of ecosystem protection after its early development; the change in forest cover after 2000 is quite limited compared to that of its neighboring regions, which makes it convenient for this study to compare the productivity and its trend among static fragmentation types.

2.2. Forest Map Data and Fragmentation Levels Classification

Considering the fact that forest cover change may alter the forest fragmentation categories with time, this study requires a temporal stable status of forest cover. In order to exclude the influence from forest coverage change on the accuracy of the classification of forest fragmentation levels, our study only focused on the forest areas in Zhejiang province that have not changed since 2000. We used grids of 500 m in size to calculate the proportion of forest loss between 2000 and 2018 (the ratio of total forest loss pixels to total pixels in a 500 m grid) based on the Global Forest Change dataset [29]; the grids with a forest loss proportion of less than 5% were retained and were representative of unchanged forest landscapes. Moreover, a 50 m resolution forest map from 2010, generated using ALOS PALSAR-2, MODIS, and Landsat-7/8 satellite data [30], was selected as the basic forest cover data to conduct a classification of forest fragmentation levels based on the retained grids (unchanged forest landscapes).
A forest fragmentation model [20,21] that is widely used to estimate the status of forest fragmentation based on satellite-derived forest maps was employed in this study to classify forest fragmentation levels. This fragmentation model was developed based on the consideration of causing forest loss as a result of spatial disturbances; it has been widely applied to estimate forest fragmentation by analyzing forest distribution maps [31,32]. Additionally, forest area density (Pf) and forest connectivity (Pff) are two key indicators in this model for defining the fragmentation type of a given “window” or “landscape” based on a forest/non-forest binary map [20]. The size of the “window” reflects different spatial scales in the estimation of forest fragmentation. Pf and Pff are calculated using the following equations:
P f = N f N w
P f f = D f f D f
where Pf is the proportion of forest pixels in a given window, calculated by dividing the number of forest pixels (Nf) by the total number of pixels (Nw) in the window; Pff is the forest connectivity, calculated by dividing the pixel pair number that includes at least one forest pixel (Dff) by the pixel pair number that includes two forest pixels in cardinal directions (Df).
A look-up table (Table 1) containing the criteria of the two indicators (Dff and Df) was used to conduct the classification of forest fragmentation levels. Six fragmentation types, including patch (PAT), transitional (TRA), perforated (PER), undetermined (UND), edge (EDG), and interior (INT), were obtained. The fragmentation levels of these six types are shown as PAT > TRA > PER > UND > EDG > INT. However, UND was excluded from our study due to the fact that it only exists in extreme cases. In addition, in order to match the resolution (~500 m) of the GPP data, a 9 × 9 size “window” was adopted in this study.

2.3. Time Series GPP Dataset

A satellite-based light-use efficiency model—the vegetation photosynthesis model (VPM)—was used to simulated time series GPP dataset from 2000 to 2018 for the study area. The VPM was driven using the MODIS MOD09A1 surface reflectance dataset, the MCD12Q1 land cover dataset, the MYD11A2 land surface temperature dataset, and NCEP reanalysis II climate data. The final 500m resolution GPP of each 8-day period during 2000–2018 was obtained. The details of the simulation processes using the VPM have been reported in previous studies [33,34].
Based on the 500 m 8-day period GPP dataset, the annual GPP for each year between 2000 and 2018 was obtained by aggregating all the data in a relevant year. In addition, the GPPmax for each year between 2000 and 2018 was obtained by extracting the peak value for each pixel in each year. Since the vegetation in our study area usually has obvious characteristics of seasonal change, the temporal dynamic curve of GPP generally shows a unimodal shape. Therefore, in this study, the growing season is defined using a relative threshold method, as suggested in previous studies [35,36]; the threshold is set as 20% of the GPPmax in a given year. The carbon uptake period (CUP) for each year between 2000 and 2018 was obtained by counting the number of days in which the GPP was higher than the value of 20% of the GPPmax in each year.

2.4. Data Analysis

2.4.1. Comparison of GPP Trend among Different Fragmentation Levels

In order to explore the impact of forest fragmentation on vegetation productivity, we compared the mean annual GPP and the normalized mean annual GPP among different fragmentation levels from 2000 to 2018. The normalized mean annual GPP throughout 2000–2018 was calculated by dividing the mean annual GPP from 2000 to 2018 by the Pf for each pixel in order to exclude the influence of forest areas on GPP values for a pixel. A one-way ANOVA was adopted to test the significance of the difference between mean annual and mean normalized annual GPP data between 2000 and 2018 among forest fragmentation levels. Meanwhile, the LSD multiple comparison method was used to detect the difference between mean annual and normalized mean annual GPP data between 2000 and 2018 under various fragmentation levels.
The linear trend of the annual GPP during 2000–2018 for each pixel and the entire Zhejiang province was calculated, and the slope value of the linear regression line was represented as the magnitude of the trend. The annual GPP trend of different fragmentation levels throughout 2000–2018 was also compared using a one-way ANOVA.

2.4.2. Detecting the Relative Importance of the Control Pathways of GPP

In order to explore the control pathways of GPP in our study area, we conducted multiple linear regression between GPP and either CUP, GPPmax, or a combination of CUP and GPPmax for each pixel of the period between 2000 and 2018. A metric assessing meth-od in the “relaimpo” package in the R software [37] was employed to quantify the relative importance of each individual variable in linear models for each pixel in this study; the variable with the highest relative importance value was regarded as the control variable of GPP. The relative importance of each individual control variable was calculated to reflect its degree of control, and the values were normalized from 0 to 100%. In addition, the pixel number percentages of the three control variables were also calculated and were statistically compared for each forest fragmentation level.

2.4.3. Comparison of GPP Control Pathways among Different Fragmentation Levels

In order to answer the question of which pathway of forest fragmentation affects vegetation productivity, the CUP, GPPmax, and CUP × GPPmax were calculated and compared among various forest fragmentation levels. A one-way ANOVA was adopted to test the significance of the differences in the three control variables, and the LSD multiple com-parison method was used to detect the difference between the three control variables un-der various fragmentation levels.

2.4.4. Statistical Analysis and Data Processing Methods

The raster data processing, mapping, and statistical analysis were conducted using ArcGIS10.3 and R software (version 4.4.1) [38]; the significance level of the one-way ANOVA was set to 0.05.

3. Results

3.1. GPP Dynamics of Different Fragmentation Levels

There was a significant (p < 0.05) difference in the mean annual GPP in 2000 and 2018 for forest landscapes with various fragmentation levels in Zhejiang (Table 2). Generally, forest landscapes with fragmentation levels of PAT and INT had the lowest and highest mean annual GPP values, respectively, while no significant difference in the mean annual GPP was identified between TRA, PER, and EDG. Although a significant (p < 0.05) difference in the normalized mean annual GPP for 2000 and 2018 in Zhejiang was found among all forest fragmentation levels (Table 2), the highest and lowest normalized mean annual GPP values in forest landscapes were represented by the PAT and INT fragmentation levels, respectively. Similarly, there was no significant difference in the normalized mean annual GPP between PER and EDG.
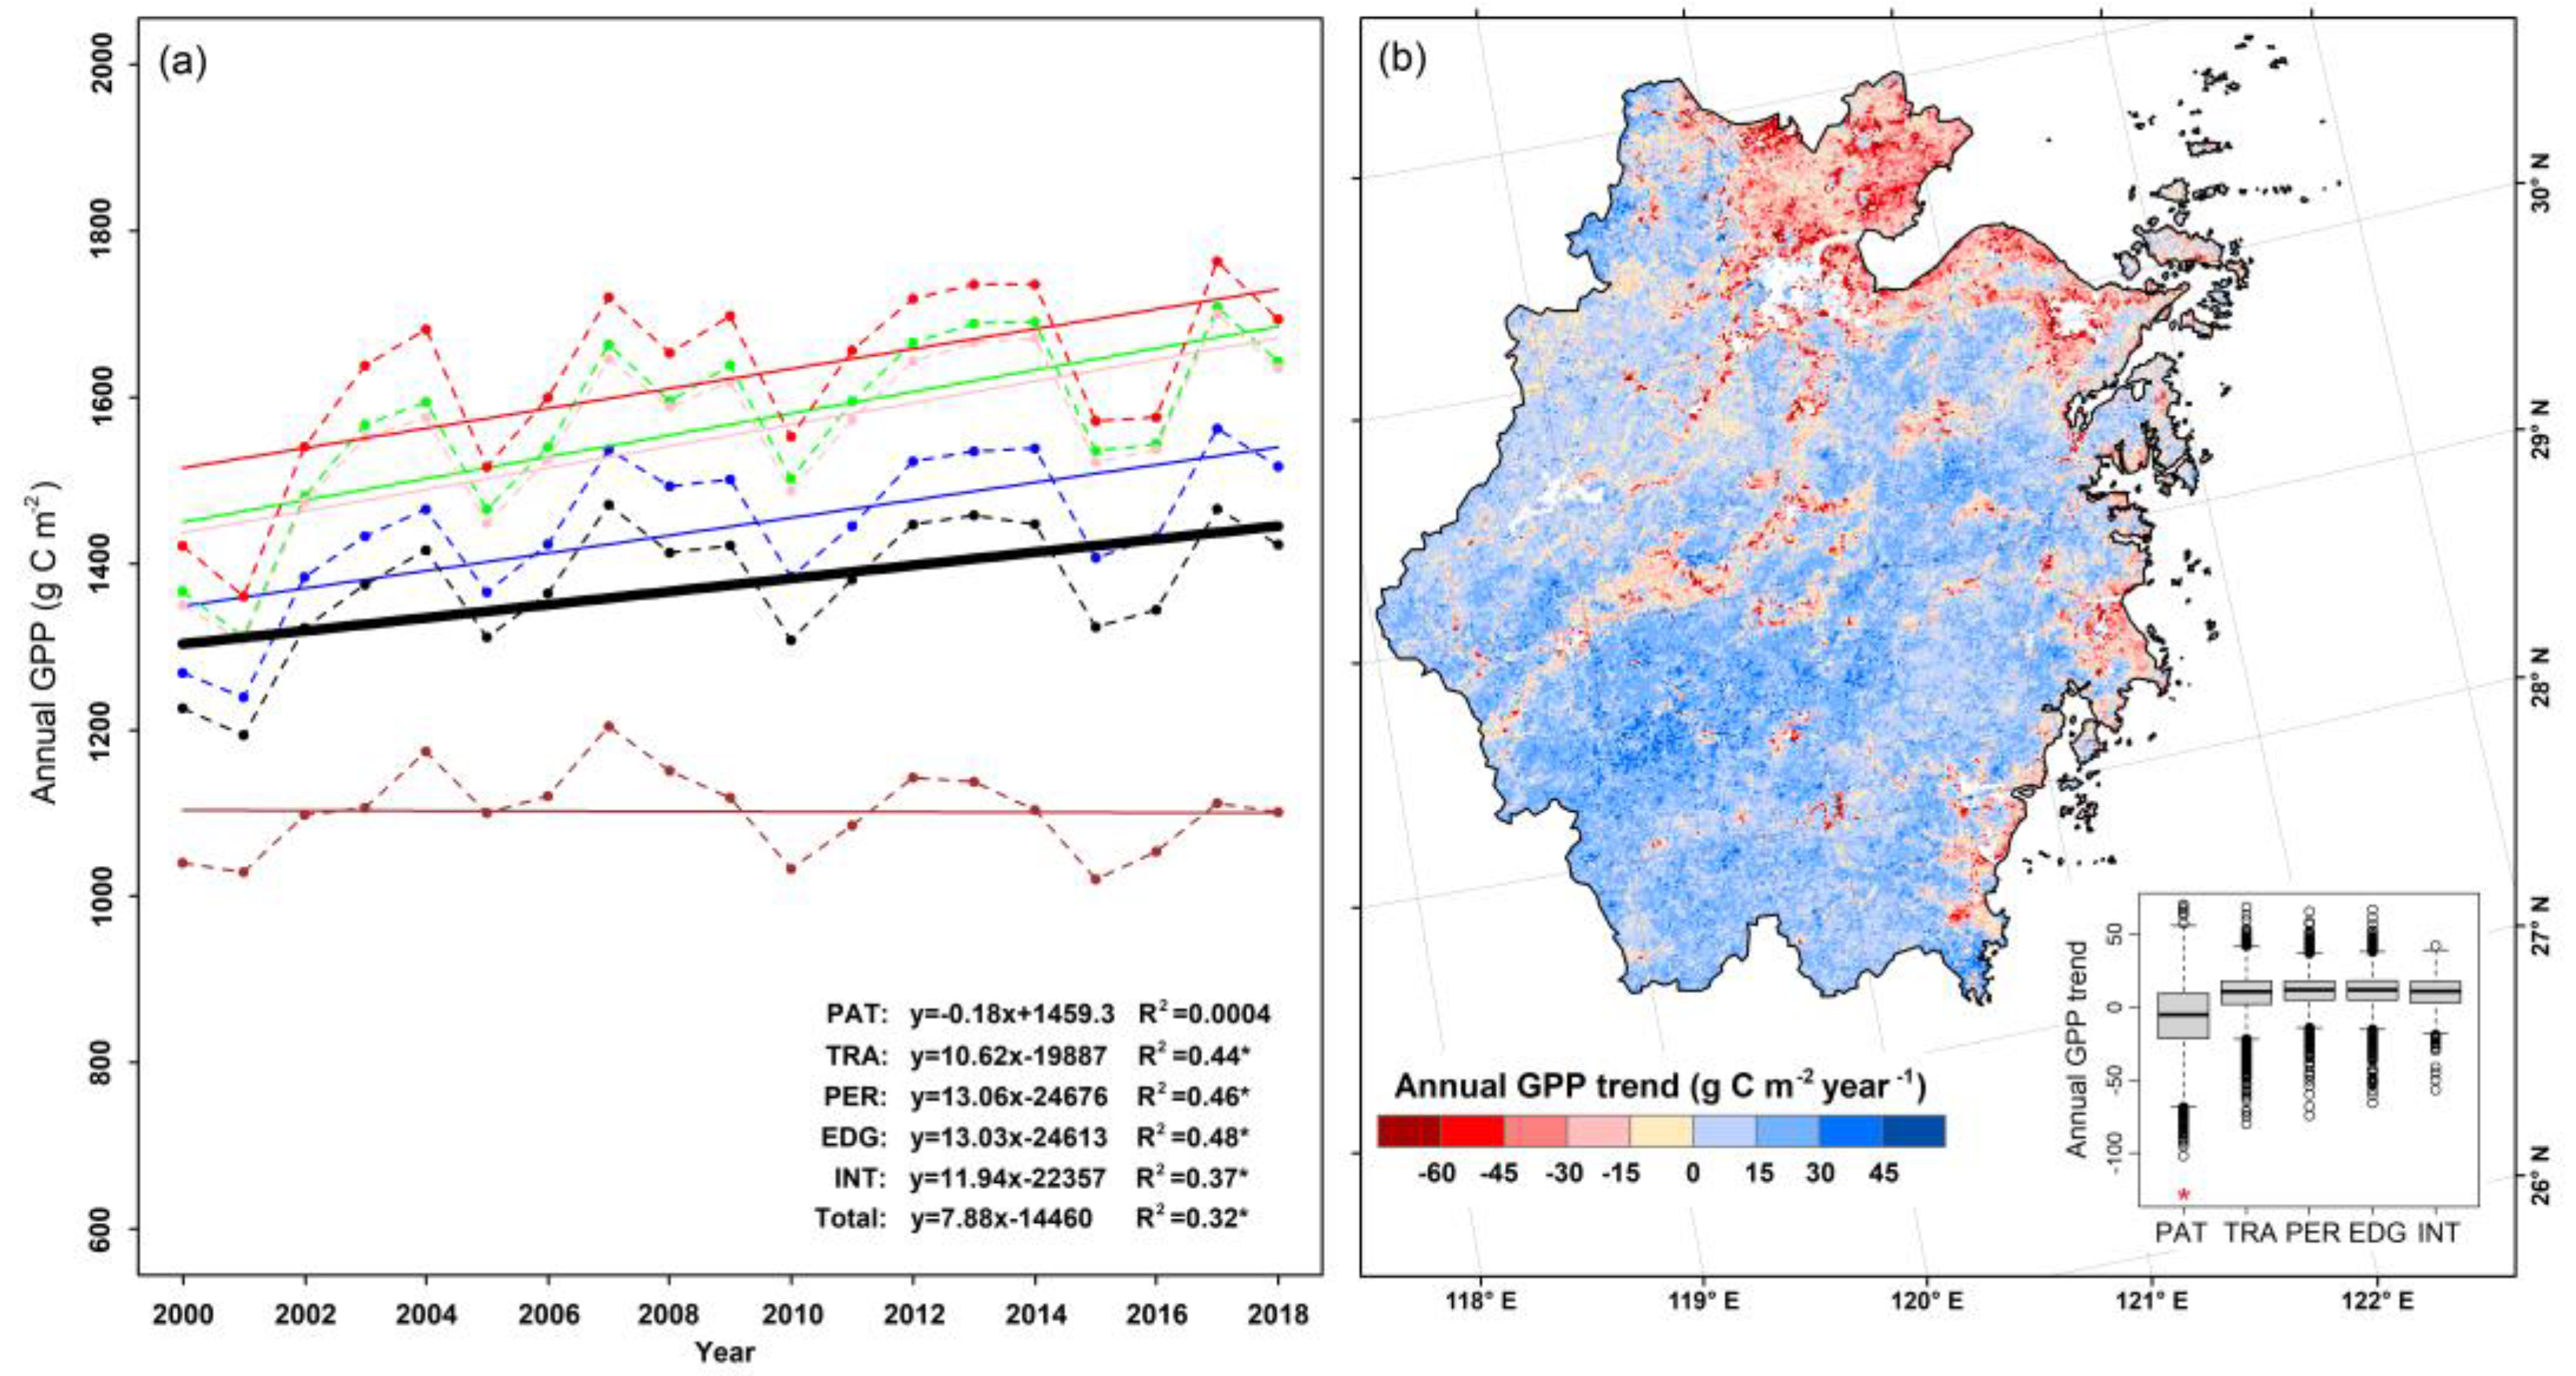
Significant (p < 0.05) increasing trends were found in all fragmentation levels and all types of forest landscapes in Zhejiang, except for the PAT landscape (Figure 2a). The in-crease in the rate of annual GPP with regard to various fragmentation levels fluctuated from 10.6 g C m−2 year−1 in TRA to 13.1 g C m−2 year−1 in PER. Spatially, the annual GPP trend in Zhejiang generally showed positive values for most pixels (Figure 2b). The annual GPP trend in PAT was significantly lower than those in forest landscapes with other fragmentation levels, but there was no significant difference in the annual GPP trend among TRA, PER, EDG, and INT. The higher values (>30 g C m−2 year−1) of the annual GPP trend were mainly distributed in the west and central part of Zhejiang, while the lower values (<−45 g C m−2 year−1) of the annual GPP trend were mainly distributed in the north and coastal areas of Zhejiang.

3.2. Relative Importance of Different GPP Control Pathways

CUP × GPPmax was identified as being the control variable for about 61.8% of the entire Zhejiang province; the area percentages of the control variables for CUP and GPPmax were 19.7% and 18.5%, respectively (Figure 3a). The control variable for CUP was mainly distributed in some parts of western and central Zhejiang, while the control variable for GPPmax was mainly distributed in central and eastern Zhejiang. The relative importance of the three control variables ranged from 0 to 82%, and most of them were distributed in the range of 5~35% (Figure 3b). The area percentages of the control variables for CUP × GPPmax were maintained at approximately 60% among various fragmentation levels (Figure 3c). However, the control variable for CUP (13.2~27.8%) and GPPmax (11.1~25.0%) still accounted for a certain proportion of area among various fragmentation levels. There was no significant (p > 0.05) difference in the relative importance between any two fragmentation levels, and the mean relative importance of various fragmentation levels ranged between 25% and 28% (Figure 3d).

3.3. GPP Control Pathways of Different Fragmentation Levels

A significant (p < 0.05) difference in the mean CUP of forest landscapes in Zhejiang during 2000–2018 was detected among all fragmentation levels (Table 3). The highest and lowest mean CUP were represented by the INT and PAT forest landscapes, respectively, and there was no significant (p > 0.05) difference in the mean CUP between TRA, PER, EDG, and INT. Moreover, the mean GPPmax of INT forest landscapes was significantly (p < 0.05) higher than that for the PAT and TRA landscapes; no significant (p > 0.05) difference in the mean GPPmax existed in forest landscapes in Zhejiang between TRA, PER, and EDG, or between PER, EDG, and INT. Similarly, a significant (p < 0.05) difference in the mean CUP × GPPmax of forest landscapes in Zhejiang during 2000–2018 was detected among all forest fragmentation levels (Table 3). The highest and lowest mean CUP × GPPmax values existed in the INT and PAT landscapes, respectively, and there was no significant (p > 0.05) difference in the mean CUP × GPPmax between PER and EDG.
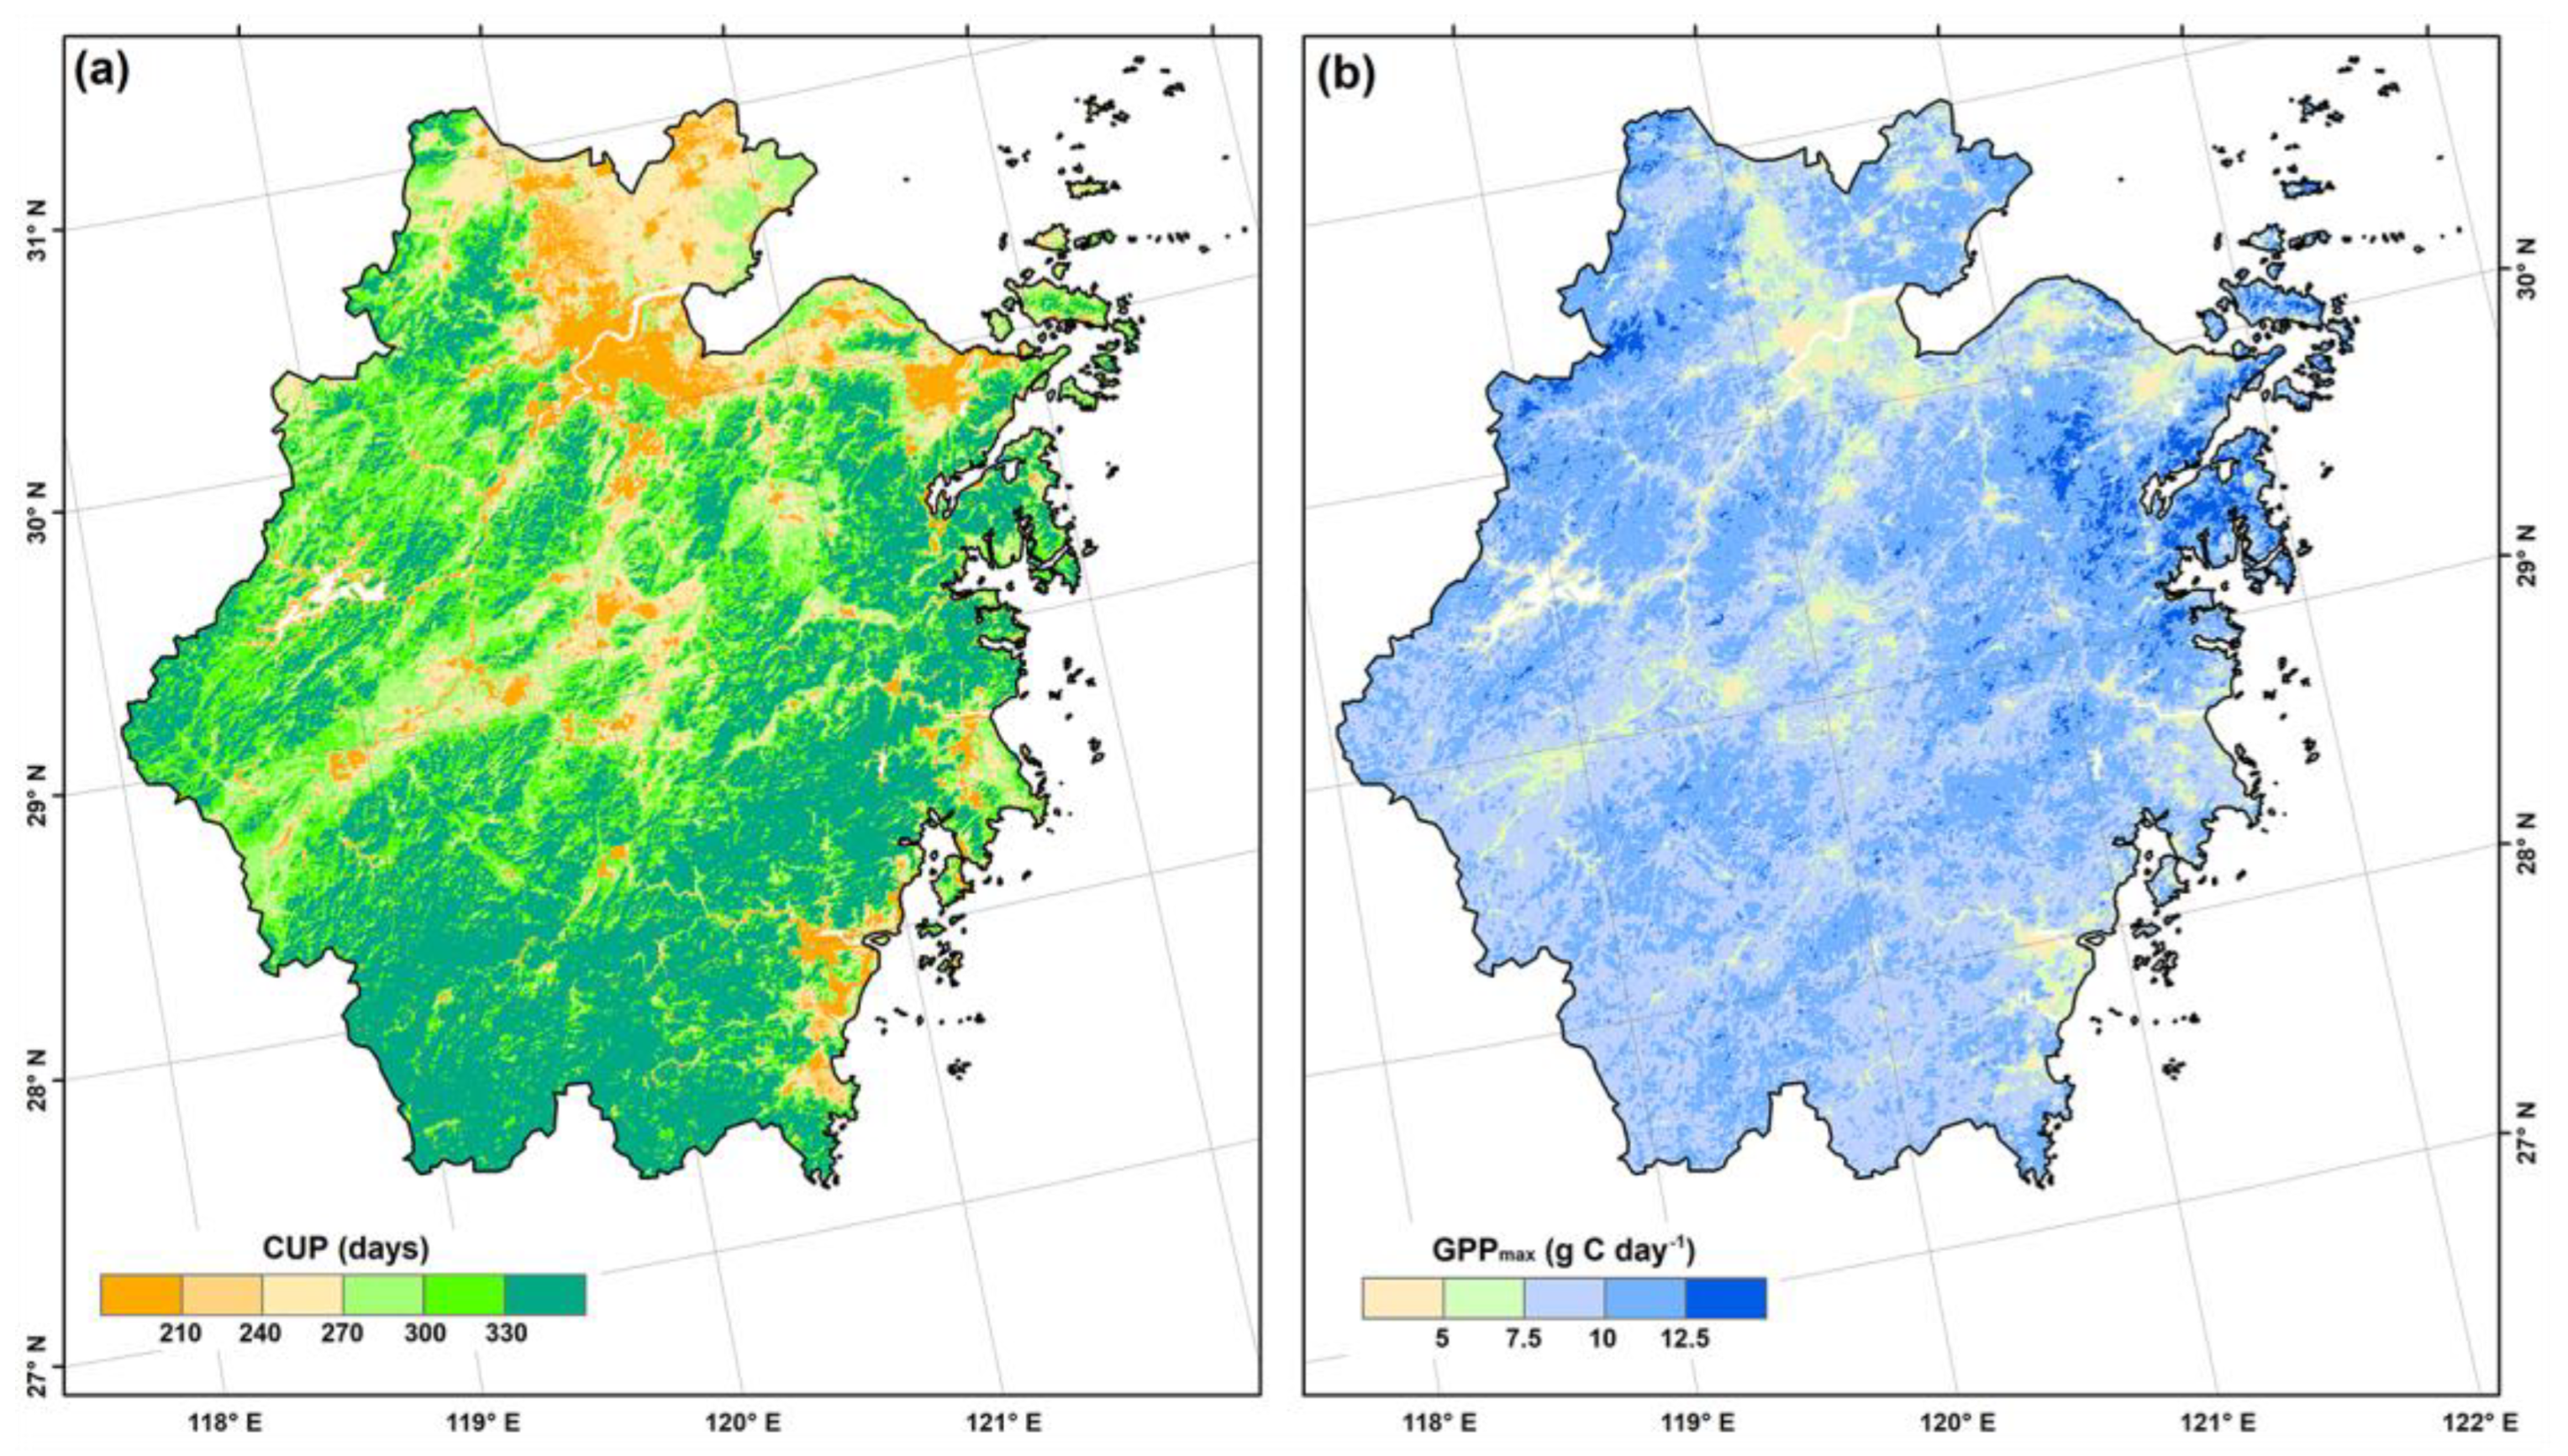
Spatially, the mean values of CUP and GPPmax in the forest landscapes of Zhejiang during 2000–2018 both have high heterogeneities. The higher mean CUP values (>330 days) were generally found in the south and east parts of Zhejiang, while the lower mean CUP values (<210 days) were generally found in the north part of Zhejiang (Figure 4a). Among the regions with a high forest coverage, there was little difference in the mean CUP throughout 2000–2018, but the mean GPPmax during 2000–2018 presented obvious spatial variations. In particular, the highest values (>12.5 g C day−1) of the mean GPPmax during 2000–2018 were concentrated in dense forest landscapes in the east and northwest parts of Zhejiang (Figure 4b); however, the values of mean GPPmax during 2000–2018 were generally less than 10 g C day−1 in the south dense forest landscapes in Zhejiang.

4. Discussion

4.1. Impacts of Forest Fragmentation on Carbon Uptake

The mean annual GPP throughout 2000–2018 generally declined from INT to PAT forest landscapes (Table 2); this is in line with previous studies, which suggest that carbon loss in forests is aggravated by fragmentation level [39,40,41]. The carbon loss is directly attributed to the forest loss under forest fragmentation, which may be mainly caused by natural and human disturbances, such as logging, fire, and agriculture and urban expansion [5,27,42]. However, our results also showed that the normalized mean annual GPP of PAT forest landscapes during 2000–2018 was significantly higher than that of other fragmentation levels (Table 2), which implies that the carbon uptake of higher fragmented forest areas was enhanced when excluding the influence of forest area density. A similar result was found in a temperate broadleaf forest of north America [16], where the forest growth rate decreased with the distance from forest edge. The variations in light availability [43] and the sensitivity to climate [44,45] of the forests with different fragmentation levels are likely to be responsible for their differences in carbon uptake.
In this study, except for the PAT forest landscapes, there was no significant difference in the annual GPP trend throughout 2000–2018 among fragmentation levels (Figure 3); this could be attributed to two possible reasons. On the one hand, forest landscapes with a high fragmentation level are more likely to be distributed near urban areas, and the changed environment with a higher temperature and CO2 concentration and better hu-man management and protection (e.g., artificial irrigation) had a positive influence on forest carbon uptake. On the other hand, forest landscapes with different forest fragmentation levels (except PAT) were evenly distributed in Zhejiang (Figure 1), which led to parallel forest age structures existing in different fragmentation levels; this result suggests that the impact of forest fragmentation on the change rate of vegetation productivity is very limited.

4.2. Impacts of Forest Fragmentation on Control Pathways of Carbon Uptake

Since vegetation carbon uptake processes can be divided into phenological and physiological factors, the control pathway of GPP is either phenological, physiological, or both. Our results showed that CUP × GPPmax was the most widespread control variable of GPP, at mostly more than 60%, during 2000–2018 for all fragmentation levels (Figure 3), which is consistent with a previous study that reported that GPP was jointly controlled by phenology and physiology processes [24]. However, the individual CUP or GPPmax still controlled the GPP in some forest landscapes in Zhejiang. For example, forest carbon uptake was mainly controlled by the CUP in mountain areas, while the controlling role of GPPmax on GPP usually occurred in the central and coastal areas with a flat terrain (Figure 3). Our study indicates that the dominant pathways of forest carbon uptake are closely related to topographic conditions.
Moreover, our results showed that the percentage area of the GPPmax control variable gradually increases with fragmentation level; the mean GPPmax of PAT during 2000–2018 was found to be higher than that of other fragmentation levels (Table 3). This means that the maximum photosynthetic capacity of vegetation, mainly reflected by GPPmax, is important in controlling carbon uptake in highly fragmented forest landscapes. The factors of less inter-individual competition [46,47] and more carbon dioxide fertilization [48,49] are likely possible drivers of the observed importance of GPPmax at higher fragmentation levels.
In addition, the control variables of the CUP and CUP × GPPmax of INT forest landscapes were obviously higher than those of other fragmentation levels. This suggests that phenology-based processes benefit from less fragmented forest landscapes and are most likely to be attributed to the warming conditions caused by the edge effect [50] in highly fragmented forests.

4.3. Insights on Local Forest Management under Forest Fragmentation

Historically, forests in Zhejiang, China, have experienced severe logging disturbances, causing a grim status of forest fragmentation. However, the results of this study may still provide useful insights into local forest management. Firstly, a higher carbon uptake capacity per unit area exists in highly fragmented forest landscapes, reminding us to explore the potential of forest carbon uptake in the context of the widespread existence of forest fragmentation. In particular, as one of the most developed regions in China, Zhejiang is subject to intense human activities, such as rapid urbanization and economic development, which have significantly affected the distribution pattern of natural ecosystems, such as forests. The positive relationship between forest fragmentation and carbon sequestration provides an opportunity for Zhejiang to balance development and ecological protection. Secondly, although the forest carbon uptake may be enhanced under fragmentation, there is still a great need to protect the forests due to the fac that any loss of forest coverage will lead to a further loss of carbon stock. Finally, this relationship is also based on the implication that the increase in the maximum photosynthetic capacity may induce the enhancement of carbon uptake in highly fragmented forest landscapes. Therefore, it is necessary to explore the mechanism by which forest fragmentation changes the vegetation photosynthetic process, which will play an important role in formulating forest management measures. In addition, although subtropical forests in Zhejiang Province were selected as being representative in this study, considering the universality of research approaches and the widespread availability of research objects, our results have great potential values for understanding how the carbon uptake of subtropical forests responds to forest fragmentation in other subtropical regions.

4.4. Research Uncertainties and Prospects

In this study, we explored how forest carbon uptake changes with different fragmentation levels and what the main pathway is in which fragmentation affected forest carbon uptake throughout 2000–2018 in forest landscapes in Zhejiang, China. Some uncertainties may exist in our study. Firstly, although forest protection and suspended logging disturbances have been implemented since 2000 in the study area [51,52], we assumed that the forest coverage was kept stable when the forest loss proportion was less than 5% in the period between 2000 and 2018; this may still induce some uncertainties, since the succession of forests themselves may have caused some changes in forest cover [53]. Secondly, the datasets of forest cover and GPP were produced on a large scale (the whole of China) and have a high accuracy. However, we only used some parts of the datasets, inducing uncertainties in the accuracy of the datasets. Lastly, although the forest fragmentation level classification and GPP estimation were obtained based on certified methods [20,29,54], the accuracy of these data may also have some impacts on the study results.

5. Conclusions

Compared to previous studies, this study has revealed the variation in carbon uptake with forest fragmentation levels at both landscape and regional scales, and the forest landscape pattern was found to have certain impacts on forest productivity. In addition, the control pathways of carbon uptake under forest fragmentation were also identified. These findings have enhanced the understanding of vegetation carbon uptake processes in the context of widespread forest fragmentation.
Our results demonstrate that carbon uptake capacity per unit area was enhanced in highly fragmented forest landscapes. However, there was almost no significant difference in the annual GPP trend throughout 2000–2018 among forest landscapes with different fragmentation levels. Additionally, although forest carbon uptake was jointly controlled by phenology- and physiology-based processes, the maximum photosynthetic capacity of vegetation—the physiology-based process—played an important role in controlling car-bon uptake, particularly in highly fragmented forest landscapes. Hence, the results and findings from this study call for a better and deeper understanding of the potential of forest carbon uptake in connection to fragmentation. There is an emerging need to pay serious attention to sustainable forest conservation and protection in the context of the widespread existence of forest fragmentation. Moreover, in order to formulate appropriate forest management and planning activities, it is necessary to explore the mechanism in which forest fragmentation changes the vegetation photosynthetic process in connection to carbon uptake and release.

Author Contributions

Conceptualization, J.J., J.M. and C.W.; methodology, J.J., P.H. and J.M.; formal analysis, J.J., Y.C., P.H., B.J. and C.W.; data curation, J.J., Y.C., P.H., B.J. and C.W.; writing—original draft preparation, J.J.; writing—review and editing, Y.C., P.H., J.M., L.Y., B.J., X.X. and C.W.; visualization, J.J. and Y.C.; funding acquisition, C.W. and J.M. All authors have read and agreed to the published version of the manuscript.

Funding

This research was supported by the research institute support project of Zhejiang Province (2024F1065-1), “Pioneer” and “Leading Goose” R&D Program of Zhejiang (2024C03227), Natural Science Foundation of China (32271659), and scientific research program of Shanghai science and technology commission (23DZ1204504).

Data Availability Statement

The time series GPP dataset was downloaded from https://doi.pangaea.de/10.1594/PANGAEA.879558?format=html#download (accessed on 21 May 2024). The forest cover map is available on request from Dr. Yuanwei Qin from the University of Oklahoma. The CUP, GPPmax, and forest fragmentation categories map are available on request from the corresponding authors.

Acknowledgments

We thanks Yuanwei Qin from the University of Oklahoma for his share of the forest cover map of China. We also thank Jijia Liu from Fudan University for his participate in the discussion of this study.

Conflicts of Interest

The authors declare no conflicts of interest.

References

  1. Pan, Y.; Birdsey, R.A.; Fang, J.; Houghton, R.; Kauppi, P.E.; Kurz, W.A.; Phillips, O.L.; Shvidenko, A.; Lewis, S.L.; Canadell, J.G.; et al. A Large and Persistent Carbon Sink in the World’s Forests. Science 2011, 333, 988–993. [Google Scholar] [CrossRef]
  2. Canadell, J.G.; Raupach, M.R. Managing forests for climate change mitigation. Science 2008, 320, 1456–1457. [Google Scholar] [CrossRef]
  3. Fang, J.Y.; Guo, Z.D.; Hu, H.F.; Kato, T.; Muraoka, H.; Son, Y. Forest biomass carbon sinks in East Asia, with special reference to the relative contributions of forest expansion and forest growth. Glob. Change Biol. 2014, 20, 2019–2030. [Google Scholar] [CrossRef] [PubMed]
  4. Kumar, P.; Pirjola, L.; Ketzel, M.; Harrison, R.M. Nanoparticle emissions from 11 non-vehicle exhaust sources—A review. Atmos. Environ. 2013, 67, 252–277. [Google Scholar] [CrossRef]
  5. Hansen, M.C.; Stehman, S.V.; Potapov, P.V. Quantification of global gross forest cover loss. Proc. Natl. Acad. Sci. USA 2010, 107, 8650–8655. [Google Scholar] [CrossRef] [PubMed]
  6. Arora, V.K.; Boer, G.J. Uncertainties in the 20th century carbon budget associated with land use change. Glob. Change Biol. 2010, 16, 3327–3348. [Google Scholar] [CrossRef]
  7. Curtis, P.G.; Slay, C.M.; Harris, N.L.; Tyukavina, A.; Hansen, M.C. Classifying drivers of global forest loss. Science 2018, 361, 1108–1111. [Google Scholar] [CrossRef] [PubMed]
  8. Ma, J.; Li, J.; Wu, W.; Liu, J. Global forest fragmentation change from 2000 to 2020. Nat. Commun. 2023, 14, 3752. [Google Scholar] [CrossRef] [PubMed]
  9. Haddad, N.M.; Brudvig, L.A.; Clobert, J.; Davies, K.F.; Gonzalez, A.; Holt, R.D.; Lovejoy, T.E.; Sexton, J.O.; Austin, M.P.; Collins, C.D.; et al. Habitat fragmentation and its lasting impact on Earth’s ecosystems. Sci. Adv. 2015, 1, e1500052. [Google Scholar] [CrossRef]
  10. Collins, C.D.; Banks-Leite, C.; Brudvig, L.A.; Foster, B.L.; Cook, W.M.; Damschen, E.I.; Andrade, A.; Austin, M.; Camargo, J.L.; Driscoll, D.A.; et al. Fragmentation affects plant community composition over time. Ecography 2017, 40, 119–130. [Google Scholar] [CrossRef]
  11. Bello, C.; Galetti, M.; Pizo, M.A.; Magnago, L.F.S.; Rocha, M.F.; Lima, R.A.F.; Peres, C.A.; Ovaskainen, O.; Jordano, P. Defaunation affects carbon storage in tropical forests. Sci. Adv. 2015, 1, e1501105. [Google Scholar] [CrossRef] [PubMed]
  12. Ma, L.; Shen, C.; Lou, D.; Fu, S.; Guan, D. Ecosystem carbon storage in forest fragments of differing patch size. Sci. Rep. 2017, 7, 13173. [Google Scholar] [CrossRef]
  13. Smith, I.A.; Hutyra, L.R.; Reinmann, A.B.; Marrs, J.K.; Thompson, J.R. Piecing together the fragments: Elucidating edge effects on forest carbon dynamics. Front. Ecol. Environ. 2018, 16, 213–221. [Google Scholar] [CrossRef]
  14. Chaplin-Kramer, R.; Ramler, I.; Sharp, R.; Haddad, N.M.; Gerber, J.S.; West, P.C.; Mandle, L.; Engstrom, P.; Baccini, A.; Sim, S.; et al. Degradation in carbon stocks near tropical forest edges. Nat. Commun. 2015, 6, 10158. [Google Scholar] [CrossRef] [PubMed]
  15. Ordway, E.M.; Asner, G.P. Carbon declines along tropical forest edges correspond to heterogeneous effects on canopy structure and function. Proc. Natl. Acad. Sci. USA 2020, 117, 7863–7870. [Google Scholar] [CrossRef] [PubMed]
  16. Reinmann, A.B.; Hutyra, L.R. Edge effects enhance carbon uptake and its vulnerability to climate change in temperate broadleaf forests. Proc. Natl. Acad. Sci. USA 2017, 114, 107–112. [Google Scholar] [CrossRef] [PubMed]
  17. Morreale, L.L.; Thompson, J.R.; Tang, X.; Reinmann, A.B.; Hutyra, L.R. Elevated growth and biomass along temperate forest edges. Nat. Commun. 2021, 12, 7181. [Google Scholar] [CrossRef]
  18. Remy, E.; Wuyts, K.; Boeckx, P.; Ginzburg, S.; Gundersen, P.; Demey, A.; Van Den Bulcke, J.; Van Acker, J.; Verheyen, K. Strong gradients in nitrogen and carbon stocks at temperate forest edges. For. Ecol. Manag. 2016, 376, 45–58. [Google Scholar] [CrossRef]
  19. Fahrig, L. Effects of habitat fragmentation on biodiversity. Annu. Rev. Ecol. Evol. Syst. 2003, 34, 487–515. [Google Scholar] [CrossRef]
  20. Riitters, K.; Wickham, J.; O’Neill, R.; Jones, B.; Smith, E. Global-scale patterns of forest fragmentation. Conserv. Ecol. 2000, 4, 30. [Google Scholar] [CrossRef]
  21. Riitters, K.H.; Wickham, J.D.; O’Neill, R.V.; Jones, K.B.; Smith, E.R.; Coulston, J.W.; Wade, T.G.; Smith, J.H. Fragmentation of continental United States forests. Ecosystems 2002, 5, 815–822. [Google Scholar] [CrossRef]
  22. Hermosilla, T.; Wulder, M.A.; White, J.C.; Coops, N.C.; Pickell, P.D.; Bolton, D.K. Impact of time on interpretations of forest fragmentation: Three-decades of fragmentation dynamics over Canada. Remote Sens. Environ. 2019, 222, 65–77. [Google Scholar] [CrossRef]
  23. Monteith, J.L. Solar-radiation and productivity in tropical ecosystems. J. Appl. Ecol. 1972, 9, 747–766. [Google Scholar] [CrossRef]
  24. Xia, J.; Niu, S.; Ciais, P.; Janssens, I.A.; Chen, J.; Ammann, C.; Arain, A.; Blanken, P.D.; Cescatti, A.; Bonal, D.; et al. Joint control of terrestrial gross primary productivity by plant phenology and physiology. Proc. Natl. Acad. Sci. USA 2015, 112, 2788–2793. [Google Scholar] [CrossRef] [PubMed]
  25. Zhou, S.; Zhang, Y.; Ciais, P.; Xiao, X.; Luo, Y.; Caylor, K.K.; Huang, Y.; Wang, G. Dominant role of plant physiology in trend and variability of gross primary productivity in North America. Sci. Rep. 2017, 7, 41366. [Google Scholar] [CrossRef]
  26. Keenan, T.F.; Gray, J.; Friedl, M.A.; Toomey, M.; Bohrer, G.; Hollinger, D.Y.; Munger, J.W.; O’Keefe, J.; Schmid, H.P.; SueWing, I.; et al. Net carbon uptake has increased through warming-induced changes in temperate forest phenology. Nat. Clim. Change 2014, 4, 598–604. [Google Scholar] [CrossRef]
  27. Arroyo-Rodriguez, V.; Melo, F.P.L.; Martinez-Ramos, M.; Bongers, F.; Chazdon, R.L.; Meave, J.A.; Norden, N.; Santos, B.A.; Leal, I.R.; Tabarelli, M. Multiple successional pathways in human-modified tropical landscapes: New insights from forest succession, forest fragmentation and landscape ecology research. Biol. Rev. 2017, 92, 326–340. [Google Scholar] [CrossRef]
  28. Grilli, G.; Urcelay, C.; Galetto, L. Forest fragment size and nutrient availability: Complex responses of mycorrhizal fungi in native-exotic hosts. Plant Ecol. 2012, 213, 155–165. [Google Scholar] [CrossRef]
  29. Hansen, M.C.; Potapov, P.V.; Moore, R.; Hancher, M.; Turubanova, S.A.; Tyukavina, A.; Thau, D.; Stehman, S.V.; Goetz, S.J.; Loveland, T.R.; et al. High-Resolution Global Maps of 21st-Century Forest Cover Change. Science 2013, 342, 850–853. [Google Scholar] [CrossRef]
  30. Qin, Y.W.; Xiao, X.M.; Dong, J.W.; Zhang, G.L.; Shimada, M.; Liu, J.Y.; Li, C.G.; Kou, W.L.; Moore, B. Forest cover maps of China in 2010 from multiple approaches and data sources: PALSAR, Landsat, MODIS, FRA, and NFI. ISPRS J. Photogramm. Remote Sens. 2015, 109, 1–16. [Google Scholar] [CrossRef]
  31. Dong, J.; Xiao, X.; Sheldon, S.; Biradar, C.; Zhang, G.; Nguyen Dinh, D.; Hazarika, M.; Wikantika, K.; Takeuhci, W.; Moore, B., III. A 50-m Forest Cover Map in Southeast Asia from ALOS/PALSAR and Its Application on Forest Fragmentation Assessment. PLoS ONE 2014, 9, e85801. [Google Scholar] [CrossRef] [PubMed]
  32. Li, Y.; Xiao, X.; Li, X.; Ma, J.; Chen, B.; Qin, Y.; Dong, J.; Zhao, B. Multi-scale assessments of forest fragmentation in China. Biodiversity 2017, 25, 372–381. (In Chinese) [Google Scholar] [CrossRef]
  33. Ma, J.; Xiao, X.M.; Zhang, Y.; Doughty, R.; Chen, B.Q.; Zhao, B. Spatial-temporal consistency between gross primary productivity and solar-induced chlorophyll fluorescence of vegetation in China during 2007-2014. Sci. Total Environ. 2018, 639, 1241–1253. [Google Scholar] [CrossRef]
  34. Zhang, Y.; Xiao, X.M.; Wu, X.C.; Zhou, S.; Zhang, G.L.; Qin, Y.W.; Dong, J.W. Data Descriptor: A global moderate resolution dataset of gross primary production of vegetation for 2000-2016. Sci. Data 2017, 4, 13. [Google Scholar] [CrossRef]
  35. Zhao, J.-J.; Liu, L.-Y. Extraction of temperate vegetation phenology thresholds in North America based on flux tower observation data. Chin. J. Appl. Ecol. 2013, 24, 311–318. [Google Scholar]
  36. White, M.A.; Thornton, P.E.; Running, S.W. A continental phenology model for monitoring vegetation responses to interannual climatic variability. Glob. Biogeochem. Cycles 1997, 11, 217–234. [Google Scholar] [CrossRef]
  37. Groemping, U. Relative importance for linear regression in R: The package relaimpo. J. Stat. Softw. 2006, 17, 1–27. [Google Scholar]
  38. R Development Core Team. R: A Language and Environment for Statistical Computing; R Foundation for Statistical Computing: Vienna, Austria, 2013. [Google Scholar]
  39. Berenguer, E.; Ferreira, J.; Gardner, T.A.; Aragao, L.; De Camargo, P.B.; Cerri, C.E.; Durigan, M.; De Oliveira, R.C.; Vieira, I.C.G.; Barlow, J. A large-scale field assessment of carbon stocks in human-modified tropical forests. Glob. Change Biol. 2014, 20, 3713–3726. [Google Scholar] [CrossRef] [PubMed]
  40. Silverio, D.V.; Brando, P.M.; Bustamante, M.M.C.; Putz, F.E.; Marra, D.M.; Levick, S.R.; Trumbore, S.E. Fire, fragmentation, and windstorms: A recipe for tropical forest degradation. J. Ecol. 2019, 107, 656–667. [Google Scholar] [CrossRef]
  41. Zeng, Z.Z.; Gower, D.B.; Wood, E.F. Accelerating forest loss in Southeast Asian Massif in the 21st century: A case study in Nan Province, Thailand. Glob. Change Biol. 2018, 24, 4682–4695. [Google Scholar] [CrossRef]
  42. Barber, C.P.; Cochrane, M.A.; Souza, C.M.; Laurance, W.F. Roads, deforestation, and the mitigating effect of protected areas in the Amazon. Biol. Conserv. 2014, 177, 203–209. [Google Scholar] [CrossRef]
  43. Briber, B.M.; Hutyra, L.R.; Reinmann, A.B.; Raciti, S.M.; Dearborn, V.K.; Holden, C.E.; Dunn, A.L. Tree Productivity Enhanced with Conversion from Forest to Urban Land Covers. PLoS ONE 2015, 10, e0136237. [Google Scholar] [CrossRef] [PubMed]
  44. Martin-Benito, D.; Pederson, N. Convergence in drought stress, but a divergence of climatic drivers across a latitudinal gradient in a temperate broadleaf forest. J. Biogeogr. 2015, 42, 925–937. [Google Scholar] [CrossRef]
  45. Tang, G.P.; Beckage, B.; Smith, B.; Miller, P.A. Estimating potential forest NPP, biomass and their climatic sensitivity in New England using a dynamic ecosystem model. Ecosphere 2010, 1, 1–20. [Google Scholar] [CrossRef]
  46. Campbell, M.J.; Edwards, W.; Magrach, A.; Alamgir, M.; Porolak, G.; Mohandass, D.; Laurance, W.F. Edge disturbance drives liana abundance increase and alteration of liana-host tree interactions in tropical forest fragments. Ecol. Evol. 2018, 8, 4237–4251. [Google Scholar] [CrossRef] [PubMed]
  47. Fischer, R.; Bohn, F.; de Paula, M.D.; Dislich, C.; Groeneveld, J.; Gutierrez, A.G.; Kazmierczak, M.; Knapp, N.; Lehmann, S.; Paulick, S.; et al. Lessons learned from applying a forest gap model to understand ecosystem and carbon dynamics of complex tropical forests. Ecol. Model. 2016, 326, 124–133. [Google Scholar] [CrossRef]
  48. Malhi, Y.; Aragao, L.; Galbraith, D.; Huntingford, C.; Fisher, R.; Zelazowski, P.; Sitch, S.; McSweeney, C.; Meir, P. Exploring the likelihood and mechanism of a climate-change-induced dieback of the Amazon rainforest. Proc. Natl. Acad. Sci. USA 2009, 106, 20610–20615. [Google Scholar] [CrossRef]
  49. Qie, L.; Lewis, S.L.; Sullivan, M.J.P.; Lopez-Gonzalez, G.; Pickavance, G.C.; Sunderland, T.; Ashton, P.; Hubau, W.; Abu Salim, K.; Aiba, S.; et al. Long-term carbon sink in Borneo’s forests halted by drought and vulnerable to edge effects. Nat. Commun. 2017, 8, 1966. [Google Scholar] [CrossRef]
  50. Schmidt, M.; Jochheim, H.; Kersebaum, K.C.; Lischeid, G.; Nendel, C. Gradients of microclimate, carbon and nitrogen in transition zones of fragmented landscapes—A review. Agric. For. Meteorol. 2017, 232, 659–671. [Google Scholar] [CrossRef]
  51. Ding, L.; Lu, J.; Xu, G.; Wu, J. Effects of ecological protection and development on landscape pattern in the Thousand-Island Lake region, Zhejiang Province. Biodivers. Sci. 2004, 12, 473. [Google Scholar]
  52. Ren, G.; Young, S.S.; Wang, L.; Wang, W.; Long, Y.; Wu, R.; Li, J.; Zhu, J.; Yu, D.W. Effectiveness of China’s national forest protection program and nature reserves. Conserv. Biol. 2015, 29, 1368–1377. [Google Scholar] [CrossRef] [PubMed]
  53. Lu, B.; He, Y.H. Species classification using Unmanned Aerial Vehicle (UAV)-acquired high spatial resolution imagery in a heterogeneous grassland. ISPRS J. Photogramm. Remote Sens. 2017, 128, 73–85. [Google Scholar] [CrossRef]
  54. Xiao, X.M.; Hollinger, D.; Aber, J.; Goltz, M.; Davidson, E.A.; Zhang, Q.Y.; Moore, B. Satellite-based modeling of gross primary production in an evergreen needleleaf forest. Remote Sens. Environ. 2004, 89, 519–534. [Google Scholar] [CrossRef]
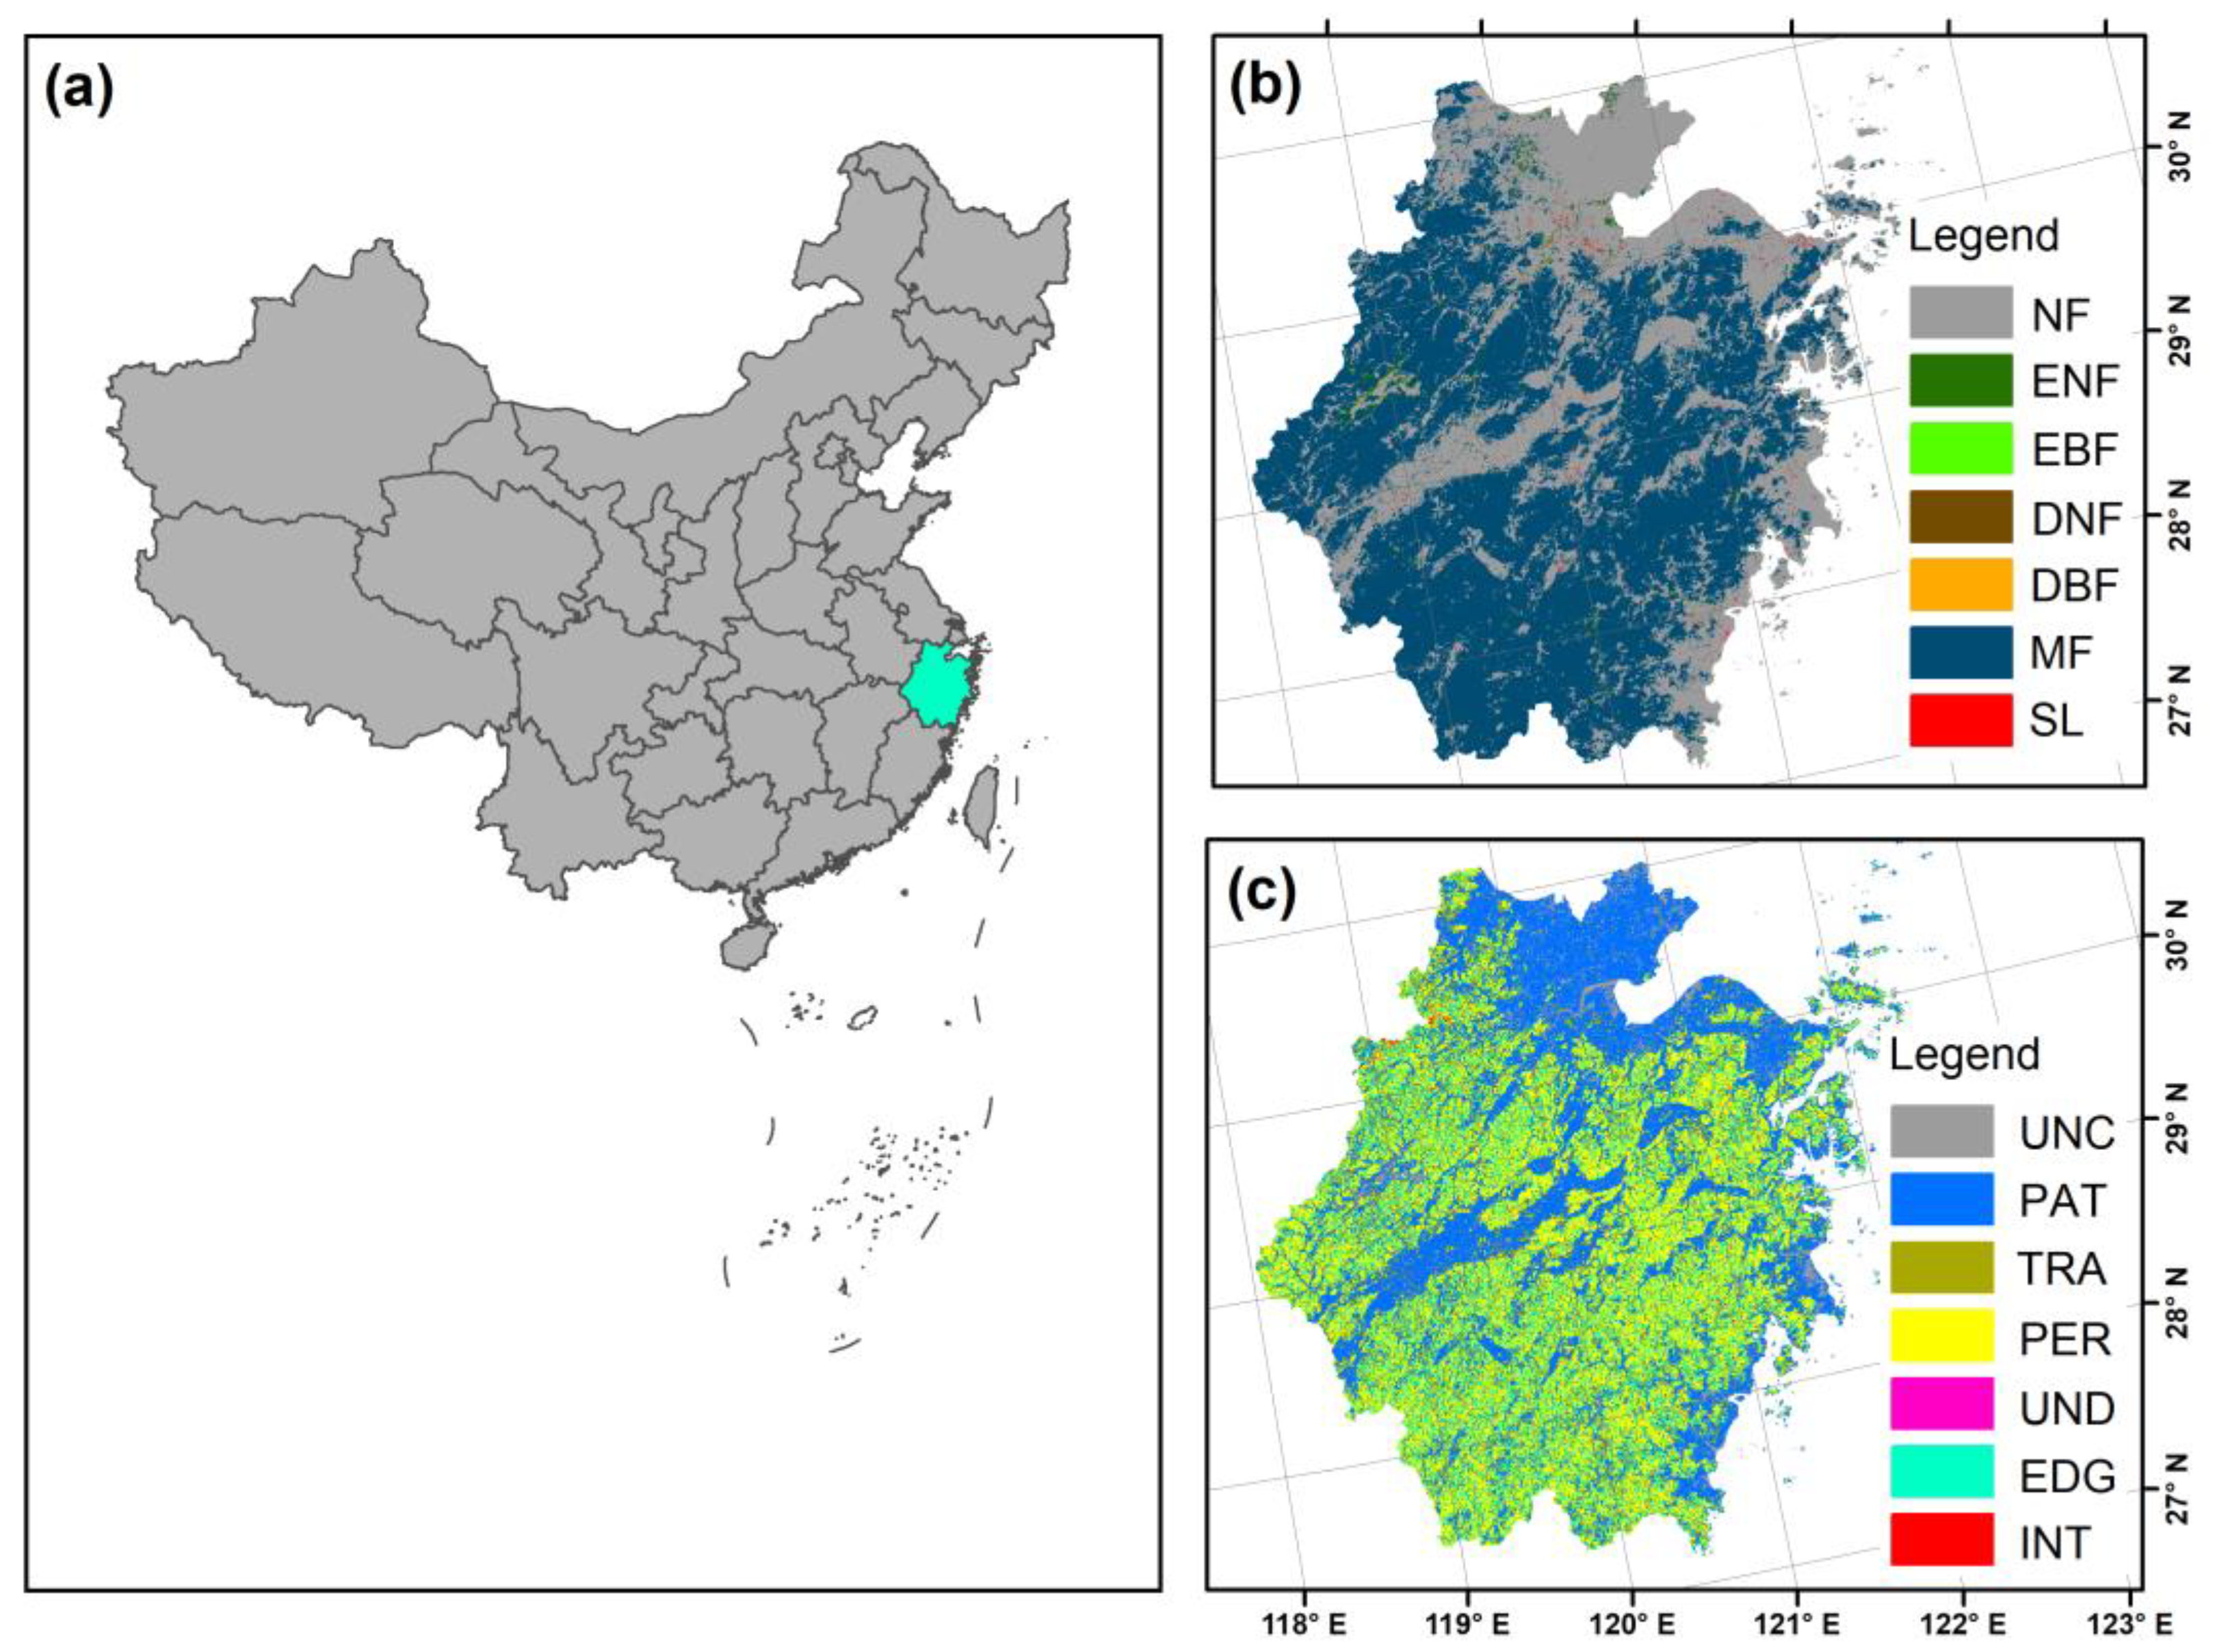
Figure 1. Location, forest type distribution, and classified forest fragmentation levels of forest landscapes in Zhejiang, China. (a) The location of Zhejiang, China. (b) Distribution of main forest types in Zhejiang. (c) Forest fragmentation levels in Zhejiang. UNC: unclassified forest, PAT: patch forest, TRA: transitional forest, PER: perforated forest, UND: undetermined forest, EDG: edge forest, INT: interior forest. The forest type data were derived from the MODIS MCD12Q1 land cover product (from 2010), while the map of fragmentation levels was calculated using the forest fragmentation model (see Section 2.2) in this study.
Remotesensing 16 02393 g001
Figure 2. (a) Annual GPP dynamics of different fragmentation levels and (b) linear trend distribution of annual GPP of forest landscapes in Zhejiang between 2000 and 2018, and the comparison of the annual GPP trend values among different fragmentation levels. The red asterisk indicates the annual GPP trend of PAT is significantly (p < 0.05) than that of other fragmentation categories. PAT: patch forest, TRA: transitional forest, PER: perforated forest, EDG: edge forest, and INT: interior forest.
Remotesensing 16 02393 g002
Figure 3. Distribution of different control variables and their relative importance. (a) Spatial distribution of different control variables, (b) spatial distribution of their relative importance on annual GPP during 2000–2018, (c) comparison of relative importance among three control variables, and (d) pixel number percentages of three control variables for different fragmentation levels. PAT: patch forest, TRA: transitional forest, PER: perforated forest, EDG: edge forest, and INT: interior forest.
Remotesensing 16 02393 g003
Figure 4. Spatial distribution of the mean values of carbon uptake period (CUP) and maximum daily GPP (GPPmax) for subtropical forest landscapes in Zhejiang Province during 2000–2018. (a) The spatial map of the mean CUP during 2000–2018. (b) The spatial map of the mean GPPmax during 2000–2018.
Remotesensing 16 02393 g004
Table 1. Classification criteria, area, and area percentage of each forest fragmentation level of the forest fragmentation model in forest landscapes in Zhejiang, China. PAT: patch forest, TRA: transitional forest, PER: perforated forest, UND: undetermined, EDG: edge forest, and INT: interior forest.
Fragmentation
Categories
Classification
Criteria
Area
(104 ha)
Area Percentage (%)
PATPf < 0.4263.033.7
TRA0.4 < Pf < 0.6129.516.6
PER0.6 <= Pf < 1 and Pf > Pff226.128.9
UND0.6 <= Pf < 1 and Pf = Pff0.70.1
EDG0.6 <= Pf < 1 and Pf < Pff153.019.6
INTPff = 19.01.2
Table 2. Comparison of mean annual GPP and mean normalized annual GPP among different forest fragmentation categories for 2000 and 2018. The mean normalized annual GPP was calculated as the ratio of the mean annual GPP to the proportion of forest pixels in a forest landscape. The characters indicate the results of multiple comparisons between any two categories. PAT: patch forest, TRA: transitional forest, PER: perforated forest, EDG: edge forest, and INT: interior forest.
Fragmentation CategoriesMean Annual GPP (g C m−2)Mean Normalized Annual GPP (g C m−2)
2000201820002018
PAT1040.4 ± 319.1 a1101.6 ± 449.4 a11,611.3 ± 17,514.1 d11,337.4 ± 16,718.4 d
TRA1268.7 ± 256.4 b1516.8 ± 351.1 b2979.0 ± 4071.6 c3505.2 ± 4629.4 c
PER1366.5 ± 193.1 bc1643.4 ± 231.5 bc1870.6 ± 1276.2 b2246.4 ± 1487.0 b
EDG1349.8 ± 202.4 bc1635.2 ± 246.3 bc2199.1 ± 2681.0 b2656.5 ± 3158.8 b
INT1421.4 ± 197.6 c1693.9 ± 213.9 c1657.0 ± 1222.9 a1972.6 ± 1478.9 a
Table 3. Comparisons of mean CUP, mean GPPmax, and mean CUP × GPPmax of forest landscapes in Zhejiang among different fragmentation categories during 2000–2018. The characters indicate the results of multiple comparisons between any two categories. PAT: patch forest, TRA: transitional forest, PER: perforated forest, EDG: edge forest, and INT: interior forest.
Fragmentation CategoriesCUP (days)GPPmax (g C m−2 day−1)CUP × GPPmax
PAT256.1 ± 73.4 a8.7 ± 2.2 a2339.4 ± 949.7 a
TRA310.7 ± 49.7 b9.6 ± 1.6 b3041.2 ± 737.1 b
PER329.8 ± 28.5 b10.2 ± 1.3 bc3369.1 ± 548.5 c
EDG327.8 ± 30.3 b10.1 ± 1.3 bc3320.6 ± 551.2 bc
INT332.9 ± 28.1 b10.7 ± 1.5 c3547.7 ± 524.7 d
Disclaimer/Publisher’s Note: The statements, opinions and data contained in all publications are solely those of the individual author(s) and contributor(s) and not of MDPI and/or the editor(s). MDPI and/or the editor(s) disclaim responsibility for any injury to people or property resulting from any ideas, methods, instructions or products referred to in the content.