Article

Comparison of the Water Vapor Budget Evolution of Developing and Non-Developing Disturbances over the Western North Pacific

1
School of Atmospheric Sciences, Sun Yat-sen University, and Southern Marine Science and Engineering Guangdong Laboratory (Zhuhai), Zhuhai 519082, China
2
Key Laboratory of Tropical Atmosphere-Ocean System, Ministry of Education, Sun Yat-sen University, Zhuhai 519082, China
*
Author to whom correspondence should be addressed.
Remote Sens. 2024, 16(13), 2396; https://doi.org/10.3390/rs16132396
Submission received: 24 May 2024 / Revised: 25 June 2024 / Accepted: 27 June 2024 / Published: 29 June 2024

Abstract

:
Tropical cyclone (TC) genesis prediction remains a major operational challenge. Using multiple satellite datasets and a state-of-the-art reanalysis dataset, this study identifies developing and non-developing tropical disturbances over the western North Pacific from June to November of 2000–2019 and conducts composite analyses of their water vapor budget components and relevant dynamic–thermodynamic parameters in the Lagrangian framework following three-day disturbance tracks. Both groups of disturbances have a similar initial 850 hPa synoptic-scale relative vorticity, while the water vapor budget of developing disturbances exhibits distinct stage-wise evolution characteristics from non-developing cases. Three days prior to TC genesis, developing cases are already associated with significantly higher total precipitable water (TPW), vertically integrated moisture flux convergence (VIMFC), and precipitation, of which TPW is the most important parameter to differentiate two groups of disturbances. One day later, all the water vapor budget components (i.e., TPW, VIMFC, precipitation, and evaporation) strengthened, linked with the enhancement of the mid-to lower-tropospheric vortices. A negative radial gradient of evaporation occurs, suggesting the beginning of the wind−evaporation feedback. On the day prior to TC genesis, the water vapor budget components, as well as the mid-to lower-tropospheric vortices, continue to intensify, eventually leading to TC genesis. By contrast, non-developing disturbances are associated with a drier environment and weaker VIMFC, precipitation, and evaporation during the three-day evolution. All these factors are not favorable for the intensification of the mid-to lower-tropospheric vortices; thus, the disturbances fail to upgrade to TCs. The results may shed light on TC genesis prediction.

1. Introduction

Tropical cyclone (TC) genesis is a series of complicated multiple-scale physical processes affected by both external and internal factors; therefore, understanding and the predictability of TC’s genesis remains one of the most difficult and critical issues in atmospheric sciences [1,2]. TCs are generated from pre-existing synoptic-scale disturbances over the tropical oceans, e.g., [3,4,5]. Tropical disturbances can be categorized into developing and non-developing disturbances based on whether they develop into TCs or not. The western North Pacific (WNP), the most active basin for TCs, accounts for nearly one-third of global TCs [6]. This basin is remarkably affected by the East Asian summer monsoon, subtropical high, and intertropical convergence zone, which is associated with the largest warm pool in the world. Various weather systems like synoptic-scale wave train disturbances, e.g., [7], easterly waves, e.g., [8], monsoon troughs, e.g., [9,10], and tropical equatorial waves, e.g., [11,12,13,14], can all serve as precursors for TCs and modulate TC genesis through complex dynamic–thermodynamic processes.
TC’s genesis fundamentally requires two primary phases: (1) the formation of a large-scale environment favorable for genesis and (2) the formation of an inner core in which mesoscale processes largely contribute to circulation intensification [15]. Numerous studies have investigated necessary large-scale environmental factors, e.g., [6,16,17,18], and circulation patterns, e.g., [7,19,20], favorable for TC genesis, while the evolution of mesoscale vortex development in the inner core is more controversial. In recent decades, two primary viewpoints have emerged as central to the discussion of TC genesis. One view suggests that the transition is due to the merging and downward extension of the mid-level vortex generated from the stratiform rain of the mesoscale convective system in the middle troposphere, i.e., a “top-down” theory [21,22]. Another variation, the “top-down showerhead” theory, was developed by Bister & Emanuel [23], who proposed that the establishment of a cool, moist environment induced by stratiform rain acts as the incubation region for the generation of a low-level, warm-core cyclonic vortex. On the contrary, “bottom-up” development highlights the influence of deep convection and the associated vorticity increase in TC’s genesis [24,25,26,27]. The “critical layer” theory from a Lagrangian view was also proposed to interpret the multi-scale interactions of the TC genesis processes [28,29,30]. All these viewpoints emphasize moist convection aggregation, increment, and organizations associated with the development of mesoscale vortices. Recently, Wu and Fang [31] counted the percentage of three types of initial mesoscale vortices that developed into TCs in the WNP and found that low-level vortices had the highest TC genesis efficiency.
As a main driving force, moist convection plays a key role in TC genesis [32,33]. It is widely agreed that the inner-core column should exhibit moistening and approach near-saturation during genesis [33,34,35,36]. Under moist conditions, convection is more active, and precipitation increases, associated with the intensification of cyclonic circulation. Wang [33] found that the meso-β area near the pouch center is characterized by a high saturation fraction, a slight disparity in equivalent potential temperature between the surface and the middle troposphere, and a short incubation time; all these conditions promote vigorous convection. Using dropsonde data, Zawislak and Zipser [37] found that developing disturbances exhibited higher mid-level humidity associated with mid-to-upper tropospheric warm temperature anomalies and stabilization, while non-developing disturbances became gradually drier and more convectively unstable.
Although previous studies have suggested that moistening of the middle and lower troposphere is a crucial precondition of TC genesis, e.g., [38], there are different viewpoints on the method of moistening. The water vapor budget analysis can serve as an effective way to investigate this process and to reveal the dynamic and thermodynamic mechanisms of TC genesis. Fritz and Wang [35] explored the water vapor budget of a hurricane through numerical simulation and found that horizontal moisture flux convergence dominates the total condensation while evaporation shows negligible contribution during the pre-genesis stage. However, in the numerical simulation of a typhoon, Zhuo et al. [39] found that evaporation is essential for TC genesis regardless of its relatively small fractional contribution to the total water vapor budget during the formation of Super Typhoon Megi (2010). Moreover, they found that pre-Megi failed to develop into a tropical depression when the wind−evaporation feedback was turned off. In addition, the water vapor budget components, such as precipitation and evaporation in the pre-genesis stage, have been investigated individually in a few observational and numerical studies. Using idealized simulations, Murthy and Boos [40] suggested that a negative radial gradient of evaporation was important for TC genesis, which was confirmed by observational studies [41,42]. Peng et al. and Fu et al. [3,5] showed that precipitation is crucial for TC genesis. Fritz et al. and Wang et al. [43,44] further found that stratiform and convective precipitation jointly contributed to TC genesis.
Due to the lack of a high-spatiotemporal resolution satellite and reanalysis datasets, there have been limited observational studies on water vapor budget in the pre-genesis stage, and, in particular, the relative and joint effects of various water vapor components on TC genesis remain controversial. Thus, by comparing the evolution features of water vapor budget components and associated dynamic−thermodynamic features of developing and non-developing tropical disturbances using state-of-the-art satellite and reanalysis datasets, this study aims to reveal the collaborative impacts of water vapor budget components on TC genesis over the WNP.
The remainder of the paper is organized as follows. Section 2 describes the data and methods. Section 3 introduces the basic characteristics of developing and non-developing disturbances. A comparison of the evolution of the water vapor budget for two groups of disturbances is presented in Section 4. Section 5 gives the conclusions and discussion.

2. Materials and Methods

2.1. Data

In this study, 3-hourly TC information, including center position and maximum sustained wind speed, was taken from the Joint Typhoon Warning Center (JTWC) data in the National Oceanic and Atmospheric Administration (NOAA)’s International Best Track Archive for Climate Stewardship (IBTrACS) version 4 [45].
The 3 hourly meteorological parameters, such as wind, specific humidity, temperature, divergence, and relative vorticity, were derived from the fifth generation of the European Centre for Medium-Range Weather Forecast (ECMWF) reanalysis (ERA5) dataset [46] on a 0.25° × 0.25° longitude–latitude grid. Previous studies have demonstrated that ERA5 shows better performance in reproducing TC activities than low-resolution products [47].
Sea surface latent heat flux, which is used to calculate evaporation, is adapted from the Ocean Heat Fluxes Climate Data Record (CDR) of the NOAA Ocean Surface Bundle [48]. This dataset computes turbulent heat flux using a neural network emulator derived from the Coupled Ocean Atmosphere Response Experiment (COARE) Bulk Air–Sea Flux Algorithm. This emulator comprises two hidden layers, with 83 and 20 neurons, respectively. Sea surface temperature (SST) CDR [49] and ocean near-surface atmospheric properties CDR [50] are also used for analyses. The CDR bundle primarily relies on data from the Special Sensor Microwave/Imager (SSM/I), the Special Sensor Microwave/Imager Sounder (SSMIS), and the Advanced Very High-Resolution Radiometer (AVHRR). All three datasets have 3-hourly and 0.25° × 0.25° resolutions. One limitation of CDRs is that an upper limit of wind speed is set to 45 m s–1 due to the availability of the training observation data [48]. However, we focus on the pre-genesis stage, and sea surface winds are well below the limit, so our results are not affected.
Precipitation is taken from version 7 of the Tropical Rainfall Measuring Mission (TRMM) 3B42 V7 product [51], which has 3-hourly and 0.25° × 0.25° resolutions with coverage from 50° S to 50° N. TRMM is a collaborative satellite mission between the United States and Japan, specifically designed to monitor tropical and subtropical precipitation patterns. Launched in late November 1997, it initially entered a circular orbit at an altitude of approximately 350 km, which was later raised to 420 km in 2001, with an inclination of 35° from the equatorial plane. Completing one orbit around the Earth takes approximately 91 min. TRMM offers a variety of products for diverse user needs, which is achieved through a combination of various satellite sensors. Our study period spans from 2000 to 2019, during which all of the above datasets are available.

2.2. Identification of Developing and Non-Developing Disturbances

To eliminate the effects of land and exclude extratropical cyclones, our study domain is confined to 5°–20° N and 130°–180° E (Figure 1). In addition, we only focused on TC peak seasons from June to November [52]. Detection algorithms similar to Peng et al. [5] were conducted to identify two groups of disturbances, using TC best-track data and 3–8-day-filtered 850 hPa wind and relative vorticity. The first group includes disturbances that develop into at least tropical depressions. Day 0 is defined as the time when a TC is first designated as a tropical depression with maximum sustained wind over 25 kt. Then, we trace the disturbance 3 days back, designated as days −1, −2, and −3, respectively. In some developing cases, disturbances undergo rapid intensification, limiting the traceable period to just 1 or 2 days before genesis.
The second group contains non-developing disturbances that fail to develop into tropical depressions. Similar to Peng et al. [5], we defined three criteria for identifying non-developing disturbances: (1) the radius of a cyclonic circulation over 400 km; (2) the maximum of a 3–8-day-filtered 850 hPa relative vorticity exceeding 10−5 s−1; (3) the satisfaction of the previous two criteria for a minimum of three successive days. Weak and short-lived disturbances were excluded accordingly. The record with the lifetime maximum synoptic relative vorticity for each non-developing disturbance was designated as day 0, consistent with Gao et al. [41].
A total of 171 developing disturbances and 134 non-developing disturbances were detected objectively. Composites of the water vapor budget components and relevant dynamic–thermodynamic parameters in 10° × 10° boxes around the disturbance center were performed on days −3, −2, −1, and 0 to investigate the differences between the two groups of disturbances.

2.3. Water Vapor Budget Equation

Integrating the total moisture tendency equation from PT (the pressure at the upper bound of the atmosphere) to PS (the pressure at the sea surface), we obtained the following:
T P W t = E + V I M F C P
where the left term is the tendency of column-integrated specific humidity (i.e., total precipitable water, TPW). The three terms on the right-hand side are evaporation, vertically integrated moisture flux convergence (VIMFC), and precipitation, respectively. TPW can be written as follows:
T P W = 1 g P T P S q d p
where g is the acceleration of gravity, q is the specific humidity, and p is the pressure. VIMFC is computed as follows:
V I M F C = 1 g · P T P S q V d p
where V is the horizontal wind vector.
Sea surface evaporation, which is equal to sea surface latent heat flux divided by the latent heat of vaporization, can be calculated using the bulk aerodynamic formula [53]:
E = ρ a C E U q s q a
where ρ a is the air density,   C E is the turbulent exchange coefficient for moisture, U   is 10 m wind speed, qs is 98% of the saturation specific humidity at the SST, and qa is the 10 m specific humidity.

2.4. Box Difference Index

To quantitatively compare water vapor budget components between two groups of disturbances and identify useful predictors for TC genesis, we used the box difference index (BDI, [5]):
B D I = M D E V M N O N D E V σ D E V + σ N O N D E V
where M D E V   and   σ D E V   ( M N O N D E V and σ N O N D E V ) represent the mean and standard deviation of the parameters for developing (non-developing) disturbances, respectively. The BDI magnitude quantifies the efficacy of a parameter in distinguishing between two groups of disturbances. A higher BDI value indicates that the parameter is more effective at predicting TC genesis.

3. Basic Characteristics of Disturbances

Figure 1 shows the tracking frequency of developing and non-developing disturbances as well as the climatological mean 850 hPa streamline during June–November of 2000–2019 over the tropical WNP. Two groups of disturbances are distributed in vast areas of the basin. The developing disturbances are concentrated in 132°–165° E, 6°–17° N. The distinct flow features, such as monsoon trough, monsoon confluence zone, and monsoon shear line, in this region, provide a favorable environment for TC genesis [3,8]. The non-developing disturbances are mainly distributed in 130°–162° E, 6°–13° N, partly overlapping with developing disturbances.
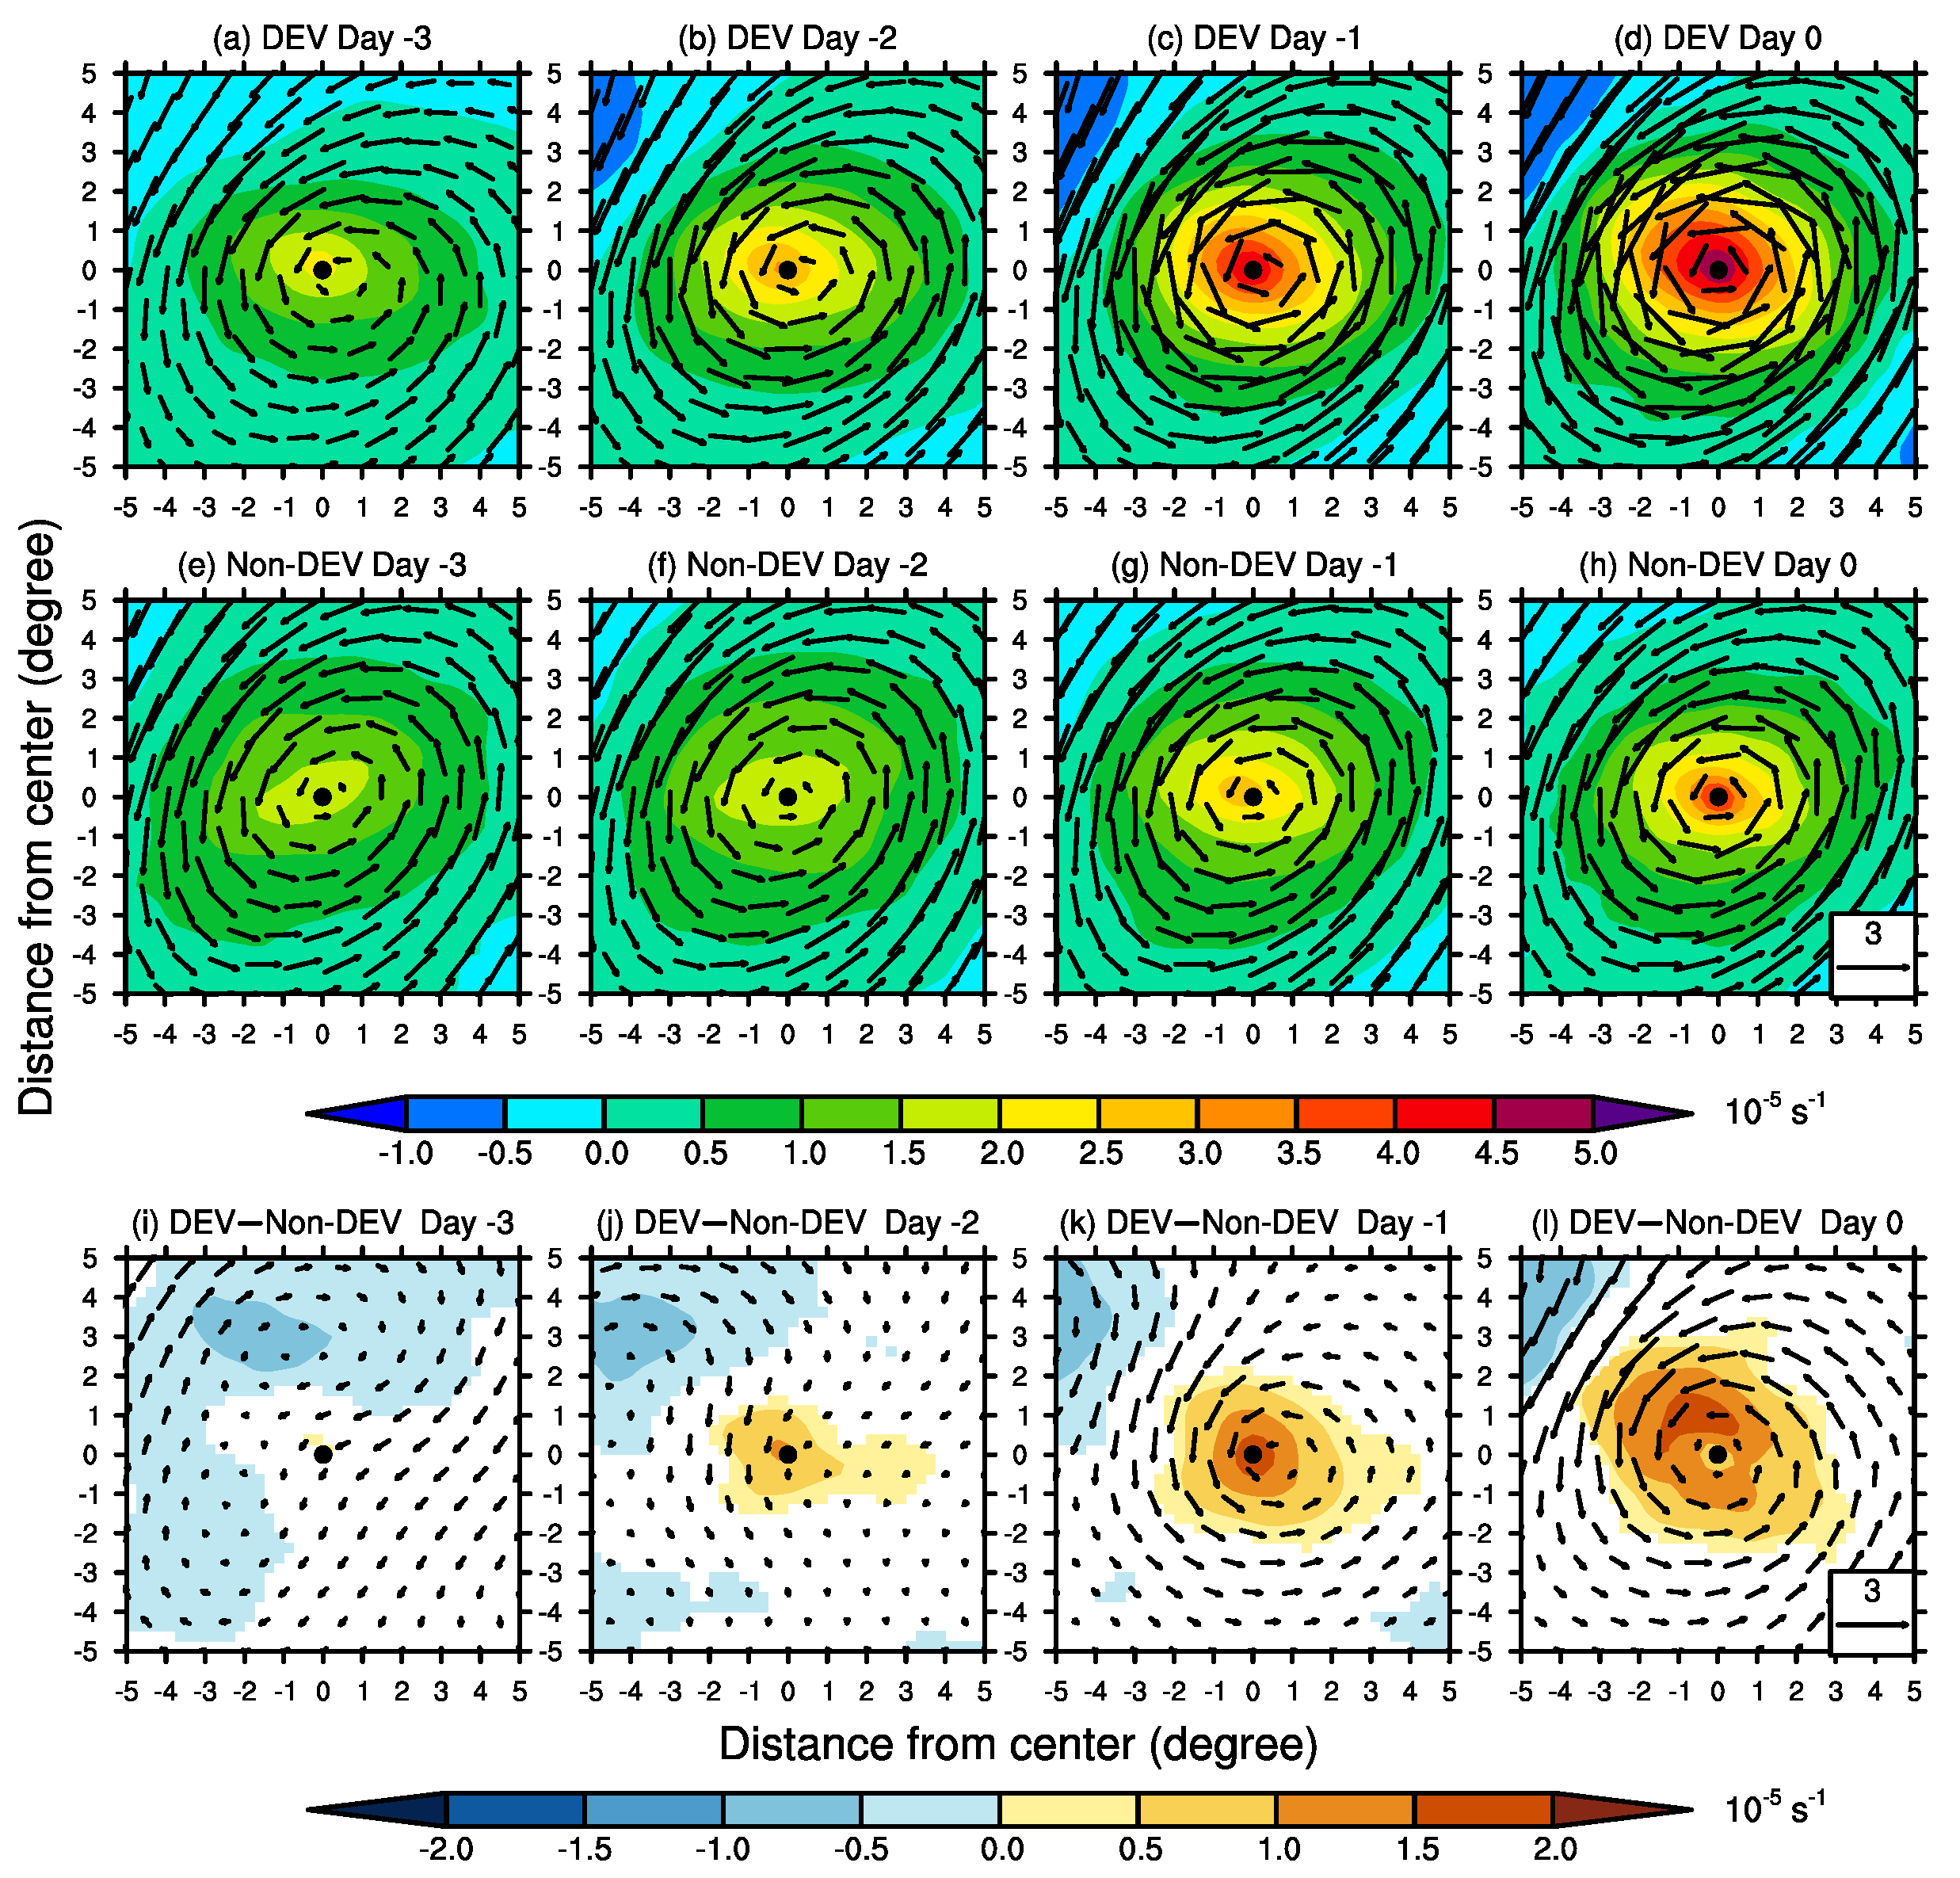
Figure 2 shows the evolution of 3–8-day-filtered 850 hPa wind and relative vorticity for developing and non-developing disturbances from day −3 to 0. On day −3, both groups of disturbances showed similar 850 hPa relative vorticity in the inner core (within 2° of the center), suggesting that TC genesis does not depend on the initial intensity of the precursor disturbances. Then, there was a gradual increase in vorticity for both groups, and developing cases intensified much faster and showed significantly larger vorticity in the inner core and more compact structures than non-developing cases from day −2 onward.
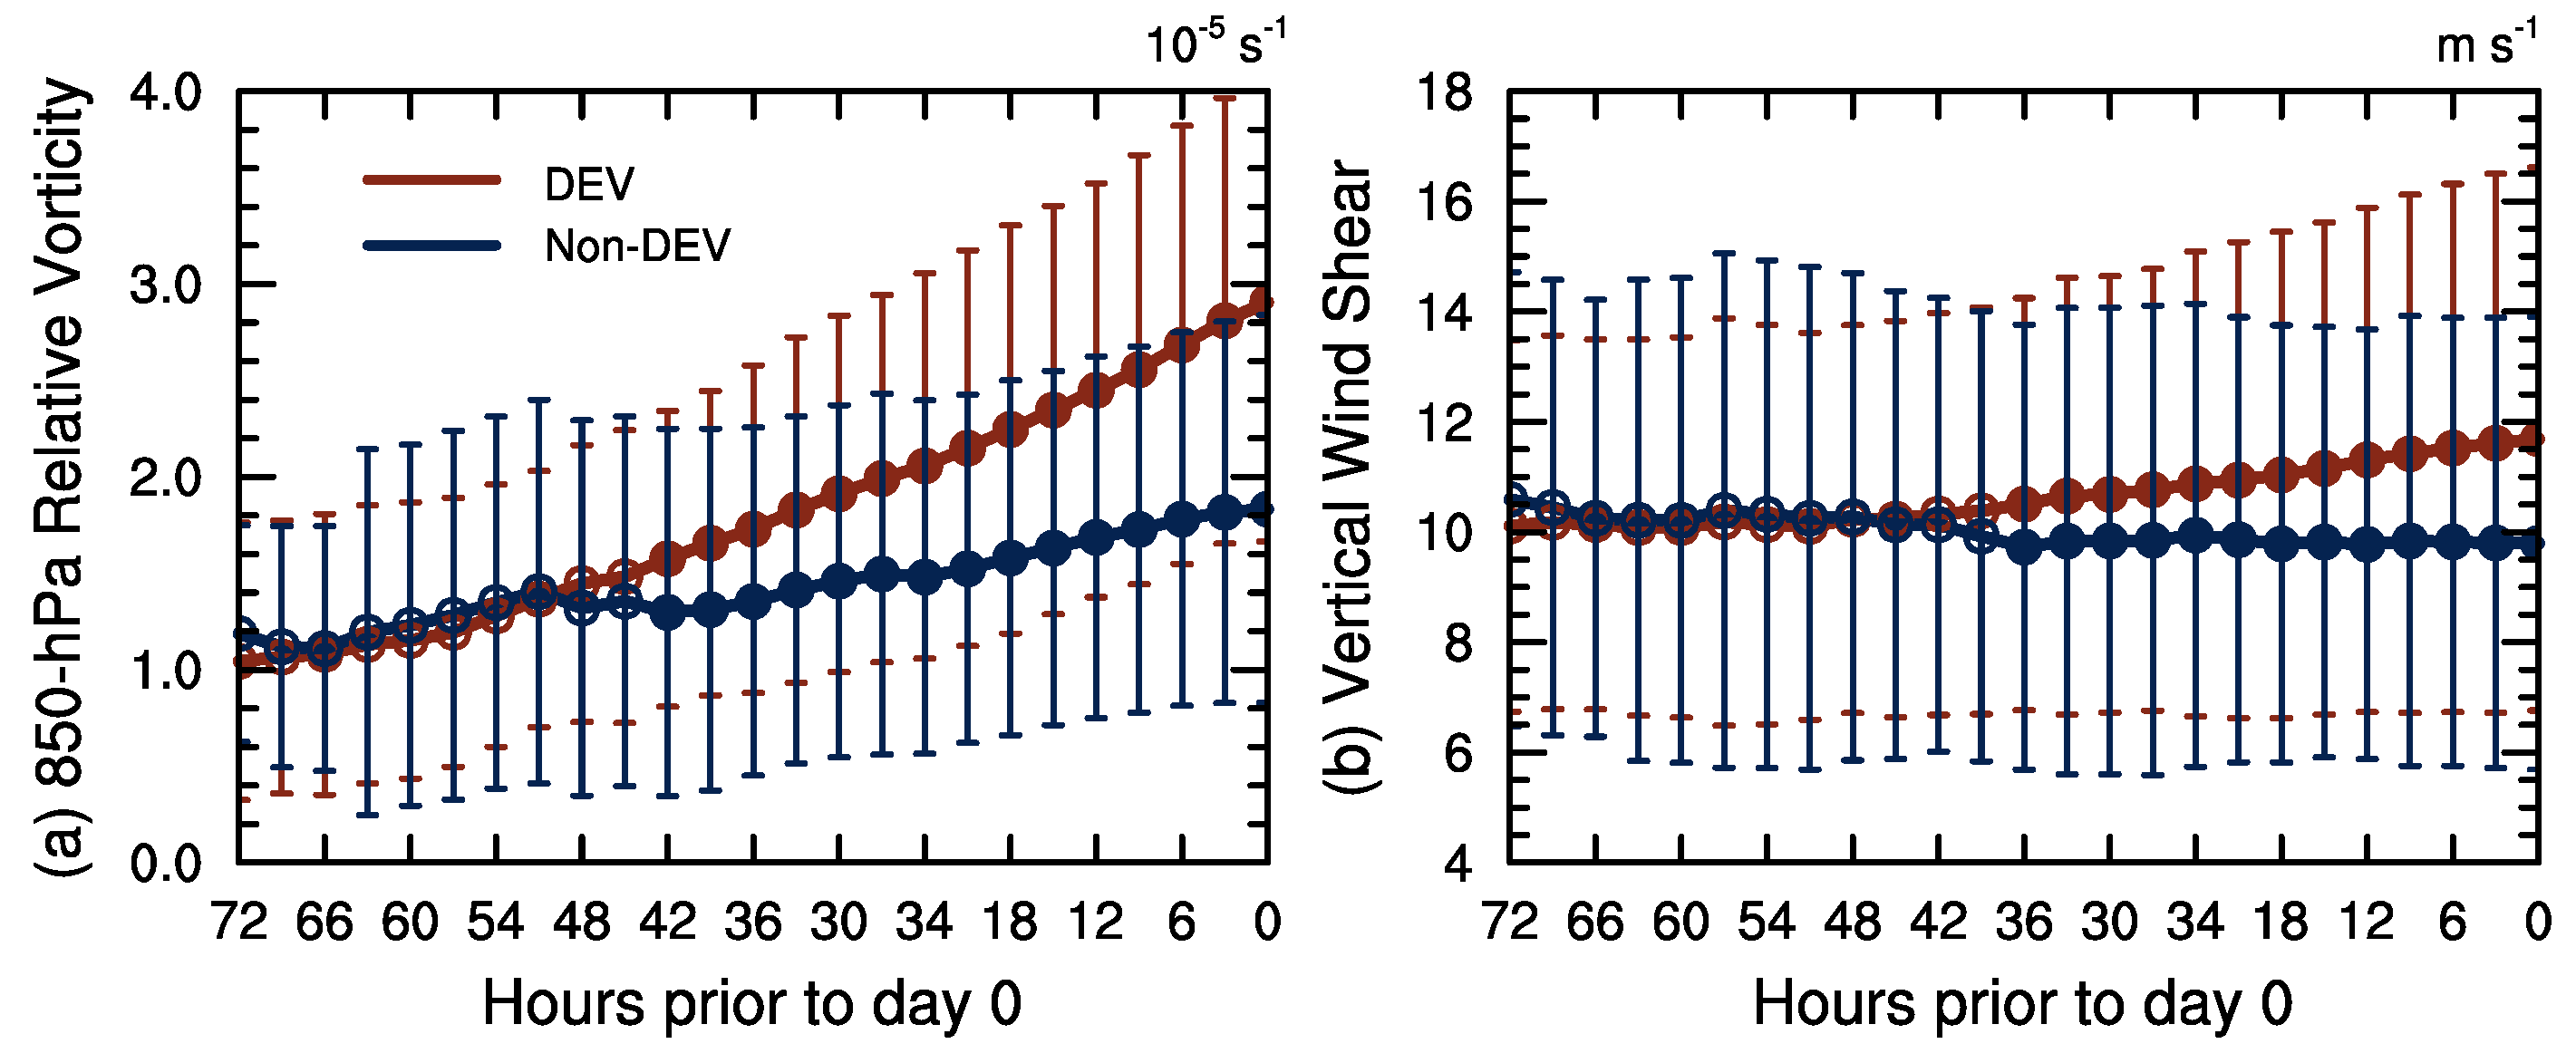
Figure 3 shows the time series of area-averaged 3–8-day-filtered 850 hPa relative vorticity within 2° of the centers and environmental (20-day low-pass-filtered) vertical wind shear between 200 and 850 hPa within 2°–8° of the centers for the developing and non-developing disturbances. The area for shear calculation is commonly used in previous studies, e.g., [41,54,55]. Two groups of disturbances show similar initial intensity and shear. The developing disturbances show a significantly larger inner-core vorticity 42 h before genesis (Figure 3a). Shear exhibits a slight increase in the developing disturbances and a slight weakening for the non-developing disturbances, and significant differences appeared 36 h before genesis (Figure 3b). As weaker shear is more favorable for TC genesis [6], this suggests that shear is not a key factor for the development of tropical disturbances over the WNP, consistent with previous studies [3,41]. There must be other factors regulating TC genesis, and we examine the roles of water vapor budget components in the next section.

4. Water Vapor Budget of Developing and Non-Developing Disturbances

4.1. TPW

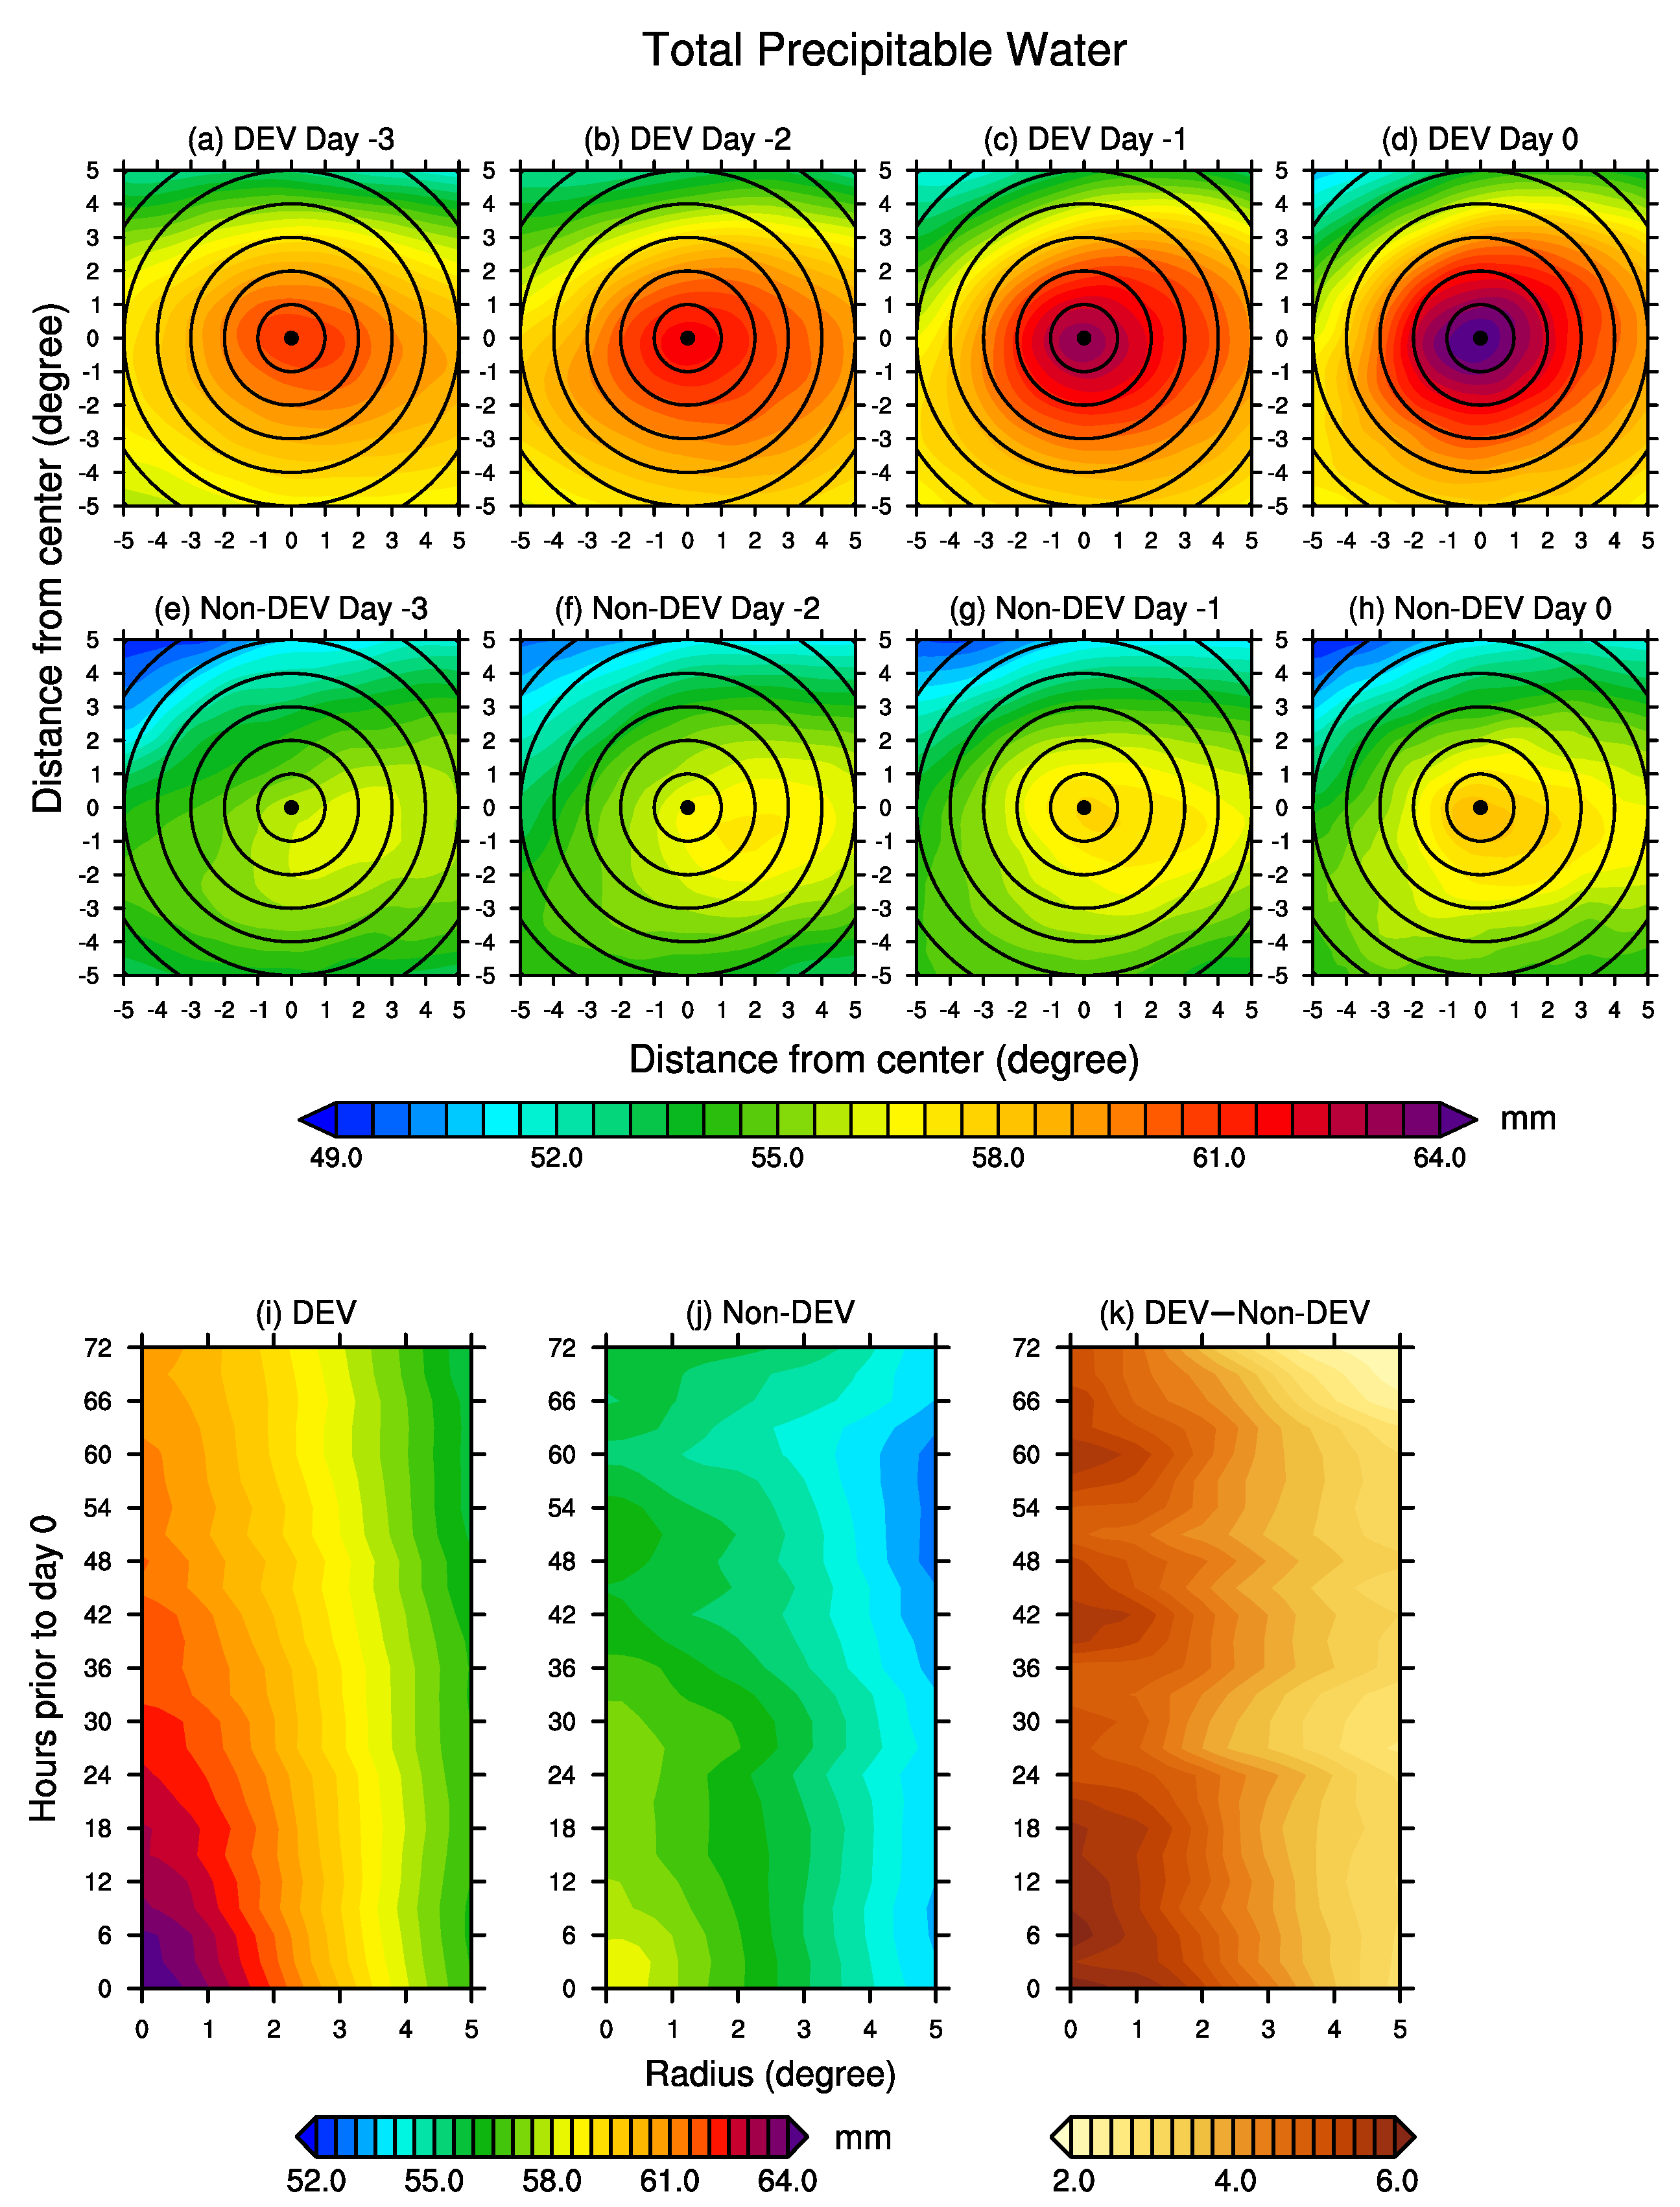
Figure 4 presents the composites of TPW and the corresponding radius–time Hovmöller plots for the two groups of disturbances as well as their differences. The developing cases exhibit a more axisymmetric moist-core structure, with a notable increase in TPW with time (Figure 4a–d,i). The initial TPW near the center is over 60 mm (Figure 4a), which is much higher than the moist tropical mean of 51.5 mm [56]. Then, the inner-core TPW continues to increase. On day −1, TPW in the whole inner-core region exceeds 60 mm (Figure 4c). The high TPW is favorable for TC genesis because it can promote convection and protect the disturbance core from dry air intrusion, e.g., [33]. However, the non-developing disturbances exhibit a small increasing tendency associated with dry air transport from the north (Figure 4e–h,j). TPW in both the inner core and outer core of the developing disturbances is significantly higher than the non-developing cases during the 3-day pre-genesis stage (Figure 4k).
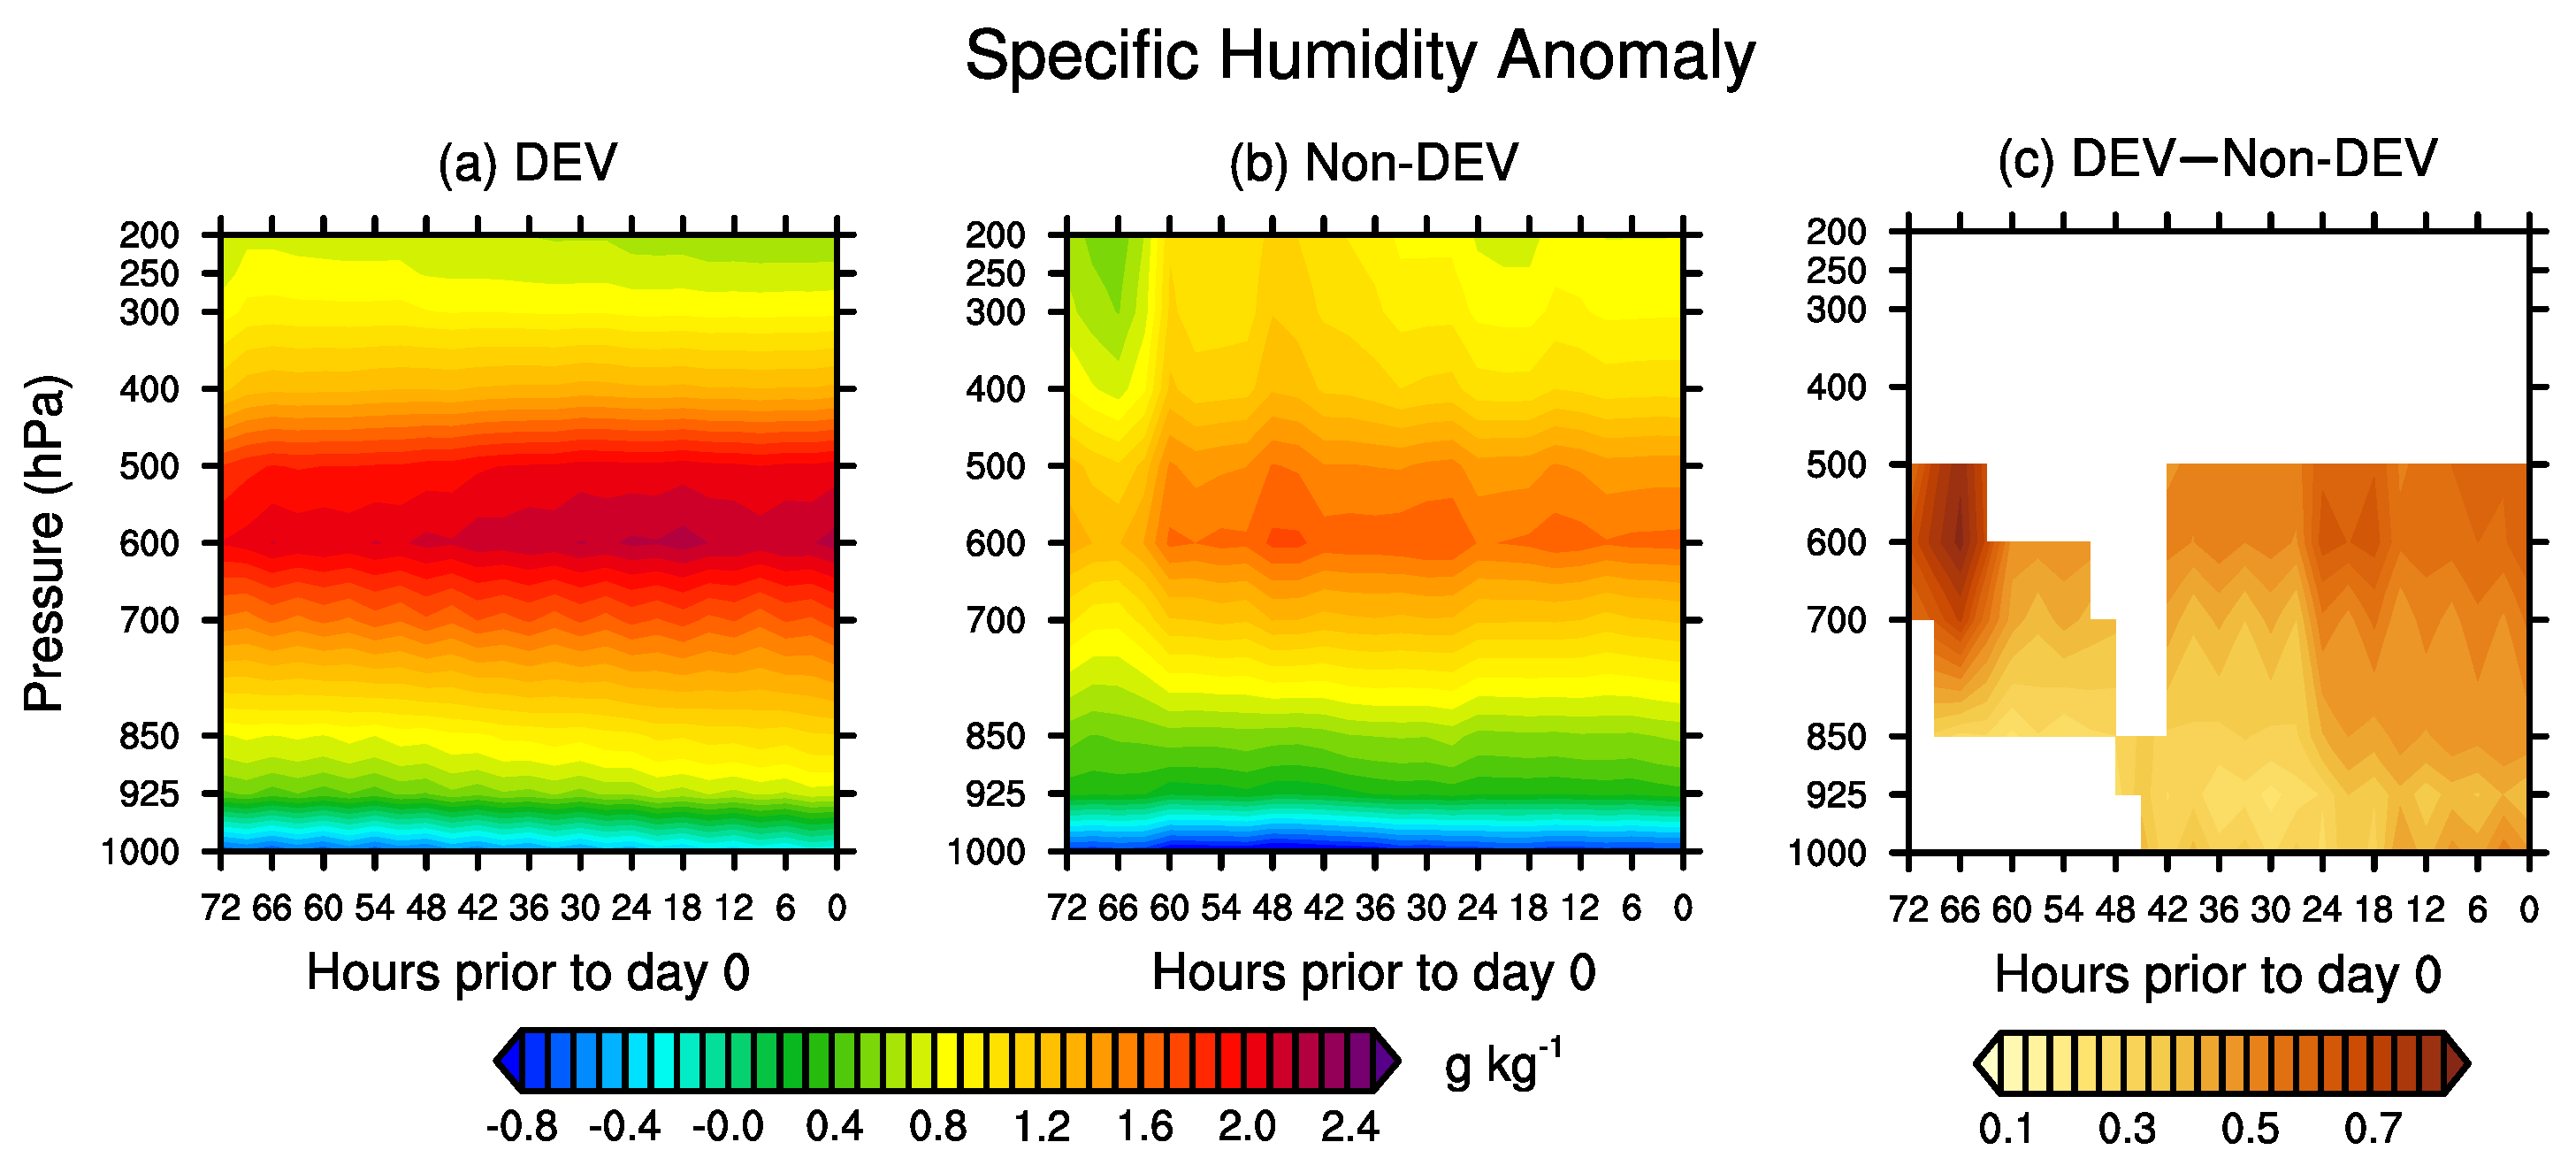
Figure 5 shows the temporal evolution of the vertical profile of specific humidity anomalies averaged in a 10° × 10° box and centered at two groups of disturbances and their differences. The significantly higher TPW for the developing disturbances (Figure 4k) is mainly attributed to the significantly higher mid-level moisture (Figure 5a,c), which is consistent with previous studies [37,57]. High mid-level humidity acts to reduce the strength of convective downdrafts and results in strong low-level convergence and spin-up [58,59].

4.2. Evaporation

Figure 6 shows the composite evaporation for the developing and non-developing disturbances as well as the corresponding radius–time Hovmöller plots and their differences. Initially, the two groups of disturbances show similar levels of evaporation (Figure 6a,e), and no significant differences exist on day −3 (Figure 6k). From day −2 to 0, evaporation of the developing disturbances obviously intensifies, and its maximum in the northeast quadrant begins to shrink inward, associated with an outward negative radial gradient (Figure 6b–d), and the differences from the non-developing disturbances become significant (Figure 6k). In comparison, the evaporation of the non-developing cases shows no clear tendency, and there is no prominent negative radial gradient during the 3 days. The negative radial gradient of evaporation necessary for TC genesis is consistent with previous studies [40,41,42]. It should be noted that, despite the statistically significant difference in evaporation between the two groups, its magnitude is relatively modest, remaining below 1 mm on day−1, even on day 0. Despite its modest magnitude, evaporation plays a crucial role in moistening the column when inner-core convection is inactive [35].
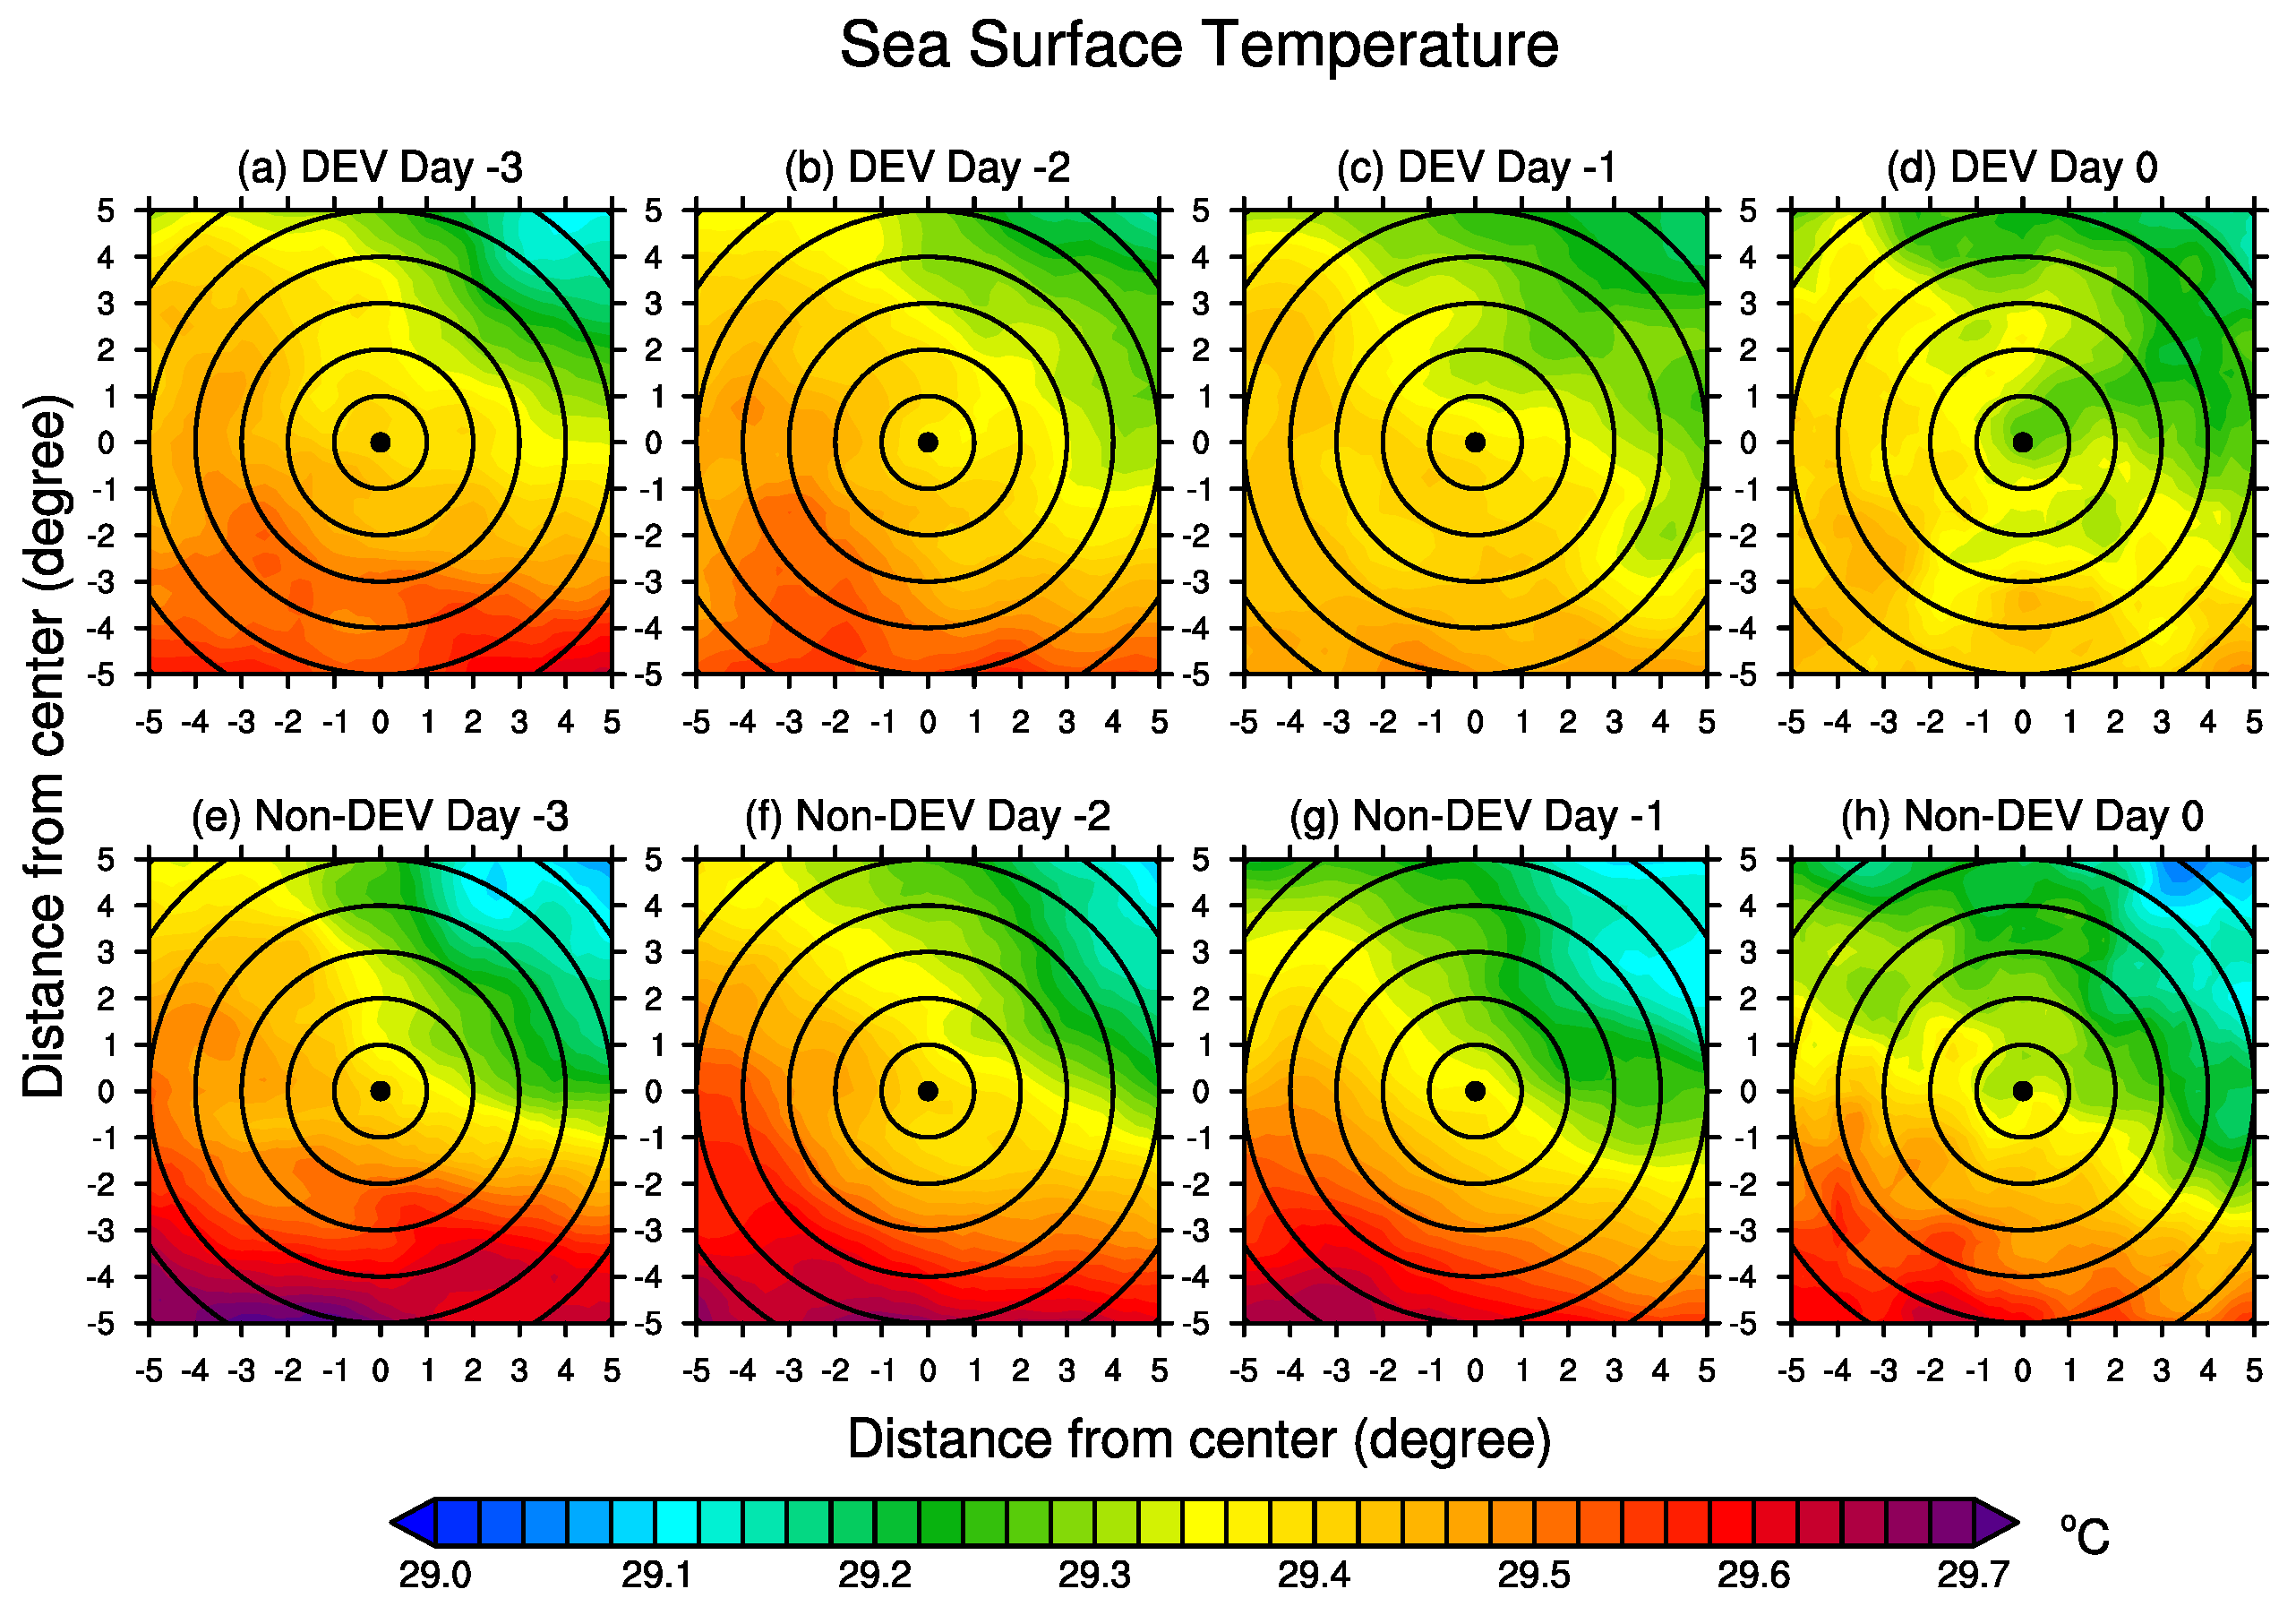
As shown in Equation (4), evaporation is proportional to SST and surface wind speed [54], which are then analyzed to examine what dominates the evolution of evaporation. Figure 7 shows the composites of SST for the developing and non-developing disturbances. SST shows a “southwest high−northeast low” spatial pattern for both groups of disturbances, with modest variations (Figure 7a–h) and no significant differences during the 3 days. SSTs surrounding the centers of two groups of disturbances are above 29 °C, which is much higher than the threshold of 26 °C for TC genesis [6]. The evolution features indicate that SST does not dominate the spatiotemporal evolution of evaporation.
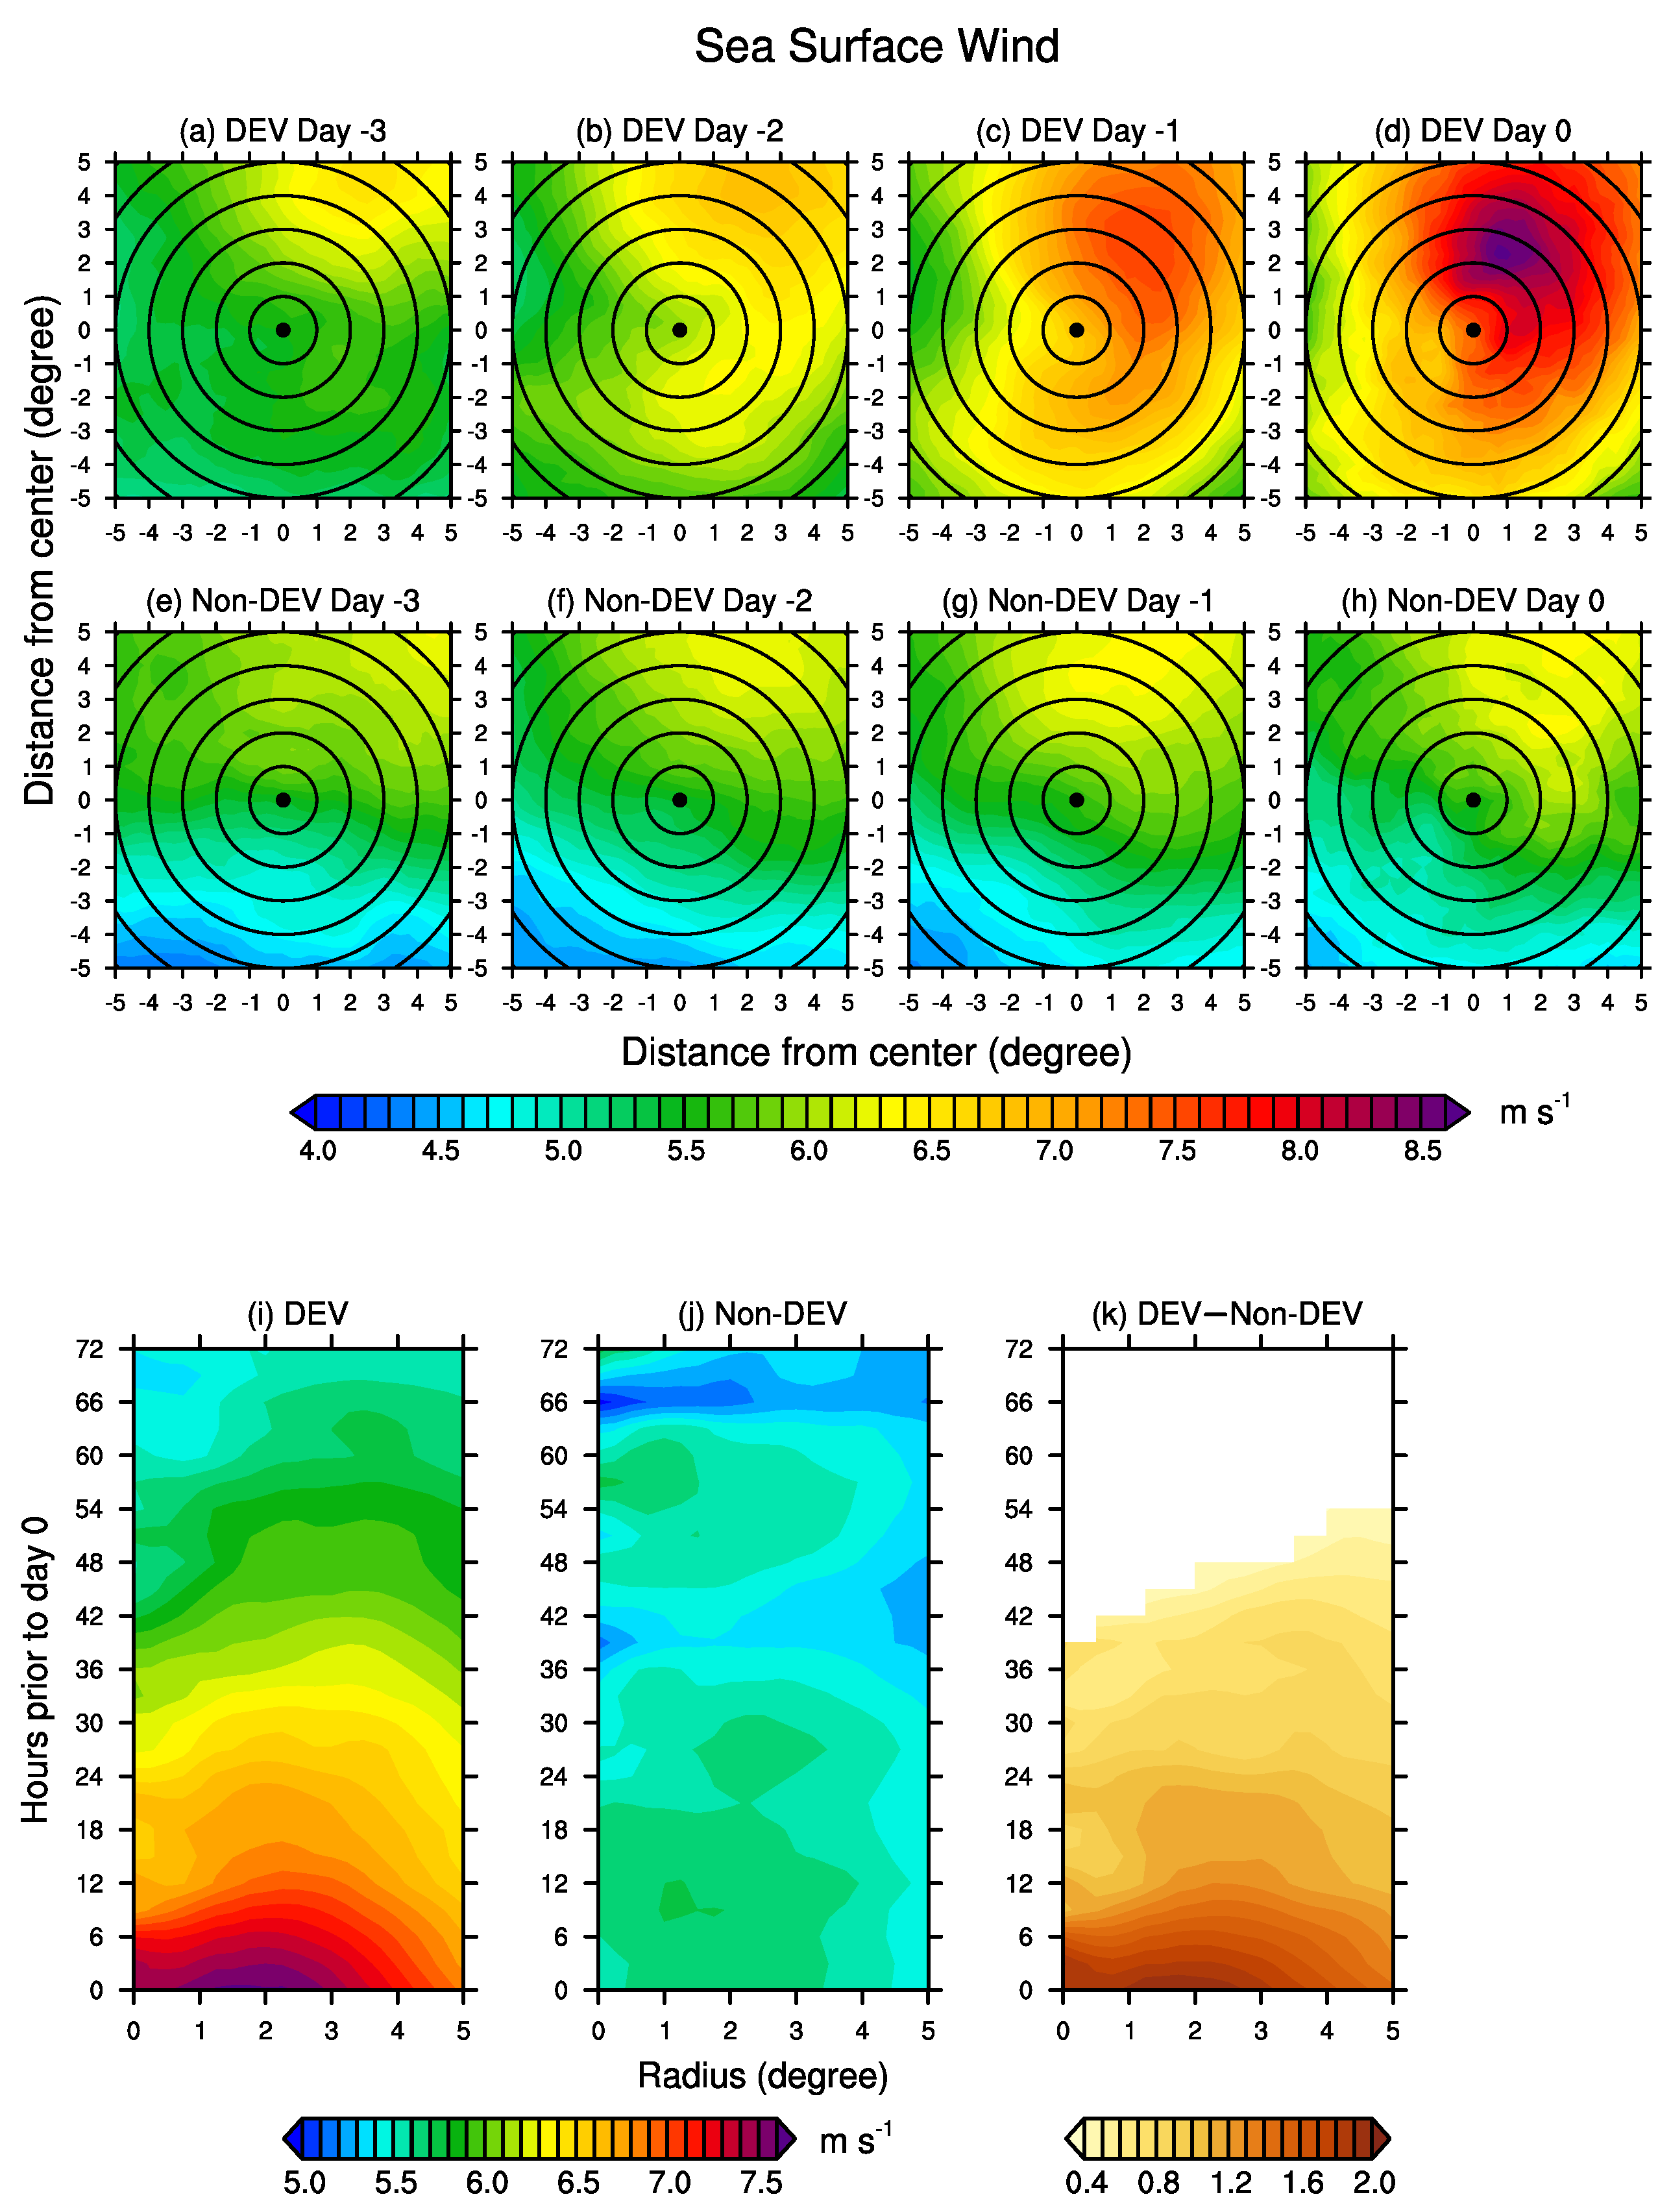
Figure 8 shows the composites of surface wind speed for the developing and non-developing disturbances and their differences. On day −3, although the developing disturbances show slightly higher surface wind speeds than the non-developing cases (Figure 8a,e,i,j), there are no significant differences between them (Figure 8k). The surface wind of the non-developing disturbances grows slowly afterward (Figure 8f–h,j), while the surface wind of the developing cases markedly intensifies from day −2 to 0, with a prominent inward propagation of the maximum, which results in a negative radial gradient in the outer core (Figure 8b–d,k). This increase in surface wind speed almost synchronizes with the increase in evaporation, and they have similar spatial variation characteristics, suggesting that surface wind speed dominates the evolution of evaporation.
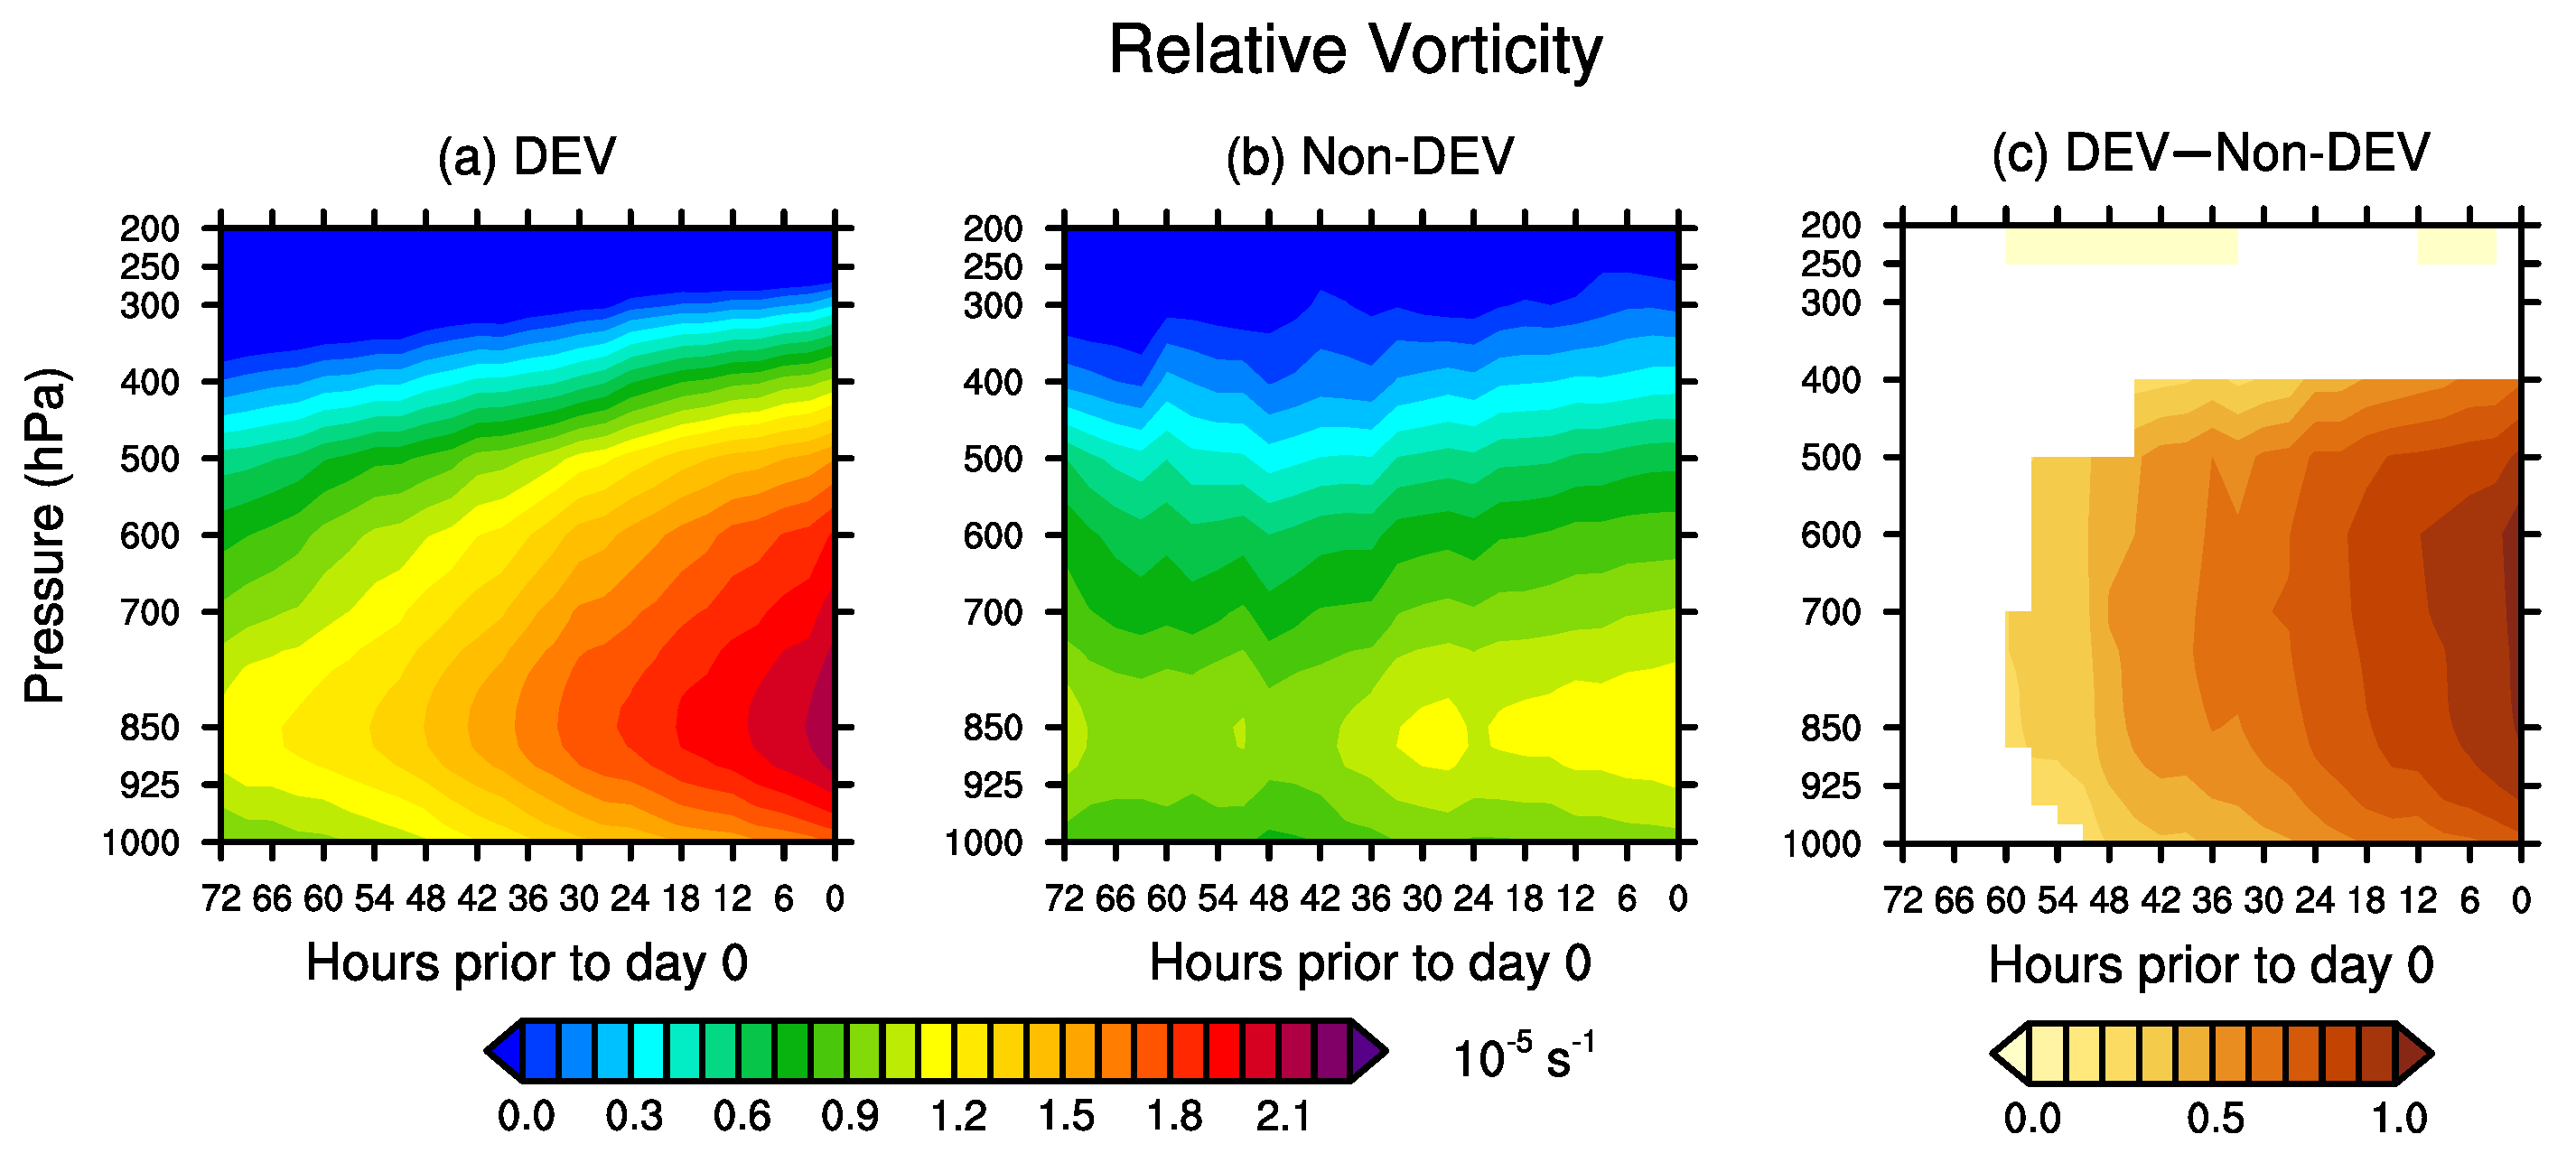
To more distinctly clarify the feedback between evaporation and cyclonic circulation and its evolution, we further investigated the temporal evolution of the vertical profile of relative vorticity averaged in a 10° × 10° box for the developing and non-developing disturbances and their differences (Figure 9). Although two groups of disturbances have comparable vorticity initially (Figure 9c), the developing disturbances show distinct vortex evolution pathways compared to the non-developing disturbances. In the early stage of genesis (day −3), the development of surface vortices is not prominent (Figure 9a); hence, the variation in evaporation is negligible (Figure 6a). In the second stage (day −2 to 0), the mid-to-lower level vorticity enhances simultaneously (Figure 9a), and the associated increase in surface wind speed leads to positive wind−evaporation feedback (Figure 6b–d and Figure 8b–d). For the non-developing disturbances, only the low-level vortices show a slowly increasing tendency (Figure 9b). In general, the vorticity evolution of the developing disturbances is likely a combination of “top-down” and “bottom-up” pathways, with the vortex maximum located at 850 hPa in the early stage, followed by overall sustained growth from the middle to lower troposphere, and finally, deep vortex forms. The vorticity evolution is somewhat consistent with previous studies based on field campaigns [37,60].

4.3. Moisture Flux Convergence

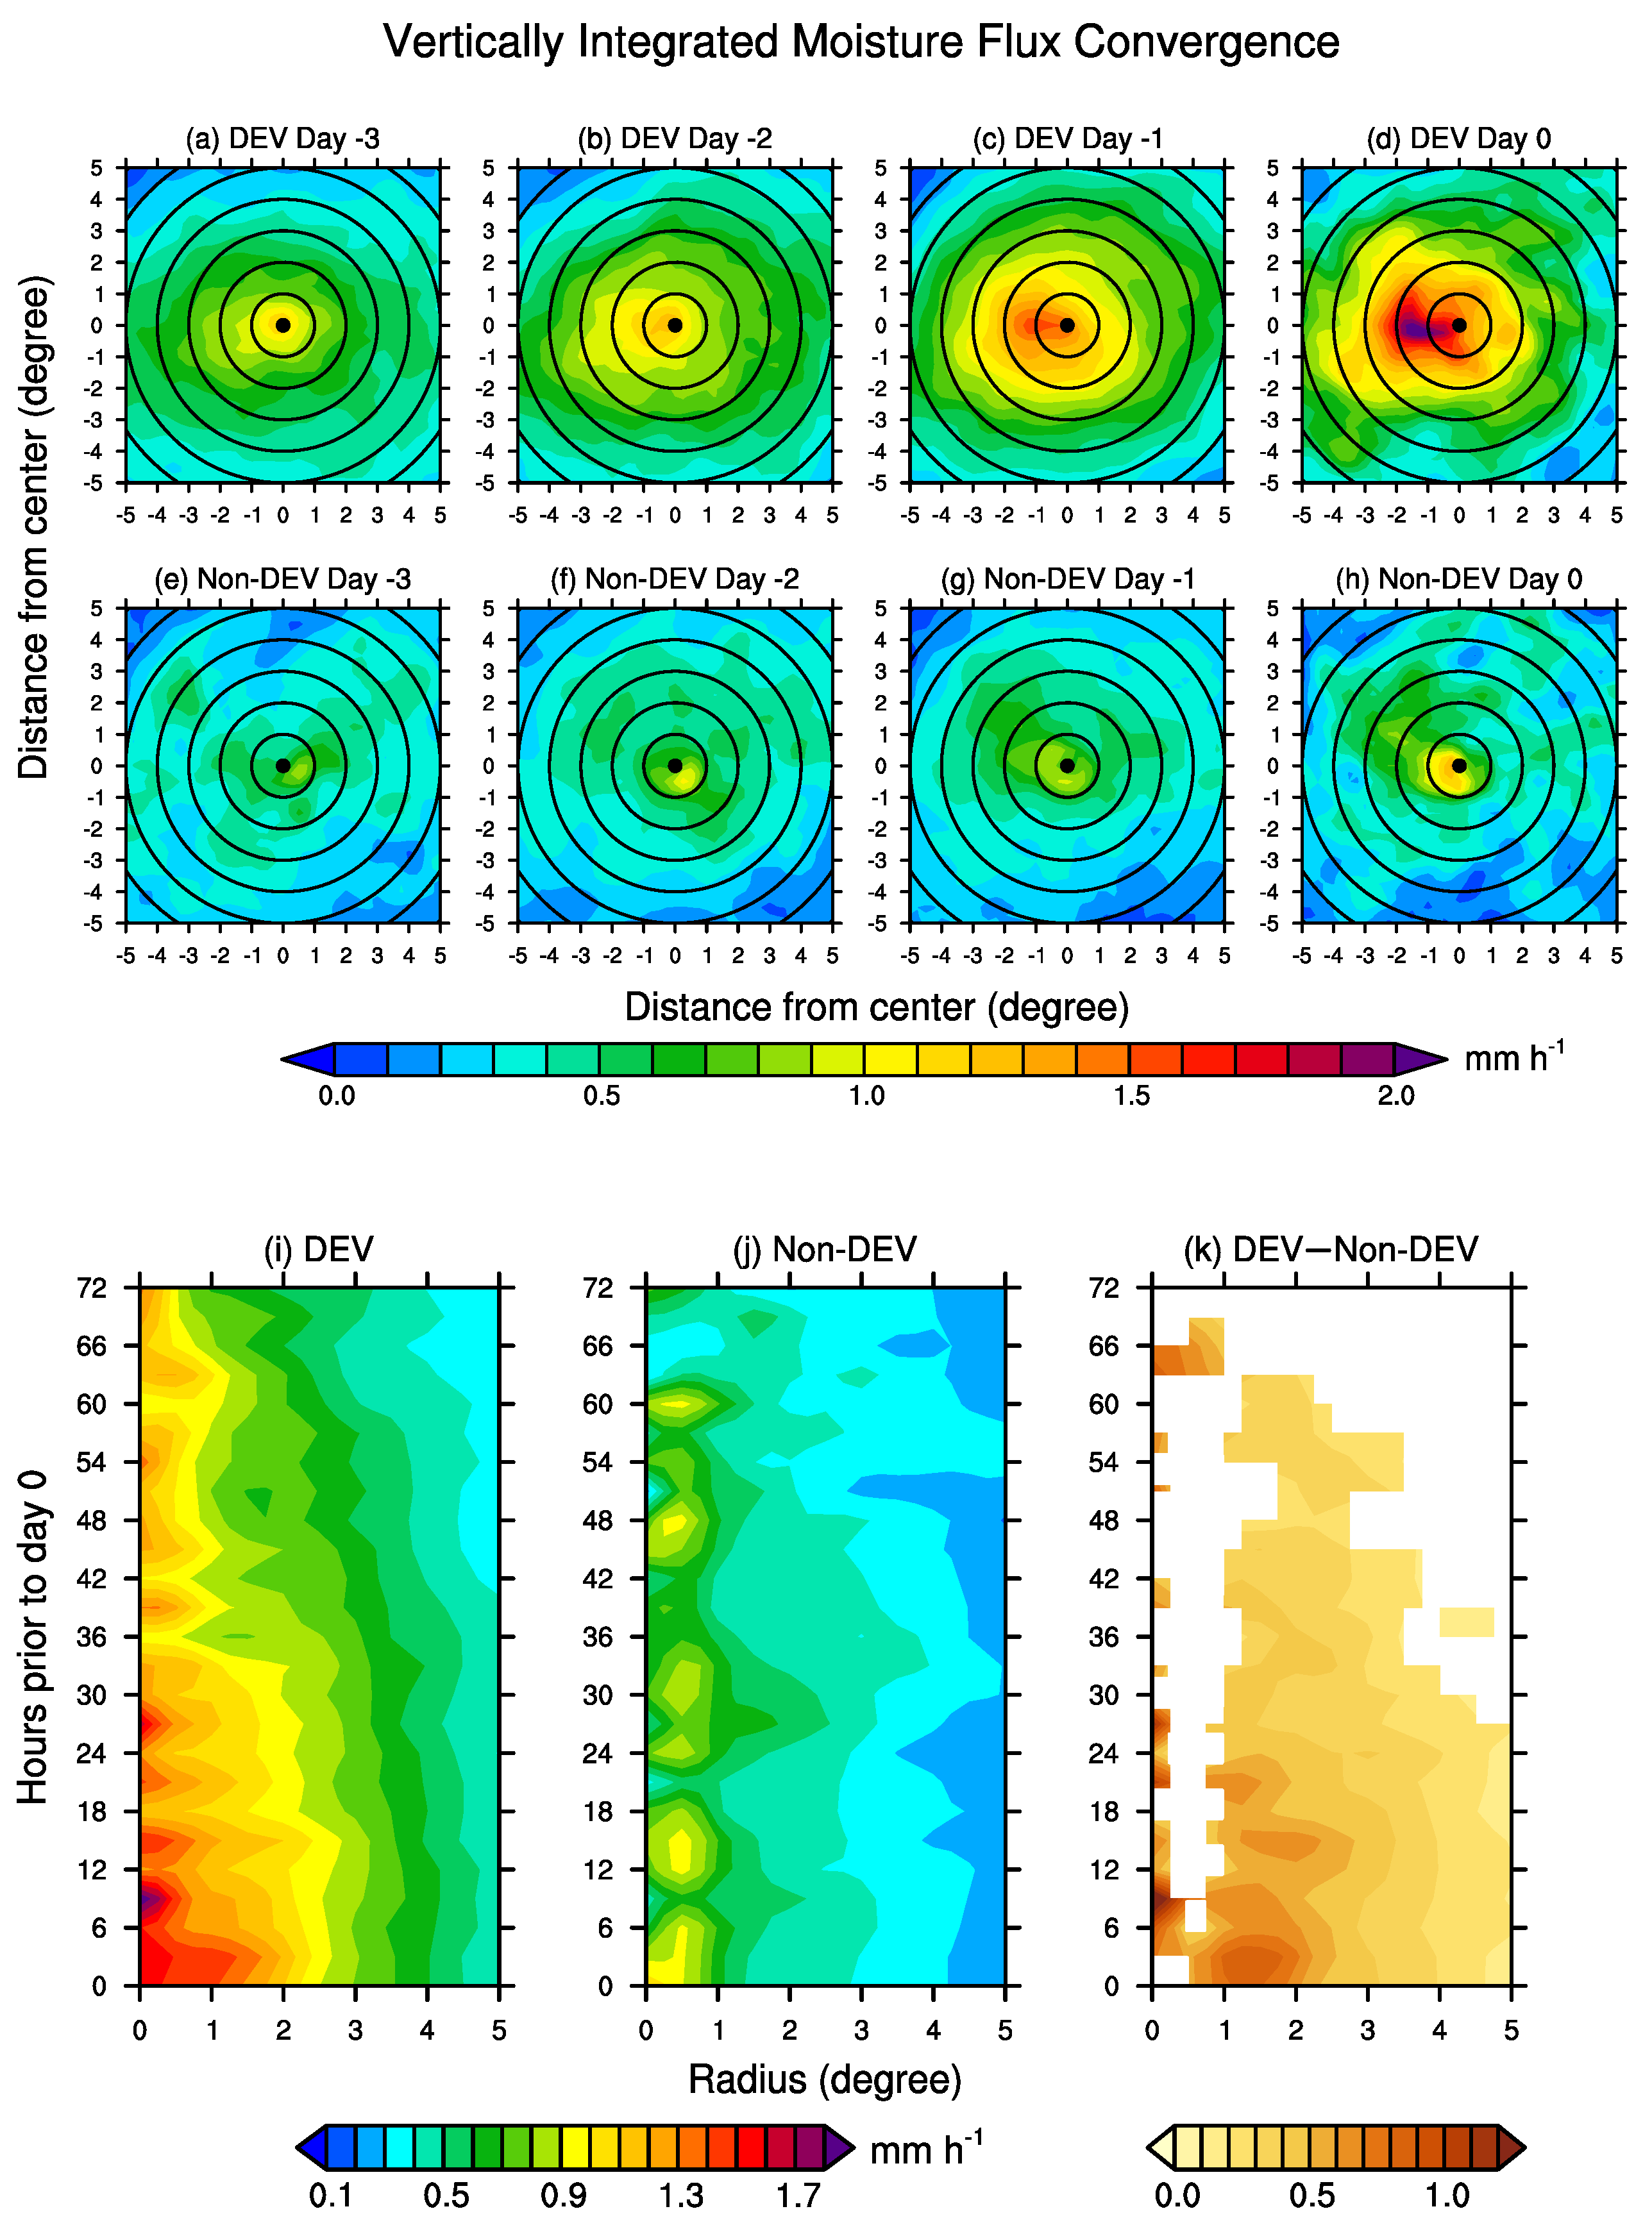
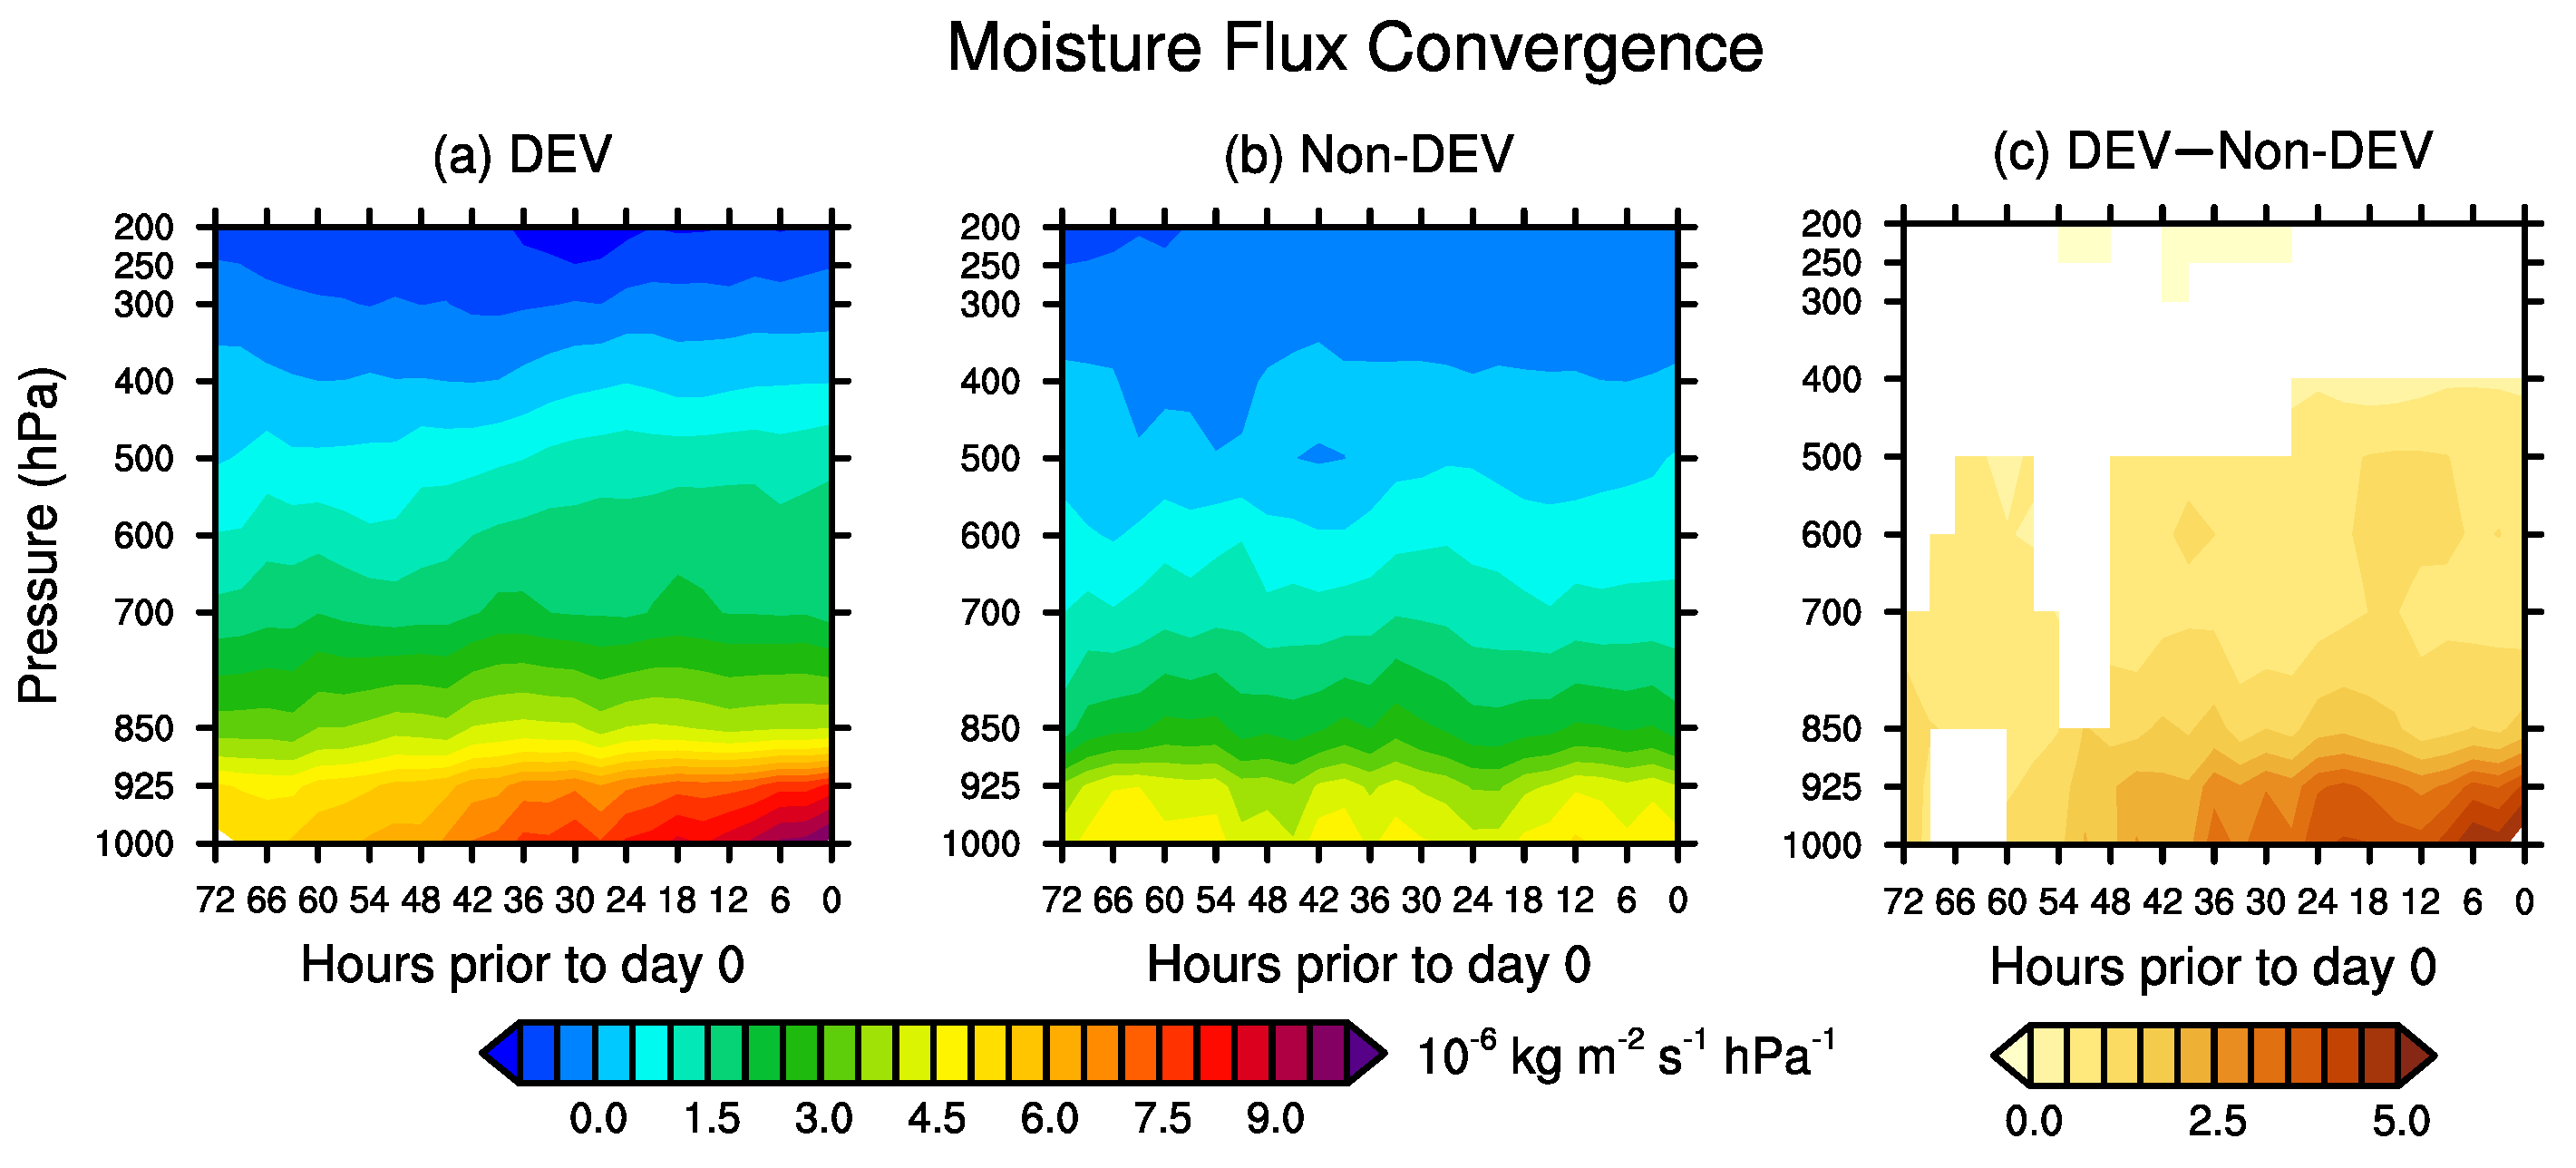
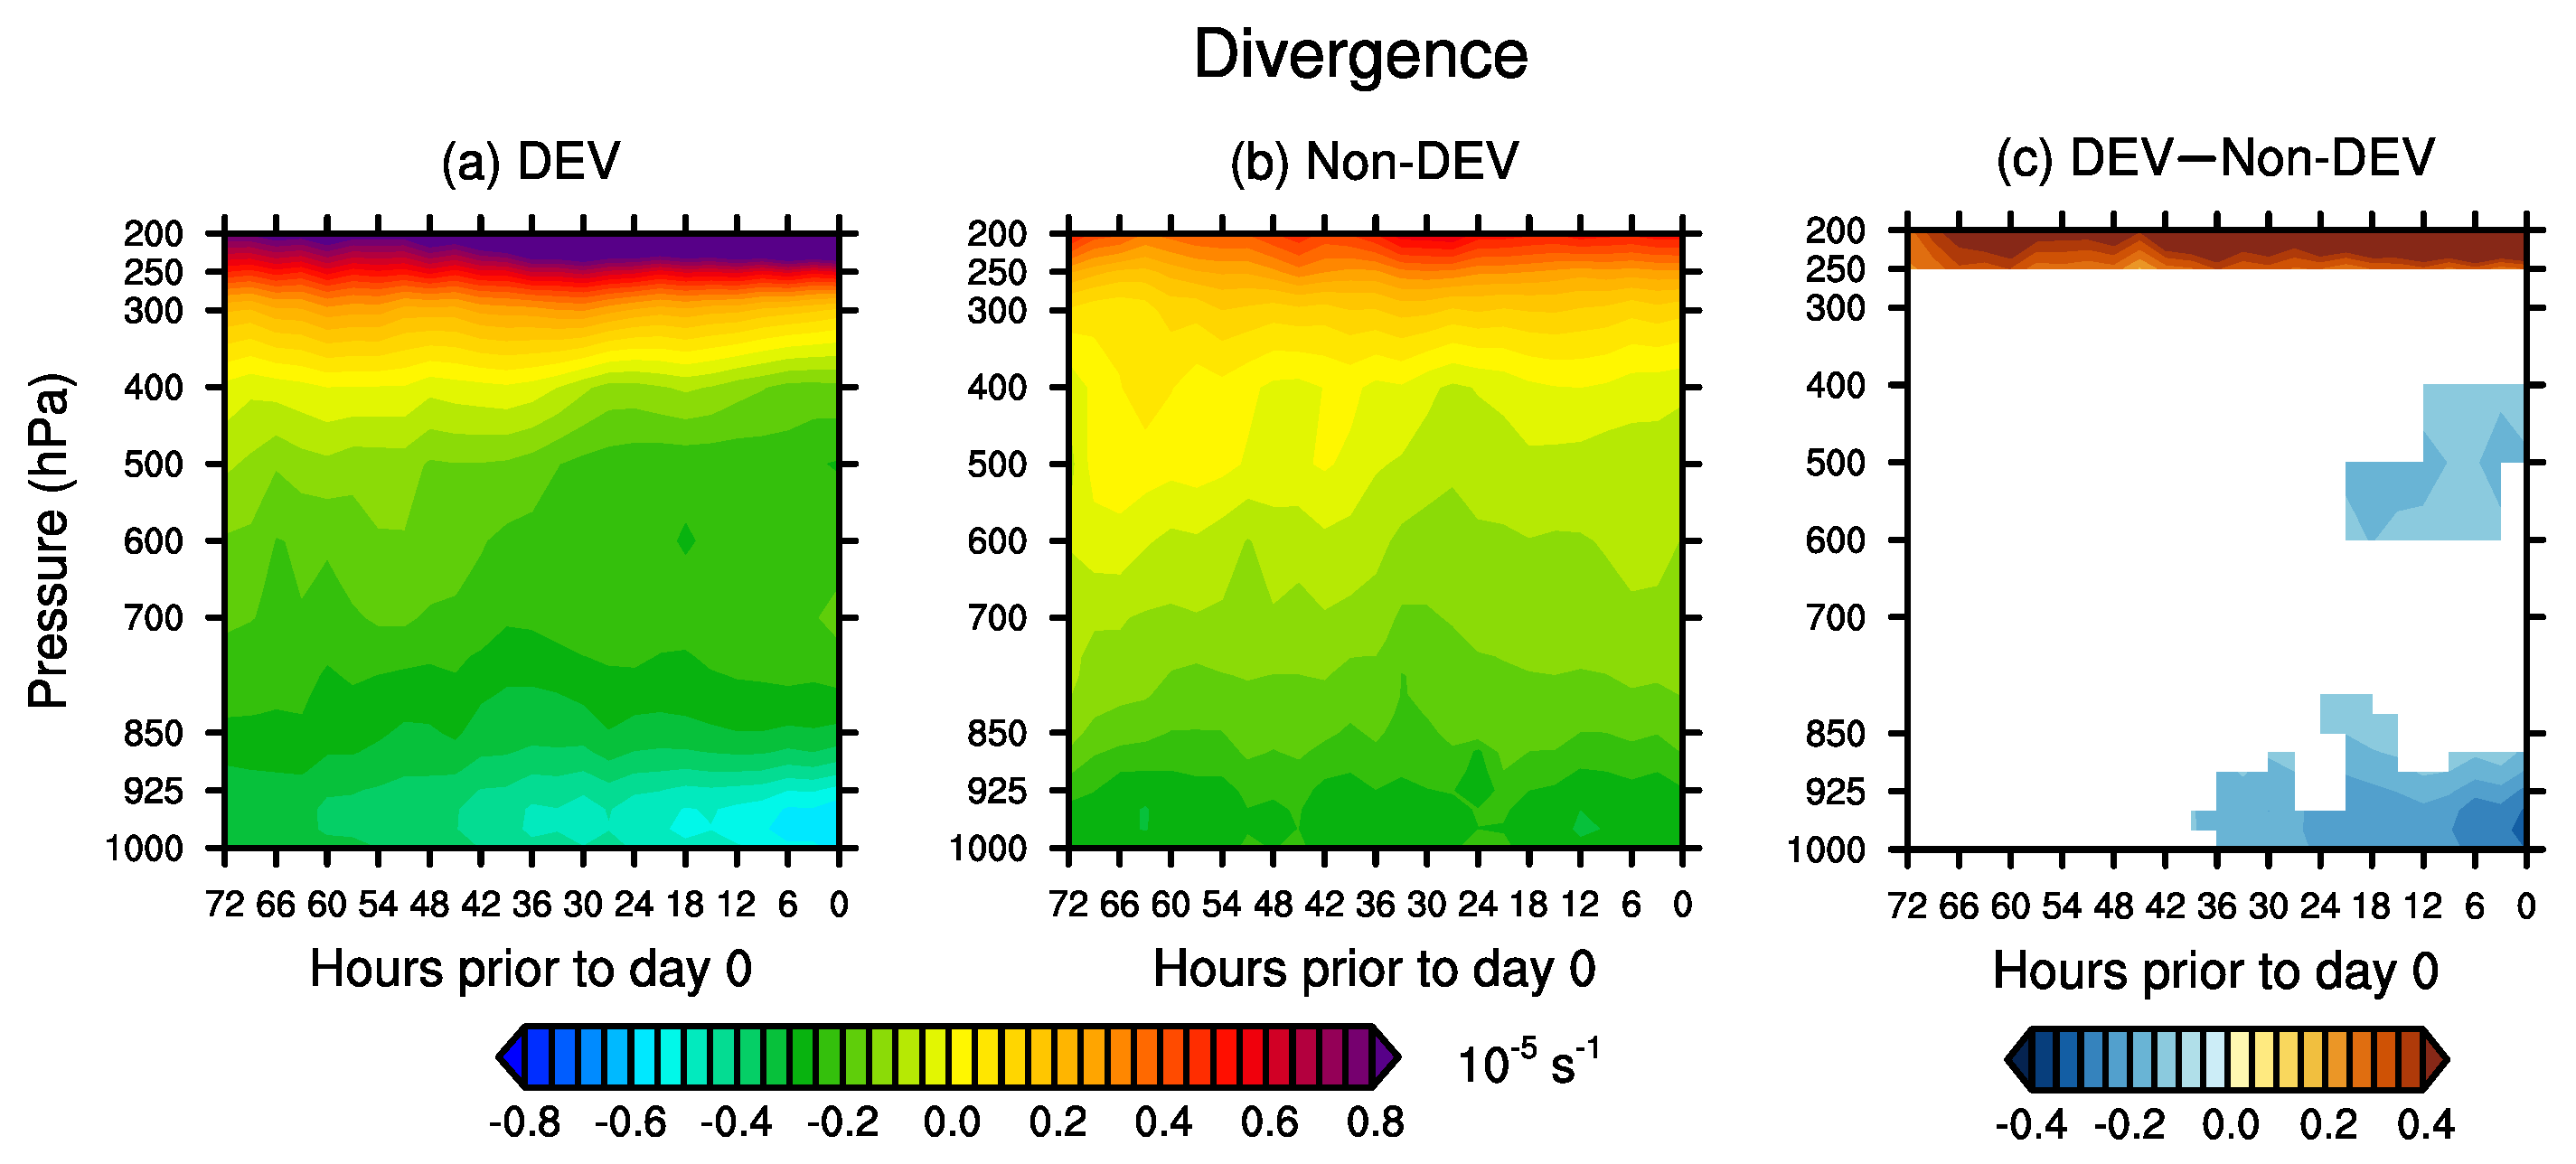
Figure 10 shows the composite VIMFC of the developing and non-developing disturbances and their differences. The temporal evolutions of the vertical profile of moisture flux convergence and divergence were averaged in a 10° × 10° box, and their differences are shown in Figure 11 and Figure 12, respectively. Although the two groups of disturbances have similar initial low-level relative vorticity (Figure 2), the developing disturbances show stronger VIMFC on day −3, with a noticeable maximum in the inner core (Figure 10a). Compared to the non-developing disturbances, the developing disturbances always have a significantly stronger VIMFC from day −3 to 0 (Figure 10k); the associated water vapor transport to the disturbance center is more conducive to promoting moist convection. The significantly stronger mid- to lower-level moisture flux convergence on day −3 (Figure 11c) is mainly attributed to significantly higher mid-to-lower level specific humidity (Figure 5c), and stronger mid- to- lower -level specific humidity (Figure 5c) and convergence (Figure 12c) jointly contribute to significantly stronger mid-to-lower level moisture flux convergence from day −2 to −1 (Figure 11c). Additionally, the developing disturbances exhibit significantly stronger divergence at 200 hPa (Figure 12c) and a higher and more abrupt shift from convergence to divergence (Figure 12a–b) than the non-developing disturbances, which may be attributed to the potential influences from upper-level systems, such as the tropical upper-tropospheric trough [61] and tropical easterly jet [62]. In summer, the warm water in the WNP was located just west of the tropical upper-tropospheric trough and near the entrance region of the upper-tropospheric tropical easterly jet. These features can contribute to a large-scale upper-level divergence, which is favorable for TC genesis [63]. Further investigation is needed to explore the effects of upper-level systems on the development of tropical disturbances.
The evolution of VIMFC in the inner core of the developing disturbances can be divided into two stages. From −72 h to −36 h, the change in the inner-core VIMFC is negligible, while it shows a significant increase starting from −36 h (Figure 10i), which is attributed to a rapid enhancement of moisture flux convergence in the lower troposphere (Figure 11a). Note that this is almost simultaneous with the increase in surface wind speed (Figure 8i), indicating that the strengthening of the cyclonic circulation in the middle to lower troposphere (i.e., a coherent enhancement of the deep-layer vorticity) results in the intensification of moisture flux convergence. In contrast, the VIMFC of the non-developing disturbances does not change much over the 3 days (Figure 10j) due to insufficient moistening (Figure 5b) and weak convergence (Figure 12b) in the middle-to-lower troposphere. The difference in inner-core VIMFC between the two groups of disturbances reaches over 1 mm h−1 on days −1 and 0 (Figure 10k).

4.4. Precipitation

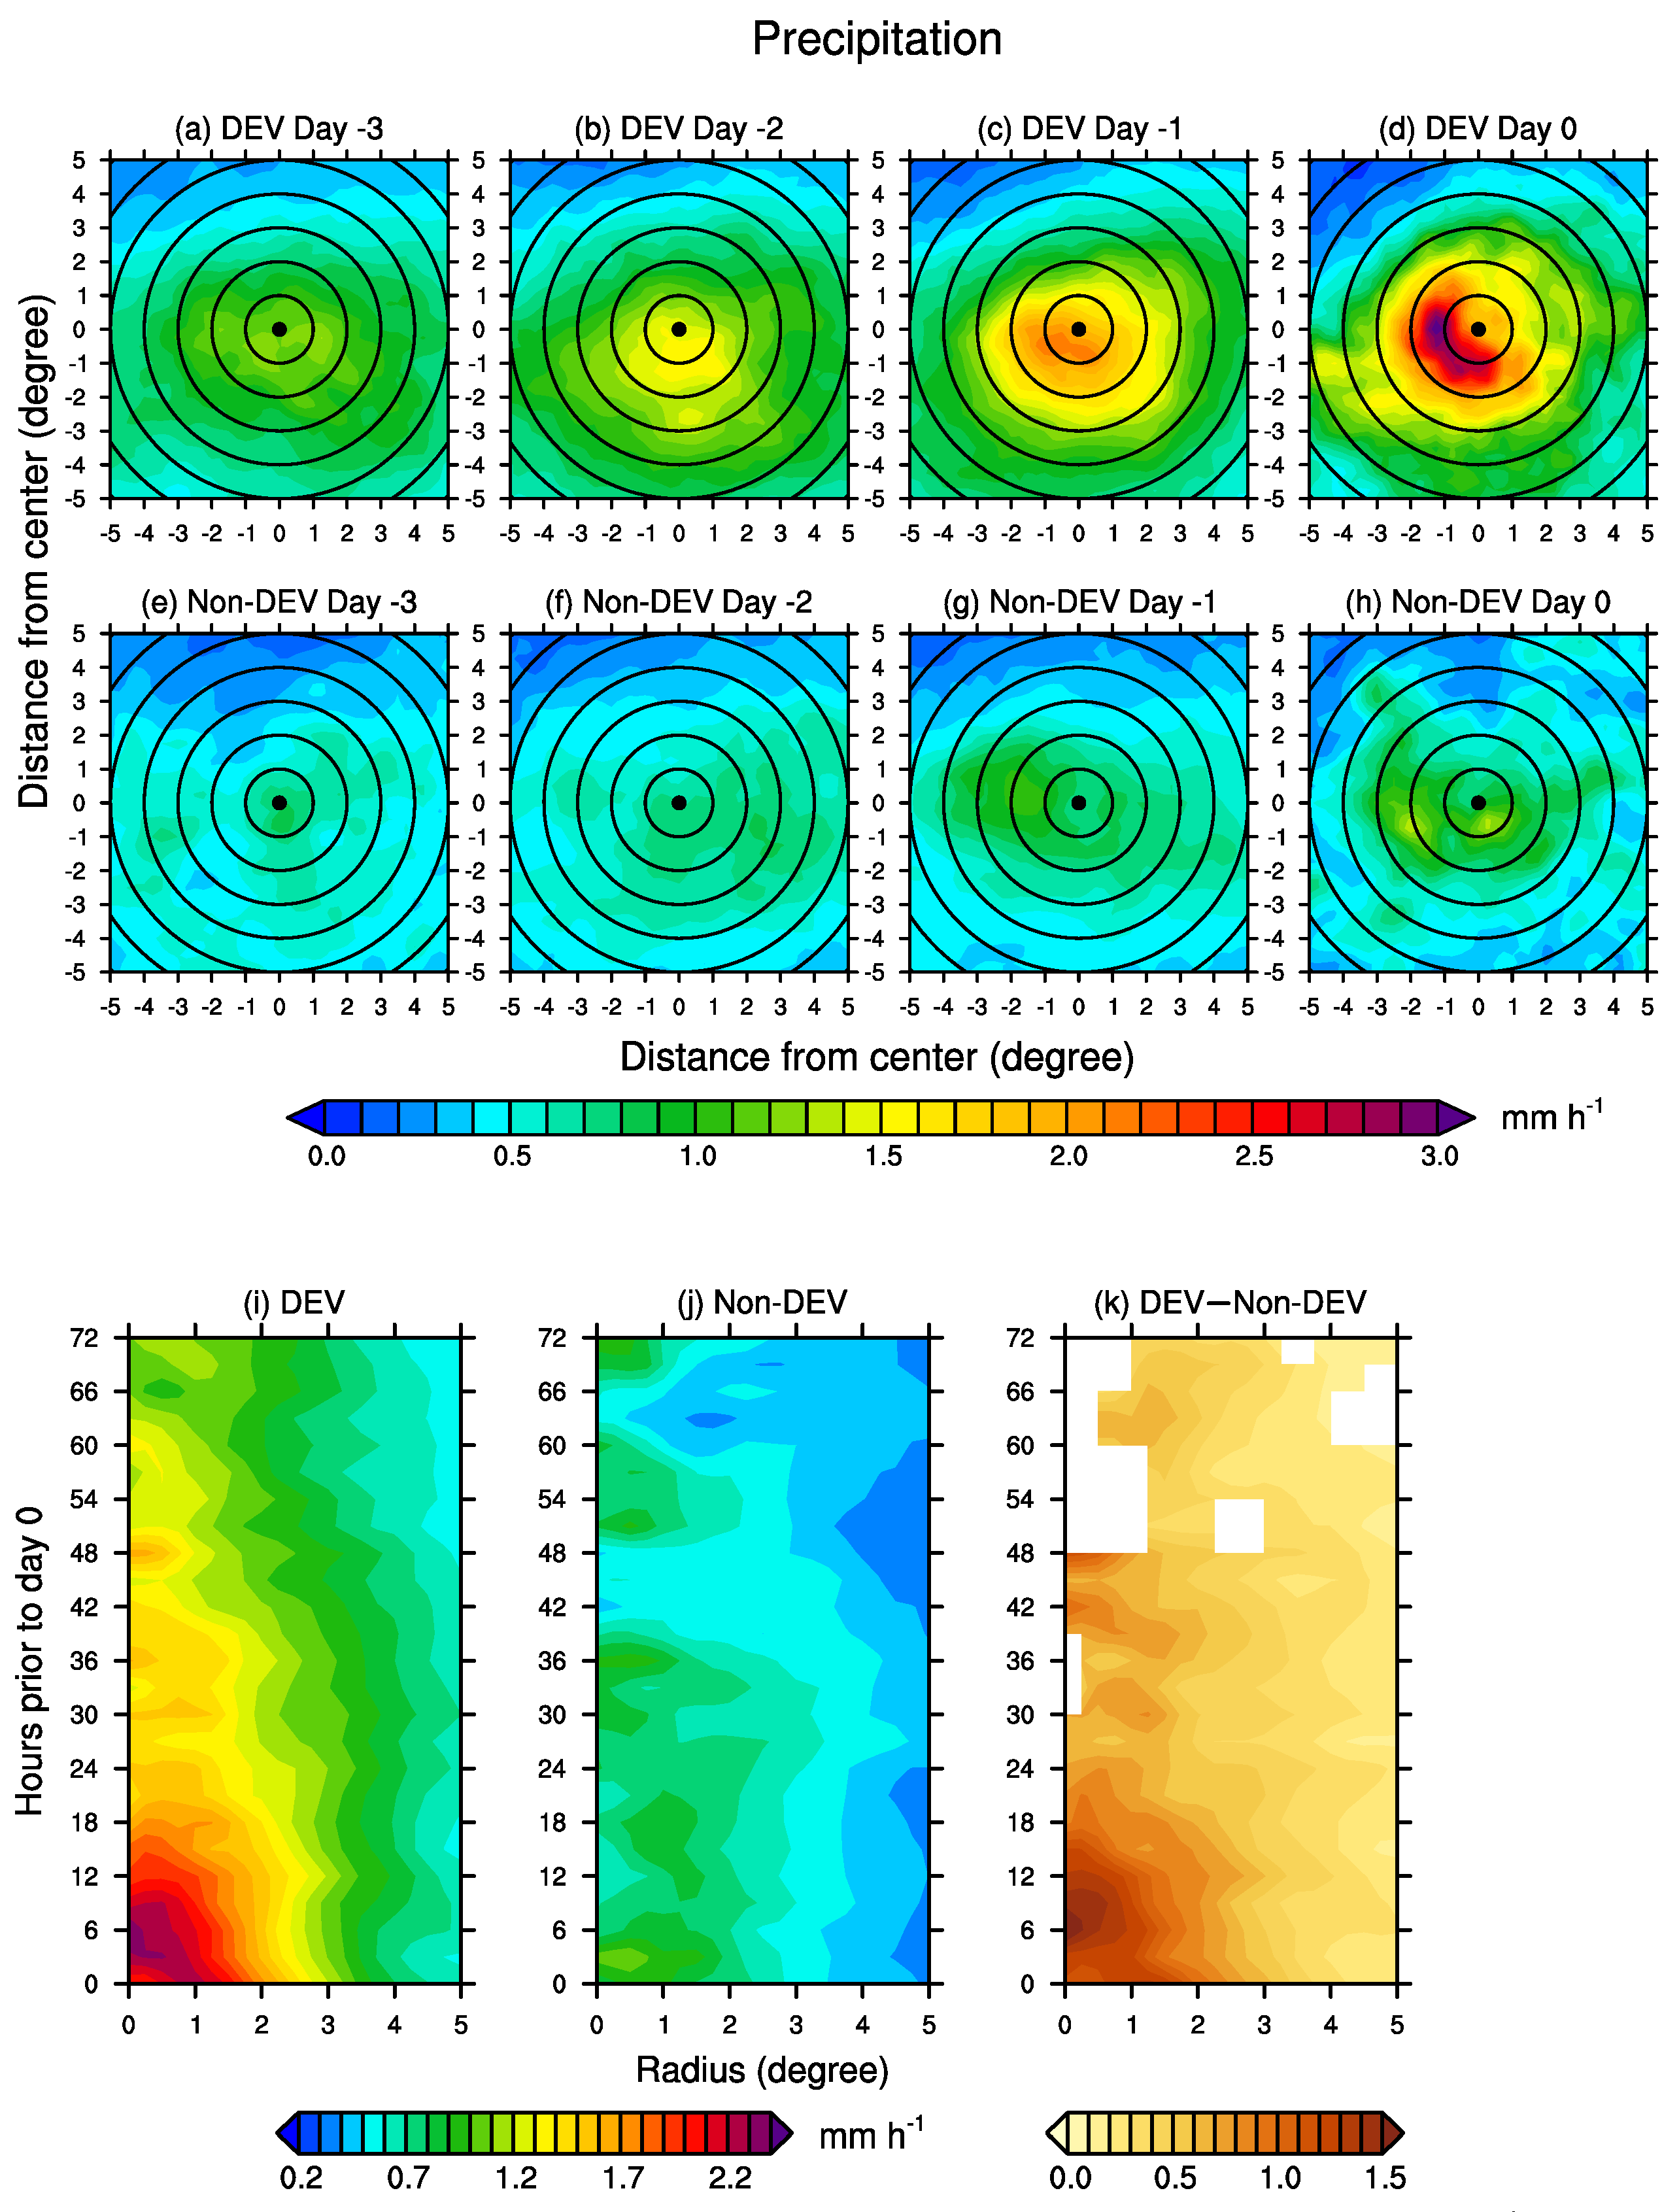
Figure 13 depicts the composite precipitation of the developing and non-developing disturbances and their differences. The spatiotemporal variation in precipitation is similar to VIMFC, with the maximum slightly deviating from the disturbance center, possibly due to the influence of vertical wind shear, e.g., [64,65,66]. During the three days prior to TC genesis, the developing disturbances exhibited a broader coverage of precipitation with significantly higher intensity compared to the non-developing cases (Figure 13a–c,k). Stratiform precipitation may be responsible for the broad coverage of precipitation in the ambient region of the developing disturbances in the pre-genesis stage [30,44]. Precipitation of the developing disturbances (especially in the inner core) gradually intensifies over the three days (Figure 13a–c,i), almost simultaneously with VIMFC (Figure 10a–c,i). On day −1, the inner-core precipitation appears to intensify markedly, possibly because TPW reaches a certain threshold (Figure 4i), as proposed in previous studies [38,67,68,69]. In contrast, the precipitation of the developing disturbances in the outer core region is relatively weak. This reflects the enhancement of low-level vorticity, the contraction of the wind field, and the continuous concentration of convection towards the disturbance center approaching TC genesis. The non-developing disturbances have much weaker initial precipitation, with no significant intensification during the three days (Figure 13e–h,j). The difference in inner-core precipitation between the two groups of disturbances approaches 1.5 mm h–1 on day −1 and 0 (Figure 13k).
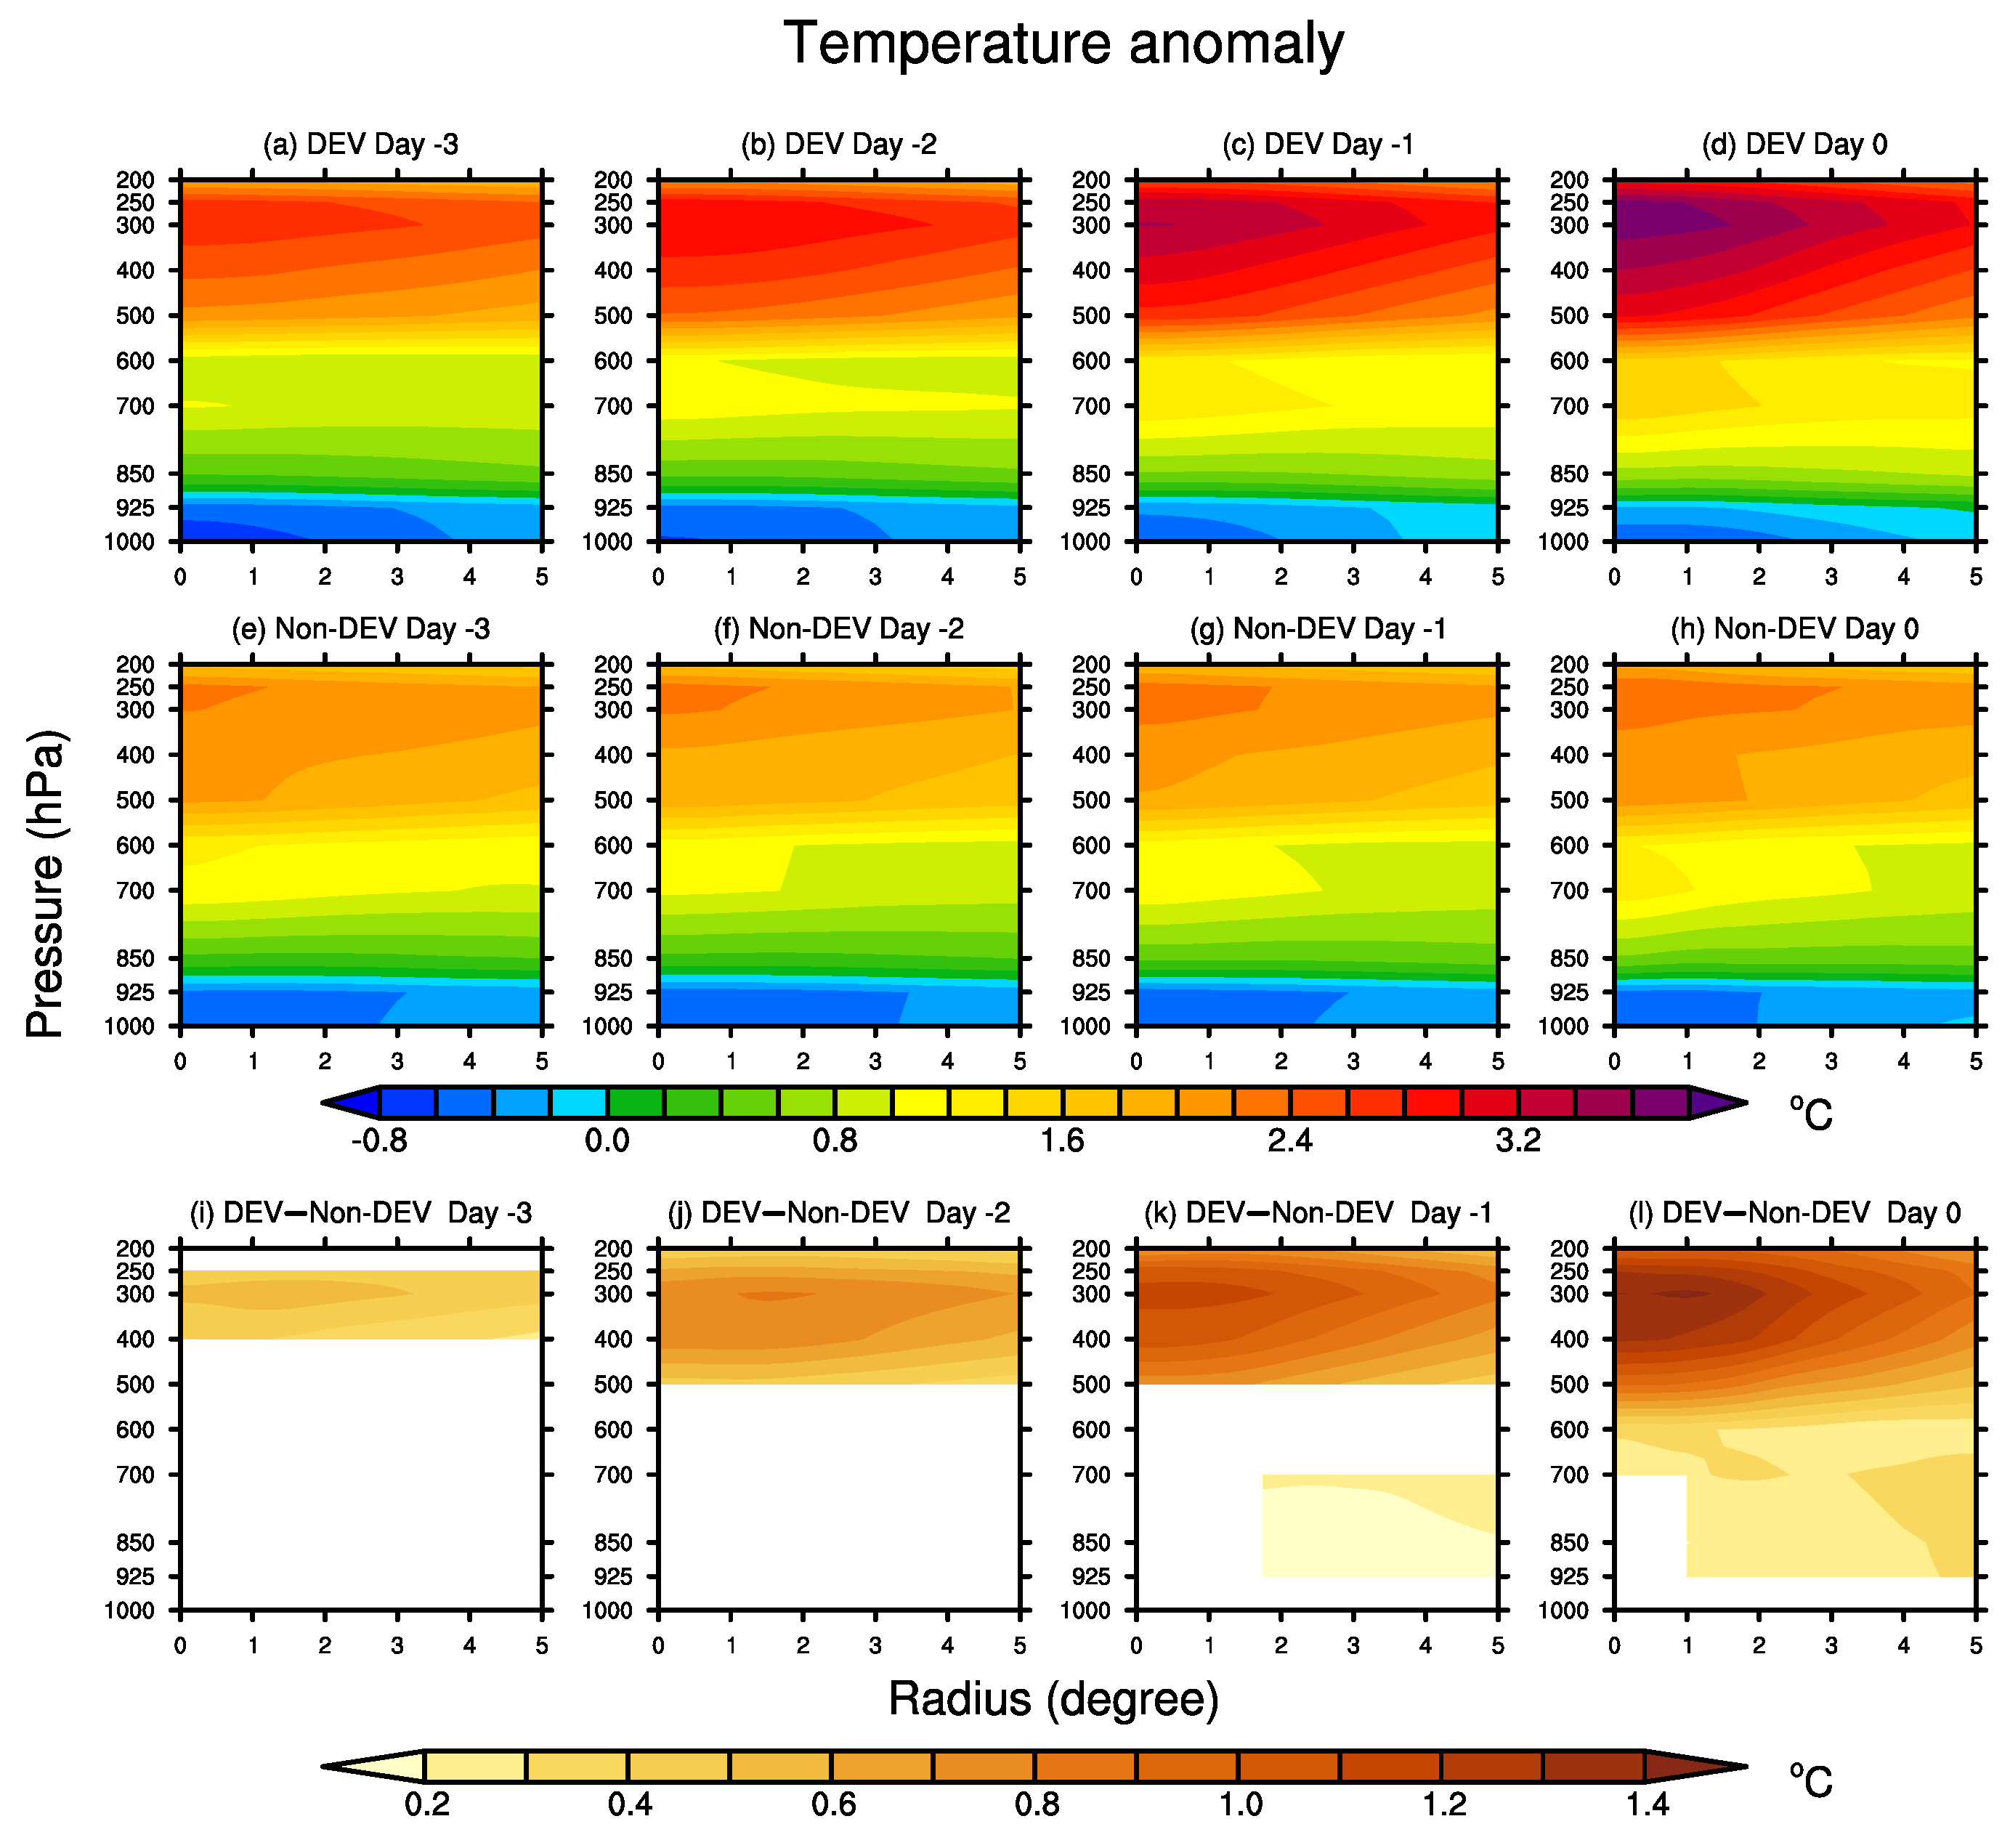
Figure 14 presents the temperature anomalies in the two groups of disturbances and their differences. The developing disturbances exhibit significantly stronger upper-level warm cores on day −3 than non-developing cases (Figure 14a,e,i), which is consistent with previous studies based on field campaign observations [57], and the warm-core strength gradually increases from day −3 to 0 (Figure 14a–d), which is related to the latent heat release associated with precipitation, e.g., [44,65]. The warm-core structure can excite the primary and secondary circulations and promote the development of disturbances [33], according to the Sawyer–Eliassen equation [70,71,72]. However, the non-developing disturbances do not exhibit the prominent enhancement of temperature anomalies (Figure 14e–h).

4.5. Analysis of BDI

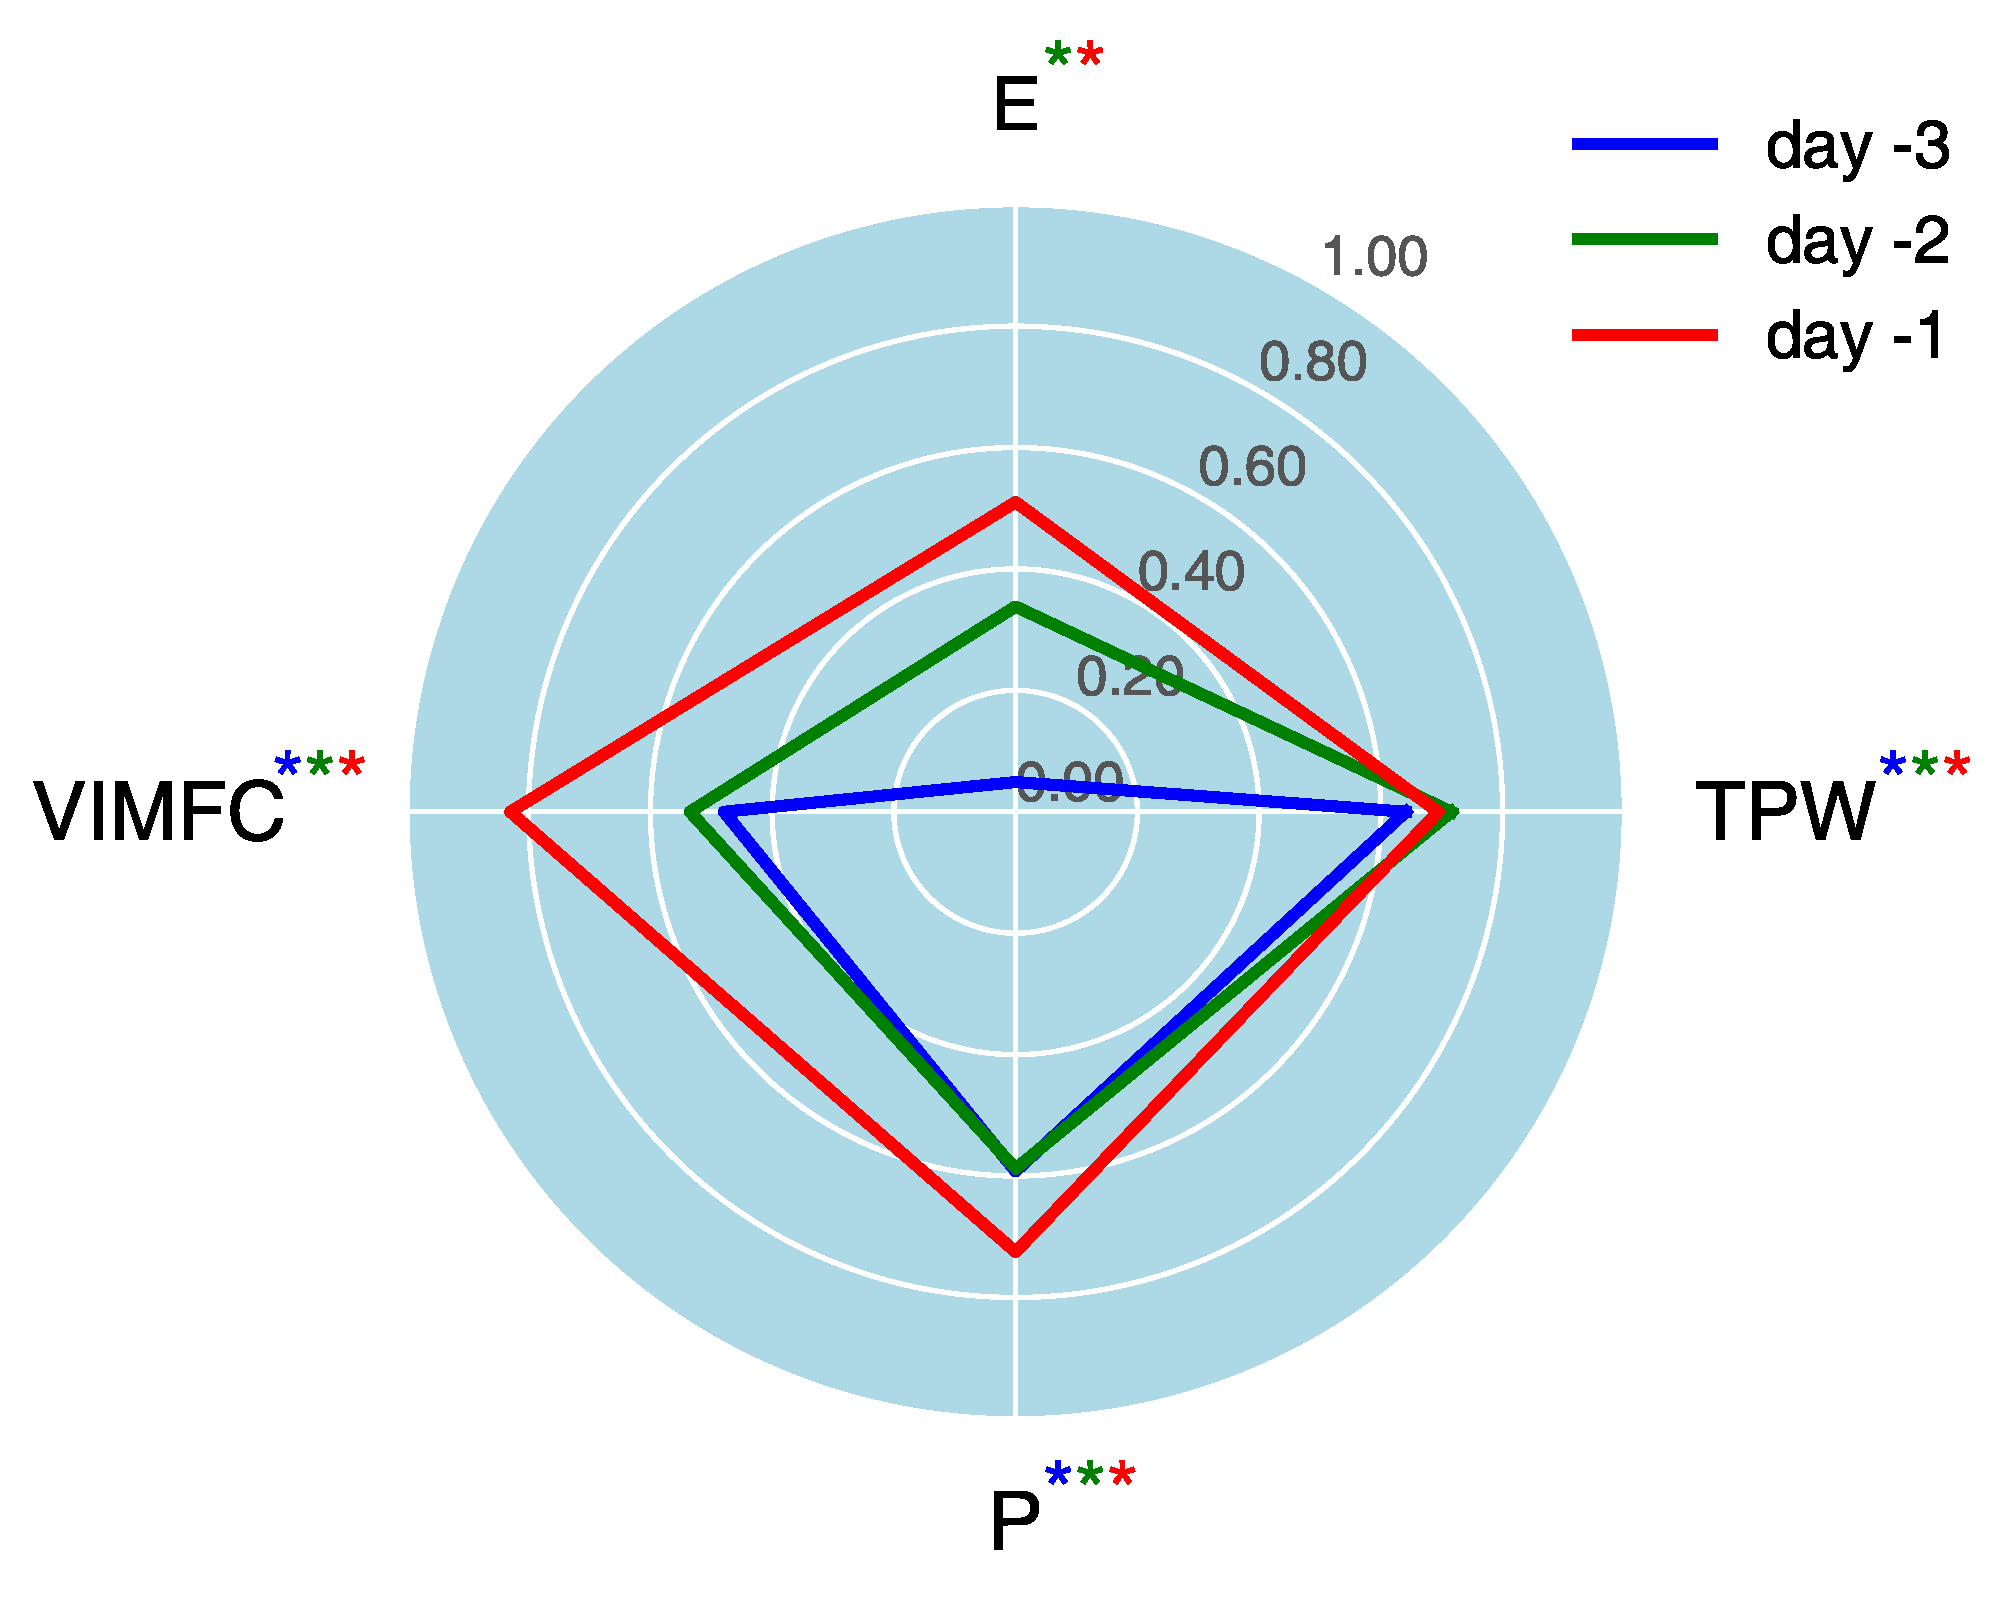
To compare the relative roles of the water vapor components at different stages of disturbances and to provide a forecast reference for TC genesis, we further examined the evolution of their BDI from day −3 to −1 (Figure 15). On day −3, TPW is the most important parameter to differentiate between the two groups of disturbances. Precipitation and VIMFC are the second and third most important parameters, respectively. Evaporation ranks fourth and shows no significant difference between two groups of disturbances, indicating the negligible effect of initial evaporation. On day −2, the order of the BDI amplitude does not change, but the BDI amplitude of evaporation increases markedly, and the difference between the two groups of disturbances becomes significant, suggesting that the role of evaporation in TC genesis stands out. On day −1, the four water vapor components show relatively comparable BDI amplitudes, indicating that they jointly contribute to TC genesis.

5. Conclusions and Discussion

This study identifies the developing and non-developing tropical disturbances over the WNP during the peak TC seasons of 2000–2019 and conducts composite analyses on water vapor budget components and relevant dynamic−thermodynamic variables, focusing on their evolution three days prior to TC genesis. We constructed a distinct physical picture of the roles of the water vapor budget in TC genesis over the WNP.
In the early stage (day −3), a moisture-rich environment can protect the vortex from dry air intrusion and induce strong moisture flux convergence and precipitation, thus playing a crucial role in triggering vorticity aggregation and growth. The vortex in the boundary layer does not intensify clearly at this time; thus, the corresponding surface evaporation is relatively weak. With the gradual strengthening of the cyclonic circulation in the middle and lower troposphere from day −2 onwards, surface evaporation significantly increases, VIMFC is further strengthened, and therefore, the air column in the core region of disturbances continues to be humidified, which is conducive to a sharp increase in precipitation on day −1 and continues to fuel the vortices through latent heat release. The significantly increased surface evaporation on days −2 and −1 also results in a pronounced negative radial gradient. Consequently, positive feedback forms between surface wind and evaporation. The rapid enhancement of the mid- and lower-level vortices ensue, ultimately culminating in TC genesis.
Specifically, the impacts of water vapor budget components on tropical disturbances exhibit a sequential order as follows: on day −3, significant differences exist in TPW, precipitation, and VIMFC between the developing and non-developing disturbances, while differences in evaporation are relatively small and non-significant. Subsequently, on days −2 and −1, all the water vapor budget components, i.e., TPW, precipitation, VIMFC, and evaporation, show significant differences between the two groups of disturbances. To a certain degree, this water vapor budget evolution is consistent with the two-stage conceptual model for TC genesis proposed by Wang [73] in a numerical study: the gradual moisture preconditioning in the first stage and the rapid increase in precipitation associated with deep convection in the second stage, eventually leads to TC genesis. This study found that the interaction between water vapor components and vortex development was crucial to TC genesis. An initially wetter environment favors more vigorous convection and stronger inflow, promoting vortex growth. The development of a deep vortex layer, in turn, helps maintain moist conditions by preventing the intrusion of dry air. Our work enhances the understanding of the moisture evolution characteristics preceding TC genesis [33,35,37,39,41].
As TPW, precipitation, VIMFC, and evaporation are key factors differentiating the developing disturbances from non-developing cases prior to TC genesis, these water vapor variables could be incorporated into statistical or artificial intelligence approaches, e.g., [74,75], to improve TC genesis prediction, which deserves further investigation. In addition, how these favorable moisture conditions form is unclear. Some previous studies pointed out that tropical waves contribute to TC genesis, e.g., [11,12,13,14]. Therefore, our future work will examine pre-genesis conditions from the perspective of multiscale tropical waves to further enhance our understanding of TC genesis.

Author Contributions

Conceptualization, S.G.; methodology, Z.S., S.G., and M.J.; software, Z.S.; validation, Z.S., and S.G.; formal analysis, Z.S., and S.G.; investigation, Z.S.; resources, S.G.; data curation, Z.S.; writing—original draft preparation, Z.S.; writing—review and editing, S.G., and M.J.; visualization, Z.S.; supervision, S.G., and M.J.; funding acquisition, S.G. All authors have read and agreed to the published version of the manuscript.

Funding

This research was funded by the National Natural Science Foundation of China (grant number 42175020, 42175018) and the Guangdong Basic and Applied Basic Research Foundation (grant number 2021A1515011573).

Data Availability Statement

All the datasets are freely available online. IBTrACS version 4 data can be accessed from https://www.ncei.noaa.gov/products/international-best-track-archive (accessed on 10 October 2021). ERA5 data can be accessed from https://cds.climate.copernicus.eu/cdsapp#!/dataset/reanalysis-era5-pressure-levels?tab=form (accessed on 10 October 2021). Ocean heat flux data can be accessed from https://www.ncei.noaa.gov/products/climate-data-records/ocean-heat-fluxes (accessed on 10 October 2021). Sea surface temperature data can be accessed from https://www.ncei.noaa.gov/products/climate-data-records/sea-surface-temperature-whoi (accessed on 30 October 2021). Sea surface wind data can be accessed from https://www.ncei.noaa.gov/products/climate-data-records/ocean-near-surface-atmosphere (accessed on 30 October 2021). TRMM 3B42 version 7 data can be accessed from https://disc.gsfc.nasa.gov/datasets/TRMM_3B42_7/summary (accessed on 10 October 2021).

Acknowledgments

Valuable comments from Da-Lin Zhang are appreciated. We also acknowledge the high-performance computing support from the School of Atmospheric Sciences at Sun Yat-sen University.

Conflicts of Interest

The authors declare no conflicts of interest.

References

  1. Emanuel, K. Tropical Cyclones. Annu. Rev. Earth Planet. Sci. 2003, 31, 75–104. [Google Scholar] [CrossRef]
  2. Emanuel, K. 100 Years of Progress in Tropical Cyclone Research. Meteorol. Monogr. 2018, 59, 15.1–15.68. [Google Scholar] [CrossRef]
  3. Fu, B.; Peng, M.S.; Li, T.; Stevens, D.E. Developing versus Nondeveloping Disturbances for Tropical Cyclone Formation. Part II: Western North Pacific. Mon. Weather Rev. 2012, 140, 1067–1080. [Google Scholar] [CrossRef]
  4. Hennon, C.C.; Papin, P.P.; Zarzar, C.M.; Michael, J.R.; Caudill, J.A.; Douglas, C.R.; Groetsema, W.C.; Lacy, J.H.; Maye, Z.D.; Reid, J.L.; et al. Tropical Cloud Cluster Climatology, Variability, and Genesis Productivity. J. Clim. 2013, 26, 3046–3066. [Google Scholar] [CrossRef]
  5. Peng, M.S.; Fu, B.; Li, T.; Stevens, D.E. Developing versus Nondeveloping Disturbances for Tropical Cyclone Formation. Part I: North Atlantic. Mon. Weather Rev. 2012, 140, 1047–1066. [Google Scholar] [CrossRef]
  6. Gray, W.M. Global View of the Origin of Tropical Disturbances and Storms. Mon. Weather Rev. 1968, 96, 669–700. [Google Scholar] [CrossRef]
  7. Fu, B.; Li, T.; Peng, M.S.; Weng, F. Analysis of Tropical Cyclogenesis in the Western North Pacific for 2000 and 2001. Weather Forecast. 2007, 22, 763–780. [Google Scholar] [CrossRef]
  8. Ritchie, E.A.; Holland, G.J. Large-Scale Patterns Associated with Tropical Cyclogenesis in the Western Pacific. Mon. Weather Rev. 1999, 127, 2027–2043. [Google Scholar] [CrossRef]
  9. Wu, L.; Zong, H.; Liang, J. Observational Analysis of Tropical Cyclone Formation Associated with Monsoon Gyres. J. Atmos. Sci. 2013, 70, 1023–1034. [Google Scholar] [CrossRef]
  10. Zong, H.; Wu, L. Synoptic-Scale Influences on Tropical Cyclone Formation within the Western North Pacific Monsoon Trough. Mon. Weather Rev. 2015, 143, 3421–3433. [Google Scholar] [CrossRef]
  11. Chen, G.; Chou, C. Joint Contribution of Multiple Equatorial Waves to Tropical Cyclogenesis over the Western North Pacific. Mon. Weather Rev. 2014, 142, 79–93. [Google Scholar] [CrossRef]
  12. Feng, X.; Yang, G.-Y.; Hodges, K.I.; Methven, J. Equatorial Waves as Useful Precursors to Tropical Cyclone Occurrence and Intensification. Nat. Commun. 2023, 14, 511. [Google Scholar] [CrossRef] [PubMed]
  13. Wu, L.; Takahashi, M. Contributions of Tropical Waves to Tropical Cyclone Genesis over the Western North Pacific. Clim. Dyn. 2018, 50, 4635–4649. [Google Scholar] [CrossRef]
  14. Yu, R.; Gao, S.; Sun, L.; Chen, G.; Shen, X. Multiscale Mechanisms for the Modulation of the Pacific Meridional Mode on Tropical Cyclone Genesis over the Western North Pacific: A Comparison between 2004 and 2011. Clim. Dyn. 2023, 60, 3241–3259. [Google Scholar] [CrossRef]
  15. McBride, J.L. Tropical cyclone formation. In Global Perspectives on Tropical Cyclones; Elsberry, R.L., Ed.; World Meteorological Organization: Geneva, Switzerland, 1995. [Google Scholar]
  16. McBride, J.L.; Zehr, R. Observational Analysis of Tropical Cyclone Formation. Part II: Comparison of Non-Developing versus Developing Systems. J. Atmos. Sci. 1981, 38, 1132–1151. [Google Scholar] [CrossRef]
  17. Zehr, R.M. Tropical Cyclogenesis in the Western North Pacific; NOAA Technical Report, NESDIS 61; National Environmental Satellite, Data, and Information Service: Silver Spring, MD, USA, 1992. [Google Scholar]
  18. Zhong, R.; Xu, S.; Huang, F.; Wu, X. Reasons for the Weakening of Tropical Depressions in the South China Sea. Mon. Weather Rev. 2020, 148, 3453–3469. [Google Scholar] [CrossRef]
  19. Wang, Z.; Chen, G. Comparison between Developing and Nondeveloping Disturbances for Tropical Cyclogenesis in Different Large-Scale Flow Patterns over the Western North Pacific. J. Clim. 2024, 37, 655–672. [Google Scholar] [CrossRef]
  20. Yuan, J.; Li, T.; Wang, D. Precursor Synoptic-Scale Disturbances Associated with Tropical Cyclogenesis in the South China Sea during 2000–2011. Int. J. Climatol. 2015, 35, 3454–3470. [Google Scholar] [CrossRef]
  21. Ritchie, E.A.; Holland, G.J. On the Interaction of Tropical-Cyclone-Scale Vortices. II: Discrete Vortex Patches. Q. J. R. Meteorol. Soc. 1993, 119, 1363–1379. [Google Scholar] [CrossRef]
  22. Ritchie, E.A.; Holland, G.J. Scale Interactions during the Formation of Typhoon Irving. Mon. Weather Rev. 1997, 125, 1377–1396. [Google Scholar] [CrossRef]
  23. Bister, M.; Emanuel, K.A. The Genesis of Hurricane Guillermo: TEXMEX Analyses and a Modeling Study. Mon. Weather Rev. 1997, 125, 2662–2682. [Google Scholar] [CrossRef]
  24. Hendricks, E.A.; Montgomery, M.T.; Davis, C.A. The Role of “Vortical” Hot Towers in the Formation of Tropical Cyclone Diana (1984). J. Atmos. Sci. 2004, 61, 1209–1232. [Google Scholar] [CrossRef]
  25. Montgomery, M.T.; Nicholls, M.E.; Cram, T.A.; Saunders, A.B. A Vortical Hot Tower Route to Tropical Cyclogenesis. J. Atmos. Sci. 2006, 63, 355–386. [Google Scholar] [CrossRef]
  26. Smith, R.K.; Montgomery, M.T.; Van Sang, N. Tropical Cyclone Spin-up Revisited. Q. J. R. Meteorol. Soc. 2009, 135, 1321–1335. [Google Scholar] [CrossRef]
  27. Tory, K.J.; Montgomery, M.T.; Davidson, N.E.; Kepert, J.D. Prediction and Diagnosis of Tropical Cyclone Formation in an NWP System. Part II: A Diagnosis of Tropical Cyclone Chris Formation. J. Atmos. Sci. 2006, 63, 3091–3113. [Google Scholar] [CrossRef]
  28. Dunkerton, T.J.; Montgomery, M.T.; Wang, Z. Tropical Cyclogenesis in a Tropical Wave Critical Layer: Easterly Waves. Atmos. Chem. Phys. 2009, 9, 5587–5646. [Google Scholar] [CrossRef]
  29. Wang, Z.; Montgomery, M.T.; Dunkerton, T.J. Genesis of Pre–Hurricane Felix (2007). Part I: The Role of the Easterly Wave Critical Layer. J. Atmos. Sci. 2010, 67, 1711–1729. [Google Scholar] [CrossRef]
  30. Wang, Z.; Montgomery, M.T.; Dunkerton, T.J. Genesis of Pre–Hurricane Felix (2007). Part II: Warm Core Formation, Precipitation Evolution, and Predictability. J. Atmos. Sci. 2010, 67, 1730–1744. [Google Scholar] [CrossRef]
  31. Wu, S.; Fang, J. The Initial Mesoscale Vortexes Leading to the Formation of Tropical Cyclones in the Western North Pacific. Adv. Atmos. Sci. 2023, 40, 804–823. [Google Scholar] [CrossRef]
  32. Montgomery, M.T.; Farrell, B.F. Tropical Cyclone Formation. J. Atmos. Sci. 1993, 50, 285–310. [Google Scholar] [CrossRef]
  33. Wang, Z. Thermodynamic Aspects of Tropical Cyclone Formation. J. Atmos. Sci. 2012, 69, 2433–2451. [Google Scholar] [CrossRef]
  34. Davis, C.A. The Formation of Moist Vortices and Tropical Cyclones in Idealized Simulations. J. Atmos. Sci. 2015, 72, 3499–3516. [Google Scholar] [CrossRef]
  35. Fritz, C.; Wang, Z. Water Vapor Budget in a Developing Tropical Cyclone and Its Implication for Tropical Cyclone Formation. J. Atmos. Sci. 2014, 71, 4321–4332. [Google Scholar] [CrossRef]
  36. Nolan, D.S. What Is the Trigger for Tropical Cyclogenesis? Aust. Meteorol. Mag. 2007, 56, 241–266. [Google Scholar]
  37. Zawislak, J.; Zipser, E.J. Analysis of the Thermodynamic Properties of Developing and Nondeveloping Tropical Disturbances Using a Comprehensive Dropsonde Dataset. Mon. Weather Rev. 2014, 142, 1250–1264. [Google Scholar] [CrossRef]
  38. Wang, Z.; Hankes, I. Moisture and Precipitation Evolution during Tropical Cyclone Formation as Revealed by the SSM/I–SSMIS Retrievals. J. Atmos. Sci. 2016, 73, 2773–2781. [Google Scholar] [CrossRef]
  39. Zhuo, L.; Wu, Z.; Fang, D.; Fang, J. Moisture Evolution during the Pre-genesis of Super Typhoon Megi (2010). J. Nanjing Univ. (Nat. Sci.) 2020, 56, 640–652, (In Chinese with English abstract). [Google Scholar] [CrossRef]
  40. Murthy, V.S.; Boos, W.R. Role of Surface Enthalpy Fluxes in Idealized Simulations of Tropical Depression Spinup. J. Atmos. Sci. 2018, 75, 1811–1831. [Google Scholar] [CrossRef]
  41. Gao, S.; Jia, S.; Wan, Y.; Li, T.; Zhai, S.; Shen, X. The Role of Latent Heat Flux in Tropical Cyclogenesis over the Western North Pacific: Comparison of Developing versus Non-Developing Disturbances. J. Mar. Sci. Eng. 2019, 7, 28. [Google Scholar] [CrossRef]
  42. Aiyyer, A.; Schreck, C. Surface Wind Speeds and Enthalpy Fluxes During Tropical Cyclone Formation from Easterly Waves: A CYGNSS View. Geophys. Res. Lett. 2023, 50, e2022GL100823. [Google Scholar] [CrossRef]
  43. Fritz, C.; Wang, Z.; Nesbitt, S.W.; Dunkerton, T.J. Vertical Structure and Contribution of Different Types of Precipitation during Atlantic Tropical Cyclone Formation as Revealed by TRMM PR. Geophys. Res. Lett. 2016, 43, 894–901. [Google Scholar] [CrossRef]
  44. Wang, K.; Chen, G.; Bi, X.; Shi, D.; Chen, K. Comparison of Convective and Stratiform Precipitation Properties in Developing and Nondeveloping Tropical Disturbances Observed by the Global Precipitation Measurement over the Western North Pacific. J. Meteorol. Soc. Jpn. 2020, 98, 1051–1067. [Google Scholar] [CrossRef]
  45. Knapp, K.R.; Kruk, M.C.; Levinson, D.H.; Diamond, H.J.; Neumann, C.J. The International Best Track Archive for Climate Stewardship (IBTrACS): Unifying Tropical Cyclone Data. Bull. Am. Meteorol. Soc. 2010, 91, 363–376. [Google Scholar] [CrossRef]
  46. Hersbach, H.; Bell, B.; Berrisford, P.; Hirahara, S.; Horányi, A.; Muñoz-Sabater, J.; Nicolas, J.; Peubey, C.; Radu, R.; Schepers, D.; et al. The ERA5 Global Reanalysis. Q. J. R. Meteorol. Soc. 2020, 146, 1999–2049. [Google Scholar] [CrossRef]
  47. Zarzycki, C.M.; Ullrich, P.A.; Reed, K.A. Metrics for Evaluating Tropical Cyclones in Climate Data. J. Appl. Meteorol. Clim. 2021, 60, 643–660. [Google Scholar] [CrossRef]
  48. Clayson, C.A.; Brown, J. NOAA CDR Program NOAA Climate Data Record Ocean Surface Bundle (OSB) Climate Data Record (CDR) of Ocean Heat Fluxes, Version 2; NOAA National Center for Environmental Information: Ashville, NC, USA, 2016. [Google Scholar] [CrossRef]
  49. Clayson, C.A.; Brown, J. NOAA CDR Program NOAA Climate Data Record (CDR) of Sea Surface Temperature—WHOI, Version 2; NOAA National Climatic Data Center: Ashville, NC, USA, 2016. [Google Scholar] [CrossRef]
  50. Clayson, C.A.; Brown, J. NOAA CDR Program NOAA Climate Data Record (CDR) of Ocean Near Surface Atmospheric Properties, Version 2; NOAA National Climatic Data Center: Ashville, NC, USA, 2016. [Google Scholar] [CrossRef]
  51. Huffman, G.J.; Bolvin, D.T.; Nelkin, E.J.; Wolff, D.B.; Adler, R.F.; Gu, G.; Hong, Y.; Bowman, K.P.; Stocker, E.F. The TRMM Multisatellite Precipitation Analysis (TMPA): Quasi-Global, Multiyear, Combined-Sensor Precipitation Estimates at Fine Scales. J. Hydrometeorol. 2007, 8, 38–55. [Google Scholar] [CrossRef]
  52. Gao, S.; Zhu, L.; Zhang, W.; Shen, X. Western North Pacific Tropical Cyclone Activity in 2018: A Season of Extremes. Sci. Rep. 2020, 10, 5610. [Google Scholar] [CrossRef] [PubMed]
  53. Gao, S.; Chiu, L.S.; Shie, C. Trends and Variations of Ocean Surface Latent Heat Flux: Results from GSSTF2c Data Set. Geophys. Res. Lett. 2013, 40, 380–385. [Google Scholar] [CrossRef]
  54. Gao, S.; Zhai, S.; Chiu, L.S.; Xia, D. Satellite Air–Sea Enthalpy Flux and Intensity Change of Tropical Cyclones over the Western North Pacific. J. Appl. Meteorol. Clim. 2016, 55, 425–444. [Google Scholar] [CrossRef]
  55. Gao, S.; Zhai, S.; Chen, B.; Li, T. Water Budget and Intensity Change of Tropical Cyclones over the Western North Pacific. Mon. Weather Rev. 2017, 145, 3009–3023. [Google Scholar] [CrossRef]
  56. Dunion, J.P. Rewriting the Climatology of the Tropical North Atlantic and Caribbean Sea Atmosphere. J. Clim. 2011, 24, 893–908. [Google Scholar] [CrossRef]
  57. Komaromi, W.A. An Investigation of Composite Dropsonde Profiles for Developing and Nondeveloping Tropical Waves during the 2010 PREDICT Field Campaign. J. Atmos. Sci. 2013, 70, 542–558. [Google Scholar] [CrossRef]
  58. Emanuel, K.A. The Finite-Amplitude Nature of Tropical Cyclogenesis. J. Atmos. Sci. 1989, 46, 3431–3456. [Google Scholar] [CrossRef]
  59. Raymond, D.D.J.; López-Carrillo, C.; Cavazos, L.L. Case-studies of Developing East Pacific Easterly Waves. Q. J. R. Meteorol. Soc. 1998, 124, 2005–2034. [Google Scholar] [CrossRef]
  60. Davis, C.A.; Ahijevych, D.A. Mesoscale Structural Evolution of Three Tropical Weather Systems Observed during PREDICT. J. Atmos. Sci. 2012, 69, 1284–1305. [Google Scholar] [CrossRef]
  61. Sadler, J.C. A Role of the Tropical Upper Tropospheric Trough in Early Season Typhoon Development. Mon. Weather Rev. 1976, 104, 1266–1278. [Google Scholar] [CrossRef]
  62. Zhan, R.; Wang, Y.; Ding, Y. Impact of the Western Pacific Tropical Easterly Jet on Tropical Cyclone Genesis Frequency over the Western North Pacific. Adv. Atmos. Sci. 2022, 39, 235–248. [Google Scholar] [CrossRef]
  63. Zhang, W.; Cui, X. Review of the studies on tropical cyclone genesis. J. Trop. Meteorol. 2013, 29, 337–346, (In Chinese with English abstract). [Google Scholar] [CrossRef]
  64. Chen, S.S.; Knaff, J.A.; Marks, F.D. Effects of Vertical Wind Shear and Storm Motion on Tropical Cyclone Rainfall Asymmetries Deduced from TRMM. Mon. Weather Rev. 2006, 134, 3190–3208. [Google Scholar] [CrossRef]
  65. Gao, S.; Zhai, S.; Li, T.; Chen, Z. On the Asymmetric Distribution of Shear-Relative Typhoon Rainfall. Meteorol. Atmos. Phys. 2018, 130, 11–22. [Google Scholar] [CrossRef]
  66. Liang, J.; Chan, K.T.F. Rainfall Asymmetries of the Western North Pacific Tropical Cyclones as Inferred from GPM. Int. J. Climatol. 2021, 41, 5465–5480. [Google Scholar] [CrossRef]
  67. Bretherton, C.S.; Peters, M.E.; Back, L.E. Relationships between Water Vapor Path and Precipitation over the Tropical Oceans. J. Clim. 2004, 17, 1517–1528. [Google Scholar] [CrossRef]
  68. Neelin, J.D.; Peters, O.; Hales, K. The Transition to Strong Convection. J. Atmos. Sci. 2009, 66, 2367–2384. [Google Scholar] [CrossRef]
  69. Raymond, D.J. Thermodynamic Control of Tropical Rainfall. Q. J. R. Meteorol. Soc. 2000, 126, 889–898. [Google Scholar] [CrossRef]
  70. Bui, H.H.; Smith, R.K.; Montgomery, M.T.; Peng, J. Balanced and Unbalanced Aspects of Tropical Cyclone Intensification. Q. J. R. Meteorol. Soc. 2009, 135, 1715–1731. [Google Scholar] [CrossRef]
  71. Eliassen, A. Slow Thermally or Frictionally Controlled Meridional Circulation in a Circular Vortex. Astrophisica Nor. 1951, 5, 19–60. [Google Scholar]
  72. Shapiro, L.J.; Willoughby, H.E. The Response of Balanced Hurricanes to Local Sources of Heat and Momentum. J. Atmos. Sci. 1982, 39, 378–394. [Google Scholar] [CrossRef]
  73. Wang, Z. Role of Cumulus Congestus in Tropical Cyclone Formation in a High-Resolution Numerical Model Simulation. J. Atmos. Sci. 2014, 71, 1681–1700. [Google Scholar] [CrossRef]
  74. Zhang, W.; Fu, B.; Peng, M.S.; Li, T. Discriminating Developing versus Nondeveloping Tropical Disturbances in the Western North Pacific through Decision Tree Analysis. Weather Forecast. 2015, 30, 446–454. [Google Scholar] [CrossRef]
  75. Kim, M.; Park, M.-S.; Im, J.; Park, S.; Lee, M.-I. Machine Learning Approaches for Detecting Tropical Cyclone Formation Using Satellite Data. Remote Sens. 2019, 11, 1195. [Google Scholar] [CrossRef]
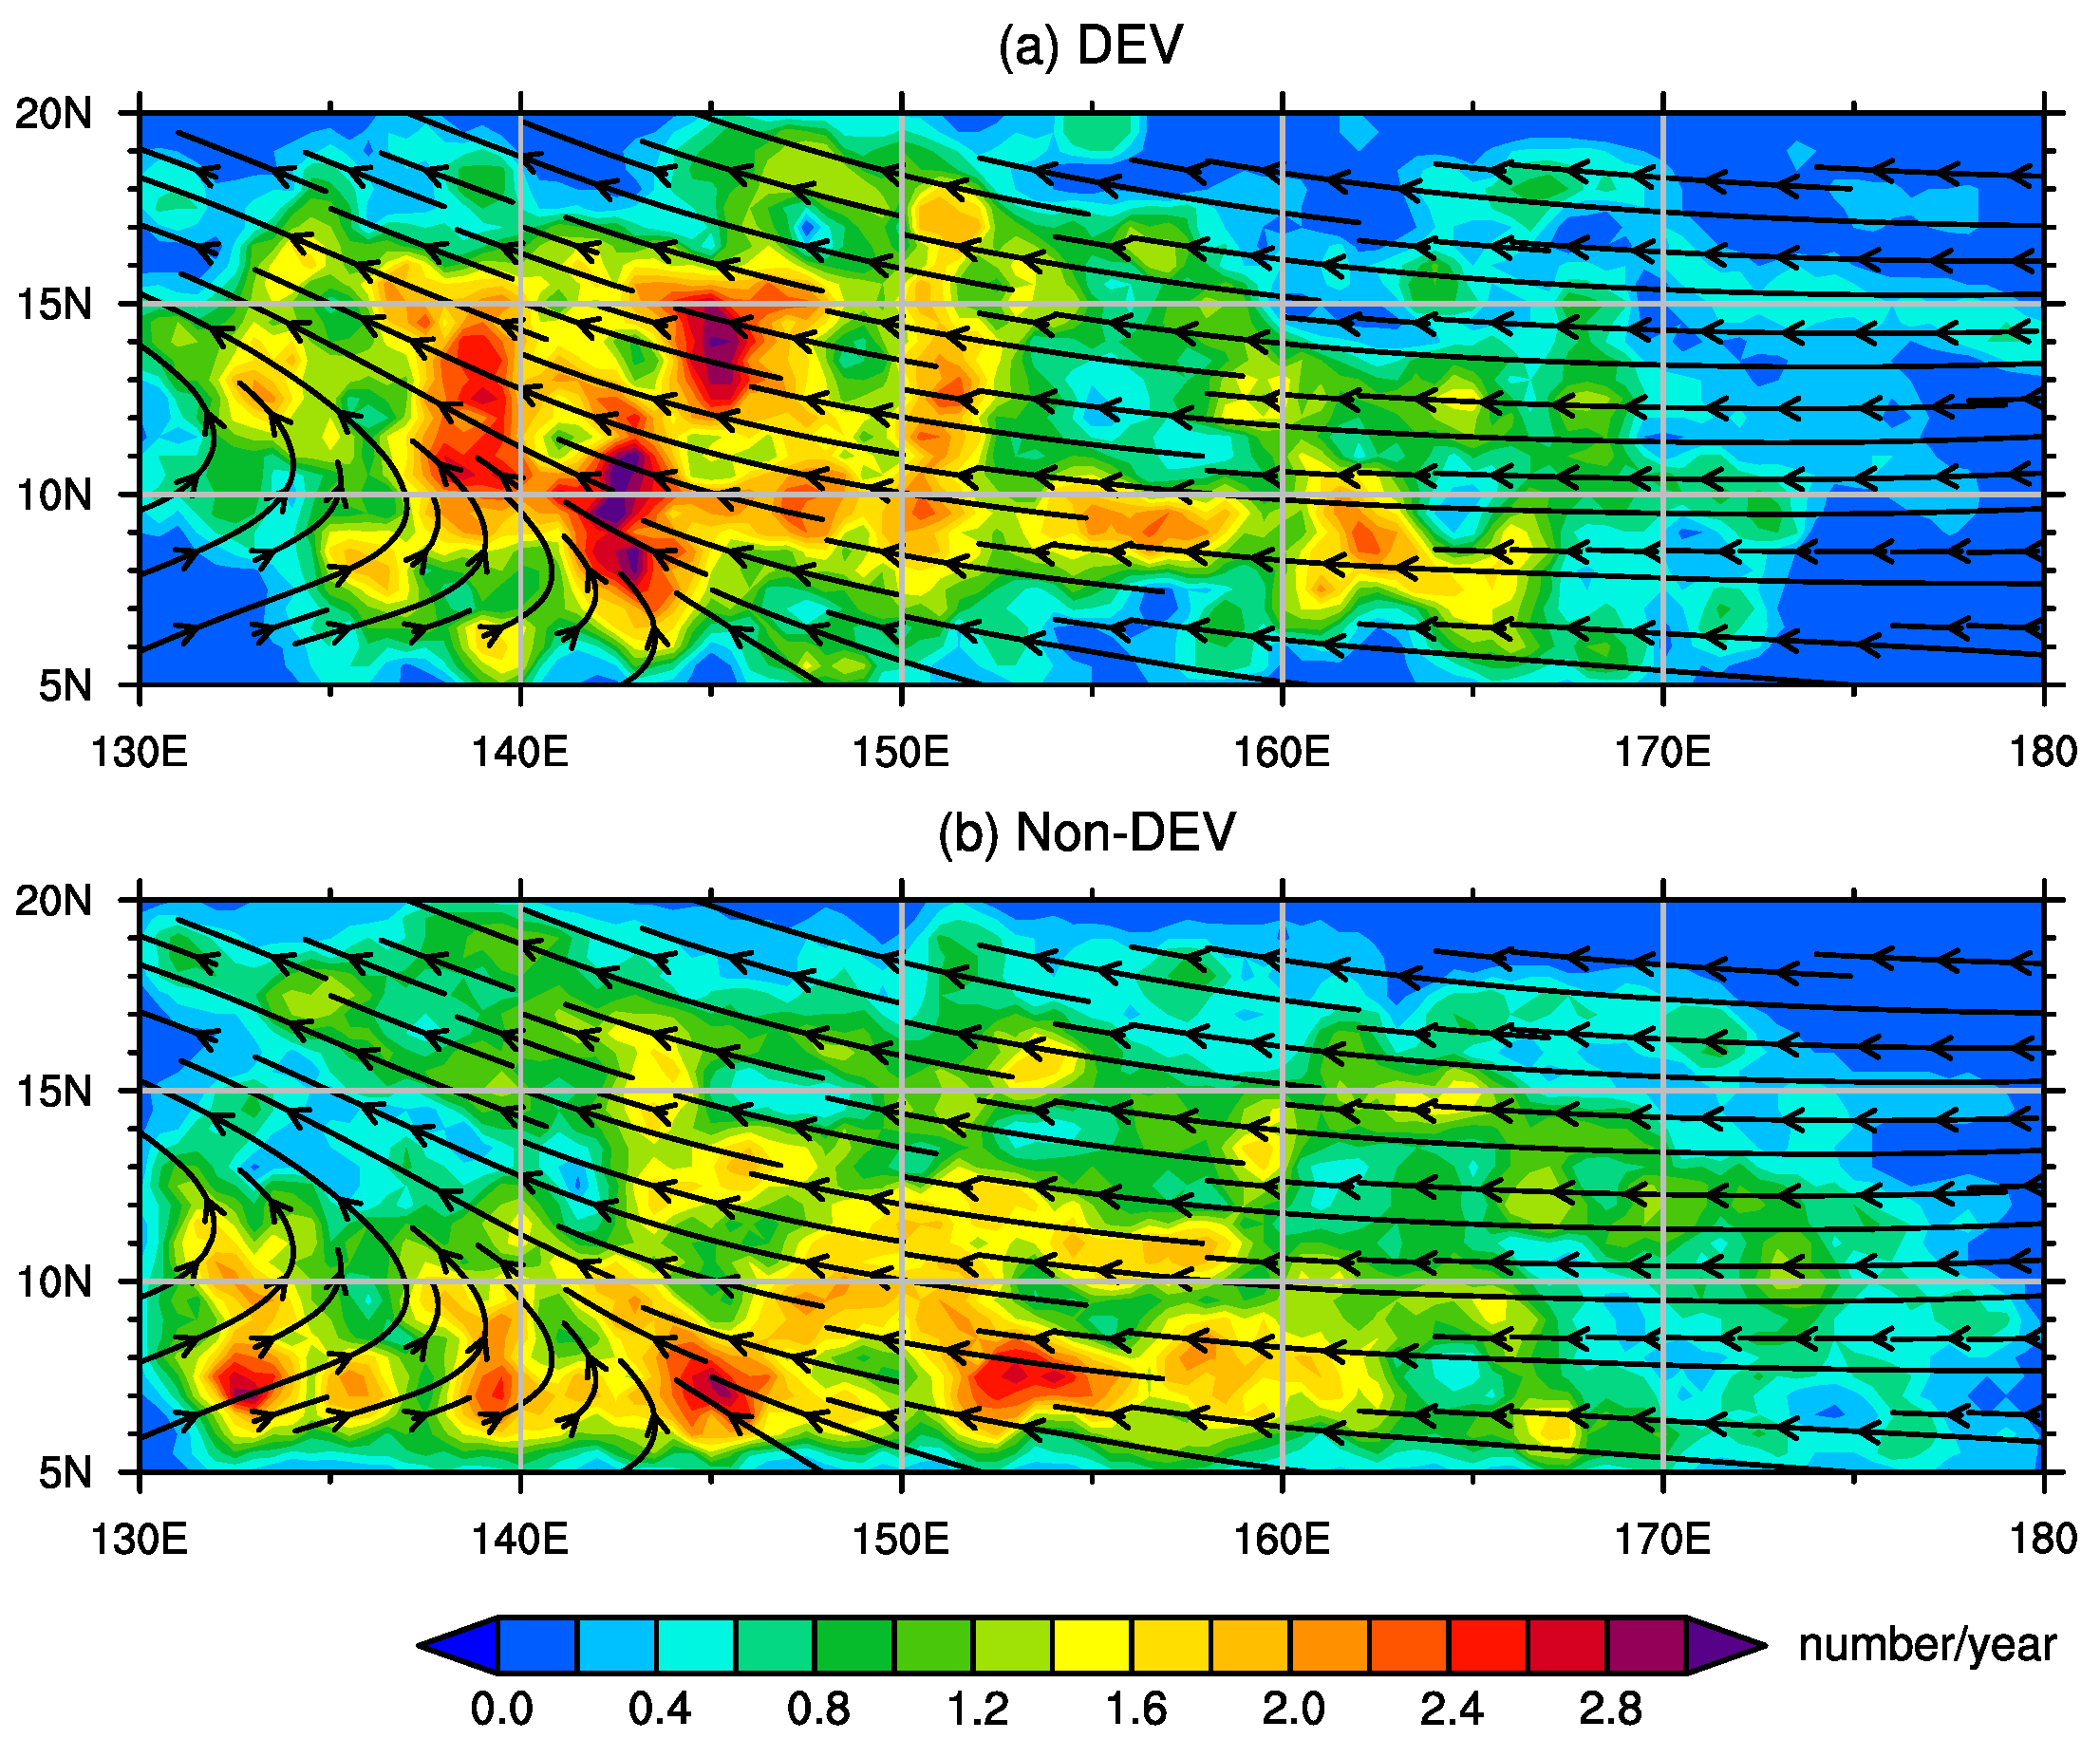
Figure 1. Track density (number of occurrences per year per 1° × 1° latitude–longitude grid box) of (a) the developing and (b) non-developing tropical disturbances, as well as climatological mean 850 hPa streamline, during June–November of 2000–2019 over the WNP.
Remotesensing 16 02396 g001
Figure 2. Composite 3–8-day-filtered 850 hPa relative vorticity (shading, 10−5 s−1) and wind (vector, m s−1) for (ad) the developing, (eh) non-developing disturbances, and (il) their differences from day −3 to 0. Bold black dots indicate the disturbance centers. The shading in (il) denotes significantly different relative vorticity at the 95% confidence level based on a t test.
Remotesensing 16 02396 g002
Figure 3. Time series of area-averaged (a) 3–8-day-filtered 850 hPa relative vorticity (10−5 s−1) within 2° of the disturbance centers and (b) 20-day low-pass filtered 200–850 hPa vertical wind shear (m s–1) within 2°–8° of the disturbance center for the developing (red) and non-developing (blue) disturbances. The bars denote standard deviations. The filled markers represent significant differences between two groups of disturbances at the 95% confidence level based on a t test.
Remotesensing 16 02396 g003
Figure 4. Composite TPW (mm) for (ad) the developing and (eh) non-developing disturbances from day −3 to 0, as well as the corresponding radius–time Hovmöller plots for (i) developing and (j) non-developing disturbances and (k) their differences. In (ah), bold black dots indicate the disturbance centers and concentric circles represent different radii at 1° intervals centered at the disturbance centers. The shading in (k) denotes significant differences at the 95% confidence level based on a t test.
Remotesensing 16 02396 g004
Figure 5. Time–height cross-sections of specific humidity anomalies (g kg−1), which are computed with respect to the Dunion (2011) moist tropical sounding, in a 10° × 10° box centered at (a) the developing disturbances, (b) non-developing disturbances, and (c) their differences. The shading in (c) denotes significant differences at the 95% confidence level based on a t test.
Remotesensing 16 02396 g005
Figure 6. Same as Figure 4, but for evaporation (mm h−1).
Remotesensing 16 02396 g006
Figure 7. Composite SST (°C) for (ad) the developing and (eh) non-developing disturbances from day −3 to 0. Bold black dots indicate the disturbance centers, and concentric circles represent different radii at 1° intervals centered at the disturbance centers.
Remotesensing 16 02396 g007
Figure 8. Same as Figure 4, but for surface wind speed (m s−1).
Remotesensing 16 02396 g008
Figure 9. Same as Figure 5, but for relative vorticity (10−5 s−1).
Remotesensing 16 02396 g009
Figure 10. Same as Figure 4, but for VIMFC (mm h−1).
Remotesensing 16 02396 g010
Figure 11. Same as Figure 5, but for moisture flux convergence (10−6 kg m−2 s−1 hPa−1).
Remotesensing 16 02396 g011
Figure 12. Same as Figure 5, but for divergence (10−5 s−1).
Remotesensing 16 02396 g012
Figure 13. Same as Figure 4, but for precipitation (mm h−1).
Remotesensing 16 02396 g013
Figure 14. Composite radial profiles of temperature anomalies (°C), which are computed with respect to Dunion (2011) moist tropical sounding, for (ad) the developing, (eh) non-developing disturbances, and (il) their differences from day −3 to 0. The shading in (il) denotes significantly different relative vorticity at the 95% confidence level based on a t test.
Remotesensing 16 02396 g014
Figure 15. BDI of water vapor budget components averaged in 10° × 10° boxes on days −3 (blue), −2 (green), and −1 (red). E and P represent evaporation and precipitation, respectively. The asterisks in corresponding colors beside each parameter denote significant differences between the developing and non-developing disturbances at the 95% confidence level based on a t test.
Remotesensing 16 02396 g015
Disclaimer/Publisher’s Note: The statements, opinions and data contained in all publications are solely those of the individual author(s) and contributor(s) and not of MDPI and/or the editor(s). MDPI and/or the editor(s) disclaim responsibility for any injury to people or property resulting from any ideas, methods, instructions or products referred to in the content.