


Surface Subsidence Characteristics and Causes Analysis in Ningbo Plain by Sentinel-1A TS-InSAR


Abstract
1. Introduction
2. Study Area and Materials
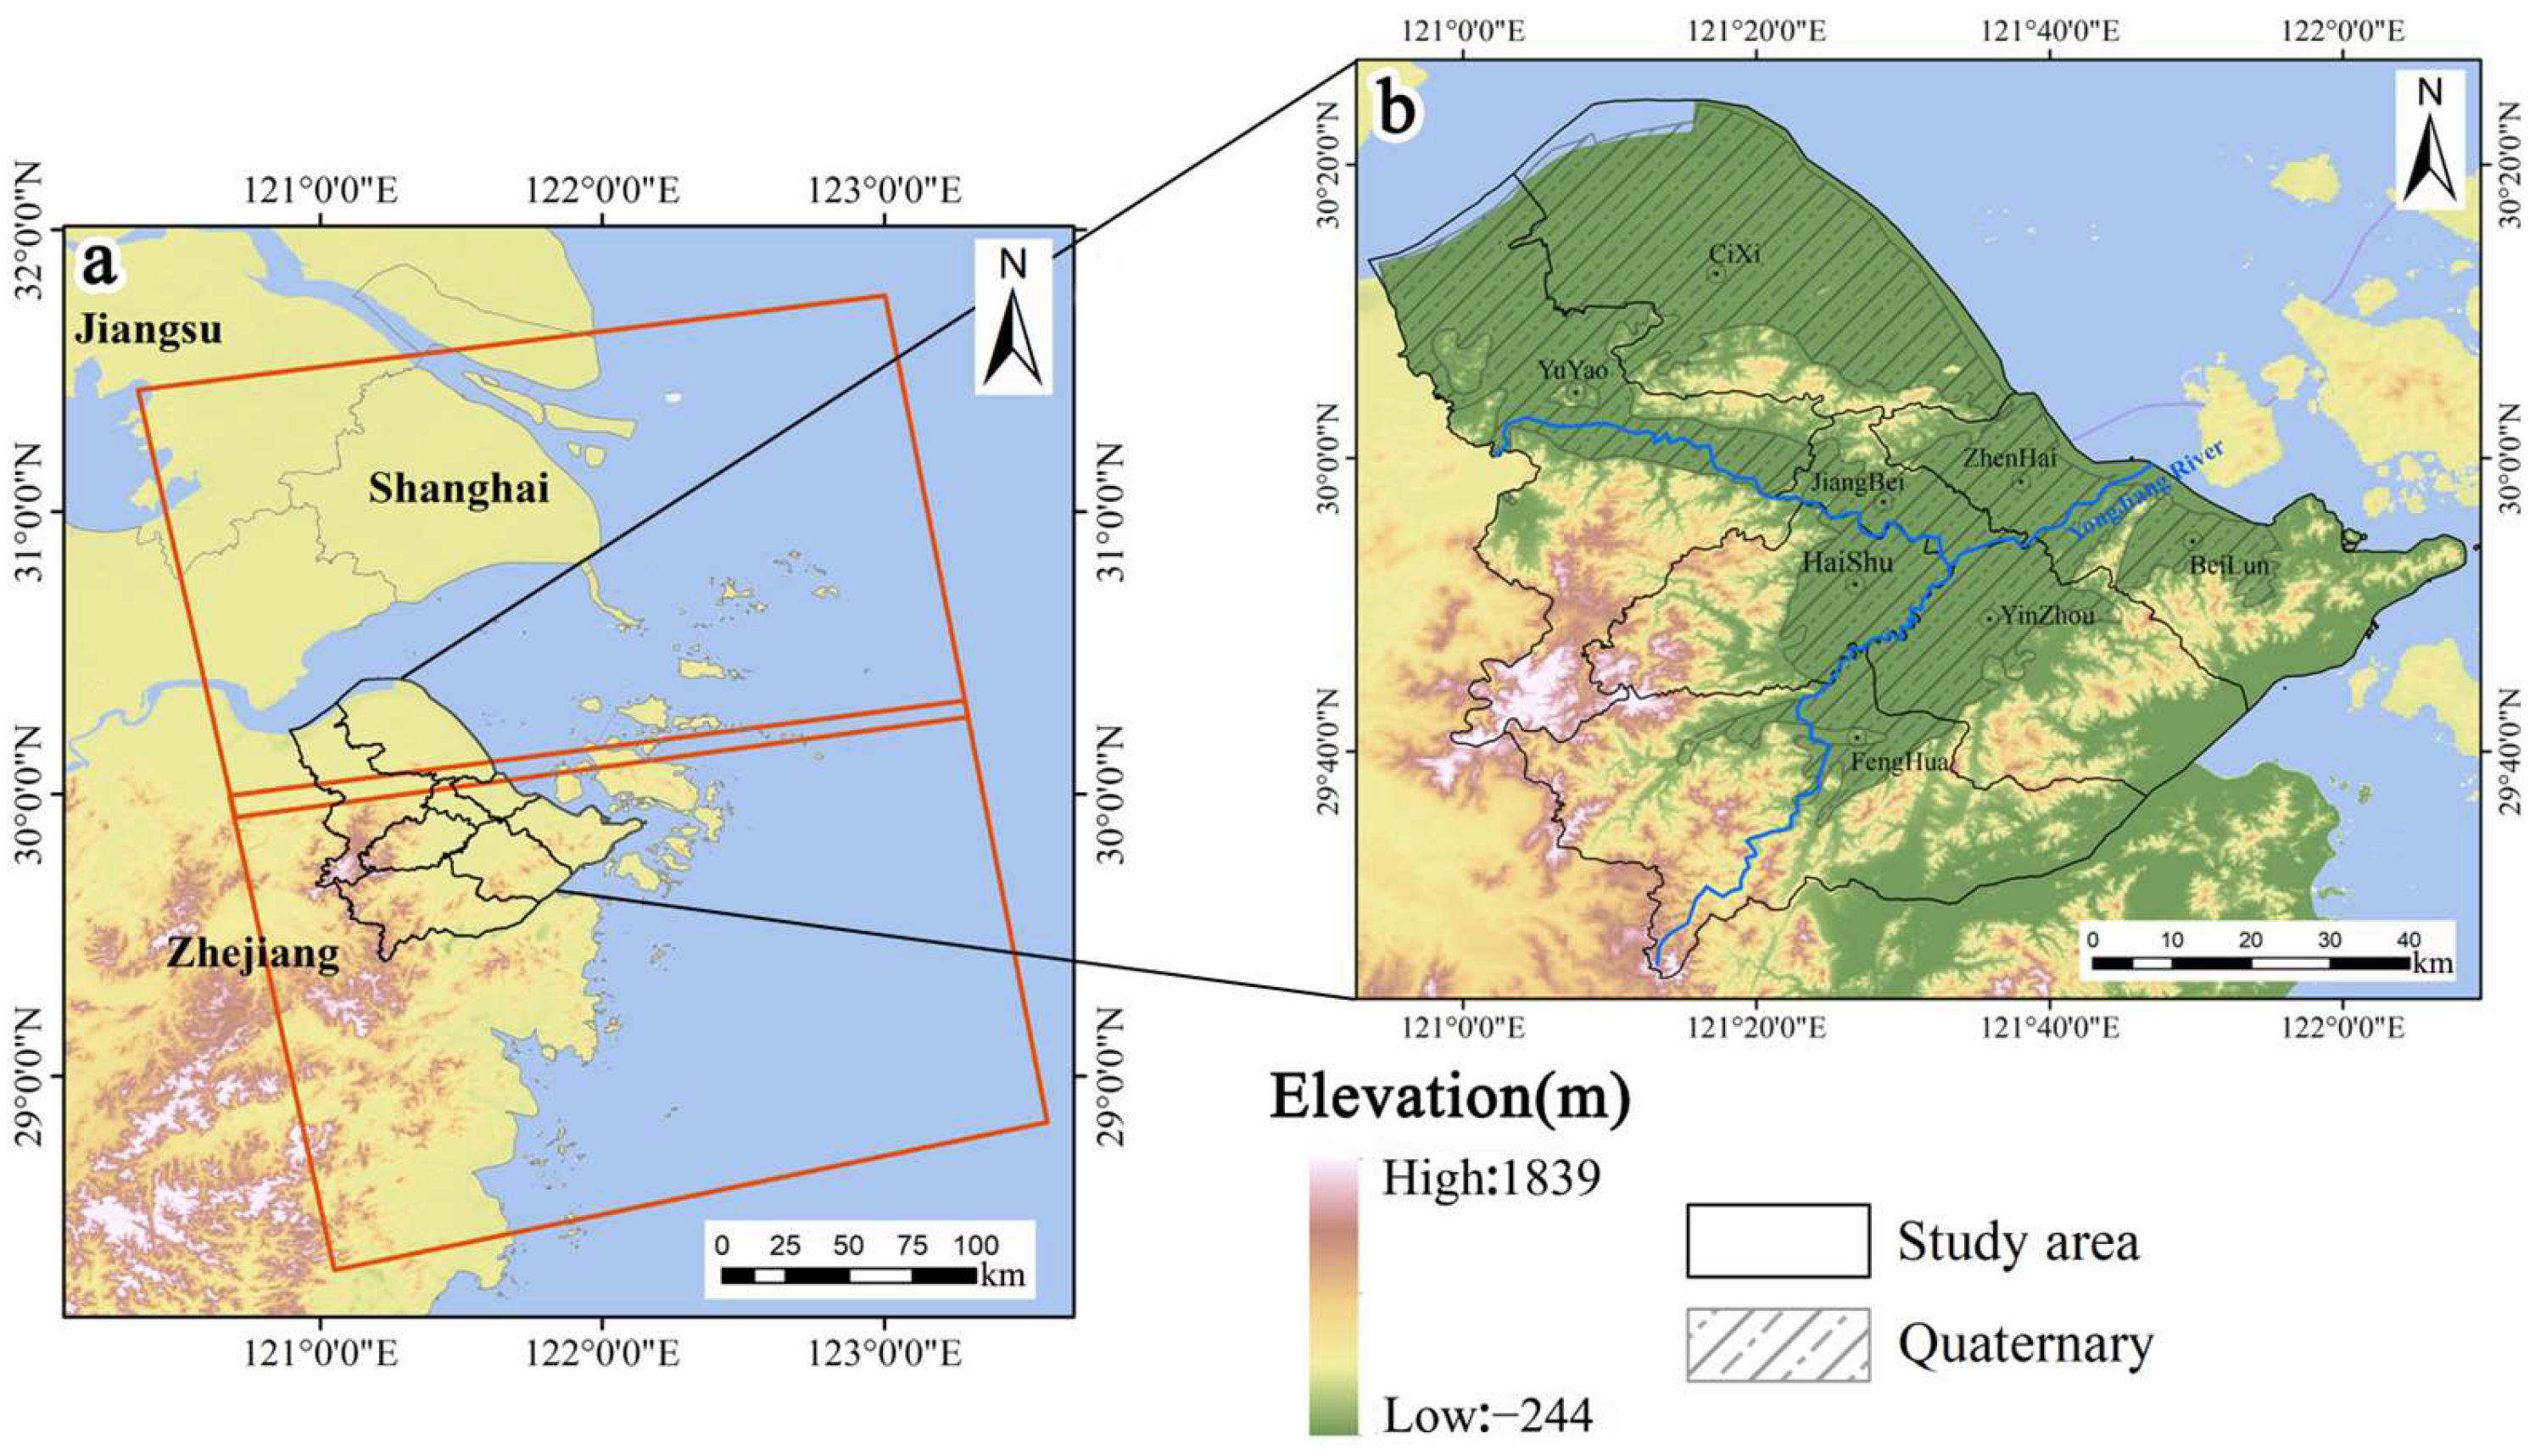
2.1. Study Area
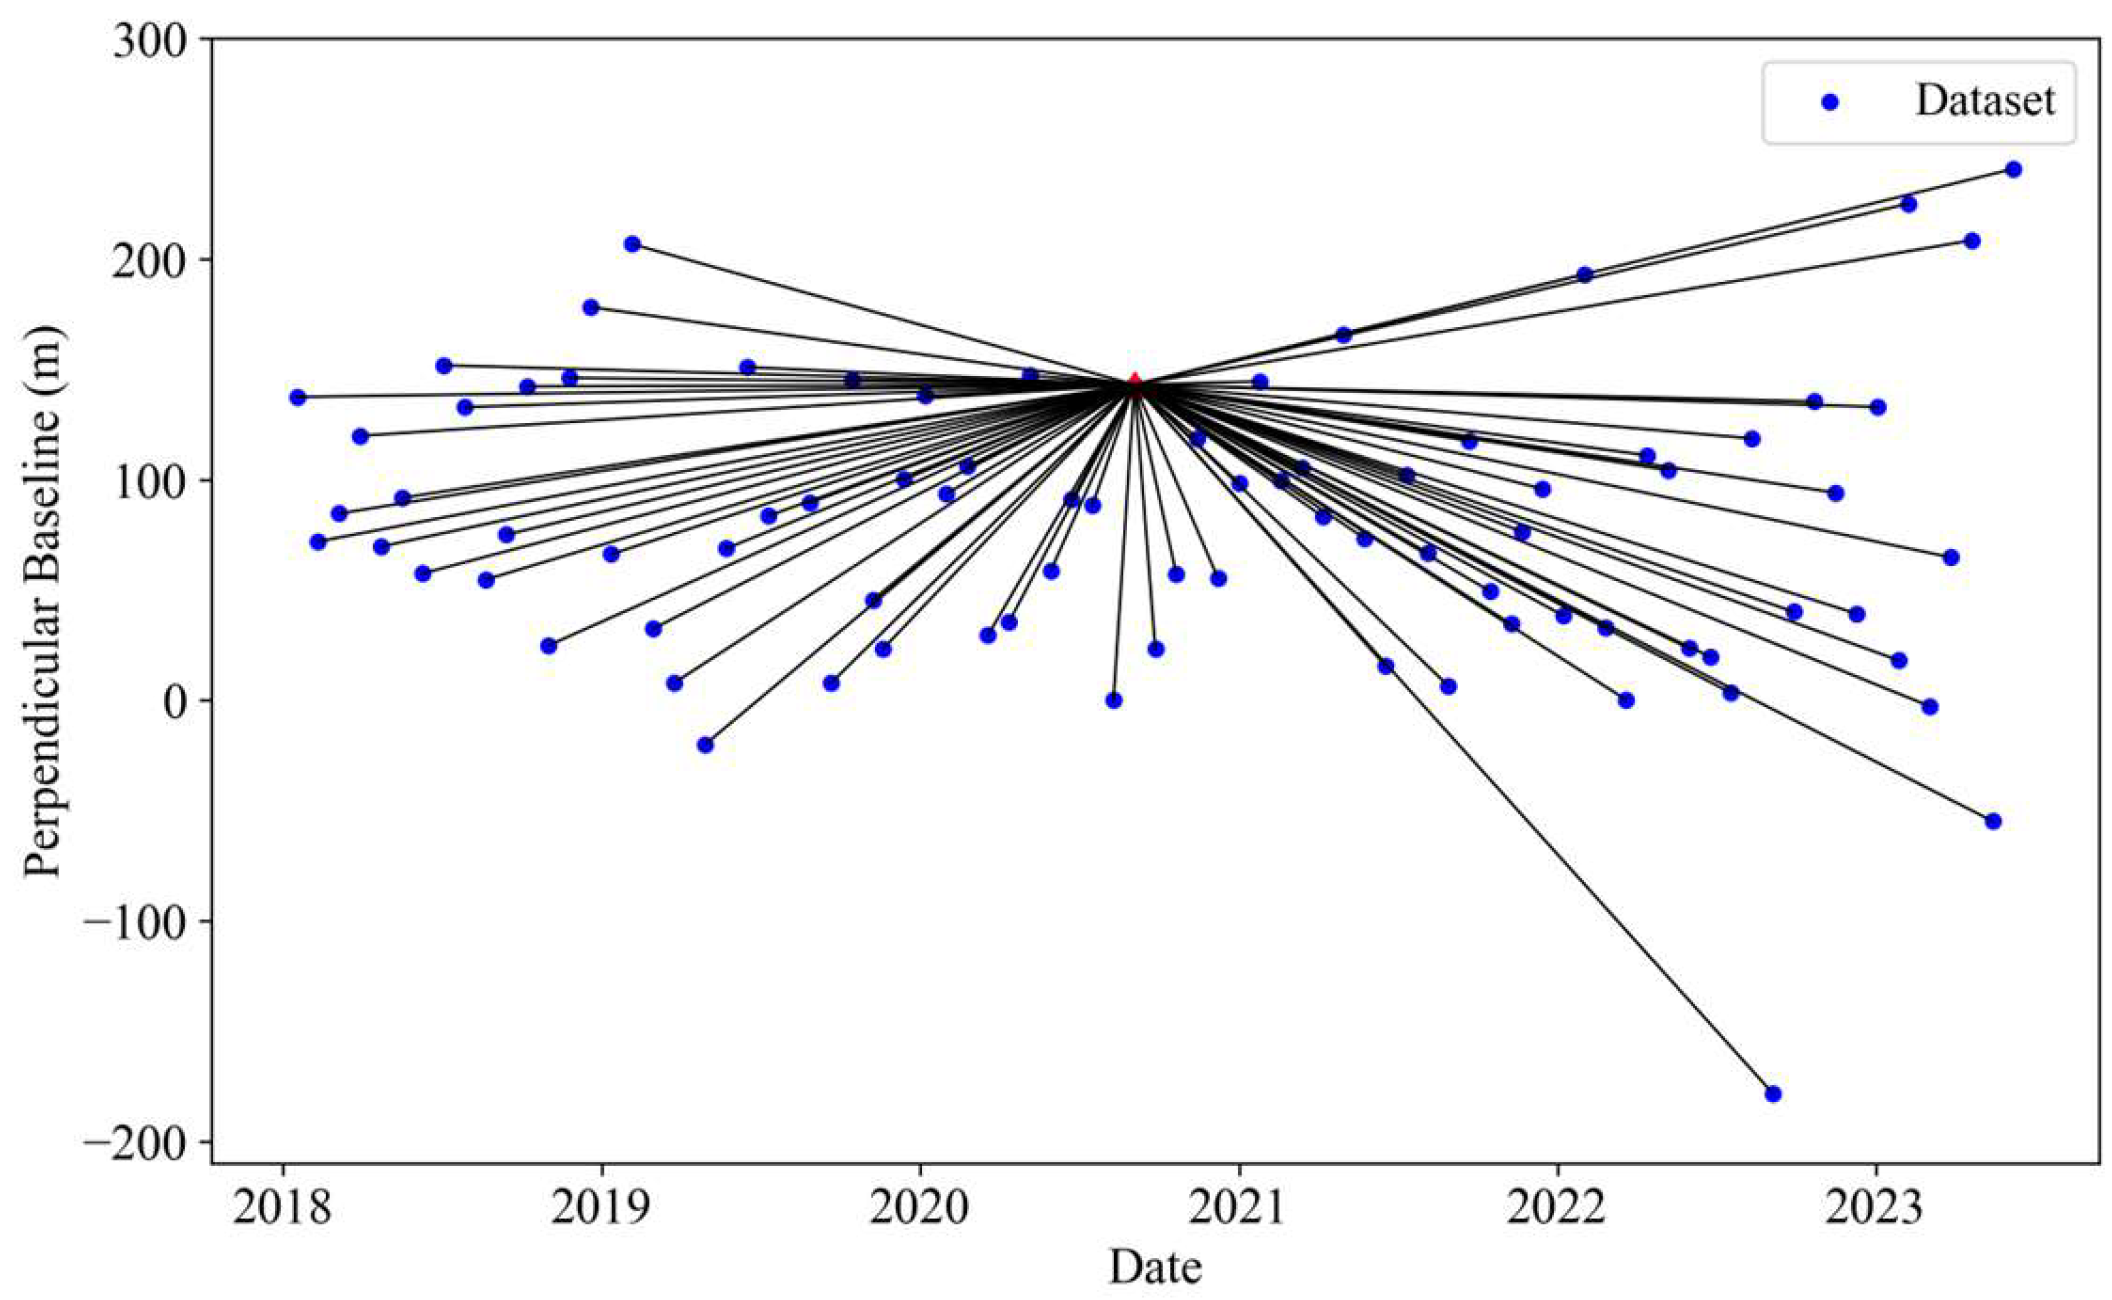
2.2. Datasets
3. Methodology
3.1. Time Series InSAR Processing
3.2. Grey Relation Analysis (GRA) Method
3.3. Vertical and Horizontal Deformation
4. Results
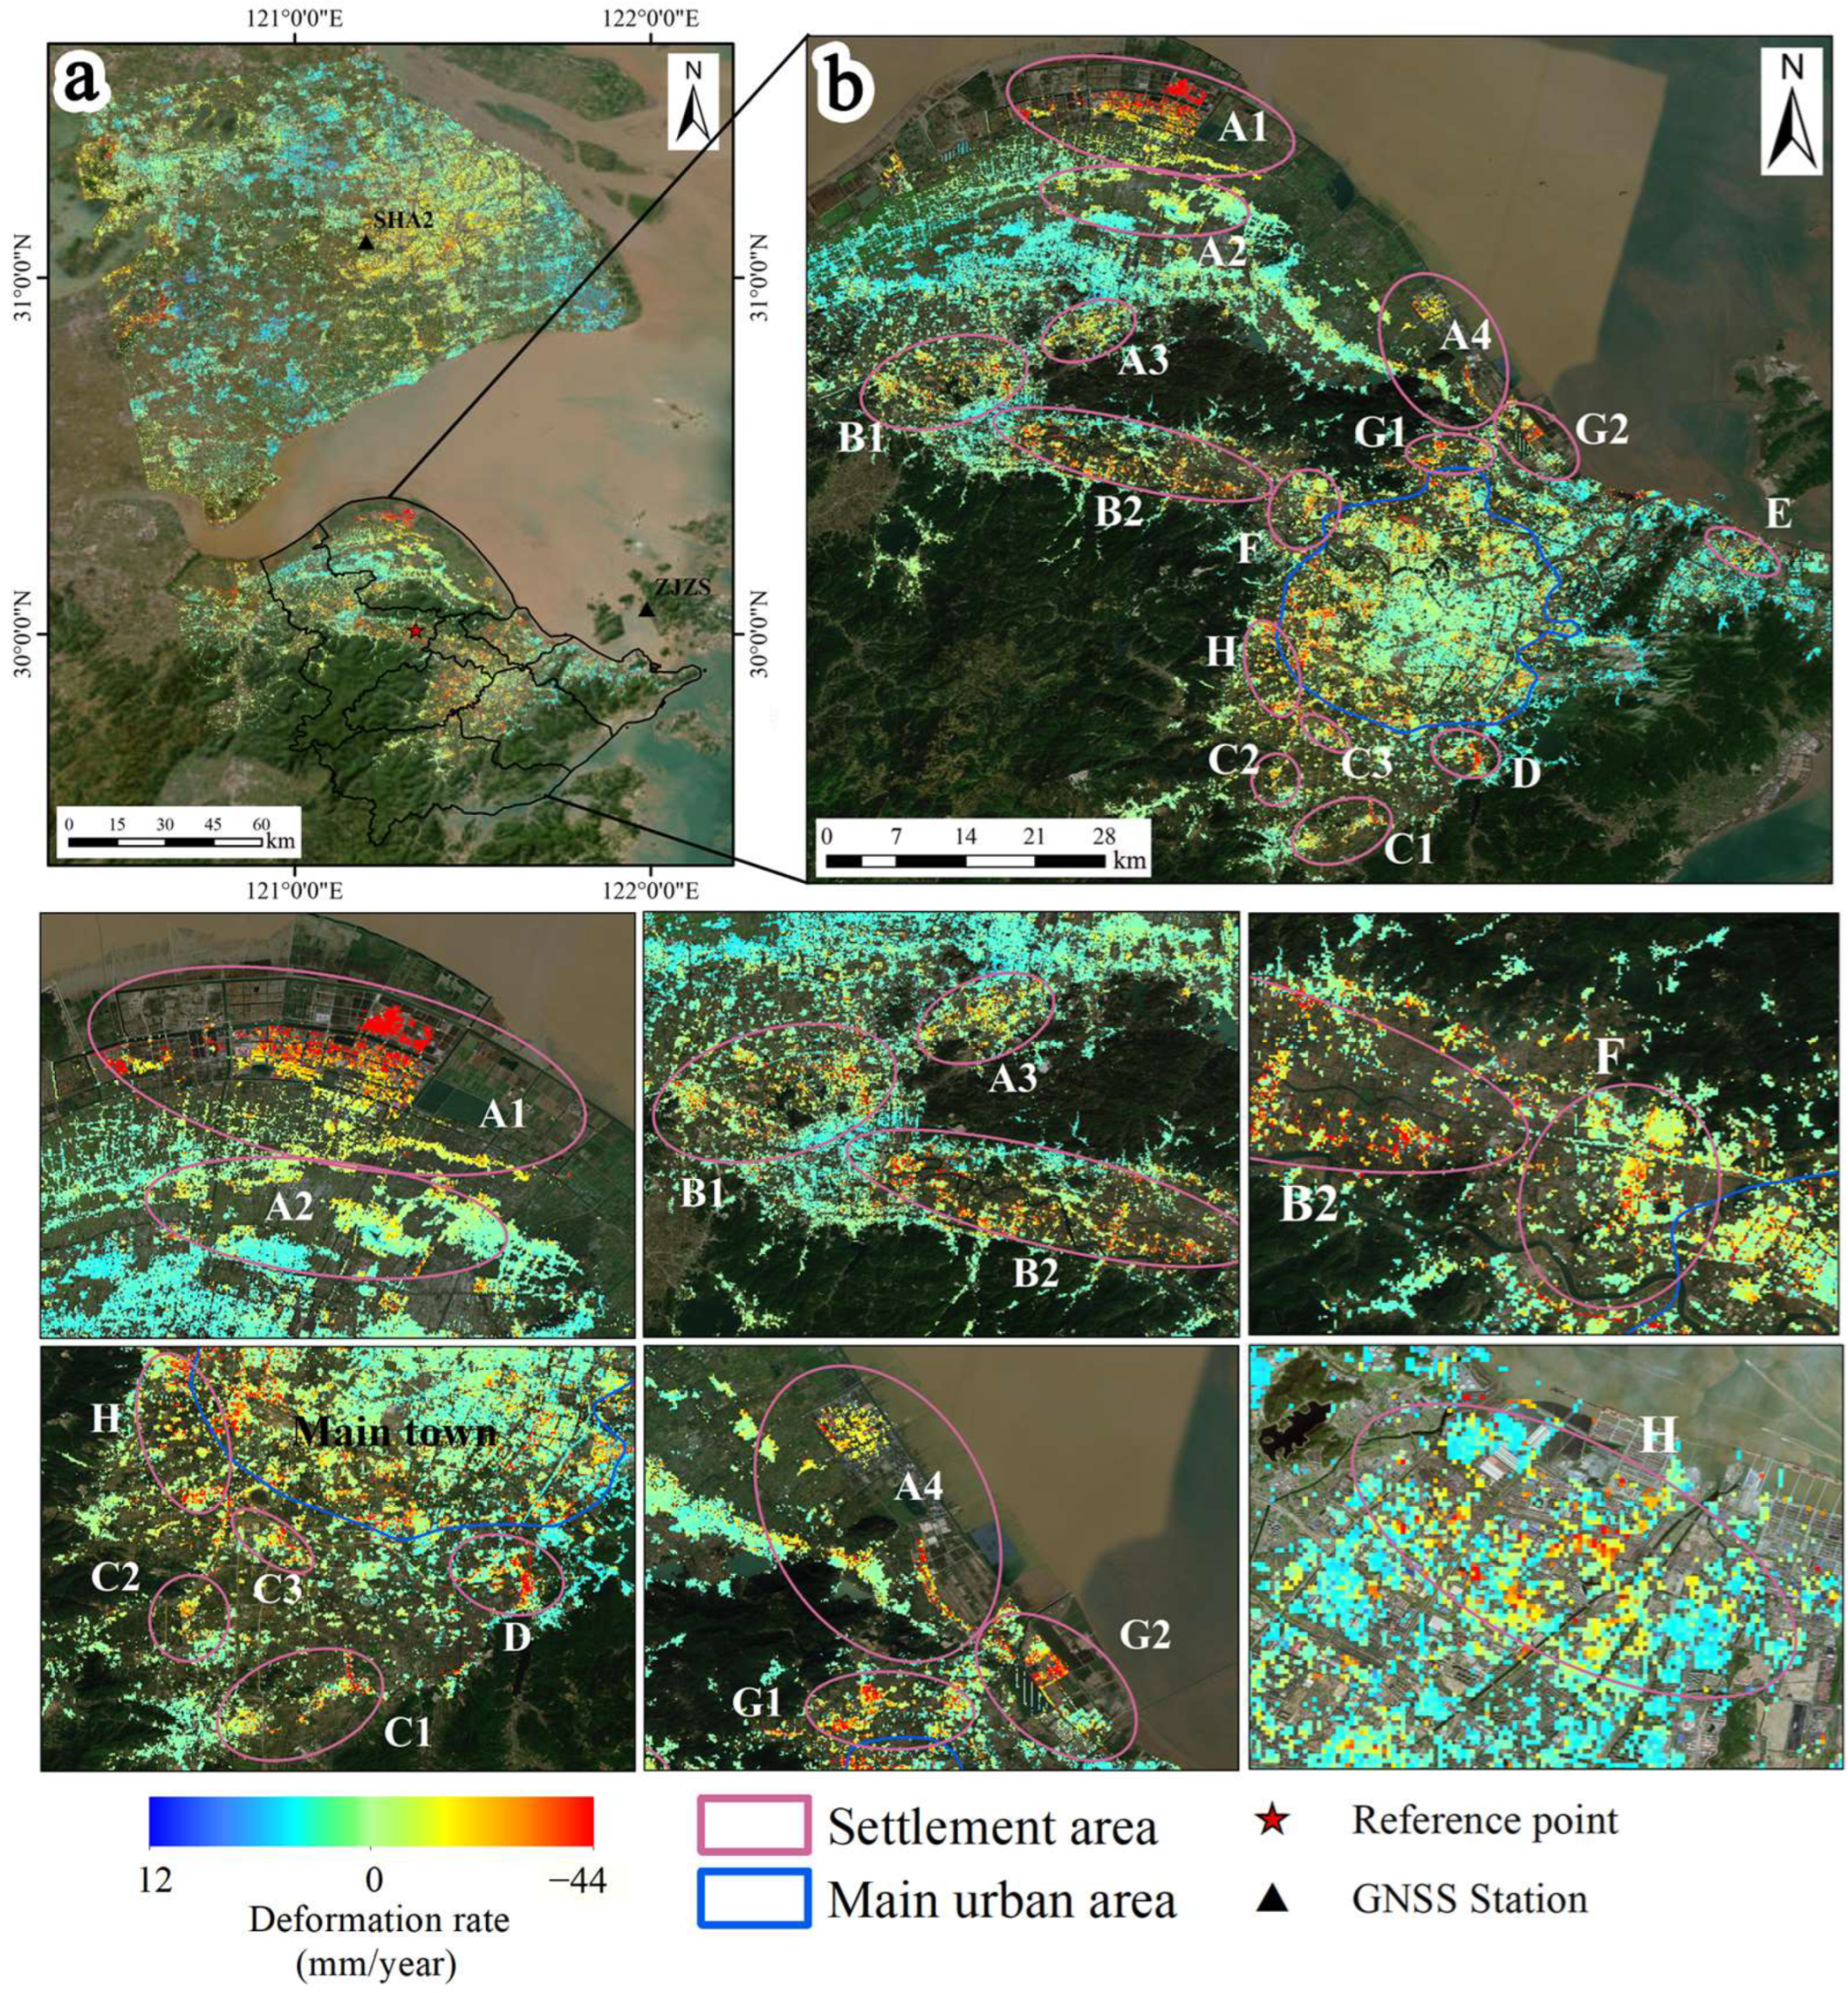
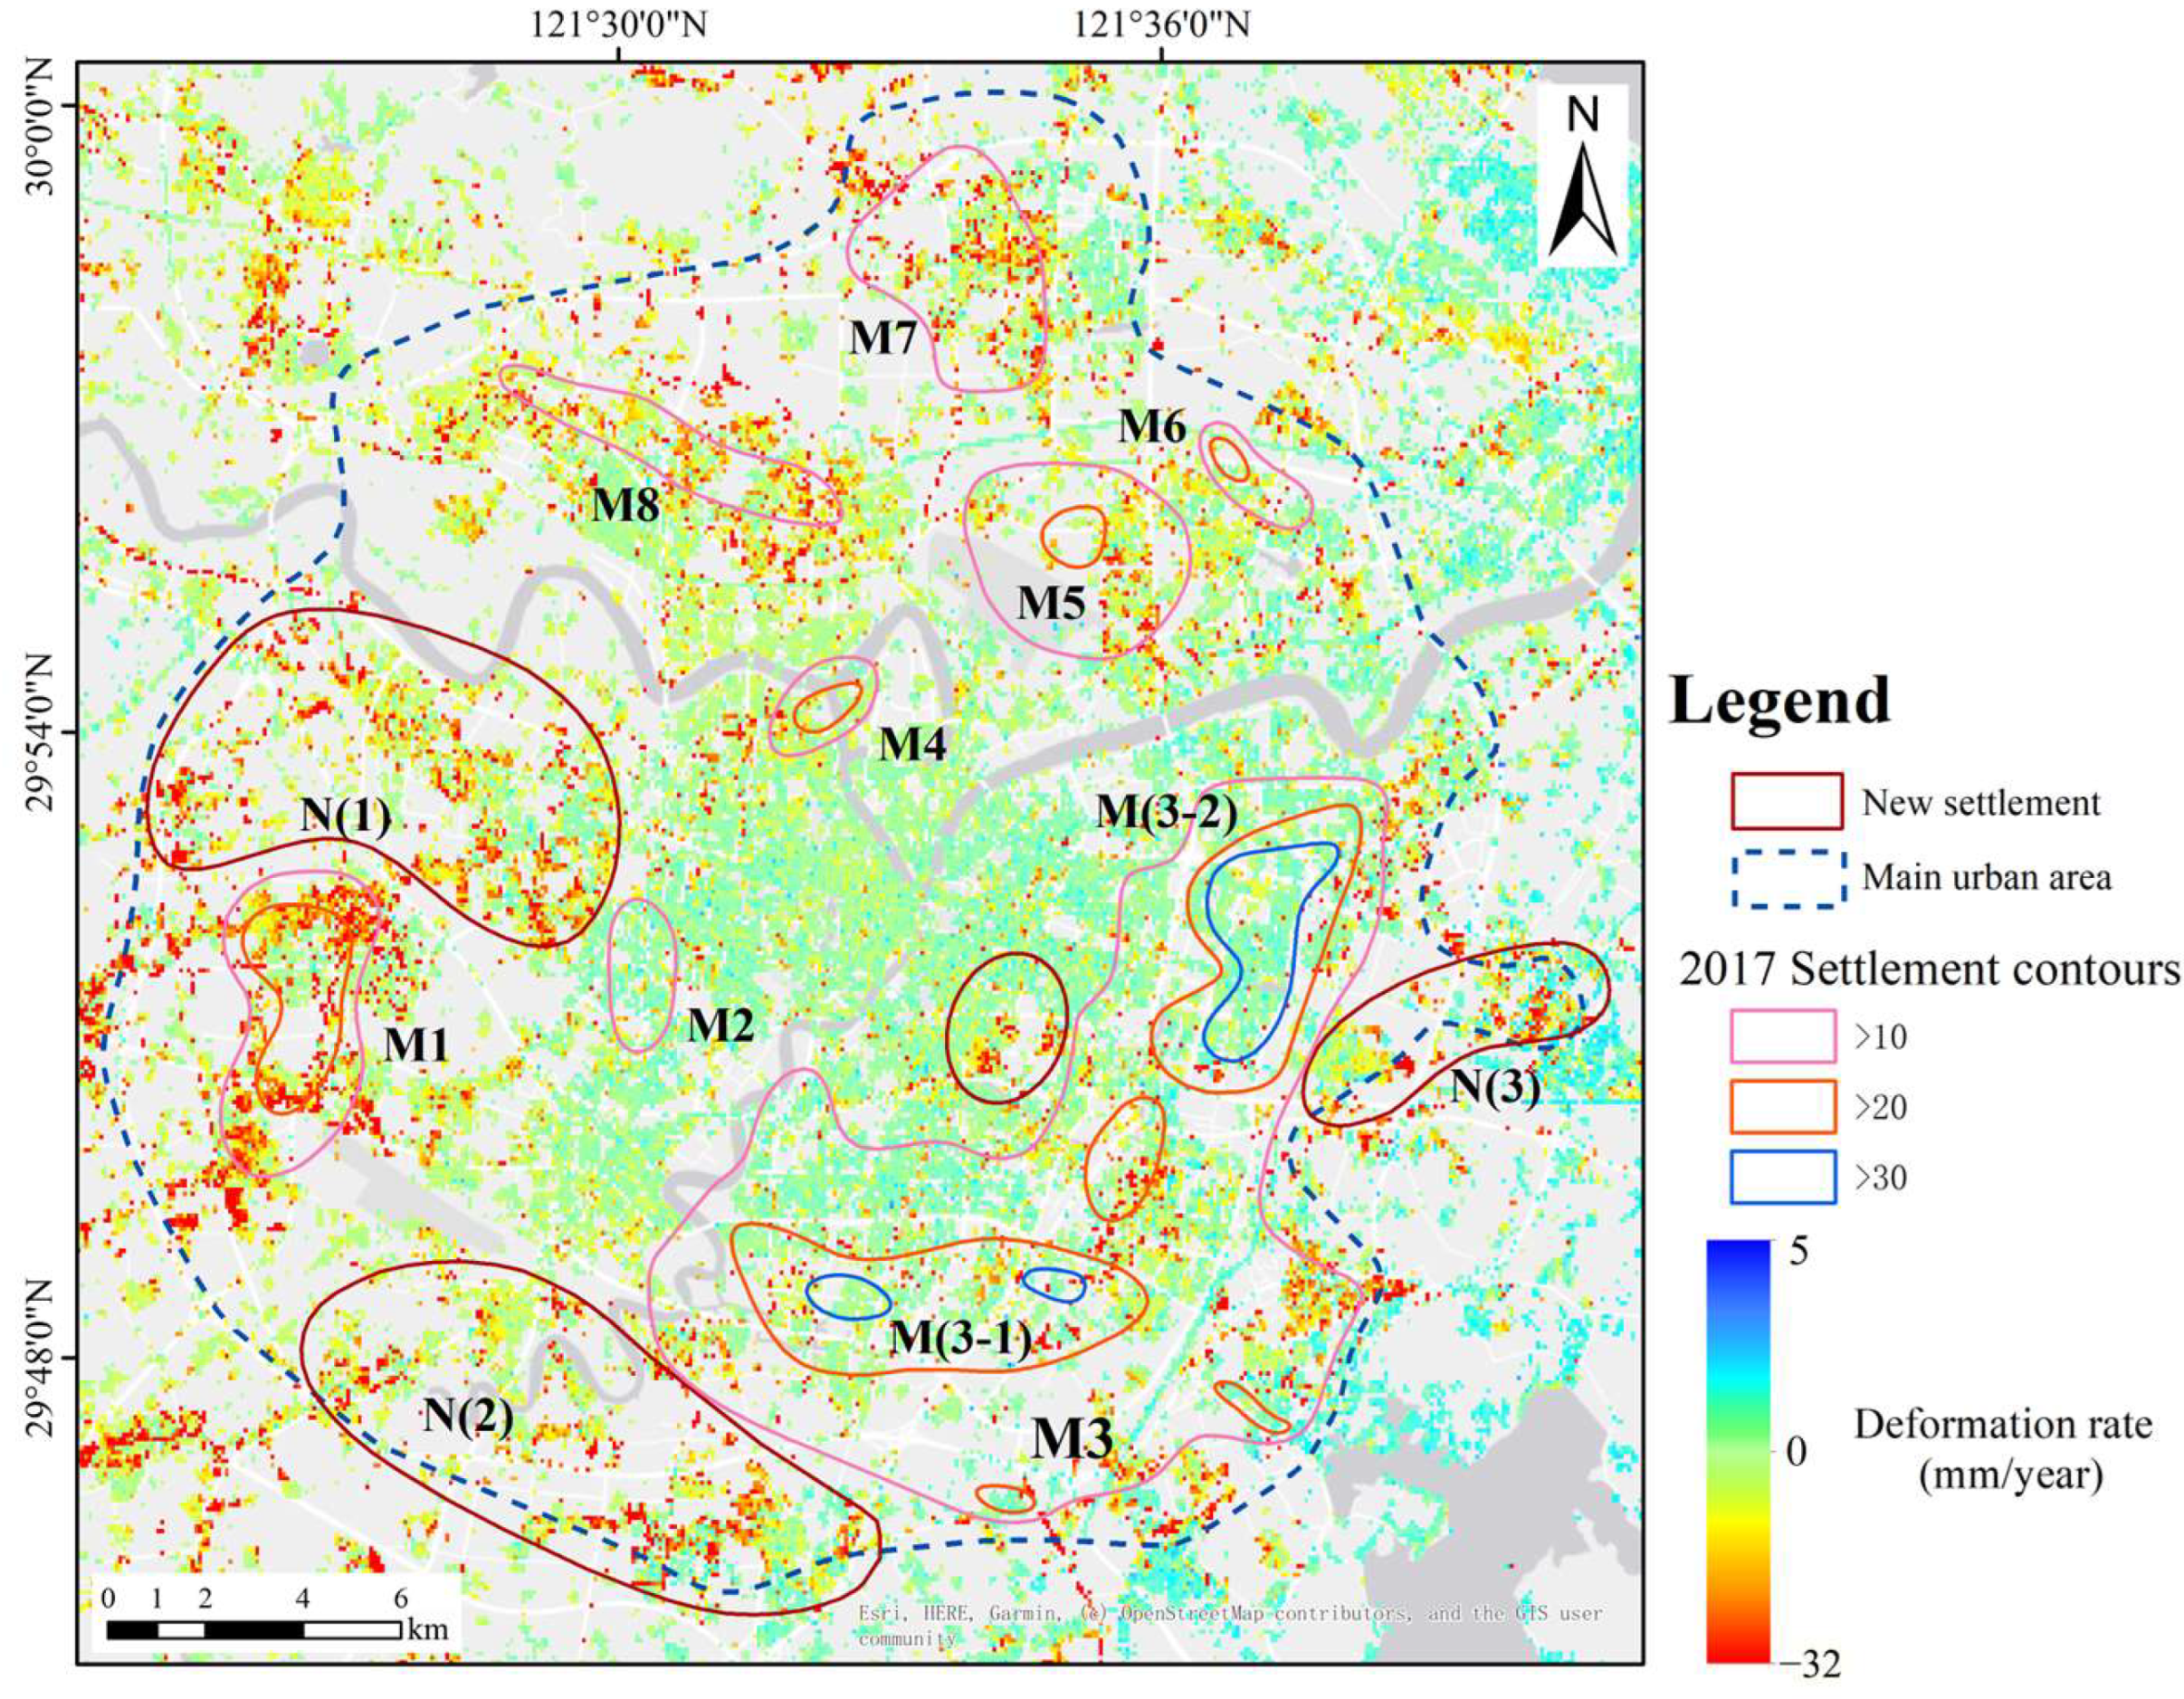
4.1. The Spatial Distribution of Surface Subsidence Monitoring
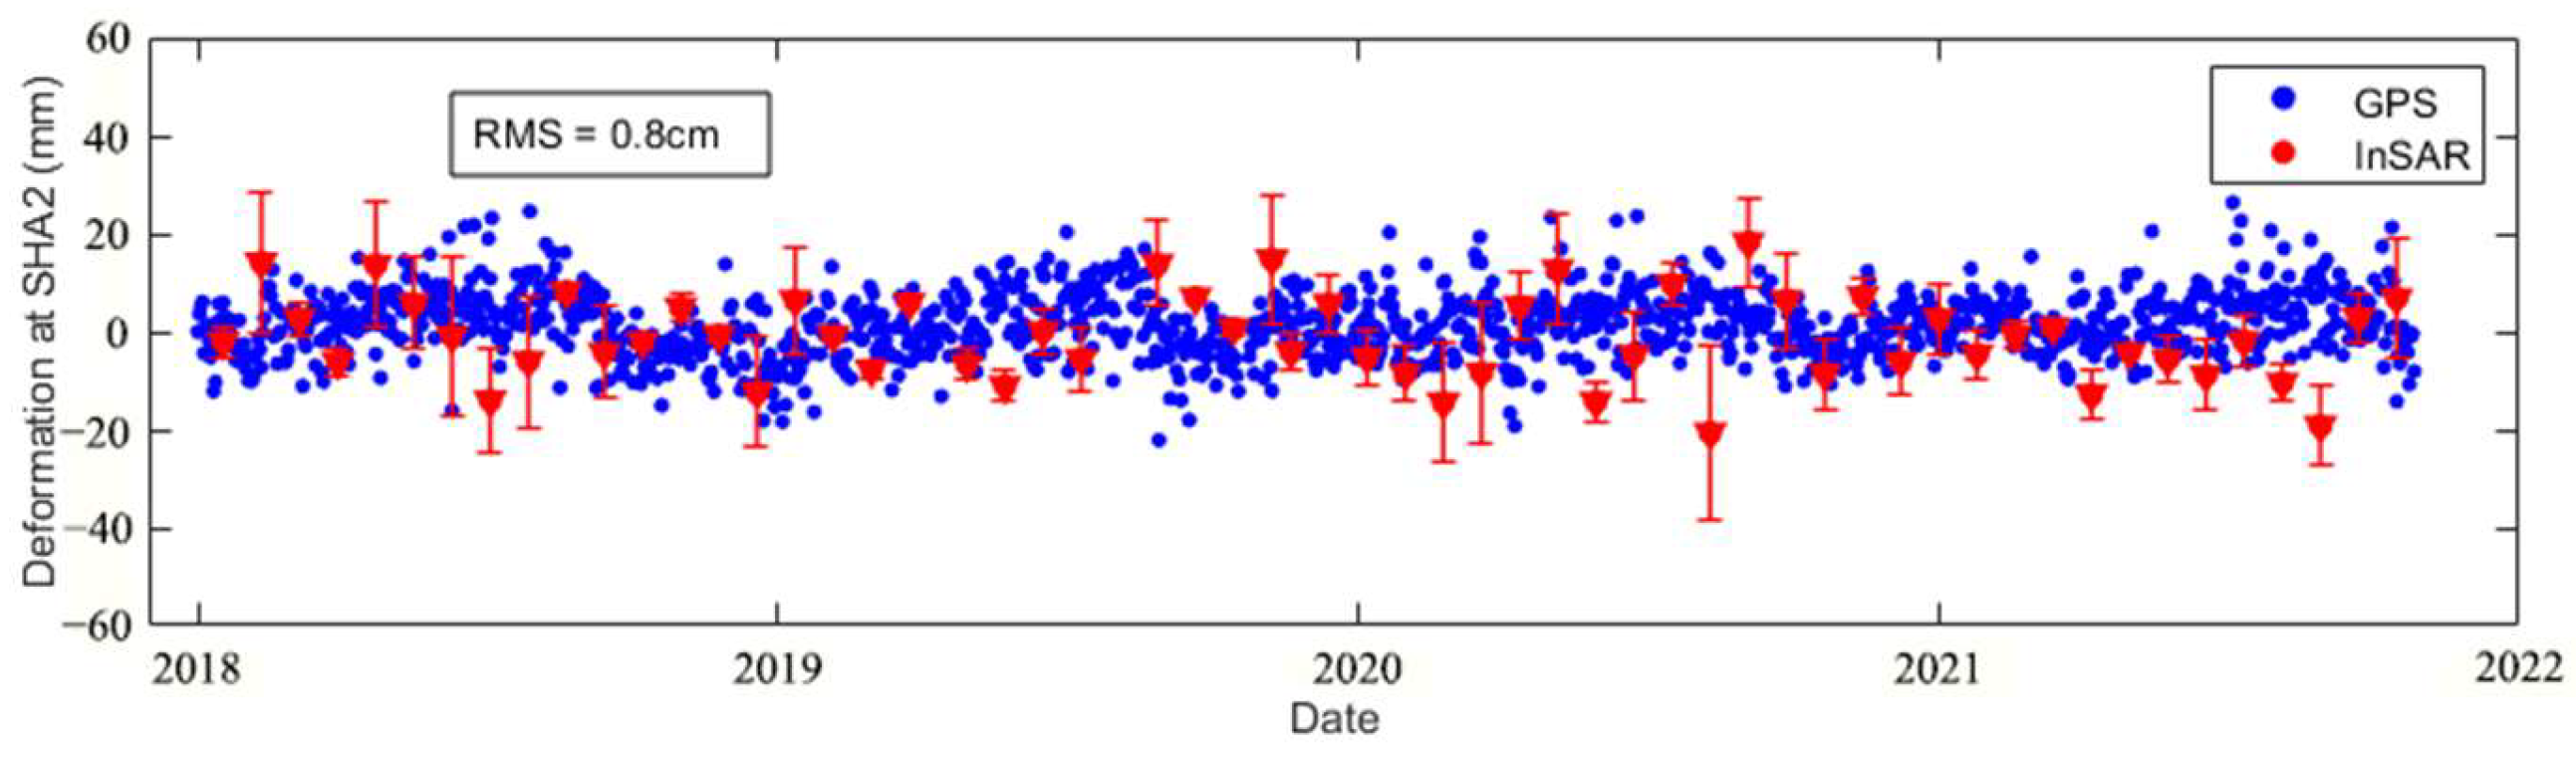
4.2. Precision Verification of the Subsidence Results
5. Discussion
5.1. Discussion of the Causes of Surface Subsidence in Different Regions
5.2. Exploration of Subsidence Trigger Factors
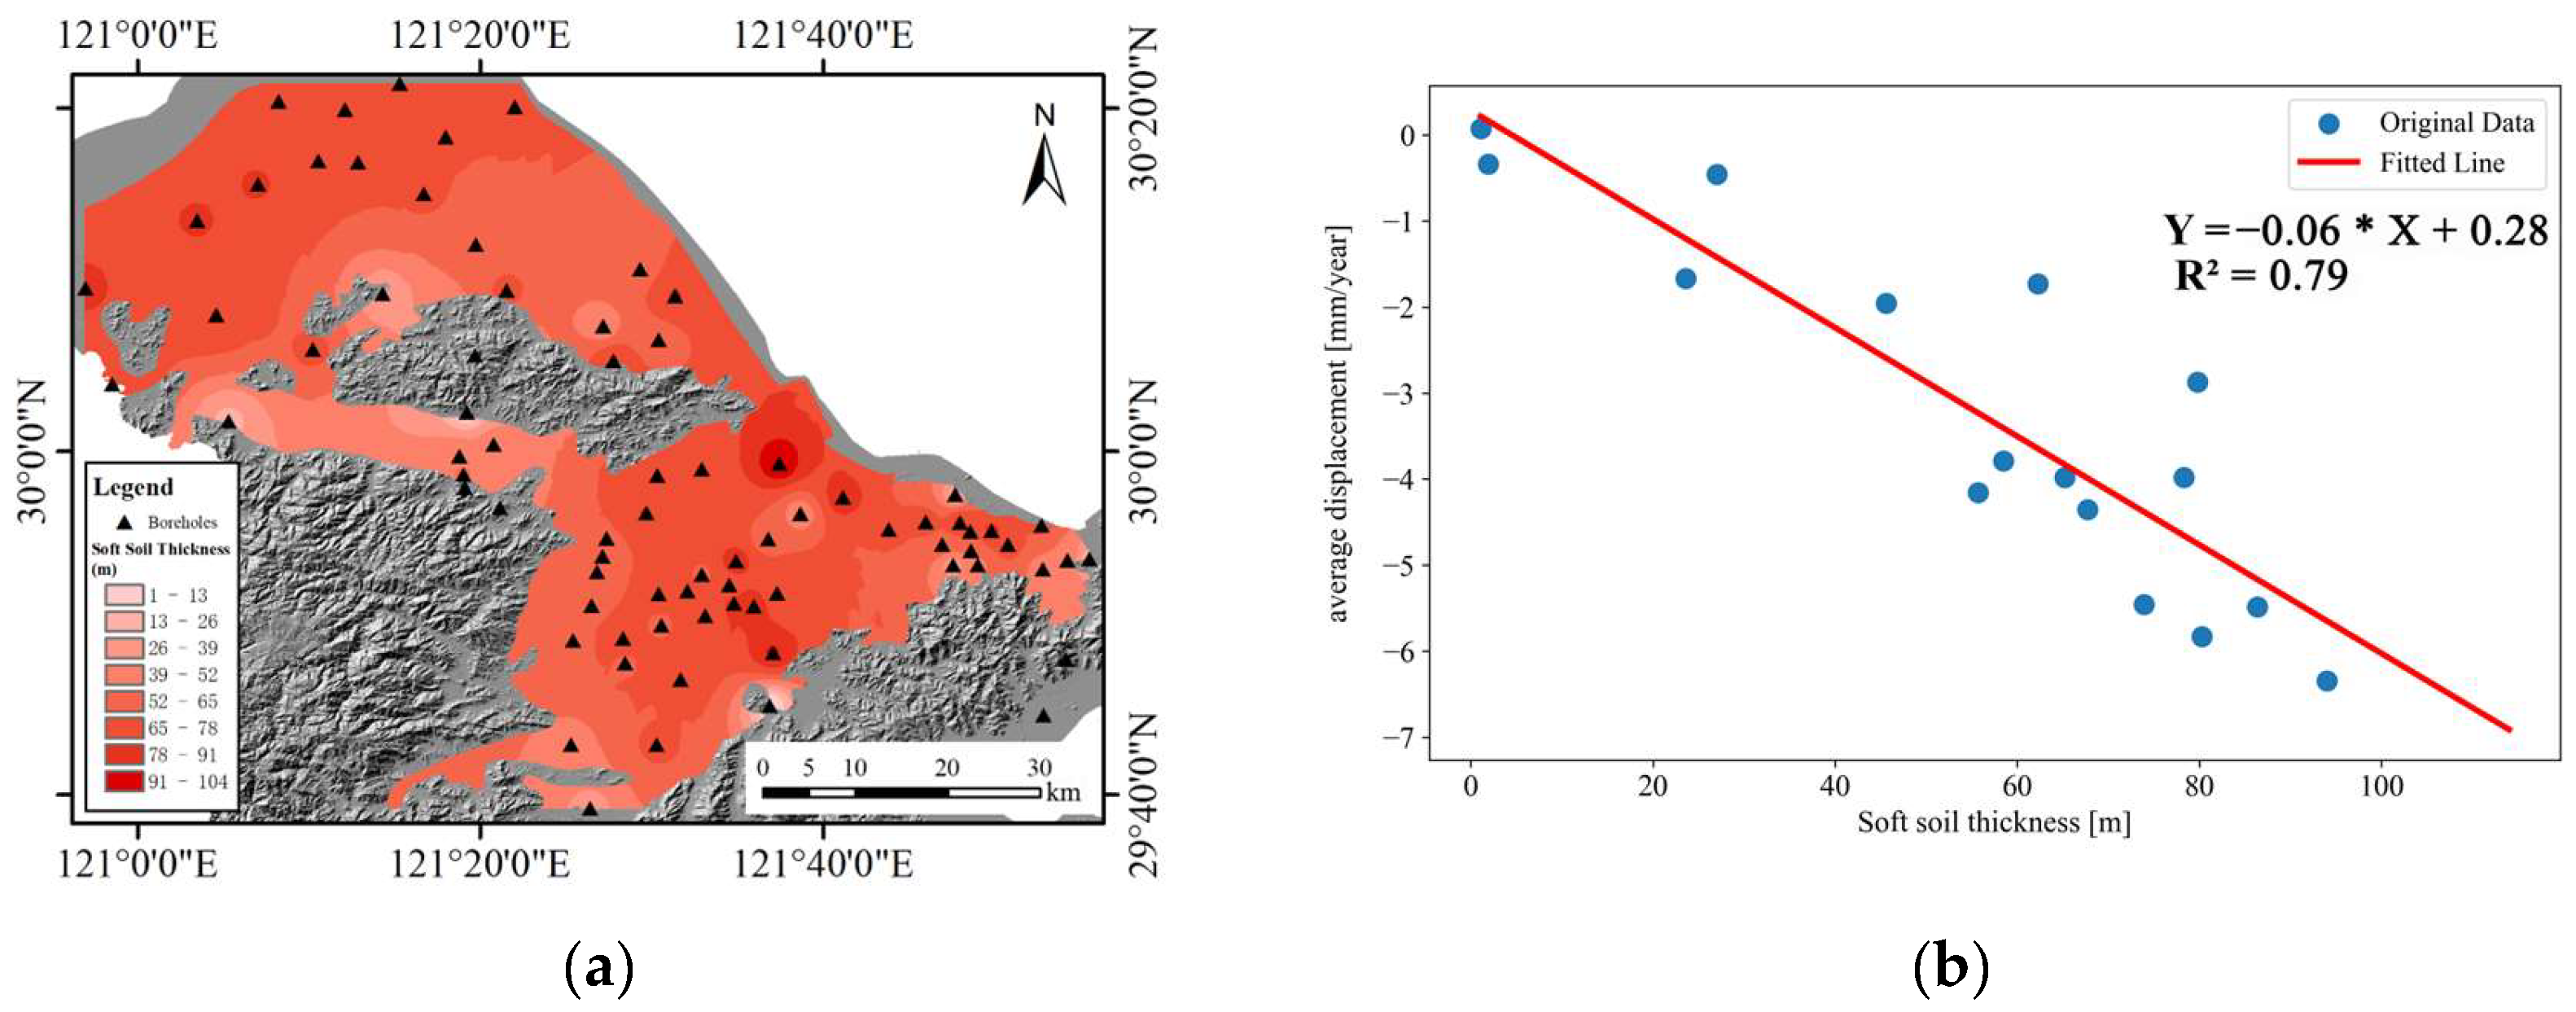
5.2.1. Impact Analysis of Geological Factor Control Deformation Pattern
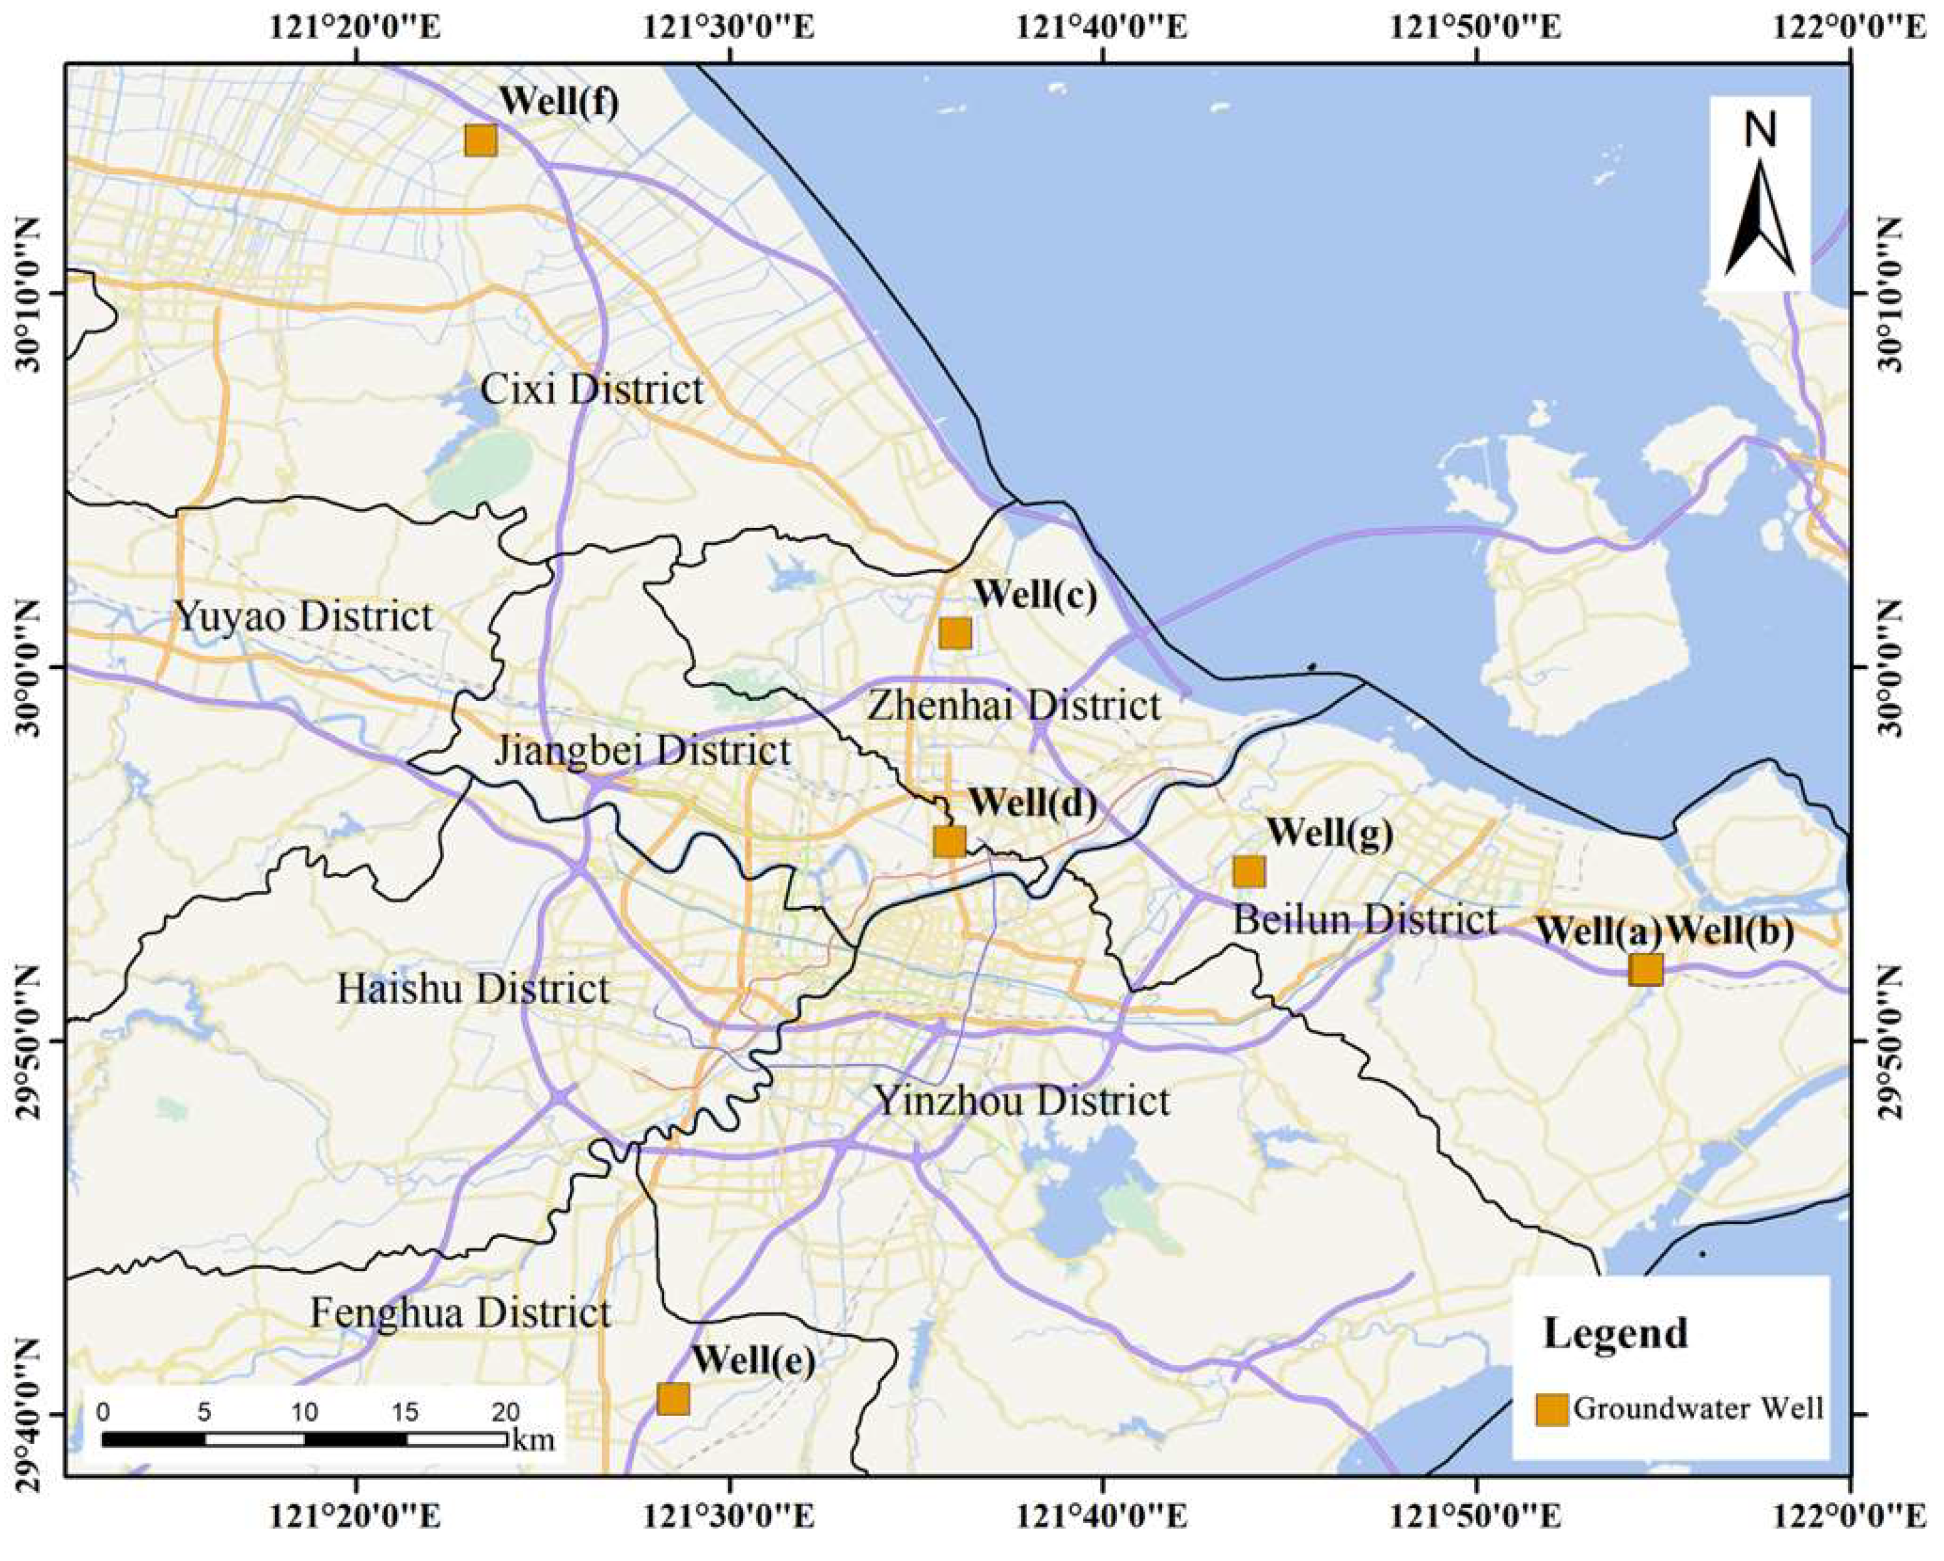
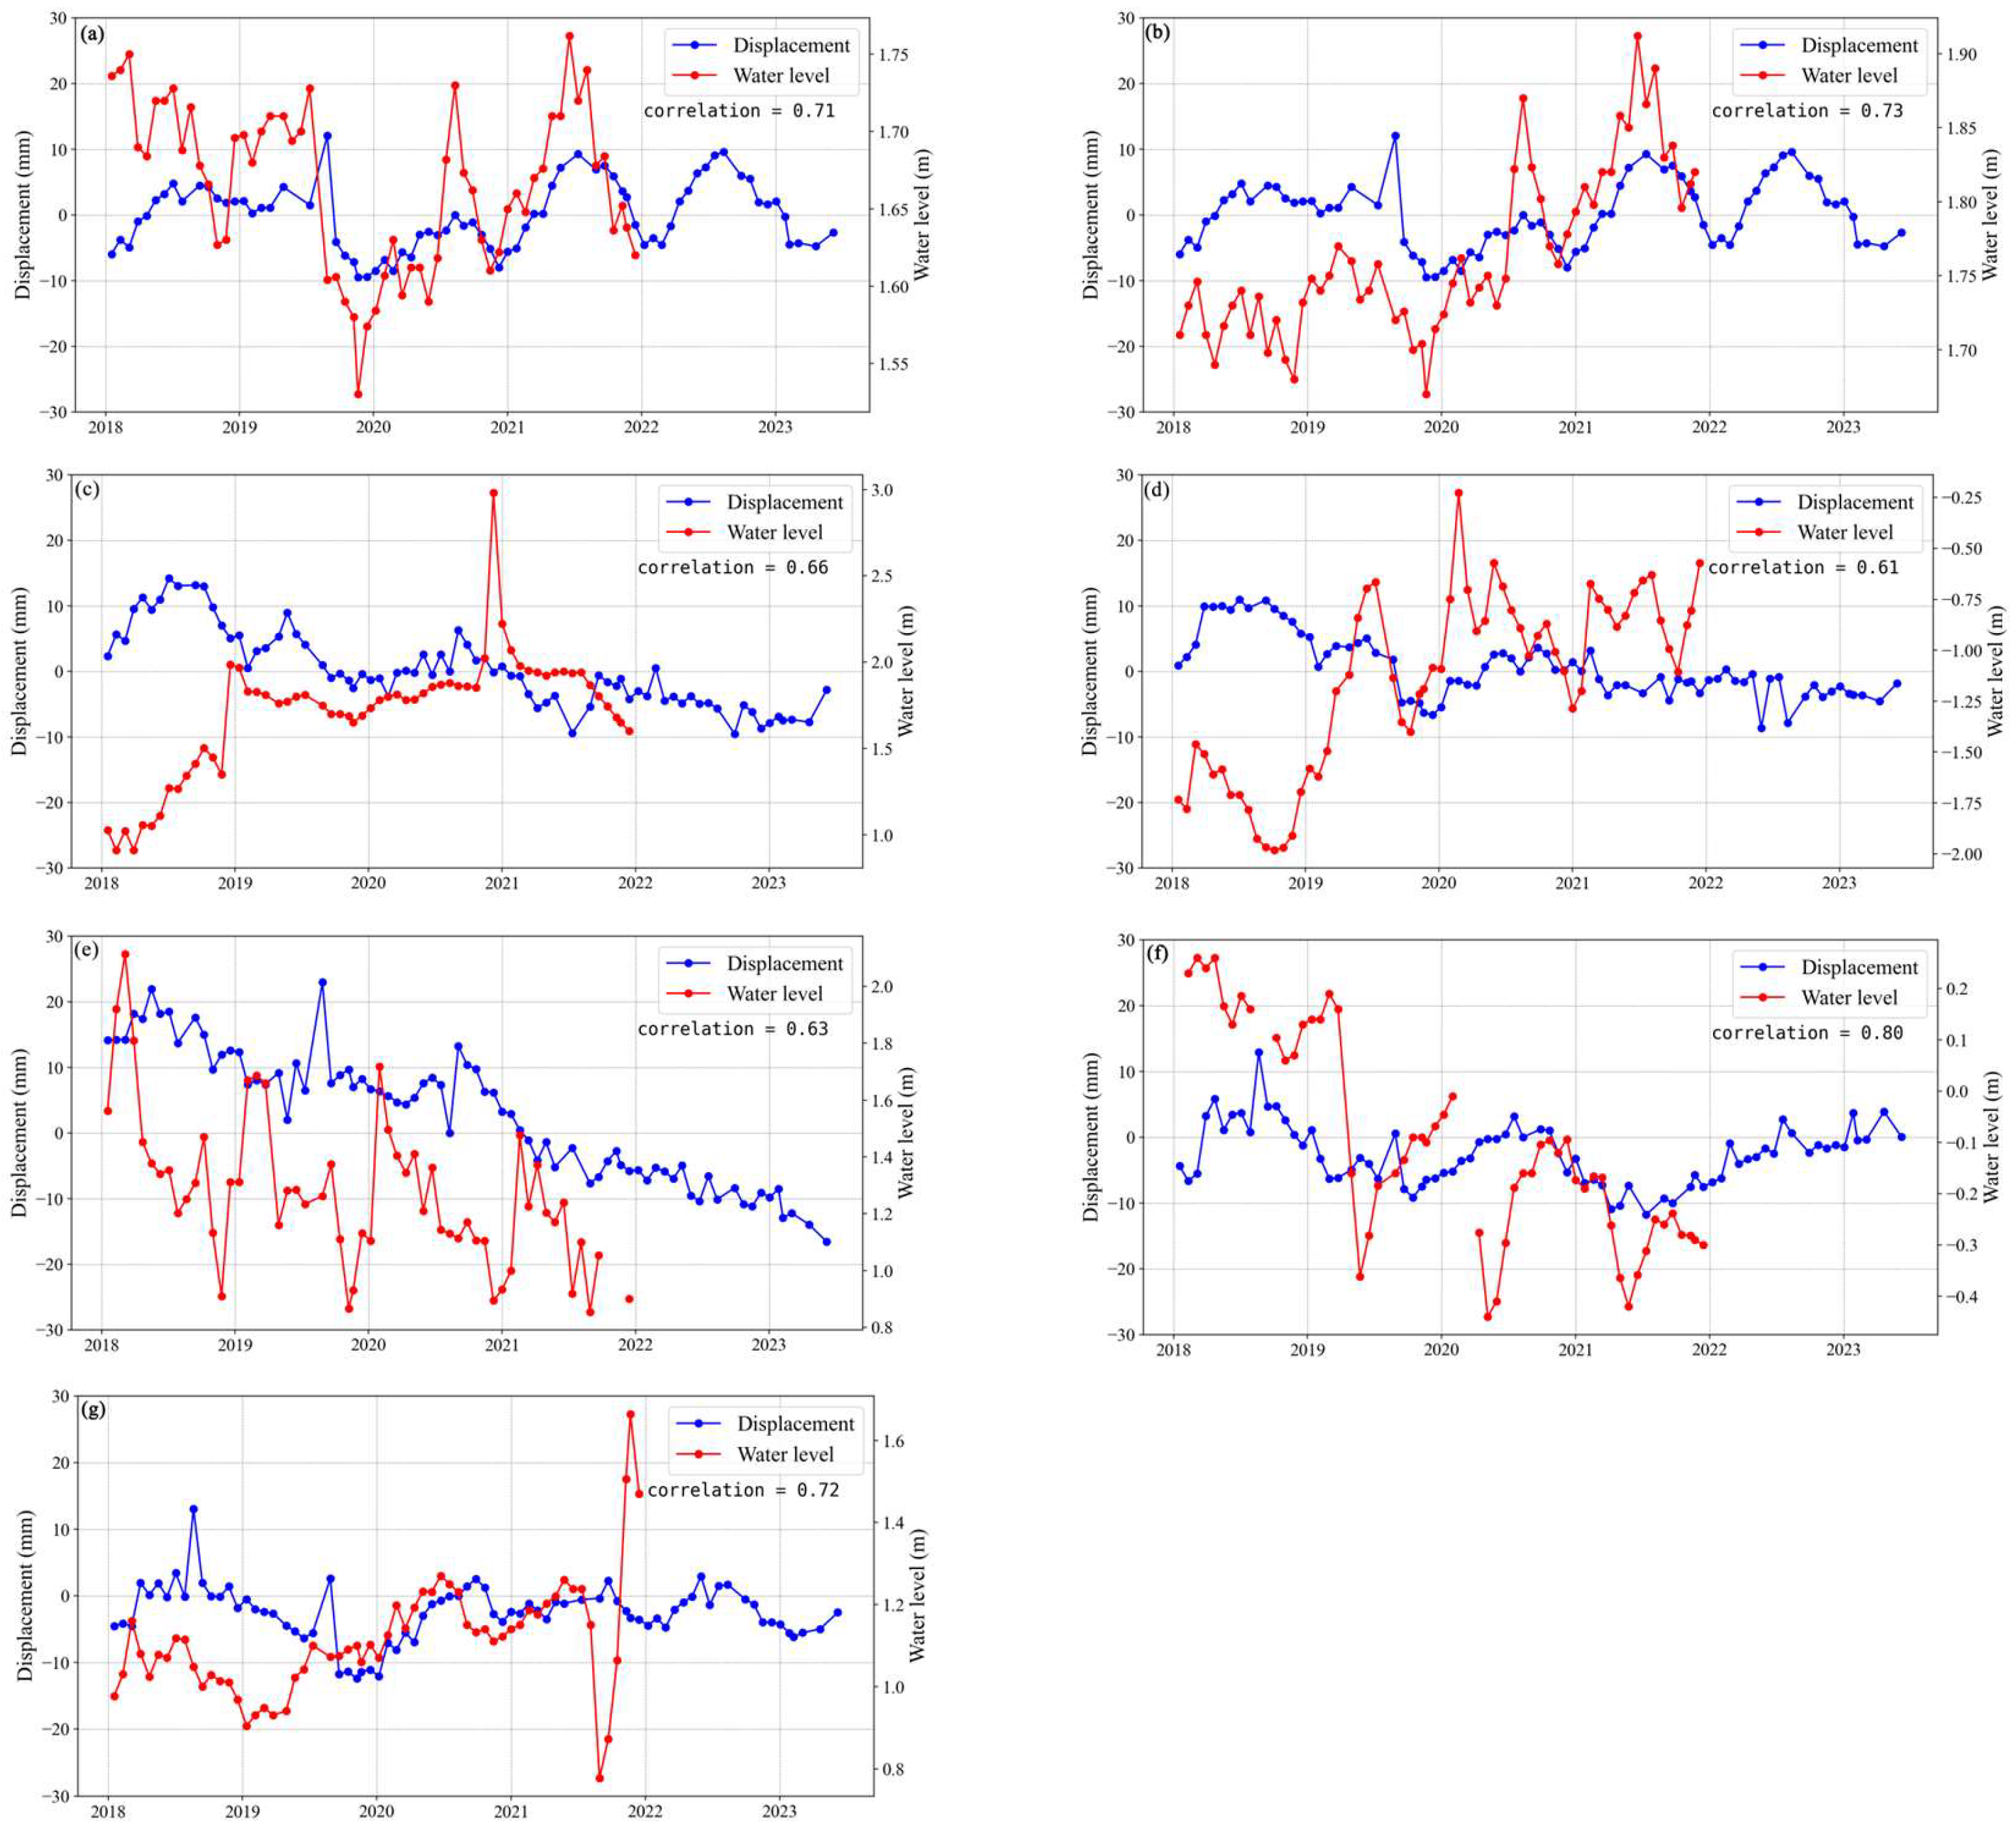
5.2.2. Response of Subsidence to Groundwater Level Changes
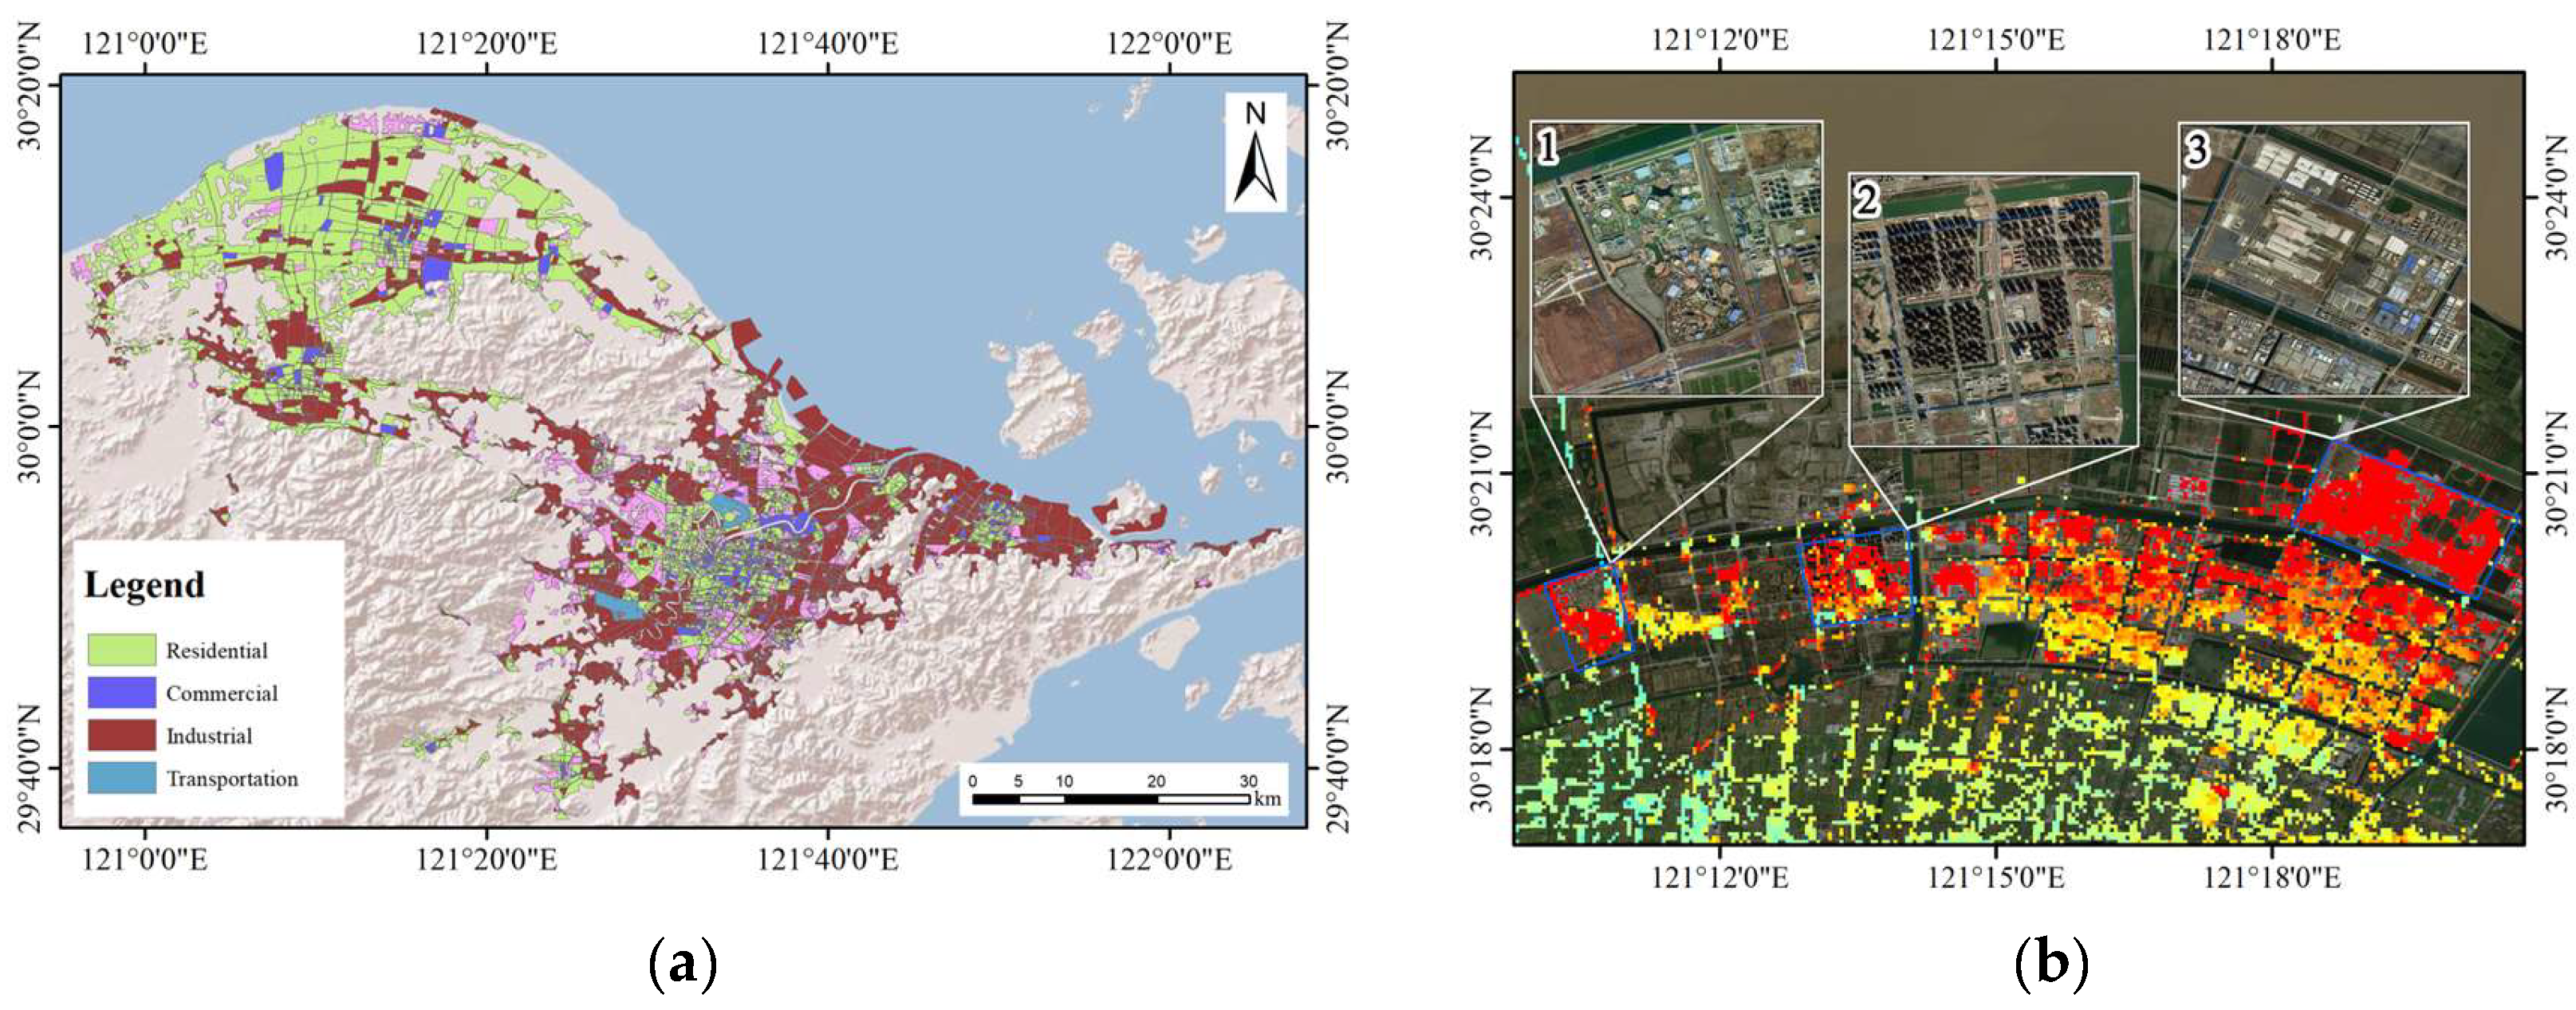
5.2.3. Impact Analysis of the Surface Subsidence Impact and Land Use
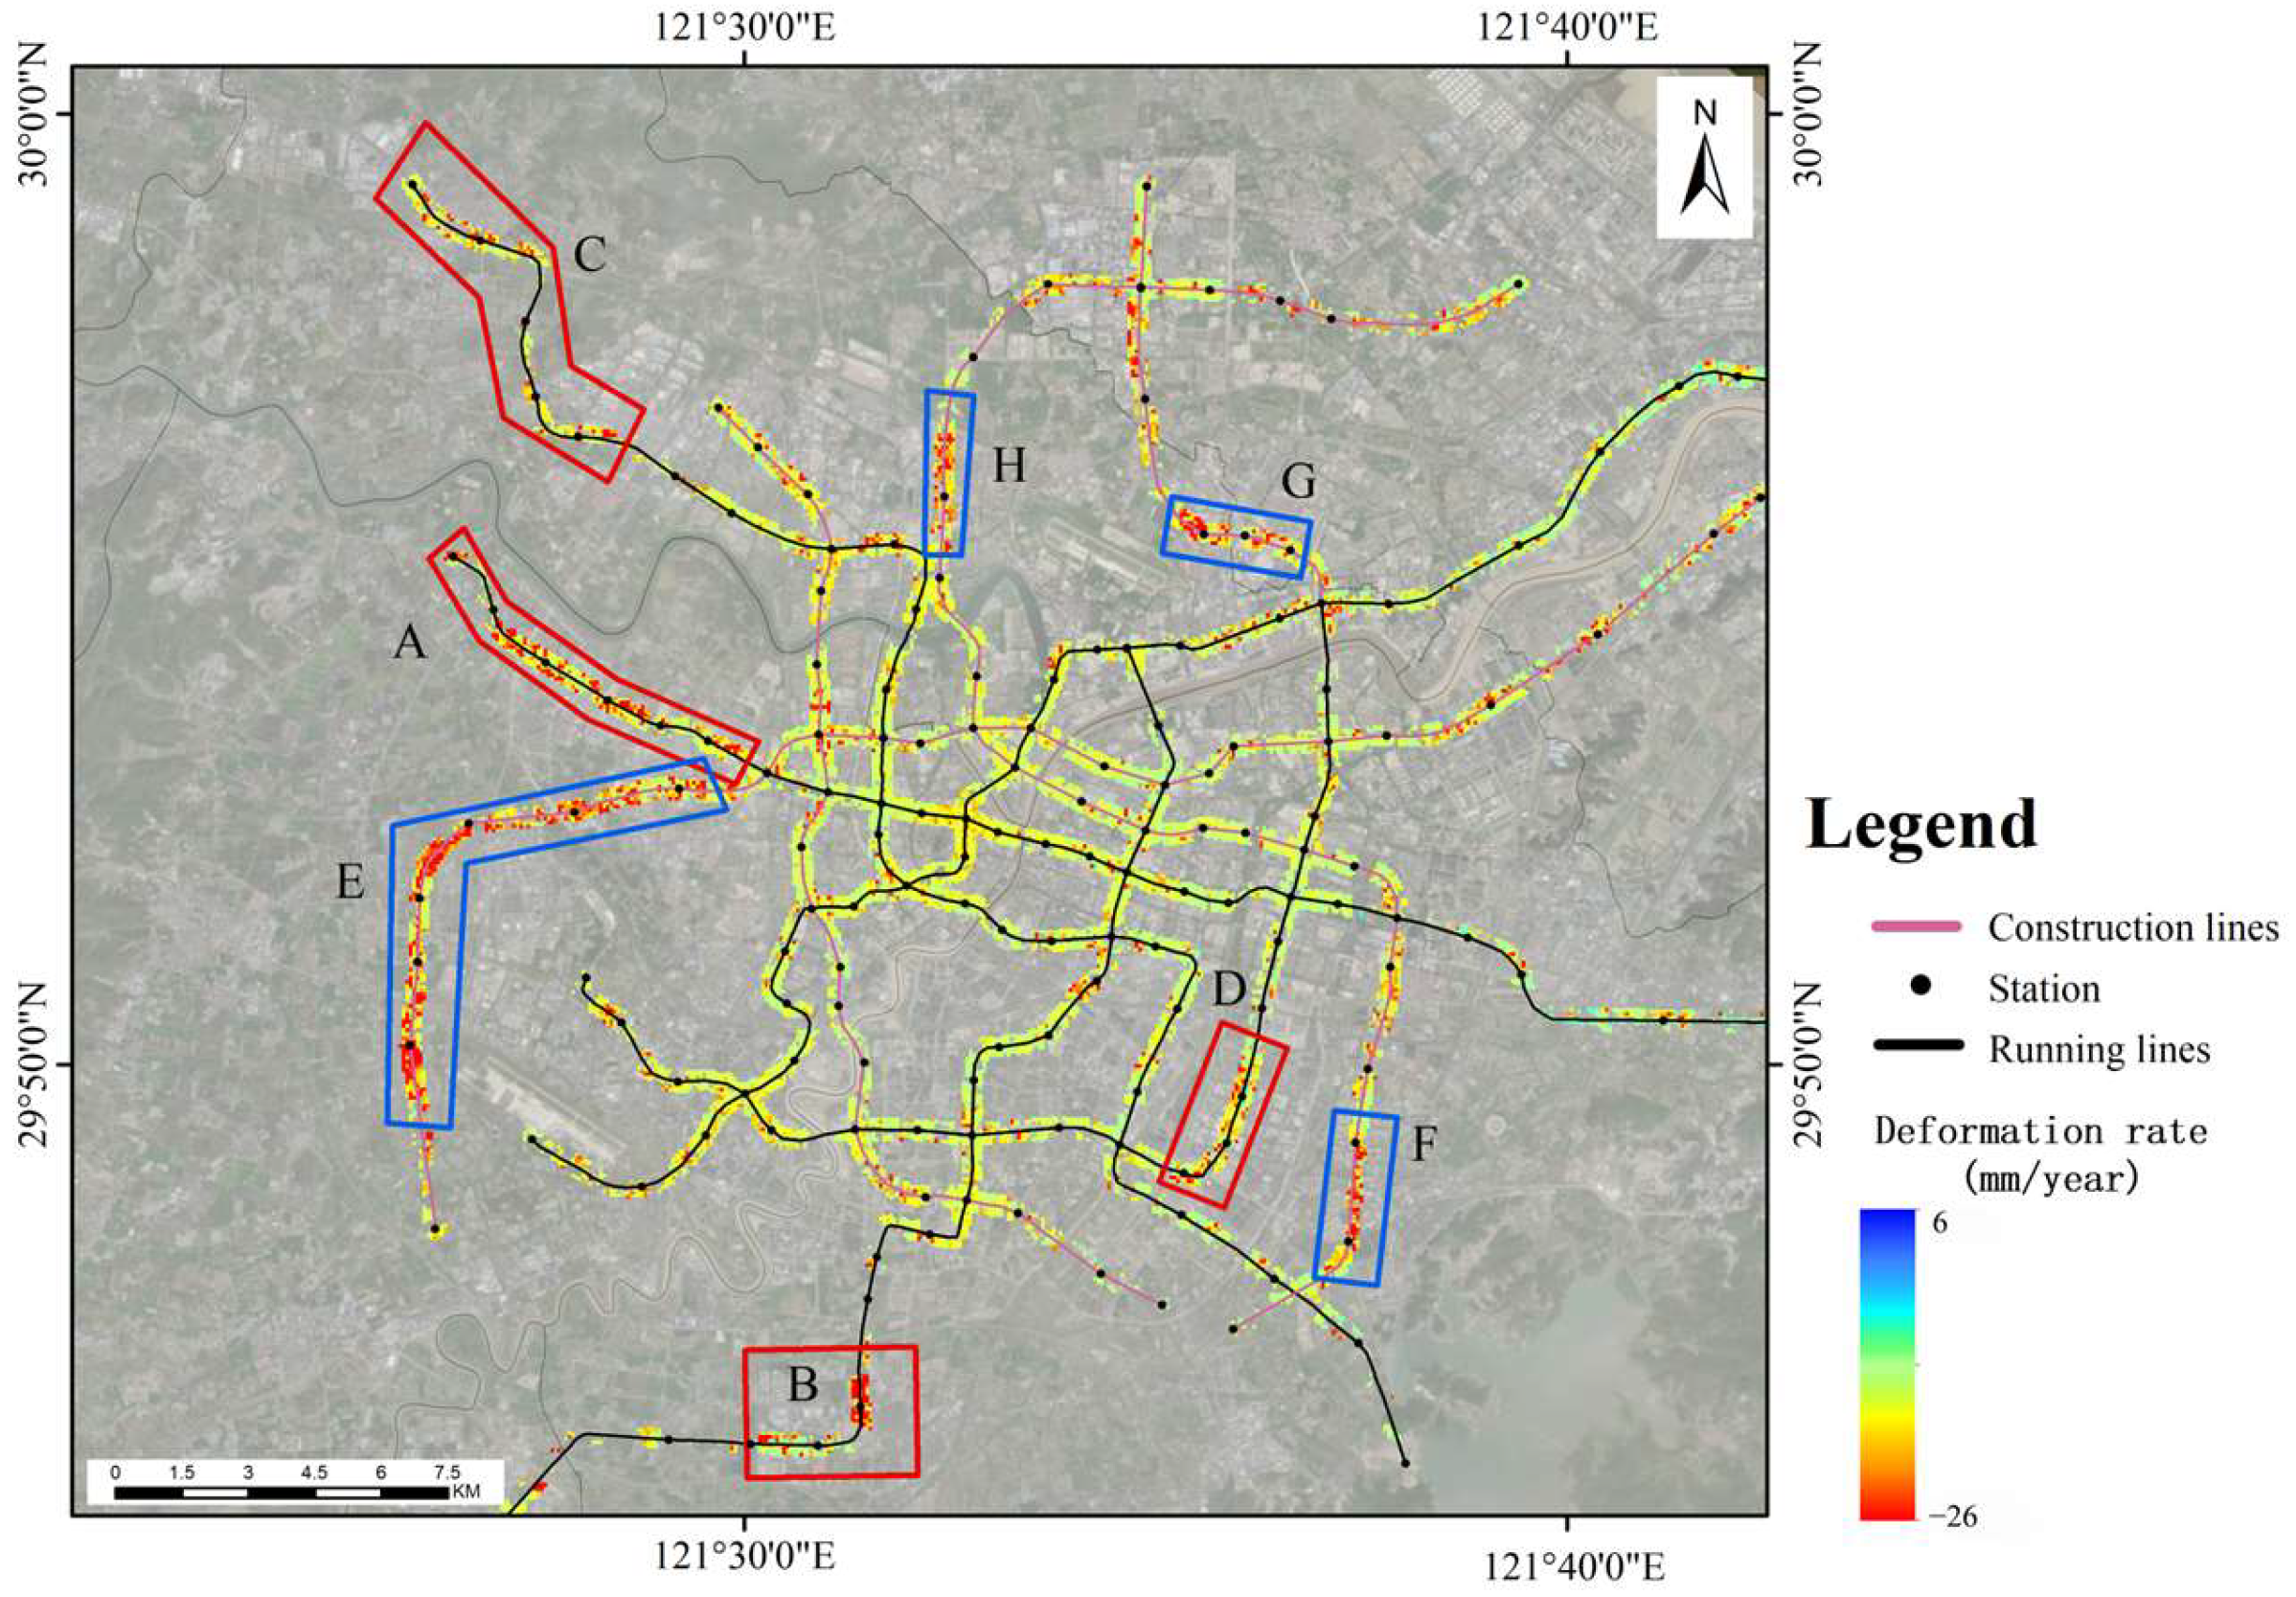
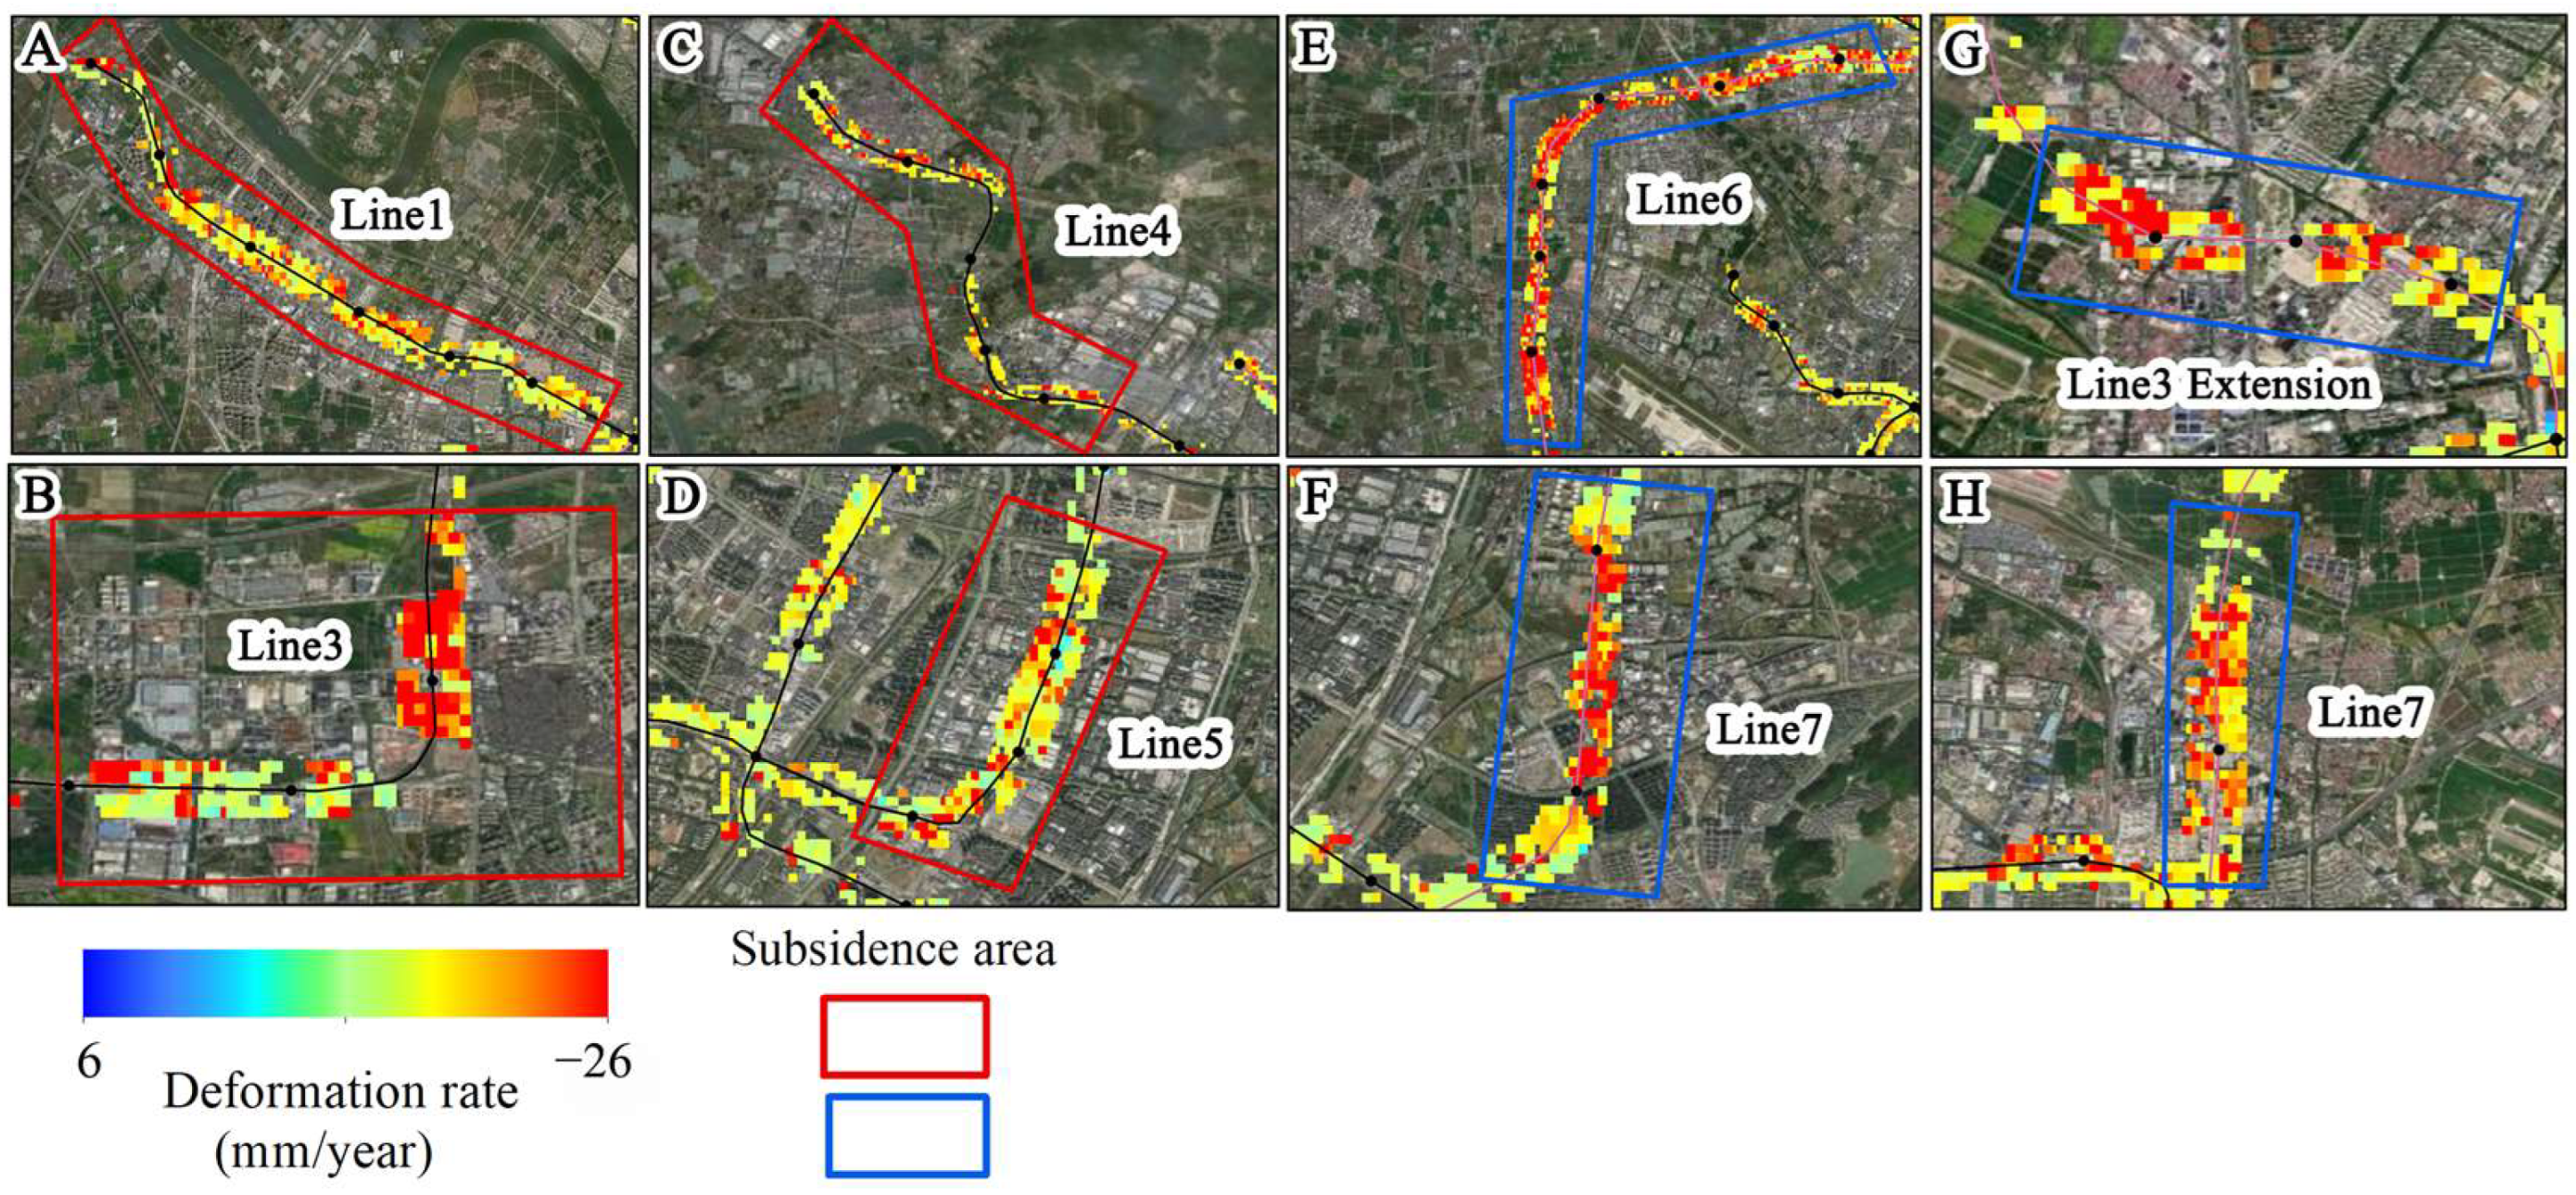
5.2.4. Analysis of Surface Subsidence and Urban Subway Construction
6. Conclusions
Supplementary Materials
Author Contributions
Funding
Data Availability Statement
Acknowledgments
Conflicts of Interest
References
- Abidin, H.Z.; Andreas, H.; Gumilar, I.; Sidiq, T.P.; Fukuda, Y. Land subsidence in coastal city of Semarang (Indonesia): Characteristics, impacts and causes. Geomat. Nat. Hazards Risk 2013, 4, 226–240. [Google Scholar] [CrossRef]
- Antoniadis, N.; Alatza, S.; Loupasakis, C.; Kontoes, C. Land Subsidence Phenomena vs. Coastal Flood Hazard—The Cases of Messolonghi and Aitolikon (Greece). Remote Sens. 2023, 15, 2112. [Google Scholar] [CrossRef]
- Arabameri, A.; Saha, S.; Roy, J.; Tiefenbacher, J.P.; Cerda, A.; Biggs, T.; Pradhan, B.; Thi Ngo, P.T.; Collins, A.L. A novel ensemble computational intelligence approach for the spatial prediction of land subsidence susceptibility. Sci Total Environ. 2020, 726, 138595. [Google Scholar] [CrossRef] [PubMed]
- Du, Z.; McCubbine, J.; Garthwaite, M.; Brown, N.; Ng, A.H.M.; Deane, A.; Wang, L.W. Toward a Wide-Scale Land Subsidence Product in Eastern States of Australia. IEEE Trans. Geosci. Remote Sens. 2023, 61, 5213312. [Google Scholar] [CrossRef]
- Mishra, V.; Malik, K.; Agarwal, V.; Mishra, P.K.; Jain, K. Impact assessment of unsustainable airport development in the Himalayas using remote sensing: A case study of Pakyong Airport, Sikkim, India. Quat. Sci. Adv. 2024, 13, 100144. [Google Scholar] [CrossRef]
- Ng, A.H.-M.; Liu, Z.; Du, Z.; Huang, H.; Wang, H.; Ge, L. A novel framework for combining polarimetric Sentinel-1 InSAR time series in subsidence monitoring—A case study of Sydney. Remote Sens. Environ. 2023, 295, 113694. [Google Scholar] [CrossRef]
- Du, Z.; Ge, L.; Ng, A.H.-M.; Zhu, Q.; Zhang, Q.; Kuang, J.; Dong, Y. Long-term subsidence in Mexico City from 2004 to 2018 revealed by five synthetic aperture radar sensors. Land Degrad. Dev. 2019, 30, 1785–1801. [Google Scholar] [CrossRef]
- Sorkhabi, O.M.; Nejad, A.S.; Khajehzadeh, M. Evaluation of Isfahan City Subsidence Rate Using InSAR and Artificial Intelligence. KSCE J. Civ. Eng. 2022, 26, 2901–2908. [Google Scholar] [CrossRef]
- Neely, W.R.; Borsa, A.A.; Burney, J.A.; Levy, M.C.; Silverii, F.; Sneed, M. Characterization of Groundwater Recharge and Flow in California’s San Joaquin Valley From InSAR-Observed Surface Deformation. Water Resour. Res. 2021, 57, e2020WR028451. [Google Scholar] [CrossRef]
- Jiang, H.; Balz, T.; Li, J.; Mishra, V. Preliminary Investigation of Sudden Ground Subsidence and Building Tilt in Balitai Town, Tianjin City, on 31 May 2023. Remote Sens. 2023, 15, 4891. [Google Scholar] [CrossRef]
- Guo, H.P.; Bai, J.B.; Zhang, Y.Q.; Wang, L.Y.; Shi, J.S.; Li, W.P.; Zhang, Z.C.; Wang, Y.L.; Zhu, J.Y.; Wang, H.G. The evolution characteristics and mechanism of the land subsidence in typical areas of the North China Plain. Geol. China 2017, 44, 1115–1127. (In Chinese) [Google Scholar]
- Zhu, Z.; Vuik, V.; Visser, P.J.; Soens, T.; van Wesenbeeck, B.; van de Koppel, J.; Jonkman, S.N.; Temmerman, S.; Bouma, T.J. Historic storms and the hidden value of coastal wetlands for nature-based flood defence. Nat. Sustain. 2020, 3, 853–862. [Google Scholar] [CrossRef]
- Syvitski, J.P.M.; Kettner, A.J.; Overeem, I.; Hutton, E.W.H.; Hannon, M.T.; Brakenridge, G.R.; Day, J.; Vörösmarty, C.; Saito, Y.; Giosan, L.; et al. Sinking deltas due to human activities. Nat. Geosci. 2009, 2, 681–686. [Google Scholar] [CrossRef]
- Liu, Z.; Ng, A.H.-M.; Wang, H.; Chen, J.; Du, Z.; Ge, L. Land subsidence modeling and assessment in the West Pearl River Delta from combined InSAR time series, land use and geological data. Int. J. Appl. Earth Obs. Geoinf. 2023, 118, 103228. [Google Scholar] [CrossRef]
- Khorrami, M.; Abrishami, S.; Maghsoudi, Y.; Alizadeh, B.; Perissin, D. Extreme subsidence in a populated city (Mashhad) detected by PSInSAR considering groundwater withdrawal and geotechnical properties. Sci. Rep. 2020, 10, 11357. [Google Scholar] [CrossRef] [PubMed]
- Galloway, D.L.; Erkens, G.; Kuniansky, E.L.; Rowland, J.C. Preface: Land subsidence processes. Hydrogeol. J. 2016, 24, 547–550. [Google Scholar] [CrossRef]
- Bagheri-Gavkosh, M.; Hosseini, S.M.; Ataie-Ashtiani, B.; Sohani, Y.; Ebrahimian, H.; Morovat, F.; Ashrafi, S. Land subsidence: A global challenge. Sci. Total Environ. 2021, 778, 146193. [Google Scholar] [CrossRef]
- Kuang, J.; Ng, A.H.; Ge, L. Displacement Characterization and Spatial-Temporal Evolution of the 2020 Aniangzhai Landslide in Danba County Using Time-Series InSAR and Multi-Temporal Optical Dataset. Remote Sens. 2022, 14, 68. [Google Scholar] [CrossRef]
- Sheng, H.; Zhou, L.; Huang, C.; Ma, S.; Xian, L.; Chen, Y.; Yang, F. Surface Subsidence Characteristics and Causes in Beijing (China) before and after COVID-19 by Sentinel-1A TS-InSAR. Remote Sens. 2023, 15, 1199. [Google Scholar] [CrossRef]
- Dong, S.; Samsonov, S.; Yin, H.; Huang, L. Two-Dimensional Ground Deformation Monitoring in Shanghai Based on SBAS and MSBAS InSAR Methods. J. Earth Sci. 2018, 29, 960–968. [Google Scholar] [CrossRef]
- Wang, H.; Feng, G.; Xu, B.; Yu, Y.; Li, Z.; Du, Y.; Zhu, J. Deriving Spatio-Temporal Development of Ground Subsidence Due to Subway Construction and Operation in Delta Regions with PS-InSAR Data: A Case Study in Guangzhou, China. Remote Sens. 2017, 9, 1004. [Google Scholar] [CrossRef]
- Zhu, L.; Gong, H.; Li, X.; Li, Y.; Su, X.; Guo, G. Comprehensive analysis and artificial intelligent simulation of land subsidence of Beijing, China. Chin. Geogr. Sci. 2013, 23, 237–248. [Google Scholar] [CrossRef]
- Dai, Y.W.; Ng, A.H.-M.; Min, X.Y.; Wang, H.; Zhu, H.L.; Peng, L.C. Ground Deformation Monitoring of Major Cities in the Pearl Delta Region Using Time Series InSAR Technique River. J. Guangdong Univ. Technol. 2019, 36, 92–98. (In Chinese) [Google Scholar]
- Zhejiang News. The Subsidence Area of Ningbo Has Reached 500 Square Kilometers. Available online: https://zjnews.zjol.com.cn/zjnews/nbnews/201610/t20161012_1969321.shtml (accessed on 1 November 2023).
- Zhao, T.Z.; Hou, Y.S.; Hu, X.F. Study on Countermeasures of Land Subsidence in Ningbo Urbanization. In Proceedings of the 2019 Academic Annual Meeting of Zhejiang Geological Society, Lishui, China, 28 November 2019. (In Chinese). [Google Scholar]
- Ningbo Municipal People’s Government. The State of Economic Development. Available online: https://www.ningbo.gov.cn/col/col1229200020/index.html (accessed on 1 November 2023).
- Tosi, L.; Strozzi, T.; Da Lio, C.; Teatini, P. Regional and local land subsidence at the Venice coastland by TerraSAR-X PSI. Proc. IAHS 2015, 372, 199–205. [Google Scholar] [CrossRef]
- Tosi, L.; Da Lio, C.; Strozzi, T.; Teatini, P. Combining L- and X-Band SAR Interferometry to Assess Ground Displacements in Heterogeneous Coastal Environments: The Po River Delta and Venice Lagoon, Italy. Remote Sens. 2016, 8, 308. [Google Scholar] [CrossRef]
- Maghsoudi, Y.; van der Meer, F.; Hecker, C.; Perissin, D.; Saepuloh, A. Using PS-InSAR to detect surface deformation in geothermal areas of West Java in Indonesia. Int. J. Appl. Earth Obs. Geoinf. 2018, 64, 386–396. [Google Scholar] [CrossRef]
- Raucoules, D.; Le Mouelic, S.; Carnec, C.; Maisons, C.; King, C. Urban subsidence in the city of Prato (Italy) monitored by satellite radar interferometry. Int. J. Remote Sens. 2003, 24, 891–897. [Google Scholar] [CrossRef]
- Ferretti, A.; Prati, C.; Rocca, F. Permanent scatterers in SAR interferometry. IEEE Trans. Geosci. Remote Sens. 2001, 39, 8–20. [Google Scholar] [CrossRef]
- Berardino, P.; Fornaro, G.; Lanari, R.; Sansosti, E. A new algorithm for surface deformation monitoring based on small baseline differential SAR interferograms. IEEE Trans. Geosci. Remote Sens. 2002, 40, 2375–2383. [Google Scholar] [CrossRef]
- Massonnet, D.; Rossi, M.; Carmona, C.; Adragna, F.; Peltzer, G.; Feigl, K.; Rabaute, T. The displacement field of the Landers earthquake mapped by radar interferometry. Nature 1993, 364, 138–142. [Google Scholar] [CrossRef]
- Wang, H.; Wright, T.J.; Liu-Zeng, J.; Peng, L. Strain Rate Distribution in South-Central Tibet from Two Decades of InSAR and GPS. Geophys. Res. Lett. 2019, 46, 5170–5179. [Google Scholar] [CrossRef]
- Lanari, R.; Lundgren, P.; Sansosti, E. Dynamic deformation of Etna Volcano observed by satellite radar interferometry. Geophys. Res. Lett. 1998, 25, 1541–1544. [Google Scholar] [CrossRef]
- Lu, Z.; Masterlark, T.; Dzurisin, D.; Rykhus, R.; Wicks, C., Jr. Magma supply dynamics at Westdahl volcano, Alaska, modeled from satellite radar interferometry. J. Geophys. Res. Solid Earth 2003, 108, 2354. [Google Scholar] [CrossRef]
- Teatini, P.; Castelletto, N.; Ferronato, M.; Gambolati, G.; Janna, C.; Cairo, E.; Marzorati, D.; Colombo, D.; Ferretti, A.; Bagliani, A.; et al. Geomechanical response to seasonal gas storage in depleted reservoirs: A case study in the Po River basin, Italy. J. Geophys. Res. Earth Surf. 2011, 116, F02002. [Google Scholar] [CrossRef]
- Li, S.; Benson, C.; Gens, R.; Lingle, C. Motion patterns of Nabesna Glacier (Alaska) revealed by interferometric SAR techniques. Remote Sens. Environ. 2008, 112, 3628–3638. [Google Scholar] [CrossRef]
- Zheng, X.X. Ningbo System Control on Land Subsidence. Hydrogeol. Eng. Geol. 1991, 18, 35–37+61. (In Chinese) [Google Scholar]
- Yang, L.Q. Numerical Simulation of Land Subsidence Considering Both Effects of Load and Groundwater Exploitation and Applications. Ph.D. Thesis, China University of Geosciences, Wuhan, China, 2014. (In Chinese). [Google Scholar]
- Yu, Y.C. Study on Coupling Model of Groundwater and Land Subsidence and Simulation of Emergency Water Supply in Ningbo Urban Area. Master’s Thesis, Chong Qing University, Chongqing, China, 2020. (In Chinese). [Google Scholar]
- Zhu, B.Y.; Li, J.C.; Chu, Z.W.; Wang, X.; Sun, J.W.; Yao, F.Y. Ground Subsidence Monitoring Using Sentinel-1 Images in Ningbo City. Bull. Surv. Mapp. 2018, 10, 102–106. (In Chinese) [Google Scholar]
- Wen, H.; Hu, Z.H.; Hu, Y.K. Land Subsidence Monitoring along Rail Transit in Ningbo Based on SBAS Technology. Urban Geotech. Investig. Surv. 2022, 162–165. (In Chinese) [Google Scholar]
- Gao, F.; Zhao, T.Z.; Wang, W.J.; Zhang, X.L.; Zheng, L.W. Analysis and risk evaluation of current land subsidence in Ningbo City. Chin. J. Geol. Hazard Control 2023, 34, 127–135. (In Chinese) [Google Scholar]
- Su, B.L. The Rheological Law of Ningbo Soft Soil and Its Application to Engineering. J. Hebei GEO Univ. 1990, 13, 111–120+2. (In Chinese) [Google Scholar]
- Liang, G.Q.; Zhang, M.Q.; Yu, J.Q.; Sun, B.Y. Technical Characteristics of Mild Clay in Coastal Areas of Zhejiang Province. J. China Univ. Min. Technol. 2002, 31, 98–100+104. (In Chinese) [Google Scholar]
- Shen, X.Y.; Sun; Zhou, G.Y.; Lin, D.; Zhang, R.T. Physical Mathematics Model and Prediction on Subsidence of Ningbo City. J. Earth Sci. 1989, 14, 135–144. (In Chinese) [Google Scholar]
- Wang, Z.F.; Zhang, H.H.; Shen, J. Ningbo actively prevents land subsidence. Decis. Inf. 2009, 46–47. (In Chinese) [Google Scholar]
- Farr, T.G.; Rosen, P.A.; Caro, E.; Crippen, R.; Duren, R.; Hensley, S.; Kobrick, M.; Paller, M.; Rodriguez, E.; Roth, L.; et al. The Shuttle Radar Topography Mission. Rev. Geophys. 2007, 45, RG2004. [Google Scholar] [CrossRef]
- Geo Cloud. National Digital Core Platform. Available online: https://search.ndcp.cgsi.cn/swzxDrill/map (accessed on 1 March 2023).
- Gong, P.; Chen, B.; Li, X.; Liu, H.; Wang, J.; Bai, Y.; Chen, J.; Chen, X.; Fang, L.; Feng, S.; et al. Mapping essential urban land use categories in China (EULUC-China): Preliminary results for 2018. Sci. Bull. 2020, 65, 182–187. [Google Scholar] [CrossRef] [PubMed]
- Ng, A.H.-M.; Wang, H.; Dai, Y.; Pagli, C.; Chen, W.; Ge, L.; Du, Z.; Zhang, K. InSAR Reveals Land Deformation at Guangzhou and Foshan, China between 2011 and 2017 with COSMO-SkyMed Data. Remote Sens. 2018, 10, 813. [Google Scholar] [CrossRef]
- Wang, H.; Avouac, J.-P.; Shao, Z.; Liu, X.; Wei, W.; Zhan, S.; Dai, X.; Lou, Y. CSES Community Deformation Models in Southwest China, in China Seismic Experimental Site: Theoretical Framework and Ongoing Practice; Li, Y.-G., Zhang, Y., Wu, Z., Eds.; Springer Nature: Singapore, 2022; pp. 111–133. [Google Scholar]
- Rosen, P.A.; Gurrola, E.M.; Agram, P.; Cohen, J.; Lavalle, M.; Riel, B.V.; Fattahi, H.; Aivazis, M.A.G.; Simons, M.; Buckley, S.M. The InSAR Scientific Computing Environment 3.0: A Flexible Framework for NISAR Operational and User-Led Science Processing. In Proceedings of the IGARSS 2018—2018 IEEE International Geoscience and Remote Sensing Symposium, Valencia, Spain, 22–27 July 2018; pp. 4897–4900. [Google Scholar]
- Herrera, G.; Tomás, R.; Lopez-Sanchez, J.M.; Delgado, J.; Mallorqui, J.J.; Duque, S.; Mulas, J. Advanced DInSAR analysis on mining areas: La Union case study (Murcia, SE Spain). Eng. Geol. 2007, 90, 148–159. [Google Scholar] [CrossRef]
- Ng, A.H.M.; Ge, L.L.; Li, X.J.; Zhang, K. Monitoring ground deformation in Beijing, China with persistent scatterer SAR interferometry. J. Geod. 2012, 86, 375–392. [Google Scholar] [CrossRef]
- Rodriguez, E.; Morris, C.S.; Belz, J.E.; Chapin, E.; Martin, J.; Daffer, W.; Hensley, S. An Assessment of the SRTM Topographic Products; Technical Report JPL D-31639; Jet Propulsion Laboratory: Pasadena, CA, USA, 2005. [Google Scholar]
- Kampes, B.M.; Hanssen, R.F. Ambiguity resolution for permanent scatterer interferometry. IEEE Trans. Geosci. Remote Sens. 2004, 42, 2446–2453. [Google Scholar] [CrossRef]
- Ng, A.H.-M.; Ge, L.; Li, X.; Abidin, H.Z.; Andreas, H.; Zhang, K. Mapping land subsidence in Jakarta, Indonesia using persistent scatterer interferometry (PSI) technique with ALOS PALSAR. Int. J. Appl. Earth Obs. Geoinf. 2012, 18, 232–242. [Google Scholar] [CrossRef]
- Costantini, M.; Rosen, P.A. A generalized phase unwrapping approach for sparse data. In Proceedings of the IEEE 1999 International Geoscience and Remote Sensing Symposium. IGARSS’99 (Cat. No.99CH36293), Hamburg, Germany, 28 June–2 July 1999. [Google Scholar]
- Yang, Q.; Ke, Y.; Zhang, D.; Chen, B.; Gong, H.; Lv, M.; Zhu, L.; Li, X. Multi-Scale Analysis of the Relationship between Land Subsidence and Buildings: A Case Study in an Eastern Beijing Urban Area Using the PS-InSAR Technique. Remote Sens. 2018, 10, 1006. [Google Scholar] [CrossRef]
- Tan, X.R.; Deng, J.L. Grey Correlation Analysis: A New Method of Multivariate Statistical Analysis. Stat. Res. 1995, 46–48. (In Chinese) [Google Scholar]
- Sun, L.K.; Jing, J.S.; Gen, J.B. Research on the Influence Factors of the Equipment’s Expense Based on the Amend Grey Correlation. Math. Pract. Theory 2012, 42, 140–145. (In Chinese) [Google Scholar]
- Zhao, L.; Jiang, X.W.; Li, Y.M.; Luo, Y.; Cui, W.J.; Tian, M.Z.; Wang, S.F.; Tian, L.; Xu, L.; Liu, Y.Z.; et al. Groundwater level changes and its impact on land subsidence in the Beijing Plain during the recent 10 years. Acta Geol. Sin. 2024, 98, 1–15. (In Chinese) [Google Scholar]
- Cabral-Cano, E.; Dixon, T.H.; Miralles-Wilhelm, F.; Díaz-Molina, O.; Sánchez-Zamora, O.; Carande, R.E. Space geodetic imaging of rapid ground subsidence in Mexico City. GSA Bull. 2008, 120, 1556–1566. [Google Scholar] [CrossRef]
- López-Quiroz, P.; Doin, M.-P.; Tupin, F.; Briole, P.; Nicolas, J.-M. Time series analysis of Mexico City subsidence constrained by radar interferometry. J. Appl. Geophys. 2009, 69, 1–15. [Google Scholar] [CrossRef]
- Ortiz-Zamora, D.; Ortega-Guerrero, A. Evolution of long-term land subsidence near Mexico City: Review, field investigations, and predictive simulations. Water Resour. Res. 2010, 46, W01513. [Google Scholar] [CrossRef]
- Sun, M.; Du, Y.A.; Liu, Q.Y.; Feng, G.C.; Peng, X.; Liao, C.H. Understanding the Spatial-Temporal Characteristics of Land Subsidence in Shenzhen under Rapid Urbanization Based on MT-InSAR. IEEE J. Sel. Top. Appl. Earth Obs. Remote Sens. 2023, 16, 4153–4166. [Google Scholar] [CrossRef]
- Geo Cloud. Technical Regulations for Data Processing of Interferometric Radar. Available online: https://geocloud.cgs.gov.cn/common-search/search/detail?globalId=cpgl_dzcp_jsbz_421_0707020145&networkType=extranet&table_name=cpgl_dzcp&isAccurate=false&keyword=Technical%20regulations%20for%20data%20processing%20of%20interferometric%20radar (accessed on 1 March 2023).
- Ningbo Bureau of Natural Resources and Planning. Report on Ground Settlement Monitoring Results in Ningbo City in 2017. Available online: https://zgj.ningbo.gov.cn/art/2018/4/20/art_1229036868_45514081.html (accessed on 1 March 2023).
- Tang, W.; Zhan, W.; Jin, B.; Motagh, M.; Xu, Y. Spatial Variability of Relative Sea-Level Rise in Tianjin, China: Insight from InSAR, GPS, and Tide-Gauge Observations. IEEE J. Sel. Top. Appl. Earth Obs. Remote Sens. 2021, 14, 2621–2633. [Google Scholar] [CrossRef]
- Chaussard, E.; Wdowinski, S.; Cabral-Cano, E.; Amelung, F. Land subsidence in central Mexico detected by ALOS InSAR time-series. Remote Sens. Environ. 2014, 140, 94–106. [Google Scholar] [CrossRef]
- Chen, B.; Gong, H.; Li, X.; Lei, K.; Zhu, L.; Gao, M.; Zhou, C. Characterization and causes of land subsidence in Beijing, China. Int. J. Remote Sens. 2017, 38, 808–826. [Google Scholar] [CrossRef]
- Gao, F.; Zhao, T.; Zhu, X.; Zheng, L.; Wang, W.; Zheng, X. Land Subsidence Characteristics and Numerical Analysis of the Impact on Major Infrastructure in Ningbo, China. Sustainability 2023, 15, 543. [Google Scholar] [CrossRef]
- Tomás, R.; Herrera, G.; Delgado, J.; Lopez-Sanchez, J.M.; Mallorquí, J.J.; Mulas, J. A ground subsidence study based on DInSAR data: Calibration of soil parameters and subsidence prediction in Murcia City (Spain). Eng. Geol. 2010, 111, 19–30. [Google Scholar] [CrossRef]
- Agarwal, V.; Kumar, A.; Gee, D.; Grebby, S.; Gomes, R.L.; Marsh, S. Comparative Study of Groundwater-Induced Subsidence for London and Delhi Using PSInSAR. Remote Sens. 2021, 13, 4741. [Google Scholar] [CrossRef]
- Jiang, L.; Bai, L.; Zhao, Y.; Cao, G.; Wang, H.; Sun, Q. Combining InSAR and Hydraulic Head Measurements to Estimate Aquifer Parameters and Storage Variations of Confined Aquifer System in Cangzhou, North China Plain. Water Resour. Res. 2018, 54, 8234–8252. [Google Scholar] [CrossRef]
- Parker, A.L.; Pigois, J.P.; Filmer, M.S.; Featherstone, W.E.; Timms, N.E.; Penna, N.T. Land uplift linked to managed aquifer recharge in the Perth Basin, Australia. Int. J. Appl. Earth Obs. Geoinf. 2021, 105, 102637. [Google Scholar] [CrossRef]
- He, Y.; Ng, A.H.-M.; Wang, H.; Kuang, J. Understanding the Spatiotemporal Characteristics of Land Subsidence and Rebound in the Lianjiang Plain Using Time-Series InSAR with Dual-Track Sentinel-1 Data. Remote Sens. 2023, 15, 3236. [Google Scholar] [CrossRef]
- Ningbo Municipal Statistics Bureau. Press Release on Ningbo’s Economic Operation in 2023. Available online: http://tjj.ningbo.gov.cn/art/2024/1/26/art_1229042910_58919607.html (accessed on 1 March 2024).
- Xiao, B.; Zhao, J.; Li, D.; Zhao, Z.; Xi, W.; Zhou, D. The Monitoring and Analysis of Land Subsidence in Kunming (China) Supported by Time Series InSAR. Sustainability 2022, 14, 12387. [Google Scholar] [CrossRef]
- Zhou, C.; Gong, H.; Chen, B.; Li, X.; Li, J.; Wang, X.; Gao, M.; Si, Y.; Guo, L.; Shi, M.; et al. Quantifying the contribution of multiple factors to land subsidence in the Beijing Plain, China with machine learning technology. Geomorphology 2019, 335, 48–61. [Google Scholar] [CrossRef]


| Parameter | Value | Parameter | Value |
|---|---|---|---|
| Product type | SLC | Orbit direction | Ascending |
| Sensor mode | IW | Incidence angle | 35.79 |
| Band | C-band (5.6 cm) | Number of Scenes | 83 |
| Polarization | VV | Frame | 91 and 96 |
| Relative orbit | 171 | Time range | January 2018–June 2023 |
| Subsidence Area | 2017 Deformation Rate (mm/year) | 2023 Maximum Deformation Rate (mm/year) |
|---|---|---|
| M1 | >20 | −22.8 |
| M2 | >10 | −9.1 |
| M(3-1) | >30 | −17.5 |
| M(3-2) | >30 | −30.6 |
| M4 | >20 | −8.9 |
| M5 | >20 | −20.0 |
| M6 | >20 | −16.2 |
| M7 | >10 | −27.1 |
| M8 | >10 | −20.1 |
| PS Number | Average Settlement (mm/year) | Max Average Settlement (mm/year) | |
|---|---|---|---|
| Residential | 416,706 | −1.3 | −16.7 |
| Commercial | 41,807 | −1.6 | −13.0 |
| Industrial | 357,904 | −3.1 | −19.3 |
| Transportation | 11,517 | −2.5 | −12.9 |
Disclaimer/Publisher’s Note: The statements, opinions and data contained in all publications are solely those of the individual author(s) and contributor(s) and not of MDPI and/or the editor(s). MDPI and/or the editor(s) disclaim responsibility for any injury to people or property resulting from any ideas, methods, instructions or products referred to in the content. |
© 2024 by the authors. Licensee MDPI, Basel, Switzerland. This article is an open access article distributed under the terms and conditions of the Creative Commons Attribution (CC BY) license (https://creativecommons.org/licenses/by/4.0/).
Share and Cite
Tang, W.; Ng, A.H.-M.; Wang, H.; Kuang, J.; Du, Z. Surface Subsidence Characteristics and Causes Analysis in Ningbo Plain by Sentinel-1A TS-InSAR. Remote Sens. 2024, 16, 2438. https://doi.org/10.3390/rs16132438
Tang W, Ng AH-M, Wang H, Kuang J, Du Z. Surface Subsidence Characteristics and Causes Analysis in Ningbo Plain by Sentinel-1A TS-InSAR. Remote Sensing. 2024; 16(13):2438. https://doi.org/10.3390/rs16132438
Chicago/Turabian StyleTang, Weilin, Alex Hay-Man Ng, Hua Wang, Jianming Kuang, and Zheyuan Du. 2024. "Surface Subsidence Characteristics and Causes Analysis in Ningbo Plain by Sentinel-1A TS-InSAR" Remote Sensing 16, no. 13: 2438. https://doi.org/10.3390/rs16132438
APA StyleTang, W., Ng, A. H.-M., Wang, H., Kuang, J., & Du, Z. (2024). Surface Subsidence Characteristics and Causes Analysis in Ningbo Plain by Sentinel-1A TS-InSAR. Remote Sensing, 16(13), 2438. https://doi.org/10.3390/rs16132438