


Evaluation of Mass Movement Hazard in the Shoreline of the Intertidal Complex of El Grove (Pontevedra, Galicia)


Abstract
:1. Introduction
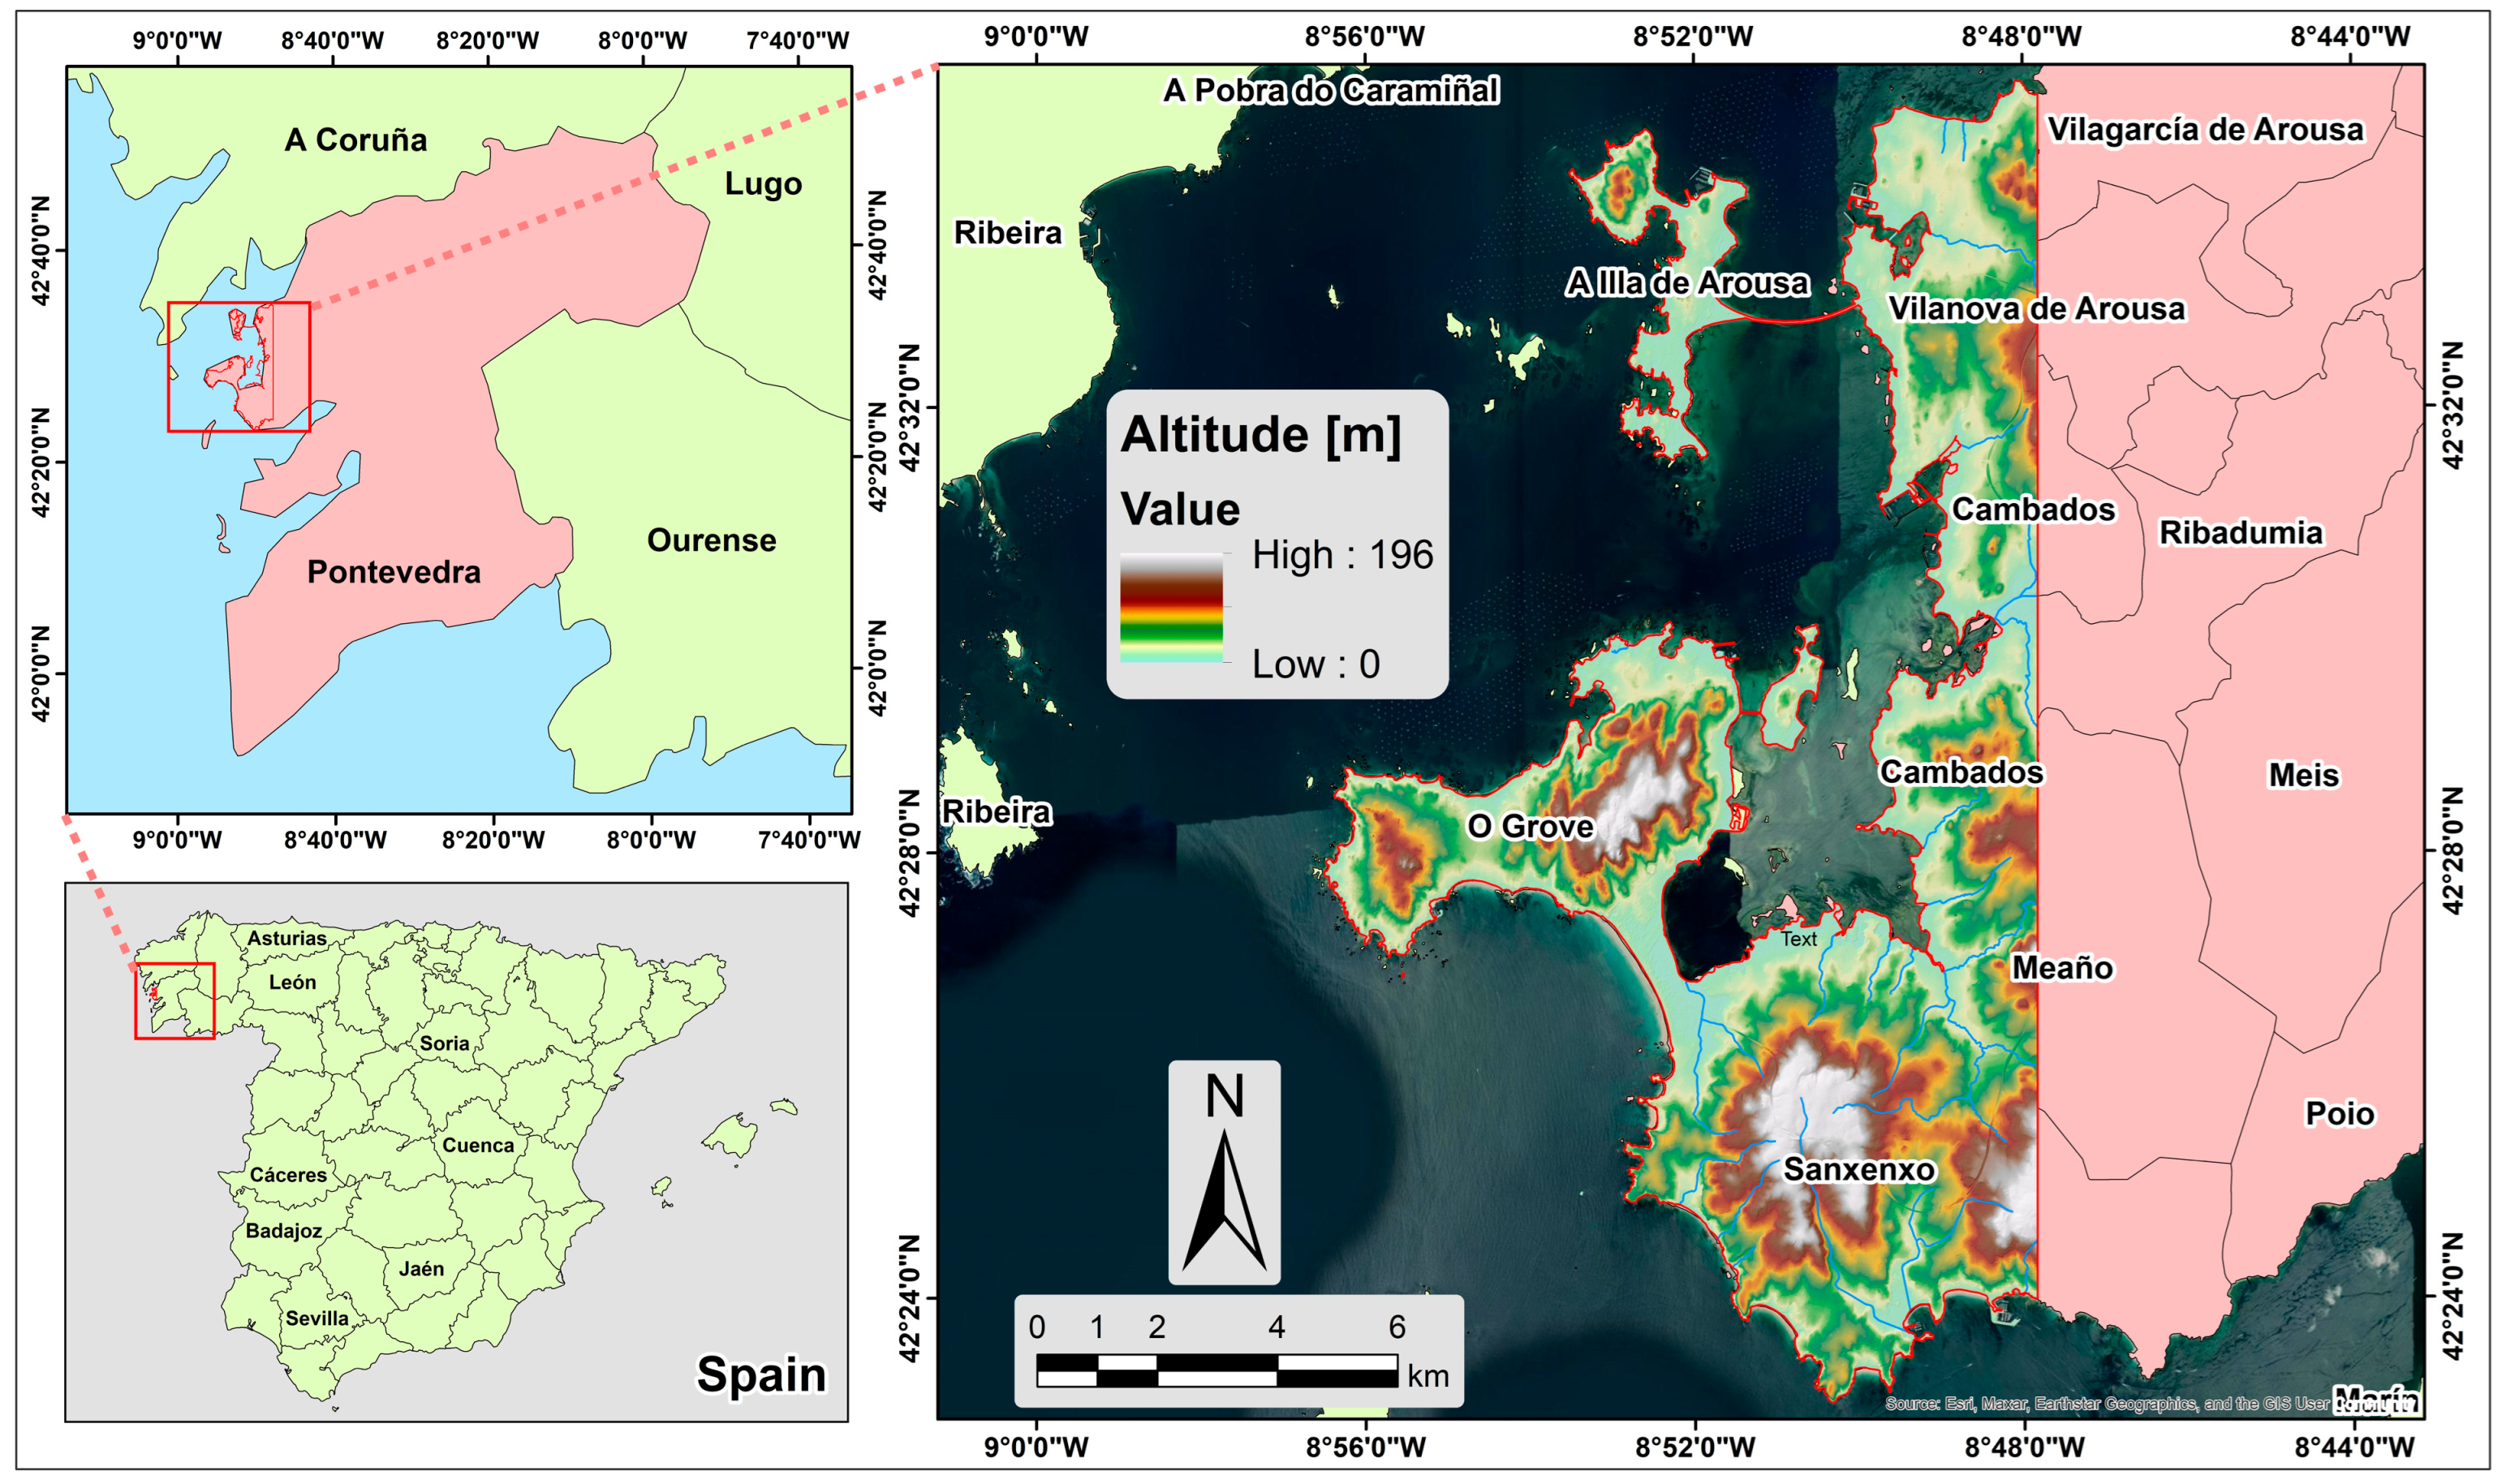
2. The Test Area
3. Methodology and Materials
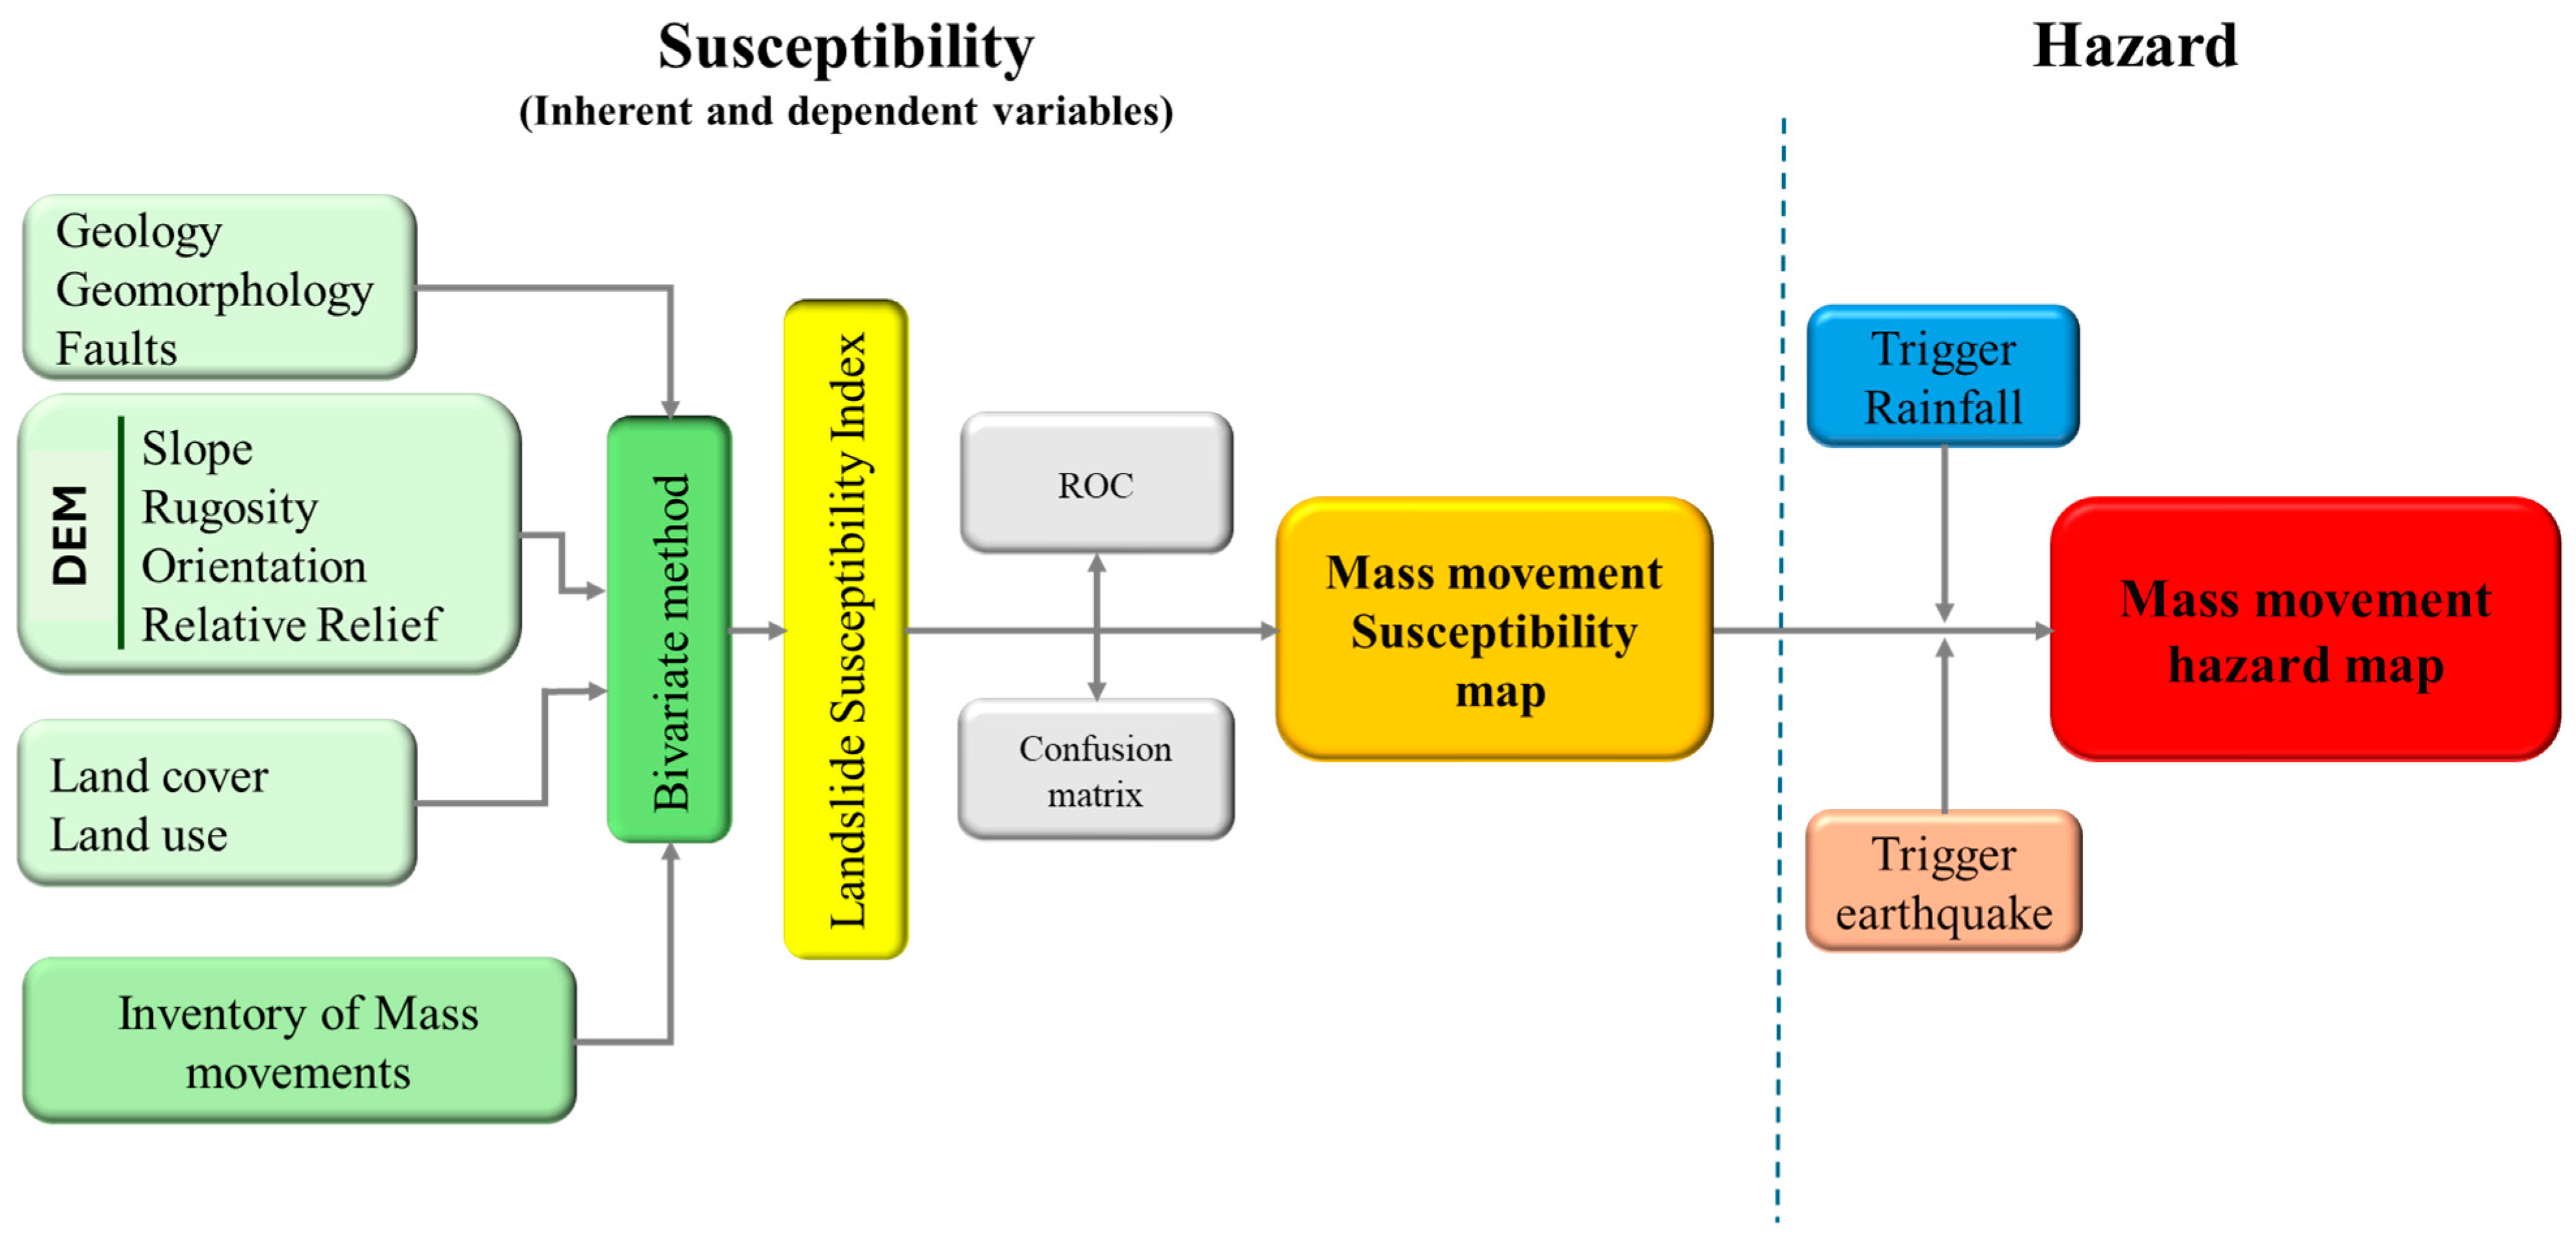
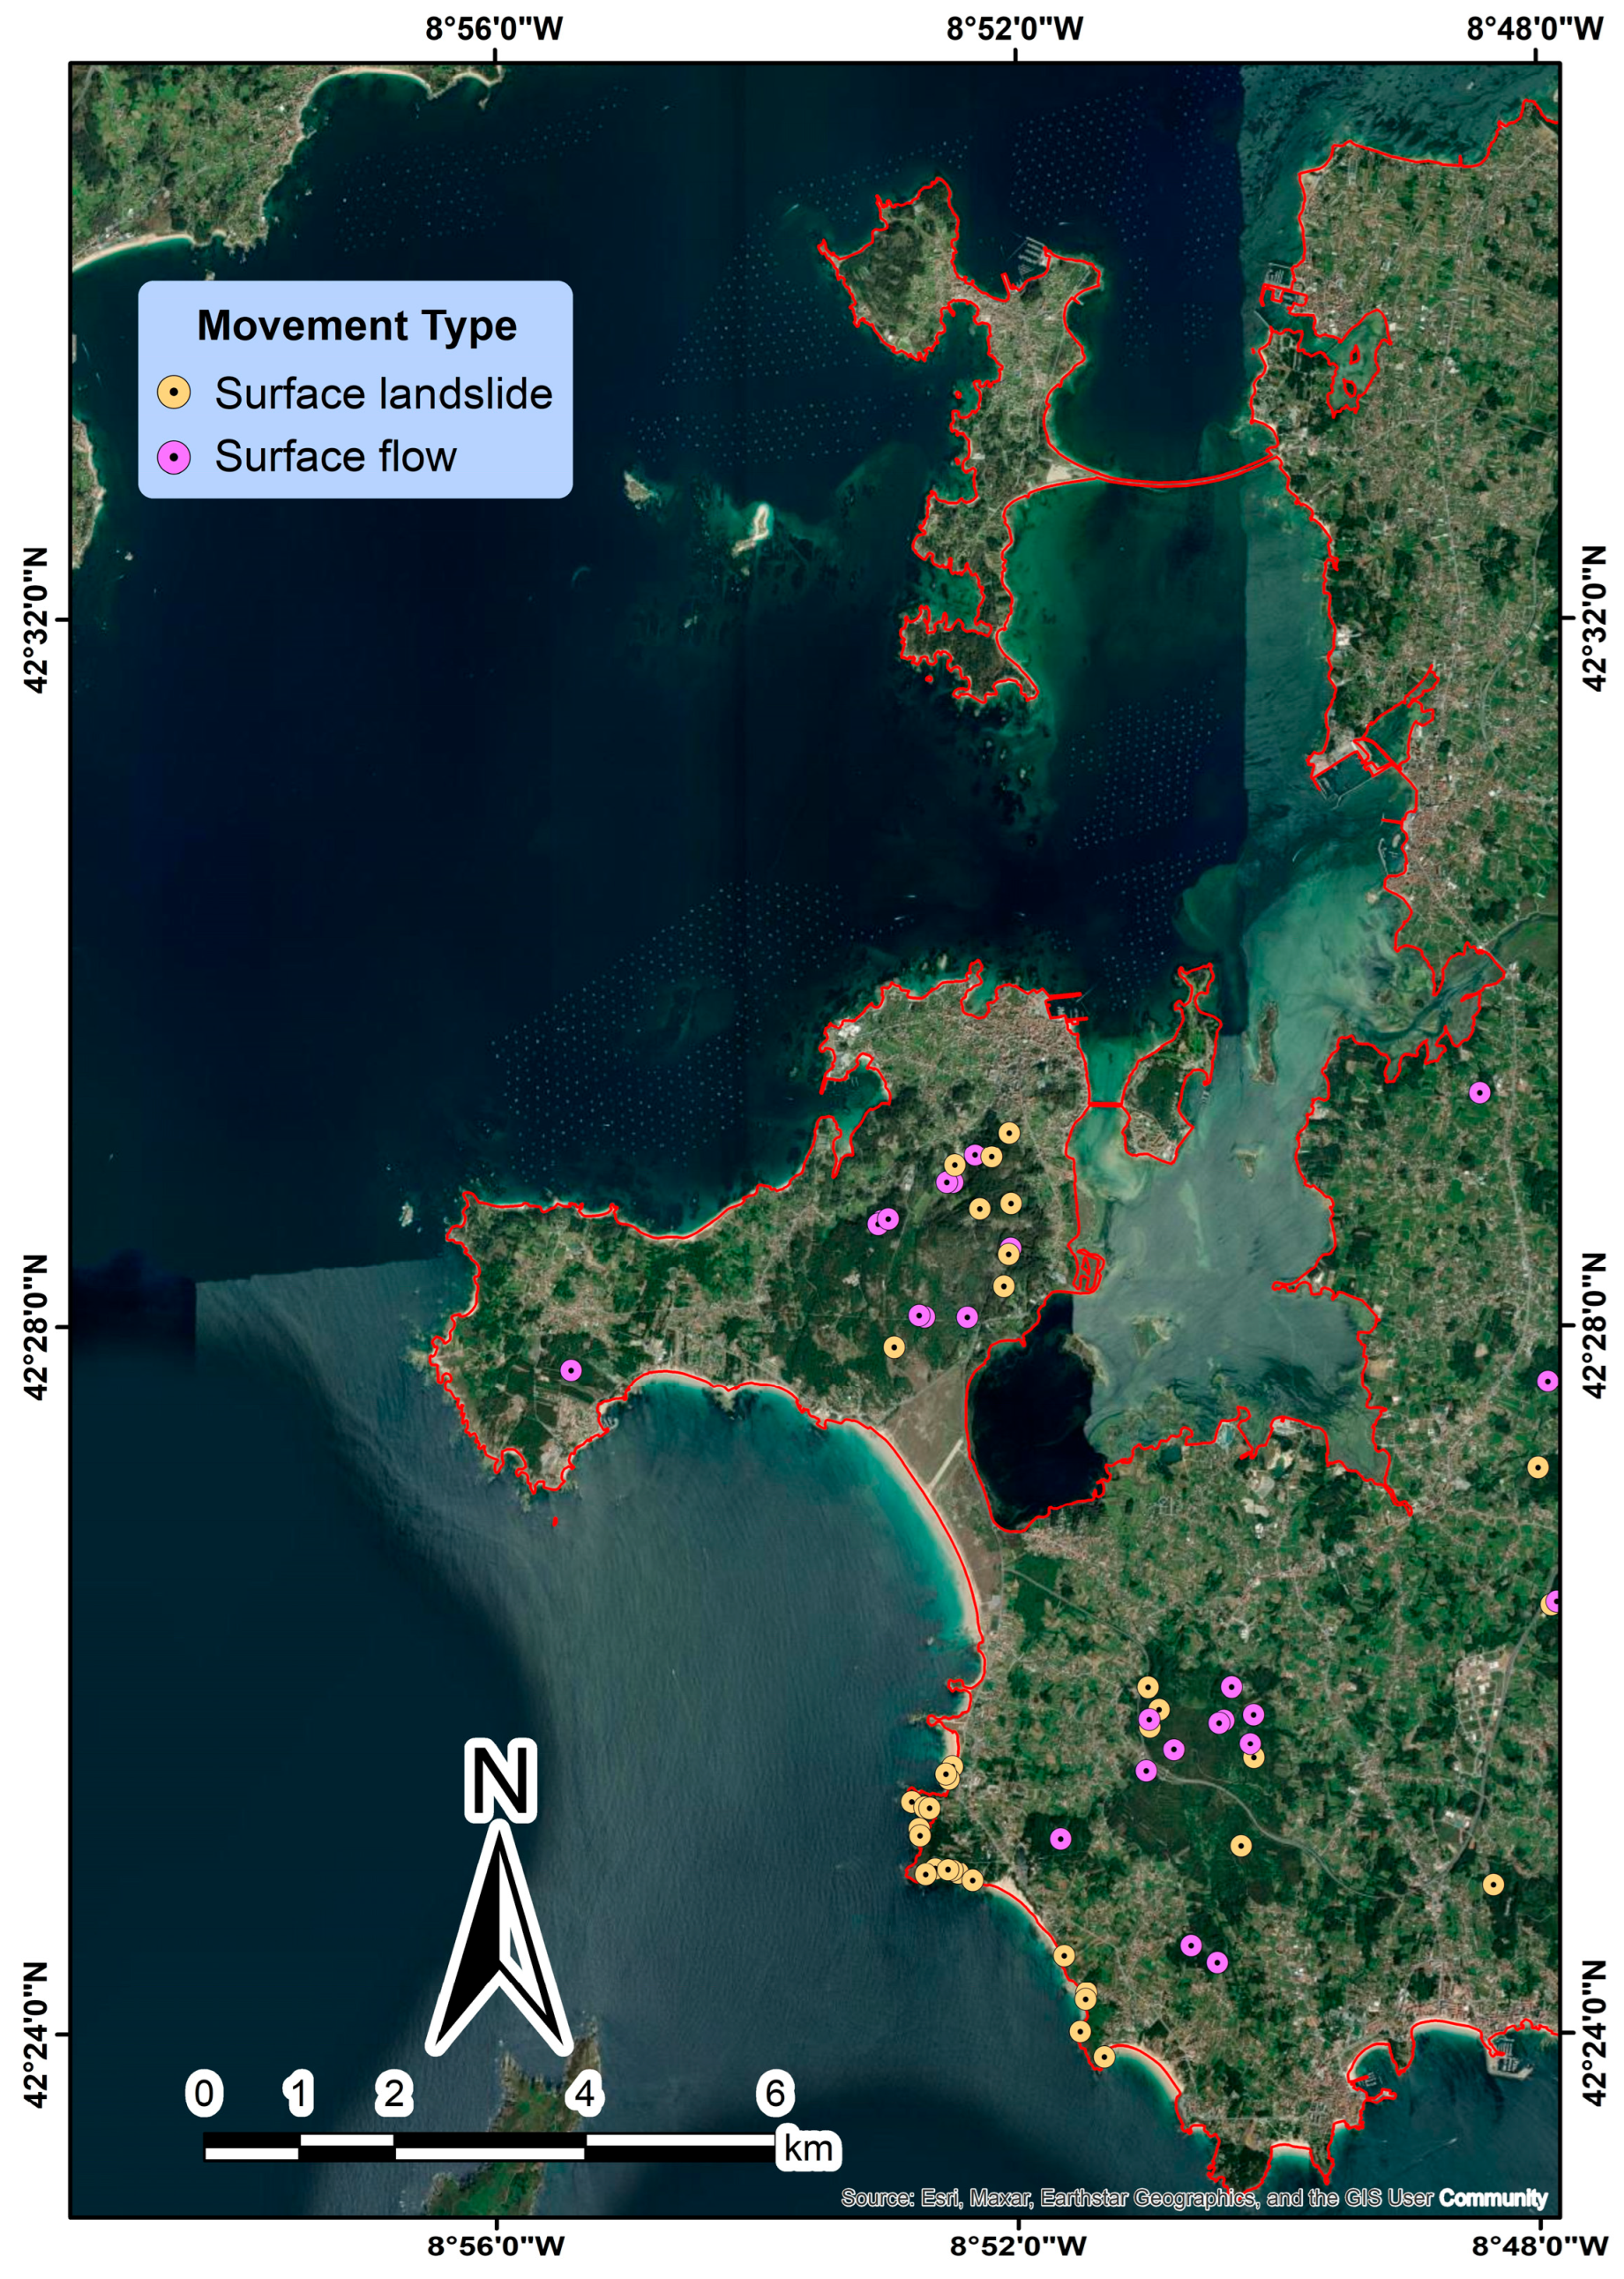
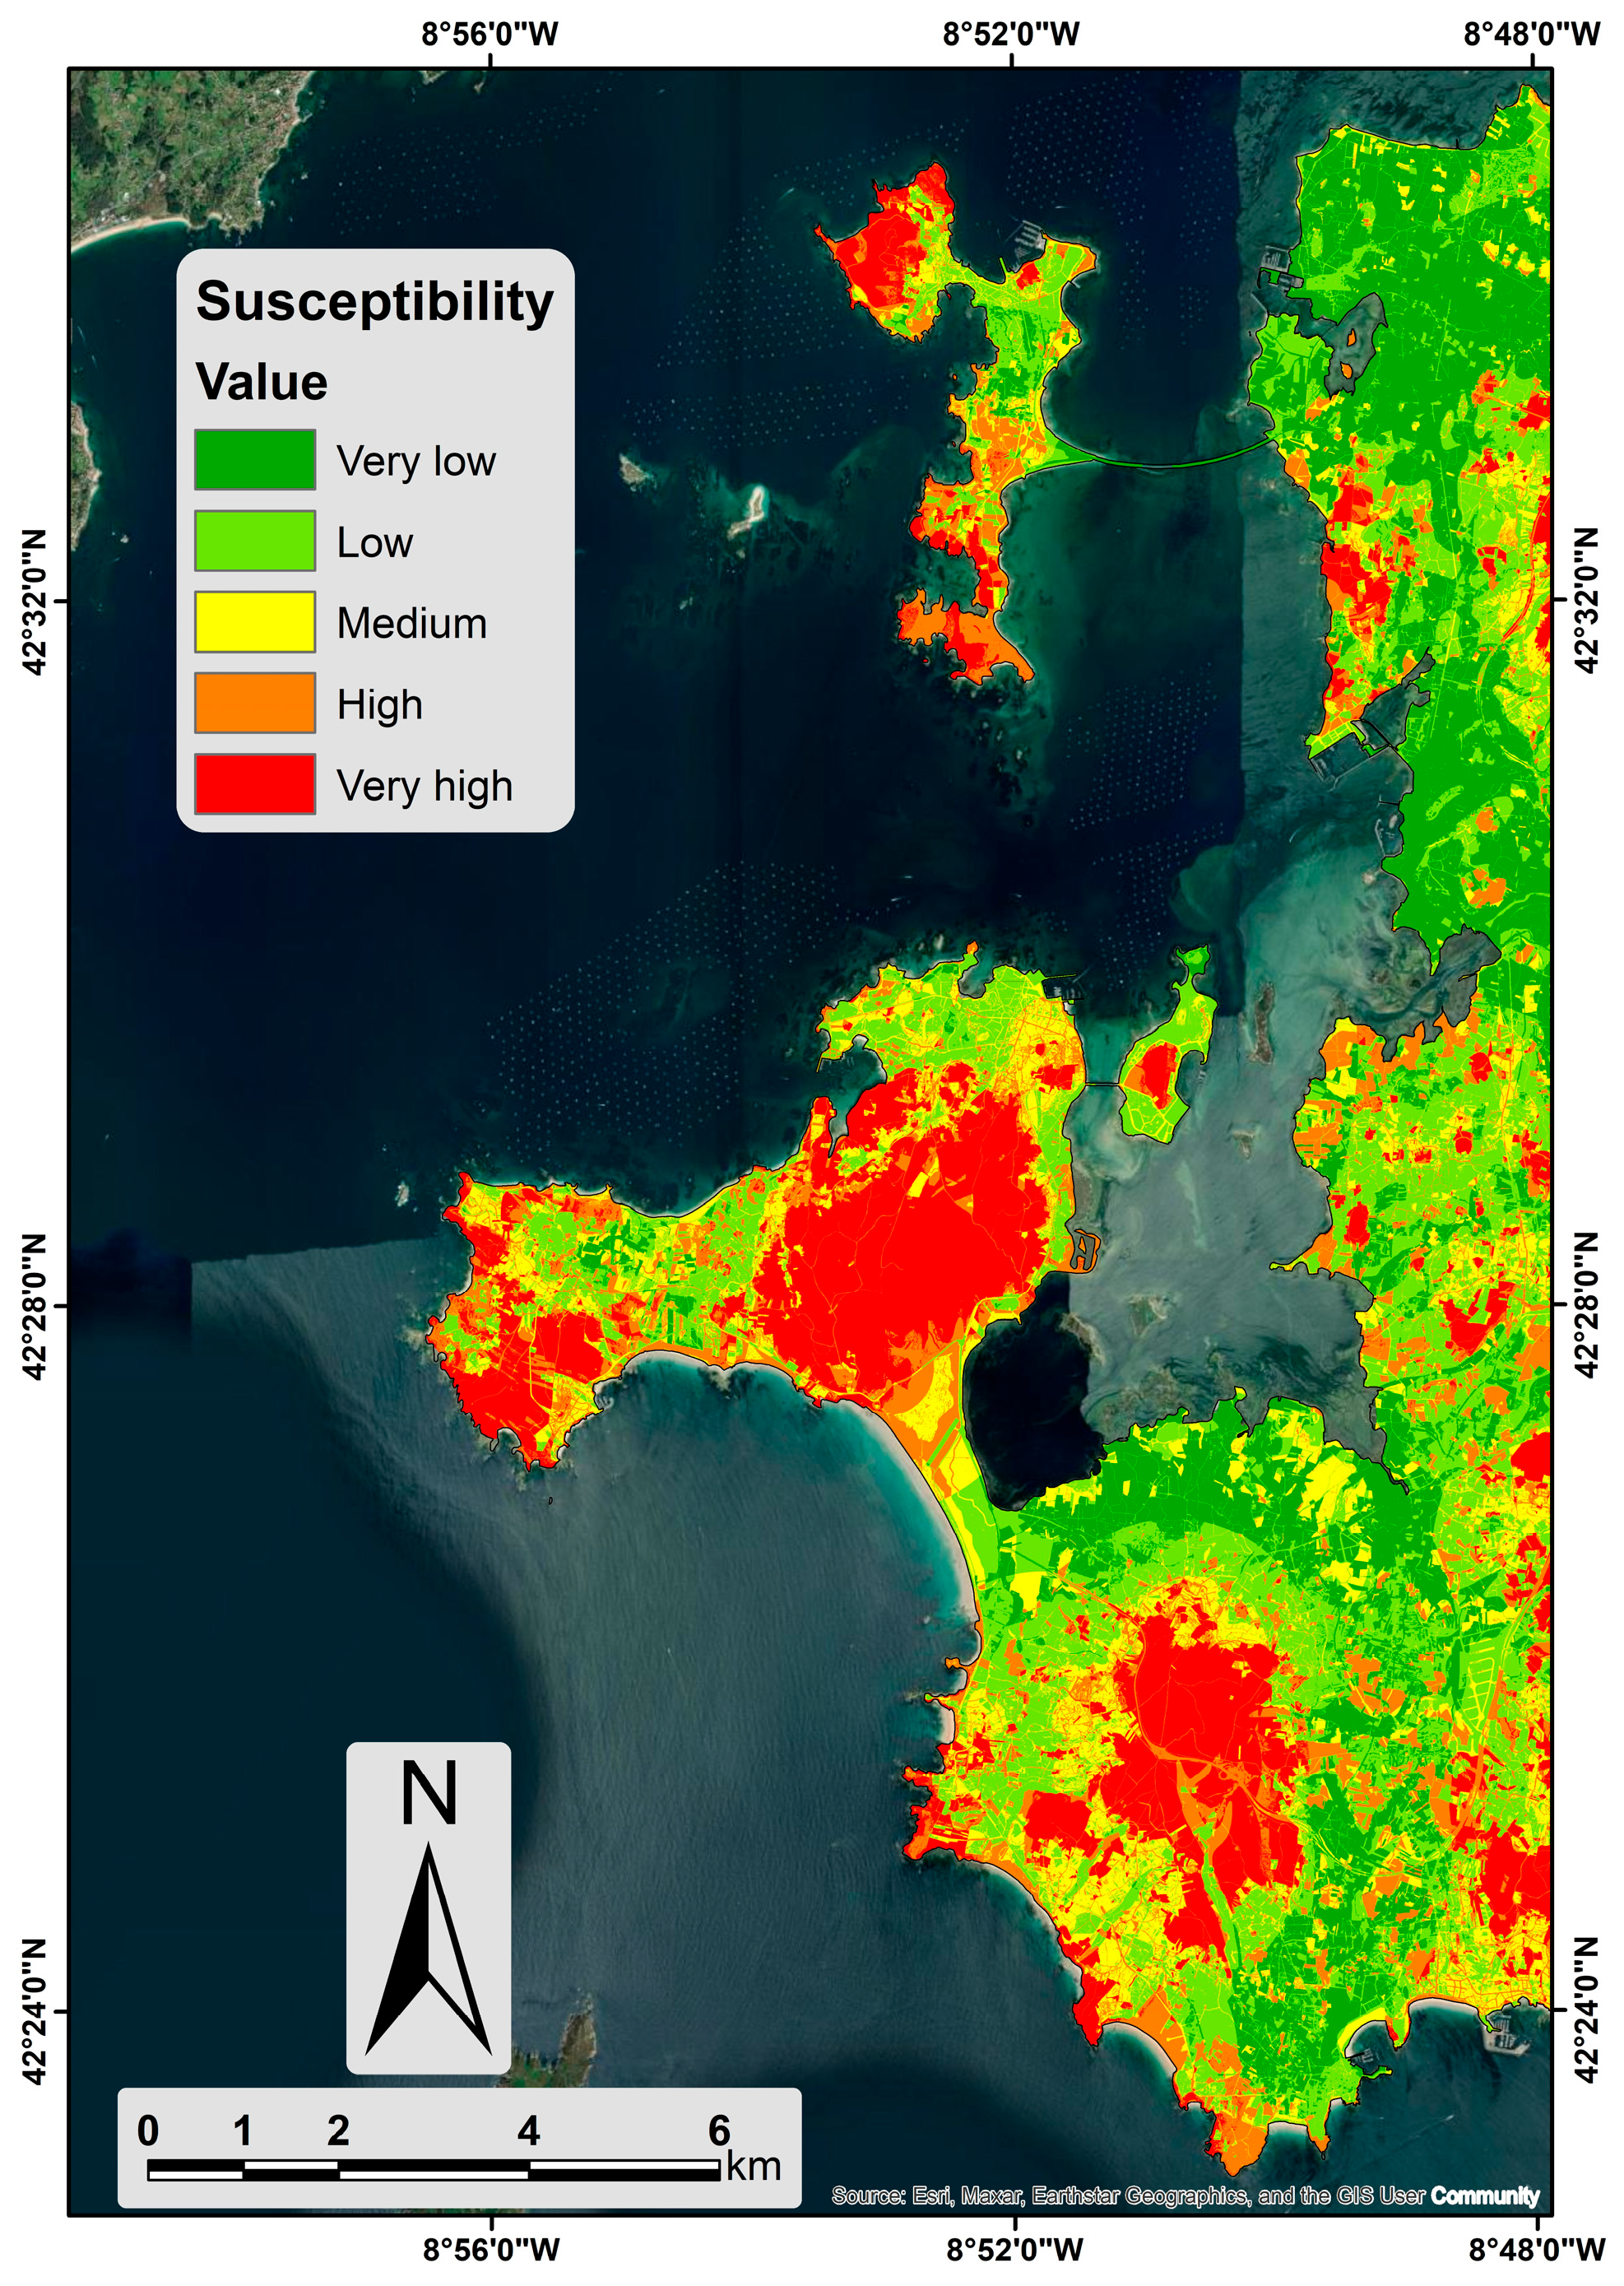
3.1. Calculation of Susceptibility to Mass Movement
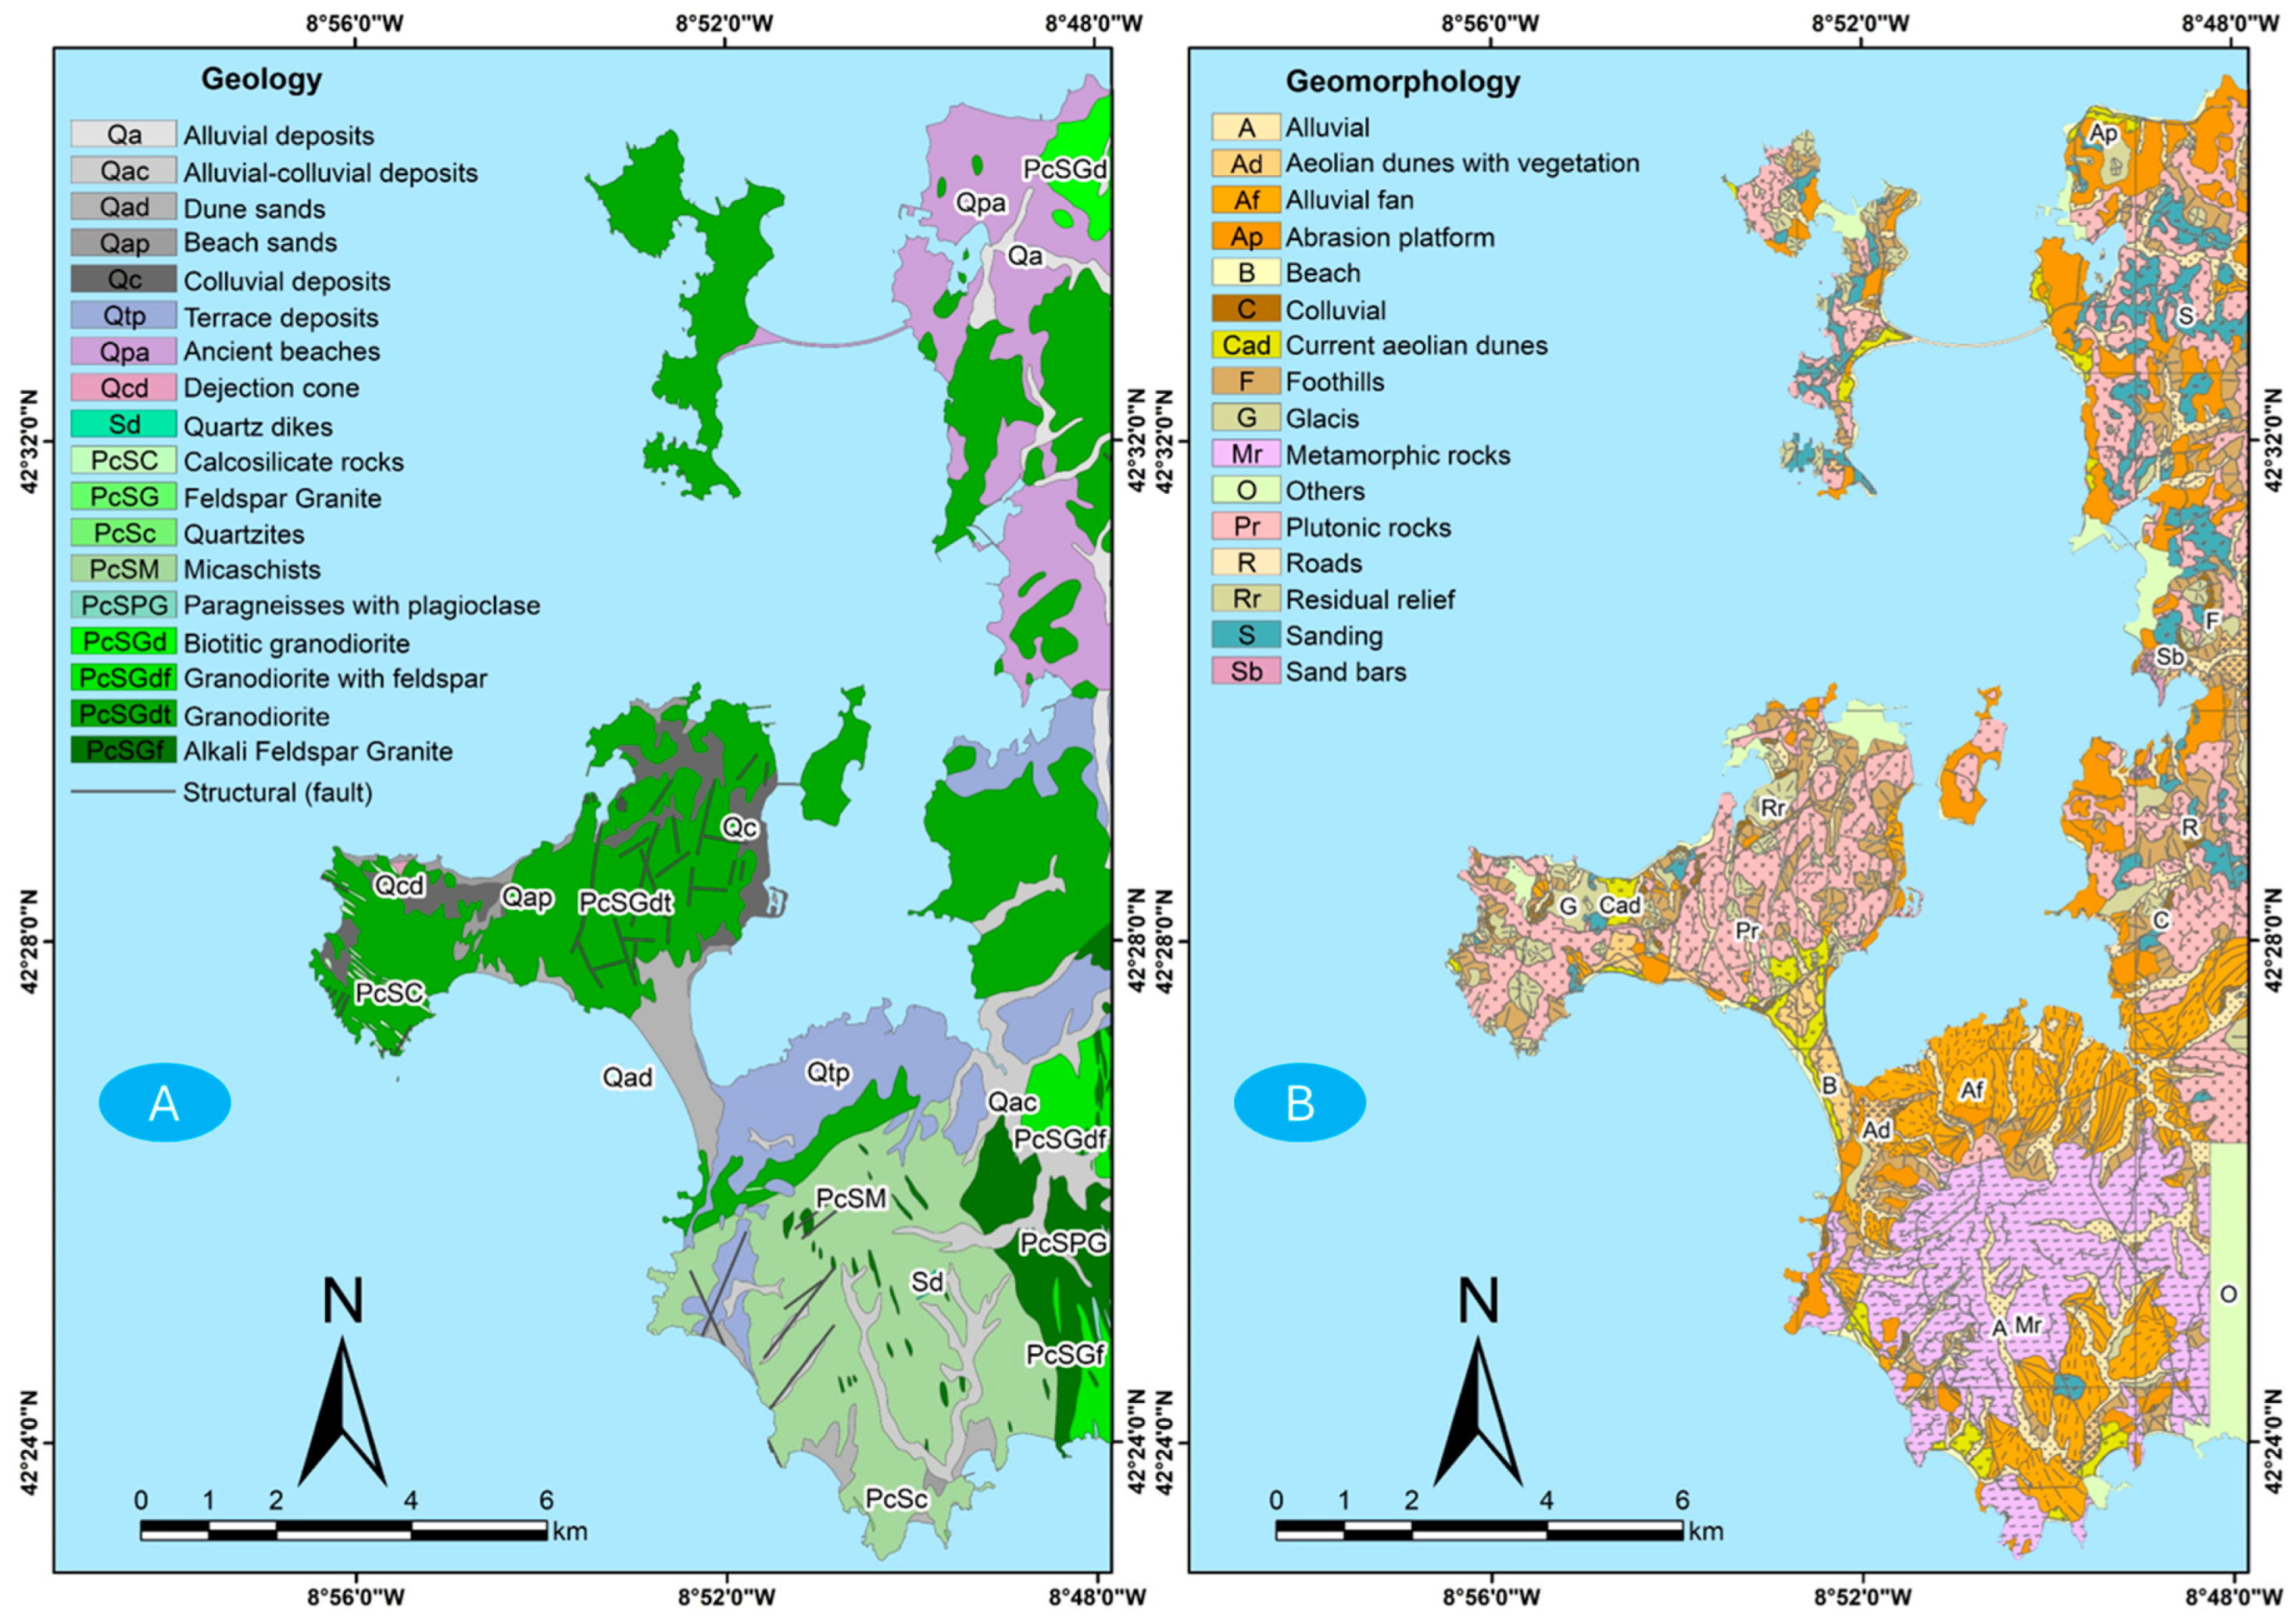
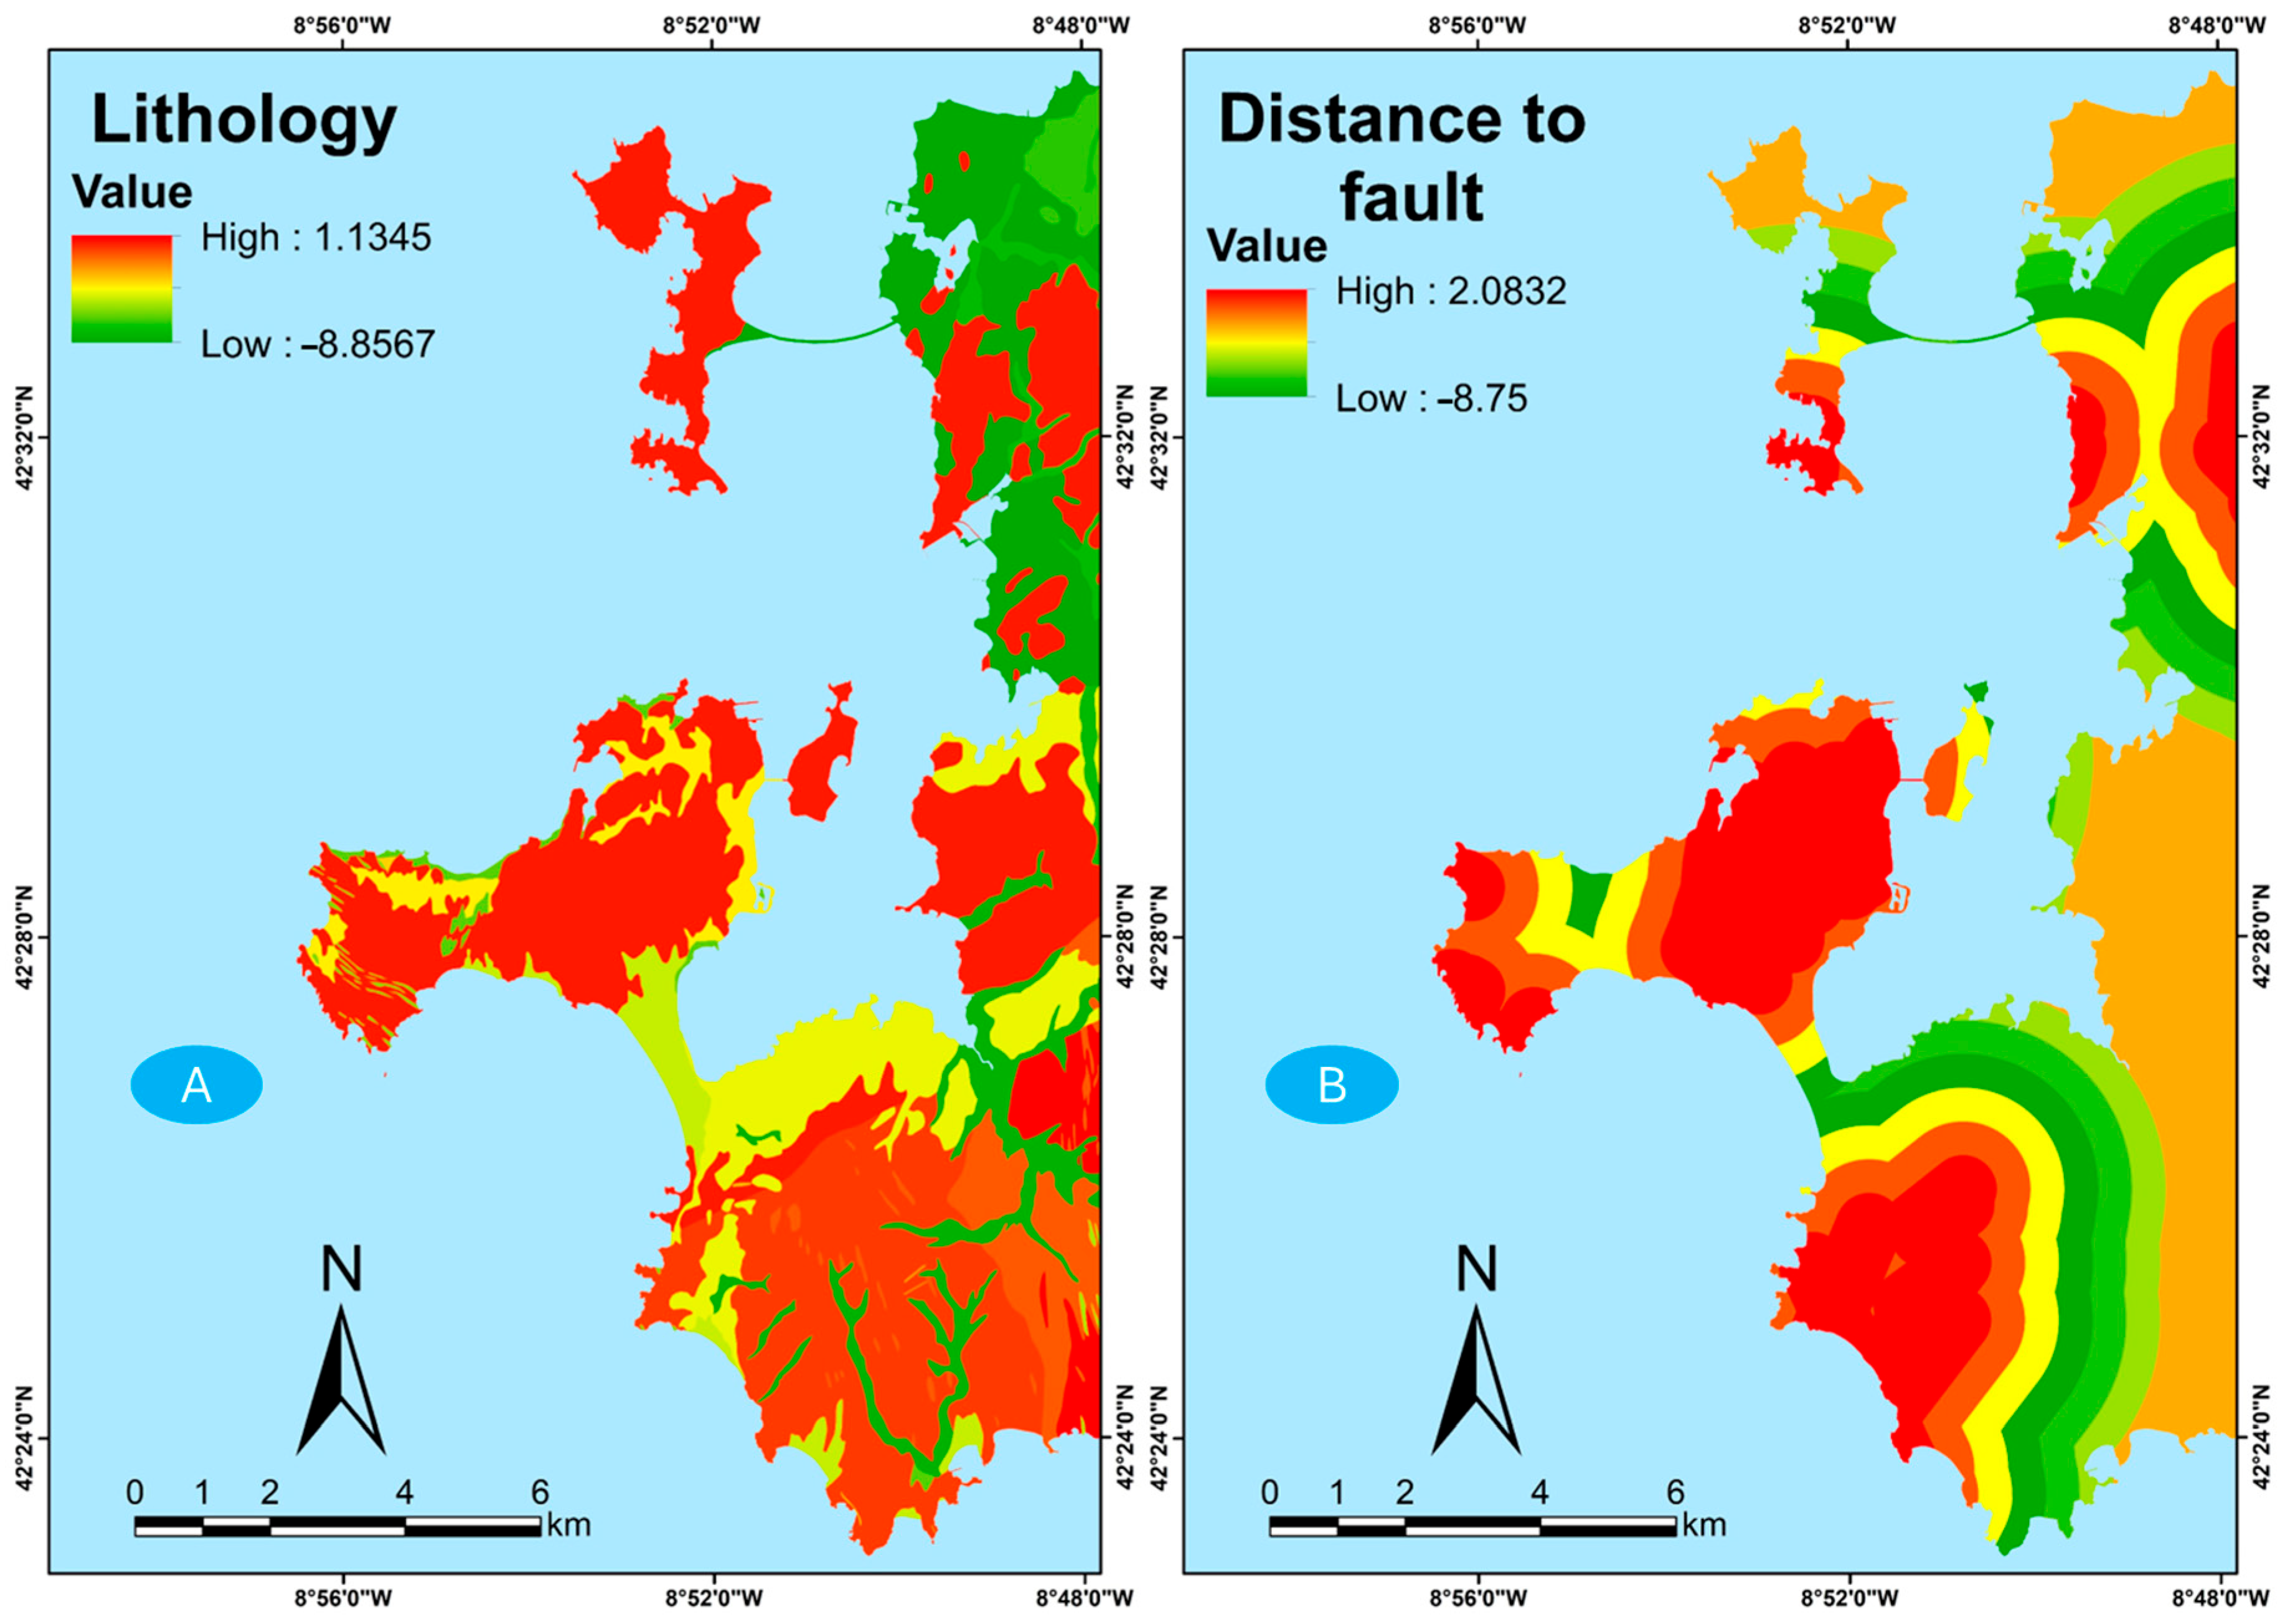
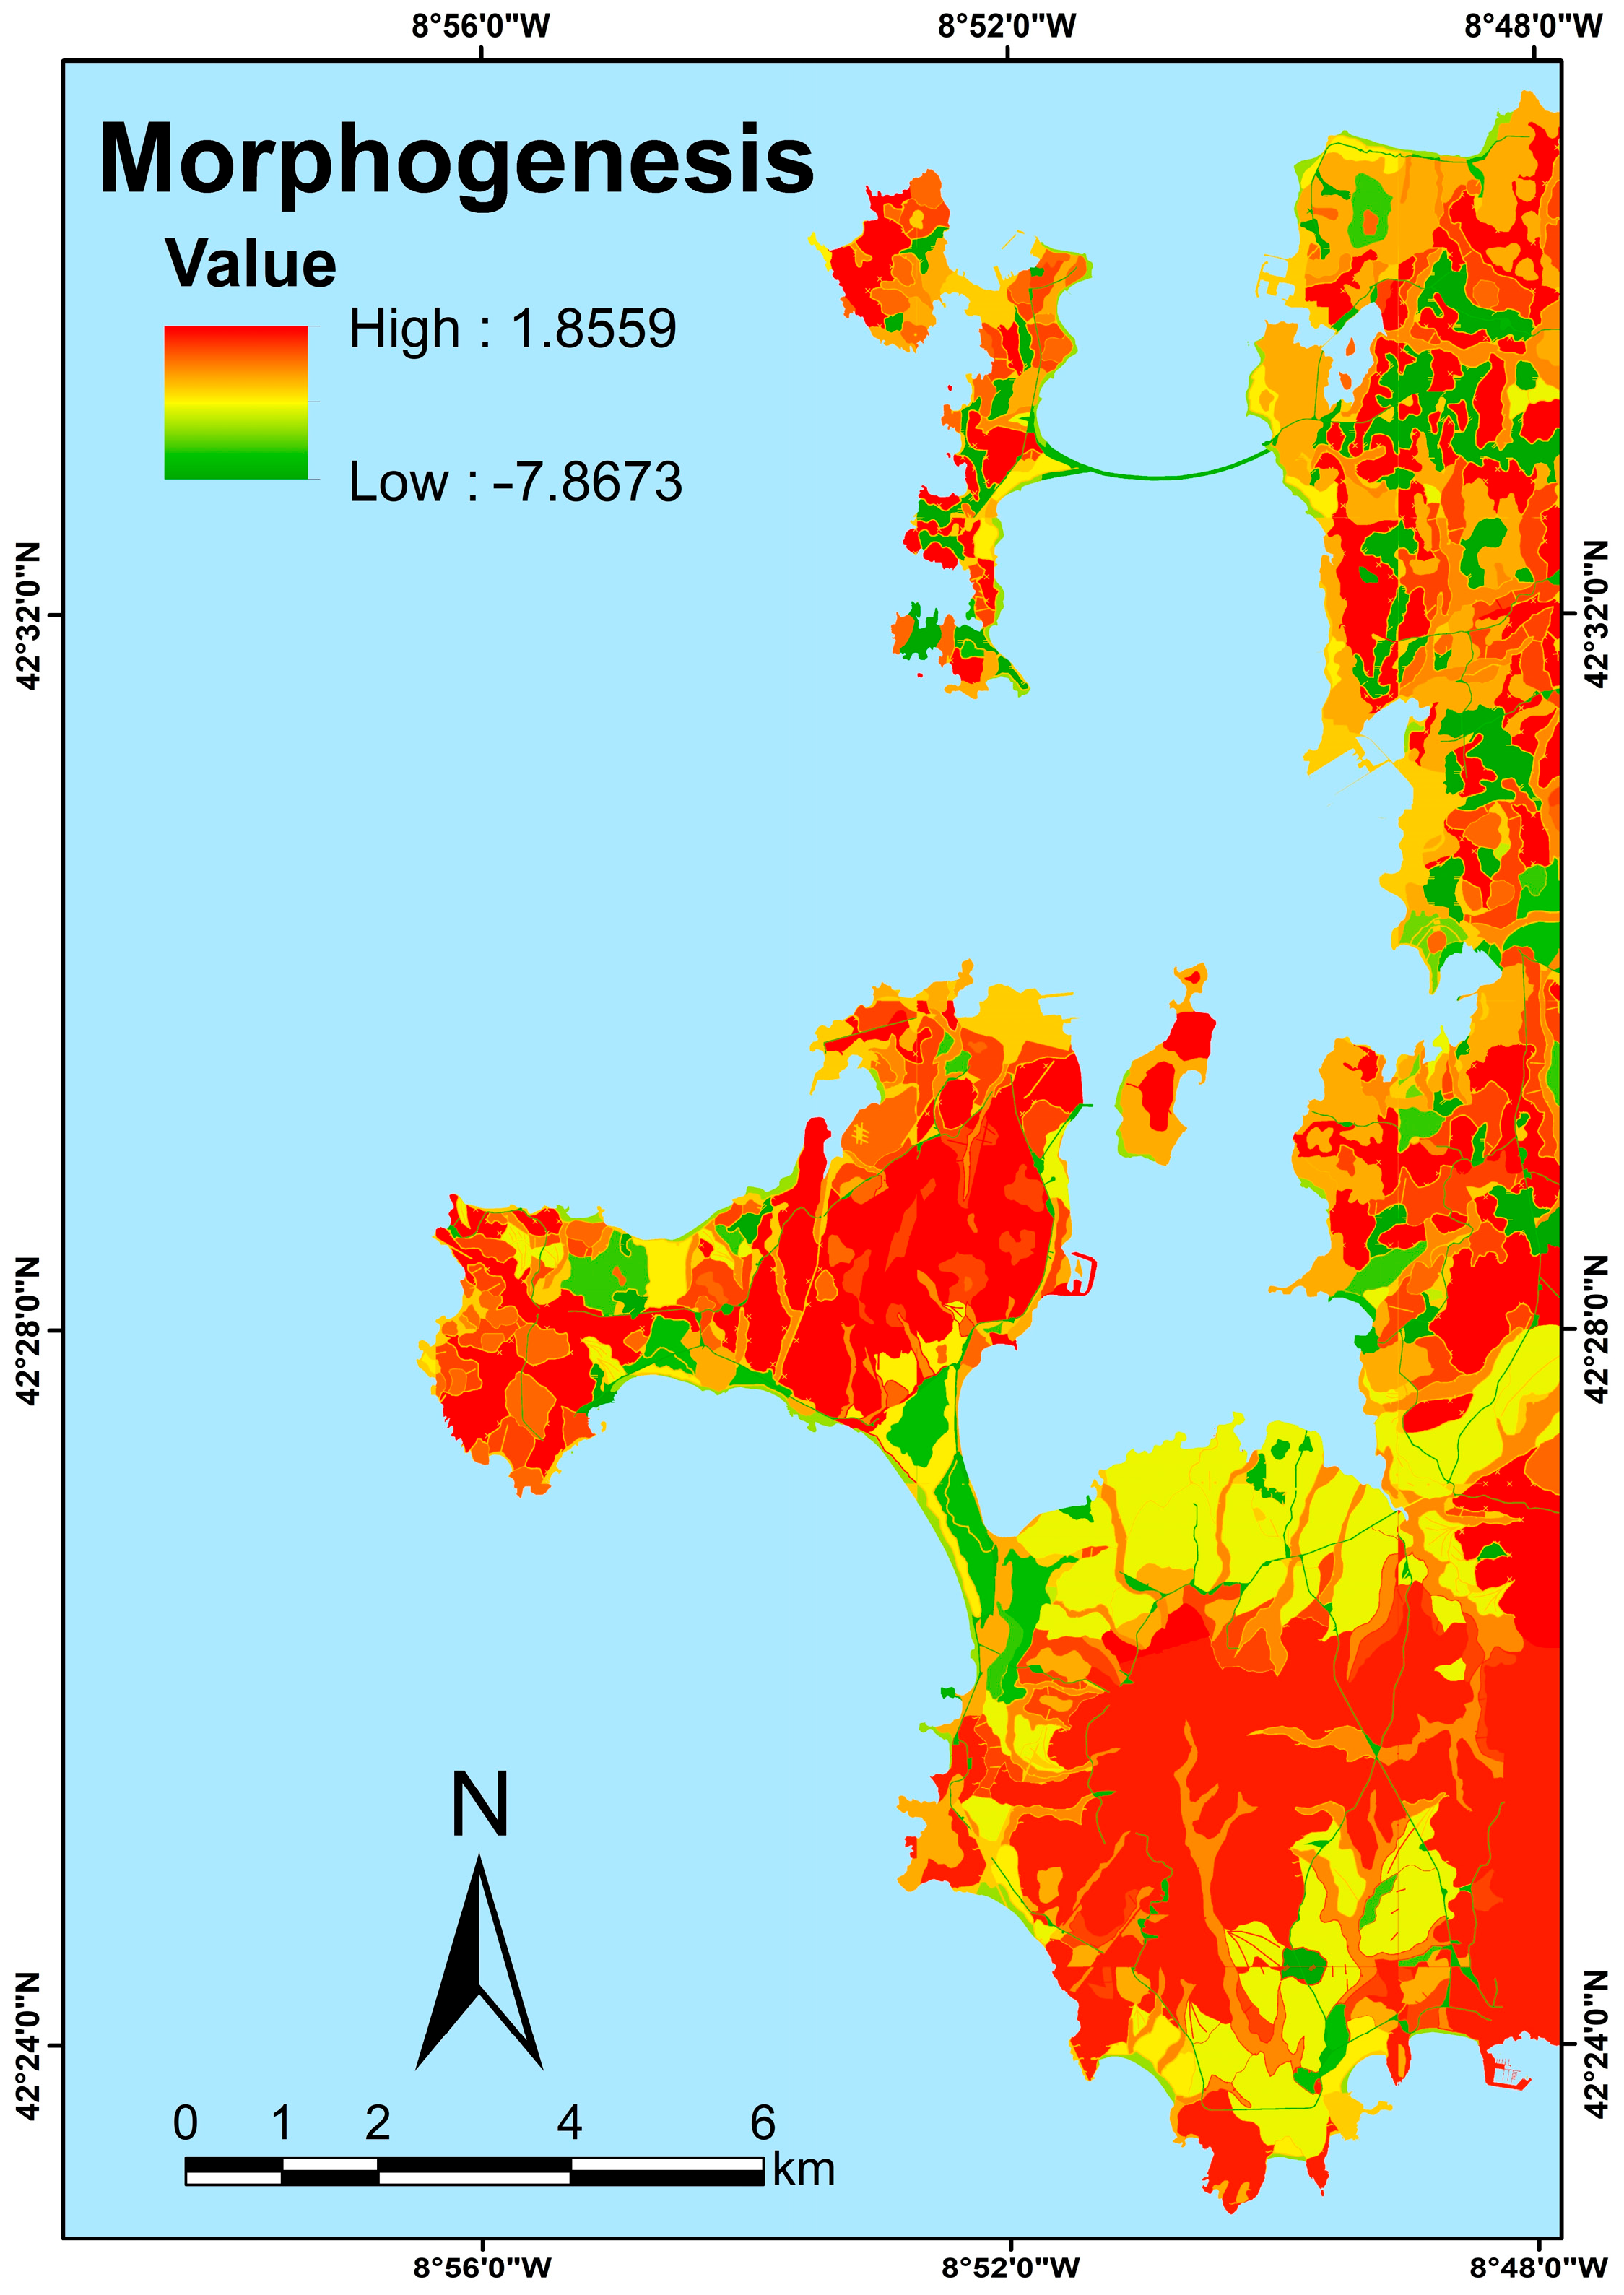
Construction of Geoenvironmental Variables
3.2. Mass Movement Hazard Calculation
4. Results
5. Discussion
6. Conclusions
Author Contributions
Funding
Data Availability Statement
Acknowledgments
Conflicts of Interest
References
- Intergovernmental Panel on Climate Change (IPCC). Climate Change 2007: The Physical Science Basis Contribution of Working Group I to the Fourth Assessment Report of the Intergovernmental Panelon Climate Change; Solomon, S., Qin, D., Manning, M., Chen, Z., Marquis, M., Averyt, K.B., Tignor, M., Miller, H.L., Eds.; Cambridge University Press: Cambridge, UK, 2007.
- Gariano, S.L.; Guzzetti, F. Landslides in a changing climate. Earth Sci. Rev. 2016, 162, 227–252. [Google Scholar] [CrossRef]
- Alvioli, M.; Melillo, M.; Guzzetti, F.; Rossi, M.; Palazzi, E.; von Hardenberg, J.; Brunetti, M.T.; Peruccacci, S. Implications of climate change on landslide hazard in Central Italy. Sci. Total. Environ. 2018, 630, 1528–1543. [Google Scholar] [CrossRef]
- Patton, A.I.; Rathburn, S.L.; Capps, D.M. Landslide response to climate change in permafrost regions. Geomorphology 2019, 340, 116–128. [Google Scholar] [CrossRef]
- Wood, J.; Harrison, S.; Reinhardt, L.; Taylor, F. Landslide databases for climate change detection and attribution. Geomorphology 2020, 355, 107061. [Google Scholar] [CrossRef]
- Popescu, M. Landslide Causal Factors and Landslide Remedial Options. In Proceedings of the 3rd International Conference on Landslides, Slope Stability and Safety of Infra-Structures, Singapore, 11–12 July 2002; pp. 61–81. [Google Scholar]
- Van Westen, C.J.; Castellanos, E.; Kuriakose, S.L. Spatial data for landslide susceptibility, hazard, and vulnerability assessment: An overview. Eng. Geol. 2008, 102, 112–131. [Google Scholar] [CrossRef]
- Lv, L.; Chen, T.; Dou, J.; Plaza, A. A hybrid ensemble-based deep-learning framework for landslide susceptibility mapping. Int. J. Appl. Earth Obs. Geoinf. 2022, 108, 102713. [Google Scholar] [CrossRef]
- Ortiz, J.A.V.; Martínez-Graña, A.M.; Méndez, L.M. Evaluation of Susceptibility by Mass Movements through Stochastic and Statistical Methods for a Region of Bucaramanga, Colombia. Remote Sens. 2023, 15, 4567. [Google Scholar] [CrossRef]
- Varnes, D.J. Slope movement types and processes. In Landslides: Analysis and Control; Schuster, R.L., Krizek, R.J., Eds.; Transportation and Road Research Board, National Academy of Science: Washington, DC, USA, 1978; pp. 11–13. [Google Scholar]
- Fell, R.; Corominas, J.; Bonnard, C.; Cascini, L.; Leroi, E.; Savage, W.Z. Guidelines for landslide susceptibility, hazard and risk zoning for land use planning. Eng. Geol. 2008, 102, 85–98. [Google Scholar] [CrossRef]
- Ortiz, J.A.V.; Martínez-Graña, A.M. A neural network model applied to landslide susceptibility analysis (Capitanejo, Colombia). Geomatics Nat. Hazards Risk 2018, 9, 1106–1128. [Google Scholar] [CrossRef]
- Liu, R.; Ding, Y.; Sun, D.; Wen, H.; Gu, Q.; Shi, S.; Liao, M. Insights into spatial differential characteristics of landslide susceptibility from sub-region to whole-region cased by northeast Chongqing, China. Geomat. Nat. Hazards Risk 2023, 14, 2190858. [Google Scholar] [CrossRef]
- Soeters, R.; van Westen, C.J. Slope instability recognition, analysis and zonation. In Landslide Types and Processes; Turner, A.K., Schuster, R.L., Eds.; Special Report National Research Council 247; National Academy of Sciences: Washington, DC, USA, 1996; Volume 247, pp. 129–177. [Google Scholar]
- Huang, F.; Cao, Z.; Guo, J.; Jiang, S.-H.; Li, S.; Guo, Z. Comparisons of heuristic, general statistical and machine learning models for landslide susceptibility prediction and mapping. CATENA 2020, 191, 104580. [Google Scholar] [CrossRef]
- Cascini, L. Applicability of landslide susceptibility and hazard zoning at different scales. Eng. Geol. 2008, 102, 164–177. [Google Scholar] [CrossRef]
- van Westen, C. Guidelines for the Generation of 1:50.000 Scale Landslide Inventory, Susceptibility Maps, and Qualitative Risk Maps, Illustrated with Case Studies of the Provinces Thanh Hoa and Nghe An; University of Twente: Enschede, The Netherlands, 2013. [Google Scholar]
- Chen, W.; Chai, H.; Sun, X.; Wang, Q.; Ding, X.; Hong, H. A GIS-based comparative study of frequency ratio, statistical index and weights-of-evidence models in landslide susceptibility mapping. Arab. J. Geosci. 2016, 9, 204. [Google Scholar] [CrossRef]
- Wieczorek, G.F. Landslides: Investigation and mitigation. In Chapter 4-Landslide Triggering Mechanisms; Transportation Research Board Special Report: Washington, DC, USA, 1996; pp. 76–90. [Google Scholar]
- Ortiz, J.A.V.; Martínez-Graña, A.M. Calculation of precipitation and seismicity thresholds as triggers for mass movements in the region of Bucaramanga, Colombia. Ecol. Indic. 2023, 152, 110355. [Google Scholar] [CrossRef]
- Corominas, J.; Moya, J. Reconstructing recent landslide activity in relation to rainfall in the Llobregat River basin, Eastern Pyrenees, Spain. Geomorphology 1999, 30, 79–93. [Google Scholar] [CrossRef]
- Iverson, R.M. Landslide triggering by rain infiltration. Water Resour. Res. 2000, 36, 1897–1910. [Google Scholar] [CrossRef]
- Dai, F.; Lee, C. Frequency–volume relation and prediction of rainfall-induced landslides. Eng. Geol. 2001, 59, 253–266. [Google Scholar] [CrossRef]
- Rosi, A.; Peternel, T.; Jemec-Auflič, M.; Komac, M.; Segoni, S.; Casagli, N. Rainfall thresholds for rainfall-induced landslides in Slovenia. Landslides 2016, 13, 1571–1577. [Google Scholar] [CrossRef]
- Dikshit, A.; Sarkar, R.; Pradhan, B.; Segoni, S.; Alamri, A.M. Rainfall Induced Landslide Studies in Indian Himalayan Region: A Critical Review. Appl. Sci. 2020, 10, 2466. [Google Scholar] [CrossRef]
- Sidle, R.C.; Swanston, D.N. Analysis of a small debris slide in coastal Alaska. Can. Geotech. J. 1982, 19, 167–174. [Google Scholar] [CrossRef]
- Fredlund, D.C. Slope stability analysis incorporating the effect of soil suction. In Slope Stability; Anderson, M.G., Ed.; John Wiley & Sons Ltd.: Saskatchewan, SK, Canada, 1987; Chapter 4. [Google Scholar]
- Crosta, G. Regionalization of rainfall thresholds: An aid to landslide hazard evaluation. Environ. Geol. 1998, 35, 131–145. [Google Scholar] [CrossRef]
- Aleotti, P. A warning system for rainfall-induced shallow failures. Eng. Geol. 2004, 73, 247–265. [Google Scholar] [CrossRef]
- Rodríguez, C.; Bommer, J.; Chandler, R. Earthquake-induced landslides: 1980–1997. Soil Dyn. Earthq. Eng. 1999, 18, 325–346. [Google Scholar] [CrossRef]
- Bird, J.F.; Bommer, J.J. Earthquake losses due to ground failure. Eng. Geol. 2004, 75, 147–179. [Google Scholar] [CrossRef]
- Corominas, J.; Van Westen, C.; Frattini, P.; Cascini, L.; Malet, J.-P.; Fotopoulou, S.; Catani, F.; Van Den Eeckhaut, M.; Mavrouli, O.; Agliardi, F.; et al. Recommendations for the quantitative analysis of landslide risk. Bull. Eng. Geol. Environ. 2014, 73, 209–263. [Google Scholar] [CrossRef]
- UNDRR. Sendai Framework for Disaster Risk Reduction 2015–2030; United Nations (ONU), United Nations Office for Disaster Risk Reduction: Geneva, Switzerland, 2015. [Google Scholar]
- IGME. Mapa Geológico de España E. 1:50.000, Puebla de Caramiñal, Hoja 151 (3–9), Segunda Serie—Primera Edición; Instituto Geológico y Minero de España, Servicio de Publicaciones Ministerio de Industria y Energía: Madrid, Spain, 1981. [Google Scholar]
- IGME. Mapa Geológico de España E. 1:50.000, Grove, Hoja 184 (3–10), Segunda Serie—Primera Edición; Instituto Geológico y Minero de España, Servicio de Publicaciones Ministerio de Industria y Energía: Madrid, Spain, 1981. [Google Scholar]
- IGME. Mapa Geológico de España E. 1:50.000, Pontevedra, Hoja 185 (4–10), Segunda Serie—Primera Edición; Instituto Geológico y Minero de España, Servicio de Publicaciones Ministerio de Industria y Energía: Madrid, Spain, 1981. [Google Scholar]
- IGME. Mapa Geológico de España E. 1:50.000, Villagarcía De Arosa, Hoja 152 (4–9), Segunda Serie—Primera Edición; Instituto Geológico y Minero de España, Servicio de Publicaciones Ministerio de Industria y Energía: Madrid, Spain, 1982. [Google Scholar]
- Martinez-Graña, A.M.; Arias, L.; Goy, J.L.; Zazo, C.; Silva, P. Geomorphology of the mouth of the Arosa estuary (Coruña-Pontevedra, Spain). J. Maps 2017, 13, 554–562. [Google Scholar] [CrossRef]
- Cruden, D.M. A simple definition of a landslide. Bull. Eng. Geol. Environ. 1991, 43, 27–29. [Google Scholar] [CrossRef]
- UNDRR. Natural Disasters and Vulnerability Analysis: Report of Expert Group Meeting, 9–12 July 1979. Office of the United Nations Disaster Relief Coordinator. Available online: https://digitallibrary.un.org/record/95986?ln=en&v=pdf (accessed on 11 April 2024).
- Bonham-Carter, G.F.; Agterberg, F.P.; Wright, D.F. Integration of geological datasets for gold exploration in Nova Scotia. Photogramm. Eng. Remote Sens. 1988, 54, 1585–1592. [Google Scholar] [CrossRef]
- Bonham, G. Geographic Information Systems for Geoscientists: Modelling with GIS (No. 13); Pergamon, Ed.; Elsevier: Ámsterdam, The Netherlands, 1994; Volume 13. [Google Scholar]
- Sato, H.P.; Harp, E.L. Interpretation of earthquake-induced landslides triggered by the 12 May 2008, M7.9 Wenchuan earthquake in the Beichuan area, Sichuan Province, China using satellite imagery and Google Earth. Landslides 2009, 6, 153–159. [Google Scholar] [CrossRef]
- Guzzetti, F.; Mondini, A.C.; Cardinali, M.; Fiorucci, F.; Santangelo, M.; Chang, K.-T. Landslide inventory maps: New tools for an old problem. Earth-Sci. Rev. 2012, 112, 42–66. [Google Scholar] [CrossRef]
- Hungr, O.; Leroueil, S.; Picarelli, L. The Varnes classification of landslide types, an update. Landslides 2014, 11, 167–194. [Google Scholar] [CrossRef]
- Skemton, A.W.; Hutchinson, J.N. Stability of natural slopes and embankment foundations. In Proceedings of the Seventh lntemational Conference on Soil Mechanics and Foundation Engineering 4, Mexico City, Mexico, 25–29 August 1969; Sociedad Mexicana de Mecánica de de Suelos: Mexico City, México, 1969; pp. 291–340. Available online: https://trid.trb.org/view/125702 (accessed on 11 April 2024).
- IGN; Instituto Geográfico Nacional. Centro de Descargas—CartoBase ANE. Available online: https://centrodedescargas.cnig.es/CentroDescargas/index.jsp# (accessed on 11 April 2024).
- Zinck, J.A. Geopedología: Elementos de geomorfología para estudios de suelos y de riesgos naturales: Enschede. In International Institute for Geo-Information Science and Earth Observation (ITC); ITC Special Lecture Notes Series; University of Twente: Enschede, The Netherlands, 2012. [Google Scholar]
- Bossard, M.; Feranec, J.; Otahel, J. CORINE Land Cover Technical Guide: Addendum 2000; European Environment Agency: Copenhagen, Denmark, 2000; Volume 40.
- Charman, P.V.; Murphy, B.W. Soils: Their Properties and Management, 2nd ed.; Oxford University Press: Melbourne, Australia; Oxford, UK, 2000. [Google Scholar]
- IGN; Instituto Geográfico Nacional. Centro de Descargas—CORINE Land Cover. Available online: https://qrcd.org/5bHm (accessed on 12 April 2024).
- IGN; Instituto Geográfico Nacional. Centro de Descargas—SIOSE AR. Available online: https://qrcd.org/5rAl# (accessed on 12 April 2024).
- Dahal, R.K.; Hasegawa, S.; Nonomura, A.; Yamanaka, M.; Dhakal, S.; Paudyal, P. Predictive modelling of rainfall-induced landslide hazard in the Lesser Himalaya of Nepal based on weights-of-evidence. Geomorphology 2008, 102, 496–510. [Google Scholar] [CrossRef]
- Vakhshoori, V.; Zare, M. Landslide susceptibility mapping by comparing weight of evidence, fuzzy logic, and frequency ratio methods. Geomat. Nat. Hazards Risk 2015, 7, 1731–1752. [Google Scholar] [CrossRef]
- Lin, L.; Lin, Q.; Wang, Y. Landslide susceptibility mapping on a global scale using the method of logistic regression. Nat. Hazards Earth Syst. Sci. 2017, 17, 1411–1424. [Google Scholar] [CrossRef]
- Zhao, Z.; He, Y.; Yao, S.; Yang, W.; Wang, W.; Zhang, L.; Sun, Q. A comparative study of different neural network models for landslide susceptibility mapping. Adv. Space Res. 2022, 70, 383–401. [Google Scholar] [CrossRef]
- Nadim, F.; Kjekstad, O.; Peduzzi, P.; Herold, C.; Jaedicke, C. Global landslide and avalanche hotspots. Landslides 2006, 3, 159–173. [Google Scholar] [CrossRef]
- SGC. Documento Metodológico de la Zonificación de Susceptibilidad y Amenaza por Movimientos en Masa Escala 1:100.000; Servicio Geológico Colombiano (SGC): Bogotá, Colombia, 2013. [Google Scholar] [CrossRef]
- CEDEX; Centro de Estudios y Experimentación de Obras Públicas. Ministerio de Transportes y Movilidad Sostenible. Available online: https://ceh.cedex.es/web/Imp_CClimatico_Pmax.htm (accessed on 12 April 2024).
- IGN. Instituto Geográfico Nacional. Mapas de Sismicidad y Peligrosidad. Available online: https://www.ign.es/web/ign/portal (accessed on 12 April 2024).
- Pachauri, A.; Pant, M. Landslide hazard mapping based on geological attributes. Eng. Geol. 1992, 32, 81–100. [Google Scholar] [CrossRef]
- Dai, F.C.; Lee, C.F. Landslide characteristics and slope instability modeling using GIS, Lantau Island, Hong Kong. Geomorphology 2002, 42, 213–228. [Google Scholar] [CrossRef]
- Santacana, N. Análisis de la susceptibilidad del terreno a la formación de deslizamientos superficiales y grandes deslizamientos mediante el uso de sistemas de información geográfica. Aplicación a la cuenca alta del río Llobregat. Ph.D. Thesis, UPC, Departament d’Enginyeria del Terreny, Cartogràfica i Geofísica, Barcelona, Spain, 2001. [Google Scholar]
- van Zuidam, R.A. Aerial Photo-Interpretation in Terrain Analysis and Geomorphologic Mapping; Smits Publishers: The Hague, The Netherlands, 1986. [Google Scholar]
- Felicisimo, A.M. Modelos Digitales del Terreno. Oviedo: Pentalfa. 1994. Available online: http://www.etsimo.uniovi.es/~feli (accessed on 11 November 2016).
- ESRI. GIS Dictionary. Available online: https://support.esri.com/en-us/gis-dictionary/geometric-interval-classification (accessed on 15 May 2024).
- IPCC. Climate Change 2013: The Physical Science Basis Contribution of Working Group I to the Fifth Assessment Report of the Intergovernmental Panel on Climate Change; Stocker, T.D.-K., Ed.; Cambridge University Press: New York, NY, USA; Cambridge, UK, 2013; pp. 91, 106, 184. [Google Scholar]
- Bathrellos, G.D.; Gaki-Papanastassiou, K.; Skilodimou, H.D.; Papanastassiou, D.; Chousianitis, K.G. Potential suitability for urban planning and industry development using natural hazard maps and geological–geomorphological parameters. Environ. Earth Sci. 2012, 66, 537–548. [Google Scholar] [CrossRef]
- Glade, T.; Crozier, M.; Smith, P. Applying Probability Determination to Refine Landslide-triggering Rainfall Thresholds Using an Empirical “Antecedent Daily Rainfall Model”. Pure Appl. Geophys. 2000, 157, 1059–1079. [Google Scholar] [CrossRef]
- Li, J.; Convertino, M. Inferring ecosystem networks as information flows. Sci. Rep. 2021, 11, 7094. [Google Scholar] [CrossRef] [PubMed]
- de Moel, H.; Jongman, B.; Kreibich, H.; Merz, B.; Penning-Rowsell, E.; Ward, P.J. Flood risk assessments at different spatial scales. Mitig. Adapt. Strat. Glob. Chang. 2015, 20, 865–890. [Google Scholar] [CrossRef] [PubMed]
- CRED; Centre for Research on the Epidemiology of Disasters. Disasters in Numbers 2022. Available online: https://www.cred.be/publications (accessed on 19 April 2024).
- Miteco. AdapteCCa.es- Visor de Escenarios de Cambio Climático. Ministerio para la Transición Ecológica y el Reto Demográfico—Miteco. Available online: https://escenarios.adaptecca.es/ (accessed on 23 June 2024).
- Aemet. Valores climatológicos normales. Agencia Estatal de Meteorología—Aemet. Available online: https://qrcd.org/5gqV (accessed on 23 June 2024).
- Dávid, L. Quarrying: An anthropogenic geomorphological approach. Acta Montan. Slovaca 2008, 13, 66–74. [Google Scholar]
- Szabó, J.; Dávid, L.; Lóczy, D. Anthropogenic Geomorphology: A Guide to Man-Made Landforms; Springer Science & Business Media: Dordrecht, The Netherlands, 2010. [Google Scholar] [CrossRef]


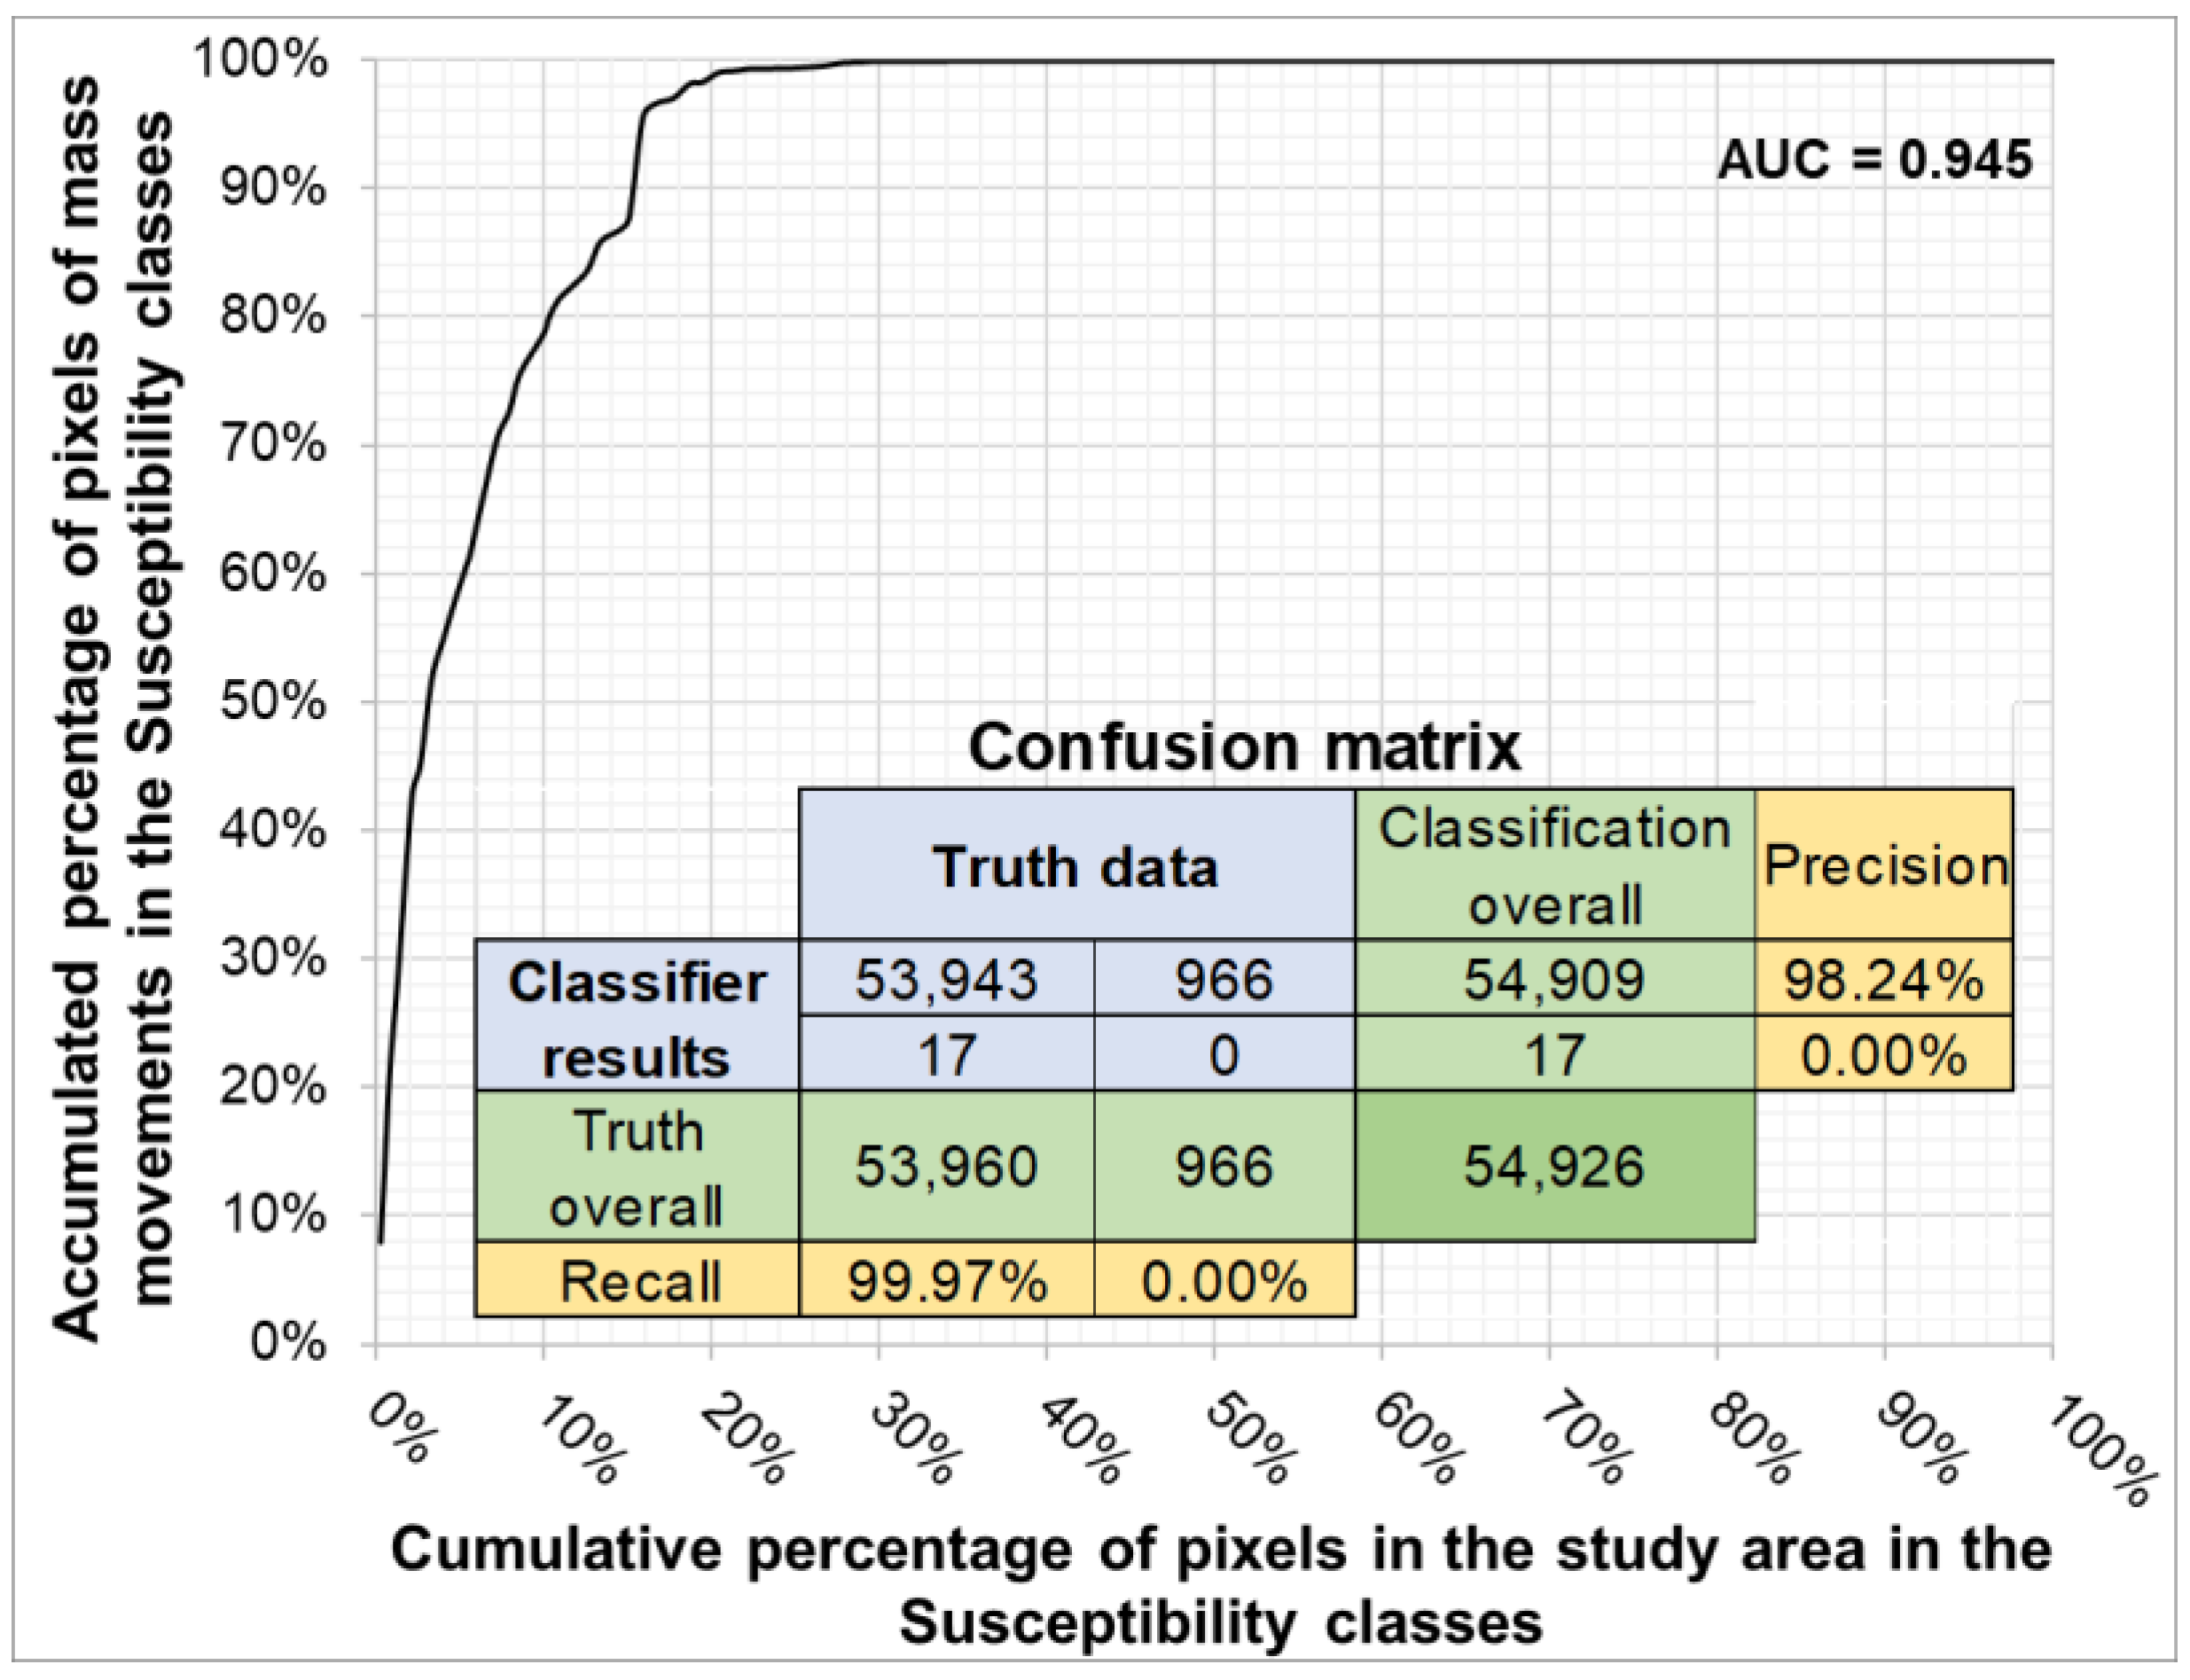
| Category | Area [m2] | % | Movements Area [m2] | % |
|---|---|---|---|---|
| Very low | 20,548,890 | 21.6 | 0 | 0 |
| Low | 28,314,904 | 29.8 | 0 | 0 |
| Medium | 13,891,375 | 14.6 | 17 | 0.03 |
| High | 14,413,417 | 15.2 | 966 | 1.76 |
| Very high | 17,917,573 | 18.8 | 53,943 | 98.21 |
| Total | 95,086,159 | 100 | 54,926 | 100 |
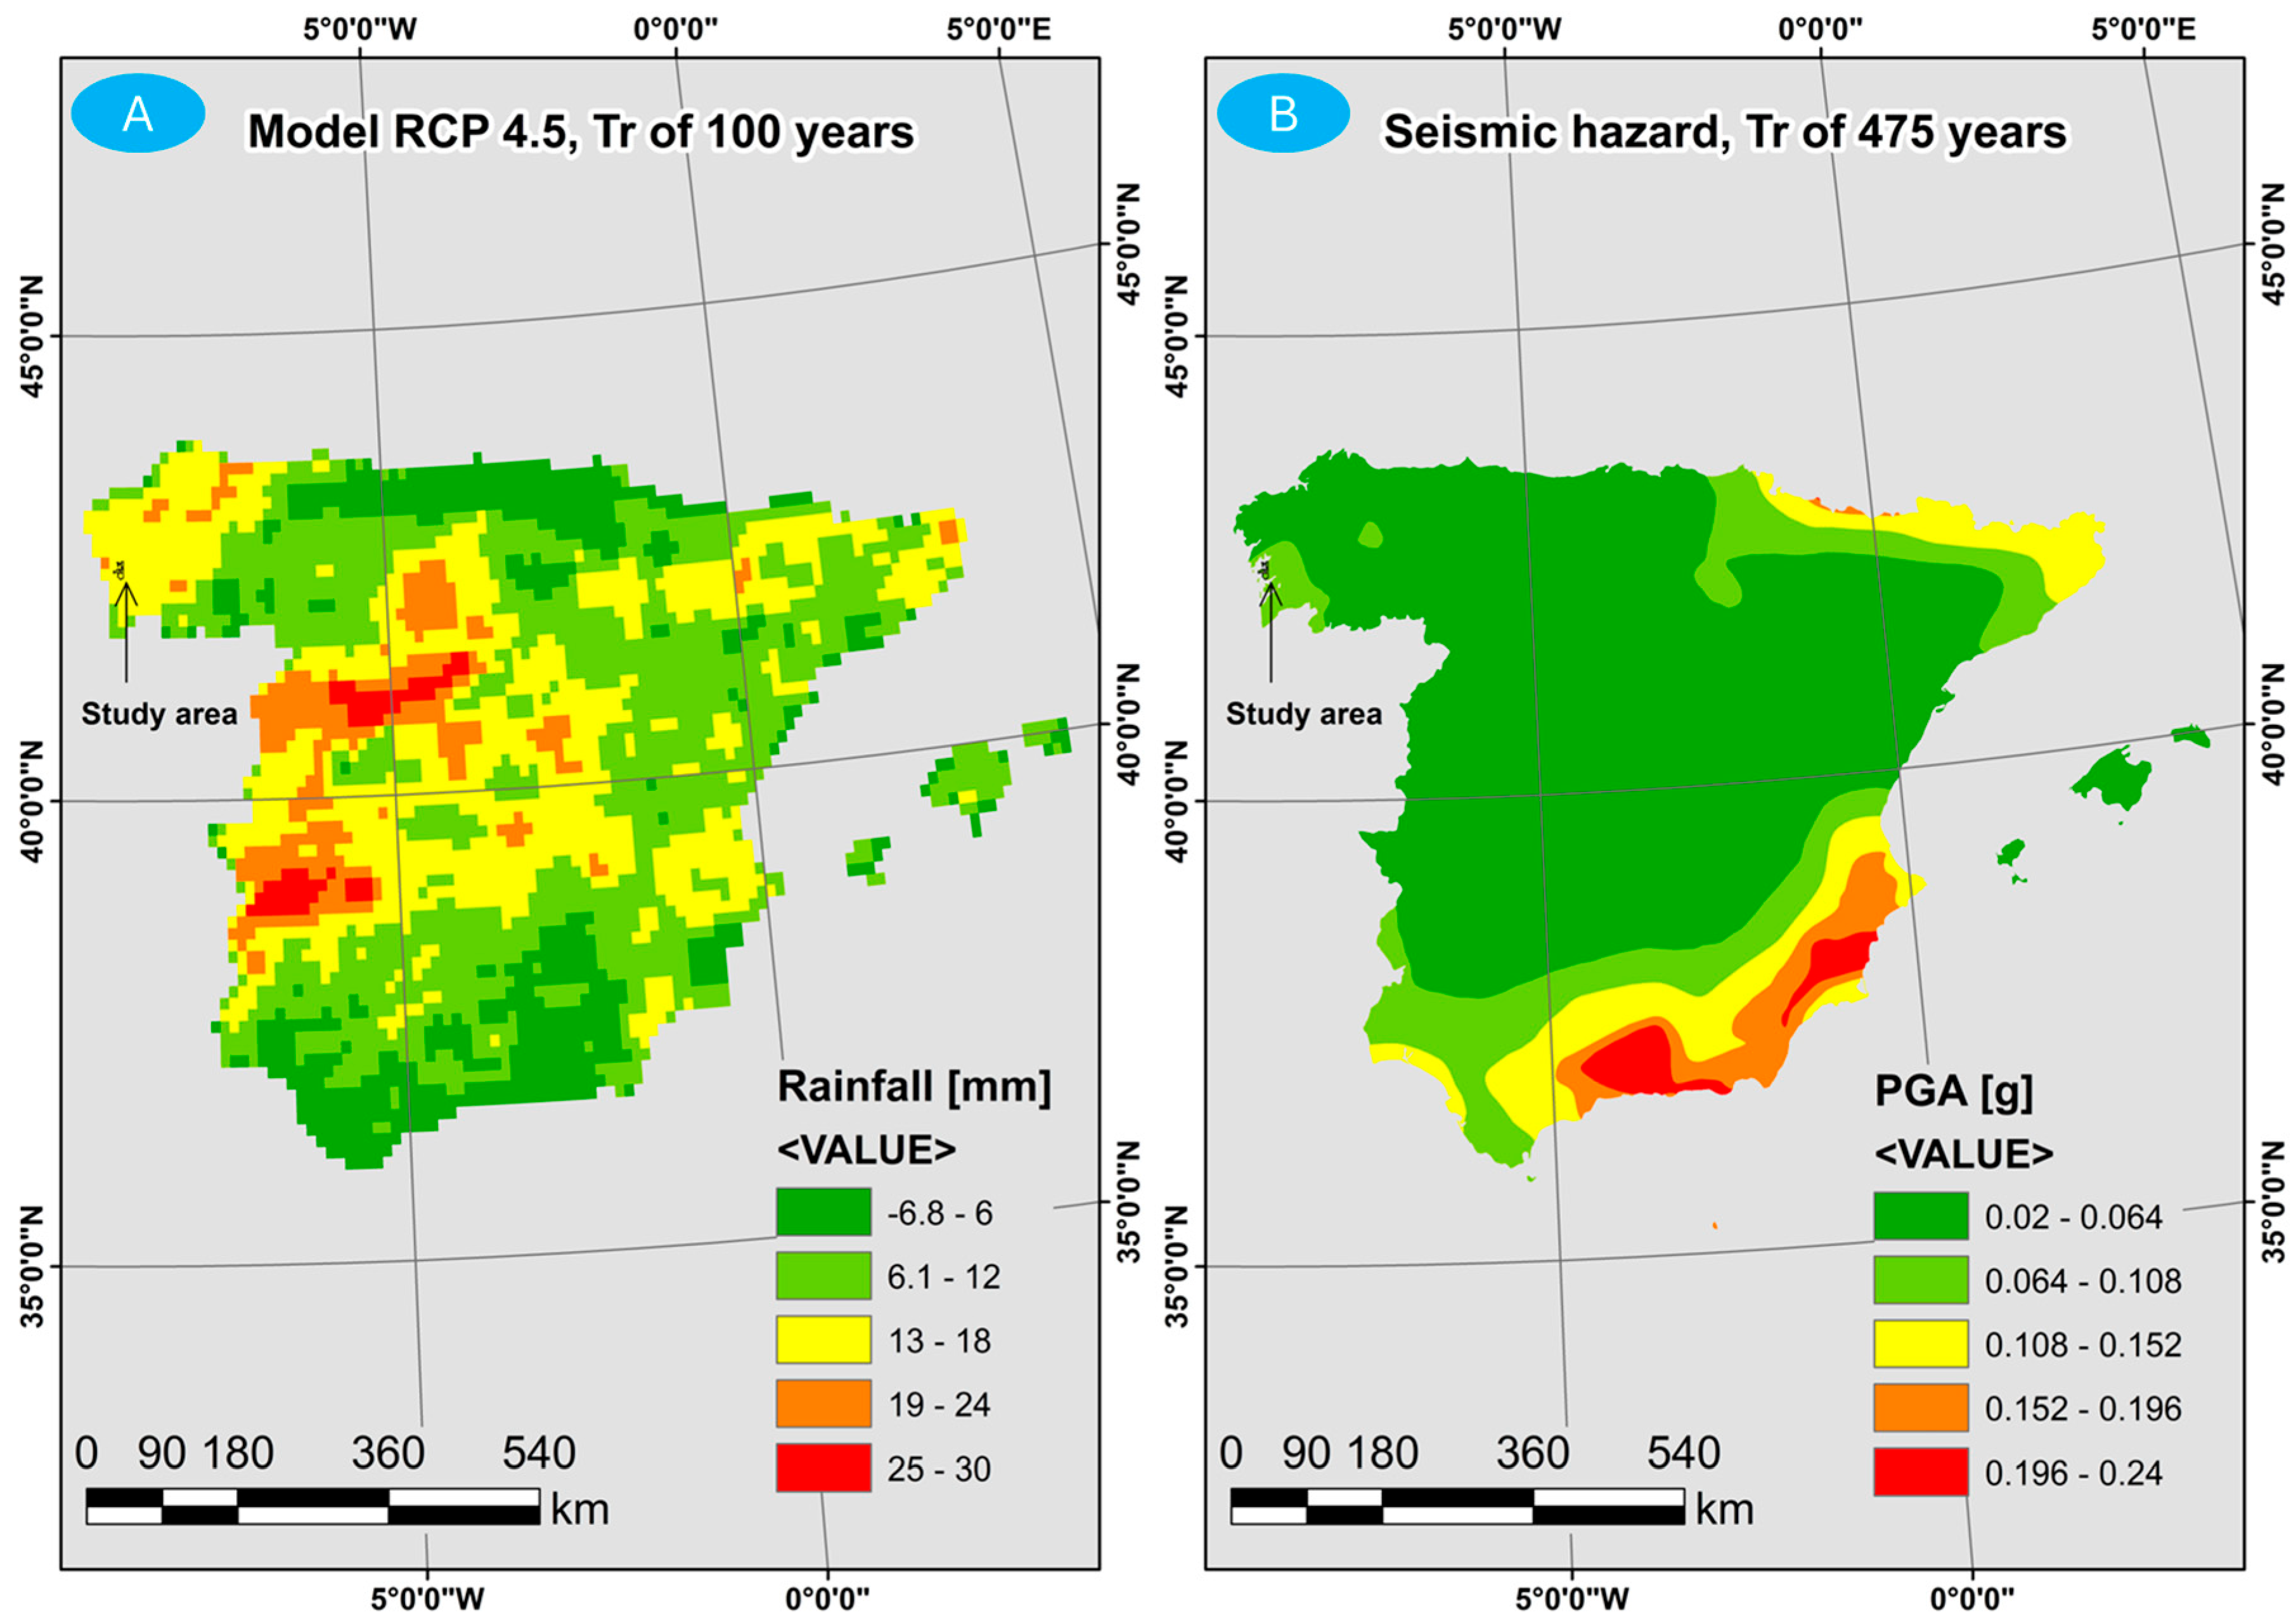
| Rainfall Classification | Acceleration Classification | Susceptibility | |||
|---|---|---|---|---|---|
| Range [mm] | Classification | Range [PGA] | Classification | Category | Classification |
| −6.8–6 | 1 | 0.02–0.064 | 1 | Very low | 1 |
| 6.1–12 | 2 | 0.064–0.108 | 2 | Low | 2 |
| 13–18 | 3 | 0.108–0.152 | 3 | Medium | 3 |
| 19–24 | 4 | 0.152–0.196 | 4 | High | 4 |
| 25–30 | 5 | 0.196–0.24 | 5 | Very high | 5 |
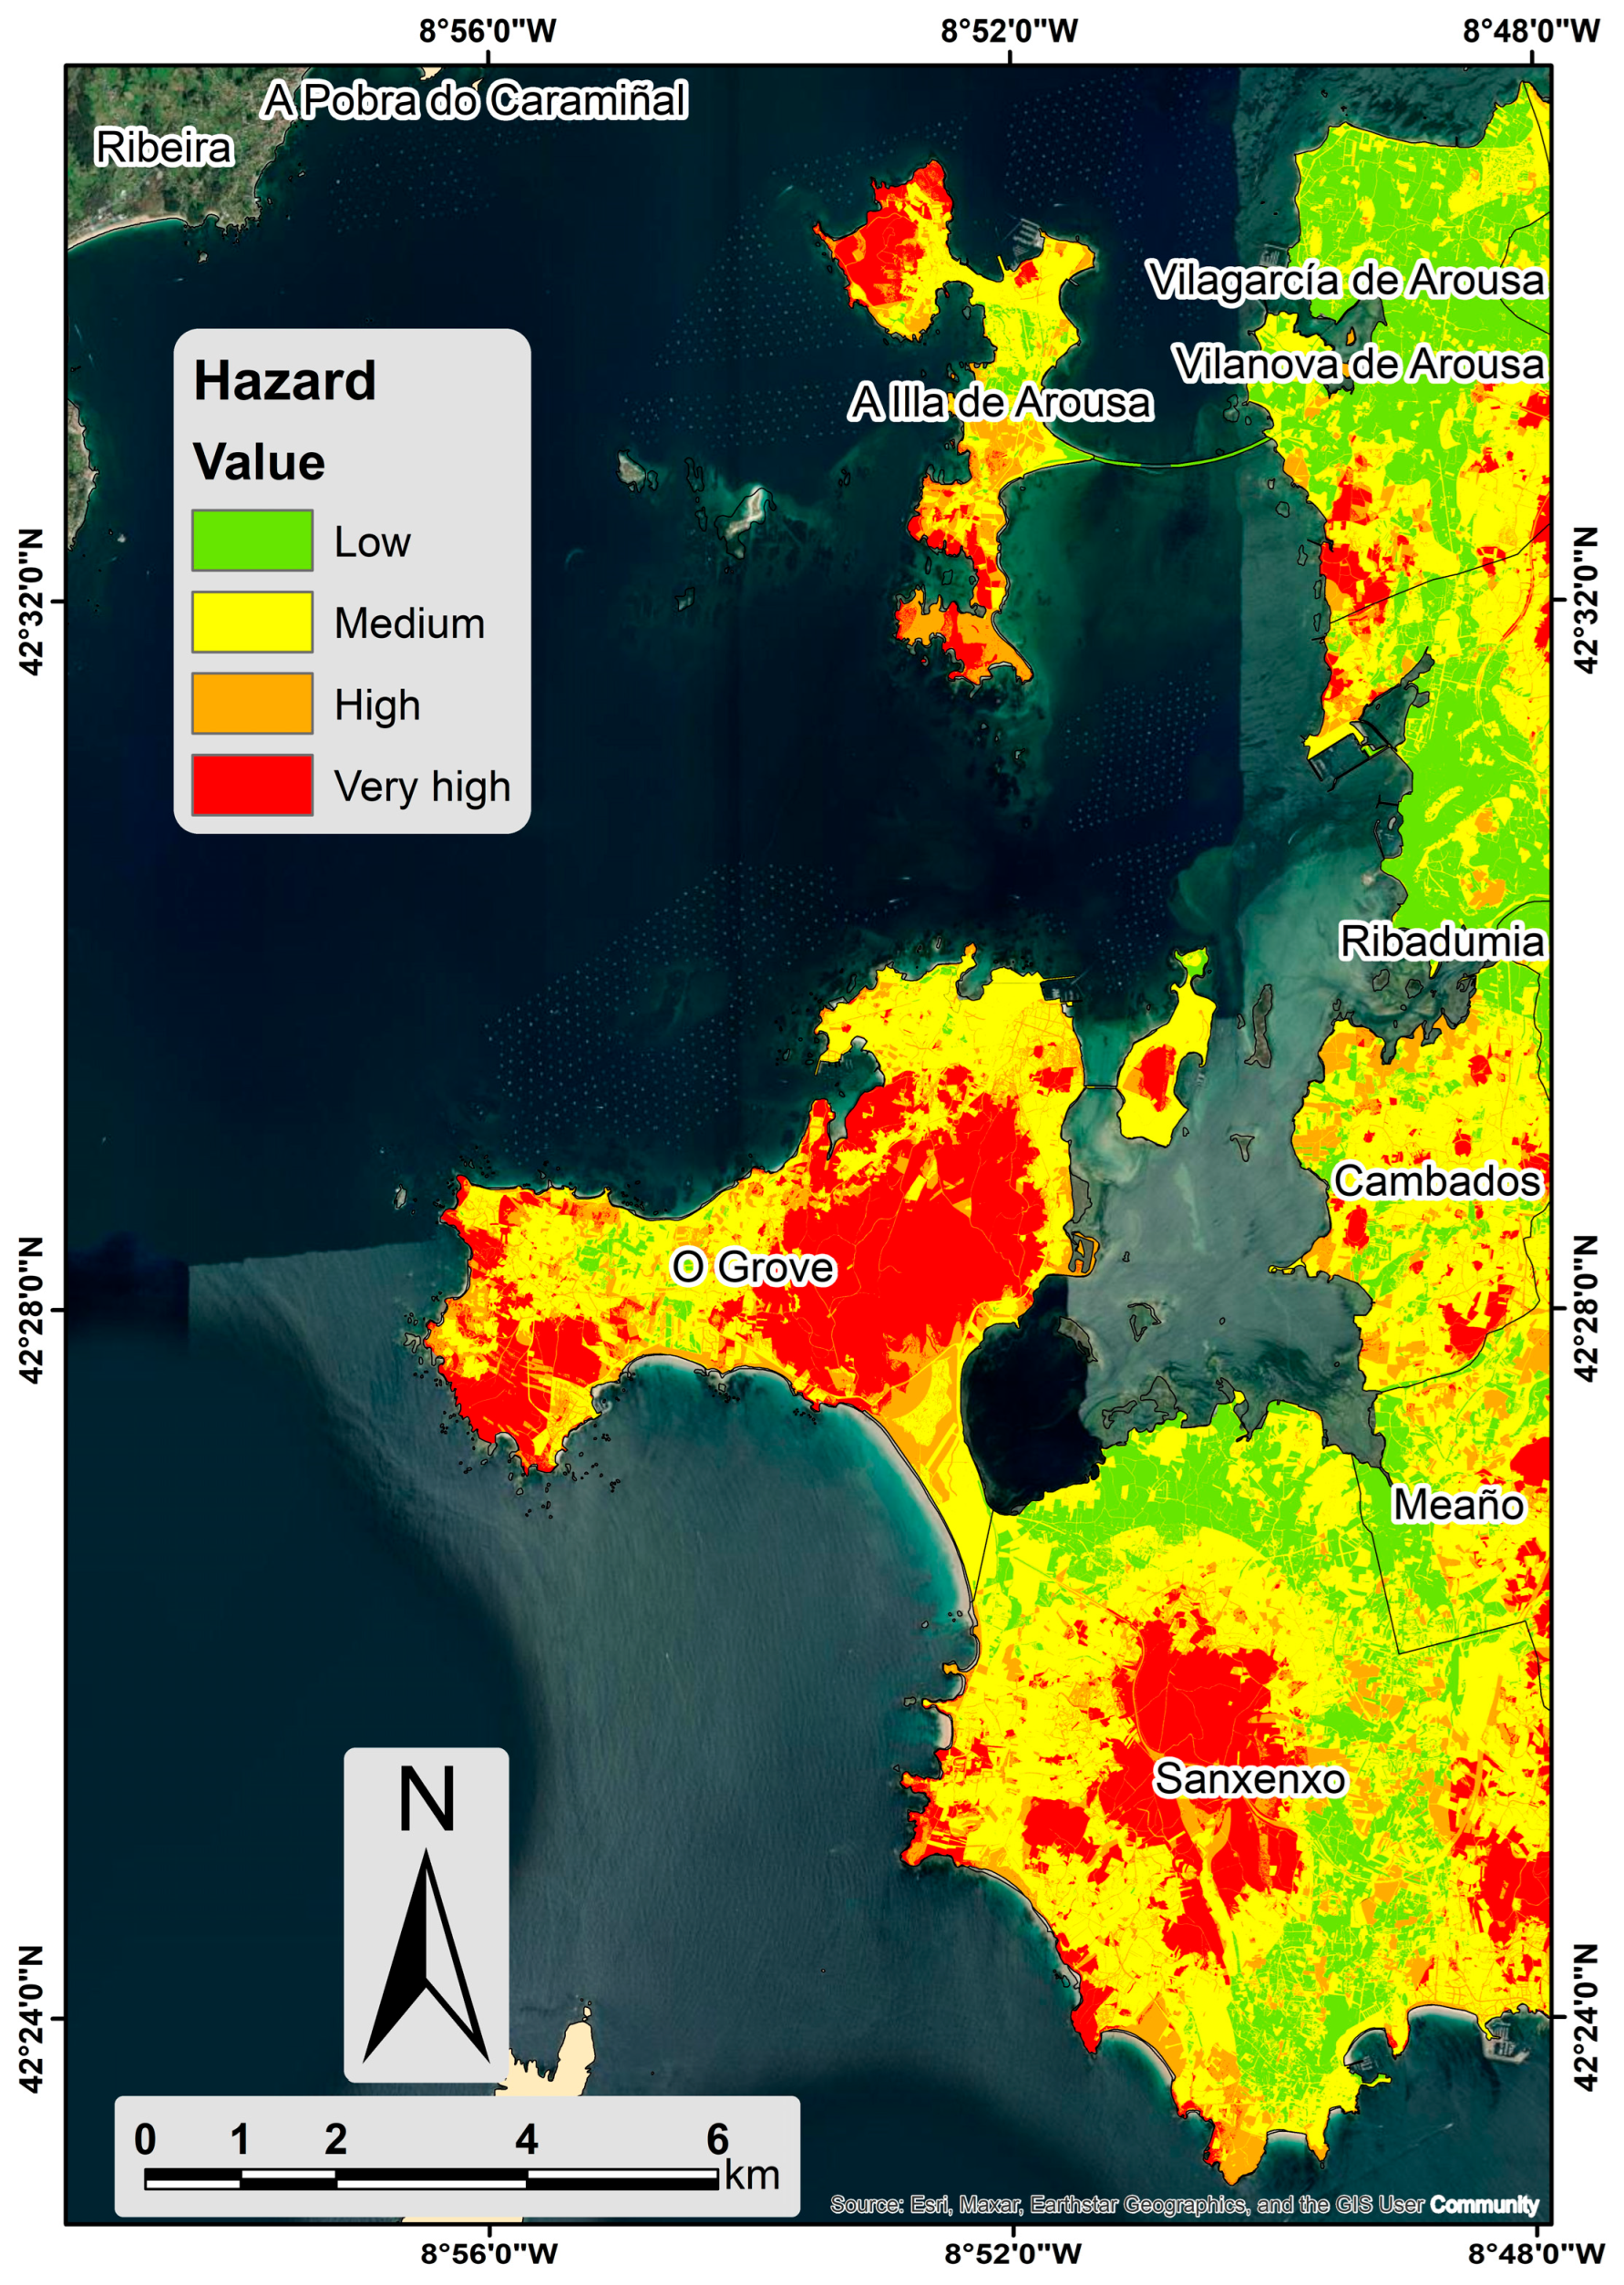
| Municipality | Area [m2] | Low | % | Medium | % | High | % | Very High | % |
|---|---|---|---|---|---|---|---|---|---|
| A Illa de Arousa | 5,085,203 | 299,543 | 5.89 | 1,993,794 | 39.21 | 1,572,726 | 30.93 | 1,219,140 | 23.97 |
| Cambados | 15,375,617 | 4,559,530 | 29.65 | 7,815,244 | 50.83 | 2,028,210 | 13.19 | 972,633 | 6.33 |
| Meaño | 6,057,936 | 1,589,025 | 26.23 | 3,139,284 | 51.82 | 823,276 | 13.59 | 506,351 | 8.36 |
| O Grove | 19,624,754 | 338,708 | 1.73 | 7,351,494 | 37.46 | 3,868,742 | 19.71 | 8,065,810 | 41.10 |
| Ribadumia | 644,234 | 430,561 | 66.83 | 186,679 | 28.98 | 26,994 | 4.19 | 0 | 0.00 |
| Sanxenxo | 34,537,584 | 6,470,560 | 18.73 | 16,543,198 | 47.90 | 5,224,003 | 15.13 | 6,299,823 | 18.24 |
| Vilagarcía de Arousa | 751,403 | 479,682 | 63.84 | 239,128 | 31.82 | 32,593 | 4.34 | 0 | 0.00 |
| Vilanova de Arousa | 11,930,437 | 6,283,569 | 52.67 | 4,228,143 | 35.44 | 724,739 | 6.07 | 693,986 | 5.82 |
Disclaimer/Publisher’s Note: The statements, opinions and data contained in all publications are solely those of the individual author(s) and contributor(s) and not of MDPI and/or the editor(s). MDPI and/or the editor(s) disclaim responsibility for any injury to people or property resulting from any ideas, methods, instructions or products referred to in the content. |
© 2024 by the authors. Licensee MDPI, Basel, Switzerland. This article is an open access article distributed under the terms and conditions of the Creative Commons Attribution (CC BY) license (https://creativecommons.org/licenses/by/4.0/).
Share and Cite
Valencia Ortiz, J.A.; Nieto, C.E.; Martínez-Graña, A.M. Evaluation of Mass Movement Hazard in the Shoreline of the Intertidal Complex of El Grove (Pontevedra, Galicia). Remote Sens. 2024, 16, 2478. https://doi.org/10.3390/rs16132478
Valencia Ortiz JA, Nieto CE, Martínez-Graña AM. Evaluation of Mass Movement Hazard in the Shoreline of the Intertidal Complex of El Grove (Pontevedra, Galicia). Remote Sensing. 2024; 16(13):2478. https://doi.org/10.3390/rs16132478
Chicago/Turabian StyleValencia Ortiz, Joaquín Andrés, Carlos Enrique Nieto, and Antonio Miguel Martínez-Graña. 2024. "Evaluation of Mass Movement Hazard in the Shoreline of the Intertidal Complex of El Grove (Pontevedra, Galicia)" Remote Sensing 16, no. 13: 2478. https://doi.org/10.3390/rs16132478
APA StyleValencia Ortiz, J. A., Nieto, C. E., & Martínez-Graña, A. M. (2024). Evaluation of Mass Movement Hazard in the Shoreline of the Intertidal Complex of El Grove (Pontevedra, Galicia). Remote Sensing, 16(13), 2478. https://doi.org/10.3390/rs16132478