Article

Different Vegetation Covers Leading to the Uncertainty and Consistency of ET Estimation: A Case Study Assessment with Extended Triple Collocation

1
School of Civil and Hydraulic Engineering, Huazhong University of Science and Technology, Wuhan 430074, China
2
Bureau of Hydrology, Changjiang Water Resources Commission, Wuhan 430010, China
3
China Institute of Water Resources and Hydropower Research, Beijing 100038, China
4
Department of Physical Geography and Ecosystem Science, Lund University, 22100 Lund, Sweden
*
Author to whom correspondence should be addressed.
Remote Sens. 2024, 16(13), 2484; https://doi.org/10.3390/rs16132484
Submission received: 2 May 2024 / Revised: 30 June 2024 / Accepted: 4 July 2024 / Published: 6 July 2024

Abstract

:
Accurate and reliable estimation of actual evapotranspiration (AET) is essential for various hydrological studies, including drought prediction, water resource management, and the analysis of atmospheric–terrestrial carbon exchanges. Gridded AET products offer potential for application in ungauged areas, but their uncertainties may be significant, making it difficult to identify the best products for specific regions. While in situ data directly estimate gridded ET products, their applicability is limited in ungauged areas that require FLUXNET data. This paper employs an Extended Triple Collocation (ETC) method to estimate the uncertainty of Global Land Evaporation Amsterdam Model (GLEAM), Famine Early Warning Systems Network (FLDAS), and Maximum Entropy Production (MEP) AET product without requiring prior information. Subsequently, a merged ET product is generated by combining ET estimates from three original products. Furthermore, the study quantifies the uncertainty of each individual product across different vegetation covers and then compares three original products and the Merged ET with data from 645 in situ sites. The results indicate that GLEAM covers the largest area, accounting for 39.1% based on the correlation coefficient criterion and 39.9% based on the error variation criterion. Meanwhile, FLDAS and MEP exhibit similar performance characteristics. The merged ET derived from the ETC method demonstrates the ability to mitigate uncertainty in ET estimates in North American (NA) and European (EU) regions, as well as tundra, forest, grassland, and shrubland areas. This merged ET could be effectively utilized to reduce uncertainty in AET estimates from multiple products for ungauged areas.

1. Introduction

Accurate and reliable estimation of actual evapotranspiration (AET) is crucial for hydrological studies, including water resource management [1,2], drought prediction, and the investigation of atmospheric–terrestrial carbon exchanges [3,4,5]. Large-scale AET estimates are inherently uncertain due to the high spatial heterogeneity and temporal variability of evapotranspiration (ET) processes [6,7].
The increasing availability of global gridded actual evapotranspiration (ET) datasets, generated through the integration and analysis of global datasets in combination with remote sensing data and modeling, offers significant potential to improve hydrological predictions in ungauged areas [8,9]. Nevertheless, these gridded ET datasets are subject to substantial uncertainties due to variations in forcing data, model structures, and parameterization schemes [10,11,12]. Therefore, developing methodologies to quantify the uncertainties in various ET products and their combinations is crucial for enhancing predictions in ungauged areas.
Previous studies have examined the performance of actual evapotranspiration (AET) under different vegetation covers at the catchment scale, but have not analyzed their uncertainty. A range of methods have been employed to assess ET products at both regional and global scales [13,14]. These methods can be categorized into two main types: one that estimates the uncertainty in ET products by comparing them to land-based observed ET values and another that indirectly evaluates ET products without using observed ET values directly. Unfortunately, quantifying the uncertainty of ET products remains challenging due to the need for long-term ET observations [15]. To address this challenge, the Triple Collocation (TC) method was introduced [16] to quantify the uncertainty of different products without knowing the true values. Further, the Extended Triple Collocation (ETC) method was developed, which provides the correlation coefficient as an additional performance metric to the TC method [17]. Recently, the TC and ETC methods have been successfully applied to quantify uncertainty in various gridded datasets, including precipitation [18,19,20], soil moisture [21,22], and evapotranspiration [23,24]. Khan et al. [21] assessed the uncertainty of three ET products (GLEAM, GLDAS, and MOD16) using the ETC method within the extent of Asia and analyzed their performances across different vegetation covers. Guo et al. [23] systematically analyzed the uncertainty of eight ET products in China from 2003 to 2014, comparing them to observations from the ChinaFLUX network and quantifying their uncertainty at the grid scale using the ETC method. However, most previous studies have used this method to evaluate ET products without assessing their reliability across different vegetation covers. Consequently, it remains unclear how well AET products perform under various vegetation covers, especially in areas with sparse or no ground observations.
Peel et al. [25] assessed the average actual evapotranspiration (AET), calculated as precipitation minus runoff, under forest and non-forest covers at the global catchment scale, revealing that AET tends to be greater in non-forested catchments compared to forested ones. Xia et al. [26] found that the uncertainty between estimated and observed daily ET varied with vegetation cover. Volk et al. [27] evaluated an ensemble ET product using in situ sites across the contiguous United States, concluding that cropland sites exhibit higher accuracy compared to shrublands and forested sites. While previous studies have focused on the impact of vegetation changes on AET or the performance of AET across different vegetation covers, few have estimated the uncertainty of AET products under different vegetation covers [28]. Accurate estimation of AET in croplands is crucial for evaluating crop water requirements and optimizing water use efficiency [29]. Improving the computation of AET in natural vegetation is essential for assessing vegetation restoration-related water consumption and water management [30]. Although these studies assess the uncertainty of AET products under various vegetation covers and emphasize the importance of reducing this uncertainty, they overlook methods to improve the quality of AET products. Consequently, quantifying and reducing the uncertainty of AET products under different vegetation covers is necessary for accurate global and regional AET estimates, particularly in areas with sparse or no ground observations.
In summary, despite numerous studies attempting to reduce uncertainty in ET estimates through various methods, including ETC, there is an urgent need for research on quantifying the uncertainty of AET products and enhancing their accuracy across different vegetation covers. To address this, we propose the following questions:
  • How is the performance of three products according to the results of the ETC method?
  • Does the ET merging method yield a superior ET product compared to individual products?
  • How does the performance of the ET merging method vary under different vegetation covers?
The answers to these questions are of great significance to the application of remote sensing data to estimate ET in ungauged areas under different vegetation covers. To tackle these questions, we selected three global ET products for testing worldwide. The remainder of the paper is structured as follows: Section 2 describes the materials and methods; Section 3.1 analyzes uncertainties in the three ET products using the ETC method; Section 3.2 presents the merged ET dataset which was obtained; and finally, we evaluate the performance of the merged ET and individual products in different vegetation covers and regions compared to in situ data. This study enriches our understanding of the applicability of the ETC method and informs the selection of ET products for ungauged areas.

2. Materials and Methods
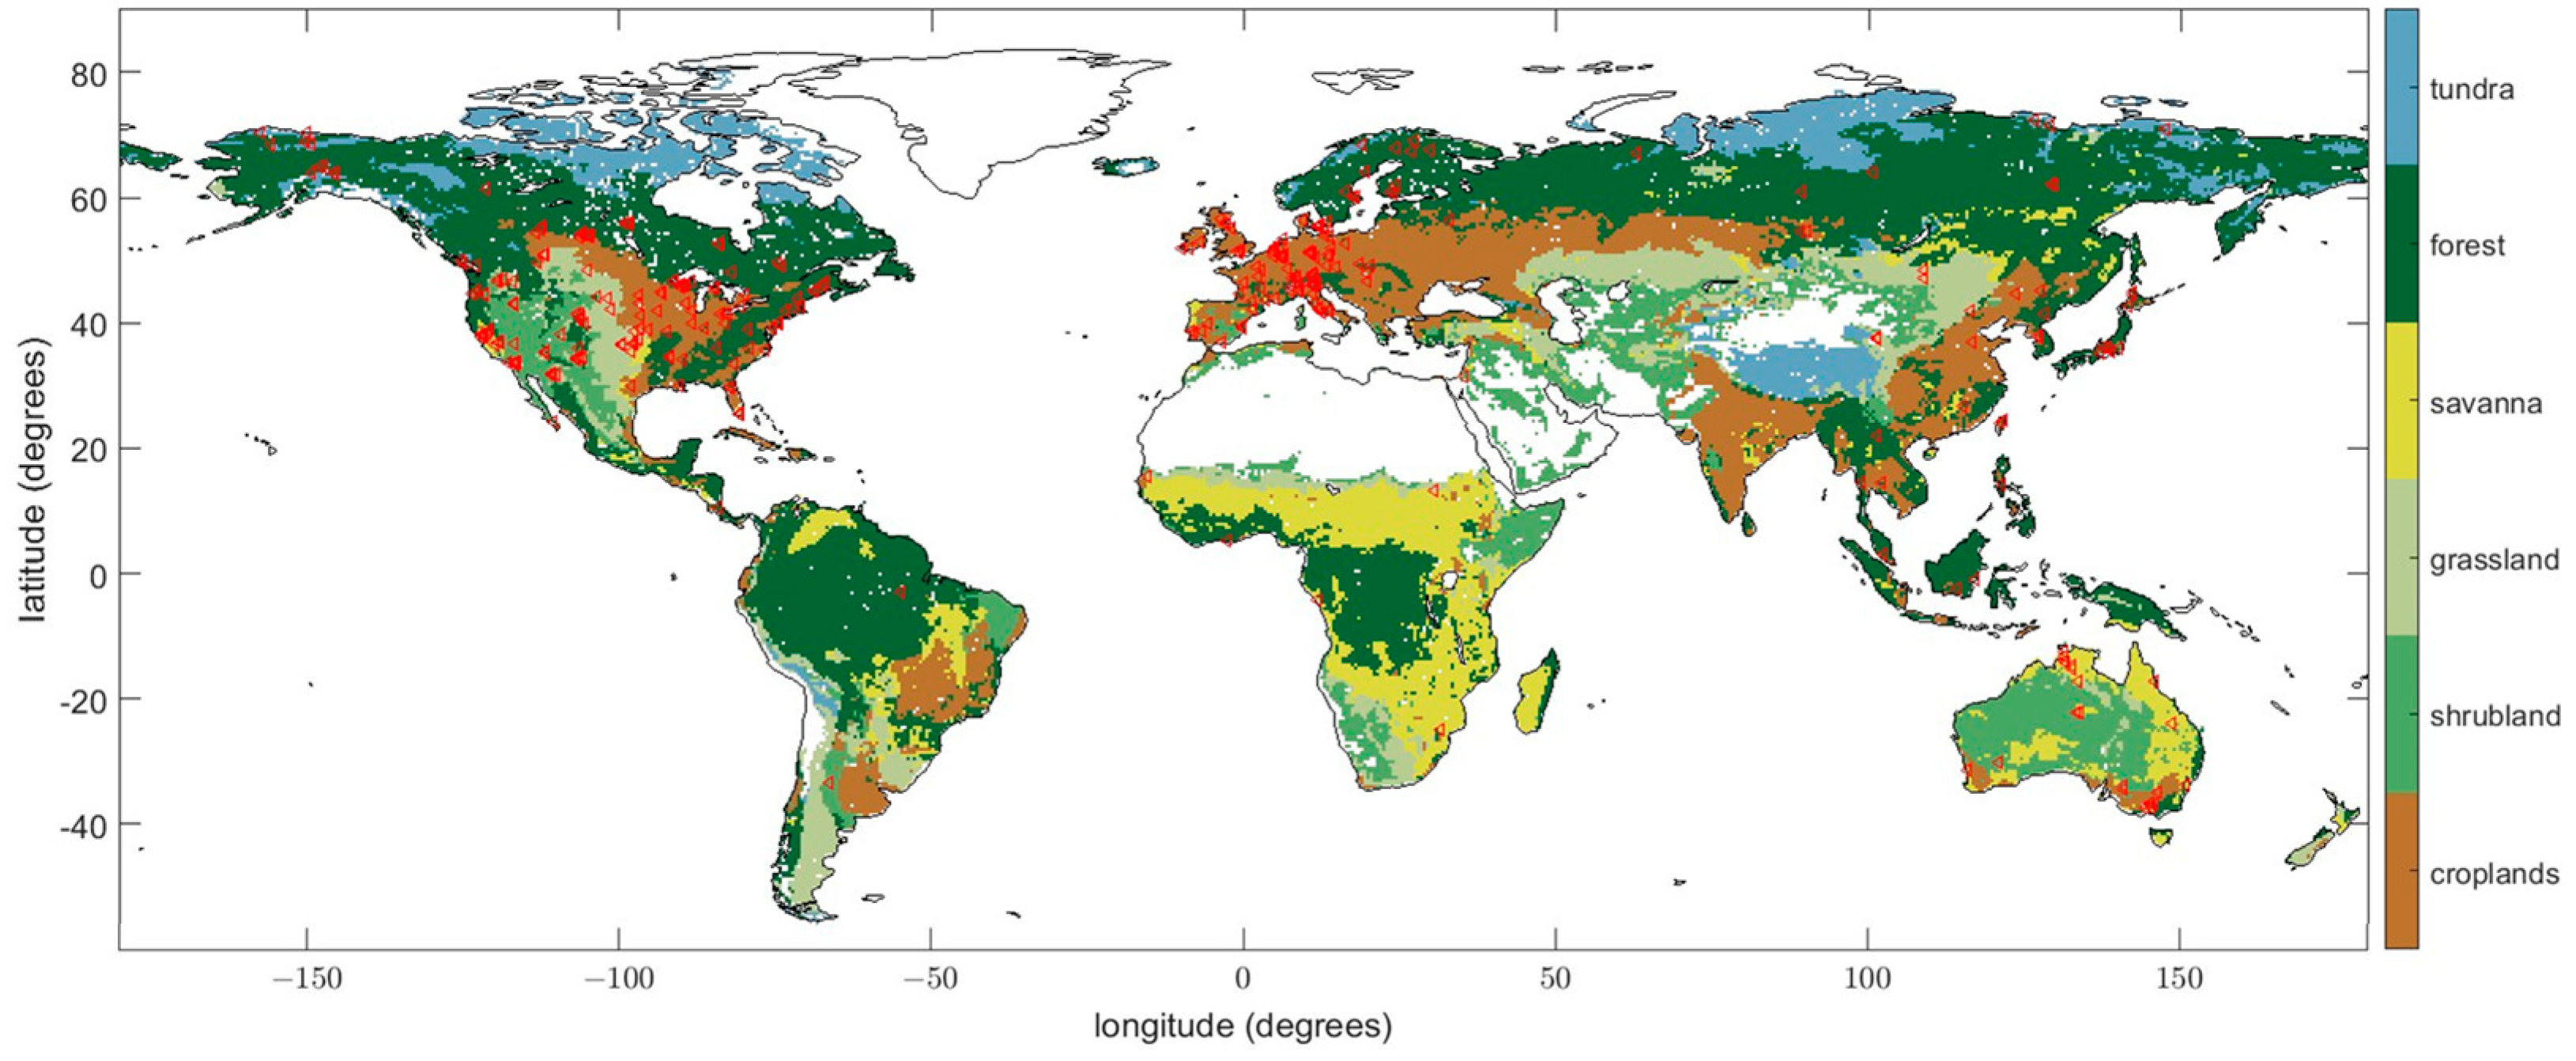
To assess the performance of GLEAM, FLDAS, MEP, and their merged ET products under different vegetation covers in “ungauged” areas, we intentionally treat global areas as “ungauged”. Initially, we employ the ETC method to assess the three ET products without prior assumptions. Subsequently, a merged ET is derived based on the results from ETC. Finally, we compare the three original products and the merged ET with in situ measurements to validate their accuracy. These evaluations highlight the ETC method’s effectiveness in significantly reducing uncertainty in global ET estimates for ungauged areas.

2.1. Data Sources

Three evapotranspiration (ET) products spanning from July 2002 to December 2018 were selected for this study: the GLEAM (Global Land Evaporation Amsterdam Model), FLDAS (Famine Early Warning Systems Network), and MEP (Maximum Entropy Production) products. All products were downscaled using the nearest-neighbor interpolation method in MATLAB to achieve a consistent spatial resolution of 0.5° × 0.5°.
The Global Land Evaporation Amsterdam Model (GLEAM) is a sophisticated land surface model dedicated to the estimation of the different components of terrestrial evaporation from satellite data [31]. Potential evaporation, based on observations of surface net radiation and near-surface air temperature, is calculated using the Priestley and Taylor equation [32], which is then converted into actual evaporation using the evaporative stress factor. S. GLEAM v3.6a provides data on a 0.25° × 0.25° latitude–longitude grid (https://www.gleam.eu/, accessed on 3 December 2022).
The Famine Early Warning Systems Network (FEWS NET) Land Data Assimilation System (FLDAS) is a customized version of the NASA Land Information System (LIS), accessible at http://lis.gsfc.nasa.gov, accessed on 12 January 2024. FLDAS utilizes rainfall and other meteorological inputs to generate multi-model and multi-forcing estimates of hydroclimate conditions, including soil moisture, evapotranspiration, and runoff [33]. AET data are provided in the FLDAS Noah Land Surface Model L4 Global Monthly dataset, with a spatial resolution of 0.1° × 0.1°.
The MEP model, developed by Wang and Bras [32,33], integrates non-equilibrium thermodynamics, Bayesian probability, information theory, and boundary-layer turbulence theory to estimate actual evapotranspiration (AET). This model utilizes net radiation, surface temperature, and specific humidity as input variables and determines surface heat fluxes by minimizing a dissipation function that includes latent, sensible, and ground heat fluxes while maintaining the surface energy balance [34]. Further details on the MEP formulation can be found in Appendix A. The MEP product derived using this model is provided by Yang et al. [34] and is available on a 0.25° × 0.25° latitude–longitude grid (https://doi.org/10.6084/m9.figshare.20401386.v1, accessed on 10 January 2024).
Hajji et al. [34] compared the MEP product with three classic ET models (PM, PT-JPL, and ARTS) at eight FLUXNET sites, finding that the MEP product exhibited the best performance across various land cover types in the continental United States, including grassland, cropland, woody savanna/shrubland, deciduous broadleaved forests, and evergreen needleleaf forests. Yang et al. [35] applied the MEP model globally to compute AET and validated it against EC flux sites, confirming that the MEP product generally outperformed the GLDAS product. These studies suggest that the MEP model can be successfully extended to larger scales, and that its uncertainty may be quantified using new methodologies. To date, the accuracy of the MEP product has primarily been evaluated by comparing it with other products using FLUXNET data as a reference. However, there has been no direct comparison of the MEP product with other AET products due to the lack of a suitable approach. Therefore, we chose the Extended Triple Collocation (ETC) method to globally compare the MEP product with other AET products.
In this study, MEP, GLEAM, and FLDAS products from three different algorithms were selected. GLEAM data, which are widely used, calculated evapotranspiration for four land use types—short vegetation, tall vegetation, bare soil, and open water—using the P-T formula to estimate potential evapotranspiration. FLDAS was employed routinely to generate multi-model and multi-forcing estimates of hydroclimate states and fluxes across semi-arid, food-insecure regions of Africa. It utilized a land surface model (LSM) to compute evapotranspiration, employing quantitative methods to simulate vertical exchanges of water and energy fluxes between the atmosphere and land surface. The MEP model calculated evapotranspiration by dividing it into soil evaporation and vegetation transpiration components. These three products use distinct methods to compute evapotranspiration, enabling their assessment using the Extended Triple Collocation (ETC) method.
To evaluate the quality of ET datasets and their Merged ET, comprehensive flux EC ET data from 645 sites across networks—AmeriFlux, FLUXNET, EuroFlux, AsiaFlux, and ChinaFlux—were utilized (see Figure A1). These datasets were used to calculate ET (mm d−1) through Eq. E T = L E ¯ λ × 3600 × 24 , with more details available in reference [36]. The EC data, recorded every half hour between 1994 and 2019, covered periods ranging from 1 year (12 months) to 21 years (252 months). Initially, the flux data underwent processing and integration into monthly datasets following quality control procedures [37]. Gaps in the in situ EC measurements were filled using a combination and an enhancement from Reicestein [38]. Out of these, we selected 301 towers that had data spanning more than two months from July 2002 to December 2018.
The ISLSCP II Potential Natural Vegetation (PNV) Cover product is part of the International Satellite Land-Surface Climatology Project, Initiative II (ISLSCP II) data collection. It categorizes vegetation cover into 15 distinct categories, in addition to water. For this study, the file potential_veg_hd.asc, with a spatial resolution of 0.5°, was utilized. The PNV dataset depicts global vegetation cover in its natural state, unaffected by human activities. In addition to the PNV data, cropland information from the MODIS Vegetation Cover dataset was incorporated. The MODIS Vegetation Cover dataset provides a geographic representation of 17 vegetation cover classes according to the classification scheme proposed by the International Geosphere-Biosphere Programme (IGBP). Globally, these vegetation covers can be grouped into six types: forest, shrubland, savanna, grassland, croplands, and tundra, as illustrated in Figure A1.

2.2. Extended Triple Collocation (ETC) Method

Hydrological simulation usually requires calibration against the “true” value of the target variable, which can be challenging in areas with sparse monitoring points. ETC is a statistical method which addresses this by estimating the correlation coefficient and the random-error variance of three independent datasets. The ETC method is based on the TC method, but includes an additional performance metric to the TC method, the Pearson correlation coefficient [16,17]. The equations of ETC, used to estimate the variance of the noise error (errVar) and correlation coefficients (rho) for three AET products (MEP, GLEAM, and FLDAS), can be summarized as:
A E T i = a i + b i T + ε i
where the A E T i i 1 , 2 , 3 are three actual evapotranspiration products. Equation (1) represents that A E T i is linearly related to the unknown true value (T) with additive random error ε i . a i and b i are the ordinary least squares (OLS) intercepts and slopes, respectively; σ T is C o v T , T , that is, the variance of T; Cov is the covariance between two datasets; and E is the mean of the dataset.
Cov ( AET i , A E T j ) = E ( A E T i A E T j ) E ( A E T i ) E ( A E T j ) = a i b j σ T 2 + b i Cov ( T , ε j ) + b j Cov ( T , ε i ) + Cov ( ε i , ε j )
where it is assumed that the errors from the independent sources have zero mean (E ε i = 0 ) and are uncorrelated with each other, i.e., C o v ε i , ε j = 0 , i j , and with T, i.e., C o v ε i , T = 0 . The i and j index refer to the GLEAM, FLDAS, or MEP products. Cov ( A E T i , A E T j ) is represented by C o v i j .
θ i = b i σ T
where θ i is a new variable introduced to minimize the number of unknowns required for solving equations.
Under the assumption that the mean error equals zero, the error variance is the square of the absolute error. The following formulas are derived [17]:
σ ε 1 2 = C o v 11 C o v 12 C o v 13 C o v 23
σ ε 2 2 = C o v 22 C o v 12 C o v 23 C o v 13
σ ε 3 2 = C o v 33 C o v 13 C o v 23 C o v 12
ρ T , A E T 1 2 = C o v 12 C o v 13 C o v 11 C o v 23
ρ T , A E T 2 2 = C o v 12 C o v 23 C o v 22 C o v 13
ρ T , A E T 3 2 = C o v 13 C o v 23 C o v 33 C o v 12
where σ ε i 2 is the error variance (mm2/day2) of dataset i, and ρ T , A E T i 2 is the Pearson correlation coefficient of AETi products with respect to the unknown true value T. For further details, please refer to reference [17].

2.3. Evapotranspiration Merging

To suppress the evapotranspiration anomaly errors, we aimed to obtain a merged ET product using weighted averaging evapotranspiration anomalies. Based on the ETC estimates, an optimal merging technique can be formulated employing least-square methods as follows [19]:
MET = AE T 1 w 1 + A E T 2 w 2 + A E T 3 w 3
where MET is the merged evapotranspiration product, and w 1 , w 2 and w 3 are the weights of the three products in evapotranspiration merging. The least-square solutions of the merging weights are calculated as:
w 1 = σ ε 2 σ ε 3 σ ε 1 σ ε 2 + σ ε 1 σ ε 3 + σ ε 2 σ ε 3
w 2 = σ ε 1 σ ε 3 σ ε 1 σ ε 2 + σ ε 1 σ ε 3 + σ ε 2 σ ε 3
w 3 = σ ε 1 σ ε 2 σ ε 1 σ ε 2 + σ ε 1 σ ε 3 + σ ε 2 σ ε 3

2.4. Statistical Analysis

In order to estimate the relationship between the AET products and the flux tower measurements, the coefficient of determination (R2), mean absolute error (MAE), root mean square error (RMSE), and similarity indicator (SI) were used to indicate the consistency and errors. The calculations of these indexes were as follows:
R 2 = ( S S X Y ) 2 S S X S S Y
M A E = | X Y | N
R M S E = [ ( X Y ) 2 N ] 1 2
S I = 1 ( X Y ) 2 ( | X Y ¯ | + | Y Y ¯ | ) 2
The Kling Gupta Efficiency (KGE) combines correlation, variability bias, and mean bias into a single metric. KGE is defined as [39,40]:
KGE = 1 ( r 1 ) 2 + ( σ X σ Y 1 ) 2 + ( μ X μ Y 1 ) 2
where S i and x i are the standard deviation and mean of three ET products at the ith cell. N represents the length of the time series X. SSxy is the square of the covariance between X and Y, SSx is the variance of X, and SSy is the variance of in situ data (Y). X and Y are the AET product (MEP, GLEAM, FLDAS) and reference separately. r is the linear correlation between the AET product and in situ data, σ X and σ Y are the standard deviations of the AET product and in situ data, and μ X and μ Y are the mean values of the AET product and in situ data.

2.5. Flowchart

The primary process for reducing uncertainty in actual evapotranspiration (AET) estimates from three global evapotranspiration (ET) products, particularly for application in ungauged vegetation areas, is illustrated in Figure 1. Each step is detailed below. First, in Step 1, the three AET products were harmonized to the same temporal and spatial resolution. Next, in Step 2, their uncertainties were computed using the ETC method. Subsequently, based on the ETC method results, the merged ET was derived from the three original products. Finally, the uncertainties of the three original products and their merged ET were analyzed across various vegetation covers.

3. Results

3.1. Uncertainties in AET Datasets based on ETC Approach

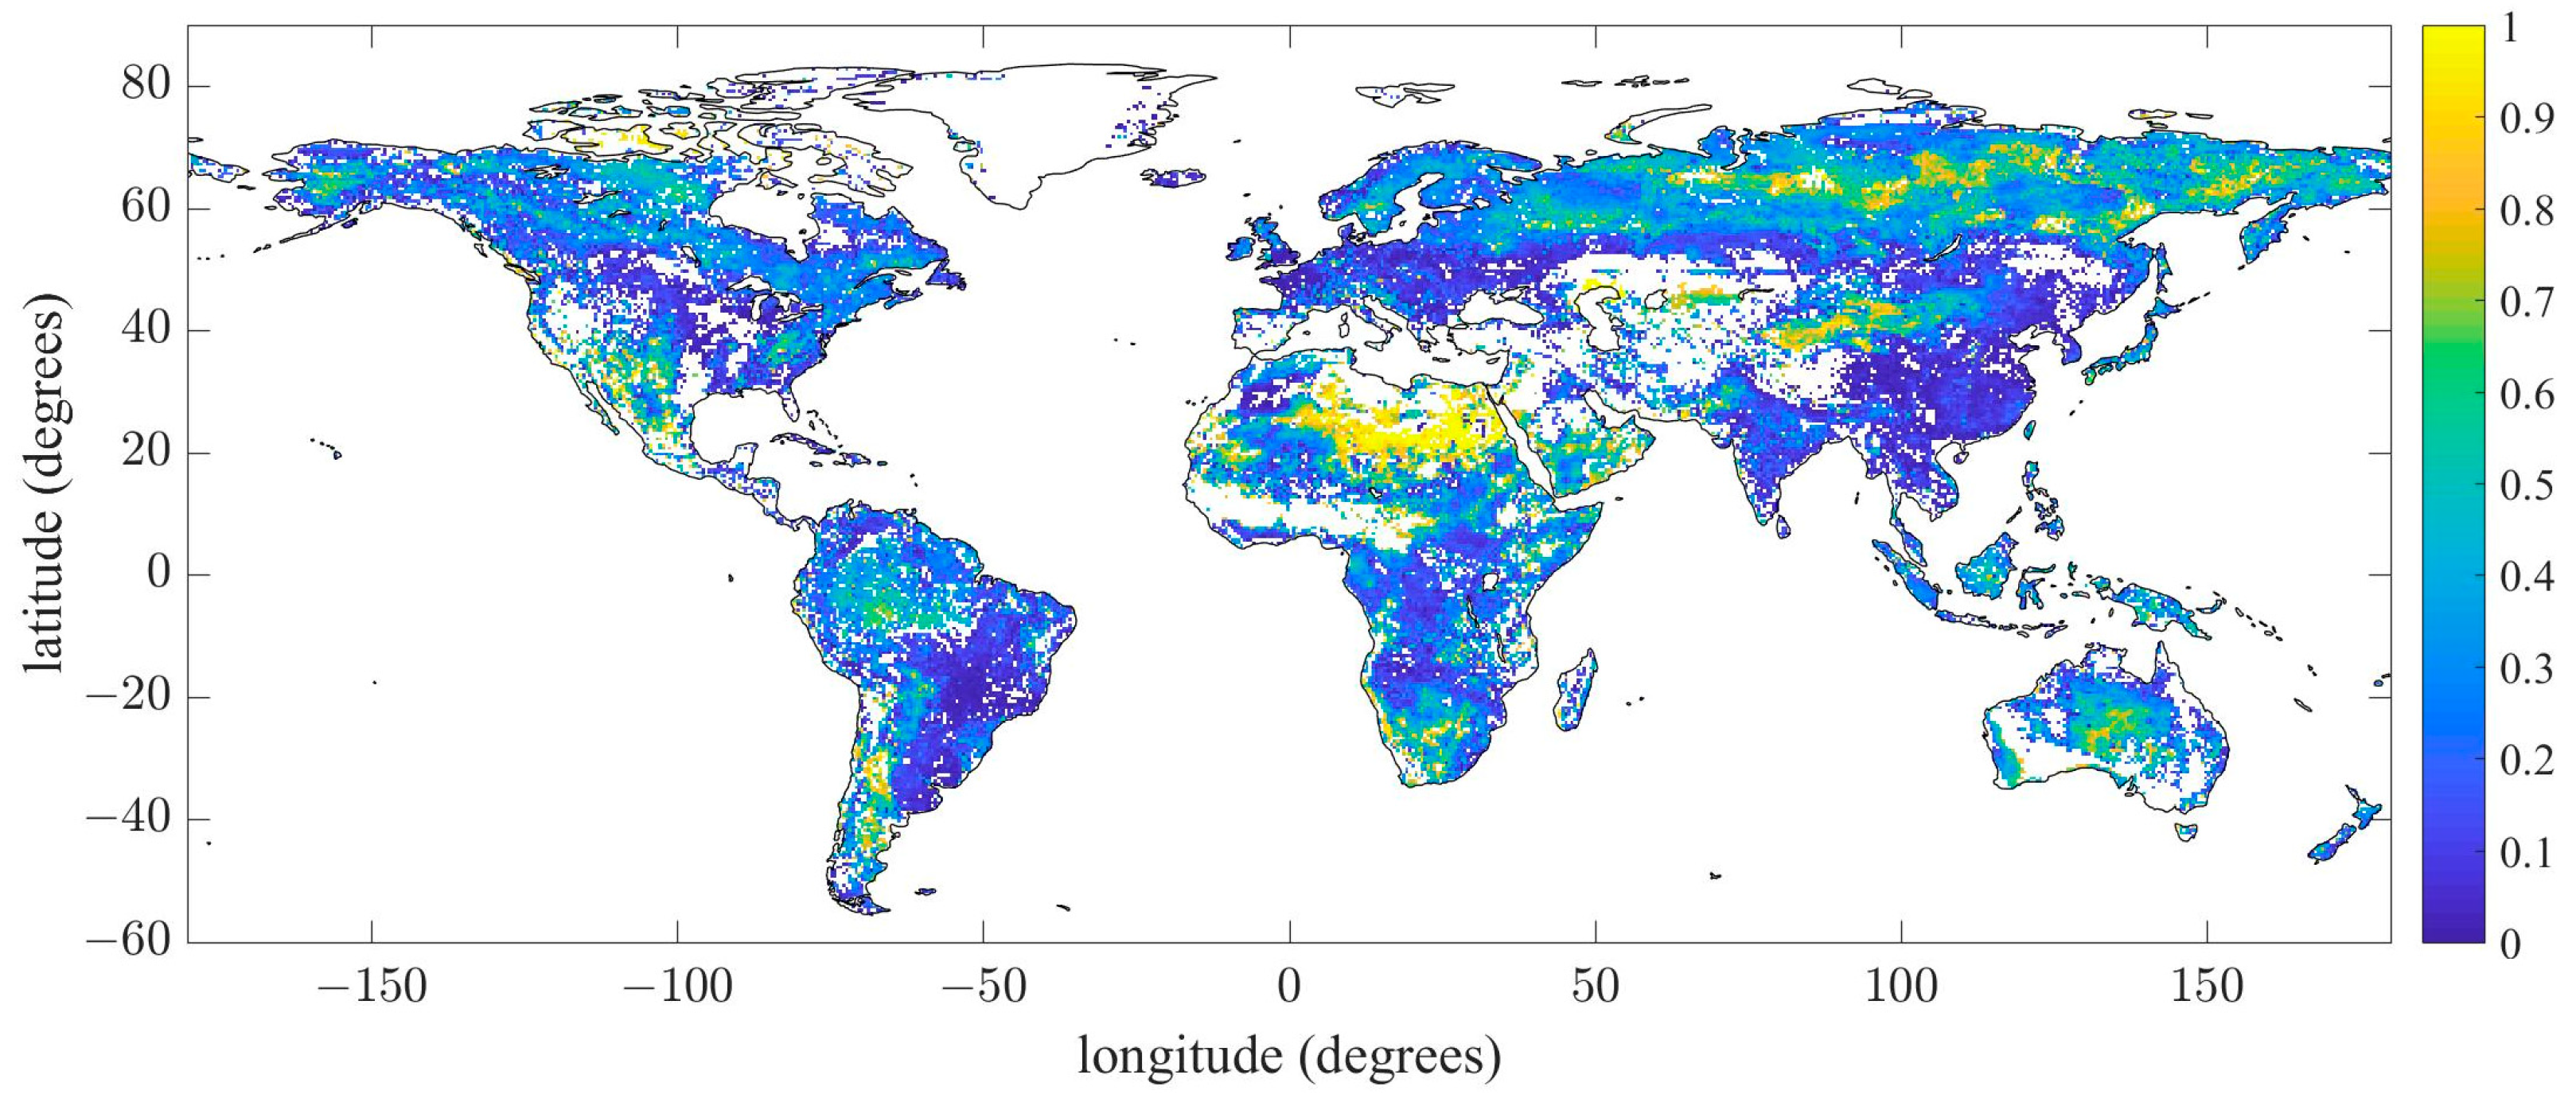
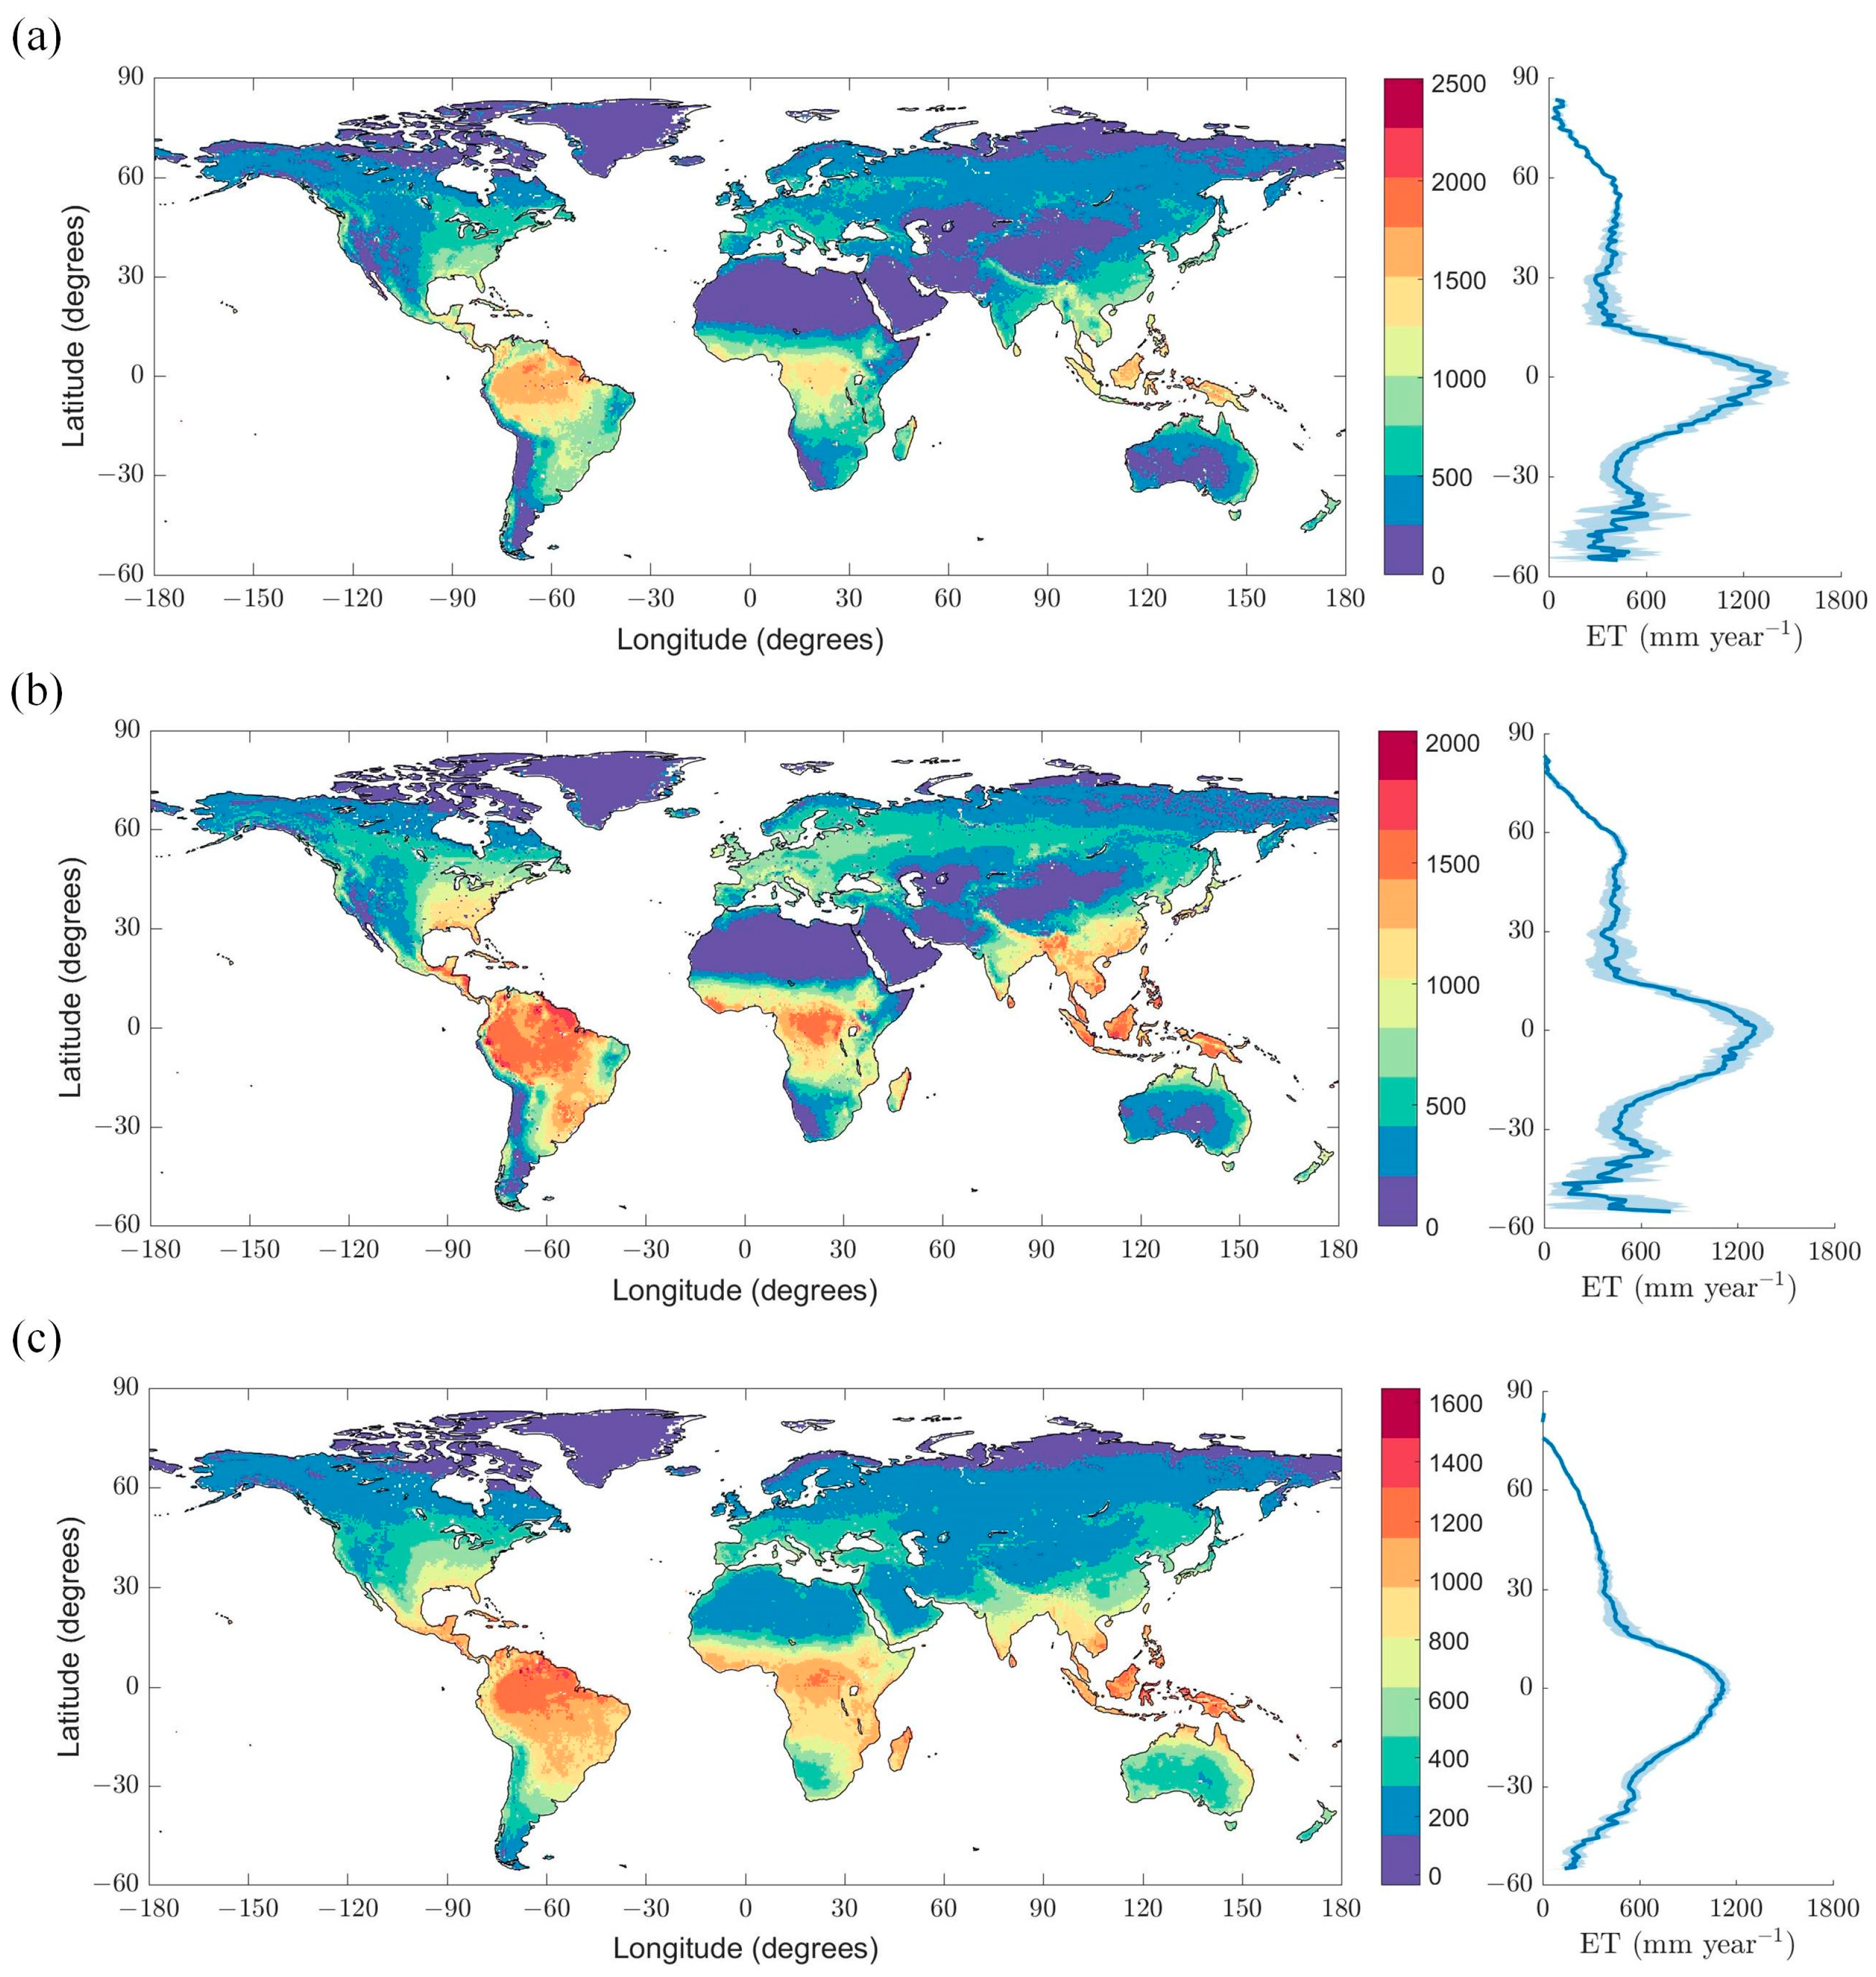
3.1.1. Spatial Consistency of AET Products Globally

Figure 2a–c depict the spatial distribution of the mean annual actual evapotranspiration (AET) for the three products spanning from 2003 to 2018. Globally, the annual AET exhibited comparable spatial patterns across all three products. The recorded maximum values of annual AET were 2516.9 mm/year for GLEAM, 2043.6 mm/year for FLDAS, and 1647.5 mm/year for MEP. Notably, GLEAM and FLDAS consistently outperformed FLDAS. Furthermore, the mean annual AET was observed to be highest in South America (excluding the southwest) and Africa (excluding the northern and southern regions).
Regarding latitudinal distribution, all three products demonstrated similar trends along the latitudes, with the highest values observed around the equatorial region. However, in the Southern Hemisphere, MEP displayed a smoother trend compared to the fluctuating patterns observed with GLEAM and FLDAS.

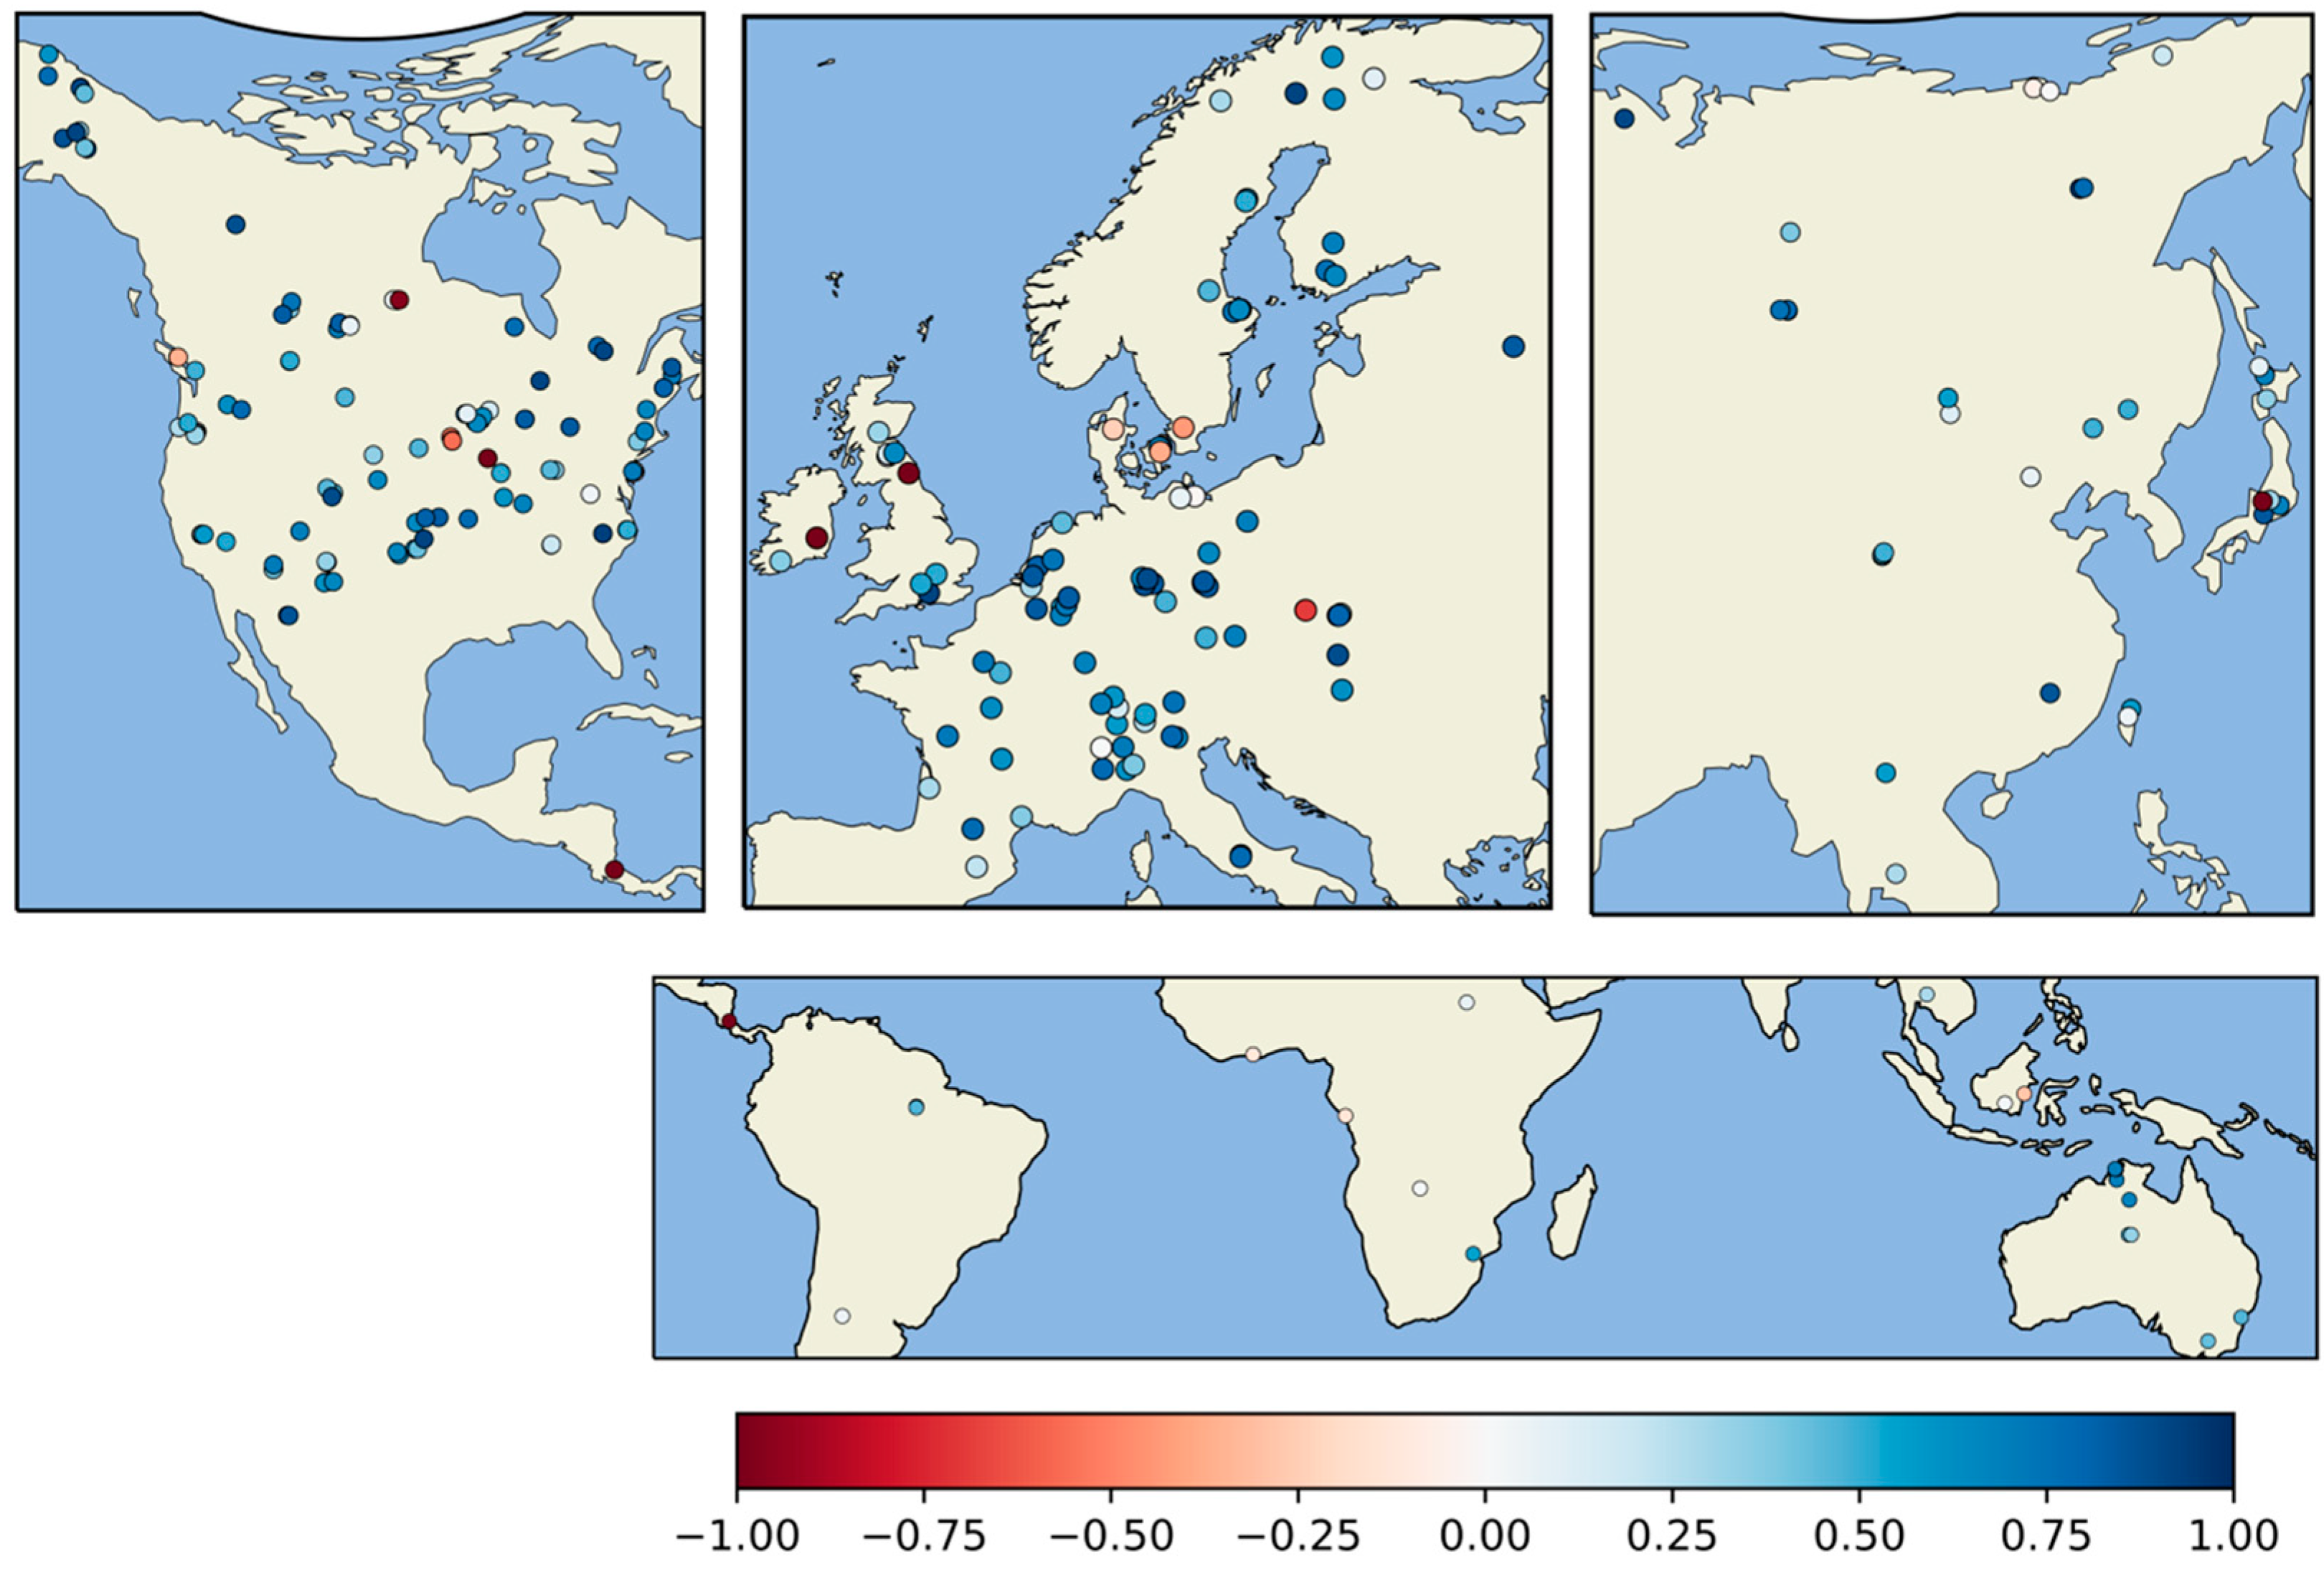
3.1.2. Correlation Coefficient Distribution of AET Products

Figure 3 illustrates the estimated correlation coefficients of the three products. Generally, these products demonstrated performances consistent with the actual data in the middle and high latitudes of the Northern Hemisphere. GLEAM exhibited a strong performance in regions such as Oceania, southern South America, and northern Asia, while FLDAS showed the highest correlation coefficient for evapotranspiration (ET) in Europe and central Asia.
MEP demonstrated a notable performance in northern and central North America, regions near the South Atlantic Ocean in South America, the Eurasian continent around latitude 50°N, Algeria, northwestern Saudi Arabia, Iran, parts of western Australia, and the Arctic Circle. However, it is important to highlight that within the region between the Tropic of Cancer and the Tropic of Capricorn, MEP’s correlation coefficient significantly deviated from that of the other products, indicating poorer performance. Additionally, MEP exhibited a lower correlation coefficient in Australia.
Of particular note is MEP’s comparatively lower correlation coefficient with the actual data in Africa compared to GLEAM and FLDAS. Within Africa, MEP’s performance was notably poorer in North Africa, possibly attributable to the effects of soil water stress.

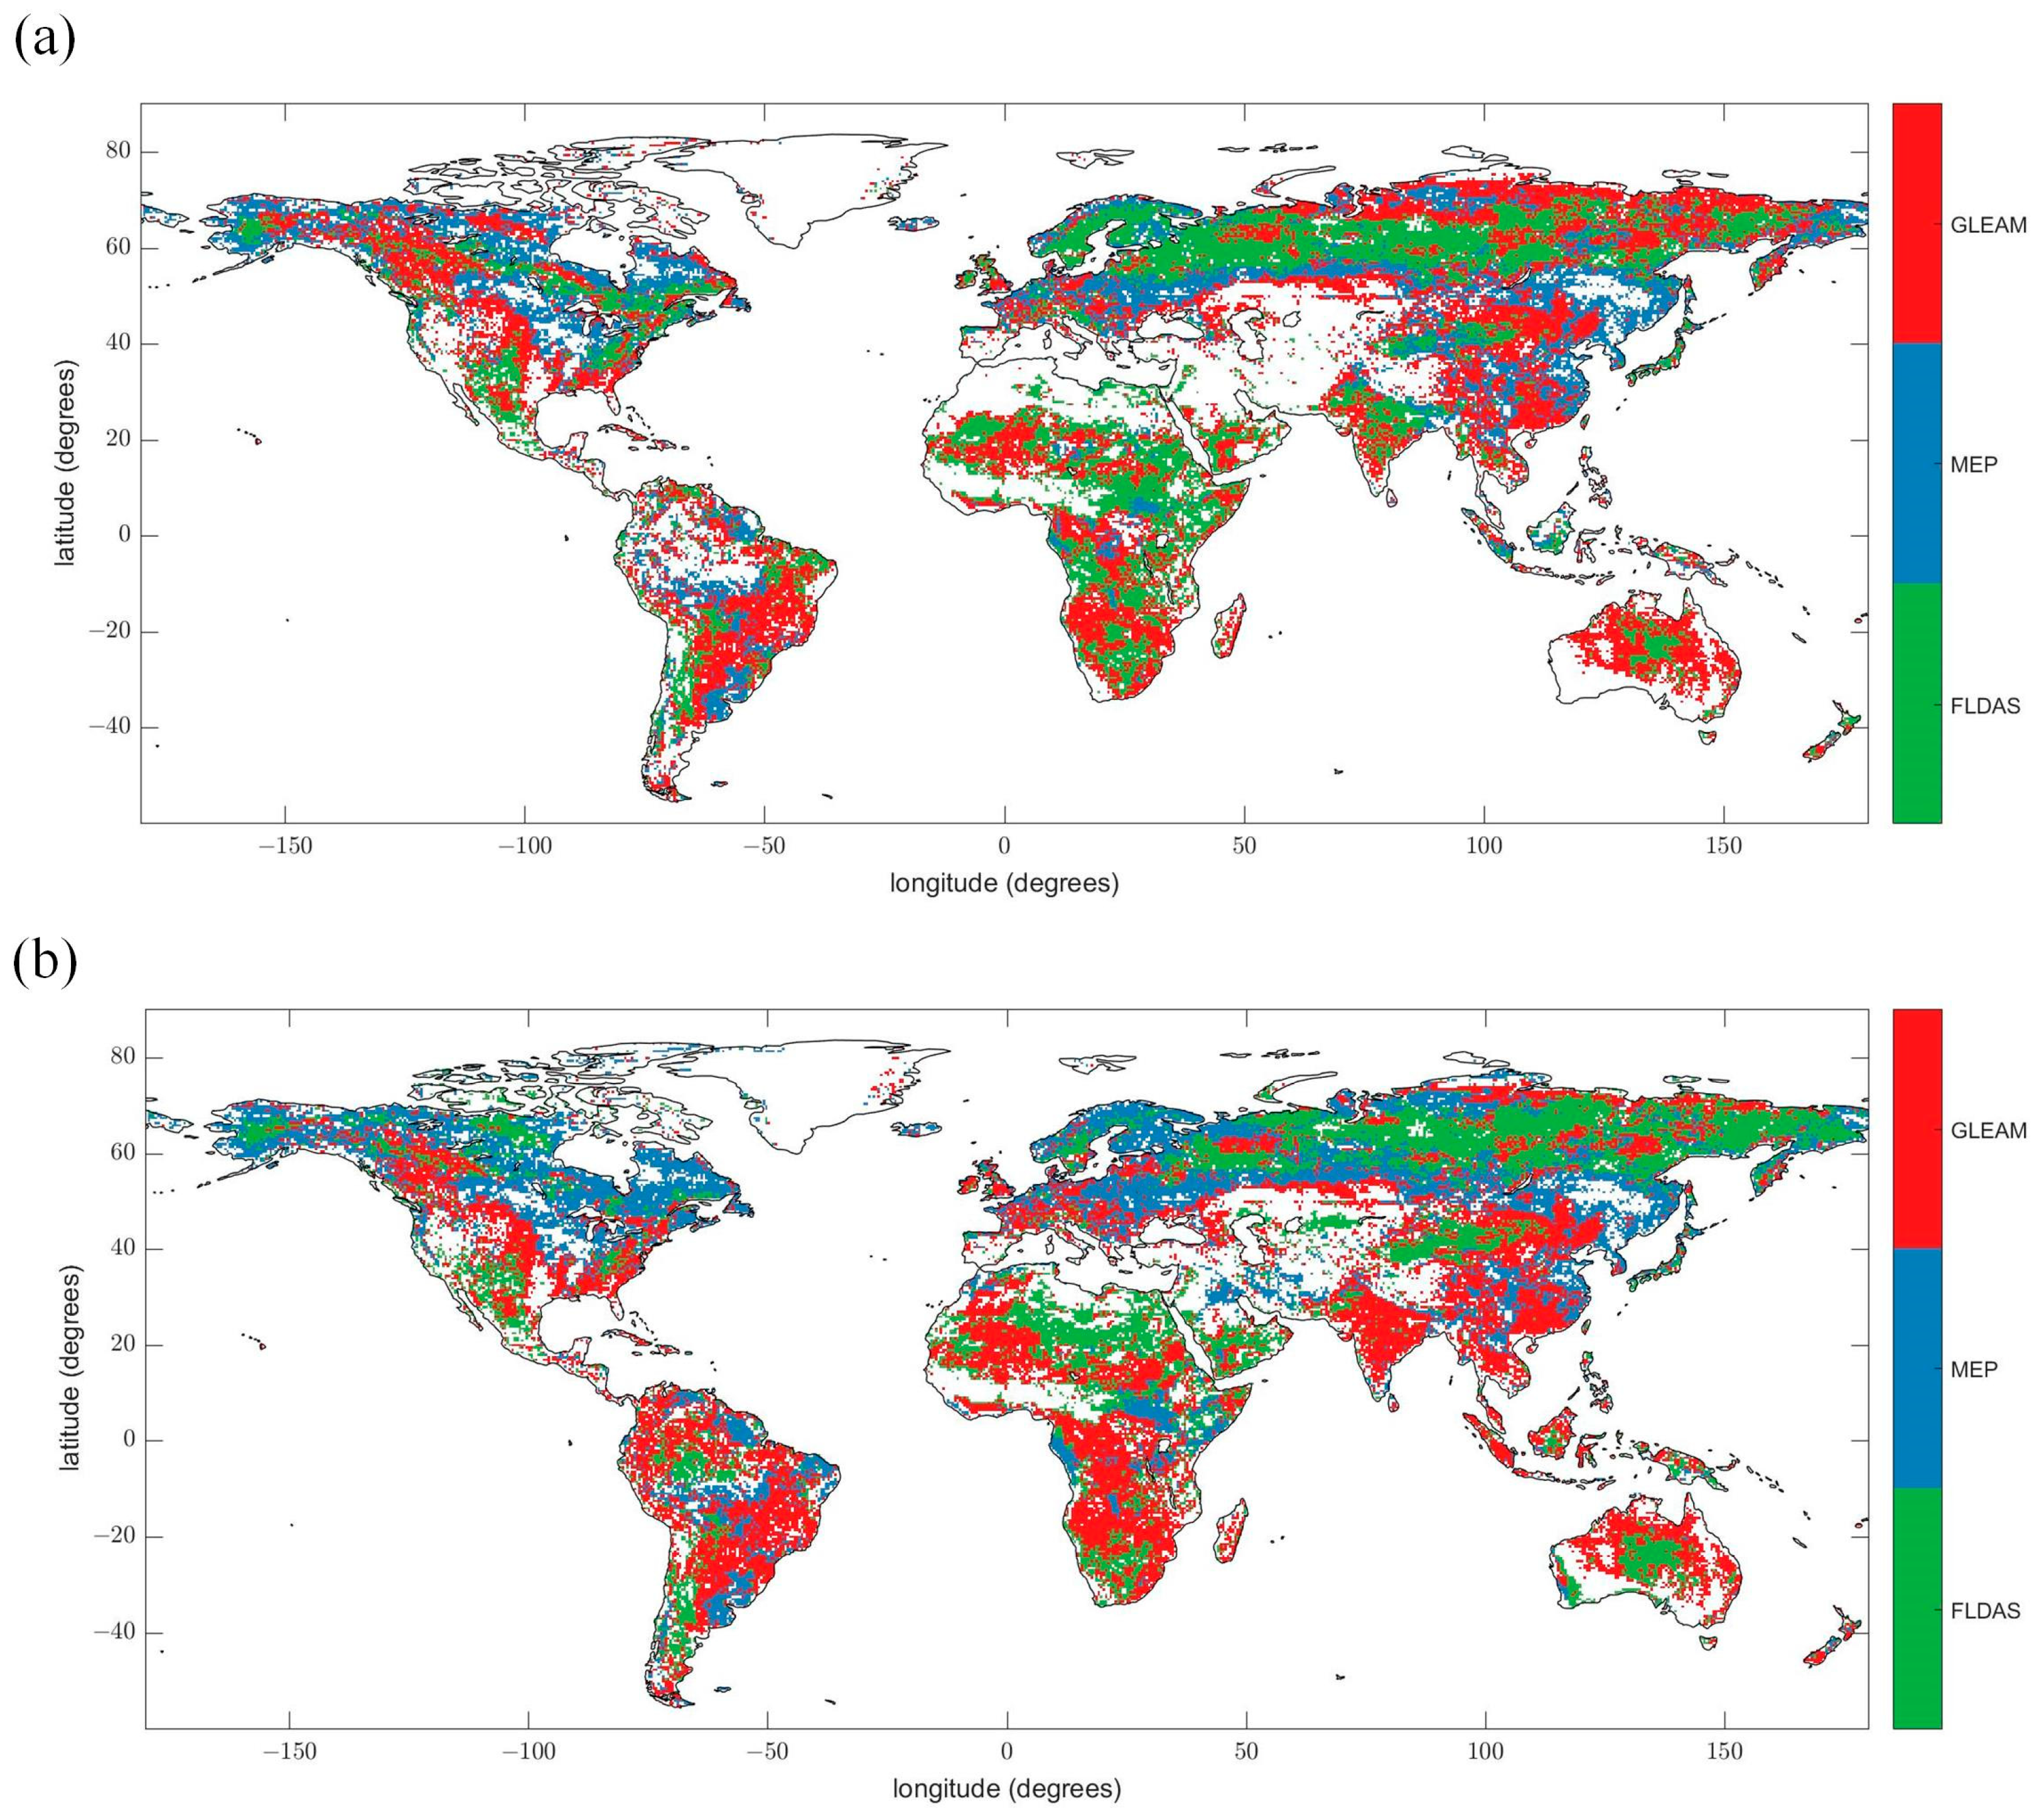
3.1.3. Best Performing ET Products on Each Grid

Figure 4 illustrates the spatial distribution of the products based on the largest correlation coefficient (a) and the lowest variation in error (b). Globally, the GLEAM product covered the largest area with the highest correlation coefficient, accounting for 39.1%, followed by FLDAS (33.4%) and MEP (27.5%). Concerning error variation, GLEAM demonstrated superior performance over 39.9% of global grids, while FLDAS and MEP each covered 30%, indicating a similar level of performance between FLDAS and MEP. Specifically, GLEAM performed exceptionally well in regions including South America, Africa, southern Asia, and northern Oceania. FLDAS exhibited the lowest uncertainty regarding evapotranspiration (ET) over Europe, northern Asia, and central Oceania. Meanwhile, MEP achieved high accuracy in northern regions of America.

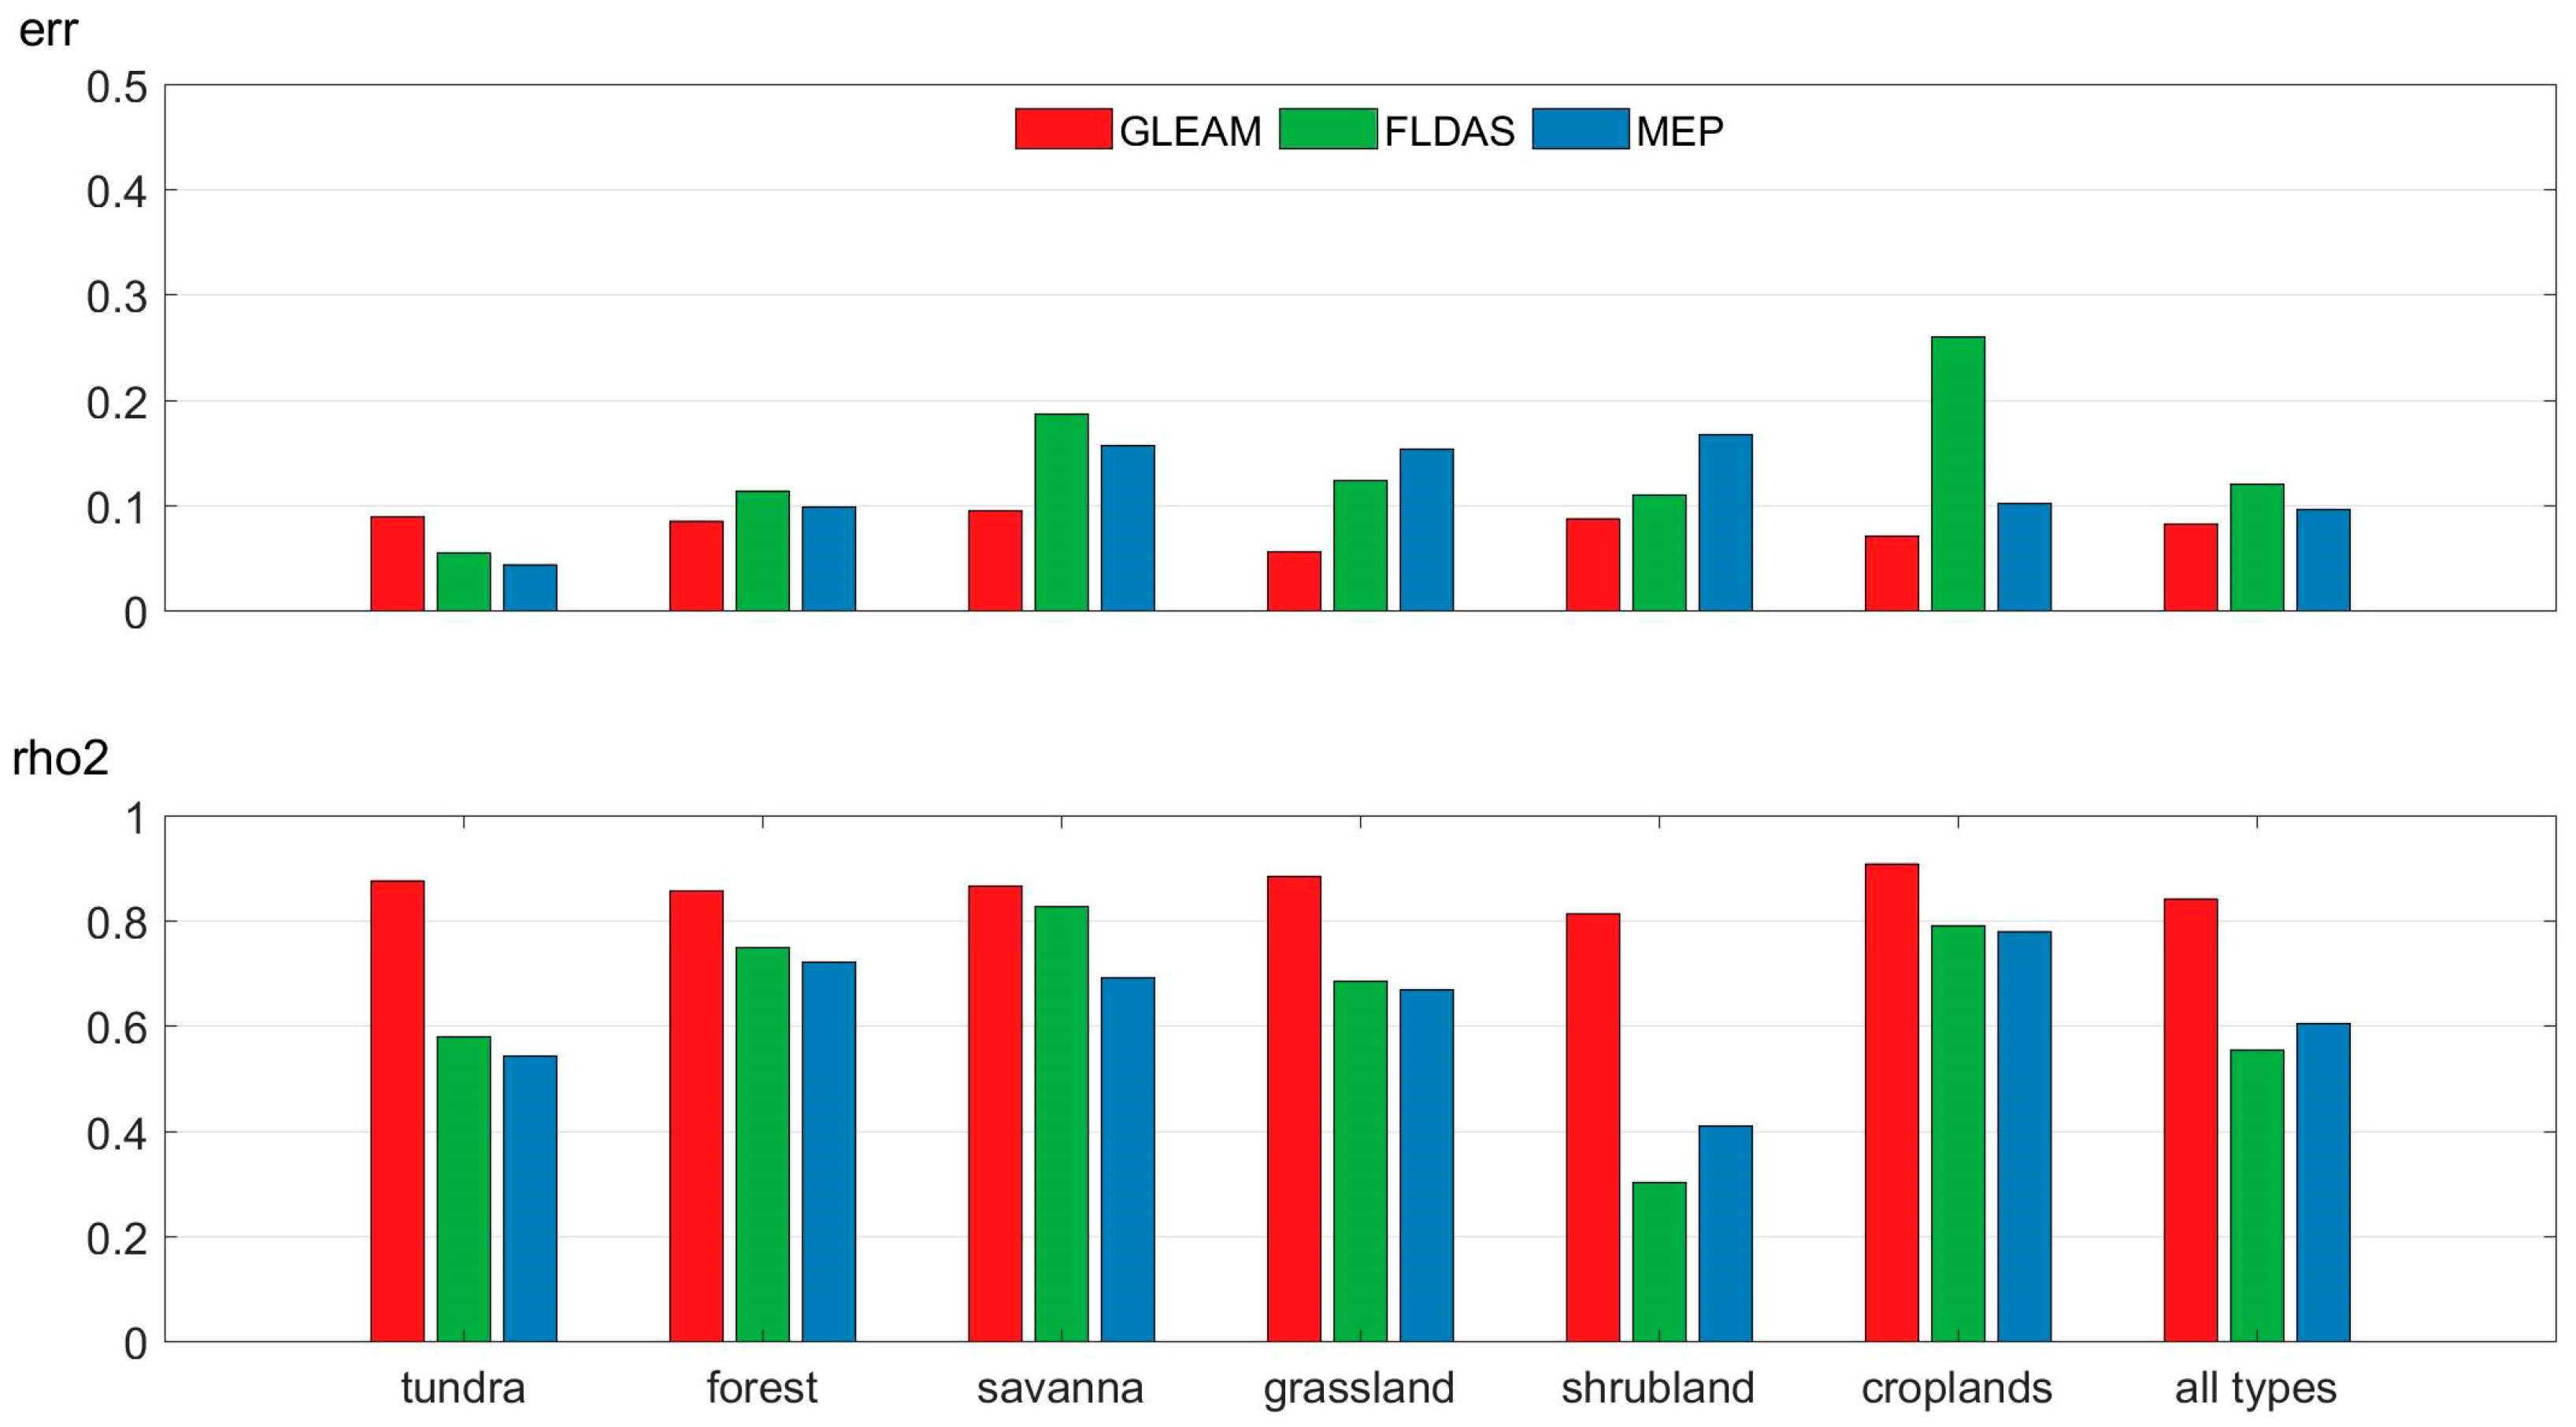
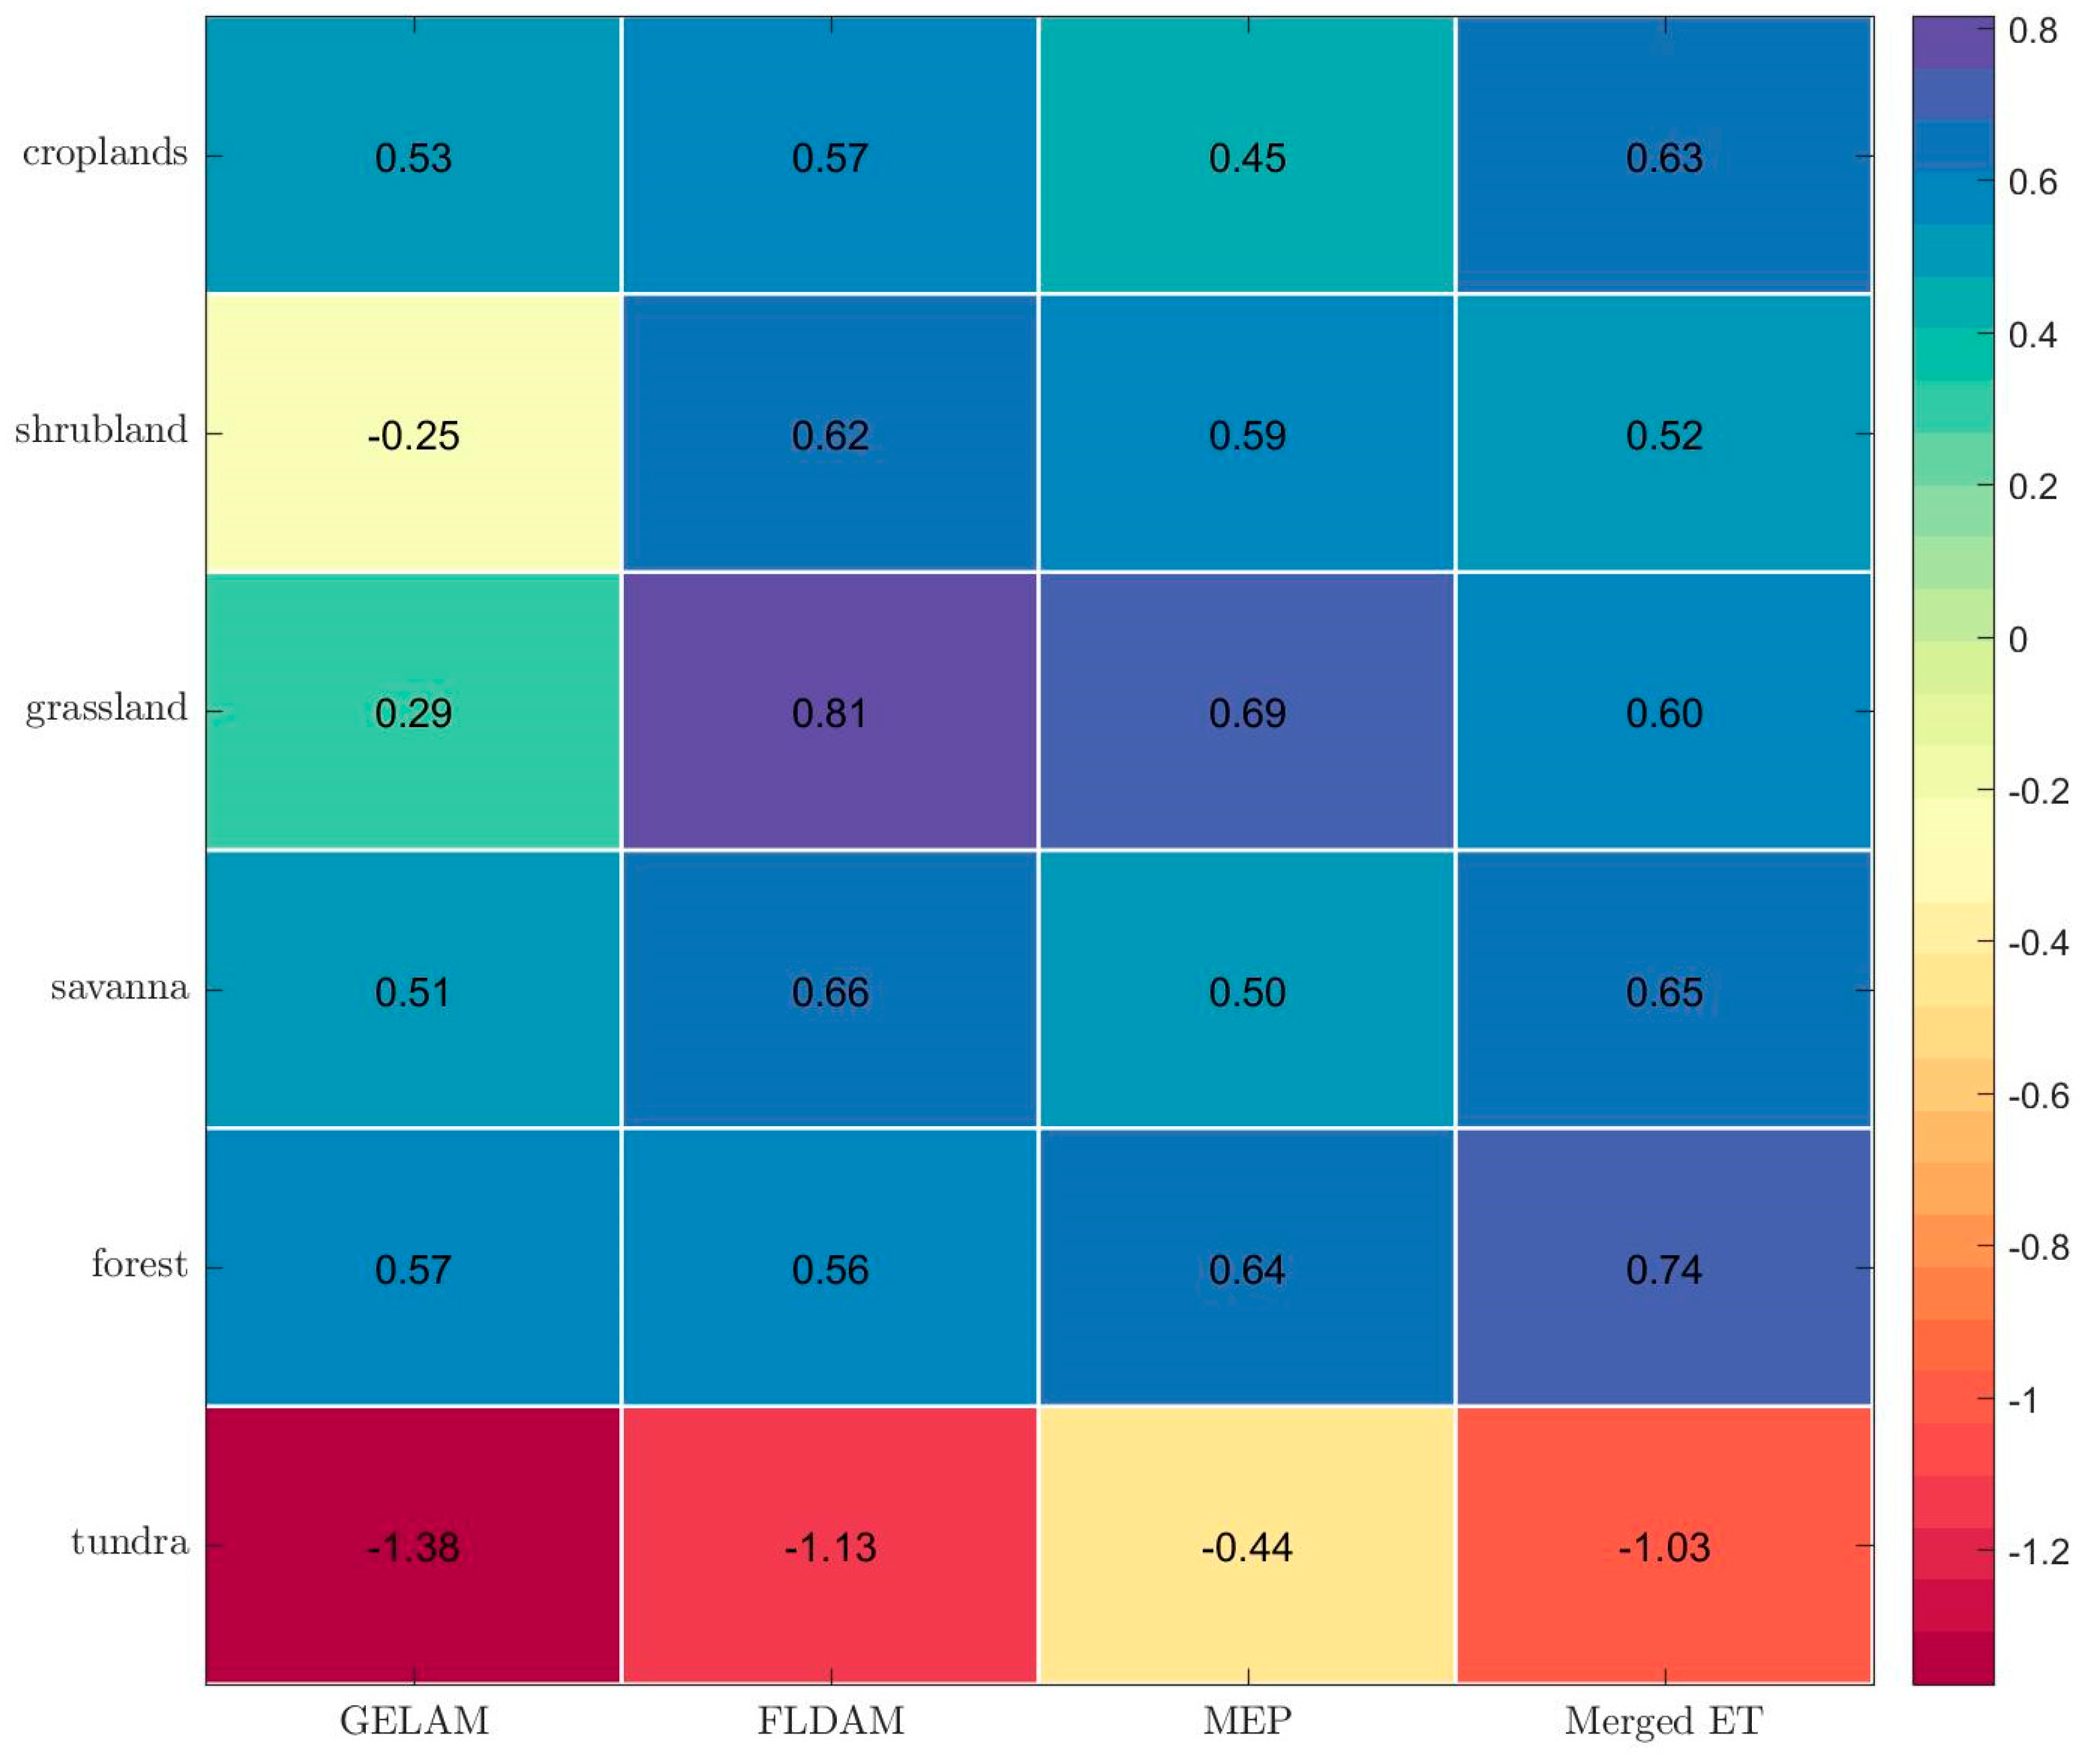
3.1.4. Uncertainty under Different Vegetation Coverages

Figure 5 illustrates the error variation and correlation coefficient derived from the ETC method between the unknown truth and three actual evapotranspiration (AET) products (GLEAM, FLDAS, MEP) across different vegetation covers during the study period. Their performance varied across different vegetation covers. Across all biome types except tundra, GLEAM consistently showed the best performance, with the lowest error and the highest correlation. FLDAS and MEP exhibited competitive metrics in certain biomes, but overall, GLEAM was the most reliable dataset according to the provided criteria. In shrubland, FLDAS and MEP showed relatively low correlation coefficients, below 0.5. For the remaining vegetation types, the correlation coefficients of all three products exceeded 0.5. In croplands and forests, the correlation coefficients were notably high, around 0.8, followed by forests, grasslands, and tundra.

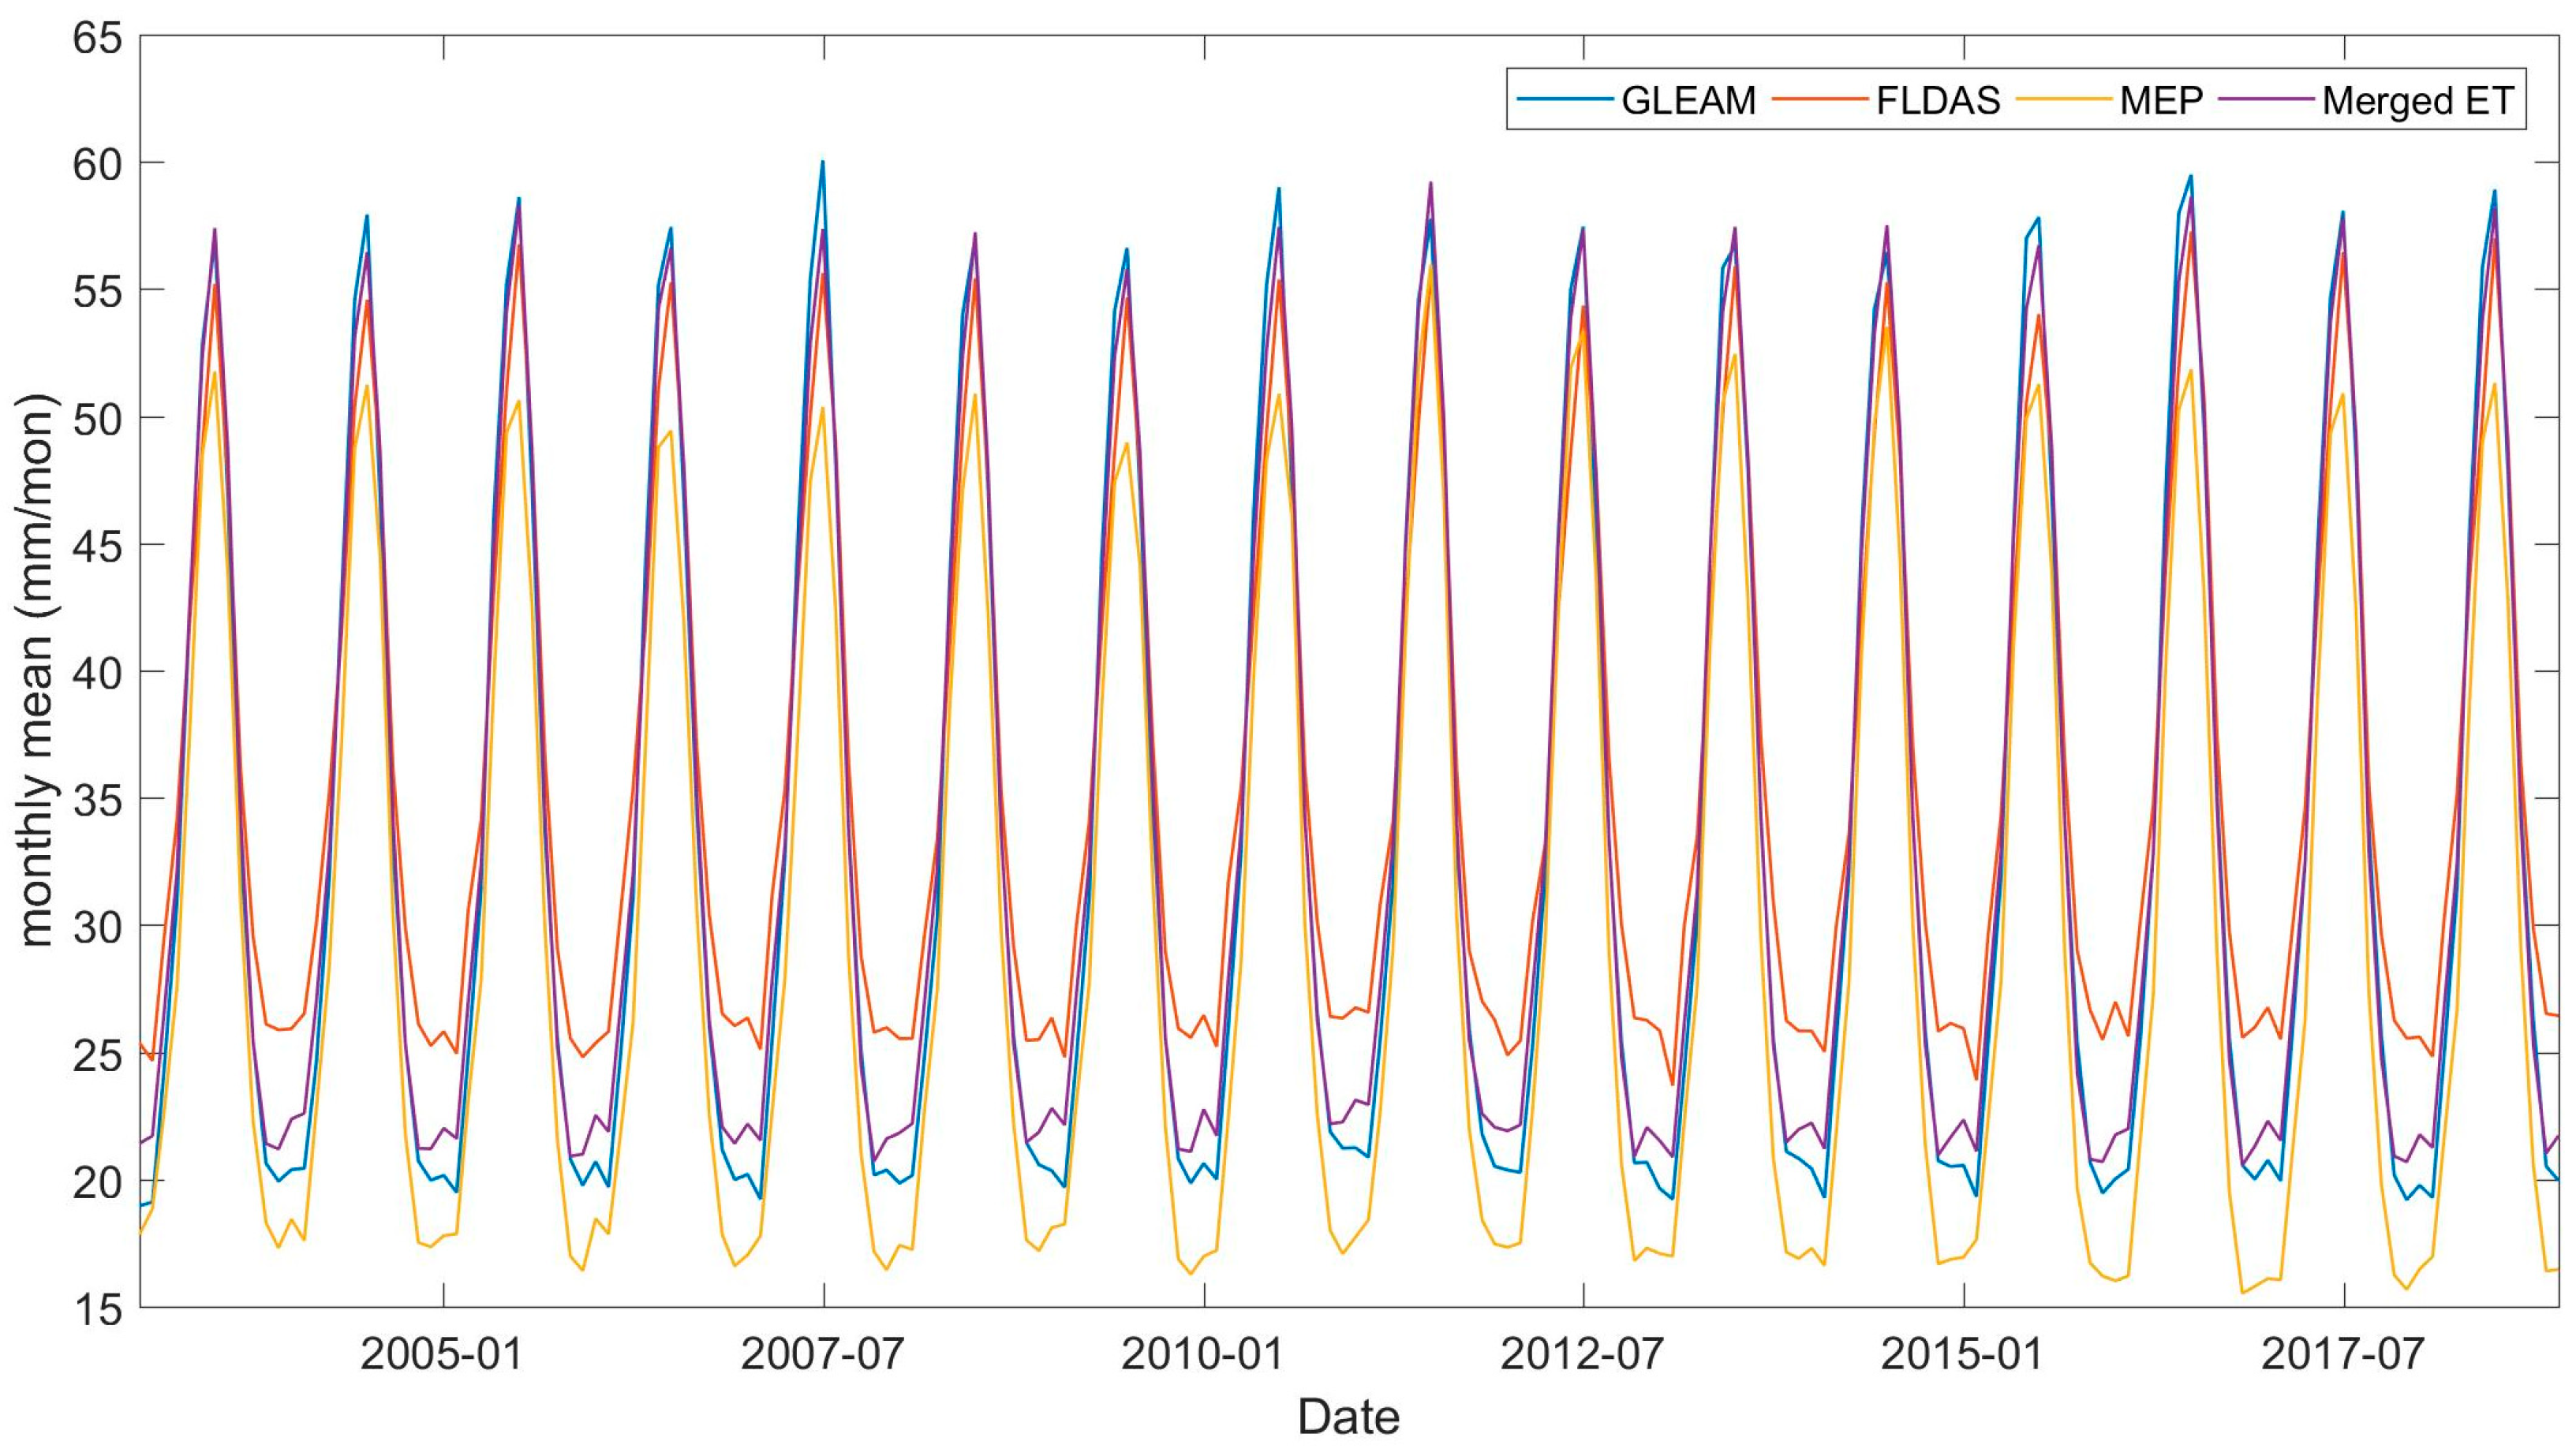
3.2. Merged ET Dataset and the Trends

Overall, the spatial variations of random error in GLEAM, FLDAS, and MEP actual evapotranspiration (AET) demonstrate that their broad uncertainty patterns were strongly influenced by the underlying vegetation cover as well as the accuracy of the reference forcing dataset [41]. The performances of these three products showed regional divergence. To leverage the strengths of each individual product, we derived a merged ET through the ETC method by assigning weights to different individual products. The weights for the three products are shown in Figure A3, Figure A4 and Figure A5.
Figure 6 illustrates the global distribution of the merged ET. The merged ET displayed a similar spatial distribution to the original products, with lower values observed in South America (excluding the Southwest) compared to FLDAS, particularly in regions dominated by forests. Additionally, the merged ET exhibited fluctuations in the Southern Hemisphere. In the Northern Hemisphere, the merged ET, along with the GLEAM and FLDAS products, showed fluctuating trends, whereas the MEP product did not.

3.3. Assessment of AET Products and Merged ET

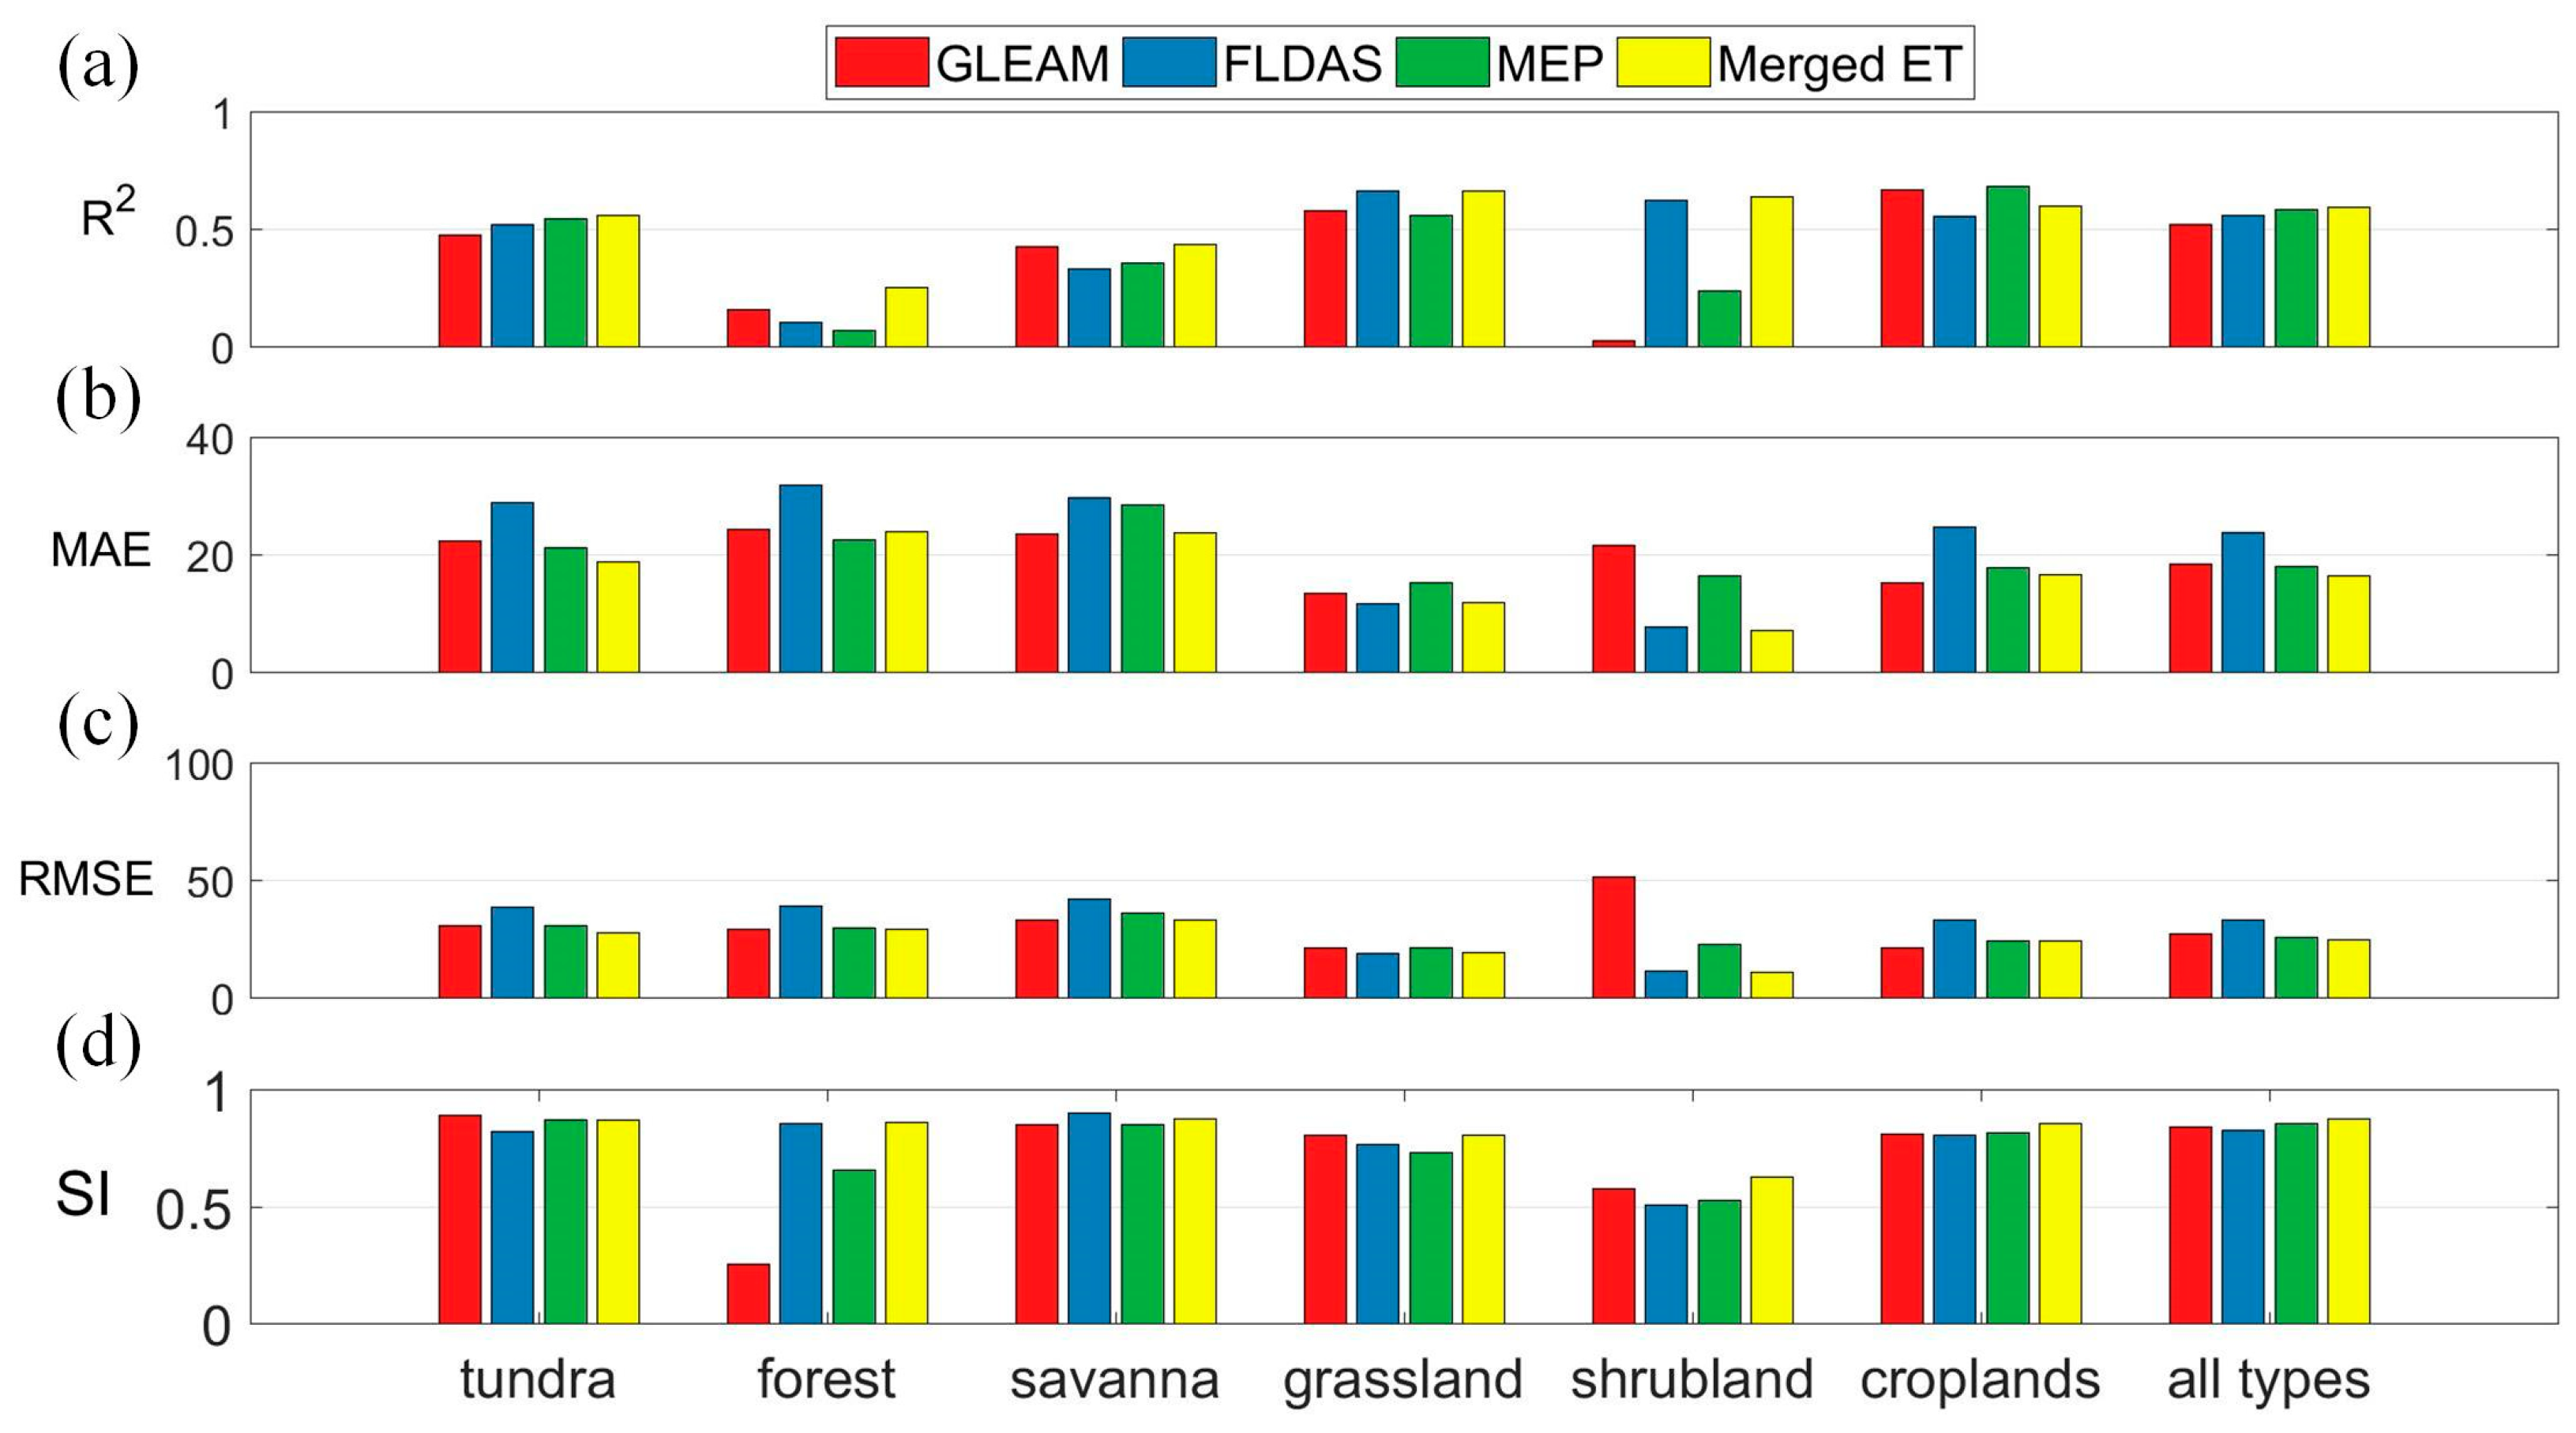
3.3.1. Assessment of AET Products

To gain a deeper understanding of the disparities between merged ET and the original products, Figure 7 presents the spatial distribution of differences in Kling–Gupta efficiency (KGE) values across various geographical zones. The performance of merged ET exhibited regional variations.
In North America (NA), which has the largest number of FLUXNET tower sites, merged ET demonstrated a superior performance compared to the original products, particularly for GLEAM (improving at 59.4% of sites) and FLDAS (enhancing at 77.5% of sites), while MEP exhibited improvement at 35.5% of sites. Notably, the KGE values of merged ET and in situ data mostly reached 0.5 in NA (refer to Figure A2), indicating the reliability of merged ET in this region.
In Europe (EU), merged ET outperformed the original products across the majority of flux tower stations, with all stations showing improvements of approximately 60% or more. This improvement extended to stations situated in relatively arid southern regions.
However, in Asia (AS) and the rest of the world (RW), the performance of merged ET closely mirrored that of the original products, with KGE values mostly around 0.3 when compared to in situ data.
For the analysis of the performance of the three original products and their merged ET under different vegetation covers, Kling–Gupta efficiency (KGE) values of the four products with in situ data were calculated and are presented in Figure 8. The merged ET demonstrated improvement over the original products across almost all vegetation covers, particularly in forests and croplands. Among the original products, FLDAS exhibited the highest KGE value (0.57), possibly due to its specific characteristics. However, none of the products showed consistently satisfactory results when compared to in situ data for tundra vegetation cover.

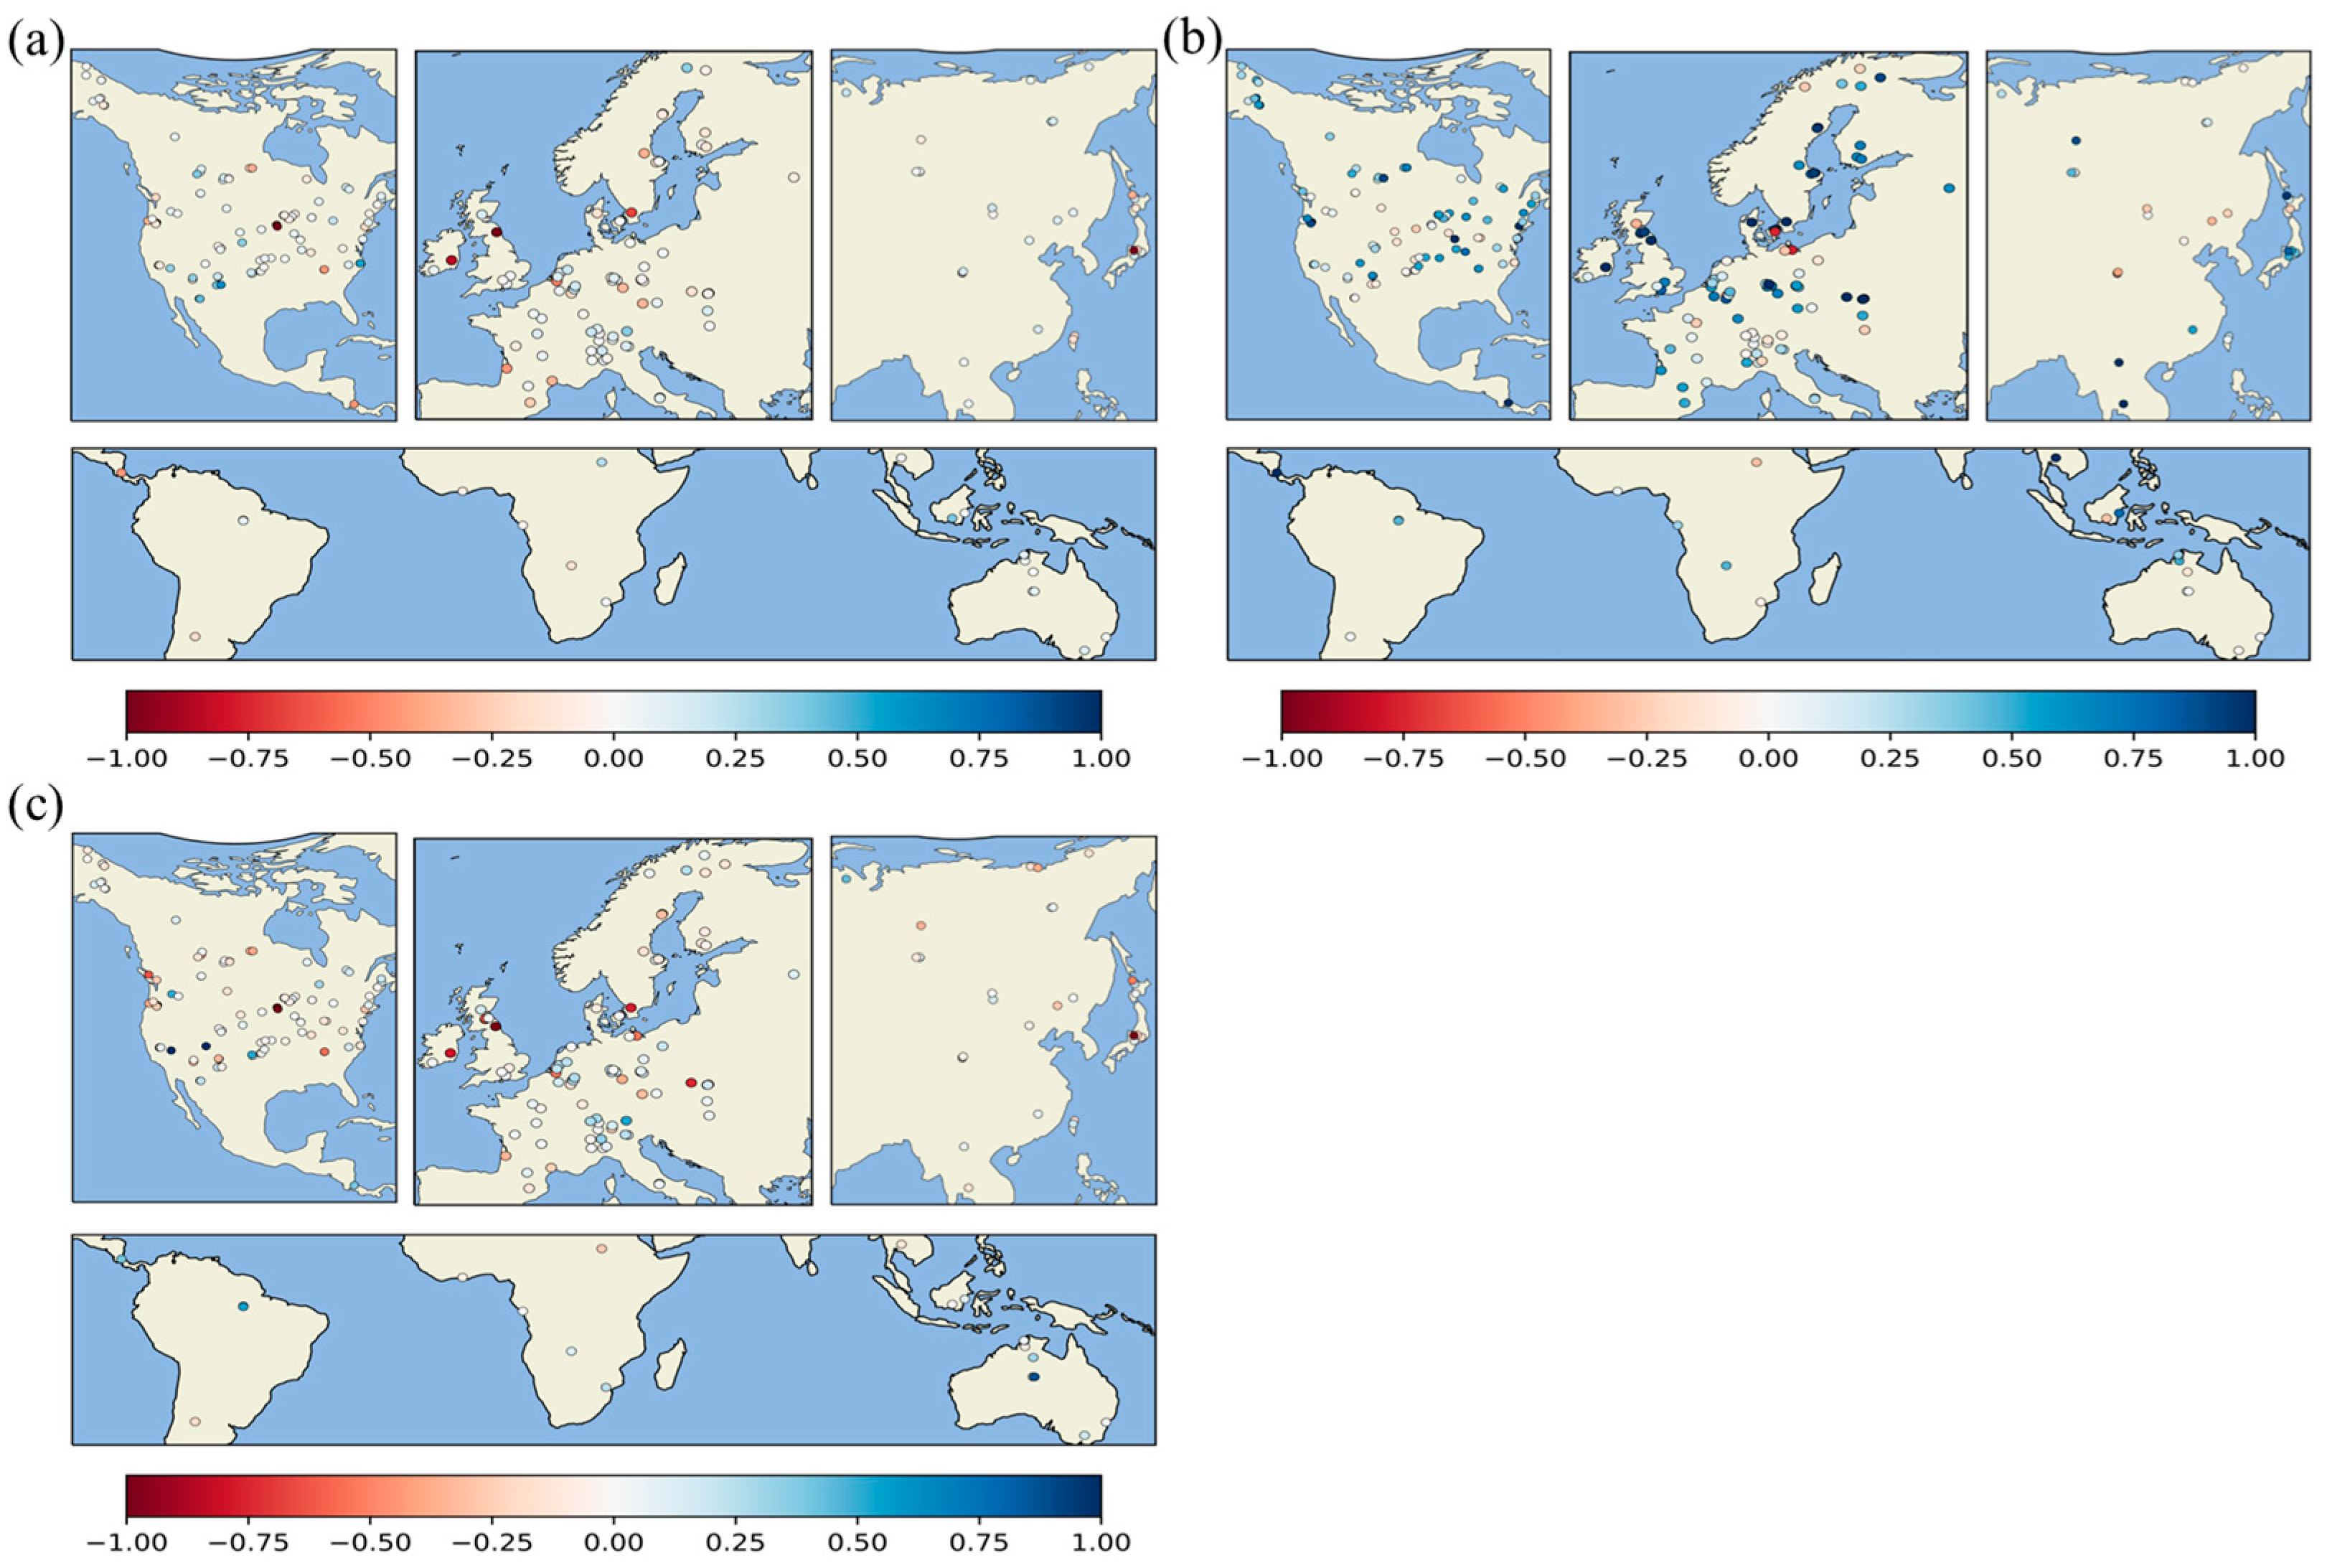
3.3.2. Uncertainties Compared to In Situ Data under Different Vegetation Covers

The multi-year average monthly mean actual evapotranspiration (AET) of GLEAM, FLDAS, MEP, and merged ET under various vegetation covers is illustrated in Figure 9, revealing noticeable variations in AET among different vegetation covers. Furthermore, each product exhibited varying AET values for the same vegetation cover. Consequently, this study proceeds to assess the uncertainty of these three products across different vegetation covers.
In general, the median AET order across different vegetation covers for the four products was as follows: savanna > croplands > forest > grassland > shrubland > tundra. Additionally, FLDAS demonstrated the highest values among the four products in croplands, grassland, forest, and tundra, whereas MEP exhibited the highest values in shrubland and savanna.
Moreover, the results from the statistical comparison, illustrated in Figure 10 and Table A1, highlight the independent accuracy of the four AET products across diverse vegetation covers at each selected site. On average, the outcomes from grassland and shrubland vegetation covers exhibited the highest agreement between flux tower measurements and Merged ET. Specifically, they exhibited R2 values of 0.6633 and 0.6380, MAE values of 11.9154 and 7.1514, RMSE values of 19.1637 and 11.0493, and SI values of 0.8070 and 0.6290, respectively, followed by tundra, croplands, savanna, and forest.
In conclusion, the merged ET product consistently demonstrated significant improvements in R2 across various vegetation types compared to individual products. Notably, it showed substantial improvements in shrubland areas, achieving the highest R2 (0.6380) and SI (0.6290) as well as the lowest MAE and RMSE values, surpassing GLEAM, FLDAS, and MEP. In grasslands, merged ET performed comparably to FLDAS, with similar R2 values (0.6633 and 0.6648, respectively), both outperforming GLEAM and MEP. Although it was slightly lower than MEP in croplands, merged ET still exhibited superior performance, with the highest R2 (0.6836) and SI (0.8574), along with lower MAE (16.5585) and RMSE (24.1886). In savanna and tundra biomes, merged ET performed competitively with GLEAM and MEP, demonstrating superior accuracy compared to FLDAS. Even in forested areas, where performance is typically challenging, merged ET exhibited substantial improvements, with the highest R2 (0.4352) compared to GLEAM and MEP. Specifically, merged ET excelled in tundra, forest, grassland, and shrubland areas. These findings underscore the efficacy of merged ET in enhancing accuracy across diverse vegetation covers, establishing it as a valuable dataset for understanding spatial dynamics in evapotranspiration.

4. Discussion

4.1. Evaluation of Merged ET and Individual Products

Overall, among the individual products, GLEAM exhibited the best performance globally. GLEAM utilizes the Priestley–Taylor equation as its core algorithm to estimate potential evapotranspiration (PET), which is then converted to actual evapotranspiration (AET). This approach outperformed FLDAS and MEP, which utilize the Priestley–Means and Maximum Entropy Production methods, respectively [42].
The median AET order across different vegetation covers for the three individual products and merged ET was as follows: savanna > croplands > forest > grassland > shrubland > tundra. This finding aligns with the results of Dong et al. [43] and Zhang et al. [44]. However, Peel et al. noted that the mean annual AET tends to be higher in non-forested catchments compared to forested catchments [25], but this study shows that shrubland, grassland, and tundra have lower AET values than forest. This phenomenon may be attributed to Peel’s studies categorizing vegetation covers as either forested or non-forested without further subdividing the non-forested vegetation covers. The varying evapotranspiration values among different subcategories within the non-forested classification might have influenced the results. FLDAS exhibited the highest value in croplands and forests, whilst Elnashar et al. [37] proved that FLDAS products overestimated AET values across croplands and forests. Merged ET addresses this issue by assigning a weight to FLDAS, mitigating the overestimation effect.
The performance of merged ET compared to the original products showed regional divergence. In NA and EU, merged ET demonstrated substantial improvement relative to the original products, whereas, in AS and RW, merged ET performed similarly to the original products. The limited number of in situ validation sites in AS and RW relative to NA and EU may restrict thorough validation of its reliability.
Taken together, our findings suggest that the choice of input forcings and of core algorithm are crucial factors in determining the accuracy of AET estimates, particularly in regions with complex vegetation covers. Furthermore, obtaining merged ET through individual products is feasible in NA and EU regions. However, further analysis and validation are required in future studies for regions with fewer in situ sites, such as AS and RW.

4.2. The Effect of the Uncertainty

Plant transpiration (Tr), soil evaporation (Es), and canopy interception (Ei) are computed individually in GLEAM and FLDAS [33,45]. In contrast, MEP exclusively calculates plant transpiration (Tr) and soil evaporation (Es) separately [35]. Both Tr and Es are calculated using a series of stress factors to constrain the Priestley–Taylor (PT) potential evapotranspiration equation [31], while the Ei is calculated separately using the Gash model [46,47] in GLEAM. FLDAS computes potential evapotranspiration (PET) using the Penman approach, with Tr, Es, and Ei calculated using different stress factors to constrain PET [48]. MEP employs the Maximum Entropy Production method formulation (Appendix A) for AET calculation. As a result, these three products employ diverse methodologies for calculating AET, thereby adhering to the assumption of evapotranspiration components (ETC).
The results from the Extended Triple Collocation (ETC) method reveal varying levels of uncertainty among the three ET products across different vegetation covers. The MEP product demonstrated acceptable uncertainty in croplands, forests, savannas, and grasslands. GLEAM yielded satisfactory results in most vegetation covers, while FLDAS performs well in forests and grasslands. However, no single ET product excels across all vegetation covers, including the FLUXCOM versions. This could be attributed to the systematic errors in in situ flux tower measurements, as discussed by Fang et al. [49]. The uncertainty in modeled ET estimates can be attributed to various factors, including the utilization of multiple input-forcing products and algorithms, as highlighted by Cao et al. [50]. The MEP model relies solely on readily available input variables, which helps to mitigate the issue of oversensitivity to air temperature, a common problem in many evaporation models, as mentioned by Isabelle et al. [51]. This could explain the excellent performance of MEP in forest vegetation cover. It is worth noting that net radiation (Rn) plays a crucial role in the MEP model for calculating AET. Rn can be directly influenced by forestry and natural disturbances, as Halim et al. [52] discussed. This may contribute to MEP’s satisfying performance in croplands.
The GLEAM model employs Priestley–Taylor (PT) equations to calculate evaporation, with a PT coefficient α that takes different values for tall or short vegetation, as explained by Wu et al. [53]. However, this coefficient is fixed for tall or short vegetation, which may lead to deviations in forest and shrubland vegetation cover. Additionally, limitations in retrieving surface soil moisture from space in densely forested regions pose challenges for products that rely on soil moisture data. This is evident in GLEAM’s relatively poorer performance in forested areas compared to other vegetation covers [54]. On the other hand, the poor performance of FLDAS is attributed to bias introduced by the forcing data and its downscaling [55].
The performance of merged ET in reducing uncertainty compared to the original products varies across different regions and vegetation covers. Merged ET demonstrates satisfactory performance in NA and EU regions. Significant improvements are observed in merged ET compared to the original products, particularly in forests and cropland vegetation covers with higher KGE values. This allows researchers to obtain superior ET products across different regions and vegetation covers, especially in regions with fewer in situ sites.

4.3. Comparison with Other Studies and Application

The results indicate that the merged ET derived from the ETC method effectively reduces uncertainty in ET estimates across North America (NA), Europe (EU), and various vegetation covers such as tundra, forest, grassland, and shrubland. These findings align with previous studies. For instance, He et al. [56] found a slight improvement in the correlation coefficient (less than 0.025) when comparing Merged ET to GLEAM in China, whereas our study shows a more substantial overall improvement. Similarly, Jongmin et al. [57] evaluated ERA5-Land, GLDAS, and MERRA2 over East Asia and observed that the merged ET of three signal products showed improvement, with RMSE decreasing by 1 to 13 mm/month, which aligns with the findings of this study. However, there have been relatively few studies of this nature, and they often focus on a limited number of products across specific regions without considering different vegetation covers. To our knowledge, this paper is the first to explore the uncertainty of GLEAM, FLDAS, and MEP under various vegetation covers, not only selecting but also generating ET products for ungauged areas using global data.
This study underscores the significant potential of utilizing evapotranspiration (ET) estimation methods to enhance ET assessments in ungauged regions using multiple readily available global ET products. Actual ET datasets have been extensively employed in hydro-meteorological applications, such as water resources management, weather forecasting, and predictions of hydroclimate extremes [58,59,60,61]. However, ground-based methodologies are typically used to validate ET estimates at specific sites due to their limited spatial coverage. Scaling up ET estimates to larger spatial extents relies on the use of ET models. With the rapid evolution of remote sensing technology, numerous ET algorithms have been developed for regional ET estimation. This paper offers valuable insights for researchers studying areas where direct ET measurements are lacking, highlighting the importance of integrating multiple global ET products to improve the accuracy and reliability of ET assessments in these regions.

4.4. Limitations and Future Works

The results of our in situ data comparison indicate that the merged ET derived from the ETC method effectively mitigates uncertainty in ET estimates in NA and EU regions, and various vegetation covers, including tundra, forest, grassland, shrubland, and particularly forest and cropland. However, the performance of the merged ET is somewhat limited by the quality of the products used for merging. This underscores the potential for further enhancing the ETC method by selecting ET products with superior performance based on prior knowledge before merging. Previous studies have highlighted the strengths and weaknesses of different model algorithms [62,63,64]. For example, the GLEAM product estimates ET using diagnostic models (e.g., Priestley–Taylor equation), which requires minimal prior data on soil and vegetation characteristics for estimating energy balance components. However, the GLEAM product is predominantly influenced by radiation, meteorological factors, and vegetation variables, often neglecting soil moisture constraints [65,66] that are crucial for regulating plant transpiration. In contrast, FLDAS products derived from the Land Surface Model (LSM) are constrained by soil moisture [67].
To match the resolution of vegetation cover dataset, we uniformly resampled the ET products to 0.5° using the nearest-neighbor interpolation method in Matlab. Additionally, Gloria et al. found that some ET remote sensing products showed less uncertainty at coarse resolutions, but higher uncertainty at finer resolutions [68]. However, Zhu et al. [69] showed that, after resampling the MOD16 (generated through an improved Penman Monteith algorithm), SSEBop (generated based on the Simplified Surface Energy Balance model), and Advanced Very High Resolution Radiometer (AVHRR) products to 0.25°, their accuracy decreased. In future research, we hope to investigate the impact of different spatial scales on product uncertainty.
This study assigns different weights to individual total evapotranspiration products to obtain the merged ET. However, the partitioning of evapotranspiration components is influenced by vegetation cover, as increases in leaf area index (LAI) reduce incoming solar radiation reaching the soil surface, thereby decreasing soil evaporation and regulating the allocation of ET components [70,71,72]. Apart from the ETC method evaluated in this study, various other merging methods can significantly reduce uncertainty in ET products [73,74,75]. Exploring how to estimate ET components using different merging methods and reducing ET uncertainty presents a promising direction for future research.

5. Conclusions

Developing robust global products poses a considerable challenge. This study investigates the capability of the ETC method to estimate the uncertainty of three AET products (GLEAM, FLDAS, and MEP) globally, without requiring prior information, and quantifies their uncertainty across different vegetation covers. Subsequently, based on the results of ETC, a merged ET is derived by combining the ET from multiple products on a monthly scale. Furthermore, the performance of the three original products and the merged ET is compared across 645 sites globally.
In terms of the best-performing ET representation, GLEAM covers the most significant area, accounting for 39.1% based on the correlation coefficient criterion and 39.9% based on the error variation criterion. Meanwhile, FLDAS and MEP exhibit similar performance characteristics. However, when considering different vegetation covers, the results indicate that only some products outperform others in specific vegetation covers.
By leveraging the strengths of each individual product, we obtained a merged ET through the ETC method by assigning weights to different individual products. The comparison with in situ sites revealed the potential of the merged ET to mitigate uncertainty in ET estimates in NA and EU regions and various vegetation covers, including tundra, forest, grassland, and shrubland. In essence, the ETC method combined with the merging approach proved to be highly effective in obtaining a superior ET product, surpassing the performance of any individual source ET products in these regions and vegetation covers. It paves the way for enhancing the accuracy of large-scale evapotranspiration datasets.

Author Contributions

Conceptualization, X.L. and H.S.; methodology, X.L., H.S. and W.Z.; writing—original draft preparation, X.L. and H.S.; writing—review and editing, Y.Y., X.S., M.X., S.O. and H.L.; project administration, H.Q. All authors have read and agreed to the published version of the manuscript.

Funding

This research was funded by the Third Xinjiang Scientific Expedition Program, grant number Grant No.2022xjkk0105; the NSFC project, grant number 52039004, 52079055, 52011530128 and the NSFC-STINT project, grant number No. 202100-3211.

Data Availability Statement

The products used in this study are publicly available as follows: (1) ISLSCP II Potential Natural Vegetation Cover can be accessed via https://doi.org/10.3334/ORNLDAAC/961 (accessed on 11 January 2024). (2) ISLSCP II MODIS (Collection 4) IGBP Vegetation Cover for 2000–2001 can be accessed via https://doi.org/10.3334/ORNLDAAC/968 (accessed on 11 January 2024). All the data used in this research are available upon request.

Acknowledgments

Acknowledgement for the data support from “National Earth System Science Data Center, National Science & Technology Infrastructure of China (http://www.geodata.cn)”.

Conflicts of Interest

The authors declare no conflicts of interest.

Appendix A

Formulation of the Maximum Entropy Production Method:
Under the constraint of the surface energy balance, the minimization of the dissipation or entropy production function (A1) yields a distinct partitioning of net radiation (Rn) into latent heat (LE), sensible heat (H), and ground heat (G) fluxes. This formulation produces solutions as follows [76,77]:
L E + H + G = R n
σ ( T s , q s ) = λ 2 c p R v q s T S 2
B ( σ ) = 6 ( 1 + 11 36 σ 1 )
L E = B ( σ ) H
G = B ( σ ) σ I s I 0 H | H | 1 6
where σ ( T s , q s ) is a dimensionless parameter characterizing the phase change-related state of the evaporating surface; T s is the skin surface temperature; q s is the surface specific humidity; λ is the vaporization heat of liquid water; c p is the specific heat of air under constant pressure; R v is the gas constant of water vapor; I 0 is the concise expression of the H-independent coefficient; and I s characterizes a thermal property of the soil varying with moisture content.
Two distinct versions of the MEP (Maximum Entropy Production) model are proposed for bare soil surface and vegetation, respectively [34,51], as follows:
Evaporation (Es) from the bare soil surface:
E s = L E λ
When considering a completely vegetated surface, G is approximately 0.
E v = R n 1 + B 1 ( σ s ) 1 λ
σ s = η s λ 2 c p R v q s T s 2
where η s characterizes the effect of the openness of stomatal apertures on the transport of water vapor, satisfying the given condition.
Finally, the total ET is:
E T = ( 1 f v ) E s + f v E v
where the f v is the fraction of vegetation cover, varying between 0 (bare soil) and 1 (fully vegetated).
Here, the vegetation cover set is categorized into six dominant land use classes (Figure A1) for smoothly characterizing the spatial error structure in AET products.
Figure A1. Classification of vegetation cover in the world, with six covers of vegetation and spatial distribution of the flux towers used in the study.
Remotesensing 16 02484 g0a1
Figure A2. In situ comparison of merged ET. Maps showing the Kling–Gupta efficiency (KGE) metric between merged ET and flux tower sites data in different geographical zones: North America (NA), Europe (EU), Asia (AS), and rest of the world (RW). Blue (red) tones indicate accuracy (inaccuracy) in merged ET compared to in situ data.
Remotesensing 16 02484 g0a2
Figure A3. The weight of GLEAM product in evapotranspiration merging.
Remotesensing 16 02484 g0a3
Figure A4. The weight of FLDAS product in evapotranspiration merging.
Remotesensing 16 02484 g0a4
Figure A5. The weight of FLDAS product in evapotranspiration merging.
Remotesensing 16 02484 g0a5
The monthly mean values of the four products from 2003 to 2018 are illustrated in Figure A6. Generally, they exhibit similar seasonality, with lower ET values occurring in November, December, January, and February, as well as a peak in July. ET values begin to increase in February, reaching their highest point in July, reflecting peak vegetation activity during summer and reduced activity in winter (Figure A6). It is observed that FLDAS generally shows the highest values, except during summer, whereas MEP tends to have the lowest values across different seasons (Figure A7). Seasonal variations show more pronounced fluctuations in spring and summer compared to the relatively stable conditions in autumn and winter. The merged product demonstrates consistency with the three source products throughout these seasonal dynamics.
Figure A6. Global monthly means of GLEAM, FLDAS, MEP, and merged ET from 2003 to 2018.
Remotesensing 16 02484 g0a6
Figure A7. Seasonal means of GLEAM, FLDAS, MEP, and merged ET in 2003–2018. (ad) The seasonal annual mean of (a) spring, (b) summer, (c) autumn, and (d) winter.
Remotesensing 16 02484 g0a7
Table A1. Statistical analysis of GLEAM, FLDAS, MEP, and merged ET in comparison with flux tower measurements.
Biome TypesDatasetR2MAE
(mm/mon)
RMSE
(mm/mon)
SI
TundraGLEAM0.4774 22.3898 30.8501 0.8916
FLDAS0.5214 28.8692 38.4059 0.8228
MEP0.5463 21.2863 30.9052 0.8731
Merged ET0.5603 18.8669 27.8232 0.8704
ForestGLEAM0.1568 24.3116 29.2547 0.2556
FLDAS0.1032 31.8802 38.9362 0.8553
MEP0.0687 22.5617 29.9345 0.6543
Merged ET0.2527 23.9891 29.0292 0.8614
SavannaGLEAM0.4279 23.5890 33.1950 0.8523
FLDAS0.3318 29.7965 42.0997 0.9003
MEP0.3565 28.4786 36.0082 0.8528
Merged ET0.4352 23.7498 33.0523 0.8777
GrasslandGLEAM0.5806 13.4673 21.2547 0.8039
FLDAS0.6648 11.6636 19.0468 0.7642
MEP0.5596 15.3106 21.4564 0.7289
Merged ET0.6633 11.9154 19.1637 0.8070
ShrublandGLEAM0.0271 21.6798 51.5772 0.5767
FLDAS0.6241 7.6778 11.4932 0.5064
MEP0.2390 16.4039 22.6190 0.5252
Merged ET0.6380 7.1514 11.0493 0.6290
CroplandsGLEAM0.6664 15.1924 21.4366 0.8105
FLDAS0.5567 24.7039 33.2429 0.8043
MEP0.6836 17.8241 24.2335 0.8159
Merged ET0.6002 16.5585 24.1886 0.8574
All typesGLEAM0.5222 18.4798 27.3480 0.8418
FLDAS0.5587 23.8607 32.9354 0.8281
MEP0.5848 18.0764 25.8383 0.8541
Merged ET0.5939 16.4510 24.5225 0.8743

References

  1. Xue, J.; Lei, J.; Chang, J.; Zeng, F.; Zhang, Z.; Sun, H. A causal structure-based multiple-criteria decision framework for evaluating the water-related ecosystem service tradeoffs in a desert oasis region. J. Hydrol. Reg. Stud. 2022, 44, 101226. [Google Scholar] [CrossRef]
  2. Wang, S.; Chang, J.; Xue, J.; Sun, H.; Zeng, F.; Liu, L.; Liu, X.; Li, X. Coupling behavioral economics and water management policies for agricultural land-use planning in basin irrigation districts: Agent-based socio-hydrological modeling and application. Agric. Water Manag. 2024, 298, 108845. [Google Scholar] [CrossRef]
  3. Wang, K.; Dickinson, R.E. A review of global terrestrial evapotranspiration: Observation, modeling, climatology, and climatic variability. Rev. Geophys. 2012, 50, RG2005. [Google Scholar] [CrossRef]
  4. Du, S.; Liang, C.; Sun, H.; Wang, K.; Wang, J.; Li, H.; Xue, J.; Chen, F.; Tuo, Y.; Disse, M. Evaluating the potential benefits of float solar photovoltaics through the water footprint recovery period. J. Clean. Prod. 2024, 446, 141399. [Google Scholar] [CrossRef]
  5. Lu, M.; Sun, H.; Cheng, L.; Li, S.; Qin, H.; Yi, S.; Zhang, H.; Zhang, W. Heterogeneity in vegetation recovery rates post-flash droughts across different ecosystems. Environ. Res. Lett. 2024, 19, 074028. [Google Scholar] [CrossRef]
  6. Miralles, D.G.; Jiménez, C.; Jung, M.; Michel, D.; Ershadi, A.; McCabe, M.; Hirschi, M.; Martens, B.; Dolman, A.J.; Fisher, J.B. The WACMOS-ET project–Part 2: Evaluation of global terrestrial evaporation data sets. Hydrol. Earth Syst. Sci. 2016, 20, 823–842. [Google Scholar] [CrossRef]
  7. Xue, B.-L.; Wang, L.; Li, X.; Yang, K.; Chen, D.; Sun, L. Evaluation of evapotranspiration estimates for two river basins on the Tibetan Plateau by a water balance method. J. Hydrol. 2013, 492, 290–297. [Google Scholar] [CrossRef]
  8. Huang, Q.; Qin, G.; Zhang, Y.; Tang, Q.; Liu, C.; Xia, J.; Chiew, F.H.S.; Post, D. Using Remote Sensing Data—Based Hydrological Model Calibrations for Predicting Runoff in Ungauged or Poorly Gauged Catchments. Water Resour. Res. 2020, 56, e2020WR028205. [Google Scholar] [CrossRef]
  9. Zhang, Y.; Chiew, F.H.S.; Liu, C.; Tang, Q.; Xia, J.; Tian, J.; Kong, D.; Li, C. Can Remotely Sensed Actual Evapotranspiration Facilitate Hydrological Prediction in Ungauged Regions Without Runoff Calibration? Water Resour. Res. 2020, 56, e2019WR026236. [Google Scholar] [CrossRef]
  10. Blöschl, G.; Bierkens MF, P.; Chambel, A.; Cudennec, C.; Destouni, G.; Fiori, A.; Kirchner, J.W.; McDonnell, J.J.; Savenije, H.H.G.; Sivapalan, M.; et al. Twenty-three unsolved problems in hydrology (UPH)—A community perspective. Hydrol. Sci. J. 2019, 64, 1141–1158. [Google Scholar] [CrossRef]
  11. Li, Z.W.; Yu, Q.G.; Jiu, X.Y.; Tha, P.U.K.; Pierre, G.; Yu, C.B. Uncertainties Caused by Resistances in Evapotranspiration Estimation Using High-Density Eddy Covariance Measurements. J. Hydrometeorol. 2020, 21, 1349–1365. [Google Scholar]
  12. Yin, L.; Wang, X.; Feng, X.; Fu, B.; Chen, Y. A Comparison of SSEBop-Model-Based Evapotranspiration with Eight Evapotranspiration Products in the Yellow River Basin, China. Remote Sens. 2020, 12, 2528. [Google Scholar] [CrossRef]
  13. Li, X.; Long, D.; Han, Z.; Scanlon, B.R.; Sun, Z.; Han, P.; Hou, A. Evapotranspiration estimation for Tibetan Plateau headwaters using conjoint terrestrial and atmospheric water balances and multisource remote sensing. Water Resour. Res. 2019, 55, 8608–8630. [Google Scholar] [CrossRef]
  14. Ma, N.; Szilagyi, J.; Zhang, Y. Calibration-Free Complementary Relationship Estimates Terrestrial Evapotranspiration Globally. Water Resour. Res. 2021, 57, e2021WR029691. [Google Scholar] [CrossRef]
  15. Pan, S.; Pan, N.; Tian, H.; Friedlingstein, P.; Sitch, S.; Shi, H.; Arora, V.K.; Haverd, V.; Jain, A.K.; Kato, E. Evaluation of global terrestrial evapotranspiration using state-of-the-art approaches in remote sensing, machine learning and land surface modeling. Hydrol. Earth Syst. Sci. 2020, 24, 1485–1509. [Google Scholar] [CrossRef]
  16. Stoffelen, A. Toward the true near-surface wind speed: Error modeling and calibration using triple collocation. J. Geophys. Res. Ocean. 1998, 103, 7755–7766. [Google Scholar] [CrossRef]
  17. McColl, K.A.; Vogelzang, J.; Konings, A.G.; Entekhabi, D.; Piles, M.; Stoffelen, A. Extended triple collocation: Estimating errors and correlation coefficients with respect to an unknown target. Geophys. Res. Lett. 2014, 41, 6229–6236. [Google Scholar] [CrossRef]
  18. Awange, J.L.; Ferreira, V.G.; Forootan, E.; Khandu; Andam-Akorful, S.; Agutu, N.; He, X. Uncertainties in remotely sensed precipitation data over Africa. Int. J. Climatol. 2016, 36, 303–323. [Google Scholar] [CrossRef]
  19. Dong, J.; Lei, F.; Wei, L. Triple collocation based multi-source precipitation merging. Front. Water 2020, 2, 498793. [Google Scholar] [CrossRef]
  20. Wu, Y.; Guo, L.; Zheng, H.; Zhang, B.; Li, M. Hydroclimate assessment of gridded precipitation products for the Tibetan Plateau. Sci. Total Environ. 2019, 660, 1555–1564. [Google Scholar] [CrossRef]
  21. Khan, M.S.; Liaqat, U.W.; Baik, J.; Choi, M. Stand-alone uncertainty characterization of GLEAM, GLDAS and MOD16 evapotranspiration products using an extended triple collocation approach. Agric. For. Meteorol. 2018, 252, 256–268. [Google Scholar] [CrossRef]
  22. Kim, S.; Pham, H.T.; Liu, Y.Y.; Marshall, L.; Sharma, A. Improving the combination of satellite soil moisture data sets by considering error cross correlation: A comparison between triple collocation (TC) and extended double instrumental variable (EIVD) alternatives. IEEE Trans. Geosci. Remote Sens. 2020, 59, 7285–7295. [Google Scholar] [CrossRef]
  23. Guo, L.; Wu, Y.; Zheng, H.; Zhang, B.; Fan, L.; Chi, H.; Yan, B.; Wang, X. Consistency and uncertainty of gridded terrestrial evapotranspiration estimations over China. J. Hydrol. 2022, 612, 128245. [Google Scholar] [CrossRef]
  24. Xu, T.; Guo, Z.; Xia, Y.; Ferreira, V.G.; Liu, S.; Wang, K.; Yao, Y.; Zhang, X.; Zhao, C. Evaluation of twelve evapotranspiration products from machine learning, remote sensing and land surface models over conterminous United States. J. Hydrol. 2019, 578, 124105. [Google Scholar] [CrossRef]
  25. Peel, M.C.; McMahon, T.A.; Finlayson, B.L. Vegetation impact on mean annual evapotranspiration at a global catchment scale. Water Resour. Res. 2010, 46, W09508. [Google Scholar] [CrossRef]
  26. Xia, Y.; Hobbins, M.T.; Mu, Q.; Ek, M.B. Evaluation of NLDAS-2 evapotranspiration against tower flux site observations. Hydrol. Process. 2015, 29, 1757–1771. [Google Scholar] [CrossRef]
  27. Volk, J.M.; Huntington, J.L.; Melton, F.S.; Allen, R.; Anderson, M.; Fisher, J.B.; Kilic, A.; Ruhoff, A.; Senay, G.B.; Minor, B. Assessing the accuracy of OpenET satellite-based evapotranspiration data to support water resource and land management applications. Nat. Water 2024, 2, 193–205. [Google Scholar] [CrossRef]
  28. Hong, S.; Deng, H.; Zheng, Z.; Deng, Y.; Chen, X.; Gao, L.; Chen, Y.; Liu, M. The influence of variations in actual evapotranspiration on drought in China’s Southeast River basin. Sci. Rep. 2023, 13, 21336. [Google Scholar] [CrossRef] [PubMed]
  29. Ippolito, M.; De Caro, D.; Ciraolo, G.; Minacapilli, M.; Provenzano, G. Estimating crop coefficients and actual evapotranspiration in citrus orchards with sporadic cover weeds based on ground and remote sensing data. Irrig. Sci. 2023, 41, 5–22. [Google Scholar] [CrossRef]
  30. Qingming, W.; Shan, J.; Jiaqi, Z.; Guohua, H.; Yong, Z.; Yongnan, Z.; Xin, H.; Haihong, L.; Lizhen, W.; Fan, H. Effects of vegetation restoration on evapotranspiration water consumption in mountainous areas and assessment of its remaining restoration space. J. Hydrol. 2022, 605, 127259. [Google Scholar] [CrossRef]
  31. Martens, B.; Miralles, D.G.; Lievens, H.; Van Der Schalie, R.; De Jeu, R.A.; Fernández-Prieto, D.; Beck, H.E.; Dorigo, W.A.; Verhoest, N.E. GLEAM v3: Satellite-based land evaporation and root-zone soil moisture. Geosci. Model Dev. 2017, 10, 1903–1925. [Google Scholar] [CrossRef]
  32. Priestley, C.H.B.; Taylor, R.J. On the assessment of surface heat flux and evaporation using large-scale parameters. Mon. Weather Rev. 1972, 100, 81–92. [Google Scholar] [CrossRef]
  33. McNally, A.; Arsenault, K.; Kumar, S.; Shukla, S.; Peterson, P.; Wang, S.; Funk, C.; Peters-Lidard, C.D.; Verdin, J.P. A land data assimilation system for sub-Saharan Africa food and water security applications. Sci. Data 2017, 4, 170012. [Google Scholar] [CrossRef]
  34. Hajji, I.; Nadeau, D.F.; Music, B.; Anctil, F.; Wang, J. Application of the maximum entropy production model of evapotranspiration over partially vegetated water-limited land surfaces. J. Hydrometeorol. 2018, 19, 989–1005. [Google Scholar] [CrossRef]
  35. Yang, Y.; Sun, H.; Zhu, M.; Wang, J.; Zhang, W. An R package of maximum entropy production model to estimate 41 years of global evapotranspiration. J. Hydrol. 2022, 614, 128639. [Google Scholar] [CrossRef]
  36. Su, Z. The Surface Energy Balance System (SEBS) for estimation of turbulent heat fluxes. Hydrol. Earth Syst. Sci. 2002, 6, 85. [Google Scholar] [CrossRef]
  37. Elnashar, A.; Wang, L.; Wu, B.; Zhu, W.; Zeng, H. Synthesis of global actual evapotranspiration from 1982 to 2019. Earth Syst. Sci. Data 2021, 13, 447–480. [Google Scholar] [CrossRef]
  38. Reichstein, M.; Falge, E.; Baldocchi, D.; Papale, D.; Aubinet, M.; Berbigier, P.; Bernhofer, C.; Buchmann, N.; Gilmanov, T.; Granier, A.; et al. On the separation of net ecosystem exchange into assimilation and ecosystem respiration: Review and improved algorithm. Glob. Chang. Biol. 2005, 11, 1424–1439. [Google Scholar] [CrossRef]
  39. Koppa, A.; Rains, D.; Hulsman, P.; Poyatos, R.; Miralles, D.G. A deep learning-based hybrid model of global terrestrial evaporation. Nat. Commun. 2022, 13, 1912. [Google Scholar] [CrossRef]
  40. Gupta, H.V.; Kling, H.; Yilmaz, K.K.; Martinez, G.F. Decomposition of the mean squared error and NSE performance criteria: Implications for improving hydrological modelling. J. Hydrol. 2009, 377, 80–91. [Google Scholar] [CrossRef]
  41. Badgley, G.; Fisher, J.B.; Jiménez, C.; Tu, K.P.; Vinukollu, R. On uncertainty in global terrestrial evapotranspiration estimates from choice of input forcing datasets. J. Hydrometeorol. 2015, 16, 1449–1455. [Google Scholar] [CrossRef]
  42. Liu, H.; Xin, X.; Su, Z.; Zeng, Y.; Lian, T.; Li, L.; Yu, S.; Zhang, H. Intercomparison and evaluation of ten global ET products at site and basin scales. J. Hydrol. 2023, 617, 128887. [Google Scholar] [CrossRef]
  43. Dong, Z.; Hu, H.; Wei, Z.; Liu, Y.; Xu, H.; Yan, H.; Chen, L.; Li, H.; Khan, M.Y.A. Estimating the actual evapotranspiration of different vegetation types based on root distribution functions. Front. Earth Sci. 2022, 10, 893388. [Google Scholar] [CrossRef]
  44. Zhang, L.; Dawes, W.; Walker, G. Response of mean annual evapotranspiration to vegetation changes at catchment scale. Water Resour. Res. 2001, 37, 701–708. [Google Scholar] [CrossRef]
  45. Chen, F.; Mitchell, K.; Schaake, J.; Xue, Y.; Pan, H.L.; Koren, V.; Duan, Q.Y.; Ek, M.; Betts, A. Modeling of land surface evaporation by four schemes and comparison with FIFE observations. J. Geophys. Res. Atmos. 1996, 101, 7251–7268. [Google Scholar] [CrossRef]
  46. Gash, J. An analytical model of rainfall interception by forests. Q. J. R. Meteorolog. Soc. 1979, 105, 43–55. [Google Scholar] [CrossRef]
  47. Valente, F.; David, J.; Gash, J. Modelling interception loss for two sparse eucalypt and pine forests in central Portugal using reformulated Rutter and Gash analytical models. J. Hydrol. 1997, 190, 141–162. [Google Scholar] [CrossRef]
  48. Ek, M.; Mitchell, K.; Lin, Y.; Rogers, E.; Grunmann, P.; Koren, V.; Gayno, G.; Tarpley, J. Implementation of Noah land surface model advances in the National Centers for Environmental Prediction operational mesoscale Eta model. J. Geophys. Res. Atmos. 2003, 108, 8851. [Google Scholar] [CrossRef]
  49. Fang, H.; Wei, S.; Jiang, C.; Scipal, K. Theoretical uncertainty analysis of global MODIS, CYCLOPES, and GLOBCARBON LAI products using a triple collocation method. Remote Sens. Environ. 2012, 124, 610–621. [Google Scholar] [CrossRef]
  50. Cao, M.; Wang, W.; Xing, W.; Wei, J.; Chen, X.; Li, J.; Shao, Q. Multiple sources of uncertainties in satellite retrieval of terrestrial actual evapotranspiration. J. Hydrol. 2021, 601, 126642. [Google Scholar] [CrossRef]
  51. Isabelle, P.E.; Viens, L.; Nadeau, D.; Anctil, F.; Wang, J.; Maheu, A. Sensitivity analysis of the maximum entropy production method to model evaporation in boreal and temperate forests. Geophys. Res. Lett. 2021, 48, e2020GL091919. [Google Scholar] [CrossRef]
  52. Halim, M.A.; Chen, H.Y.; Thomas, S.C. Stand age and species composition effects on surface albedo in a mixedwood boreal forest. Biogeosciences 2019, 16, 4357–4375. [Google Scholar] [CrossRef]
  53. Wu, J.; Feng, Y.; Zheng, C.; Zeng, Z. Dense flux observations reveal the incapability of evapotranspiration products to capture the heterogeneity of evapotranspiration. J. Hydrol. 2023, 622, 129743. [Google Scholar] [CrossRef]
  54. Purdy, A.J.; Fisher, J.B.; Goulden, M.L.; Colliander, A.; Halverson, G.; Tu, K.; Famiglietti, J.S. SMAP soil moisture improves global evapotranspiration. Remote Sens. Environ. 2018, 219, 1–14. [Google Scholar] [CrossRef]
  55. Stettz, S.; Zaitchik, B.F.; Ademe, D.; Musie, S.; Simane, B. Estimating variability in downwelling surface shortwave radiation in a tropical highland environment. PLoS ONE 2019, 14, e0211220. [Google Scholar] [CrossRef] [PubMed]
  56. He, Y.; Wang, C.; Hu, J.; Mao, H.; Duan, Z.; Qu, C.; Li, R.; Wang, M.; Song, X. Discovering Optimal Triplets for Assessing the Uncertainties of Satellite-Derived Evapotranspiration Products. Remote Sens. 2023, 15, 3215. [Google Scholar] [CrossRef]
  57. Jongmin, P.; Jongjin, B.; Minha, C. Triple collocation-based multi-source evaporation and transpiration merging. Agric. For. Meteorol. 2023, 331, 109353. [Google Scholar]
  58. Jie, Y.; Qin, H.; Jia, B.; Tian, M.; Lou, S.; Liu, G.; Huang, Y. A multiscale attribution framework for separating the effects of cascade and individual reservoirs on runoff. Sci. Total Environ. 2024, 933, 172784. [Google Scholar] [CrossRef]
  59. Shahid, M.; Cong, Z.; Zhang, D. Understanding the impacts of climate change and human activities on streamflow: A case study of the Soan River basin, Pakistan. Theor. Appl. Climatol. 2018, 134, 205–219. [Google Scholar] [CrossRef]
  60. Li, X.; Zhang, W.; Vermeulen, A.; Dong, J.; Duan, Z. Triple collocation-based merging of multi-source gridded evapotranspiration data in the Nordic Region. Agric. For. Meteorol. 2023, 335, 109451. [Google Scholar]
  61. Sun, H.; Sun, X.; Chen, J.; Deng, X.; Yang, Y.; Qin, H.; Chen, F.; Zhang, W. Different types of meteorological drought and their impact on agriculture in Central China. J. Hydrol. 2023, 627, 130423. [Google Scholar]
  62. Ershadi, A.; McCabe, M.; Evans, J.; Wood, E.F. Impact of model structure and parameterization on Penman–Monteith type evaporation models. J. Hydrol. 2015, 525, 521–535. [Google Scholar] [CrossRef]
  63. Melo, D.; Anache, J.; Borges, V.; Miralles, D.; Martens, B.; Fisher, J.; Nóbrega, R.; Moreno, A.; Cabral, O.; Rodrigues, T. Are remote sensing evapotranspiration models reliable across South American ecoregions? Water Resour. Res. 2021, 57, e2020WR028752. [Google Scholar] [CrossRef]
  64. Michel, D.; Jiménez, C.; Miralles, D.G.; Jung, M.; Hirschi, M.; Ershadi, A.; Martens, B.; McCabe, M.F.; Fisher, J.B.; Mu, Q. The WACMOS-ET project–Part 1: Tower-scale evaluation of four remote-sensing-based evapotranspiration algorithms. Hydrol. Earth Syst. Sci. 2016, 20, 803–822. [Google Scholar] [CrossRef]
  65. Mu, Q.; Heinsch, F.A.; Zhao, M.; Running, S.W. Development of a global evapotranspiration algorithm based on MODIS and global meteorology data. Remote Sens. Environ. 2007, 111, 519–536. [Google Scholar] [CrossRef]
  66. Zhang, K.; Kimball, J.S.; Nemani, R.R.; Running, S.W. A continuous satellite-derived global record of land surface evapotranspiration from 1983 to 2006. Water Resour. Res. 2010, 46, W09522. [Google Scholar] [CrossRef]
  67. Rodell, M.; Houser, P.; Jambor, U.; Gottschalck, J.; Mitchell, K.; Meng, C.-J.; Arsenault, K.; Cosgrove, B.; Radakovich, J.; Bosilovich, M. The global land data assimilation system. Bull. Am. Meteorol. Soc. 2004, 85, 381–394. [Google Scholar] [CrossRef]
  68. Ezenne, G.I.; Eyibio, N.U.; Tanner, J.L.; Asoiro, F.U.; Obalum, S.E. An overview of uncertainties in evapotranspiration estimation techniques. J. Agrometeorol. 2023, 25, 173–182. [Google Scholar]
  69. Wenbin, Z.; Shengrong, T.; Jiaxing, W.; Shaofeng, J.; Zikun, S. Multi-scale evaluation of global evapotranspiration products derived from remote sensing images: Accuracy and uncertainty. J. Hydrol. 2022, 611, 127982. [Google Scholar]
  70. Gu, C.; Ma, J.; Zhu, G.; Yang, H.; Zhang, K.; Wang, Y.; Gu, C. Partitioning evapotranspiration using an optimized satellite-based ET model across biomes. Agric. For. Meteorol. 2018, 259, 355–363. [Google Scholar] [CrossRef]
  71. He, Y.; Yu, H.; Ozaki, A.; Dong, N.; Zheng, S. Influence of plant and soil layer on energy balance and thermal performance of green roof system. Energy 2017, 141, 1285–1299. [Google Scholar] [CrossRef]
  72. Lian, X.; Piao, S.; Huntingford, C.; Li, Y.; Zeng, Z.; Wang, X.; Ciais, P.; McVicar, T.R.; Peng, S.; Ottlé, C. Partitioning global land evapotranspiration using CMIP5 models constrained by observations. Nat. Clim. Chang. 2018, 8, 640–646. [Google Scholar] [CrossRef]
  73. Hobeichi, S.; Abramowitz, G.; Evans, J.; Ukkola, A. Derived Optimal Linear Combination Evapotranspiration (DOLCE): A global gridded synthesis ET estimate. Hydrol. Earth Syst. Sci. 2018, 22, 1317–1336. [Google Scholar] [CrossRef]
  74. Shao, X.; Zhang, Y.; Liu, C.; Chiew, F.H.; Tian, J.; Ma, N.; Zhang, X. Can indirect evaluation methods and their fusion products reduce uncertainty in actual evapotranspiration estimates? Water Resour. Res. 2022, 58, e2021WR031069. [Google Scholar] [CrossRef]
  75. Yao, Y.; Liang, S.; Li, X.; Chen, J.; Liu, S.; Jia, K.; Zhang, X.; Xiao, Z.; Fisher, J.B.; Mu, Q. Improving global terrestrial evapotranspiration estimation using support vector machine by integrating three process-based algorithms. Agric. For. Meteorol. 2017, 242, 55–74. [Google Scholar] [CrossRef]
  76. Wang, J.; Bras, R. A model of evapotranspiration based on the theory of maximum entropy production. Water Resour. Res. 2011, 47, W03521. [Google Scholar] [CrossRef]
  77. Wang, J.; Bras, R.L. A model of surface heat fluxes based on the theory of maximum entropy production. Water Resour. Res. 2009, 45, W11422. [Google Scholar] [CrossRef]
Figure 1. Flow chart of this study.
Remotesensing 16 02484 g001
Figure 2. Mean annual global actual evapotranspiration and latitudinal distribution from three gridded products. (ac) show the mean annual evapotranspiration from (a) GLEAM, (b) FLDAS, and (c) MEP. Note that the AET data for Greenland in GLEAM and FLDAS are missing.
Remotesensing 16 02484 g002
Figure 3. The correlation coefficient between AET product and the unknown truth estimated by ETC for (a) GLEAM, (b) FLDAS, and (c) MEP.
Remotesensing 16 02484 g003
Figure 4. The best-performing product according to (a) the correlation coefficient and (b) the error variation in each grid.
Remotesensing 16 02484 g004
Figure 5. The error variation (err, mm2/day2) and the estimated correlation coefficient (rho2) from ETC method between the truth and AET products (GLEAM, FLDAS, MEP) of different vegetation covers.
Remotesensing 16 02484 g005
Figure 6. Mean global annual actual evapotranspiration and latitudinal distribution from merged ET.
Remotesensing 16 02484 g006
Figure 7. In situ comparison of three gridded products and merged ET. Maps showing the difference in the Kling–Gupta efficiency (KGE) metric between three gridded products and merged ET, calculated using observations at flux tower sites in different geographical zones: North America (NA), Europe (EU), Asia (AS), and rest of the world (RW). (ac) show the KGE difference between (a) GLEAM, (b) FLDAS, and (c) MEP compared to merged ET. Blue (red) tones indicate an improvement (degradation) in merged ET compared to the respective gridded products.
Remotesensing 16 02484 g007
Figure 8. KGE of three gridded products and merged ET compared to in situ data under different vegetation covers.
Remotesensing 16 02484 g008
Figure 9. Multi-year average monthly mean of three products and merged ET under different vegetation covers.
Remotesensing 16 02484 g009
Figure 10. Comparison of the physical accuracy of GLEAM, FLDAS, MEP, and merged ET with flux tower measurements, assessed by (a) the coefficient of determination (R2), (b) the mean absolute error (MAE, mm/mon), (c) the root mean square error (RMSE, mm/mon), and (d) the similarity indicator (SI).
Remotesensing 16 02484 g010
Disclaimer/Publisher’s Note: The statements, opinions and data contained in all publications are solely those of the individual author(s) and contributor(s) and not of MDPI and/or the editor(s). MDPI and/or the editor(s) disclaim responsibility for any injury to people or property resulting from any ideas, methods, instructions or products referred to in the content.

