
Early Radiometric Assessment of NOAA-21 Visible Infrared Imaging Radiometer Suite Reflective Solar Bands Using Vicarious Techniques
 ,
,  , , and
Abstract
1. Introduction
2. Methodology
2.1. Calibration of RSBs
2.2. Vicarious Approaches
2.3. Correction for Spectral Differences
3. Results
3.1. Libya-4
3.2. DCC
3.3. Dome C
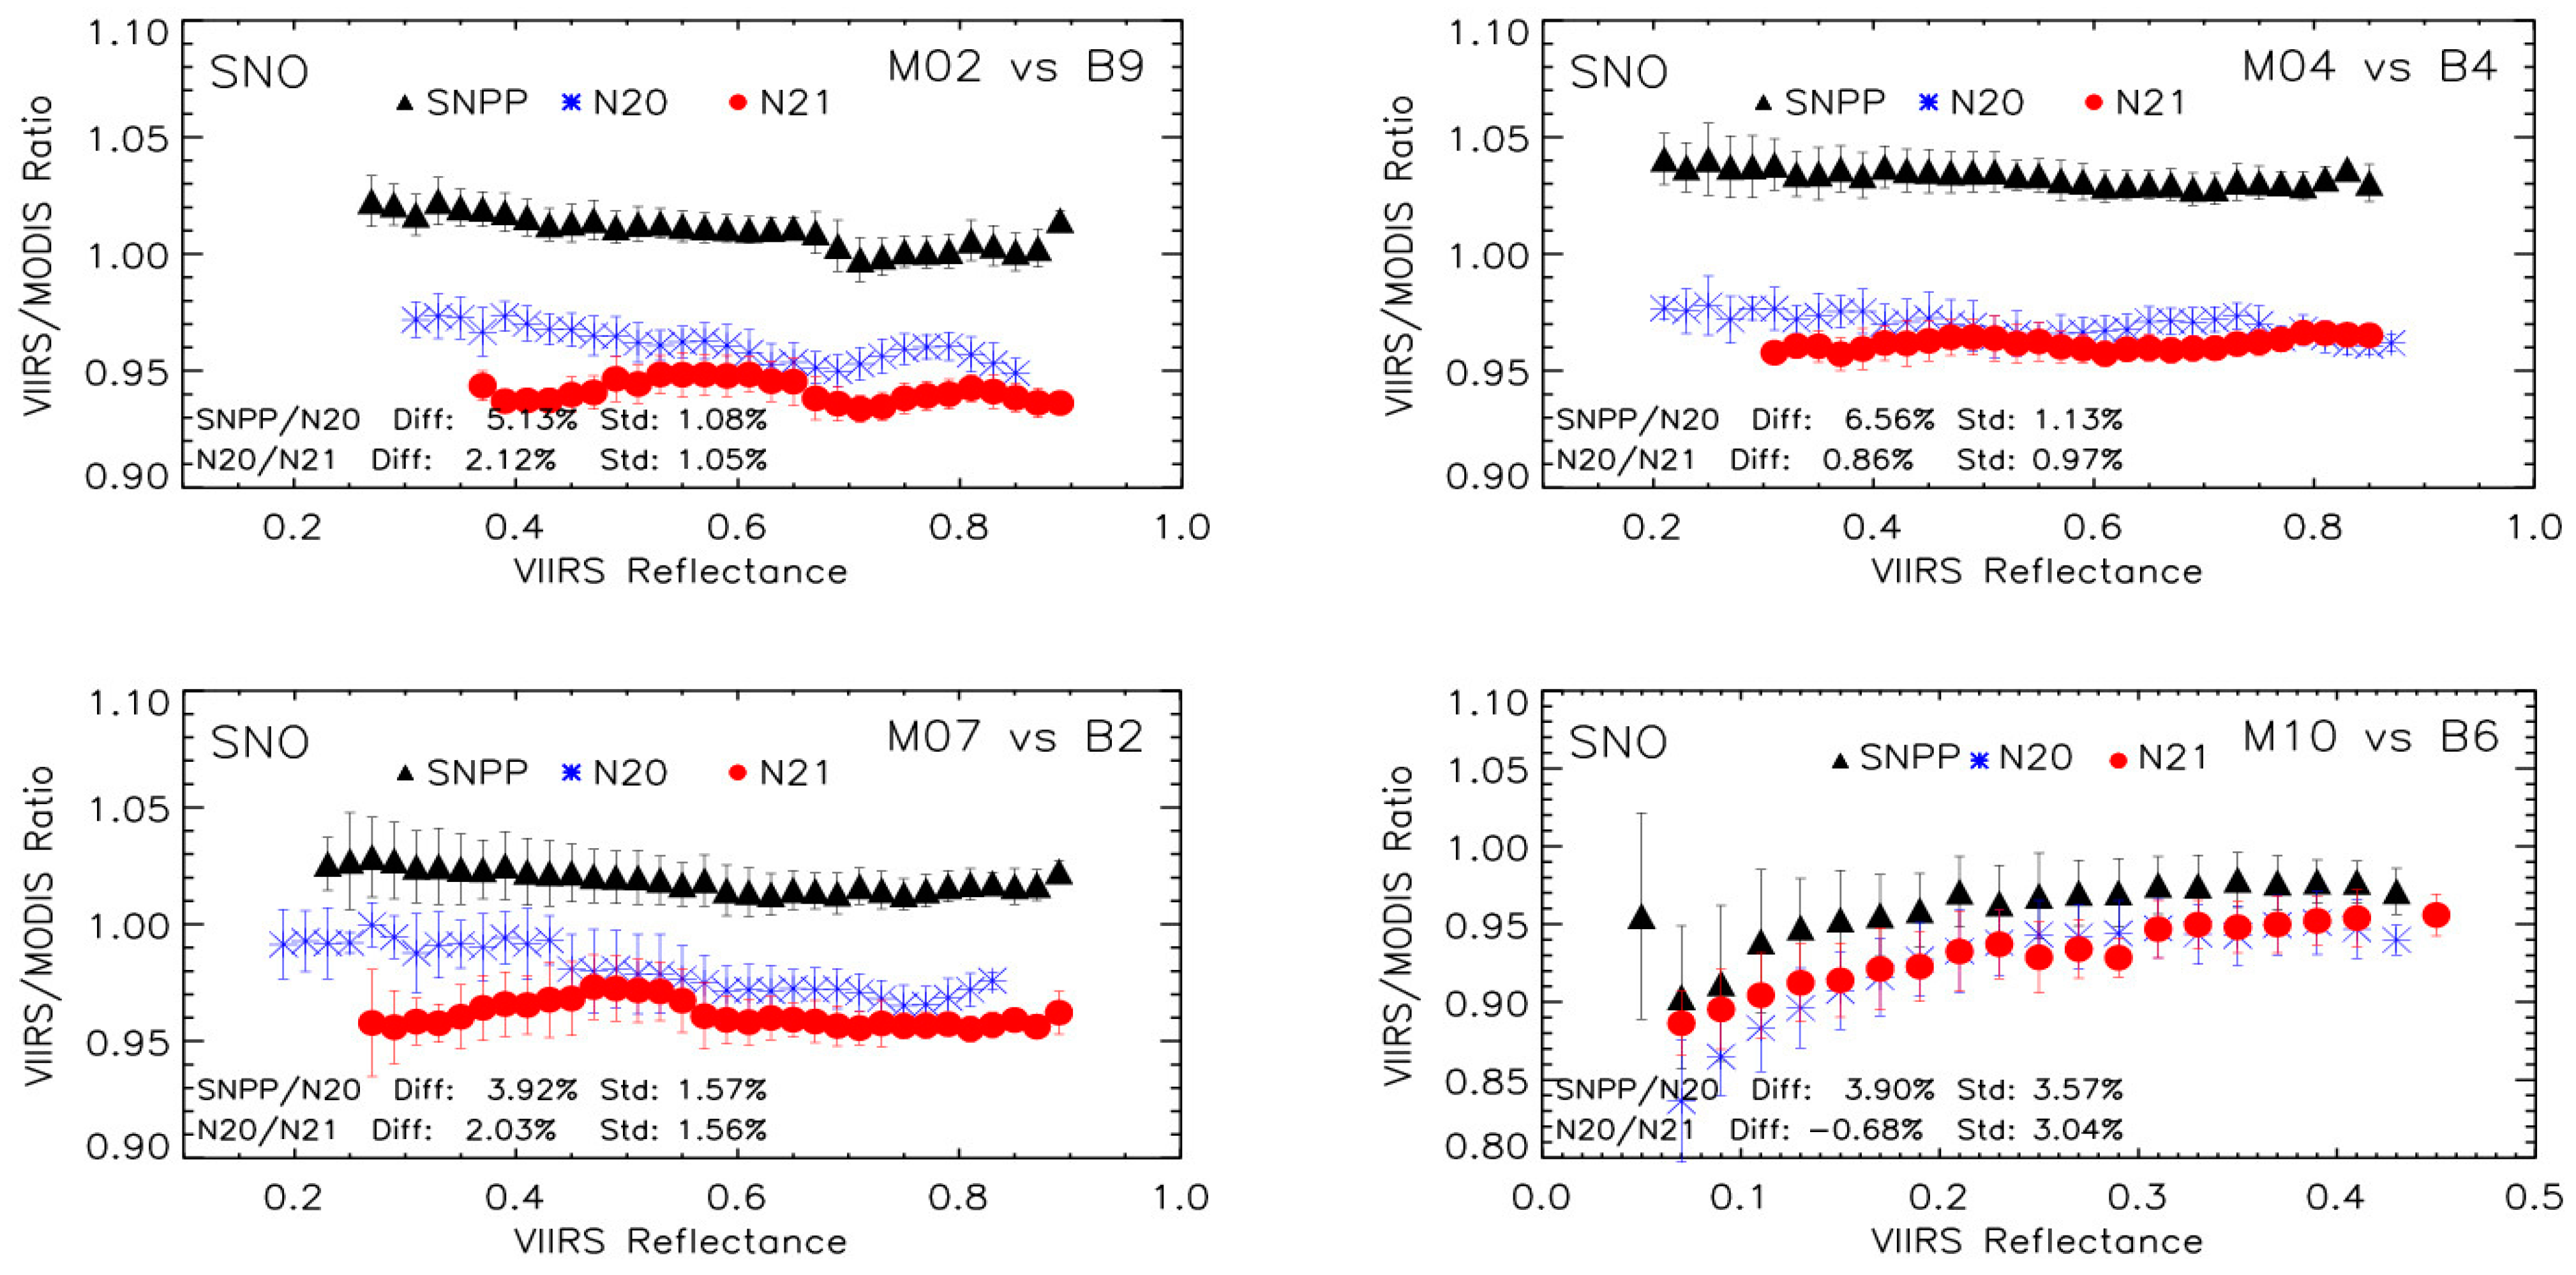
3.4. SNO
4. Discussion
5. Conclusions
Author Contributions
Funding
Data Availability Statement
Conflicts of Interest
References
- Murphy, R.P.; Ardanuy, P.E.; De Luccia, F.; Clement, J.E.; Schueler, C. The visible infrared imaging radiometer suite. In Earth Science Satellite Remote Sensing; Springer: New York, NY, USA, 2006; Volume 1, pp. 199–223. [Google Scholar]
- Salomonson, V.; Barnes, W.L.; Maymon, P.W.; Montgomery, H.E.; Ostrow, H. MODIS: Advanced facility instrument for studies of the Earth as a system. IEEE Trans. Geosci. Remote Sens. 1989, 27, 145–153. [Google Scholar] [CrossRef]
- Barnes, W.L.; Salomonson, V.V. MODIS: A global image spectroradiometer for the Earth Observing System. Crit. Rev. Opt. Sci. Technol. 1993, CR47, 285–307. [Google Scholar]
- Rao, C.R.N.; Chen, J. Inter-satellite calibration linkages for the visible and near-infrared channels of the Advanced Very High Resolution Radiometer on the NOAA-7, -9, and -11 spacecraft. Int. J. Remote Sens. 1995, 16, 1931–1942. [Google Scholar]
- Thome, K.; Biggar, S.; Choi, H.J. Vicarious calibration of Terra ASTER, MISR, and MODIS. In Proceedings of the Earth Observing Systems IX, Denver, CO, USA, 2–6 August 2004; Volume 5542, pp. 290–299. [Google Scholar]
- Chander, G.; Xiong, X.; Choi, T.; Angal, A. Monitoring on-orbit calibration stability of the Terra MODIS and Landsat 7 ETM+ sensors using pseudo-invariant test sites. Remote Sens. Environ. 2010, 114, 925–939. [Google Scholar] [CrossRef]
- Angal, A.; Xiong, X.; Choi, T.; Chander, G.; Wu, A. Using the Sonoran and Libyan Desert Test Sites to monitor the temporal stability of reflective solar bands for Landsat 7 ETM+ and Terra MODIS Sensors. J. Appl. Remote Sens. 2010, 4, 043525. [Google Scholar]
- Cao, C.; Weinreb, M.; Xu, H. Predicting simultaneous nadir overpasses among polar-orbiting meteorological satellites for the intersatellite calibration of radiometers. J. Atmos. Ocean. Technol. 2004, 21, 537–542. [Google Scholar] [CrossRef]
- Wu, A.; Xiong, X.; Doelling, D.R.; Morstad, D.; Angal, A.; Bhatt, R. Characterization of Terra and Aqua MODIS VIS, NIR, and SWIR Spectral Bands’ Calibration Stability. IEEE Trans. Geosci. Remote Sens. 2012, 51, 4330–4338. [Google Scholar] [CrossRef]
- Wu, A.; Xiong, X.; Bhatt, R.; Haney, C.; Doelling, D.R.; Angal, A.; Mu, Q. An Assessment of SNPP and NOAA20 VIIRS RSB Calibration Performance in NASA SIPS Reprocessed Collection-2 L1B Data Products. Remote Sens. 2022, 14, 4134. [Google Scholar] [CrossRef]
- Xiong, X.; Angal, A.; Chang, T.; Chiang, K.; Lei, N.; Li, Y.; Sun, J.; Twedt, K.; Wu, A. MODIS and VIIRS Calibration and Characterization in Support of Producing Long-Term High-Quality Data Products. Remote Sens. 2020, 12, 3167. [Google Scholar] [CrossRef]
- Uprety, S.; Cao, C.; Shao, X. Radiometric consistency between GOES-16 ABI and VIIRS on Suomi NPP and NOAA-20. J. Appl. Remote Sens. 2020, 14, 032407. [Google Scholar] [CrossRef]
- Wang, W.; Cao, C. Evaluation of NOAA-20 VIIRS Reflective Solar Bands Early On-Orbit Performance Using Daily Deep Convective Clouds Recent Improvements. IEEE J. Sel. Top. Appl. Earth Obs. Remote Sens. 2020, 13, 3975–3985. [Google Scholar] [CrossRef]
- Shea, Y.; Fleming, G.; Kopp, G.; Lukashin, C.; Pilewskie, P.; Smith, P.; Thome, K.; Wielicki, B.; Liu, X.; Wu, W. Clarreo Pathfinder: Mission Overview and Current Status. In Proceedings of the IGARSS 2020—2020 IEEE International Geoscience and Remote Sensing Symposium, Waikoloa, HI, USA, 26 September–2 October 2020; pp. 3286–3289. [Google Scholar] [CrossRef]
- Wielicki, B.A.; Young, D.F.; Mlynczak, M.G.; Thome, K.J.; Leroy, S.; Corliss, J.; Anderson, J.G.; Ao, C.O.; Bantges, R.; Best, F.; et al. Achieving climate change absolute accuracy in orbit. Bull. Am. Meteorol. Soc. 2013, 94, 1519–1539. [Google Scholar] [CrossRef]
- VIIRS.1 NASA Goddard Space Flight Center. Joint Polar Satellite System (JPSS) VIIRS Radiometric Calibration Algorithm Theoretical Basis Document (ATBD); NASA Goddard Space Flight Center: Greenbelt, MA, USA, 2013. [Google Scholar]
- Lei, N.; Wang, Z.; Xiong, X. On-orbit Radiometric Calibration of Suomi NPP VIIRS Reflective Solar Bands through Observations of a Sunlit Solar Diffuser Panel. IEEE Trans. Geosci. Remote Sens. 2015, 53, 5983–5990. [Google Scholar] [CrossRef]
- Xiong, X.; Sun, J.; Fulbright, J.; Wang, Z.; Butler, J. Lunar Calibration and Performance for S-NPP VIIRS Reflective Solar Bands. IEEE Trans. Geosci. Remote Sens. 2016, 54, 1052–1061. [Google Scholar] [CrossRef]
- Xiong, X.; Angal, A.; Sun, J.; Lei, N.; Twedt, K.; Chen, H.; Chiang, K.F. An overview of NOAA-21 VIIRS early on-orbit calibration and performance. In Proceedings of the Sensors, Systems, and Next-Generation Satellites XXVII, Amsterdam, The Netherlands, 3–7 September 2023; Volume 1272916, pp. 308–317. [Google Scholar] [CrossRef]
- Lei, N.; Xiong, X.; Twedt, K.; Angal, A.; Li, S.; Sun, J. Early mission performance of NOAA-21 VIIRS reflective solar bands. In Proceedings Volume 12685, Earth Observing Systems XXVIII; SPIE Optical Engineering + Applications: San Diego, CA, USA, 2003. [Google Scholar] [CrossRef]
- Cosnefroy, H.; Leroy, M.; Briottet, X. Selection and characterization of Saharan and Arabian desert sites for the calibration of optical satellite sensors. Remote Sens. Environ. 1996, 58, 101–114. [Google Scholar] [CrossRef]
- Doelling, D.R.; Morstad, D.; Scarino, B.R.; Bhatt, R.; Gopalan, A. The Characterization of Deep Convective Clouds as an Invariant Calibration Target and as a Visible Calibration Technique. IEEE Trans. Geosci. Remote Sens. 2013, 51, 1147–1159. [Google Scholar] [CrossRef]
- Bhatt, R.; Doelling, D.R.; Angal, A.; Xiong, X.; Haney, C.; Scarino, B.R.; Wu, A.; Gopalan, A. Response Versus Scan-Angle Assessment of MODIS Reflective Solar Bands in Collection 6.1 Calibration. IEEE Trans. Geosci. Remote Sens. 2020, 58, 2276–2289. [Google Scholar] [CrossRef]
- Bhatt, R.; Doelling, D.R.; Scarino, B.; Haney, C.; Gopalan, A. Development of Seasonal BRDF Models to Extend the Use of Deep Convective Clouds as Invariant Targets for Satellite SWIR-Band Calibration. Remote Sens. 2017, 9, 1061. [Google Scholar] [CrossRef]
- Six, D.; Fily, M.; Alvain, S.; Henry, P.; Benoist, J.-P. Surface characterization of the dome concordia area (Antarctica) as a potential satellite calibration site using spot 4/vegetation instrument. Remote Sens. Environ. 2004, 89, 83–94. [Google Scholar] [CrossRef]
- Gottwald, M.; Bovensmann, H. SCIAMACHY—Exploring the Changing Earth’s Atmosphere; Springer: New York, NY, USA, 2011. [Google Scholar]
- Scarino, B.R.; Doelling, D.R.; Minnis, P.; Gopalan, A.; Chee, T.; Bhatt, R.; Lukashin, C.; Haney, C. A Web-Based Tool for Calculating Spectral Band Difference Adjustment Factors Derived from SCIAMACHY Hyperspectral Data. IEEE Trans. Geosci. Remote Sens. 2016, 54, 2529–2542. [Google Scholar] [CrossRef]
- Mu, Q.; Wu, A.; Xiong, X.; Doelling, D.R.; Angal, A.; Chang, T.; Bhatt, R. Optimization of a Deep Convective Cloud Technique in Evaluating the Long-Term Radiometric Stability of MODIS Reflective Solar Bands. Remote Sens. 2017, 9, 535. [Google Scholar] [CrossRef]
- Doelling, D.R.; Bhatt, R.; Scarino, B.R.; Gopalan, A.; Rutan, D.; Scott, R.; Haney, C.O. Additional characterization of Dome-C to improve its use as an invariant visible calibration target. In Earth Observing Systems XXVI; International Society for Optics and Photonics: Bellingham, WA, USA, 2021; p. 118290D. [Google Scholar] [CrossRef]
- Lei, N.; Xiong, X. Products of the SNPP VIIRS SD Screen Transmittance and the SD BRDFs from Both Yaw Maneuver and Regular On-orbit Data. IEEE Trans. Geosci. Remote Sens. 2017, 55, 1975–1987. [Google Scholar] [CrossRef]
- Bhatt, R.; Shea, Y.; Wu, W.; Yang, Q.; Goldin, D.; Sun, W.; Little, M.; Liu, X.; Smith, N.; Lukashin, C. CLARREO Pathfinder as a SI-traceable reference for satellite intercalibration. In Earth Observing Systems XXVIII; SPIE Optical Engineering + Applications: San Diego, CA, USA, 2023; Volume 12685, p. 1268507. [Google Scholar] [CrossRef]


| Band | Wavelength (µm) | Bandwidth (µm) | Gain Mode | Primary Use |
|---|---|---|---|---|
| I1 | 0.64 | 0.08 | Single | Imagery |
| I2 | 0.865 | 0.039 | Single | Imagery |
| I3 | 1.61 | 0.06 | Single | Imagery |
| M1 | 0.412 | 0.02 | Low/High | Ocean color, aerosol |
| M2 | 0.445 | 0.018 | Low/High | Ocean color, aerosol |
| M3 | 0.488 | 0.02 | Low/High | Ocean color, aerosol |
| M4 | 0.555 | 0.02 | Low/High | Ocean color, aerosol |
| M5 | 0.672 | 0.02 | Low/High | Ocean color, aerosol |
| M6 | 0.746 | 0.015 | Single | Atmospheric correction |
| M7 | 0.865 | 0.039 | Low/High | Ocean color, aerosol |
| M8 | 1.24 | 0.02 | Single | Cloud particle size |
| M9 | 1.378 | 0.015 | Single | Cirrus/Cloud cover |
| M10 | 1.61 | 0.06 | Single | Snow fraction |
| M11 | 2.25 | 0.05 | Single | Clouds |
| Band | M1 | M2 | M3 | M4 | M5 | M7 | M8 | M9 | M10 | M11 | I1 | I2 | I3 |
|---|---|---|---|---|---|---|---|---|---|---|---|---|---|
| Libya-4 | 7.85 ±1.25 | 6.16 ±1.32 | 4.22 ±1.40 | 3.20 ±1.21 | 4.47 ±0.87 | 2.67 ±1.10 | 2.44 ±1.25 | NA | 1.75 ±0.75 | 1.50 ±2.18 | 2.74 ±1.22 | 2.59 ±1.08 | 3.00 ±0.76 |
| DCC | 6.73 ±1.36 | 5.27 ±1.24 | 5.32 ±1.17 | 5.38 ±1.32 | 4.95 ±1.22 | 3.93 ±0.97 | 1.80 ±0.75 | 0.74 ±2.78 | 2.61 ±2.68 | 1.85 ±1.97 | 4.56 ±1.21 | 4.4 ±0.92 | 4.13 ±2.62 |
| Dome C | 7.99 ±1.30 | 6.42 ±1.15 | 4.73 ±1.48 | 4.51 ±3.38 | 4.88 ±2.33 | 2.17 ±2.49 | NA | NA | NA | NA | 3.01 ±3.25 | 2.42 ±2.50 | NA |
| SNO | 6.87 ±2.06 | 5.72 ±1.20 | 3.74 ±1.39 | 4.59 ±0.76 | 4.35 ±2.03 | 2.77 ±1.43 | 2.98 ±1.50 | NA | 2.93 ±3.27 | NA | 2.27 ±1.01 | 2.49 ±1.42 | 3.81 ±3.27 |
| Band | M1 | M2 | M3 | M4 | M5 | M7 | M8 | M9 | M10 | M11 | I1 | I2 | I3 |
|---|---|---|---|---|---|---|---|---|---|---|---|---|---|
| Libya4 | 0.90 ±1.16 | 1.37 ±1.45 | 1.29 ±1.49 | 0.91 ±1.10 | −0.36 ±0.95 | 0.91 ±1.10 | 3.06 ±1.15 | NA | 4.62 ±0.82 | 2.05 ±2.23 | −0.46 ±1.28 | 0.51 ±1.09 | 2.34 ±0.88 |
| DCC | 0.79 ±1.05 | 1.17 ±1.23 | 0.62 ±1.08 | −2.23 ±1.04 | −1.18 ±1.05 | 0.31 ±0.75 | 2.47 ±0.79 | 1.86 ±2.31 | 2.97 ±2.50 | −0.24 ±1.99 | −0.93 ±1.06 | −0.42 ±0.82 | 0.74 ±2.59 |
| Dome C | 3.83 ±1.02 | 4.28 ±1.24 | 1.46 ±1.48 | −0.81 ±3.48 | 0.47 ±2.39 | −0.99 ±2.38 | NA | NA | NA | −0.81 ±3.23 | −1.10 ±2.40 | NA | |
| SNO | 1.80 ±2.28 | 2.11 ±1.24 | 1.64 ±1.52 | 1.11 ±0.85 | −0.10 ±1.98 | 1.21 ±1.59 | 1.09 ±1.68 | NA | 3.33 ±2.60 | NA | 0.59 ±1.08 | 1.19 ±1.58 | 2.73 ±2.43 |
Disclaimer/Publisher’s Note: The statements, opinions and data contained in all publications are solely those of the individual author(s) and contributor(s) and not of MDPI and/or the editor(s). MDPI and/or the editor(s) disclaim responsibility for any injury to people or property resulting from any ideas, methods, instructions or products referred to in the content. |
© 2024 by the authors. Licensee MDPI, Basel, Switzerland. This article is an open access article distributed under the terms and conditions of the Creative Commons Attribution (CC BY) license (https://creativecommons.org/licenses/by/4.0/).
Share and Cite
Wu, A.; Xiong, X.; Mu, Q.; Angal, A.; Bhatt, R.; Shea, Y. Early Radiometric Assessment of NOAA-21 Visible Infrared Imaging Radiometer Suite Reflective Solar Bands Using Vicarious Techniques. Remote Sens. 2024, 16, 2528. https://doi.org/10.3390/rs16142528
Wu A, Xiong X, Mu Q, Angal A, Bhatt R, Shea Y. Early Radiometric Assessment of NOAA-21 Visible Infrared Imaging Radiometer Suite Reflective Solar Bands Using Vicarious Techniques. Remote Sensing. 2024; 16(14):2528. https://doi.org/10.3390/rs16142528
Chicago/Turabian StyleWu, Aisheng, Xiaoxiong Xiong, Qiaozhen Mu, Amit Angal, Rajendra Bhatt, and Yolanda Shea. 2024. "Early Radiometric Assessment of NOAA-21 Visible Infrared Imaging Radiometer Suite Reflective Solar Bands Using Vicarious Techniques" Remote Sensing 16, no. 14: 2528. https://doi.org/10.3390/rs16142528
APA StyleWu, A., Xiong, X., Mu, Q., Angal, A., Bhatt, R., & Shea, Y. (2024). Early Radiometric Assessment of NOAA-21 Visible Infrared Imaging Radiometer Suite Reflective Solar Bands Using Vicarious Techniques. Remote Sensing, 16(14), 2528. https://doi.org/10.3390/rs16142528