
Evaluation of VIIRS Thermal Emissive Bands Long-Term Calibration Stability and Inter-Sensor Consistency Using Radiative Transfer Modeling

 , , , , and
Abstract
:1. Introduction
2. Materials and Methods
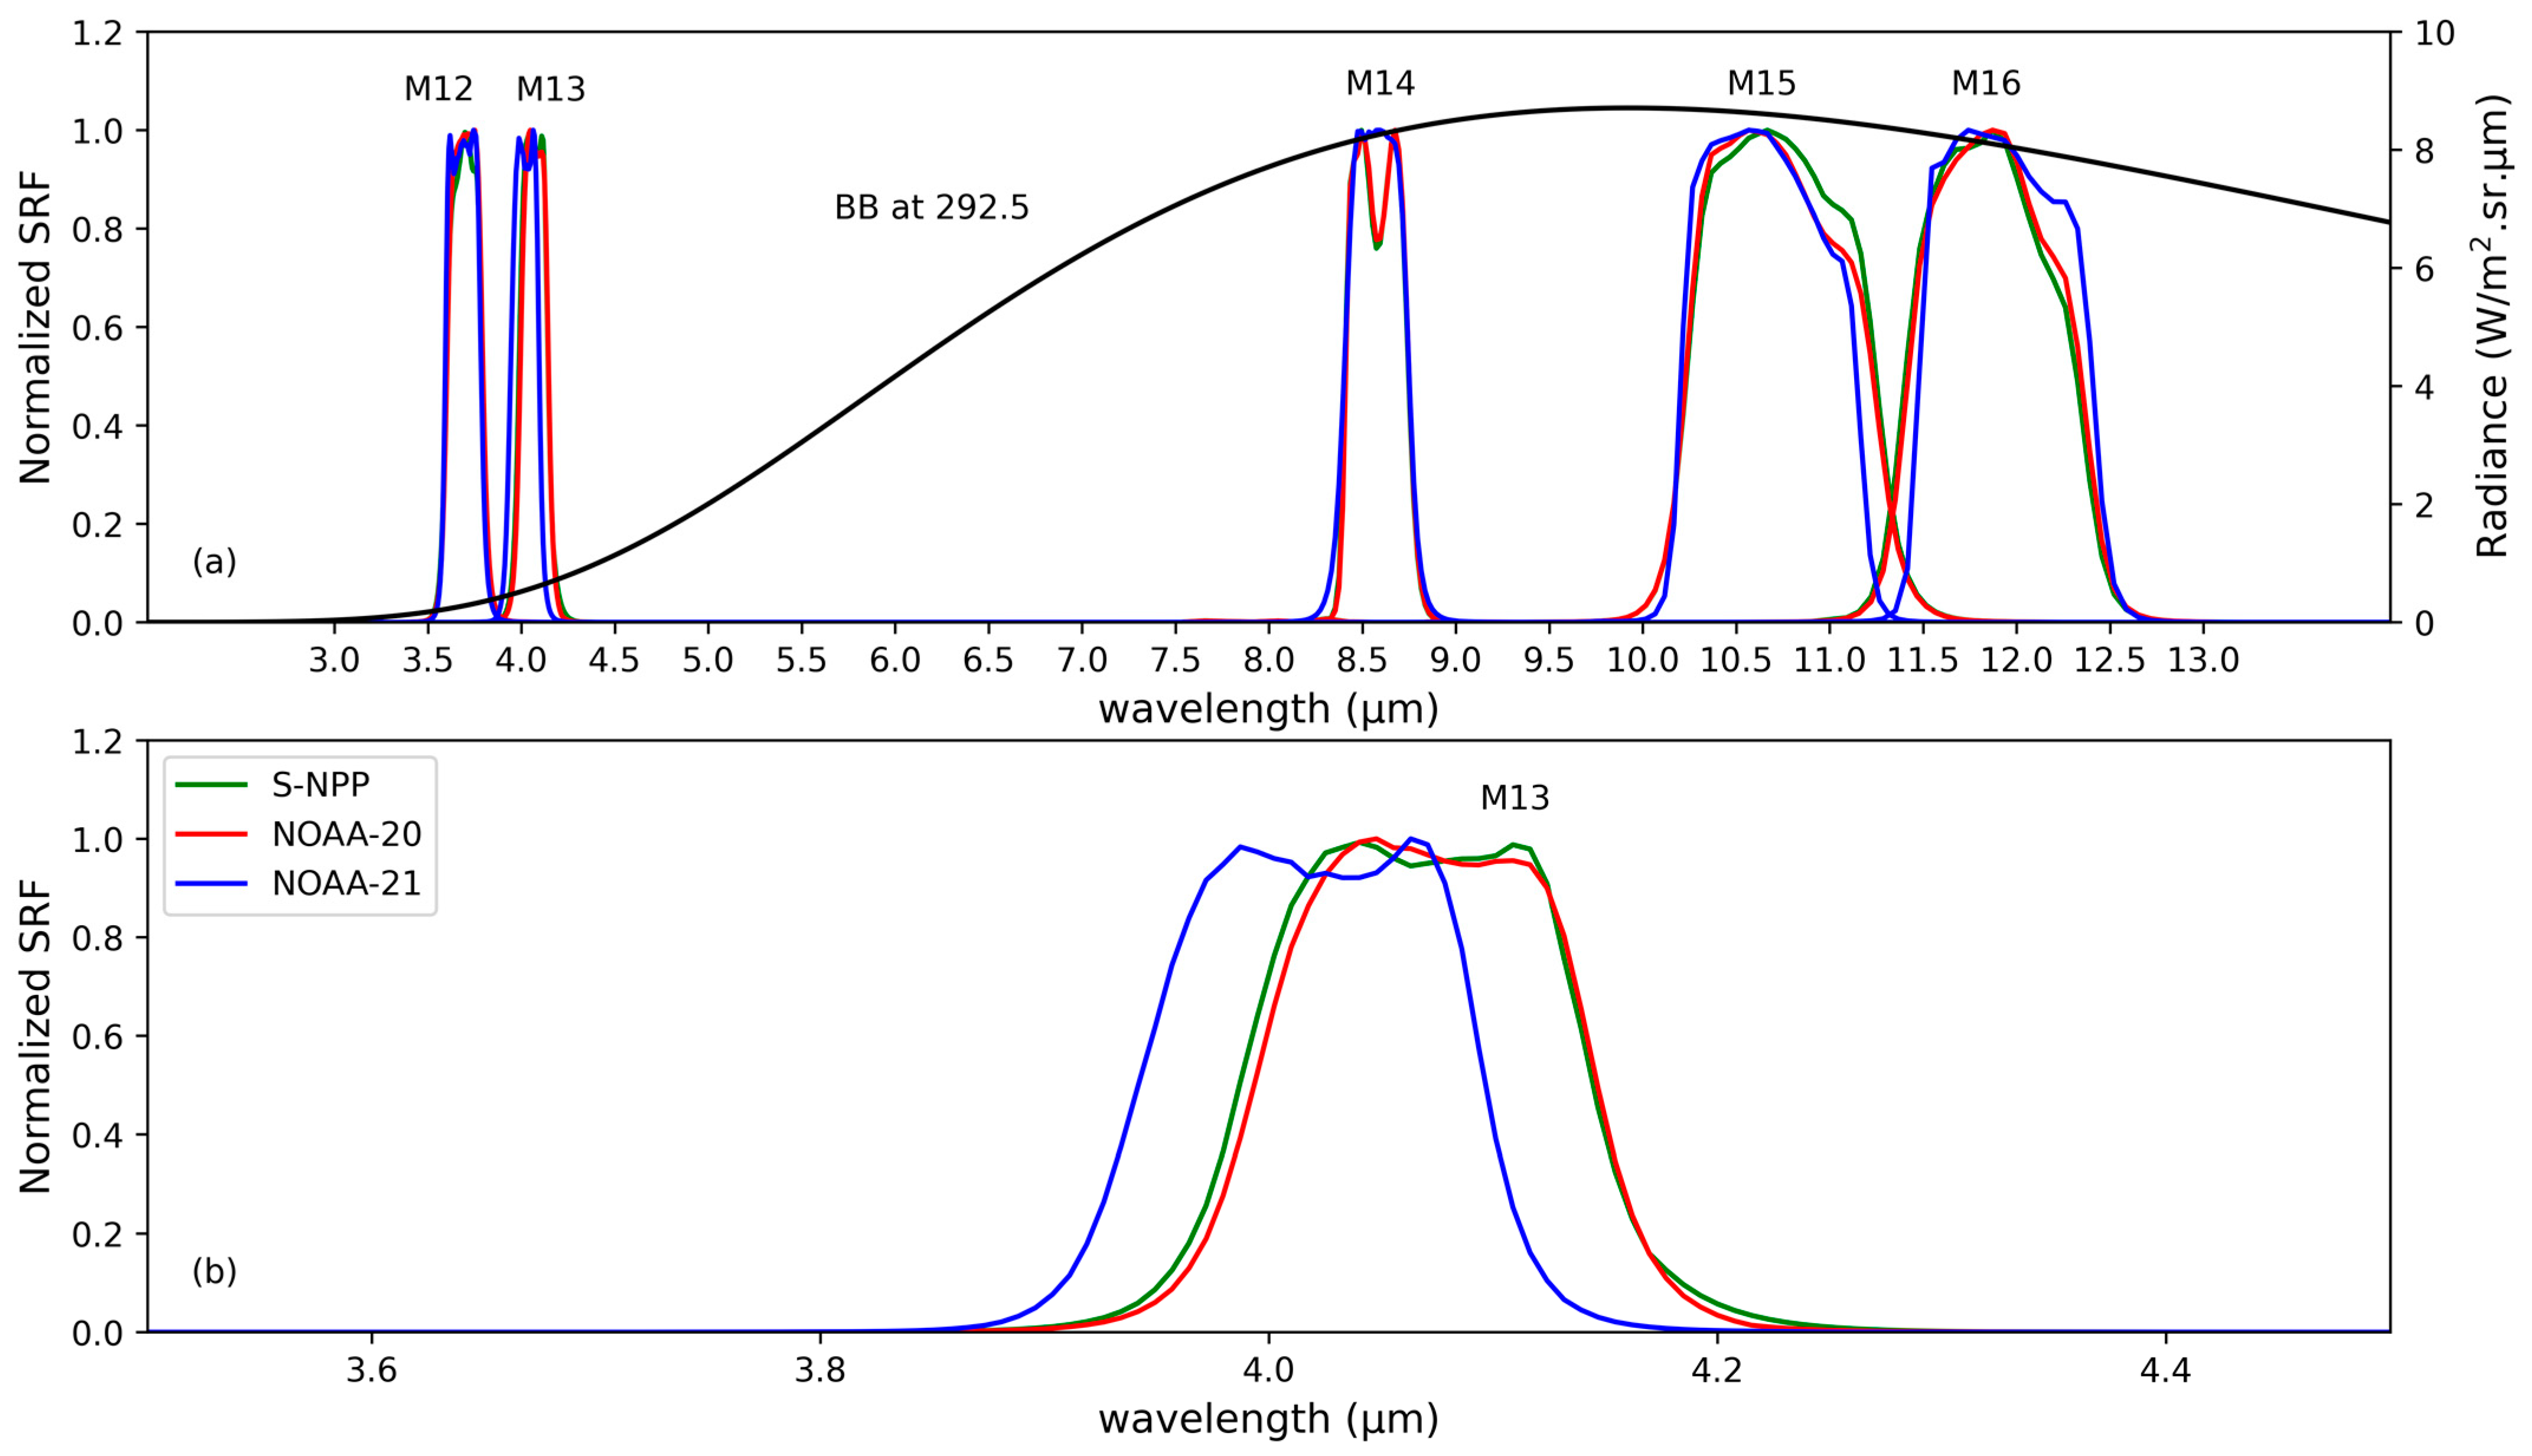
2.1. VIIRS Thermal Emissive Band Calibration and Characteristics
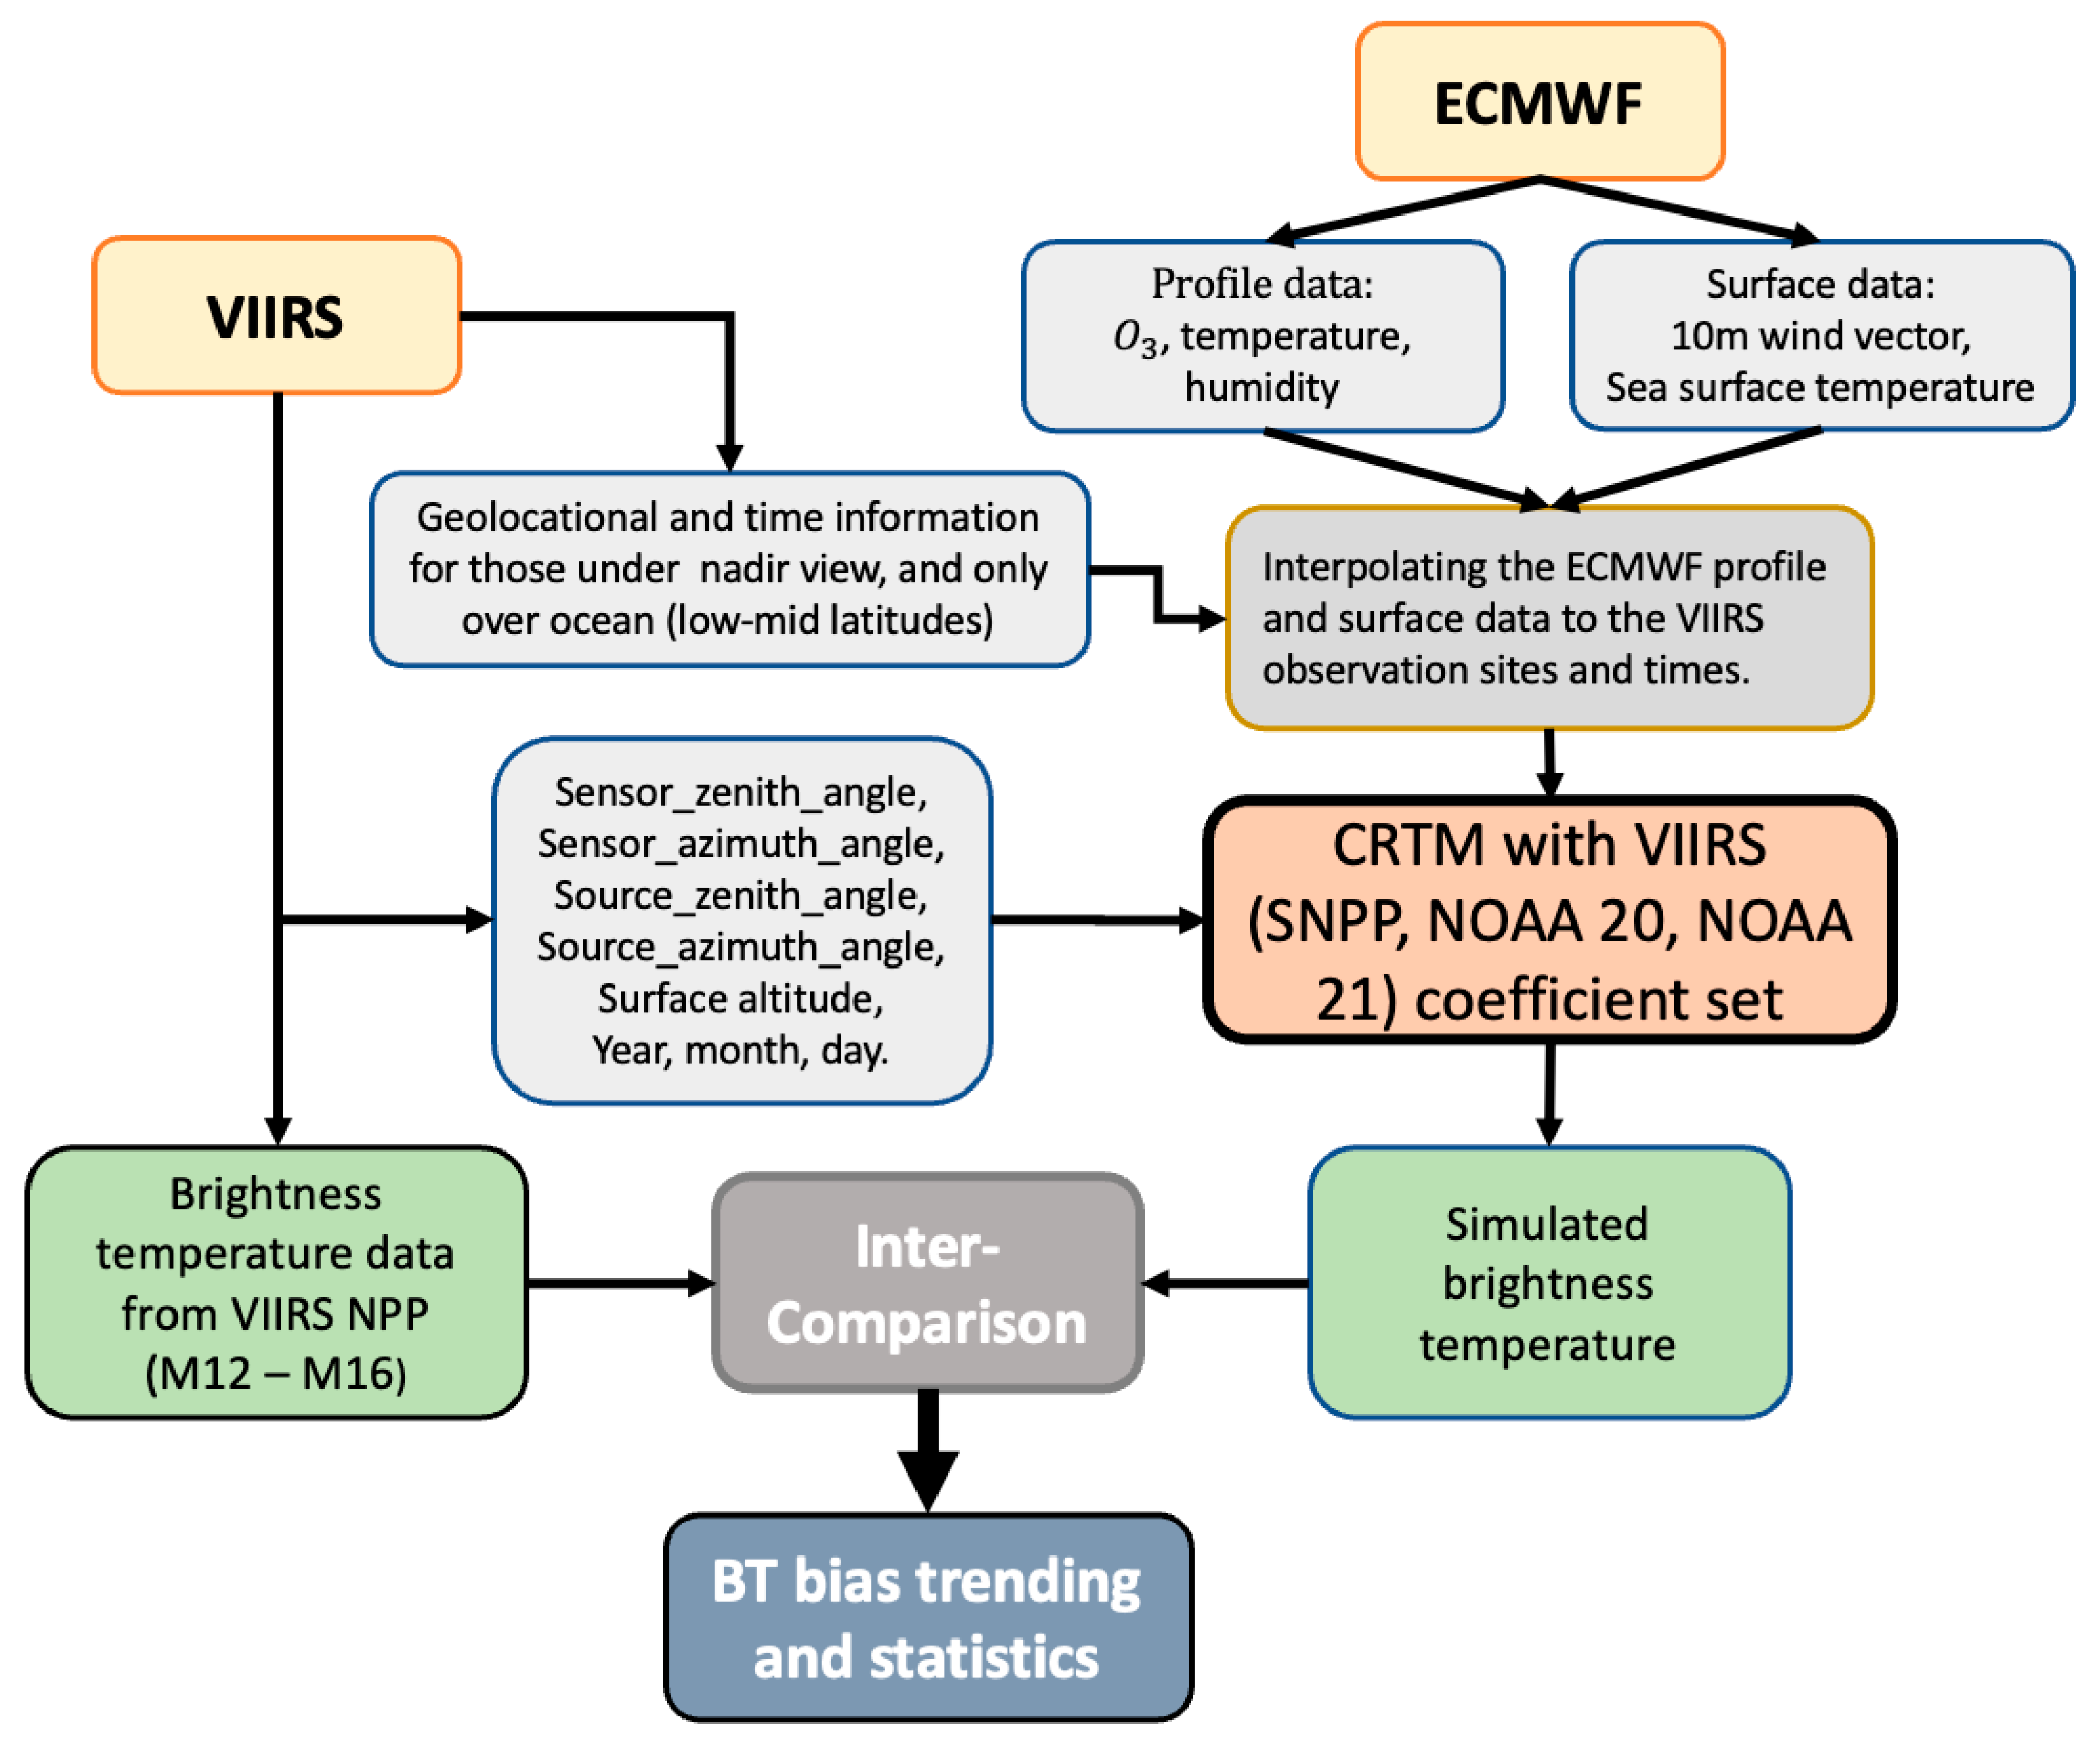
2.2. CRTM Radiative Transfer Modeling
2.3. Scene Target Selection
2.4. Task Summary
- Long-Term VIIRS stability evaluation (2012–2020):
- Objective: To assess the long-term stability of the NOAA STAR version 2 reprocessed S-NPP VIIRS M TEB data [5].
- Time Frame: February 2012 to August 2020.
- Data Collection: the reprocessed S-NPP data “https://www.aev.class.noaa.gov/saa/products/search?sub_id=0&datatype_family=RPVIIRSSDR&submit.x=26&submit.y=12 (accessed on 1 April 2023)”, ECMWF surface reanalysis data “https://cds.climate.copernicus.eu/cdsapp#!/dataset/reanalysis-era5-single-levels?tab=form (accessed on 1 April 2023)”, and ECMWF pressure-level reanalysis data “https://cds.climate.copernicus.eu/cdsapp#!/dataset/reanalysis-era5-pressure-levels?tab=form (accessed on 1 April 2023)” were collected on the 15th day of each month during this timeframe.
- Methodology: Monthly O-B ∆BT calculations were analyzed.
- Inter-VIIRS data consistency analysis (since 18 March 2023):
- Objective: To analyze the inter-sensor consistency of M-TEB data across three VIIRS instruments: S-NPP, NOAA-20, and NOAA-21, each named after the satellite it is aboard.
- Time Frame: from 18 March 2023 to 30 November 2023.
- Data Collection: Daily operational data for S-NPP/NOAA-21/NOAA-20 “https://www.aev.class.noaa.gov/saa/products/search?sub_id=0&datatype_family=VIIRS_SDR&submit.x=22&submit.y=6 (accessed on 1 April 2023)”, and 6-h ECMWF reanalysis surface and pressure-level data (The links are the same as before) were collected during this period.
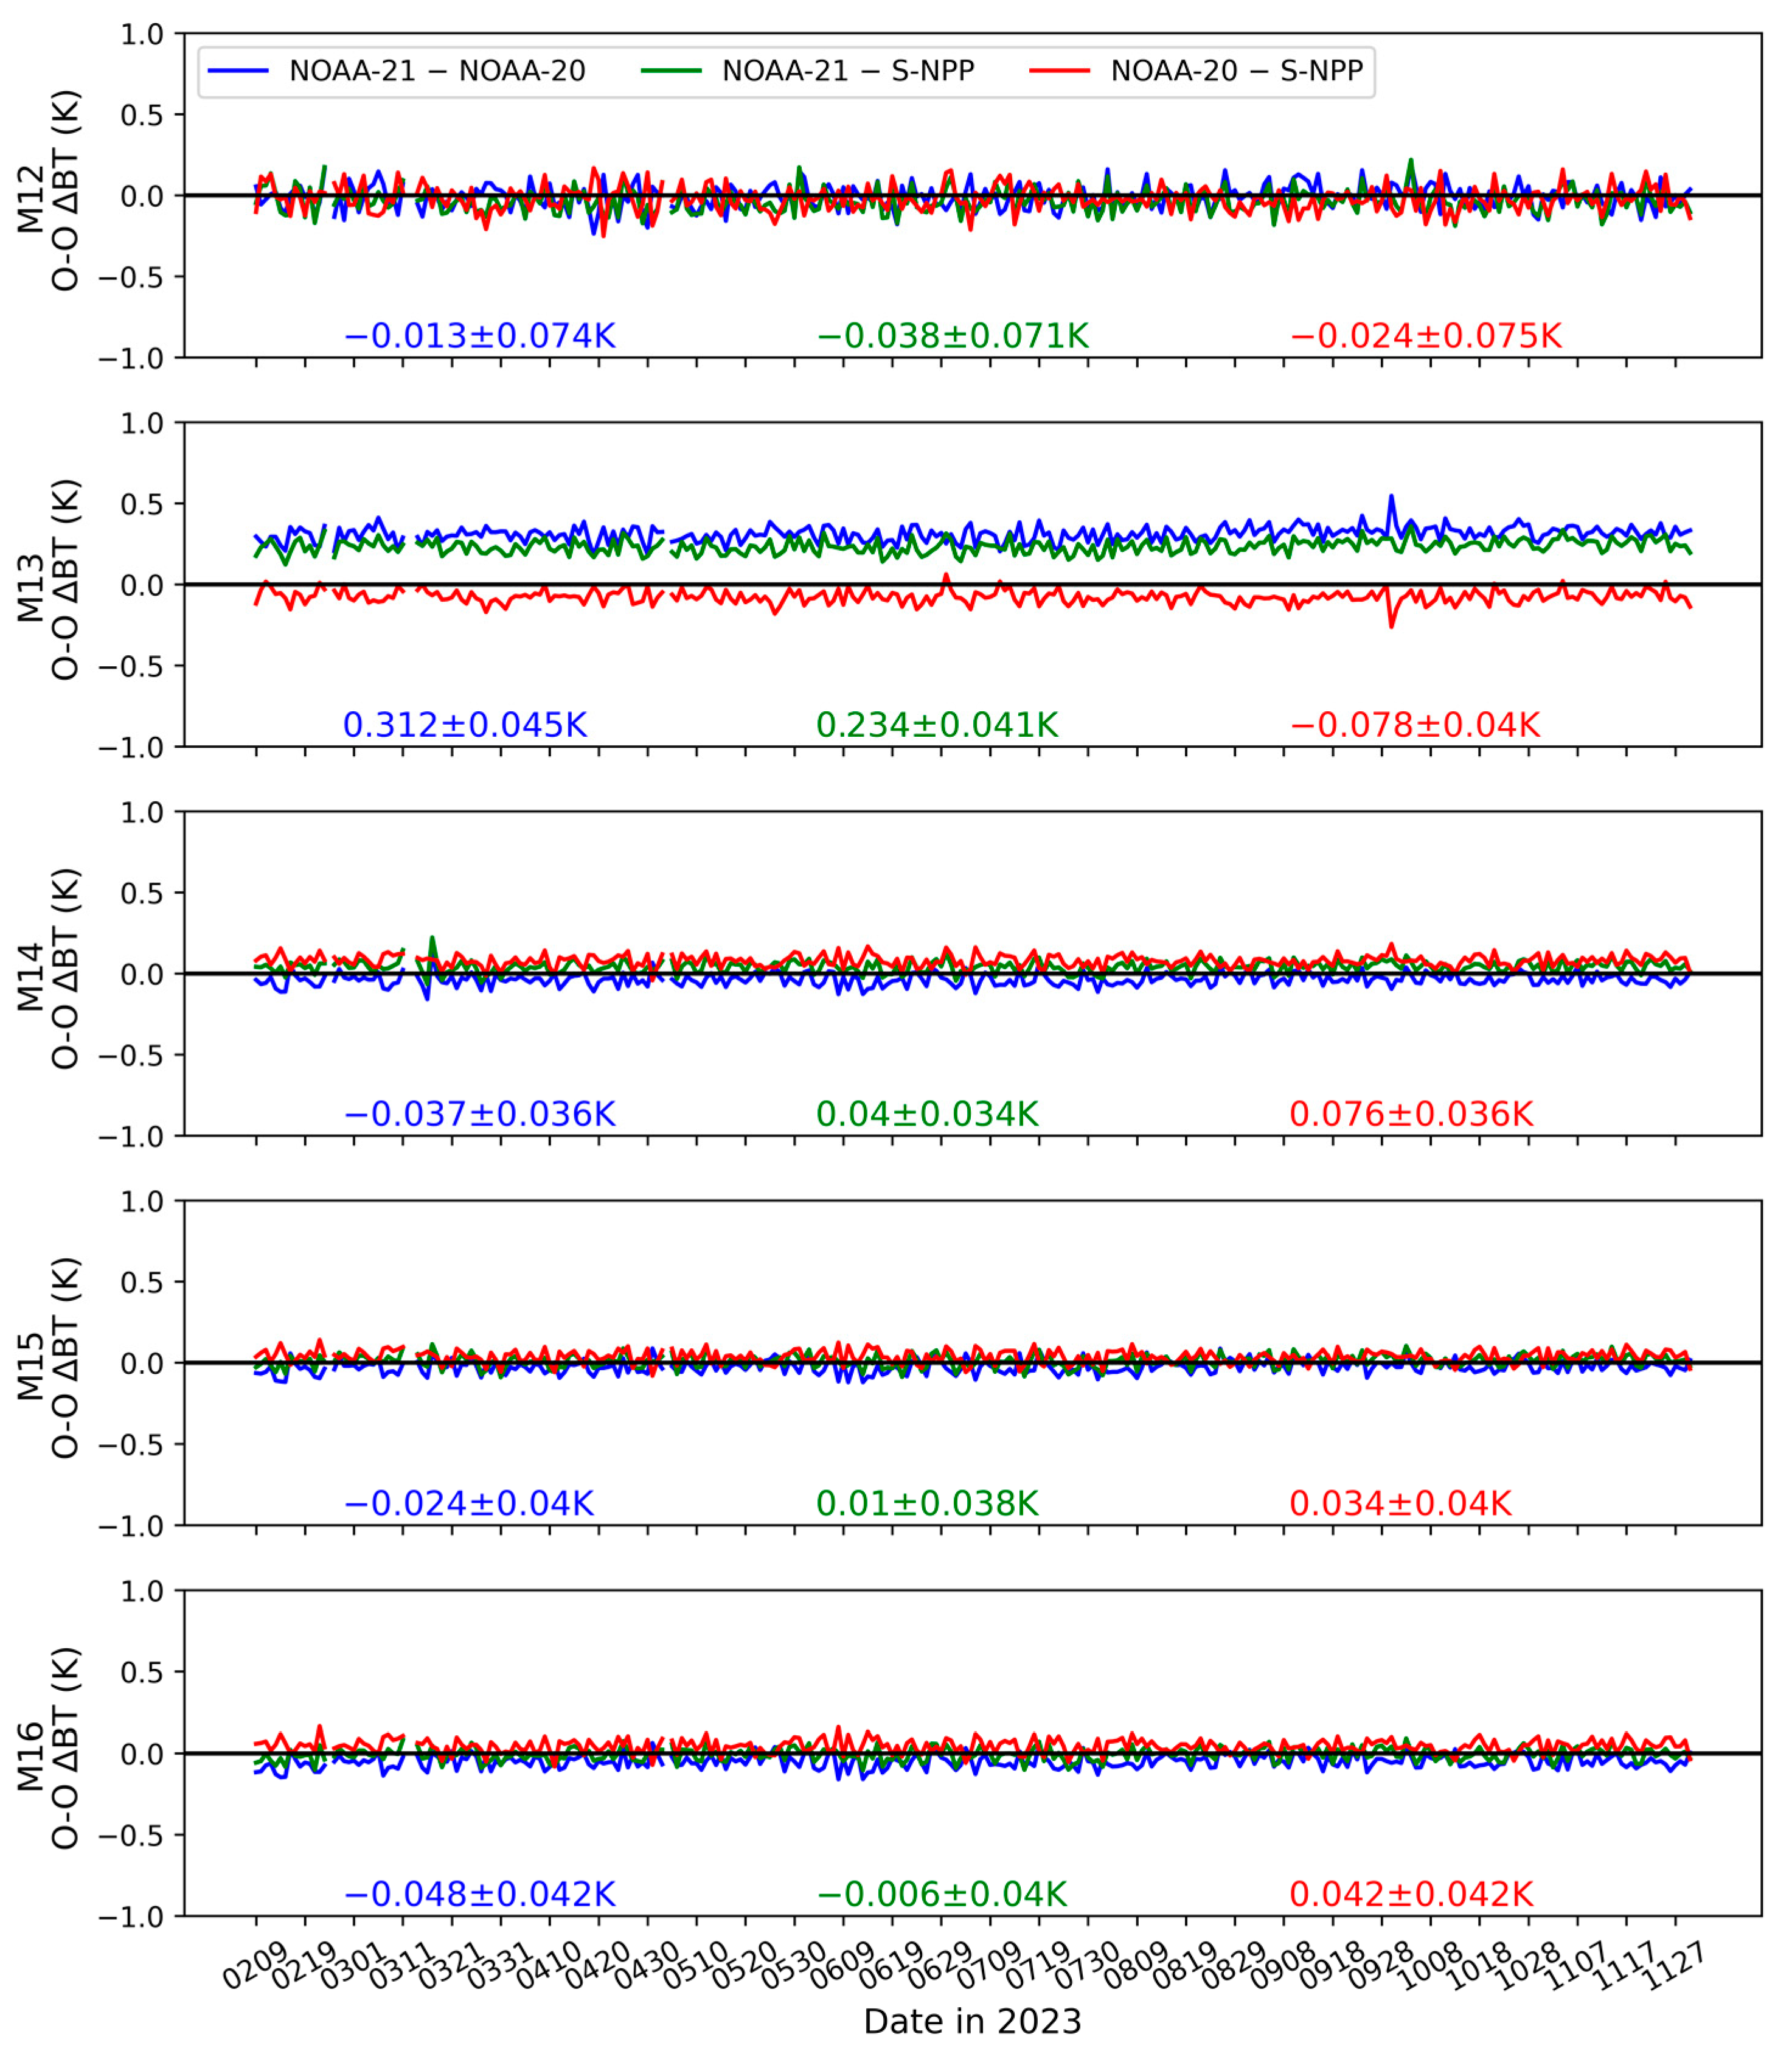
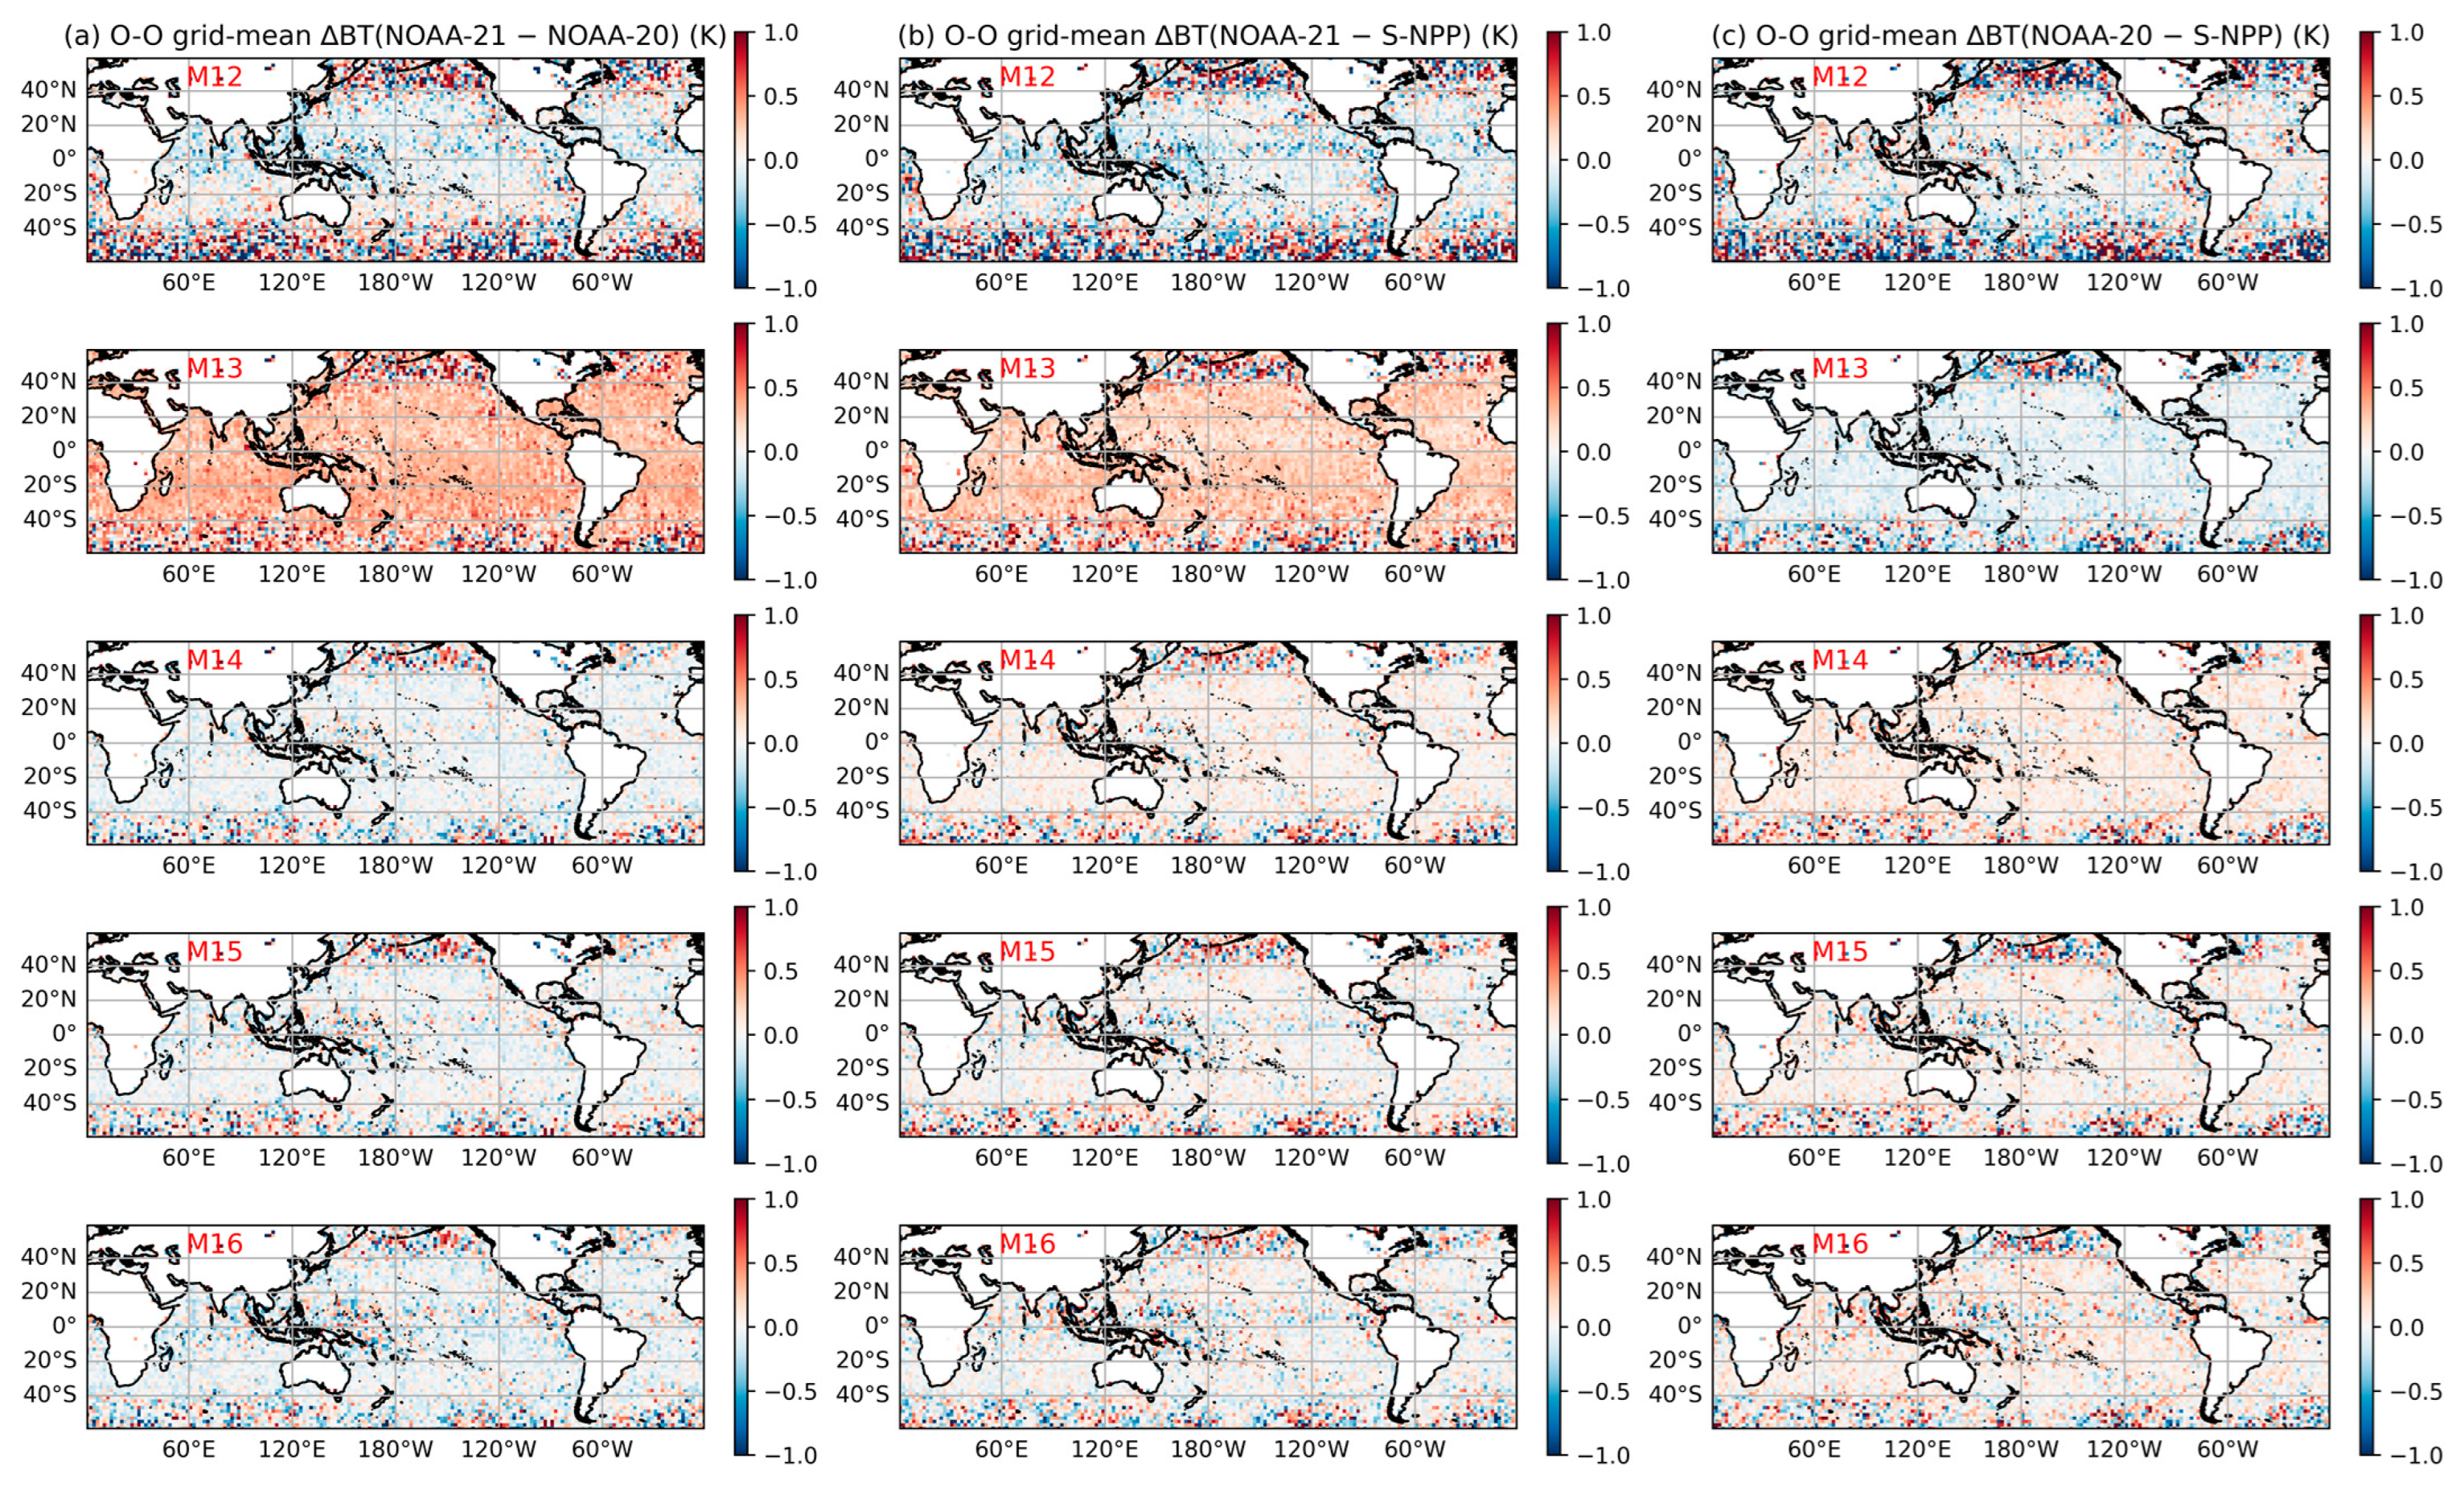
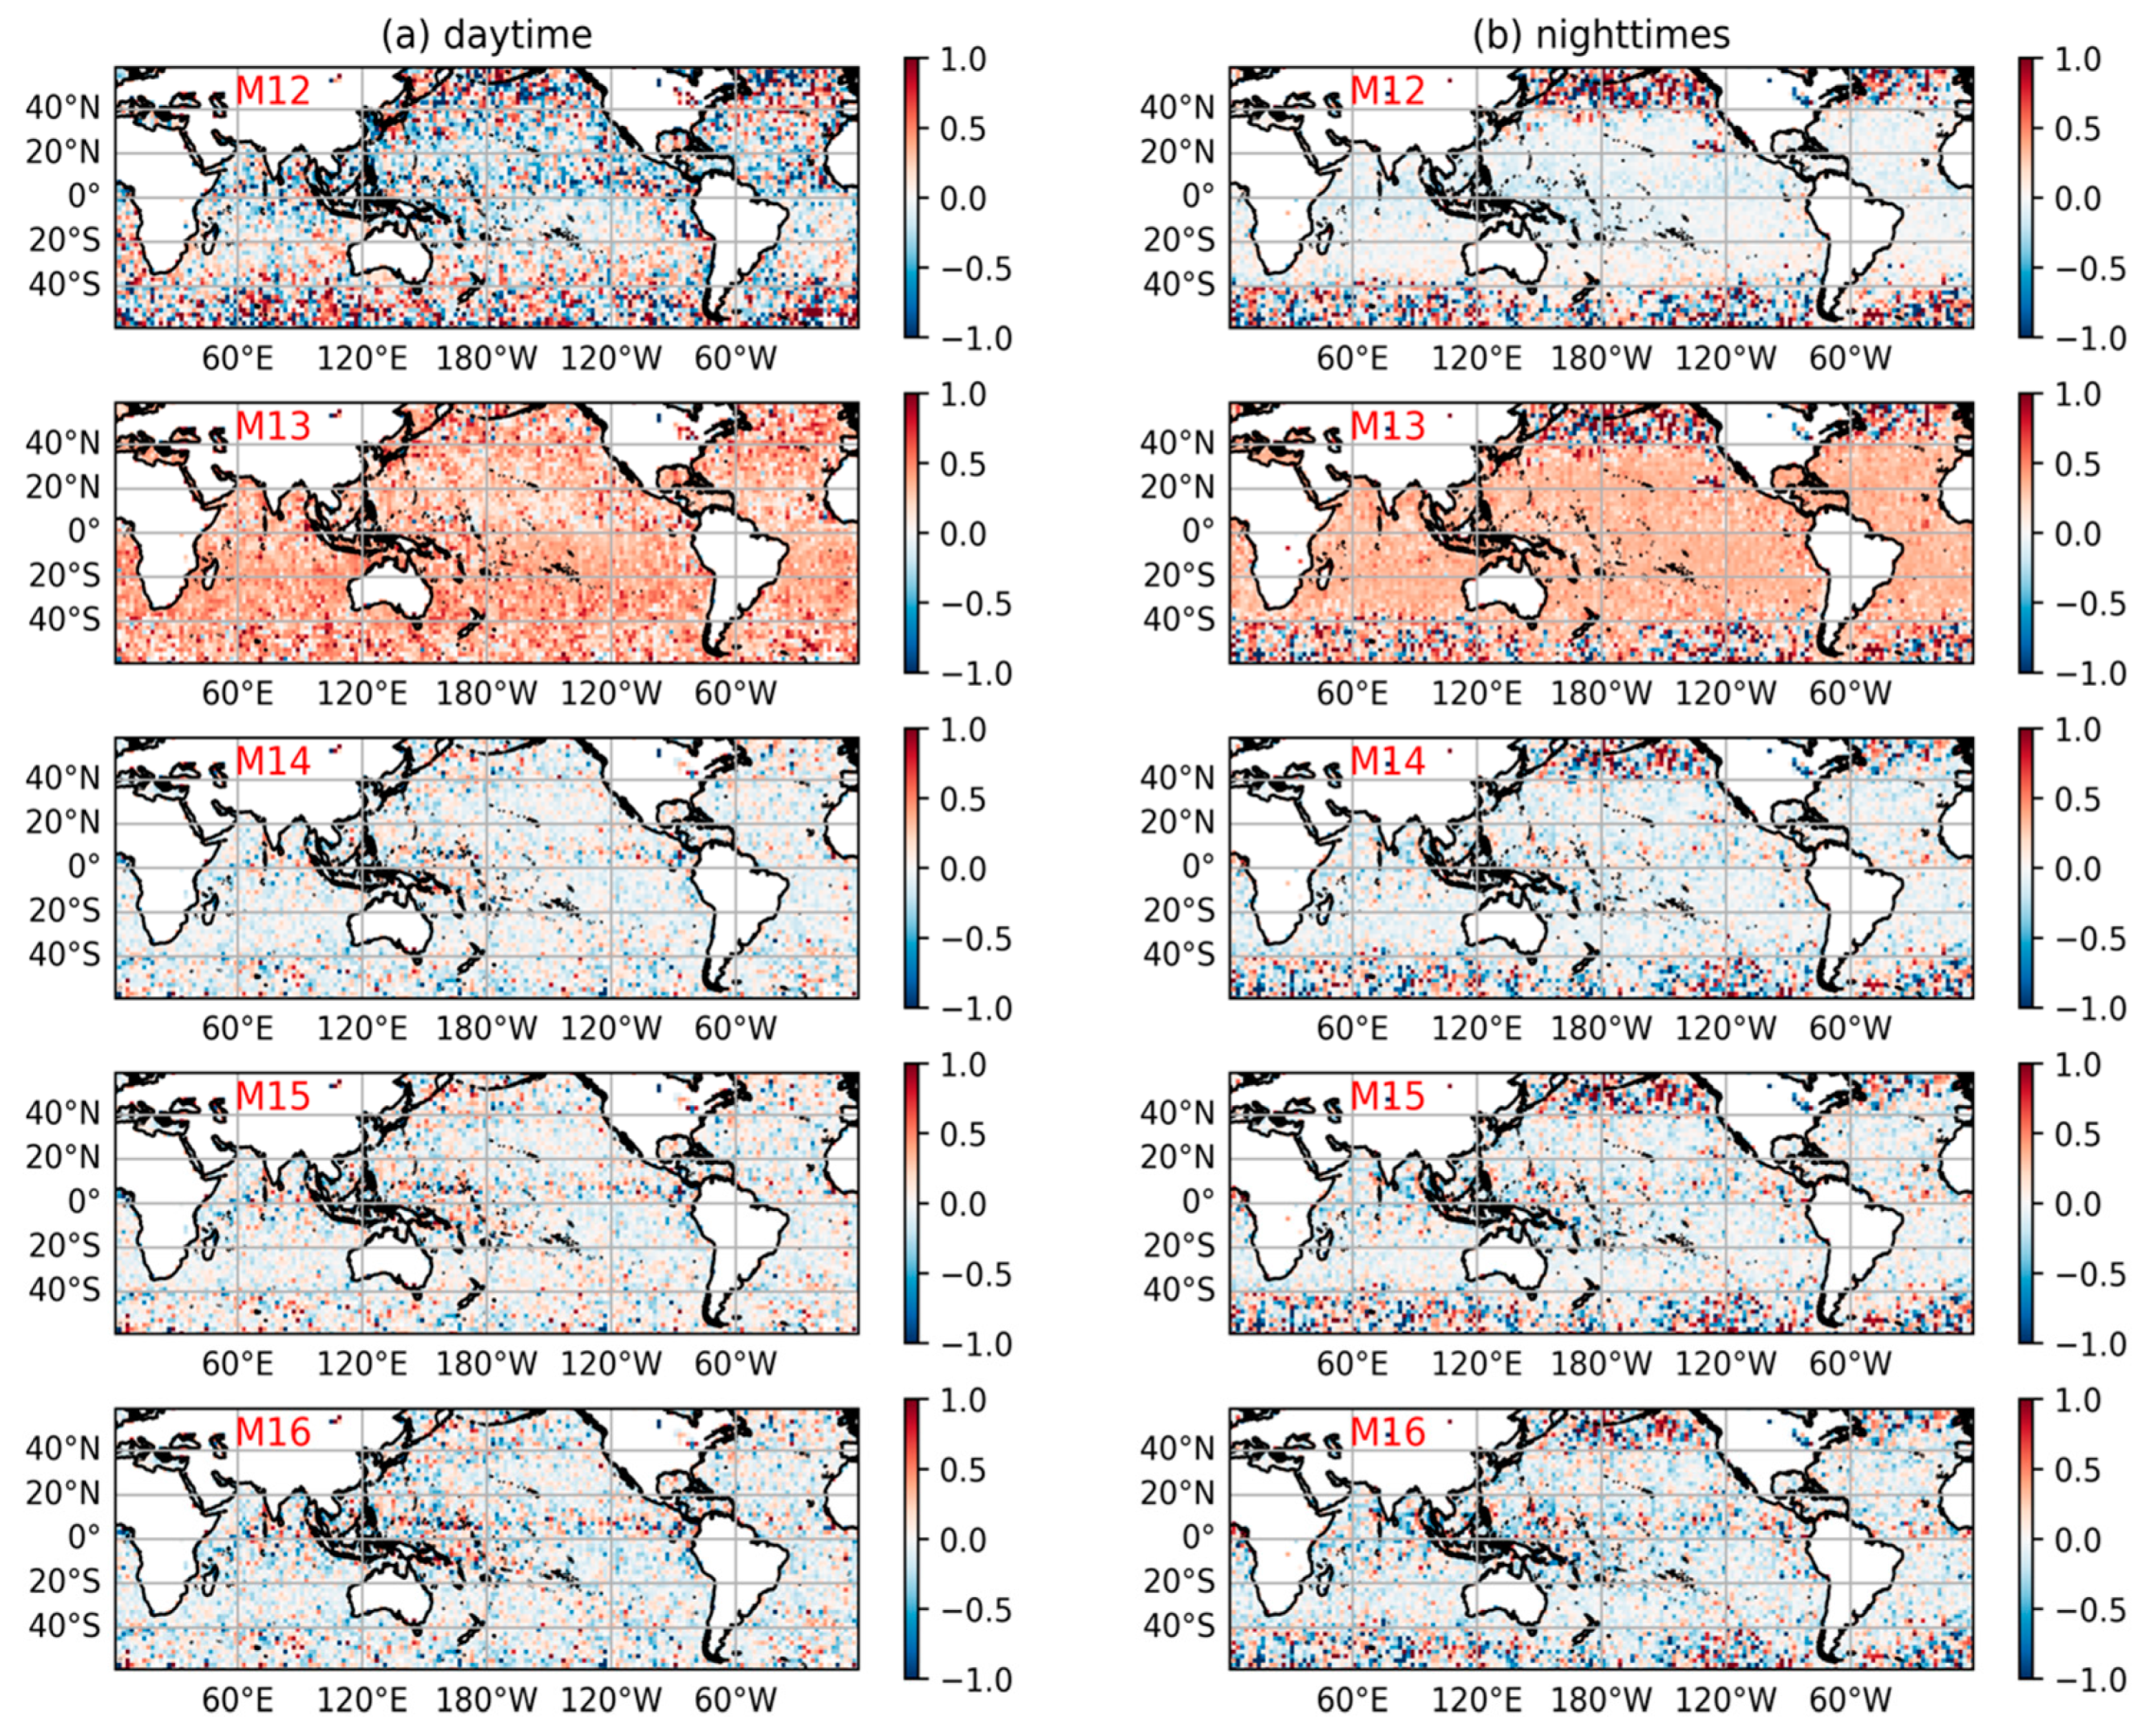
- Methodology: Daily calculations of both O-B ∆BTs and double-difference (O-O) ∆BTs were conducted. The double-difference analyses involve subtracting any pair of daily-mean O-B ∆BT values between S-NPP, NOAA-20, and NOAA-21 to derive inter-sensor VIIRS O-O ∆BTs.
3. Results
3.1. Long-Term Stability of VIIRS S-NPP M TEBs
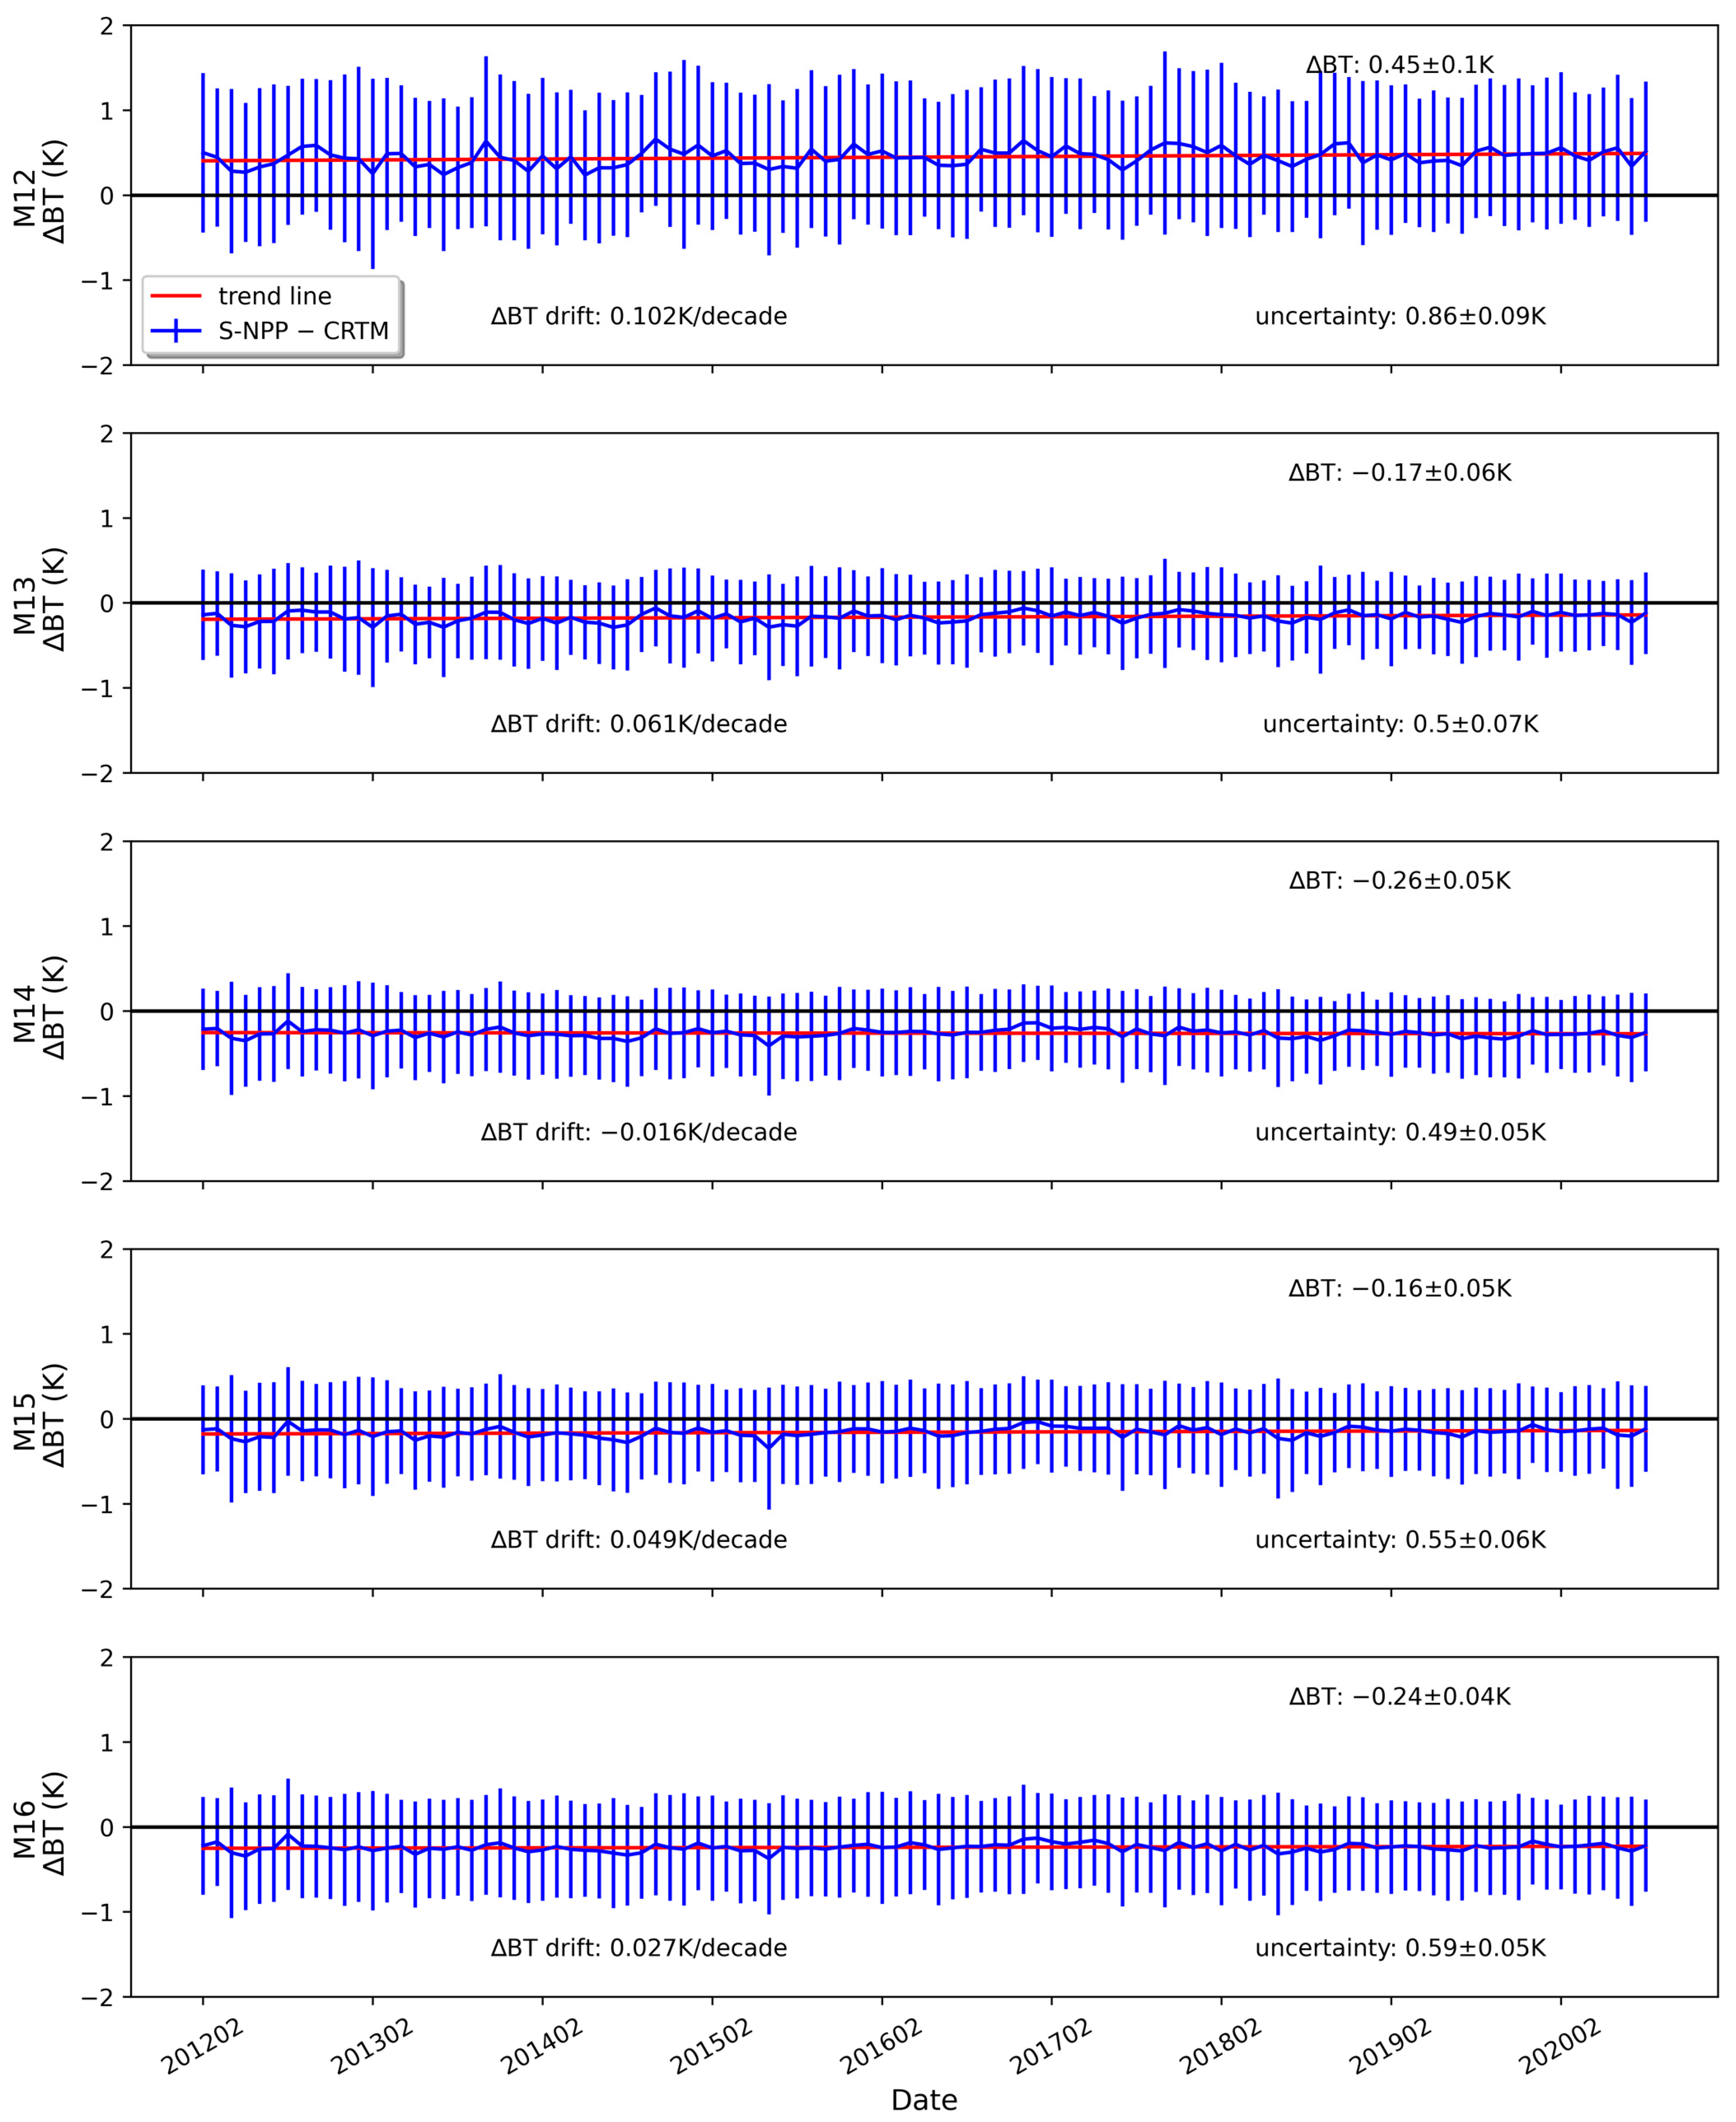
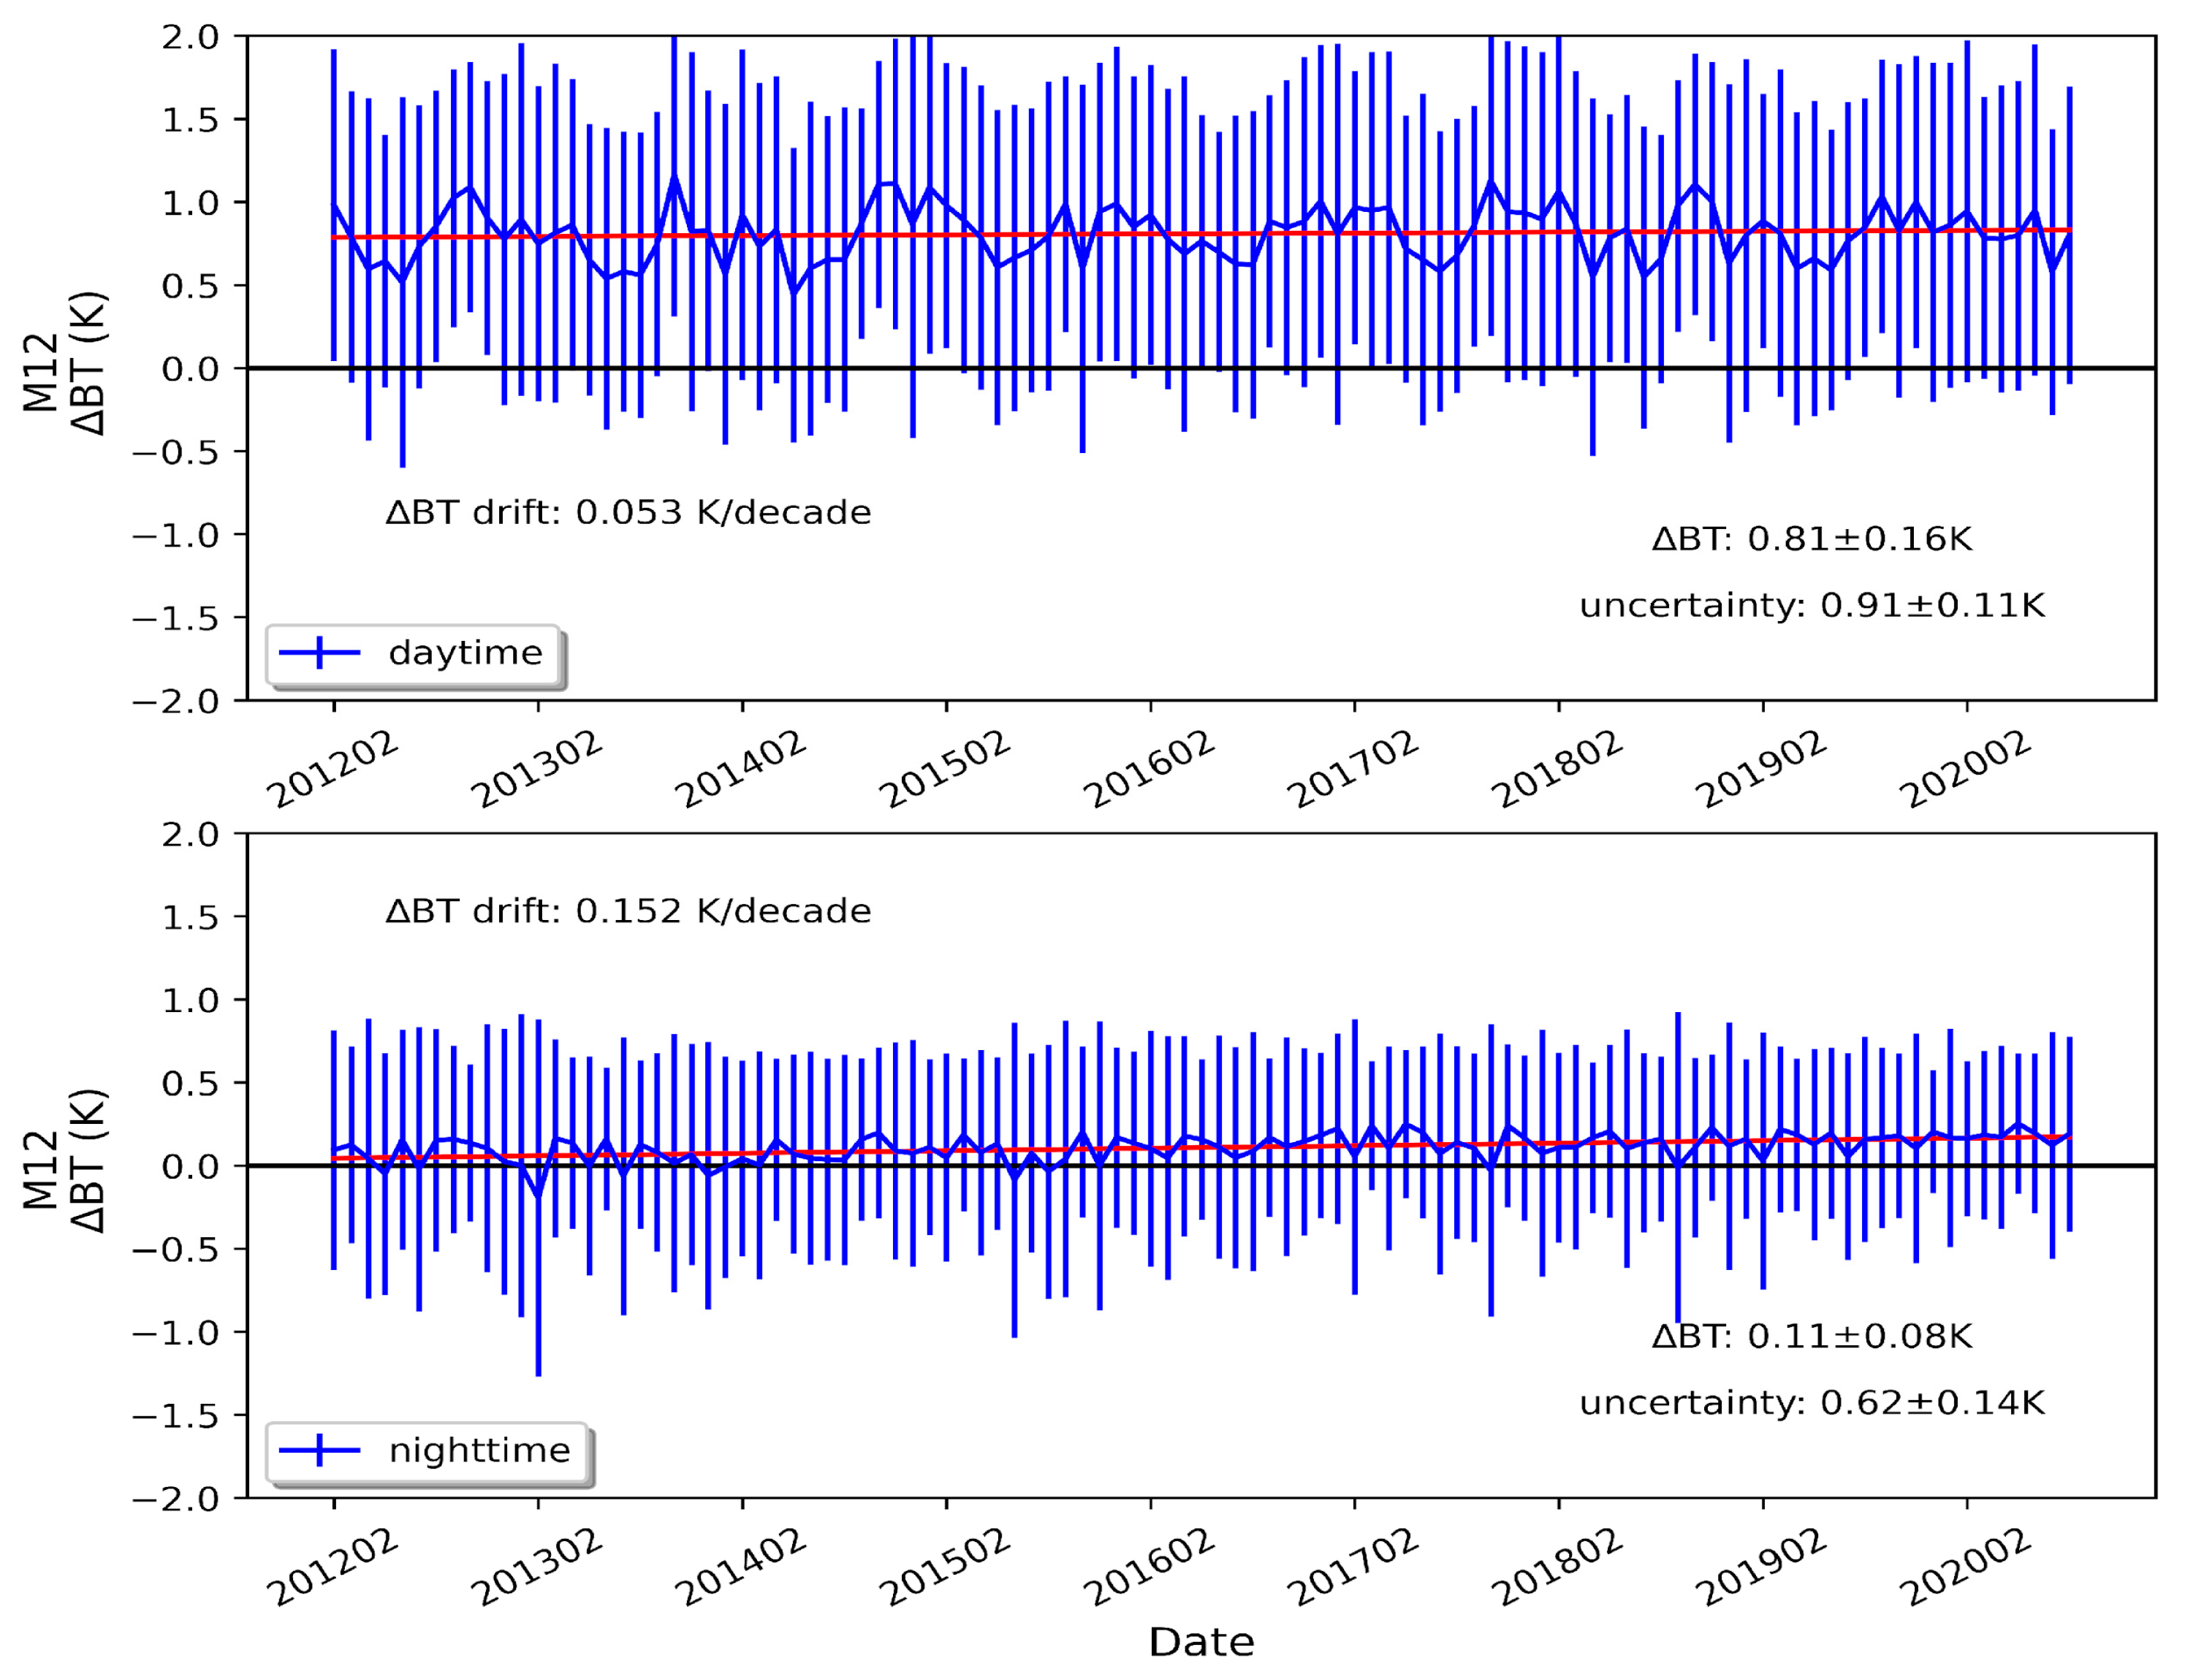
3.1.1. Analyses on the Long-Term Time Series
3.1.2. Analysis on the Drifts of O-B BT Differences from 2012 to 2020
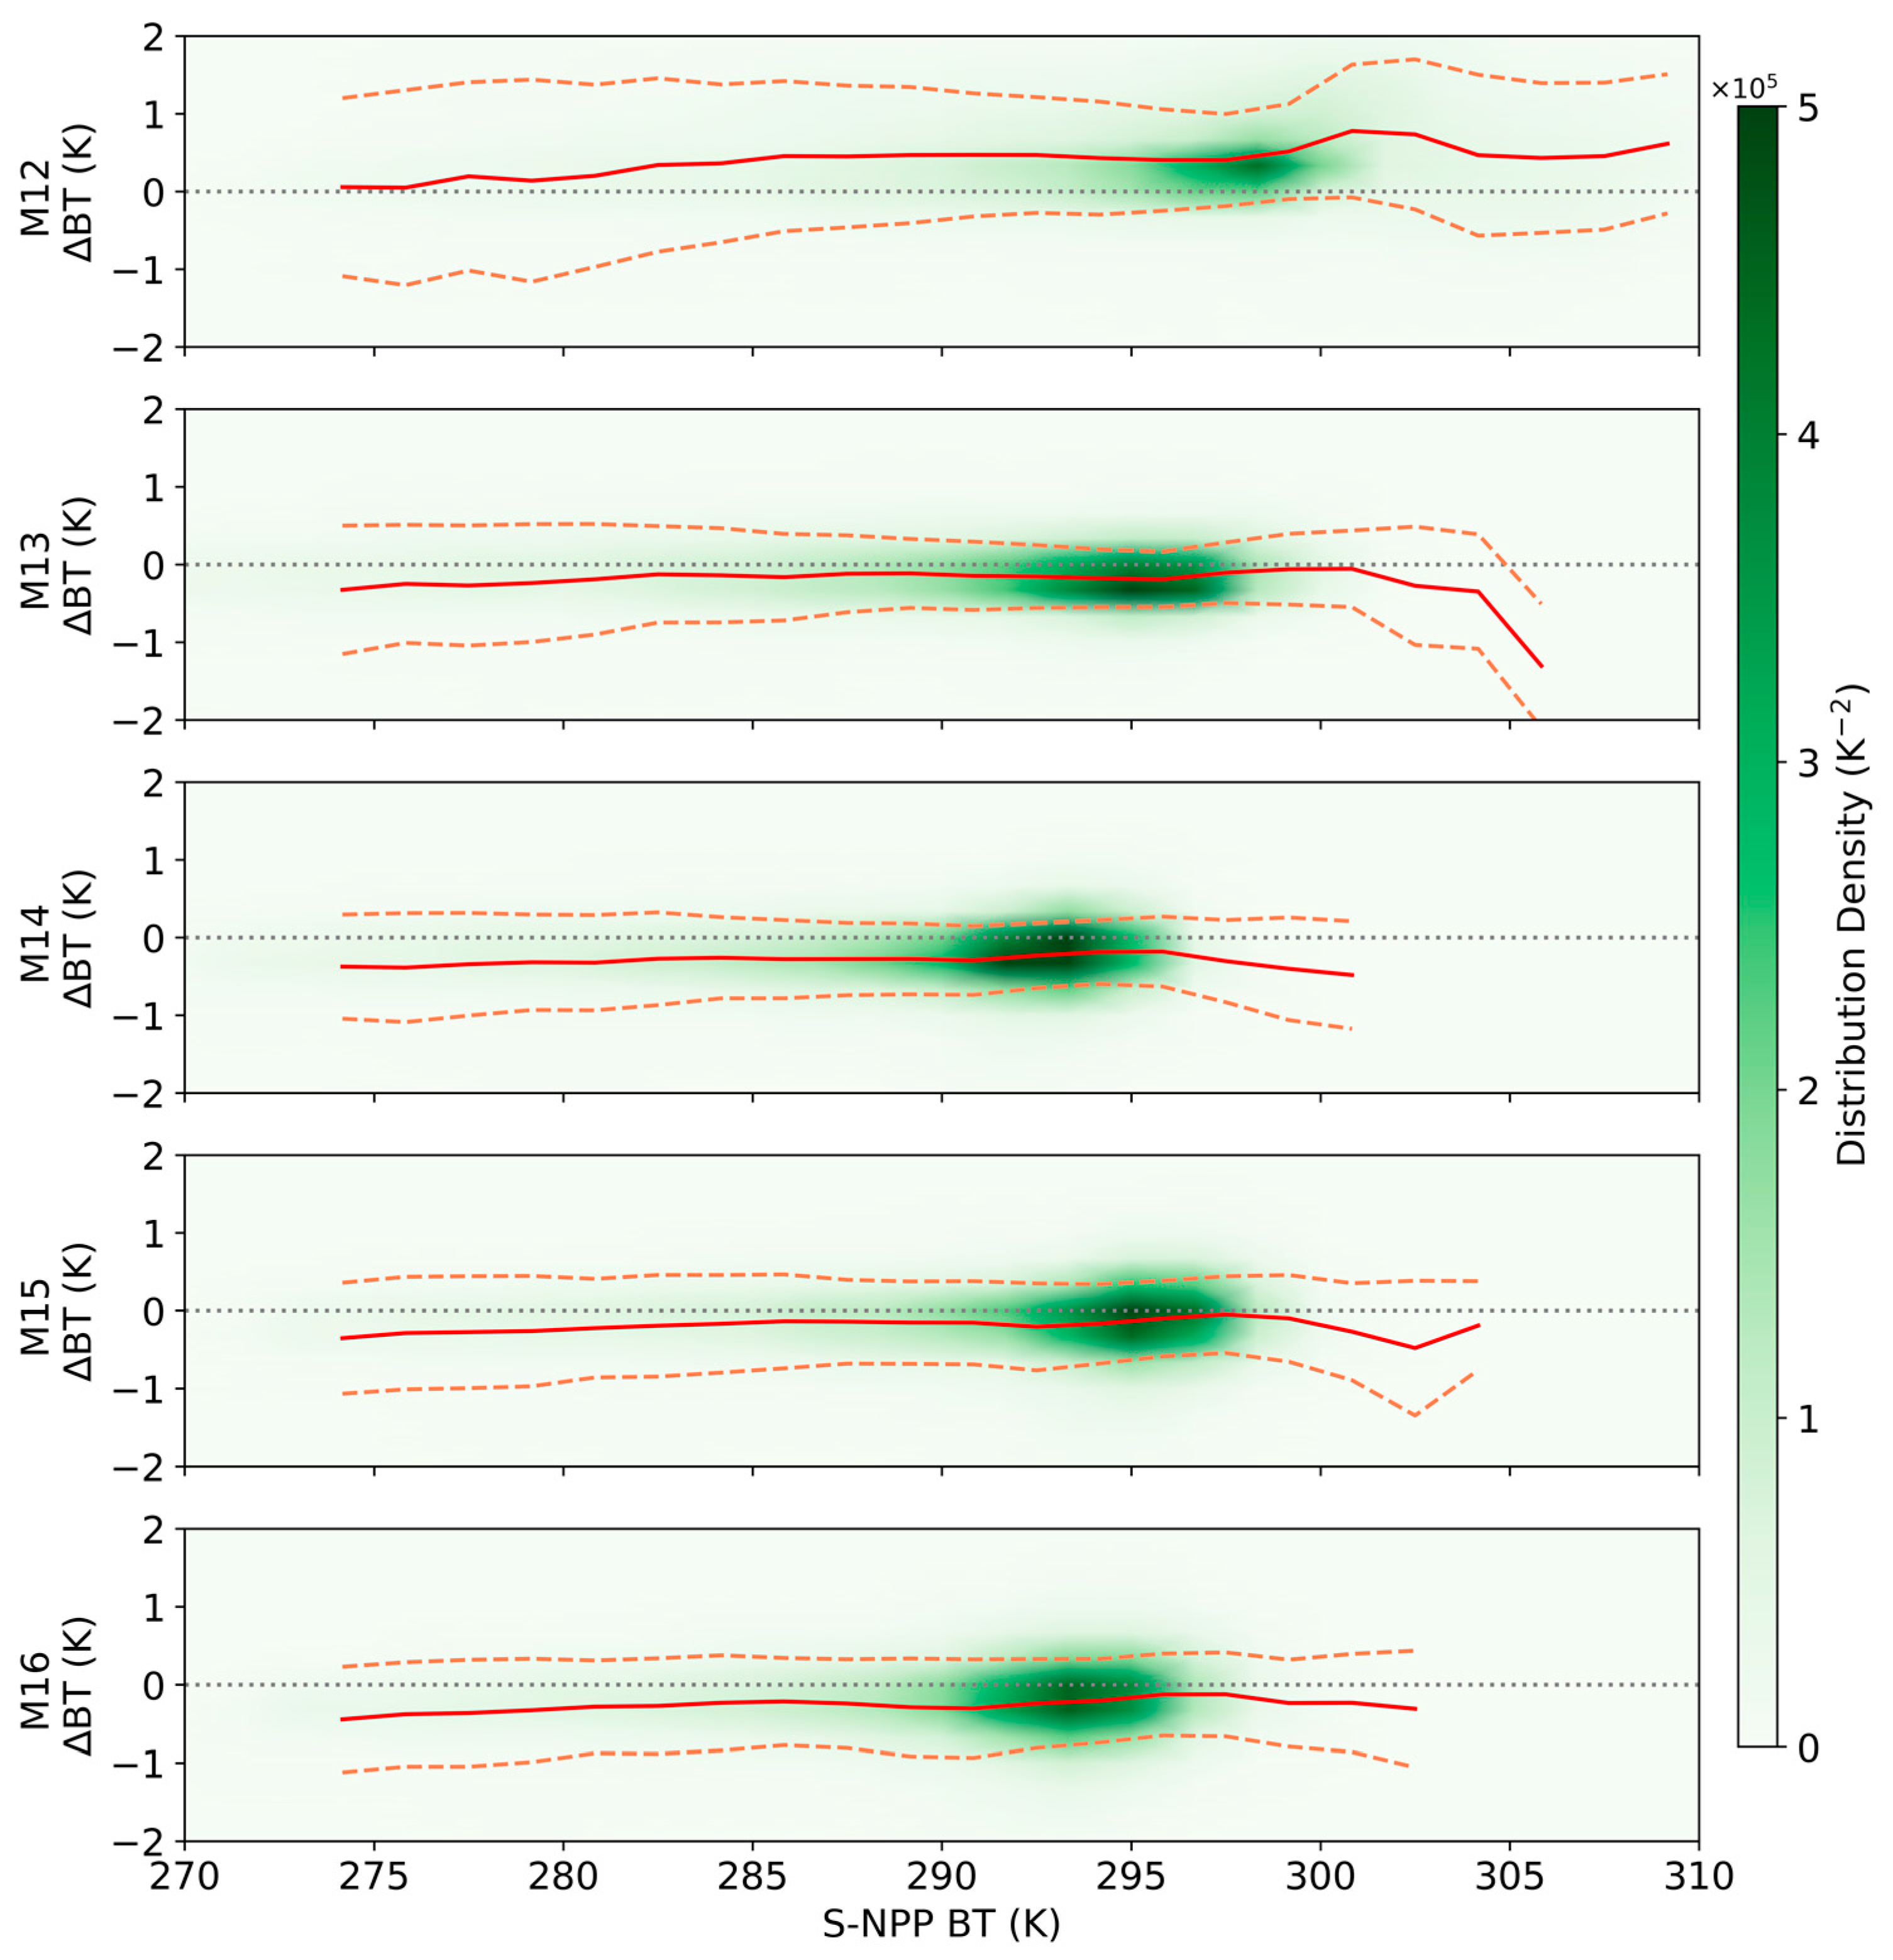
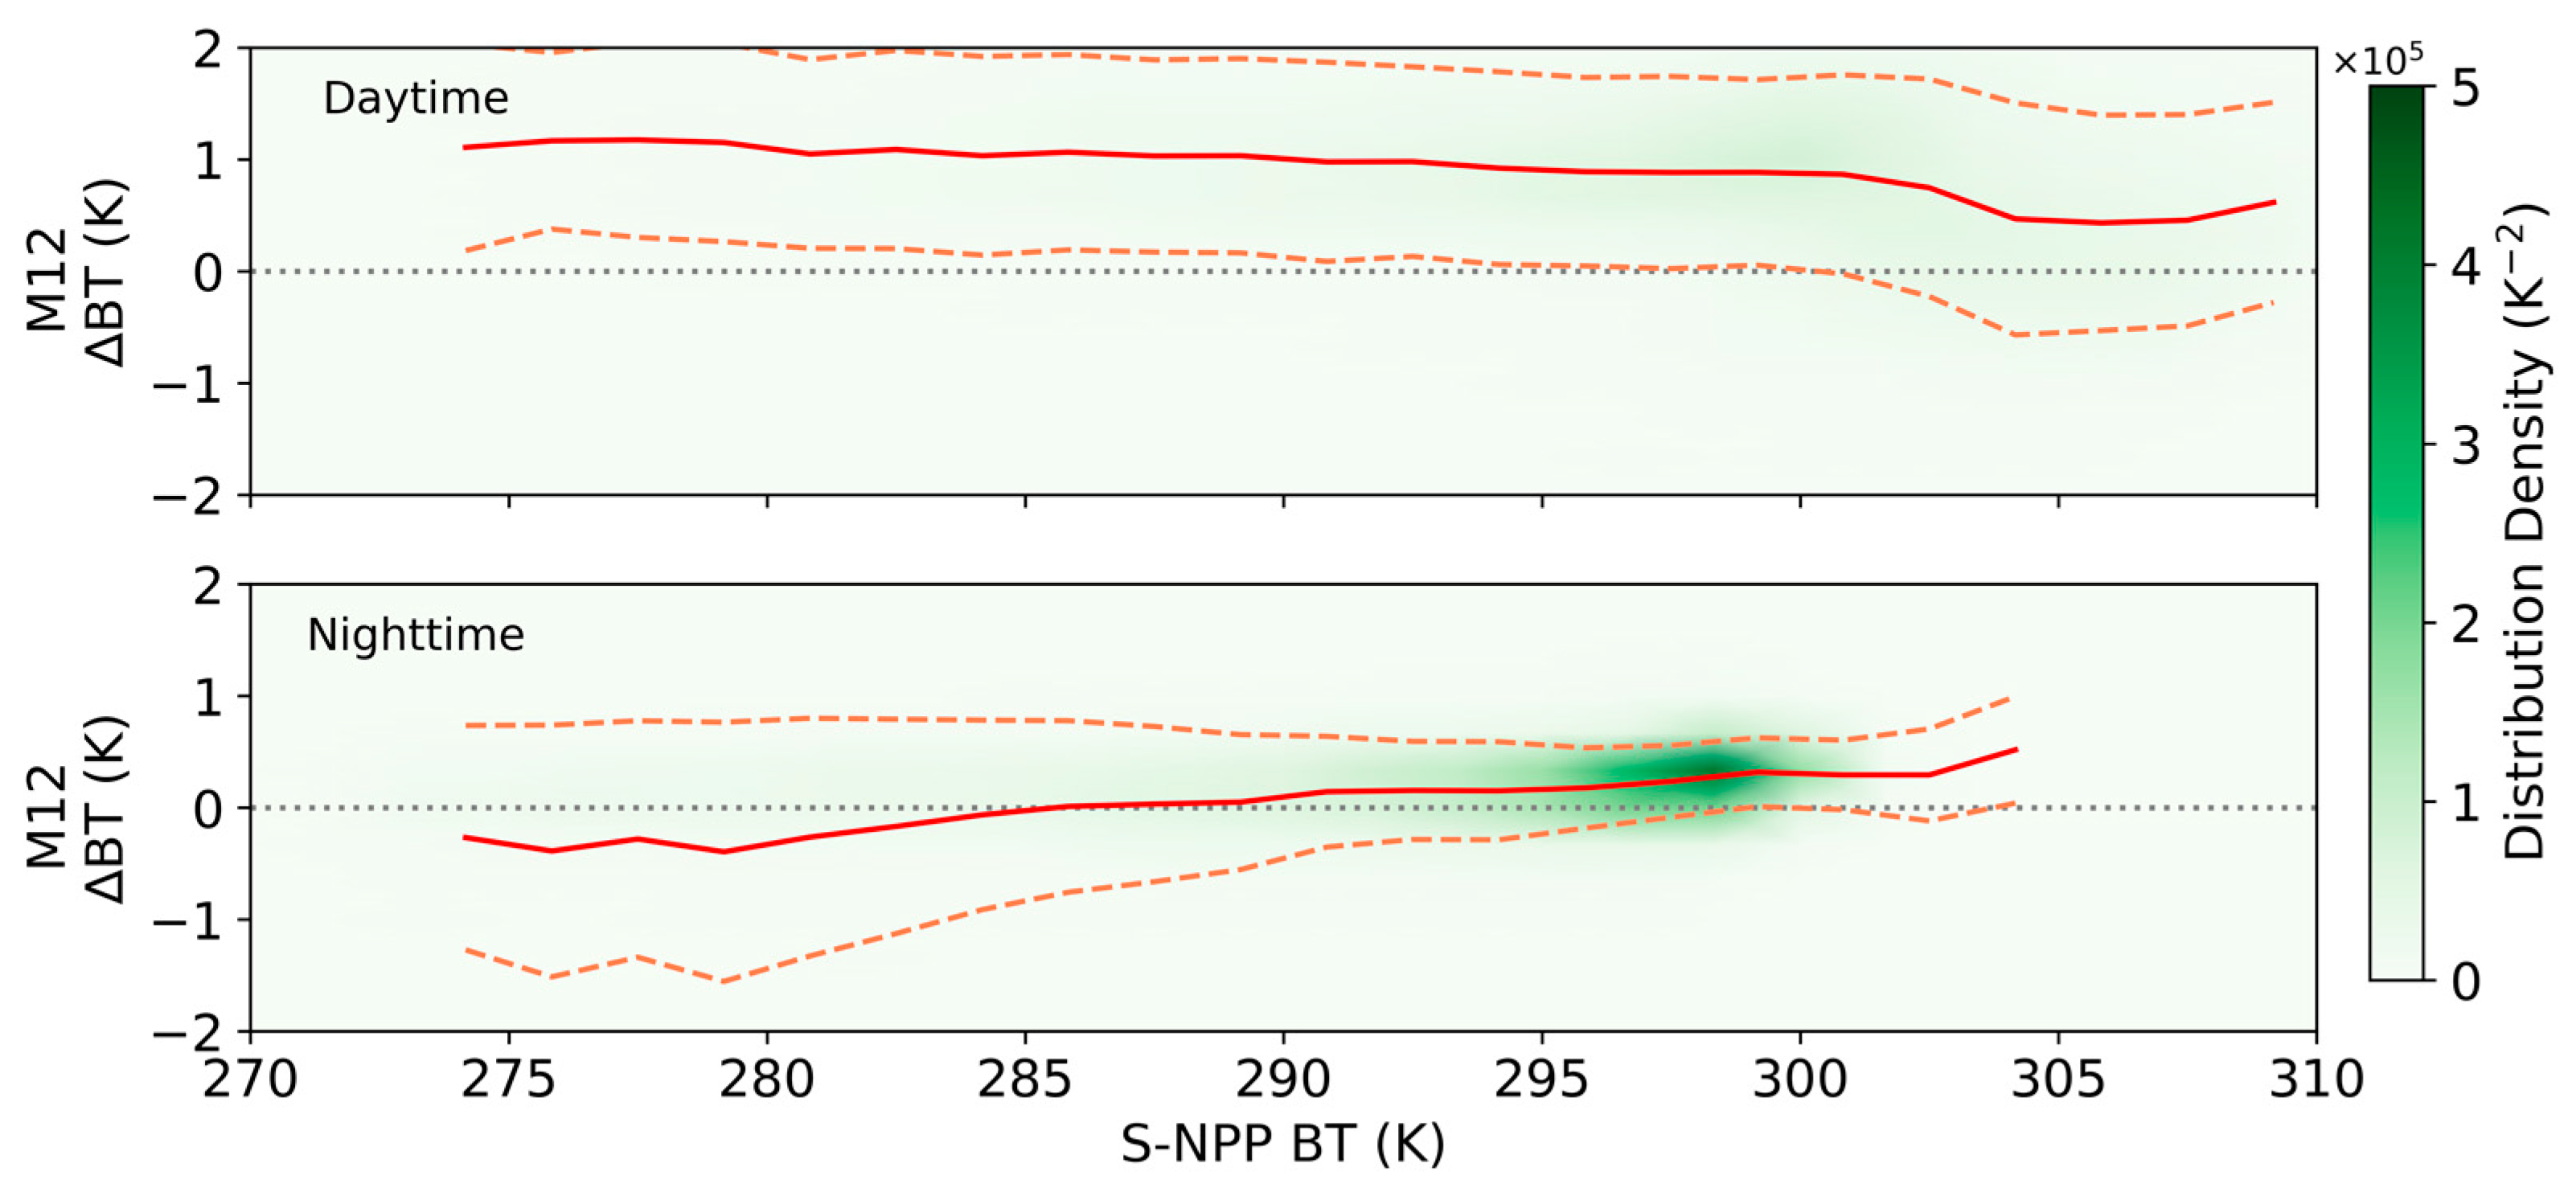
3.1.3. Analysis on O-B BT Differences against Scene Temperature
3.2. Inter-Sensor Consistency of VIIRS M TEBs
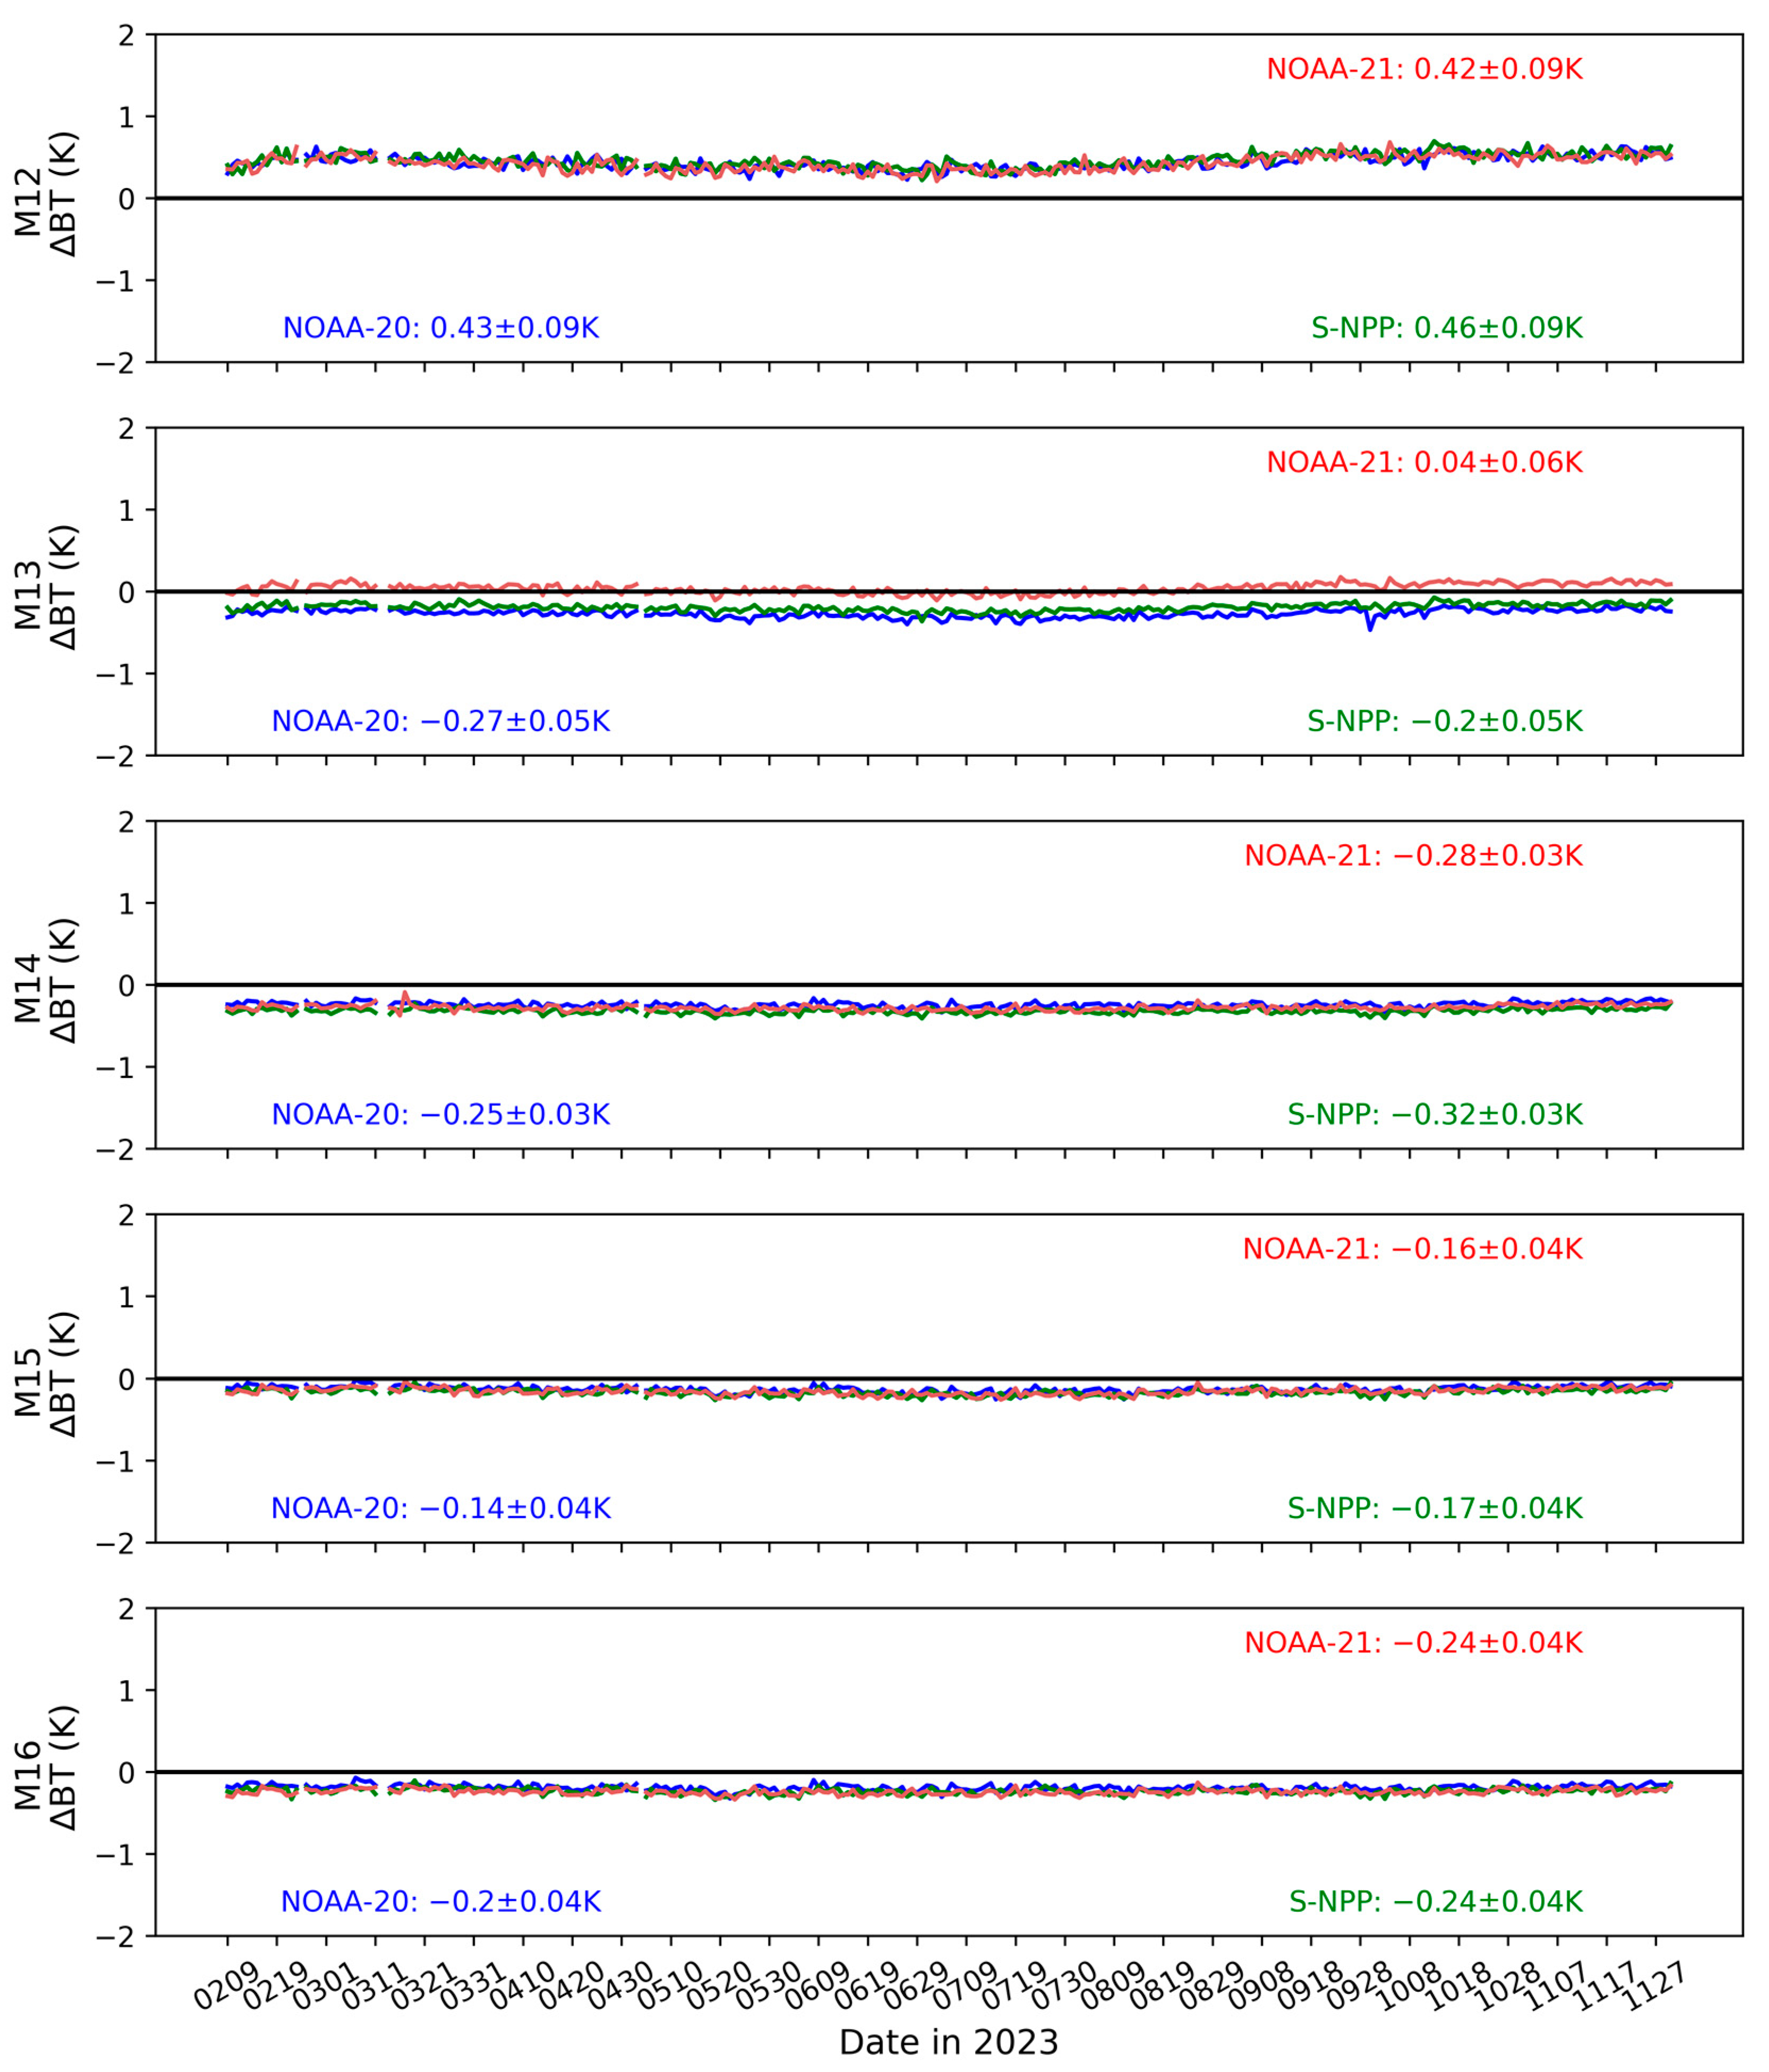
3.2.1. Analyses of the Time Series from 18 March to 30 November 2023
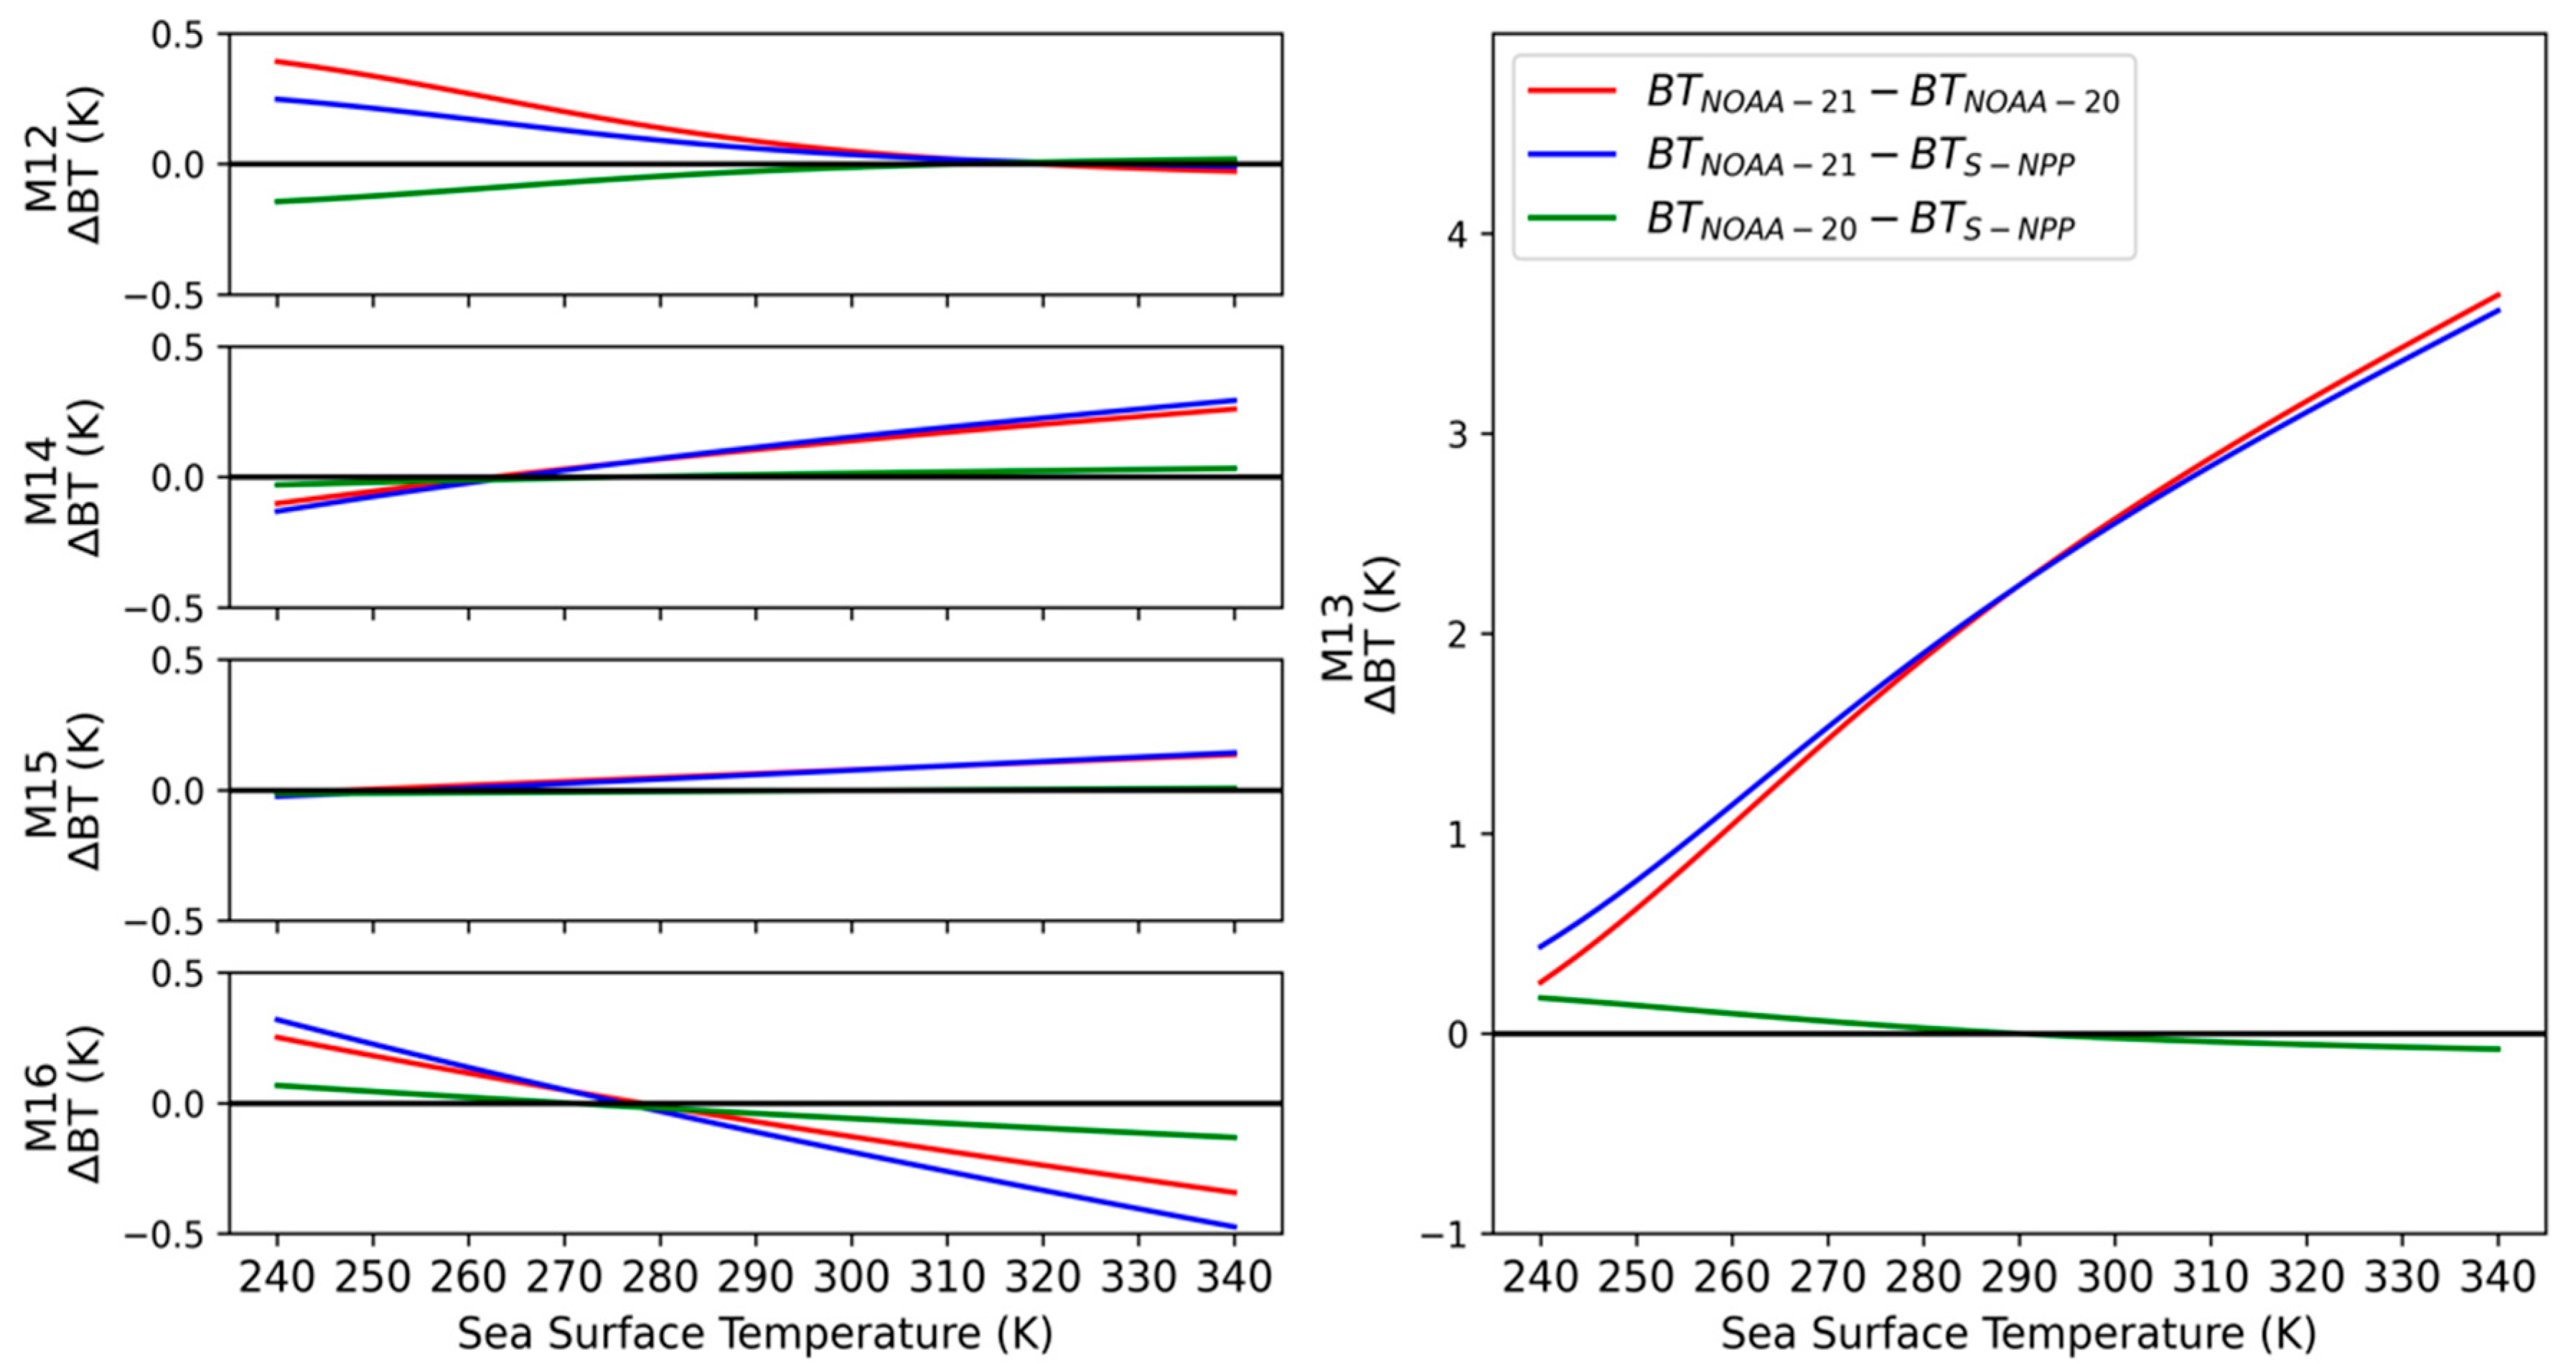
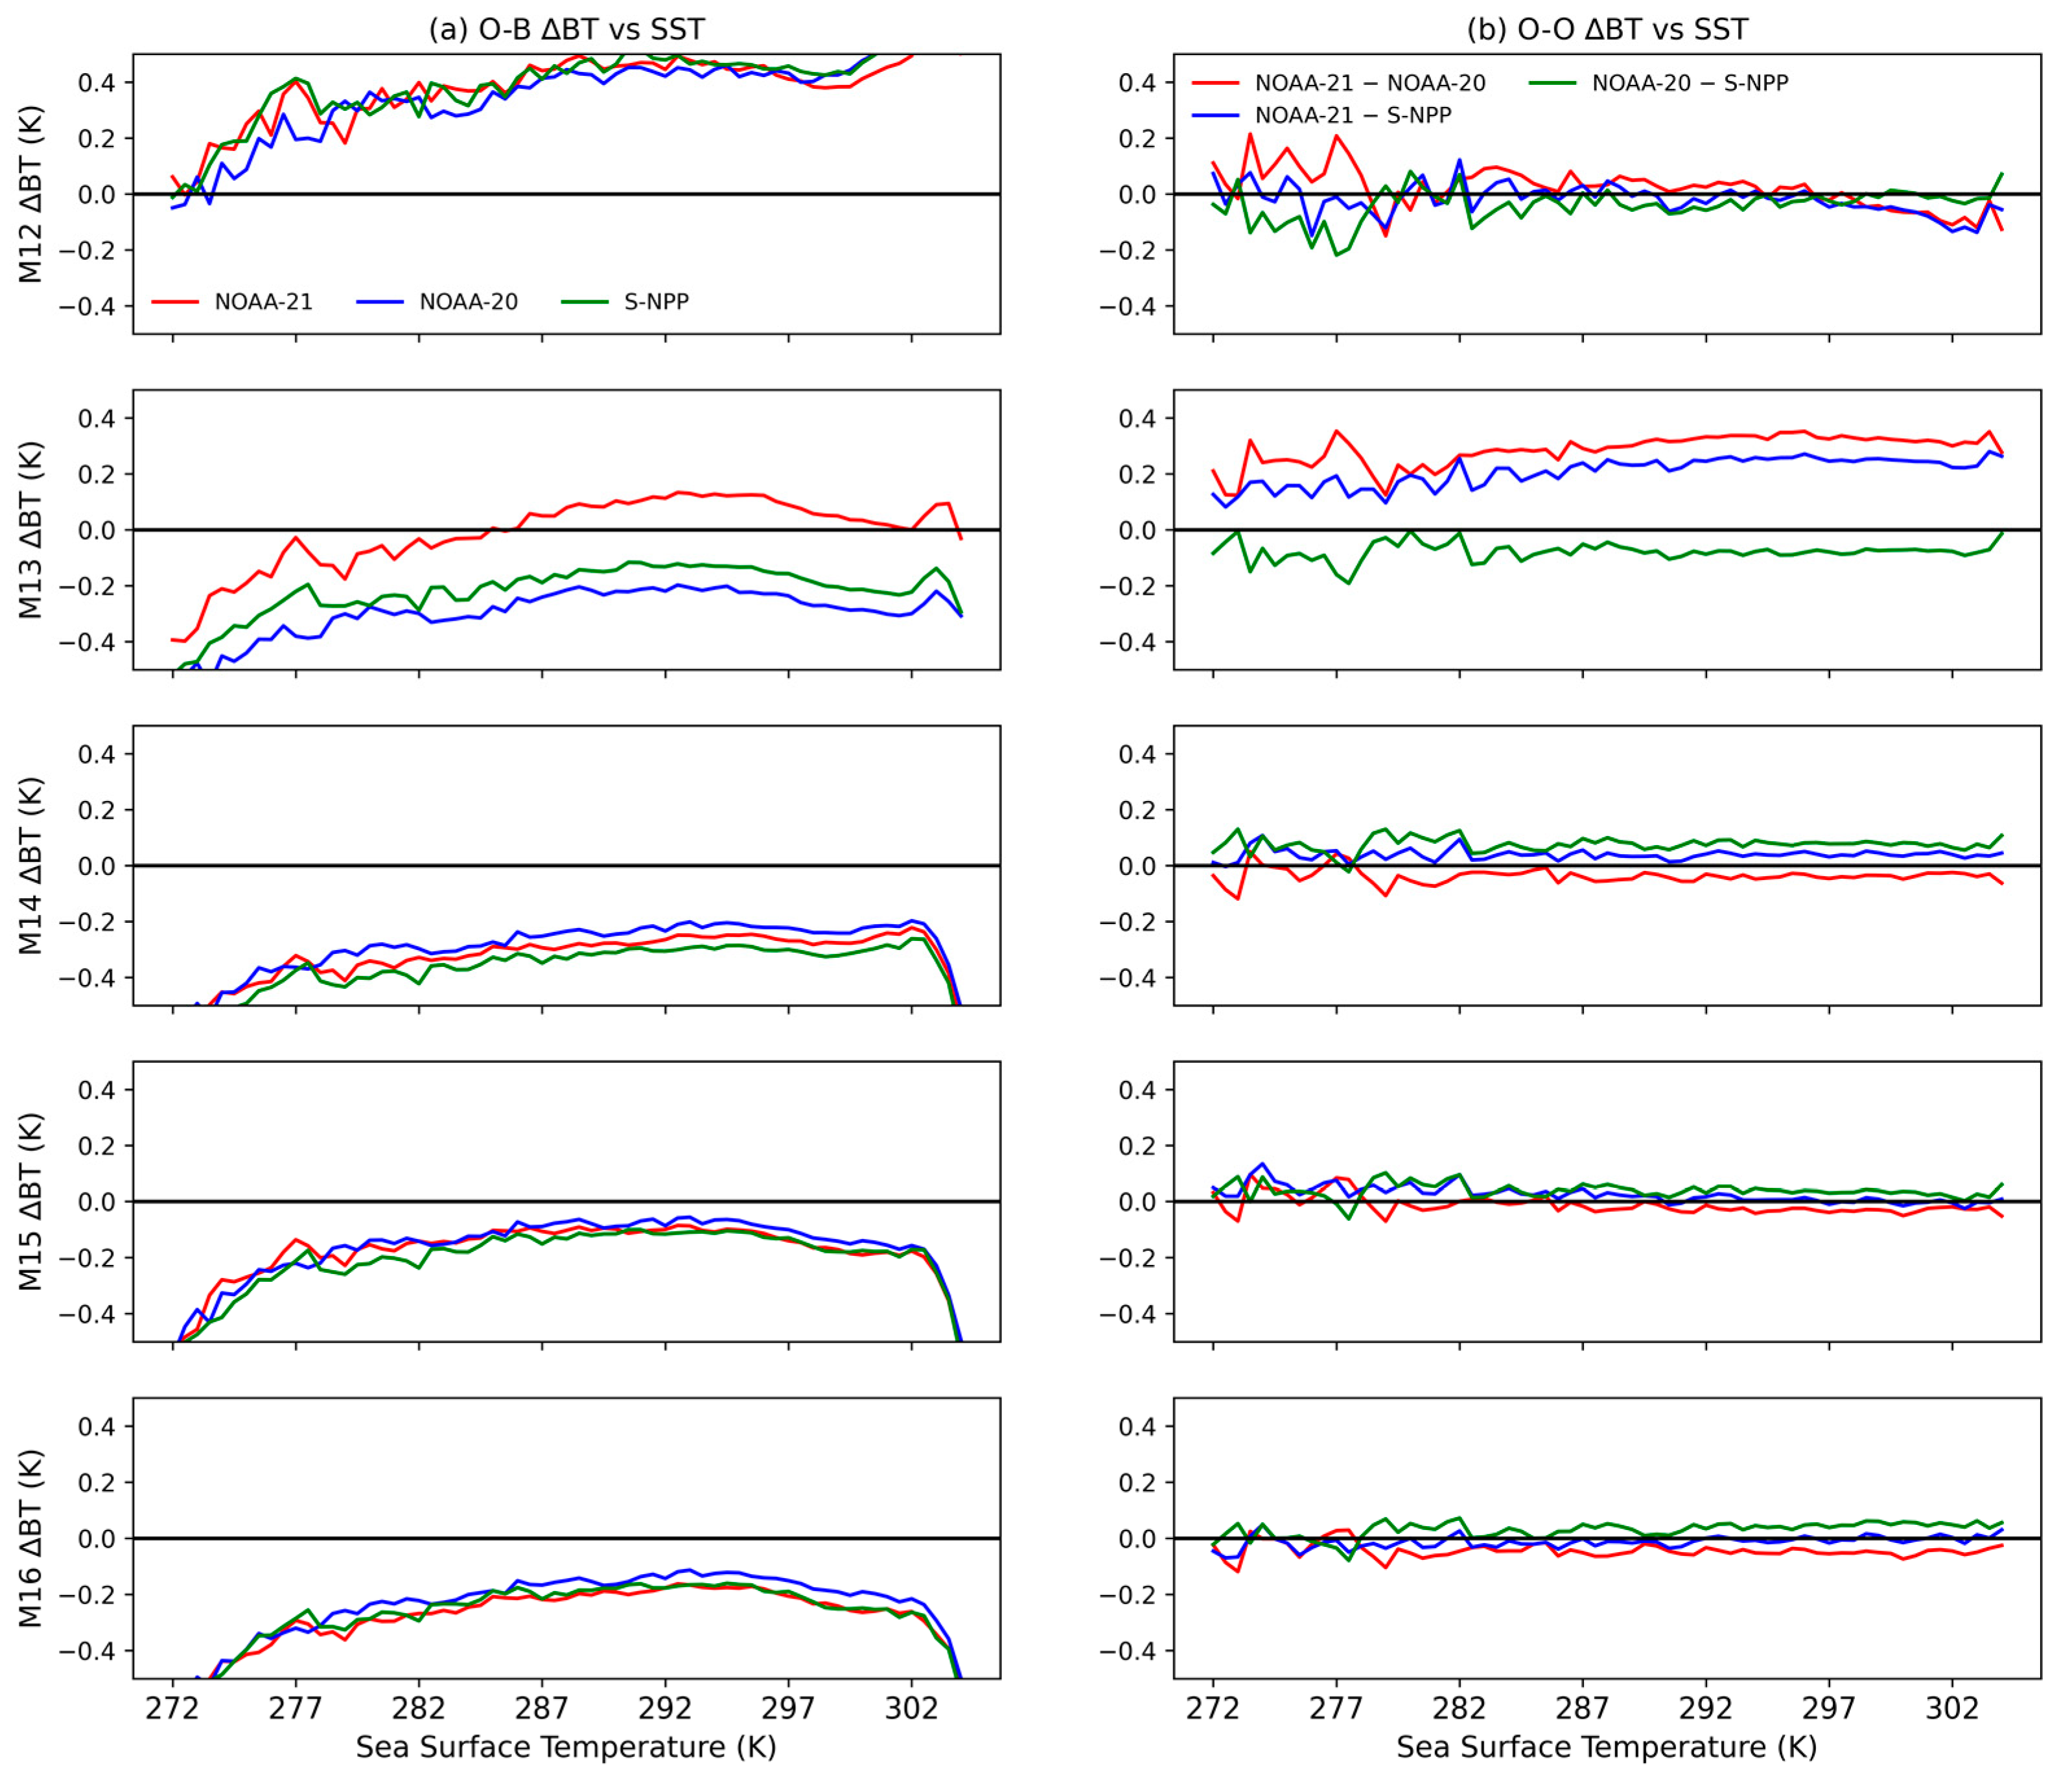
3.2.2. Analyses on the Relationship between ∆BTs and Scene Temperatures
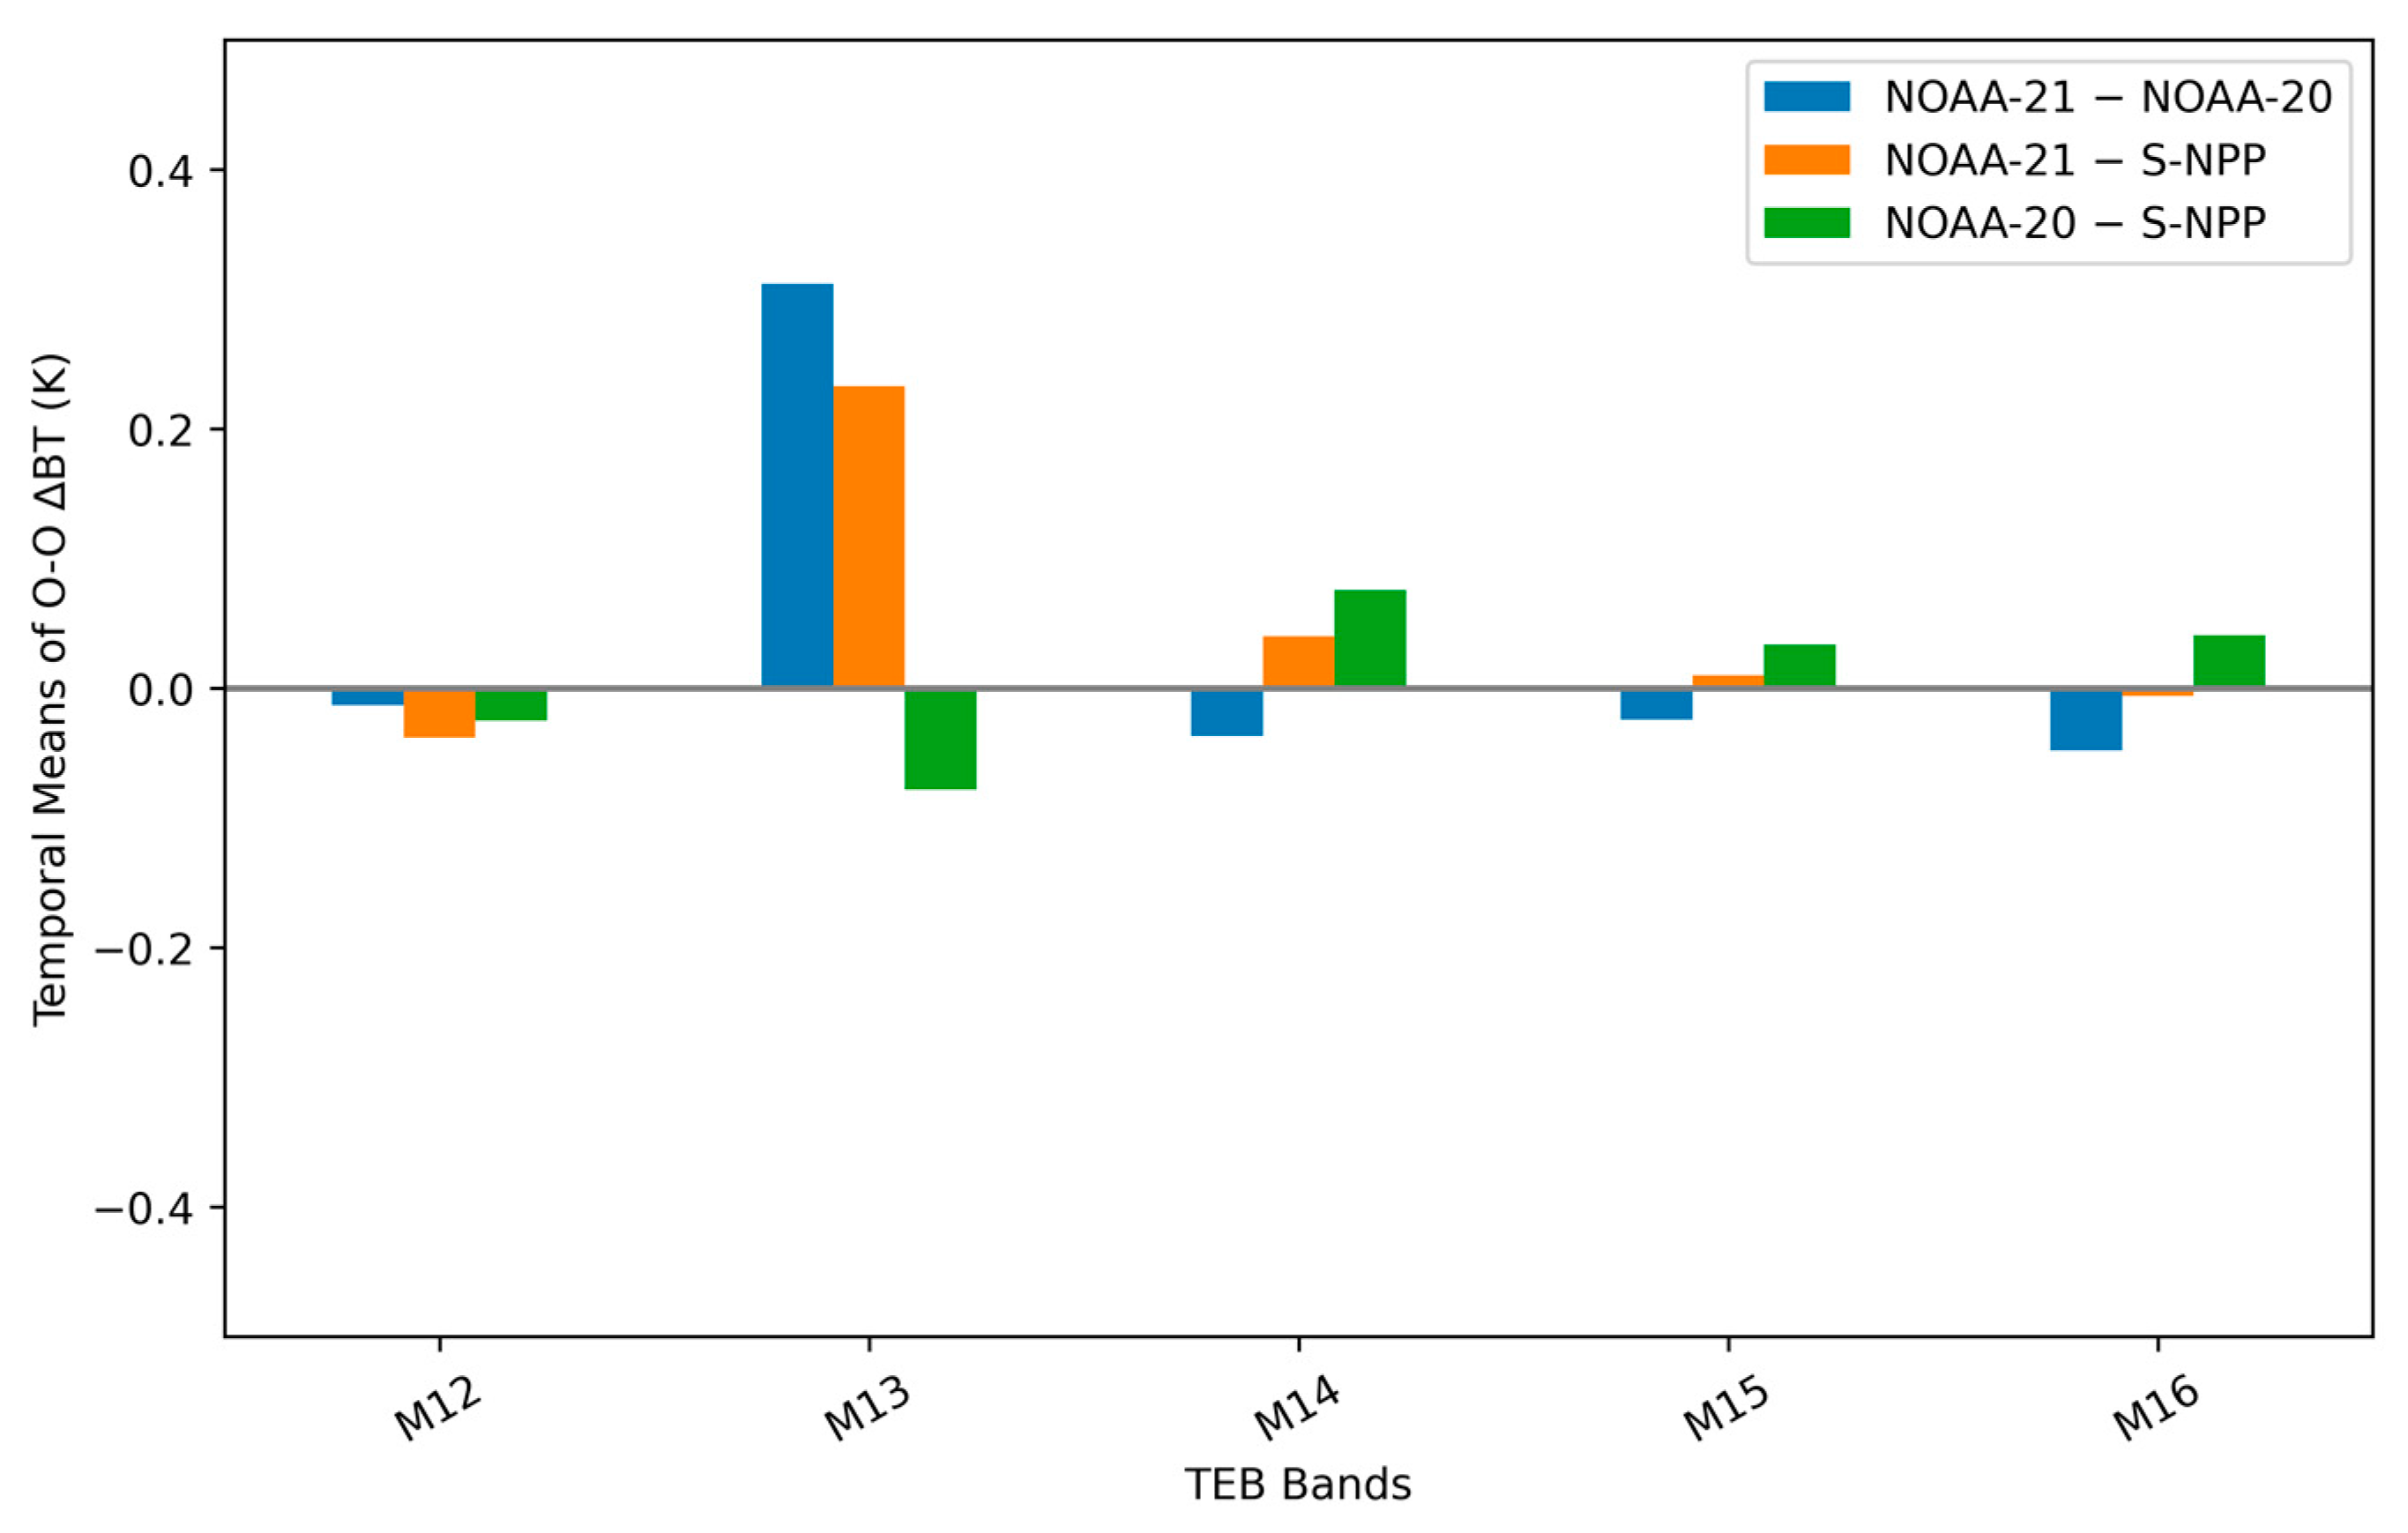
3.2.3. Analyses on the Spatial Variation of O-O ∆BTs
4. Discussion
5. Conclusions
Author Contributions
Funding
Data Availability Statement
Acknowledgments
Conflicts of Interest
References
- Lee, T.; Miller, S.; Schueler, C.; Miller, S. NASA MODIS previews NPOESS VIIRS capabilities. Weather Forecast. 2006, 21, 649–655. [Google Scholar] [CrossRef]
- Vargas, M.; Miura, T.; Shabanov, N.; Kato, A. An initial assessment of Suomi NPP VIIRS vegetation index EDR. J. Geophys. Res. Atmos. 2013, 118, 12301–12316. [Google Scholar] [CrossRef]
- Key, J.R.; Mahoney, R.; Liu, Y.; Romanov, P.; Tschudi, M.; Appel, I.; Maslanik, J.; Baldwin, D.; Wang, X.; Meade, P. Snow and ice products from Suomi NPP VIIRS. J. Geophys. Res. Atmos. 2013, 118, 12816–12830. [Google Scholar] [CrossRef]
- Petrenko, B.; Ignatov, A.; Kihai, Y.; Stroup, J.; Dash, P. Evaluation and selection of SST regression algorithms for JPSS VIIRS. J. Geophys. Res. Atmos. 2014, 119, 4580–4599. [Google Scholar] [CrossRef]
- Cao, C.; Zhang, B.; Shao, X.; Wang, W.; Uprety, S.; Choi, T.; Blonski, S.; Gu, Y.; Bai, Y.; Lin, L.; et al. Mission-Long Recalibrated Science Quality Suomi NPP VIIRS Radiometric Dataset Using Advanced algorithms for Time Series Studies. Remote Sens. 2021, 13, 1075. [Google Scholar] [CrossRef]
- Liang, X.; Ignatov, A. AVHRR, MODIS and VIIRS radiometric stability and consistency in SST bands. J. Geophys. Res. Ocean. 2013, 118, 3161–3171. [Google Scholar] [CrossRef]
- Madhavan, S.; Brinkmann, J.; Wenny, B.N.; Wu, A.; Xiong, X. Evaluation of VIIRS and MODIS Thermal Emissive Band calibration stability using ground target. Remote Sens. 2016, 8, 158. [Google Scholar] [CrossRef]
- Hulley, G.C.; Malakar, N.K.; Islam, T.; Freepartner, R.J. NASA’s MODIS and VIIRS Land surface temperature and emissivity products: A long-term and consistent earth system data record. IEEE J. Sel. Top. Appl. Earth Observat. Remote Sens. 2018, 11, 522–535. [Google Scholar] [CrossRef]
- Skakun, S.; Justice, C.O.; Vermote, E.; Roger, J.C. Transitioning from MODIS to VIIRS: An analysis of inter-consistency of NDVI data sets for agricultural monitoring. Int. J. Remote Sens. 2018, 39, 971–992. [Google Scholar] [CrossRef]
- Xiong, X.; Butler, J.; Chiang, K.; Efremova, B.; Fulbright, J.; Lei, N.; Mcintire, J.; Oudrari, H.; Sun, J.; Wang, Z.; et al. VIIRS on-orbit calibration methodology and performance. J. Geophys. Res. Atmos. 2014, 119, 5065–5078. [Google Scholar] [CrossRef]
- Efremova, B.; McIntire, J.; Moyer, D.; Wu, A.; Xiong, X. S-NPP VIIRS thermal emissive bands on-orbit calibration and performance. J. Geophys. Res. Atmos. 2014, 119, 10859–10875. [Google Scholar] [CrossRef]
- Wang, W.; Cao, C.; Blonski, S. Estimating the VIIRS Thermal Emissive Band Response Versus Scan (RVS) and Calibration Offsets Using On-Orbit Pitch Maneuver Data. IEEE Trans Geosci. Remote Sens. 2022, 60, 5002610. [Google Scholar] [CrossRef]
- Shrestha, A.; Xiong, X. Tracking long-term stability of MODIS thermal emissive bands response versus scan-angle using Dome C observations. In Algorithms, Technologies, and Applications for Multispectral and Hyperspectral Imagery XXV; SPIE: Bellingham, WA, USA, 2019; Volume 10986, pp. 550–558. [Google Scholar]
- Liu, T.; Xiong, X.; Shao, X.; Chen, Y.; Wu, A.; Chang, T.; Shrestha, A. Evaluation of aqua MODIS thermal emissive bands stability through radiative transfer modeling. Appl. Remote Sens. 2021, 15, 024502. [Google Scholar] [CrossRef]
- Chen, Y.; Weng, F.; Han, Y.; Liu, Q. Validation of the Community Radiative Transfer Model (CRTM) by using CloudSat data. J. Goephys. Res. 2008, 113, D00A03. [Google Scholar] [CrossRef]
- Chen, Y.; Han, Y.; van Delst, P.; Weng, F. Assessment of shortwave infrared sea surface reflection and nonlocal thermodynamic equilibrium effects in the community radiative transfer model using IASI data. J. Atmos. Ocean. Technol. 2013, 30, 2152–2160. [Google Scholar] [CrossRef]
- Liu, Q.; Boukabara, S. Community radiative transfer model (CRTM) applications in supporting the Suomi national polar-orbiting partnership (SNPP) mission validation and verification. Remote Sens. Environ. 2014, 140, 744–754. [Google Scholar] [CrossRef]
- Wu, X.; Smith, W.L. Emissivity of rough sea surface for 8–13 μm: Modeling and verification. Appl. Opt. 1997, 36, 2609–2619. [Google Scholar] [CrossRef] [PubMed]
- Zou, C.Z.; Goldberg, M.D.; Hao, X.-J. New generation of U.S. satellite microwave sounder achieves high radiometric stability performance for reliable climate change detection. Sci. Adv. 2018, 4, eaau0049. [Google Scholar] [CrossRef] [PubMed]
- Berg, W.; Bilanow, S.; Chen, R.; Datta, S.; Draper, D.; Ebrahimi, H.; Farrar, S.; Jones, W.L.; Kroodsma, R.; McKague, D.; et al. Intercalibration of the GPM Microwave Radiometer Constellation. J. Atmos. Ocean. Technol. 2016, 33, 2639–2654. [Google Scholar] [CrossRef]
- Chen, H.; Ebrahimi, H.; Jones, W.L. Creating a Multidecadal Ocean Microwave Brightness Dataset: Three-Way Intersatellite Radiometric Calibration Among GMI, TMI, and WindSat. IEEE J. Sel. Top. Appl. Earth Obs. Remote Sens. 2017, 10, 2623–2630. [Google Scholar] [CrossRef]
- Shao, X.; Liu, T.C.; Blonski, S.; Uprety, S.; Choi, T. Evaluation and correction of NOAA-21 VIIRS day night band stray light and comparison with SNPP and NOAA-20. In Earth Observing Systems XXVIII; SPIE: Bellingham, WA, USA, 2023; Volume 12685, pp. 282–291. [Google Scholar] [CrossRef]
- Cao, C.; Weinreb, M.; Sullivan, J. Solar contamination effects on the infrared channels of the advanced very high resolution radiometer (AVHRR). J. Geophys. Res. 2001, 106, 33463–33469. [Google Scholar] [CrossRef]
- Lin, G.; Wolfe, R.E.; Zhang, P.; Dellomo, J.J.; Tan, B. Ten years of VIIRS on-orbit geolocation calibration and performance. Remote Sens. 2022, 14, 4212. [Google Scholar] [CrossRef]
- Wolfe, R.E.; Lin, G.; Nishihama, M.; Tewari, K.P.; Tilton, J.C.; Isaacman, A.R. Suomi NPP VIIRS prelaunch and on-orbit geometric calibration and characterization. J. Geophys. Res. Atmos. 2013, 118, 11508–11521. [Google Scholar] [CrossRef]


| VIIRS TEBs | Central Wavelength (μm) | Central Wavelength (μm) | Central Wavelength (μm) | ||
|---|---|---|---|---|---|
| NOAA-21 | NOAA-21 | NOAA-21 | |||
| M12 | 3.688 | 3.696 | 3.693 | H2O | Sea surface temperature, Land surface type, Cloud mask. |
| M13 | 4.017 | 4.068 | 4.065 | − | Fires, Land surface type, Cloud mask, Dust. |
| M14 | 8.571 | 8.580 | 8.577 | H2O | Sea surface temperature, Land surface type, Cloud properties, Volcanic ash. |
| M15 | 10.640 | 10.693 | 10.710 | − | Sea surface temperature, Fires, VIIRS polar winds, Land surface temperature/type, Cloud properties, Cryosphere ice cover properties, Smoke/dust/volcanic ash. |
| M16 | 11.917 | 11.854 | 11.832 | H2O | Sea surface temperature, Fires, Land surface temperature/type, Cloud properties, Cryosphere ice cover properties, Volcanic ash. |
| VIIRS TEBs | Central Wavelength (μm) | Averaged Yearly BT Drift ± 95% CI (K/Decade) |
|---|---|---|
| M12 | 3.693 | 0.102 ± 0.076 |
| M13 | 4.065 | 0.061 ± 0.043 |
| M14 | 8.577 | −0.016 ± 0.037 |
| M15 | 10.710 | 0.049 ± 0.040 |
| M16 | 11.832 | 0.028 ± 0.035 |
| VIIRS TEBs | O-B ΔBT ± σ (K) (ΔBT: Temporal Mean of Daily Mean ΔBT; σ: Standard Deviation) | ||
|---|---|---|---|
| NOAA-21 | NOAA-20 | S-NPP | |
| M12 | 0.42 ± 0.09 | 0.43 ± 0.09 | 0.46 ± 0.09 |
| M13 | 0.04 ± 0.06 | −0.27 ± 0.05 | −0.20 ± 0.05 |
| M14 | −0.28 ± 0.03 | −0.25 ± 0.03 | −0.32 ± 0.03 |
| M15 | −0.16 ± 0.04 | −0.14 ± 0.04 | −0.17 ± 0.04 |
| M16 | −0.24 ± 0.04 | −0.20 ± 0.04 | −0.24 ± 0.04 |
| VIIRS TEBs | O-O ΔBT ± σ (K) (ΔBT: Temporal Mean of Daily Mean ΔBT; σ: Standard Deviation) | ||
|---|---|---|---|
| NOAA-21–NOAA-20 | NOAA-21–S-NPP | NOAA-20–S-NPP | |
| M12 | −0.013 ± 0.074 | −0.038 ± 0.071 | −0.024 ± 0.075 |
| M13 | 0.312 ± 0.045 | 0.234 ± 0.041 | −0.078 ± 0.040 |
| M14 | −0.037 ± 0.036 | 0.040 ± 0.034 | 0.076 ± 0.036 |
| M15 | −0.024 ± 0.040 | 0.01 ± 0.038 | 0.034 ± 0.040 |
| M16 | −0.048 ± 0.042 | −0.006 ± 0.040 | 0.042 ± 0.042 |
Disclaimer/Publisher’s Note: The statements, opinions and data contained in all publications are solely those of the individual author(s) and contributor(s) and not of MDPI and/or the editor(s). MDPI and/or the editor(s) disclaim responsibility for any injury to people or property resulting from any ideas, methods, instructions or products referred to in the content. |
© 2024 by the authors. Licensee MDPI, Basel, Switzerland. This article is an open access article distributed under the terms and conditions of the Creative Commons Attribution (CC BY) license (https://creativecommons.org/licenses/by/4.0/).
Share and Cite
Zhang, F.; Shao, X.; Cao, C.; Chen, Y.; Wang, W.; Liu, T.-C.; Jing, X. Evaluation of VIIRS Thermal Emissive Bands Long-Term Calibration Stability and Inter-Sensor Consistency Using Radiative Transfer Modeling. Remote Sens. 2024, 16, 1271. https://doi.org/10.3390/rs16071271
Zhang F, Shao X, Cao C, Chen Y, Wang W, Liu T-C, Jing X. Evaluation of VIIRS Thermal Emissive Bands Long-Term Calibration Stability and Inter-Sensor Consistency Using Radiative Transfer Modeling. Remote Sensing. 2024; 16(7):1271. https://doi.org/10.3390/rs16071271
Chicago/Turabian StyleZhang, Feng, Xi Shao, Changyong Cao, Yong Chen, Wenhui Wang, Tung-Chang Liu, and Xin Jing. 2024. "Evaluation of VIIRS Thermal Emissive Bands Long-Term Calibration Stability and Inter-Sensor Consistency Using Radiative Transfer Modeling" Remote Sensing 16, no. 7: 1271. https://doi.org/10.3390/rs16071271