Article

The Detectability of Post-Seismic Ground Displacement Using DInSAR and SBAS in Longwall Coal Mining: A Case Study in the Upper Silesian Coal Basin, Poland

by
K. Pawłuszek-Filipiak
1,*,
N. Wielgocka
1 and
Ł. Rudziński
2
1
Institute of Geodesy and Geoinformatics, Wroclaw University of Environmental and Life Sciences, 50-357 Wrocław, Poland
2
Institute of Geophysics, Polish Academy of Sciences, 01-452 Warszawa, Poland
*
Author to whom correspondence should be addressed.
Remote Sens. 2024, 16(14), 2533; https://doi.org/10.3390/rs16142533
Submission received: 17 May 2024 / Revised: 3 July 2024 / Accepted: 5 July 2024 / Published: 10 July 2024
(This article belongs to the Section Earth Observation Data)

Abstract

:
The Upper Silesian coal basin (USCB) in Poland faces significant ground deformation issues resulting from mining activities conducted without backfill, which can persist for years. These activities can cause damage to surface structures and phenomena such as induced seismicity. Ground deformations can be monitored using differential synthetic aperture radar interferometry (DInSAR). However, various DInSAR approaches have their own advantages and limitations, particularly regarding accuracy and atmospheric filtering. This is especially important for high-frequency displacement signals associated with seismic activity, which can be filtered out. Therefore, this study aims to assess the detectability of mining-induced seismic events using interferometric techniques, focusing on the USCB area. In this experiment, we tested two InSAR approaches: conventional DInSAR without atmospheric filtering and the small baseline subset (SBAS) approach, where the atmospheric phase screen was estimated and removed using high-pass and low-pass filtering. The results indicate that, in most cases, post-seismic ground displacement is not detectable using both methods. This suggests that mining-related seismic events typically do not cause significant post-seismic ground displacement. Out of the 17 selected seismic events, only two were clearly visible in the DInSAR estimated deformation, while for four other events, some displacement signals could neither be definitively confirmed nor negated. Conversely, only one seismic event was clearly detectable in the SBAS displacement time series, with no evidence of induced tremors found for the other events. DInSAR proved to be more effective in capturing displacement signals compared to SBAS. This could be attributed to the small magnitude of the tremors and, consequently, the small size of the seismic sources. Throughout the investigated period, all registered events had magnitudes less than 4.0. This highlights the challenge of identifying any significant influence of low-magnitude tremors on ground deformation, necessitating further investigations. Moreover, SBAS techniques tend to underestimate mining displacement rates, leading to smoothed deformation estimates, which may render post-seismic effects invisible for events with low magnitudes. However, after an in-depth analysis of the 17 seismic events in the USCB, DInSAR was found to be more effective in capturing displacement signals compared to SBAS. This indicates the need for significant caution when applying atmospheric filtering to high-frequency displacement signals.

1. Introduction

Underground coal mining leads to various phenomena that pose significant anthropogenic hazards. Both the Geological and Mining Law in Poland and the requirements outlined in the Environmental Protection Act mandate the mining industry to monitor the impacts of mining activities on the surface, particularly those threatening engineering and civil structures. Ground deformation resulting from excavated mining panels, often conducted without backfill, can lead to substantial ground deformations [1,2,3]. These deformations may persist for years after mining operations cease [4,5,6]. Ground subsidence can cause damage to surface facilities within the mining area [7] and may also trigger other hazardous phenomena such as landslides [8]. Hence, understanding and accurately estimating ground deformation is crucial for mining regions globally [9,10,11].
Moreover, another critical hazard in mining regions is associated with mining-induced seismic activity, e.g., [12] and references therein. These seismic events, induced by mining activities, can result in weak to moderate ground shaking, often noticed by local residents. Typically, the sources of mining-induced earthquakes are situated relatively shallow, usually no deeper than 1–3 km, often less than 1 km below the surface. Therefore, even the vibrations generated by minor earthquakes should be regarded as hazardous for surface infrastructure and people’s lives. Also, shallow sources can be associated with deformations formed on the ground in the vicinity of epicenters. In Poland, there are primarily two seismically active mining regions: the Legnica–Głogów Copper District (LGCD) and the Upper Silesian coal basin (USCB). Located in southern Poland, the USCB region belongs to the old hard coal mining area. The coal has been excavated here for more than 100 years. The peak of the excavation was reached in the late seventies of the last century and has regularly decreased because of the resignation of coal production. Even though the production has decreased, the USCB coal mines are going to be in operation at least until 2049. The area is also heavily populated, with more than 3 million residents living in some places in the vicinity of mining shafts. Since 1974, over 56,000 mining tremors with a magnitude (M) greater than 1.5 have been recorded in the USCB [3,13]. From a physical point of view, natural and mining-induced seismic events do not exhibit significant differences. Generally, they tend to have smaller magnitudes and affect smaller regions. However, unlike natural earthquakes, some mining sources can manifest as non-double-couple (non-DC) sources, including a high level of isotropic parts in mechanism models. These non-DC sources are well-suited to explaining collapses of mining tunnels [14,15] and are closely linked to ground deformations [3,11]. While most mining-induced events are located in the vicinity of currently operated excavation fronts, stronger earthquakes can happen at some distance from the operated mining panels. In some cases, these sources can be characterized by a deeper location of the focal point and typically are more likely characterized by a double-couple model of earthquakes. The size of the seismic source depends on the event magnitude [16]. While micro-earthquakes with magnitudes less than two are characterized by rupture sizes of 10–100 m and fault displacements of 0.4–4 mm, strong earthquakes with magnitudes of above 8–10 can have rupture lengths of up to 1000 km and fault displacements of up to 40 m. These facts are important if we consider that the ground deformations are related to the depth of a particular seismic source. For natural seismicity, the depth of earthquakes in subduction zones can be located even more than 300 km below the surface. Because of the depth of their location, even strong earthquakes can have less impact on the surface than smaller, shallower events. Most seismic sources are deep enough to prevent any co-seismic discontinuous deformation from appearing on the ground (e.g., a fault plane visible on the surface). Therefore, only geodetic measurements can provide information about ground deformation around the epicenter. In Poland, particularly in the regions of LGCD and USCB, the strongest mining-induced events typically have magnitudes around 4 [13,15,17]. Earthquakes of this magnitude are characterized by source dimensions ranging from 0.1 to 1 km [16]. This implies that ground changes, if they happen, should be observed within approximately 1 km from the epicenter location.
Monitoring ground deformation in mining areas is typically conducted using conventional geodetic techniques, such as leveling or total stations [4], as well as GNSS applications [18]. However, these methods are limited by their point-based nature, requiring a large number of measurements to achieve spatially dense information about ground deformation. Consequently, monitoring with traditional geodetic techniques, especially in large study areas, is time-consuming [9,19], with measurements confined to specific areas of a few square kilometers [19,20,21]. Additionally, laser scanners [22] have been utilized for monitoring purposes. In this case, the limitation lies in the time resolution of the data used. Differential synthetic aperture radar interferometry (DInSAR) utilizes phase information for ground deformation estimation, offering a greater number of measurements and, thus, better spatial density compared to conventional geodetic techniques [7]. This enables a more effective capture of surface deformation characteristics and their spatial and temporal behavior. The Sentinel-1 mission, which acquires images with a temporal baseline of 6 days, has opened new avenues for studying temporal ground deformation behavior. Numerous applications of such data exist for estimating ground deformation caused by earthquakes or coal exploitation. However, these studies typically focus on individual seismic events [3,22,23,24,25] or specific mines [26,27] and do not generally consider post-seismic displacement detectability using InSAR for a broader range of seismic events.
Conventional DInSAR approaches are susceptible to atmospheric artifacts, prompting the scientific community to introduce stacking-based methods to mitigate this effect, such as persistent scatterers interferometry [28,29,30,31,32], small baseline subsets [32], and other techniques [33]. These methods estimate and remove interferometric components corresponding to the atmosphere by leveraging its physical properties: high spatial correlation and low temporal correlation. In this case, atmospheric correction is performed without external data, based on the assumption that the atmospheric phase screen is uncorrelated in time. To reduce the negative impact of the atmosphere on DInSAR processing results, corrections with external data should be applied. These include methods based on ground observations, utilizing GNSS or weather stations [34], satellite observations, such as MODIS and MERIS [35], numerical weather models such as ECMWF [36], or their combination in GACOS [37]. However, in stacking-based methods, there is a risk that interferometric signals from seismic events, which exhibit similar characteristics to atmospheric noise (small correlation in time and high spatial correlation), can be mistakenly removed from the final time series estimates. A drawback of external corrections is their low spatial resolution or daily solutions, which are insufficient to reduce local and rapid atmospheric changes [38].
Considering the opportunities presented by DInSAR and the significance of mining-induced seismicity, in this study using interferometric techniques, we aim to assess the detectability of ground displacement in the InSAR results caused by seismic events related to coal mining, which usually have magnitudes less than four. Given the diverse advantages and limitations of various DInSAR techniques, both conventional DInSAR and the stacking-based method (SBAS) were employed in this work. Furthermore, previous research on mining-induced deformation and seismicity has been explored from a broader perspective, not focusing on single events only, by [17] in the LGCD area in Poland. However, to our knowledge, there has been no comprehensive study investigating multiple seismic events in one of the largest coal exploitation areas in Europe, namely the USCB in Poland. Here, we selected the USCB region for our investigation, as the results could provide new insights into deformations caused by the longwall mining systems. This system differs from the room-and-pillar excavation method used in the LGCD copper mines. Additionally, the novelty of our work deals with an approach that is focused on multiple seismic events rather than concentrating solely on one specific mining-induced earthquake. The main research question that we aim to answer using this study is whether mining-induced ground displacement can be detectable using DInSAR and SBAS methods.

2. Definition of the Problem

2.1. Displacement Sources Caused by Underground Mining Exploitation

Detecting the interferometric signal corresponding to seismic events with M < 4 is very challenging in the area of mining activity. This difficulty arises primarily due to two deformation sources. The first source is the ground response to the excavation of geo-resources, and the second is the deformation resulting from seismic activity. To address this issue, mining deformation can be modeled by using the Mogi model [39]. This model was originally developed to estimate the deformation caused by volcanic activity [34] and is characterized by non-DC isotropic seismic sources similar to those induced by mining. Despite being initially designed for volcanic activity, the Mogi model is applied for first-order deformation estimation caused by other phenomena due to its simplicity and universal character [40,41,42,43]. The Mogi model is an analytical model that describes the magnitude and direction of ground displacements due to the changes in volume or pressure of a point in a uniform elastic half-space. The displacements of any point on the surface can be calculated from the following equations [39]:
v U = 3 V d 4 π ( d 2 + r 2 ) 3 2   ;   v H = 3 V r 4 π ( d 2 + r 2 ) 3 2
where
v U vertical deformation component,
v H horizontal deformation component,
V volume change,
d depth,
r horizontal distance from points located on a flat surface to the surface projection of the source position.
The authors of [17] conducted a study in the LGCD area of Poland, simulating the behavior of displacement time series in active underground mining areas affected by seismic events. Mining deformations were modeled by using the Mogi model, incorporating specific parameters such as volume change and depth, which can vary between mines and different seams [11]. Nevertheless, for the simulation purposes and conceptualization of the problem, the exact values of these parameters are not critical and can be found in detail in [17].
Figure 1a illustrates subsidence resulting from mining exploitation, with a seismic event represented by the red line positioned at the center of the subsidence basin. In Figure 1b, a similar scenario is shown, where both mining exploitation and a seismic event are centered in the subsidence basin. However, the signal originating from the seismic event has been filtered out, making it undetectable in the displacement time series. This situation may occur when a seismic event occurs but does not induce visible ground displacement, either caused by the nature of the seismic event or due to atmospheric filtering. Figure 1c shows a seismic event located at the edge of the subsidence basin, while Figure 1d describes a scenario where a seismic event occurs at the basin’s edge; however, a portion of the signal is filtered out through the atmospheric phase screen (APS) estimation, thereby removing it from the displacement time series.

2.2. SAR Interferometry

Satellite differential radar interferometry is based on the principle that the phase difference between two synthetic aperture radar (SAR) acquisitions captured over the same area is proportional to surface deformation [26]. The principles underlying this technique have been extensively studied [39,44,45,46], with many highlighting its effective application for monitoring significant ground displacements [7,10]. However, the effectiveness of DInSAR relies on deformations producing phase differences significantly larger than those caused by atmospheric effects [41]. Generally, atmospheric artifacts can induce phase differences equivalent to up to half a fringe [42], which with Sentinel-1 can translate to differences up to 2.7 cm. The small magnitude of mining-induced tremors in the USCB, characterized by fault plane displacements ranging from 4 to 40 mm, interferometric signals from these events may be subtle and could go unnoticed if significant atmospheric disturbances are present and corrections are not applied.
To mitigate errors primarily associated with possible atmospheric artifacts, multi-temporal InSAR techniques (MTInSAR), also known as stacking-based techniques, have been developed by the scientific community [39,44,45,46,47]. Essentially, MTInSAR, through the processing of multiple images over time (usually more than 20 pictures), subtracts various interferometric components corresponding to deformation, topographic error, atmospheric error, and orbital errors [7]. These interferometric components between two SAR images δ ϕ j can be represented by the following Equation (2):
δ ϕ j = ϕ t B ϕ t A 4 π λ d t B d t A + 4 π λ B Δ z R s i n θ + ϕ a t m d t B ϕ a t m d t A + Δ n j ,     j = 1 , , M  
where
λ is a sensor wavelength,
ϕ t B , x , r and ϕ t A , x , r are the phases that correspond to times t A and t B ,
d t B , x , r and d t A , x , r are the radar Line of Sight (LOS) projection of cumulative deformation,
Δ z corresponds to topographic error,
ϕ a t m d t B , x , r ϕ a t m d t A , x , r reference as atmospheric phase component between two images (A,B),
Different assumptions are typically applied to estimate various interferometric components effectively, such as those connected with the expected deformation pattern over time (e.g., a linear model is often employed) [28,29,30]. However, these assumptions can pose challenging issues when the actual deformation pattern significantly diverges from the assumed displacement model. Additionally, to mitigate atmospheric artifacts from the differential interferograms, high-pass temporal and low-pass spatial filtering is commonly applied. These filters leverage the physical properties of the atmosphere, such as high spatial correlation (e.g., 1 km) and low temporal correlation (typically over one year). In the case of seismic events, which are characterized by sudden and non-continuous interferometric signals, these signals can be erroneously treated as atmospheric artifacts and mistakenly removed through low-pass filtering. This issue has been extensively discussed by [17].
Therefore, considering the advantages and limitations of various interferometric processing techniques, especially those involving deformation models and APS filtering, we opted to apply both approaches to assess whether estimated deformations using InSAR could be utilized for post-seismic ground displacement detectability.
There are two approaches to the DInSAR processing: cumulative and consecutive DInSAR. Cumulative DInSAR processing uses one fixed master image, with slave images selected sequentially (e.g., φ1-2, φ1-3, φ1-4,… φ1-n) (Figure 2b). A drawback of this approach is that the temporal baseline between images (e.g., φ1-n) becomes increasingly extended, leading to greater temporal decorrelation and reduced coherence, especially with short wavelength sensors. Consecutive DInSAR, on the other hand, generates differential interferograms of neighboring SAR acquisitions, which are then accumulated to form a complete time series interferometric results (e.g., φ1-2, φ2-3, φ3-4,… φn-1, n) (Figure 2a). This method utilizes shorter temporal baselines (6 days in the case of Sentinel 1A/B), thereby reducing temporal decorrelation [10]. However, this approach also has its limitations. Specifically, errors in calculated deformations (such as residual terrain, atmospheric delay, and other phase errors) in the interferograms can propagate through subsequent time series deformation results [48].
Similarly, Figure 2c illustrates the image connection graph for the persistent scatterer interferometry approach (PSInSAR) [29,30]. In this case, coherence also decreases over time due to the extended temporal baseline. In contrast to PSInSAR, the small baseline subset (SBAS) technique calculates interferograms between neighboring images, allowing for better spatial coverage, especially in rural areas. The area of interest in this study is highly populated, but a lot of mining panels are located under places with minimal urbanization. Thus, numerous forested and agricultural areas can affect backscattering stability (Appendix A). Therefore, to maximize coherence and provide dense spatial coverage of the interferograms, consecutive DInSAR and SBAS techniques were deemed more appropriate and were selected for the study presented in this paper. A comprehensive overview and the fundamentals of SBAS can be found in [33,49].

3. Materials and Method

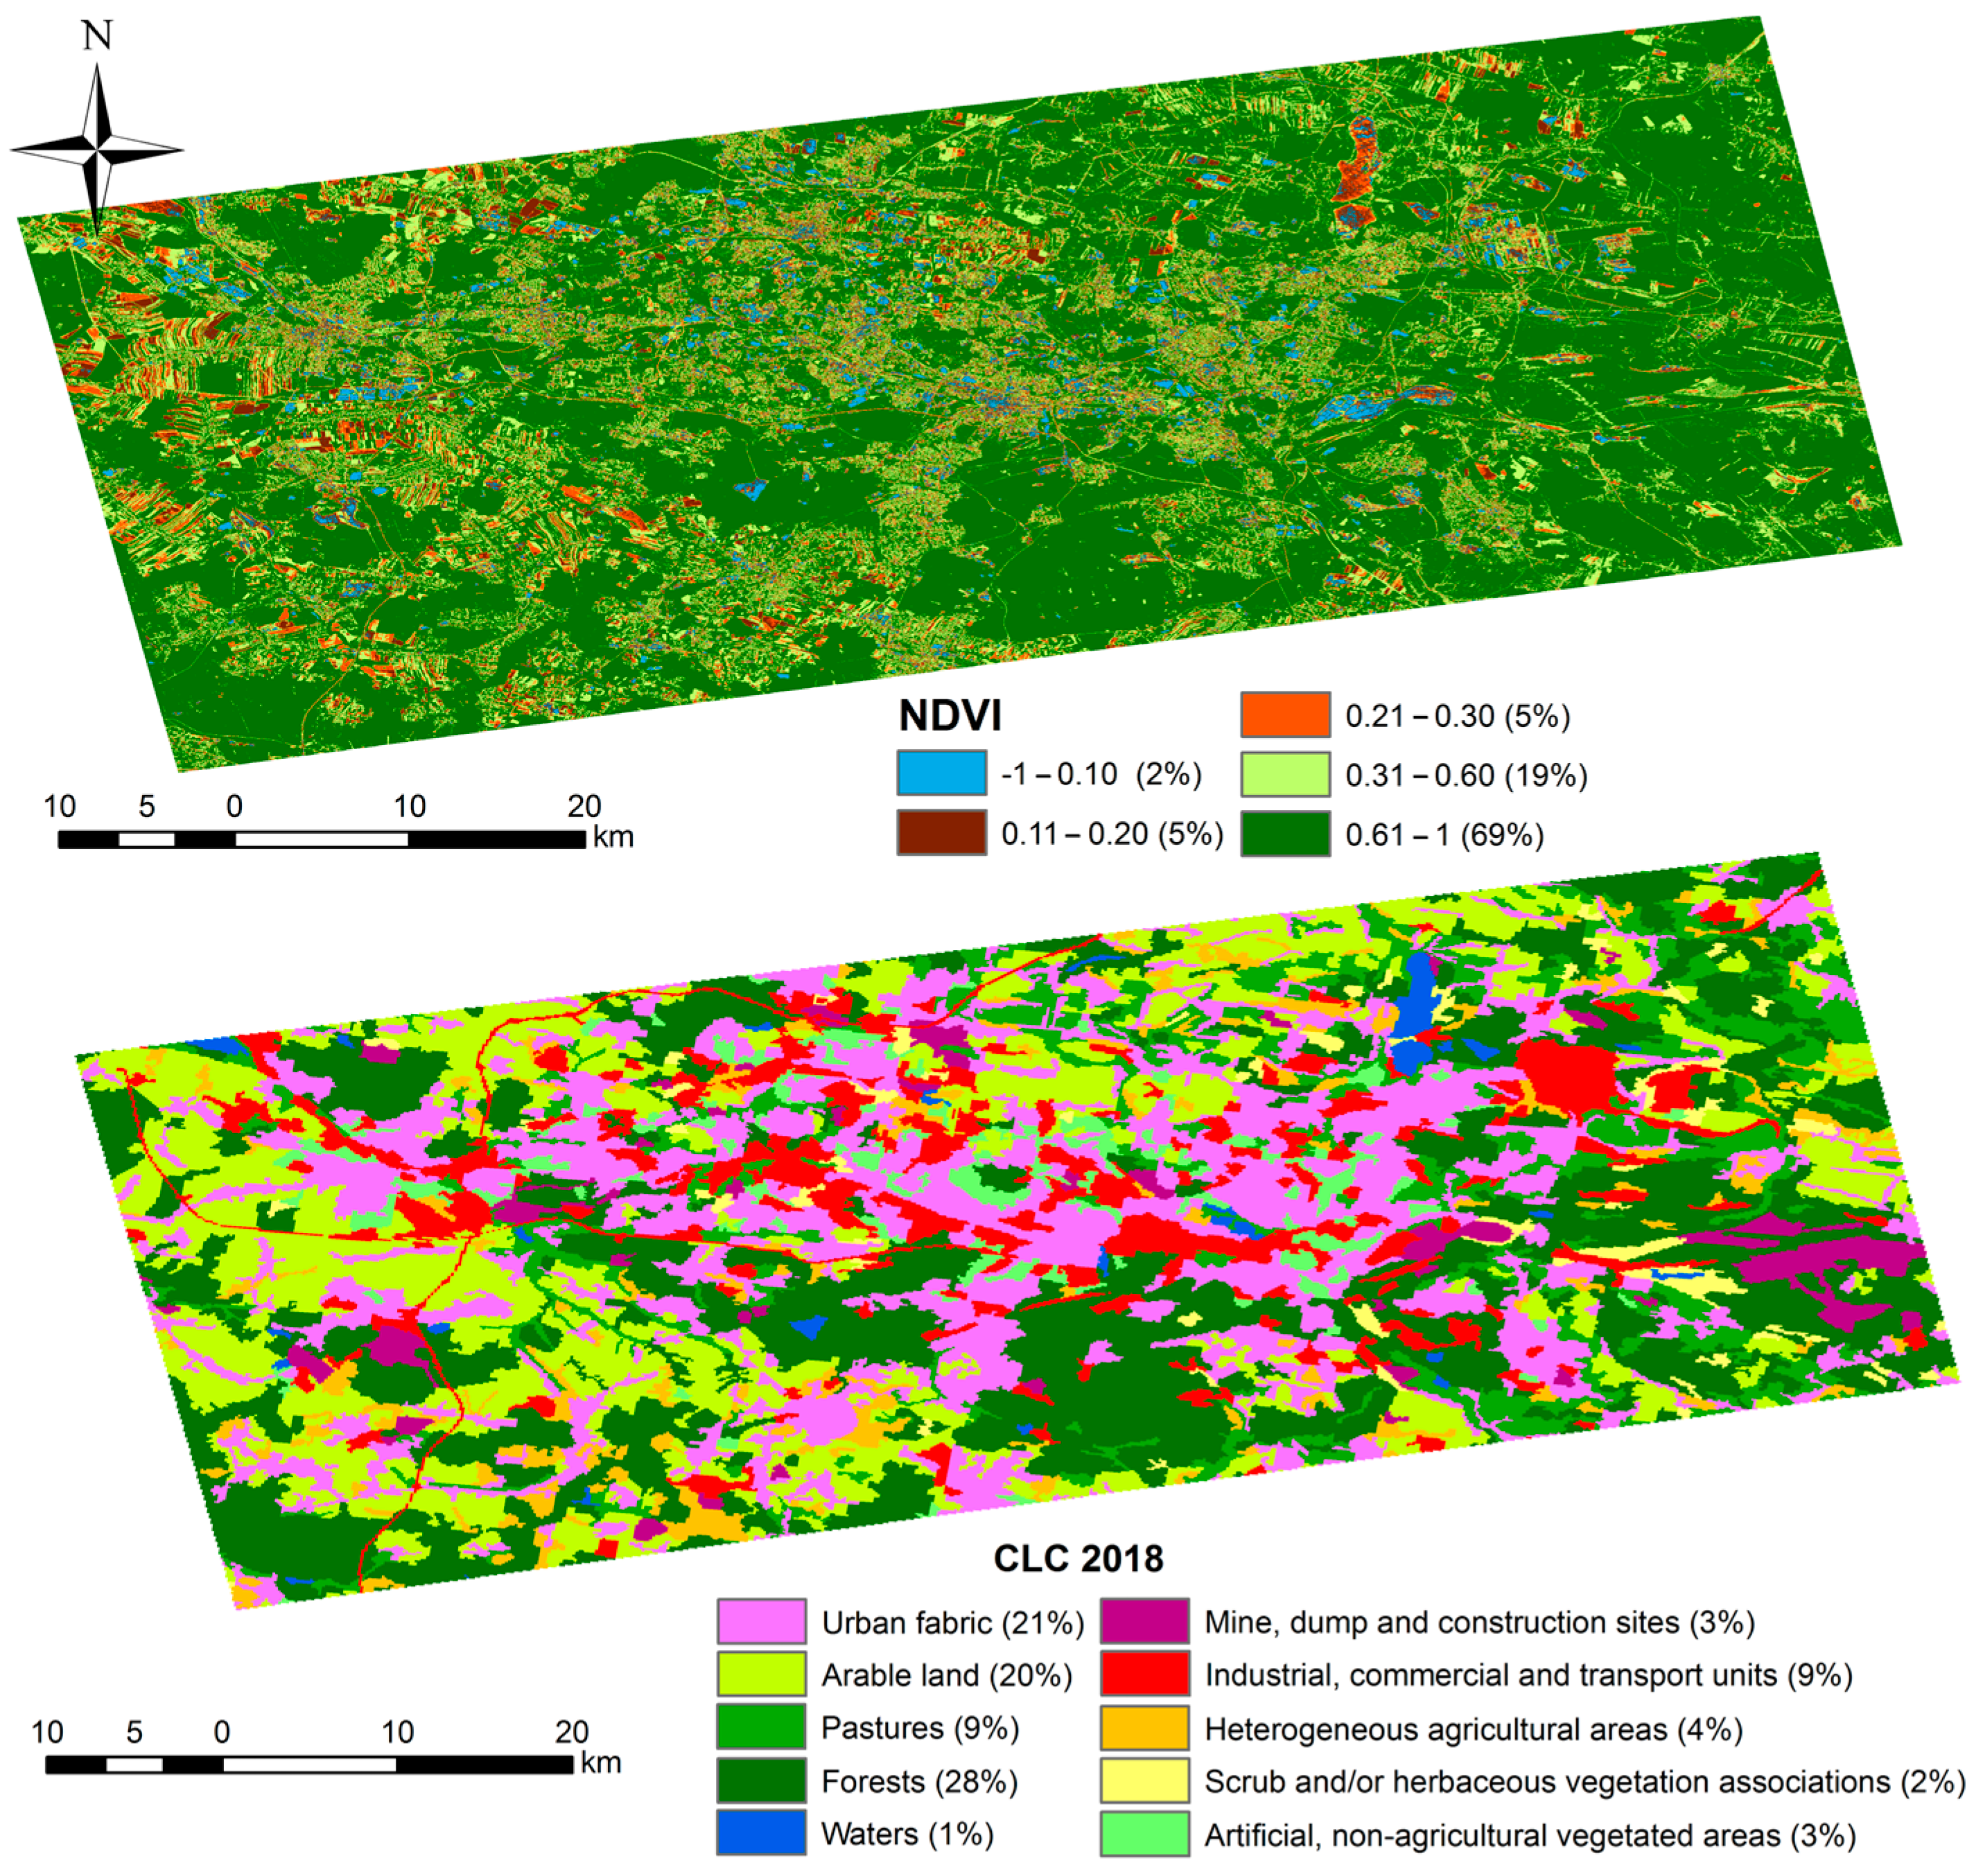
3.1. Area of Interest

The Upper Silesian coal basin stands as one of the largest coal mining regions in Europe, covering approximately 7400 km2. The majority of this area, about 5800 km2, lies within Poland, while the remainder is situated in the Czech Republic [50]. Coal extraction in the USCB dates back to the 19th century and has continued to the present day. The peak of excavation occurred during the 1970s and 1980s, with coal production reaching nearly 200 million tons annually from approximately 70 coal mines. However, diminishing coal reserves led to the closure of several mines, resulting in a total production decline of 71 million tons per year [51,52]. Currently, coal deposits in the region are exploited by 20 active mines, with the largest in Poland being KWK ROW, formed by the merger of the former Marcel, Rydułtowy, and Chwałowice coal mines.
The study area under investigation covers the upper section of the USCB, spanning approximately 2037 km2 (Figure 3). This area is one of the most densely populated regions in Poland, with nearly three million inhabitants. Major urban centers in the vicinity include Katowice, Sosnowiec, Bytom, Ruda Śląska, Zabrze, and Gliwice. Surrounding this urban agglomeration, the study area features extensive vegetation, predominantly forests. Appendix A presents the normalized difference vegetation index (NDVI) calculated from Sentinel-2 data and the Corine Land Cover (CLC). As indicated in Appendix A, approximately 69% of the study area exhibits NDVI values exceeding 0.6, suggesting significant coverage by dense vegetation and forested areas. According to the Corine Land Cover (CLC) data, forests account for the largest portion of land use (28%), followed by arable land (20%), aligning with the NDVI values. However, estimating deformations using InSAR in vegetated regions presents challenges due to coherence loss.
Seismic activity within the USCB is closely monitored by all mines, each employing localized in-mine systems. These systems operate in conjunction with the Upper Silesian Regional Seismological Network (USRSN), managed by the Central Mining Institute, Katowice [53]. This network meticulously records and provides data on the location and magnitude of the most significant seismic events occurring in the USCB region (http://www.grss.gig.eu/pl/ (accessed on 1 June 2024)). The network consists of several seismic stations that cover frequency ranges between 0.125 and 100 Hz, ensuring the capability to record minor seismic activity throughout the region. While most earthquakes recorded in USCB are relatively weak and not felt on the surface, a few events each year are associated with underground tunnel collapse. These events, known as rock bursts, usually are characterized by magnitudes over 3.0 and often result in dramatic accidents, sometimes with fatalities among miners.
For our study, we analyzed the period from 1 January 2017, to 9 August 2018. During this timeframe, the local seismic network USRSN recorded a total of 134 seismic events (Figure 2c) with magnitudes greater than 2.

3.2. Data Used

In the presented study, we employed 95 ascending Sentinel-1A/B TOPSAR images (C-band) with a revisiting time of 6 days, covering the upper section of the USCB. To remove the topographic phase component, we used the ALOS-3D Digital Elevation Model (DEM) with a 30 m resolution, provided by the Japan Aerospace Exploration Agency (JAXA) [54]. Precise orbit determination (POD) data, supplied by the European Space Agency (ESA), were used for orbital refinement and phase re-flattening. Additionally, seismic events recorded by the USRSN were downloaded from the web platform. The extended characteristics of the utilized data are presented in Table 1.

3.3. Methods

The overall methodology flowchart is depicted in Figure 4. Specifically, the SAR data presented in Section 3.2 were independently processed using both DInSAR methods: consecutive DInSAR and SBAS. To localize seismic events, the time series deformation estimated in the LOS was extracted. Additionally, time series profiles were extracted for the selected subsidence areas to evaluate the detectability of these events. Given that 134 seismic events were recorded during the investigated period, we focused on subsidence basins where the strongest tremors occurred (we selected five seismic events with the largest magnitude). It is worth noting that some subsidence areas experienced more than one seismic event during this period, allowing us to investigate post-seismic effects for a total of 17 seismic tremors. A more detailed description of the consecutive DInSAR and SBAS processing is provided in the following subsections.

3.3.1. DInSAR Processing

The Sentinel-1 data were processed following the standard consecutive DInSAR approach described in Section 2.2. Interferograms with the smallest temporal baseline of six days between adjacent SAR acquisitions were calculated and accumulated to generate complete time series displacement results. This technique minimizes temporal decorrelation by using small temporal baselines, thereby capturing more information. In the SARscape software 5.6.2, DInSAR results are also reflattened and refined using reference points. The refinement and reflattening step applied a third-degree polynomial to the selected reference points to compute and discard the phase constant and ramp, which correspond to the orbital errors [55,56]. The reference points were chosen outside the deformation and seismically active areas on highly coherent pixels (i.e., coherence bigger than 0.9), where unwrapped values showed no residuals and no phase jumps. These points were primarily located in urbanized areas, where high coherence and no displacement are expected.

3.3.2. SBAS Processing

Similarly to DInSAR, the interferometric processing within the SBAS processing chain includes coregistration, interferogram generation, multi-looking filtering, and phase unwrapping. The slave images were coregistered to the master images with the assistance of the DEM. Following the coregistration step, a multi-looking factor of 4 × 1 was applied to enhance the signal-to-noise ratio (SNR) of the interferograms and to generate squared pixels. Goldstein filtering with a window size of 64 was then utilized to smooth the results and facilitate the phase unwrapping (PhU) step. For the PhU, a coherence threshold of 0.2 was set, and the minimum cost flow (MCF) algorithm with a regular grid covering the data extent was applied [57].
To mitigate unwrapping errors caused by low-coherence pixels, a decomposition level (DL) was employed. The DL performs data multi-looking and undersampling iteratively to unwrap the interferograms at a lower resolution before reconstructing them back to the original resolution [55,56]. Nine reference points were used for the refinement and reflattening step. The refinement and reflattening step implemented in the SARScape software aims to estimate and remove remaining offsets and ramps from the ingested unwrapped phase stack. Final calibration is applied to the slant range products (velocity, height, and displacement) during the geocoding step by using reference points (also called ground control points—GCP). GCPs must be characterized by high coherence, zero displacement, and zero residual topography since all the pixels within the area of interest are calibrated to these final GCPs. A third-degree polynomial was applied to the selected nine GCPs to compute and discard the phase constant and ramp during the refinement and reflattening steps. The same points were used in the DInSAR and SBAS processing.
In the first inversion step, the SBAS inversion kernel was implemented to provide the initial displacement rate estimation and residual topography using a cubic model [32]. In the second inversion step, after the initial displacement estimation, atmospheric filtering was carried out based on the previous result. The estimated APS was removed from the initial estimated results. The window size of the filtering was set to 1200 m for spatial filtering and 365 days for temporal filtering. Finally, the displacement time series and mean displacement map were geocoded according to the WGS84 reference system.

4. Results

4.1. Deformation Estimated by SBAS and DInSAR in the Area of USCB

The time series deformation estimated by DInSAR and SBAS is presented in Figure 5a,b, respectively. Both methods estimate maximum subsidence levels of 1.25 m and 1.50 m, correspondingly. The maximum uplift is estimated at 0.15 m for SBAS and 0.35 m for DInSAR. Comparing Figure 5a,b, positive values of 0.35 m, represented as yellow, are particularly noticeable in the upper left part of Figure 5b. Since the APS has not been removed from the DInSAR results, these values correspond to accumulated atmospheric artifacts.
In contrast, DInSAR captures more detailed information within the centers of the subsidence basins, where SBAS failed due to the use of a cubic displacement model over time. Nonetheless, SBAS successfully estimates displacement for more than 20 subsidence basins within the study area using both InSAR approaches. Most of these subsidence basins are situated in the western part of the analyzed area (Figure 5).

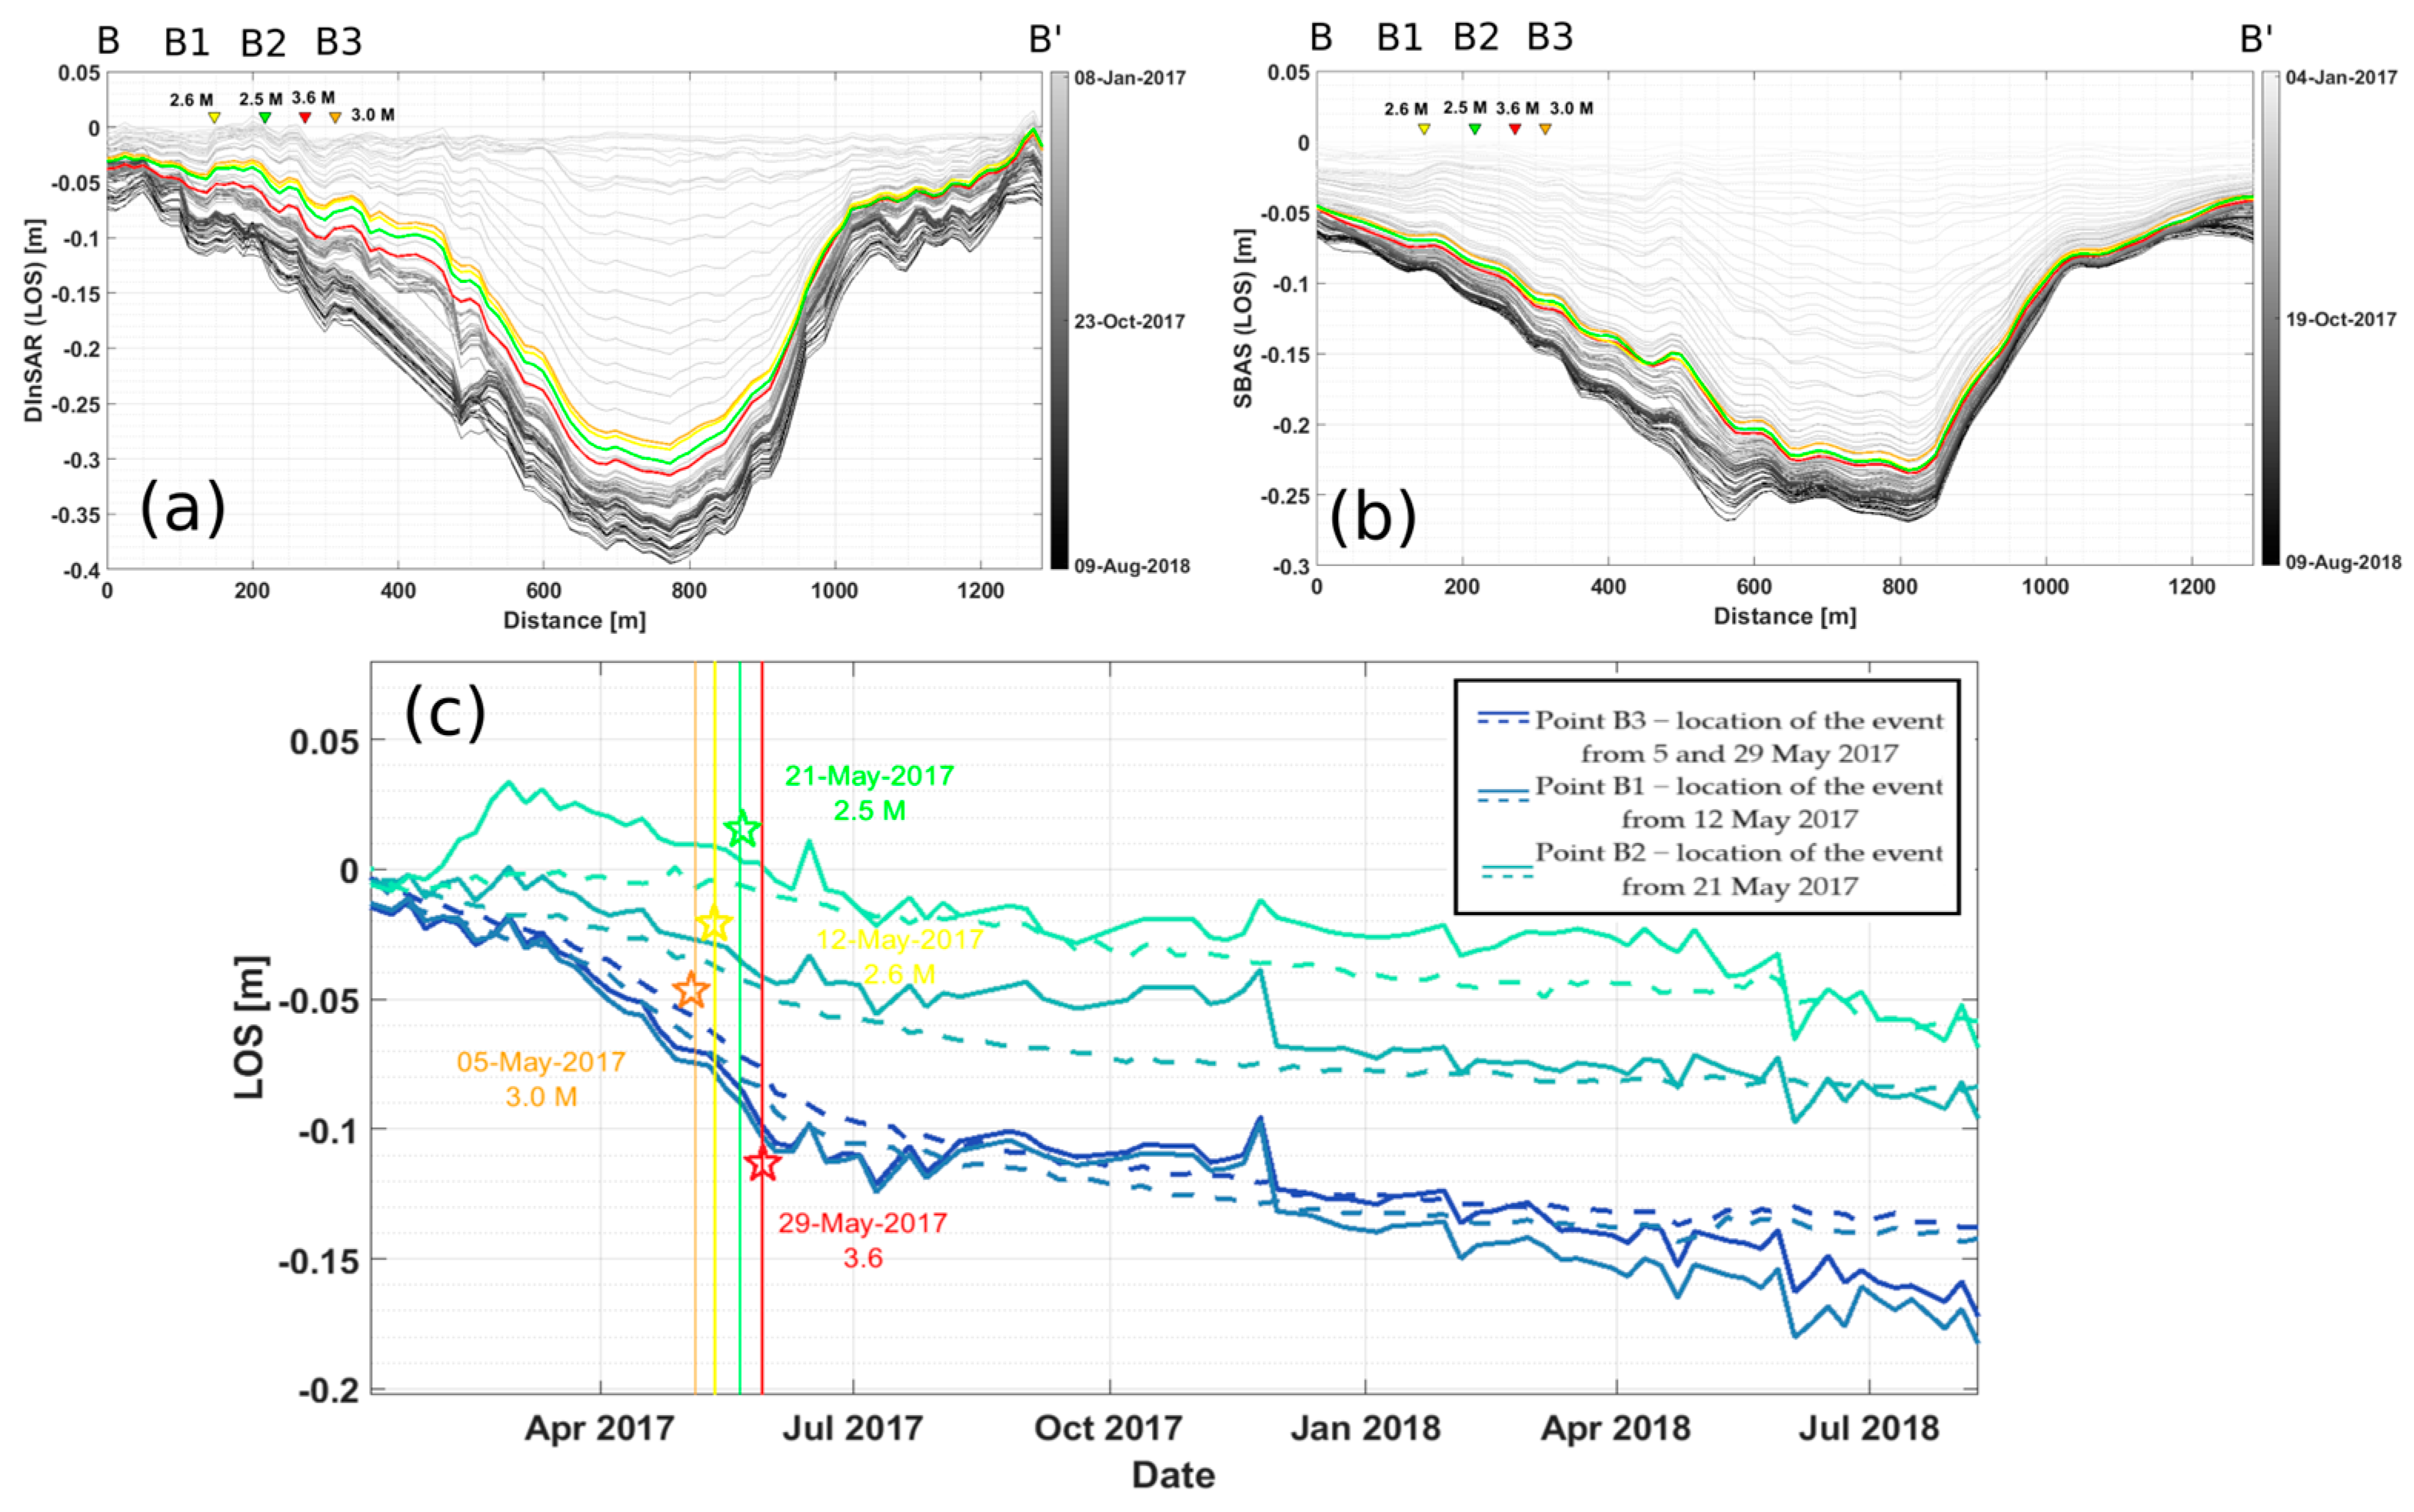
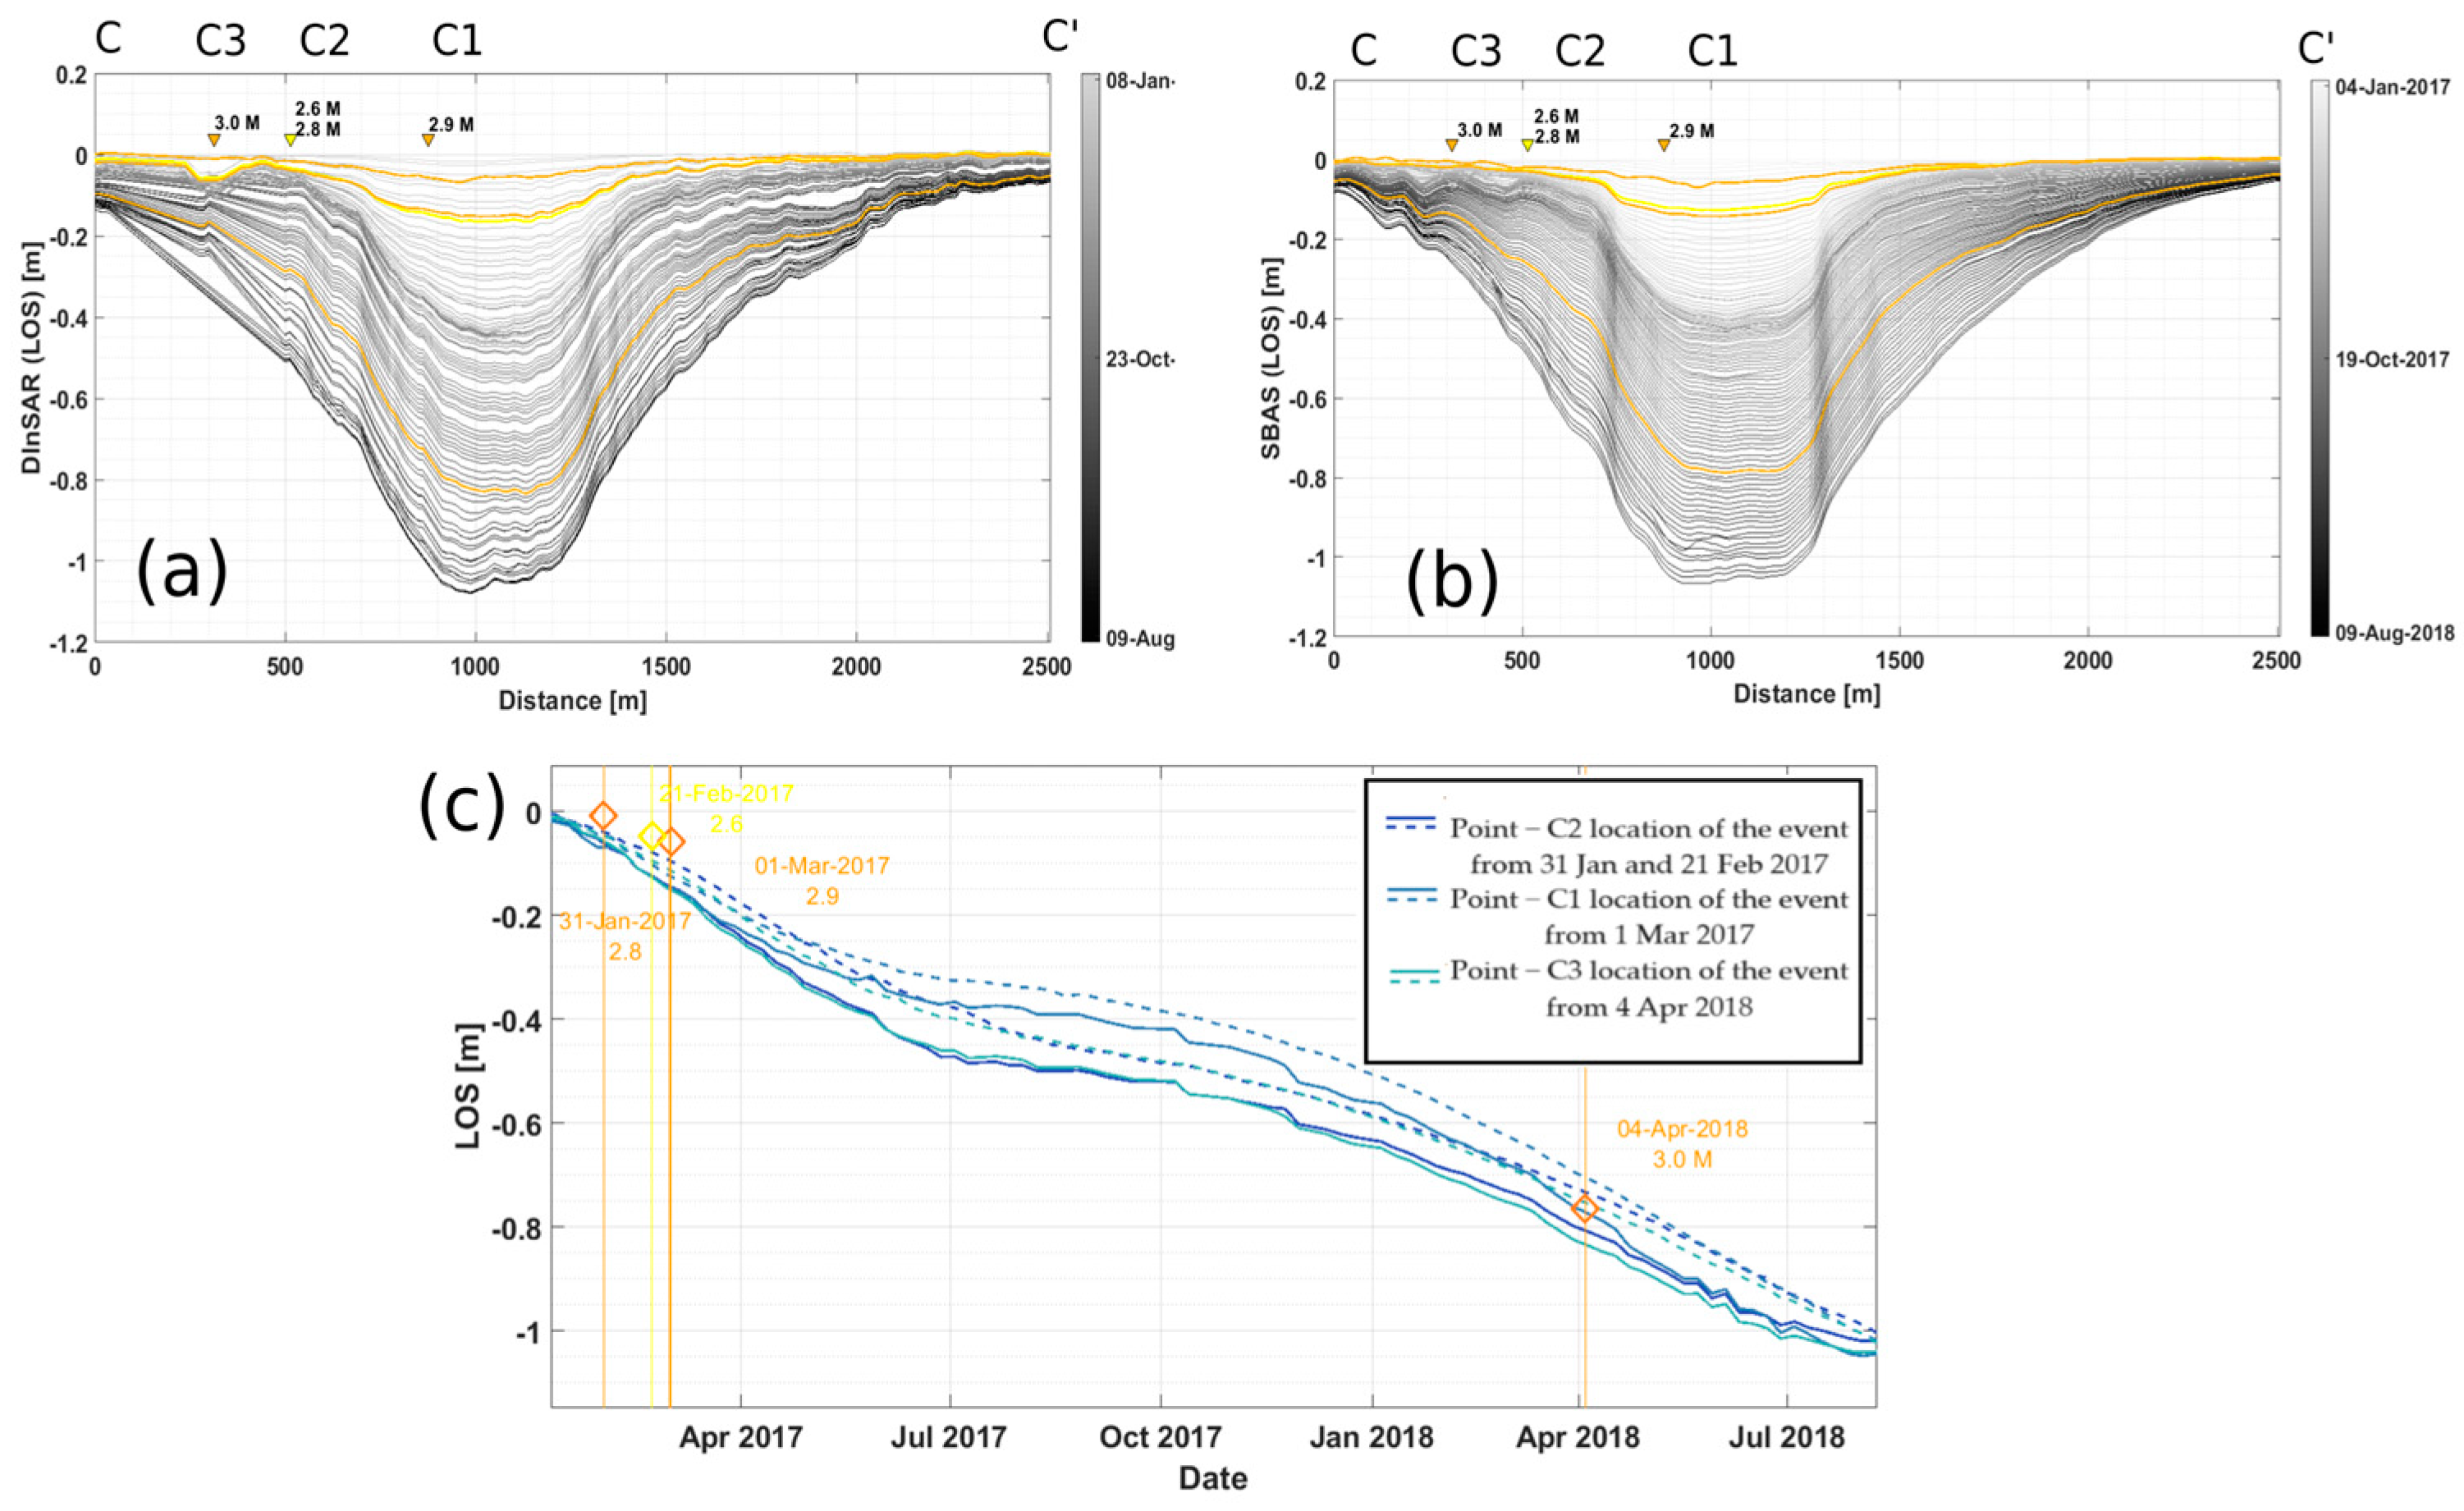
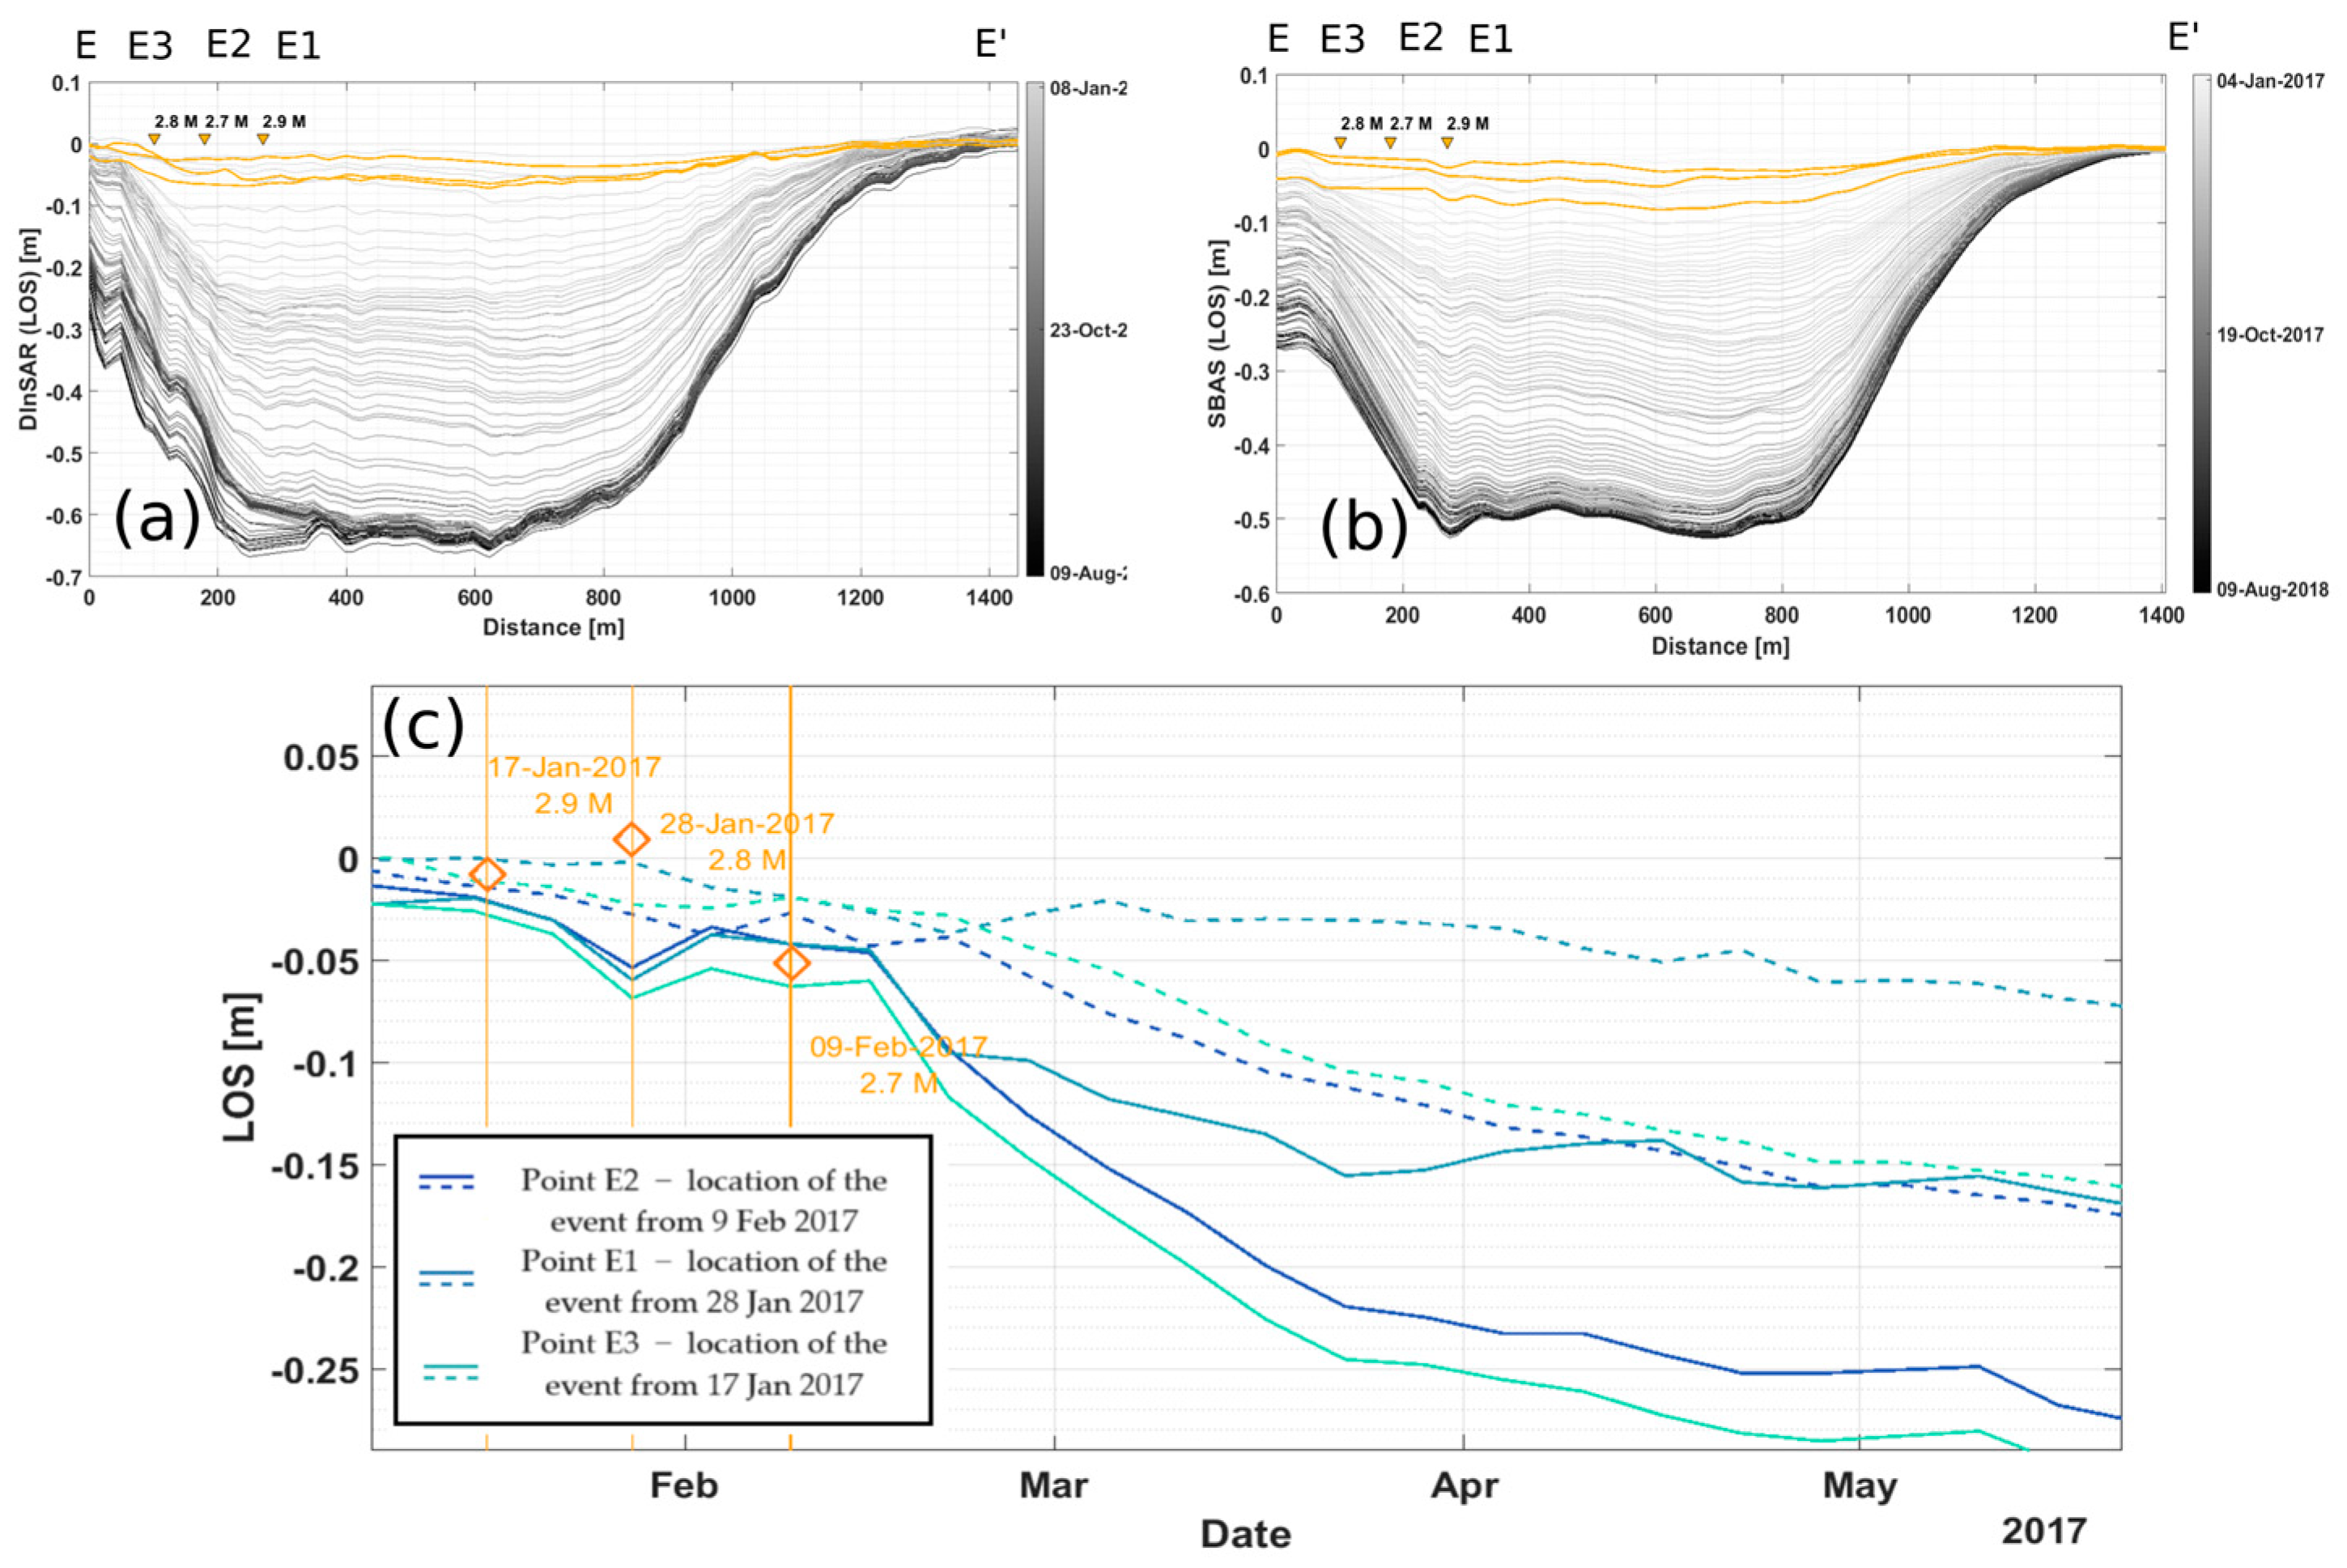
4.2. Post-Seismic Ground Displacement Detectability by InSAR

Based on seismic events recorded by the USRSN network, we selected five subsidence areas where seismic events with the highest magnitudes were recorded (see Figure 5, red rectangles). Time series displacement profiles were extracted for these subsidence areas, and displacement charts were plotted for points indicating the locations of the seismic events. These profiles were generated from zigzagged lines crossing all points of interest (locations of the seismic events). However, for better graphical representation, they are depicted as straight lines in Figure 6. In cases where deformation information was unavailable at a pixel exactly coinciding with the seismic events, we selected a nearby pixel (pixel with the smallest distance to the location of the seismic event). Time series profiles and deformation data for the locations of the seismic events were prepared for both DInSAR and SBAS results and are presented in Appendix B, Appendix C, Appendix D, Appendix E and Appendix F.
Table 2 presents the seismic events that occurred near the five selected subsidence basins (A–E). The “+” and “–signs indicate whether seismic events are visually evident (+) or not visible (–) in the estimated deformation using the DInSAR or SBAS method. When the interferometric signal from a seismic event was ambiguous, we used the “+/–” sign. Out of 17 selected seismic events, only two are clearly visible in the DInSAR deformation time series (23 April 2018 and 31 March 2018), and only one event is visible in both the DInSAR and SBAS results (23 April 2018). This event had the highest magnitude recorded during the investigated period (M3.7). The other seismic event (31 March 2018) was noticeable only with the DInSAR method. For these two events, changes in the deformation pattern are significant and can be attributed to the seismic events. For the other four seismic events, some interferometric signal is visible in the time series, but it is less obvious; thus, we used the symbol “+/–”.

5. Discussion

5.1. Seismic Events in the Light of Estimated Mining-Induced Deformation

Figure 6 illustrates the overlap between mining-induced earthquakes and the deformation map, revealing a significant correlation between subsidence and the epicentral location of seismic events. While seismicity often occurs within mining exploitation areas, most tremors are primarily associated with co-seismic ground shaking or vibration effects comparable to those observed during small-to-moderate natural earthquakes. In contrast, some of the most energetic earthquakes also induce post-seismic surface effects, although these are less frequent and specific. The most probable scenario is that seismic events accompanied by visible surface subsidence involve volumetric changes in their sources. These changes could be linked to rock bursts or collapse-like events, which typically manifest effects within mining tunnels and must be reported by mines in accordance with Polish law. Such events are usually the strongest observed in the USCB.

5.2. Seismic Events Detectability Using Sentinel-1 InSAR Approach in the Selected Case Studies

In Appendix B, Appendix C, Appendix D, Appendix E and Appendix F, we present time series profile lines and displacement cross-sections for seismic event epicenter locations or nearby points for DInSAR and SBAS results. These cross-section profiles were generated from zigzagged lines crossing all points of interest (locations of the seismic events). However, for better graphical representation, they are depicted as straight lines in Figure 6. The deformation patterns estimated using DInSAR or SBAS do not indicate any significant or evident changes within displacement time series directly linked to recorded tremors.
Near subsidence basin A (Figure 6 and Appendix B), the largest seismic event during the analysis period was observed. This tremor, with a magnitude of 3.7, occurred on 23 April 2018. It notably affected the displacement trend for both DInSAR and SBAS techniques (Appendix B, point A3). Additionally, two smaller seismic events were recorded on 17 July 2017 and 31 March 2018, with magnitudes of 2.4 and 3.2, respectively. The surface influence connected with these events is visible in the DInSAR time series (Appendix B, points A1, A2); however, for the smaller event, the change is not as straightforward. The influence of SBAS data is largely imperceptible. According to the Polish State Mining Authority (SMA), all three events were not reported as rock bursts.
Around subsidence basin B (Figure 6, Appendix C), four seismic events were recorded in May 2017. Despite the accumulation of events in such a short period, significant changes in displacement time series are not observed. Only the events from 21 May and 29 are visible in the DInSAR time series (Appendix C, points B2, B3). Perhaps for these events, surface effects are connected with the physical characteristics of the seismic sources. The event on 29 May 2017, was reported as a rock burst by the SMA, suggesting volumetric changes inside the seismic source and a slight ground response visible on the surface. In contrast the SBAS method shows a steady permanent trend without any fluctuations. The DInSAR time series displays a notable degree of noise, potentially indicating the presence of accumulated atmospheric errors that may prevent the observation of changes caused by events. Furthermore, increased vegetation growth during this period could contribute to signal decorrelation.
For subsidence basin C, both DInSAR and SBAS techniques (Appendix D, Figure A4a,b) show only a stable deformation trend without any acceleration. This subsidence trough represents the most significant deformation observed in the study area, with a maximum subsidence of 1 m during the analyzed period. However, the magnitude of change was relatively small in comparison to the overall deformation occurring, making it difficult to identify the time series or profiles in this case. This indicates that the displacements can only be caused by coal excavation. There is no distinct relationship between recorded seismic events and deformation changes. The same holds for basin D (Appendix E), although the magnitude for all recorded seismic events exceeds 3.0.
Near subsidence basin E, we selected three events with the highest magnitude for the time series charts (Appendix F, Figure A6c). On the deformation calculated by the DInSAR method (Appendix F, Figure A6a), only one tremor can be slightly visible on the displacement time series. This event, recorded on 28 January 2017, had a magnitude of 2.8. For the SBAS time series (Appendix F, Figure A6b, point E1), the tremors do not show any displacement acceleration and are not detectable. Information from SMA supports that these earthquakes were not followed by the destruction of underground tunnels, likely excluding isotropic changes in their sources.
Mining areas exhibit two distinguishable types of seismic activity: very local “mining” activity and regional “mining-tectonic” activity [58,59]. The former is strongly linked to the excavation of geological resources, with seismic events typically occurring near active mining fronts and often being weaker in intensity. The latter type results from the interaction between mining and tectonic stresses and is usually triggered by mining activity. These seismic events tend to be situated in tectonically disturbed zones, such as faults or dykes, and their sources are visibly more energetic, potentially located deeper and farther from the excavation panels. Even though they are also considered as deeper earthquakes, they can have a noticeable impact on the surface.
The map of seismic events and LOS deformation (Figure 5) suggests that analyzed seismic events frequently occur at the borders of subsidence basins, which is likely a direct response to mining excavations. Only five events with a magnitude higher than three were recorded, concentrated in the central regions of subsidence bowls. While these two events could be categorized as mining-tectonic, their depth is not reported to be deeper than other earthquakes in the catalog. On the other hand, depth is a parameter that is poorly resolved using recordings from local and planar networks like the USRSN; thus, it cannot be excluded that their hypocenters are actually deeper than reported. Another plausible explanation is that these events occurred in already excavated and closed areas (gobs). In such scenarios, their sources could be characterized by volumetric components. However, since the gobs are abandoned, it is impossible to assess the post-seismic situation through visual inspection. Factors associated with seismic events, including their source parameters and focal mechanisms, lie beyond the scope of this paper. In-depth investigations of these aspects can be found in [59,60,61].
Additionally, it may be valuable to evaluate in the future whether SBAS and DIn-SAR interferometric results, calculated from SAR images captured from different viewing angles, will positively affect the capture of seismic-related deformation. In this paper, we investigated only SAR datasets captured from one side-looking geometry. Analysis utilizing multiple viewing geometries will be beneficial. Additionally, investigating other interferometric techniques such as SqueeSAR, STAMPS, or DInSAR, along with incorporating additional weather models, will be necessary.

6. Conclusions

This paper aimed to assess the feasibility of using satellite radar interferometric to detect ground displacement caused by mining-induced seismic events in the Upper Silesian Coal Basin. Sentinel-1 data and two-time series processing techniques, such as DInSAR and SBAS, were utilized for this purpose. Interferograms were generated using both techniques and overlaid with seismic event data. Consequently, five deformation basins associated with the highest magnitude seismic events were thoroughly investigated.
The results indicate that both DInSAR and SBAS methods are somewhat suitable for monitoring coal exploitation. Specifically, SBAS and DInSAR are effective for tracking stable ground deformation caused by ongoing coal exploitation and typically exhibit low-frequency signals. However, SBAS methods tend to underestimate rapid displacements with high deformation gradients. In contrast, DInSAR is better at capturing deformation with high gradients without the significant underestimation seen in SBAS. While SBAS methods provide smoother results compared to DInSAR and reduce the influence of atmospheric signals, they are more advisable for monitoring deformations at a low rate.
Monitoring seismic activity, which exhibits high-frequency signals, remains challenging for both SBAS and DInSAR methods. DInSAR was found to be more effective in capturing displacement signals caused by seismic events compared to the SBAS method. As mentioned, SBAS techniques tend to underestimate displacement rates, leading to smoothed deformation estimates, which may render post-seismic effects invisible for events with low magnitudes. Out of the 17 selected seismic events, only two were clearly visible in the DInSAR estimated deformation, while for four events, some displacement signals could neither be definitively confirmed nor negated. Conversely, only one seismic event was clearly detectable in the SBAS displacement time series, with no evidence of induced tremors for the other events. This could be attributed to the small magnitude of the tremors and the small size of the seismic sources. Throughout the investigated period, all registered events had magnitudes less than 4.0. This highlights the challenge of identifying any significant influence of low-magnitude tremors on ground deformation, necessitating further investigations.
In the future, it would be beneficial to analyze additional mining-induced tremors with higher magnitudes and their correlation with displacement time series. It is expected that tremors with higher magnitudes will result in greater variations in time series deformation; however, as discussed previously, this strongly depends on the type of seismic events. Furthermore, incorporating weather models instead of time series filtering within SBAS processing could enhance the detectability of the ground displacement caused by mining-induced seismic activity. Our paper sheds some light, not only on studies in mining areas, but can be interesting for analysis conducted in regions where similar, from a physical point of view, seismic source models are possible to happen.

Author Contributions

Conceptualization, K.P.-F.; methodology, K.P.-F.; software, K.P.-F. and N.W.; validation, K.P.-F. and N.W.; formal analysis and investigation, K.P.-F., N.W. and Ł.R.; writing—original draft preparation, K.P.-F., N.W. and Ł.R.; writing—review and editing, K.P.-F., N.W. and Ł.R.; visualization, K.P.-F. and N.W. All authors have read and agreed to the published version of the manuscript.

Funding

The research infrastructure that has been used for computation purposes was created within the project EPOS-PL (POIR.04.02.00-14-A003/16) and EPOS-PL + (POIR.04.02.00-00-C005/19-00) Euro-pean Plate Observing System, funded by the Operational Programme Smart Growth 2014–2020, Priority IV: Increasing the research potential, Action 4.2: Development of modern research infrastructure of the science sector and co-financed by the European Regional Development Fund. Ł.R. was supported by a subsidy from the Polish Ministry of Sciences and Higher Education for the Institute of Geophysics Polish Academy of Sciences. K.P.-F. was supported by the Wrocław University of Environmental and Life Sciences (Poland) as part of the research project No. N060/0004/23.

Data Availability Statement

All the data used in this paper is freely available on the internet.

Conflicts of Interest

The authors declare no conflicts of interest.

Appendix A

Figure A1. NDVI (top) and land cover map (bottom) for the investigated study area.
Remotesensing 16 02533 g0a1

Appendix B

Figure A2. Subsidence through A for DInSAR (a) and SBAS (b) results. (c) represents the time series deformation for the pixel selected at or near the location of the seismic event.
Remotesensing 16 02533 g0a2

Appendix C

Figure A3. Subsidence through B for DInSAR (a) and SBAS (b) results. (c) represents the time series deformation for the pixels selected at or near the location of the seismic event.
Remotesensing 16 02533 g0a3

Appendix D

Figure A4. Subsidence through C for DInSAR (a) and SBAS (b) results. (c) represents the time series deformation for the pixels selected or near the location of the seismic event.
Remotesensing 16 02533 g0a4

Appendix E

Figure A5. Subsidence through D for DInSAR (a) and SBAS (b) results. (c) represent the time series deformation for the pixels selected or near the location of the seismic event.
Remotesensing 16 02533 g0a5

Appendix F

Figure A6. Subsidence through E for DInSAR (a) and SBAS (b) results. (c) represents the time series deformation for the pixels selected or near the location of the seismic event.
Remotesensing 16 02533 g0a6

References

  1. Mirek, K.; Mirek, J. Non-parametric approximation used to analysis of PSinSAR™ data of Upper Silesian Coal Basin, Poland. Acta Geodyn. Geomater. 2009, 6, 405–409. [Google Scholar]
  2. Mirek, K.; Mirek, J. Observation of underground exploitation influence on a surface in Budryk, Sośnica, and Makoszowy coal mine area. Pol. J. Environ. Stud. 2016, 25, 57–61. [Google Scholar]
  3. Rudziński, Ł.; Mirek, K.; Mirek, J. Rapid ground deformation corresponding to a mining-induced seismic event followed by a massive collapse. Nat. Hazards 2019, 96, 461–471. [Google Scholar] [CrossRef]
  4. Samsonov, S.; Smets, B.; D’Oreye, N.; Smets, B. Ground deformation associated with post-mining activity at the French—German border revealed by novel InSAR time series method. Int. J. Appl. Earth Obs. Geoinf. 2013, 23, 142–154. [Google Scholar] [CrossRef]
  5. Salmi, E.F.; Nazem, M.; Karakus, M. The effect of rock mass gradual deterioration on the mechanism of post-mining subsidence over shallow abandoned coal mines. Int. J. Rock Mech. Min. Sci. 2017, 91, 59–71. [Google Scholar] [CrossRef]
  6. Milczarek, W.; Blachowski, J.; Grzempowski, P. Application of PSInSAR for assessment of surface deformations in post-mining area–case study of the former Walbrzych hard coal basin (SW Poland). Acta Geodyn. Geomater. 2017, 14, 41–52. [Google Scholar] [CrossRef]
  7. Przyłucka, M.; Herrera, G.; Graniczny, M.; Colombo, D.; Béjar-Pizarro, M. Combination of conventional and advanced DInSAR to monitor very fast mining subsidence with TerraSAR-X data: Bytom City (Poland). Remote Sens. 2015, 7, 5300–5328. [Google Scholar] [CrossRef]
  8. Salmi, E.F.; Nazem, M.; Karakus, M. Numerical analysis of a large landslide induced by coal mining subsidence. Eng. Geol. 2017, 217, 141–152. [Google Scholar] [CrossRef]
  9. Jung, H.C.; Kim, S.W.; Jung, H.S.; Min, K.D.; Won, J.S. Satellite observation of coal mining subsidence by persistent scatterer analysis. Eng. Geol. 2007, 92, 1–13. [Google Scholar] [CrossRef]
  10. Ma, C.; Cheng, X.; Yang, Y.; Zhang, X.; Guo, Z.; Zou, Y. Investigation on mining subsidence based on multi-temporal InSAR and analysis of the small baseline subset—Case study of working faces 22201-1/2 in Bu’ertai mine, Shendong coalfield, China. Remote Sens. 2016, 8, 951. [Google Scholar] [CrossRef]
  11. Ilieva, M.; Polanin, P.; Borkowski, A.; Gruchlik, P.; Smolak, K.; Kowalski, A.; Rohm, W. Mining deformation life cycle in the light of InSAR and deformation models. Remote Sens. 2019, 11, 745. [Google Scholar] [CrossRef]
  12. Gibowicz, S.J. Chapter 1-Seismicity induced by mining: Recent Research. Adv. Geophys. 2009, 51, 1–53. [Google Scholar]
  13. Stec, K. Characteristics of seismic activity of the Upper Silesian Coal Basin in Poland. Geophys. J. Int. 2007, 168, 757–768. [Google Scholar] [CrossRef]
  14. Ford, S.R.; Dreger, D.S.; Walter, W.R. Source characterization of the 6 August 2007 Crandall Canyon Mine seismic event in central Utah. Seismol. Res. Lett. 2008, 79, 637–644. [Google Scholar] [CrossRef]
  15. Rudziński, Ł.; Cesca, S.; Lizurek, G. Complex rupture process of the 19 March 2013, Rudna Mine (Poland) induced seismic event and collapse in the light of local and regional moment tensor inversion. Seismol. Res. Lett. 2016, 87, 274–284. [Google Scholar] [CrossRef]
  16. Bohnhoff, M.; Dresen, G.; Ellsworth, W.L.; Ito, H. Passive seismic monitoring of natural and induced earthquakes: Case studies, future directions and socio–economic relevance. In New Frontiers in Integrated Solid Earth Sciences; Cloetingh, S., Negendank, J., Eds.; Springer: Dordrecht, The Netherlands; New York, NY, USA, 2010; pp. 261–285. [Google Scholar] [CrossRef]
  17. Milczarek, W. Application of a small baseline subset time series method with atmospheric correction in monitoring results of mining activity on ground surface and in detecting induced seismic events. Remote Sens. 2019, 11, 1008. [Google Scholar] [CrossRef]
  18. Yue, Z.; Sun, H.; Zhong, R.; Du, L. Method for tunnel displacements calculation based on mobile tunnel monitoring system. Sensors 2021, 21, 4407. [Google Scholar] [CrossRef]
  19. Ge, L.; Chang, H.C.; Rizos, C. Mine subsidence monitoring using multi-source satellite SAR images. Photogramm. Eng. Remote Sens. 2007, 73, 259–266. [Google Scholar] [CrossRef]
  20. Liu, Z.; Cui, B.; Liang, Y.; Guo, H.; Li, Y. Study on Foundation Deformation of Buildings in Mining Subsidence Area and Surface Subsidence Prediction. Geotech. Geol. Eng. 2019, 37, 1755–1764. [Google Scholar] [CrossRef]
  21. Szczerbowski, Z.; Jura, J. Mining induced seismic events and surface deformations monitored by GPS permanent stations. Acta Geodyn. Geomater. 2015, 12, 237–248. [Google Scholar] [CrossRef]
  22. Fielding, E.J.; Sangha, S.S.; Bekaert, D.P.; Samsonov, S.V.; Chang, J.C. Surface deformation of north-central Oklahoma related to the 2016 M w 5.8 Pawnee earthquake from SAR interferometry time series. Seismol. Res. Lett. 2017, 88, 971–982. [Google Scholar] [CrossRef]
  23. Ali, M.; Shahzad, M.I.; Nazeer, M.; Mahmood, I.; Zia, I. Estimation of surface deformation due to Pasni earthquake using RADAR interferometry. Geocarto Int. 2019, 36, 1630–1645. [Google Scholar] [CrossRef]
  24. Fujiwara, S.; Nakano, T.; Morishita, Y.; Kobayashi, T.; Yarai, H.; Une, H.; Hayashi, K. Detection and interpretation of local surface deformation from the 2018 Hokkaido Eastern Iburi Earthquake using ALOS-2 SAR data. Earth Planets Space 2019, 71, 64. [Google Scholar] [CrossRef]
  25. Ilieva, M.; Rudziński, Ł.; Pawłuszek-Filipiak, K.; Lizurek, G.; Kudłacik, I.; Tondaś, D.; Olszewska, D. Combined Study of a Significant Mine Collapse Based on Seismological and Geodetic Data—29 January 2019, Rudna Mine, Poland. Remote Sens. 2020, 12, 1570. [Google Scholar] [CrossRef]
  26. Pawluszek-Filipiak, K.; Borkowski, A. Integration of DInSAR and SBAS Techniques to Determine Mining-Related Deformations Using Sentinel-1 Data: The Case Study of Rydułtowy Mine in Poland. Remote Sens. 2020, 12, 242. [Google Scholar] [CrossRef]
  27. Pawluszek-Filipiak, K.; Borkowski, A. Monitoring mining-induced subsidence by integrating differential radar interferometry and persistent scatterer techniques. Eur. J. Remote Sens. 2021, 54, 18–30. [Google Scholar] [CrossRef]
  28. Ferretti, A.; Prati, C.; Rocca, F. Nonlinear subsidence rate estimation using permanent scatterers in differential SAR interferometry. IEEE Trans. Geosci. Remote Sens. 2000, 38, 2202–2212. [Google Scholar] [CrossRef]
  29. Ferretti, A.; Prati, C.; Rocca, F. Permanent scatterers in SAR interferometry. IEEE Trans. Geosci. Remote Sens. 2001, 39, 8–20. [Google Scholar] [CrossRef]
  30. Hooper, A.; Zebker, H.; Segall, P.; Kampes, B. A new method for measuring deformation on volcanoes and other natural terrains using InSAR persistent scatterers. Geophys. Res. Lett. 2004, 31, 1–5. [Google Scholar] [CrossRef]
  31. Hooper, A. A multitemporal InSAR method incorporating both persistent scatterer and small baseline approaches. Geophys. Res. Lett. 2008, 35. [Google Scholar] [CrossRef]
  32. Berardino, P.; Fornaro, G.; Lanari, R.; Sansosti, E. A new algorithm for surface deformation monitoring based on small baseline differential SAR interferograms. IEEE Trans. Geosci. Remote Sens. 2002, 40, 2375–2383. [Google Scholar] [CrossRef]
  33. Werner, C.; Wegmuller, U.; Strozzi, T.; Wiesmann, A. Interferometric point target analysis for deformation mapping. In Proceedings of the Geoscience and Remote Sensing Symposium, IGARSS’03. Proceedings, Toulouse, France, 21–25 July 2003; IEEE International: Piscataway, NJ, USA, 2003; Volume 7, pp. 4362–4364. [Google Scholar] [CrossRef]
  34. Onn, F.; Zebker, H.A. Correction for interferometric synthetic aperture radar atmospheric phase artifacts using time series of zenith wet delay observations from a GPS network. J. Geophys. Res. Solid Earth 2006, 111. [Google Scholar] [CrossRef]
  35. Li, Z.; Fielding, E.J.; Cross, P.; Preusker, R. Advanced InSAR atmospheric correction: MERIS/MODIS combination and stacked water vapour models. Int. J. Remote Sens. 2009, 30, 3343–3363. [Google Scholar] [CrossRef]
  36. Parker, A.L.; Biggs, J.; Walters, R.J.; Ebmeier, S.K.; Wright, T.J.; Teanby, N.A.; Lu, Z. Systematic assessment of atmospheric uncertainties for InSAR data at volcanic arcs using large-scale atmospheric models: Application to the Cascade volcanoes, United States. Remote Sens. Environ. 2015, 170, 102–114. [Google Scholar] [CrossRef]
  37. Yu, C.; Li, Z.; Penna, N.T.; Crippa, P. Generic atmospheric correction model for interferometric synthetic aperture radar observations. J. Geophys. Res. Solid Earth 2018, 123, 9202–9222. [Google Scholar] [CrossRef]
  38. Xiao, R.; Yu, C.; Li, Z.; He, X. Statistical assessment metrics for InSAR atmospheric correction: Applications to generic atmospheric correction online service for InSAR (GACOS) in Eastern China. Int. J. Appl. Earth Obs. Geoinf. 2021, 96, 102289. [Google Scholar] [CrossRef]
  39. Mogi, K. Relations between the eruptions of various volcanoes and the deformations of the ground surfaces around them. Bull. Earthq. Res. Inst. 1958, 36, 99–134. [Google Scholar]
  40. Carnec, C.; Fabriol, H. Monitoring and modeling land subsidence at the Cerro Prieto Geothermal Field, Baja California, Mexico, using SAR interferometry. Geophys. Res. Lett. 1999, 26, 1211–1214. [Google Scholar] [CrossRef]
  41. Masterlark, T. Magma intrusion and deformation predictions: Sensitivities to the Mogi assumptions. J. Geophys. Res. Solid Earth 2007, 112, 1–17. [Google Scholar] [CrossRef]
  42. Fuhrmann, T.; Garthwaite, M.C. Resolving Three-Dimensional Surface Motion with InSAR: Constraints from Multi-Geometry Data Fusion. Remote Sens. 2019, 11, 241. [Google Scholar] [CrossRef]
  43. Perski, Z. Applicability of ERS-1 and ERS-2 InSAR for land subsidence monitoring in the Silesian coal mining region, Poland. Int. Arch. Photogramm. Remote Sens. 1998, 32, 555–558. [Google Scholar]
  44. Mossop, A.; Segall, P. Subsidence at The Geysers geothermal field, N. California from a comparison of GPS and leveling surveys. Geophys. Res. Lett. 1997, 24, 1839–1842. [Google Scholar] [CrossRef]
  45. Fan, H.; Gao, X.; Yang, J.; Deng, K.; Yu, Y. Monitoring mining subsidence using a combination of phase-stacking and offset-tracking methods. Remote Sens. 2015, 7, 9166–9183. [Google Scholar] [CrossRef]
  46. Mora, O.; Arbiol, R.; Palà, V. ICC’s project for DInSAR terrain subsidence monitoring of the Catalonian territory. In Proceedings of the Geoscience and Remote Sensing Symposium, 2007. IGARSS 2007, Barcelona, Spain, 23–28 July 2007; IEEE International: Piscataway, NJ, USA, 2007; pp. 4953–4956. [Google Scholar]
  47. Wu, Y.Y.; Madson, A. Error Sources of Interferometric Synthetic Aperture Radar Satellites. Remote Sens. 2024, 16, 354. [Google Scholar] [CrossRef]
  48. Yang, Z.; Li, Z.; Zhu, J.; Yi, H.; Hu, J.; Feng, G. Deriving dynamic subsidence of coal mining areas using InSAR and logistic model. Remote Sens. 2017, 9, 125. [Google Scholar] [CrossRef]
  49. Lanari, R.; Casu, F.; Manzo, M.; Zeni, G.; Berardino, P.; Manunta, M.; Pepe, A. An overview of the small baseline subset algorithm: A DInSAR technique for surface deformation analysis. In Deformation and Gravity Change: Indicators of Isostasy, Tectonics, Volcanism, and Climate Change; Birkhäuser: Basel, Switzerland, 2007; pp. 637–661. [Google Scholar] [CrossRef]
  50. Popiolek, E.; Ostrowski, J.; Czaja, J.; Mazur, J. The impact of a strong mining tremor on the subsidence of the area surface in the Legnica-Glogow Copper Area. In Proceedings of the 10th FIG International Symposium on Deformation Measurements, International Federation of Surveyors, Orange, CA, USA, 19–22 March 2001; pp. 19–22. [Google Scholar]
  51. Dulias, R. The Impact of Mining on the Landscape: A Study of the Upper Silesian Coal Basin in Poland; Springer: Berlin/Heidelberg, Germany, 2016. [Google Scholar]
  52. Rózkowski, K.; Rózkowski, A.; Soltysiak, M. Participation of quaternary aquifers in groundwater inflow to mines in the Upper Silesian Coal Basin (USCB). Arch. Min. Sci. 2015, 60, 419–437. [Google Scholar] [CrossRef]
  53. Dubiński, J.; Mutke, G.; Chodacki, J. Distribution of peak ground vibration caused by mining induced seismic events in the Upper Silesian Coal Basin in Poland. Arch. Min. Sci. 2020, 65, 419–432. [Google Scholar] [CrossRef]
  54. Tadono, T.; Ishida, H.; Oda, F.; Naito, S.; Minakawa, K.; Iwamoto, H. Precise global DEM generation by ALOS PRISM. ISPRS Ann. Photogramm. Remote Sens. Spat. Inf. Sci. 2014, 2, 71. [Google Scholar] [CrossRef]
  55. SARMAP. SARScape: Technical Description; SARMAP: Purasca, Switzerland, 2012. [Google Scholar]
  56. Sarmap, S.A. Synthetic Aperture Radar and SARscape: SAR Guidebook; Sarmap SA: Purasca, Switzerland, 2009; p. 274. [Google Scholar]
  57. Costantini, M. A novel phase unwrapping method based on network programming. IEEE Trans. Geosci. Remote Sens. 1998, 36, 813–821. [Google Scholar] [CrossRef]
  58. Gibowicz, S.J.; Kijko, A. An Introduction to Mining Seismology; Academic Press: San Diego, CA, USA, 1994. [Google Scholar]
  59. Fialko, Y.; Simons, M. Deformation and seismicity in the Coso geothermal area, Inyo County, California: Observations and modeling using satellite radar interferometry. J. Geophys. Res. Solid Earth 2000, 105, 21781–21793. [Google Scholar] [CrossRef]
  60. Vasco, D.W.; Rutqvist, J.; Ferretti, A.; Rucci, A.; Bellotti, F.; Dobson, P.; Oldenburg, C.; Garcia, J.; Walters, M.; Hartline, C. Monitoring deformation at the Geysers geothermal field, California using C-band and X-band interferometric synthetic aperture radar. Geophys. Res. Lett. 2013, 40, 2567–2572. [Google Scholar] [CrossRef]
  61. Weingarten, M.; Ge, S.; Godt, J.W.; Bekins, B.A.; Rubinstein, J.L. High-rate injection is associated with the increase in U.S. mid-continent seismicity. Science 2015, 348, 1336–1340. [Google Scholar] [CrossRef] [PubMed]
Figure 1. Simulated underground mining deformation scenarios are depicted as follows: (a) two displacement sources are visible, caused by underground exploitation (black line) and seismic events (red line); (b) only one displacement source is clearly visible, either due to underground exploitation or seismic events with the other source not visible on the displacement time series or removed by atmospheric filtering; (c) two displacement sources are visible involving mining activity and a mining-induced tremor located outside the mining activity’s surface area without atmospheric filtering; (d) two displacement sources are visible with atmospheric filtering (Figure source [17]).
Remotesensing 16 02533 g001
Figure 2. The connection between SAR image pairs used for interferogram generation in various processing strategies: (a) consecutive DInSAR, (b) cumulative DInSAR, (c) PSInSAR, and (d) SBAS.
Remotesensing 16 02533 g002
Figure 3. (b) Location of the study area; (a) study area extent with location of the seismic events superimposed on Sentinel 2-image acquired 9 September 2020 and (c) histogram of all seismic events with M > 2 recorded within the investigated period (1 January 2017 to 9 August 2018).
Remotesensing 16 02533 g003
Figure 4. Methodology flowchart applied in the presented study.
Remotesensing 16 02533 g004
Figure 5. Line−of−sight (LOS) deformation estimated using SBAS (a) and consecutive DInSAR (b) results, superimposed with seismic events for the period from 1 January 2017 to 9 August 2018. Red rectangles indicate subsidence basins selected for in-depth analysis (Appendix B, Appendix C, Appendix D, Appendix E and Appendix F and Figure 6).
Remotesensing 16 02533 g005
Figure 6. Zoomed-in view of LOS displacement estimated using SBAS (left image) and consecutive DInSAR (right image) results, superimposed with seismic events for the period from 1 January 2017 to 9 September 2018, for subsidence basin A (a), B (b), C (c), D (d) and E (e) marked as red polygons in Figure 5.
Remotesensing 16 02533 g006
Table 1. Metadata of data used in the presented study.
SAR datamissionSentinel-1
acquisitionAscending TOPSAR
satellitesA and B
relative orbit175
time span4 January 2017–9 August 2018
number of acquisitions95
incidence angle38.77–42.55°
source linkhttps://scihub.copernicus.eu/dhus/#/home (accessed on 1 June 2024)
DEM dataALOS-World-3Dhttps://www.eorc.jaxa.jp/ALOS/en/aw3d30/index.htm (accessed on 1 June 2024)
resolution30 m
Seismic eventsnumber of seismic events134
time span4 January 2017–9 August 2018
min. magnitude2.0
max. magnitude3.7
mean magnitude2.7
source linkhttp://www.grss.gig.eu/pl (accessed on 1 June 2024)
Table 2. Subsidence basins and corresponding seismic events with their magnitudes and detectability using the DInSAR and SBAS methods. The seismic event detected with the highest magnitude were bolded.
Subsidence ThoughAppendix NumberSeismic eventDateMagnitudeAnalyzed PointVisibility on DInSARVisibility on SBAS
AB1st17 July 20172.4A1+/–
2nd31 March 20183.2A2+
3rd23 April 20183.7A3++
BC1st5 May 20173.0B3
2nd12 May 20172.6B1
3rd21 May 20172.5B2+/–
4th29 May 20173.6B3+/–
CD1st31 January 20172.8C2
2nd21 February 20172.9C1
3rd1 March 20172.6C2
4th4 April 20183.0C3
DE1st7 May 20173.1D1
2nd21 July 20173.0D3
3rd18 January 20183.4D2
EF1st17 January 20172.9E3
2nd28 January 20172.8E1+/–
3rd9 February 20172.7E2
Total:+21
+/–40
1116
Disclaimer/Publisher’s Note: The statements, opinions and data contained in all publications are solely those of the individual author(s) and contributor(s) and not of MDPI and/or the editor(s). MDPI and/or the editor(s) disclaim responsibility for any injury to people or property resulting from any ideas, methods, instructions or products referred to in the content.

