Article

Integrated Use of Synthetic Aperture Radar and Optical Data in Mapping Native Vegetation: A Study in a Transitional Brazilian Cerrado–Atlantic Forest Interface

by
Allita R. Santos
*,
Mariana A. G. A. Barbosa
,
Phelipe S. Anjinho
,
Denise Parizotto
and
Frederico F. Mauad
Center for Water Resources and Environmental Studies (CRHEA), University of São Paulo, São Carlos 13566-590, SP, Brazil
*
Author to whom correspondence should be addressed.
Remote Sens. 2024, 16(14), 2559; https://doi.org/10.3390/rs16142559
Submission received: 30 May 2024 / Revised: 9 July 2024 / Accepted: 9 July 2024 / Published: 12 July 2024

Abstract

:
This study develops a structure for mapping native vegetation in a transition area between the Brazilian Cerrado and the Atlantic Forest from integrated spatial information of Sentinel-1 and Sentinel-2 satellites. Most studies use integrated data to improve classification accuracy in adverse atmospheric conditions, in which optical data have many errors. However, this method can also improve classifications carried out in landscapes with favorable atmospheric conditions. The use of Sentinel-1 and Sentinel-2 data can increase the accuracy of mapping algorithms and facilitate visual interpretation during sampling by providing more parameters that can be explored to differentiate land use classes with complementary information, such as spectral, backscattering, polarimetry, and interferometry. The study area comprises the Lobo Reservoir Hydrographic Basin, which is part of an environmental conservation unit protected by Brazilian law and with significant human development. LULC were classified using the random forest deep learning algorithm. The classifying attributes were backscatter coefficients, polarimetric decomposition, and interferometric coherence for radar data (Sentinel-1), and optical spectral data, comprising bands in the red edge, near-infrared, and shortwave infrared (Sentinel-2). The attributes were evaluated in three settings: SAR and optical data in separately settings (C1 and C2, respectively) and in an integrated setting (C3). The study found greater accuracy for C3 (96.54%), an improvement of nearly 2% compared to C2 (94.78%) and more than 40% in relation to C1 (55.73%). The classification algorithm encountered significant challenges in identifying wetlands in C1, but performance improved in C3, enhancing differentiation by stratifying a greater number of classes during training and facilitating visual interpretation during sampling. Accordingly, the integrated use of SAR and optical data can improve LULC mapping in tropical regions where occurs biomes interface, as in the transitional Brazilian Cerrado and Atlantic Forest.

1. Introduction

Alterations in land use and land cover (LULC) arising from anthropic activities are one of the principal environmental problems studied by scientists [1,2,3,4,5,6]. Adverse changes in conservation areas cause environmental damage and harm our quality of life, such as reduction in the available water for human consumption, or reduction in soil nutrients for food production [4]. Society is highly dependent on a functional and stable land system for food production and access to natural resources, including water, timber, fiber, ore, and fuel, among other ecosystem services [5,7]. In this instance, the functionality and stability of land systems depend on the interaction of soil, water, and plants within the ecological composition and the quality of native vegetation [8,9]. Thus, mapping the composition of vegetation not only provides information on the region’s quantitative and qualitative state, but is a crucial initial step in analyzing and monitoring its management, including the state of the natural vegetation and the impact of anthropic activities on affected ecosystems [10].
The Brazilian Cerrado biome is a global biodiversity hotspot. It encompasses part of three South America’s largest river basins (Amazon, São Francisco, and Prata), which contribute to nearly half of Brazil’s surface water and recharge of Bambuí, Urucuia, and Guarani aquifers, depending on biome integrity [11]. Its vital significance for the conservation of species and the provision of ecosystem services notwithstanding, only 53.1% of its original area has been preserved [12], as it lost 279,000 km2 between 1985 and 2021 from LULC changes arising from such anthropic endeavors as crops, pastures, forestry, mining, industrialization, and human expansion [12].
A similar trend can be observed in the Atlantic Forest, where 70% of Brazilians live, as only 24.3% remains as a forest formation [13]. The forest largely corresponds to legal reserves (LRs) and permanent protection areas (PPAs), both instruments of Brazilian environmental laws, whose role is to preserve the quality of water, soil, and biodiversity [4,8,9]. The quality of the vegetation cover has also been adversely impacted, as there was a 23% loss of mature forest from 1985 to 2021 [5]. In 37 years, 98,000 km2 of primary vegetation were suppressed, while 88,000 km2 were regenerated into secondary vegetation [13], which comprises 26% of forest cover in the Atlantic Forest. Thus, mapping the spatial composition of forest vegetation is fundamental for the evaluation of the spatial pattern of ecosystem services in an environmental study [10].
Without adequate LULC management focused on sustainability, regional river basins suffer persistent alterations. The Lobo Reservoir Hydrographic Basin (LRHB), hereafter basin, is formed by streams and rivers that contribute to the reservoir [2,3,4,14]. It lies in the center-west of the state of São Paulo, Brazil, a transitional region between the Brazilian Cerrado and the Atlantic Forest, over 200 km from the city of São Paulo, one of the principal financial, corporate, and commercial centers of South America [4,14]. The state encompasses 16.6% and 28.4% of the two biomes, respectively [12,13].
Algorithms using machine learning can efficiently classify images from remote sensing and are capable of handling high-dimensional data and mapping thematic classes with complex features [15]. As remote sensing can provide cost-efficient data, it is suitable for LULC evaluation at higher spatial resolution. The free availability of medium–high-spatial resolution imagery, such as Sentinel-1 radar data and Sentinel-2 optical data, can facilitate mapping the state of native vegetation in regions where ecosystem services require finer-scale assessments [16]. Several studies have examined the applicability of active synthetic aperture radar (SAR) to map LULC in terms of specific objectives [10,16,17,18,19,20,21,22,23]. One study delineated cocoa agroforests in Cameroon from textural features extracted from SAR imaging [22], and another evaluated the value of short-time baseline coherence of SAR images over a complex agricultural area in the state of São Paulo [21]. With all-day and all-weather operational capability, these sensors provide diverse, complementary physical data that enhance spectral data when combined with optical imaging [10,16,19,23]. In addition, the integration of Sentinel-1 and Sentinel-2 increased the accuracy of LULC mapping, using complementary information such as spectral [18,20], backscattering, polarimetry, and interferometry [17].
However, the work in general has been carried out to map vegetated and nonvegetated areas without distinction in relation to vegetation characteristic of the region under study. Furthermore, the mappings carried out in studies and published in high-impact journals have not yet explored the expanded extraction of LULC thematic classes with the intention of differentiating types of transitional vegetation between different biomes, and reforestation for commercial and research purposes. In Brazil, research has focused on mapping the vegetation characteristic of the Amazon Forest, thus leaving other biomes with tropical characteristics without scientific reference. Therefore, this study seeks to fill the gaps in the field of remote sensing using multisensor and spatial data typology. In this sense, this methodology applied to the Brazilian biomes Cerrado and Atlantic Forest interface can be used to study similar biomes present in other countries, such as Cerrado in Bolivia, Paraguay, and Argentina (Chaco, Gran Chaco, or South American Cerrado), and the Atlantic Forest interface in Paraguay, Argentina, and Uruguay.
Regarding remote sensing LULC mapping, advanced artificial neural networks, especially deep learning models, have gained increased attention due to their end-to-end nature [16]. An obstacle affecting the performance of deep learning networks is the dearth of training samples [24]. Accordingly, a framework based on deep learning for classifying native vegetation in the transitional regions that can integrate SAR and optical data and effectively handle training samples should be developed.
This study develops such an architecture for mapping native vegetation from integrated spatial information from the Sentinel-1 and Sentinel-2 satellites. To this end, the Lobo Reservoir Hydrographic Basin, which is in an environmental conservation unit protected by Brazilian law for the purpose of sustainable use, was adopted as the study area, as it is a region with significant agricultural, mining, and industrial development. The spatial composition of the basin’s native vegetation is formed by permanent protection areas, comprising fragments of the Atlantic Forest in rivers and streams margins, close to springs, and the Ecological Station of Itirapina area, composed of typical vegetation of savannah and grassland Brazilian Cerrado biome. This study further contributes to national and international research, as the basin is part of the long-term ecological research program of the National Council for Scientific and Technological Development, which promotes advances in environmental and ecological research [2,3,4,8,14,25,26].

2. Materials and Methods

This study’s methodology is characterized as follows. Section 2.1 presents the characterization of the study area; Section 2.2 describes the source and acquisition of spatial data used to elaborate the LULC map; Section 2.3 describes the elaboration of LULC classification attributes derived from the integration of optical and SAR data; and Section 2.4 delineates the classification of the LULC map and the evaluation of the accuracy of the architecture developed from the field visit.

2.1. Study Area

Located in the center-west region of the state of São Paulo, between Brotas and Itirapina, at the geographic coordinates 22°15′S and 47°49′W (Figure 1), the Lobo Reservoir Hydrographic Basin (LRHB), officially designated the Carlos Botelho Reservoir, has an area of 230 km2, drainage density of 0.75 km/km2, maximum altitude of 800 m, and slope of 0.0075 m/m [8].
Constructed in 1936 to generate electricity, the Lobo Reservoir is currently used for irrigation, tourism, and research. One of Brazil’s most studied reservoirs, it is known worldwide as the Broa model, reflecting the scientific research it has generated since the 1970s as a strategic project of two major universities, the University of São Paulo and the Federal University of São Carlos [2,3,4,14,25]. The reservoir is primarily formed by contributions of the Itaqueri river and the Lobo stream, augmented by contributions from the Água Branca, Geraldo, Limoeiro, and Perdizes streams. The region is in the Tietê/Jacaré Water Resources Management Unit (number 13) and part of the Tietê river basin and, consequently, those of the Paraná and Prata rivers.
The basin is in the special use region of the Corumbataí Environmental Protection Area, created by State Decree 20,960 [27]. Among its ecological attributes, its highly diverse natural environments, rich historical and archaeological heritage, quality hydrological resources, and scenic landscape stand out. The protection area seeks to regulate development ensuring the basin’s sustainability through sustainable use, which balances the use of natural resources with their conservation.
The Itirapina Ecological and Experimental Stations are also located in the basin and are under the management of the Brazilian Forestry Institute. The former station was created by State Decree 22,335 in 1984 and the latter by expropriation decrees. The stations focus on environmental preservation and conservation through forestry management, environmental education, research, visitation, and control of activities as agriculture, hunting, fishing, road construction, fire, and vandalism. The ecological station has a crucial role in conserving the Brazilian Cerrado, a typically savannah and grassland biome. Marked by characteristics of soil and climate, it includes formations originated during the glacial periods in which the global temperature dropped, and the climate became drier, favoring the retraction of forests and, consequently, the expansion of a more open vegetation, which required less moisture [28].

2.2. Spatial Data Used to Evaluate LULC and Classify Native Vegetation

Table 1 details spatial data used for LULC evaluation and classification of native vegetation in transitional regions between the Brazilian Cerrado and Atlantic Forest interface.
The LULC map was created from two single-look complex (SLC) images from Sentinel-1A (C band) in interferometric wide-swath (IW) mode, in descending orbit and in VV-VH polarizations to obtain the following attributes from radar data: backscatter coefficients (σ0VH e σ0VV), polarimetric decomposition entropy (H) and alpha (α), and interferometric coherence ( γ VH   e   γ VV ) [17,31,32]; and an image with 20 m spectral bands: red edge (B05, B06, B07, and B8A), near-infrared (B08) and shortwave infrared (B11 and B12) of the Sentinel-2A satellite sensors to derive attributes from optical data. The images dated 19 and 31 September 2022 for the radar images and 25 March 2023 for the optical image were obtained free of charge from the website of the Copernicus Open Access Hub of the European Space Agency [29]. This study used radar data to the maximum extent and supplemented them with optical data to enhance LULC classification.

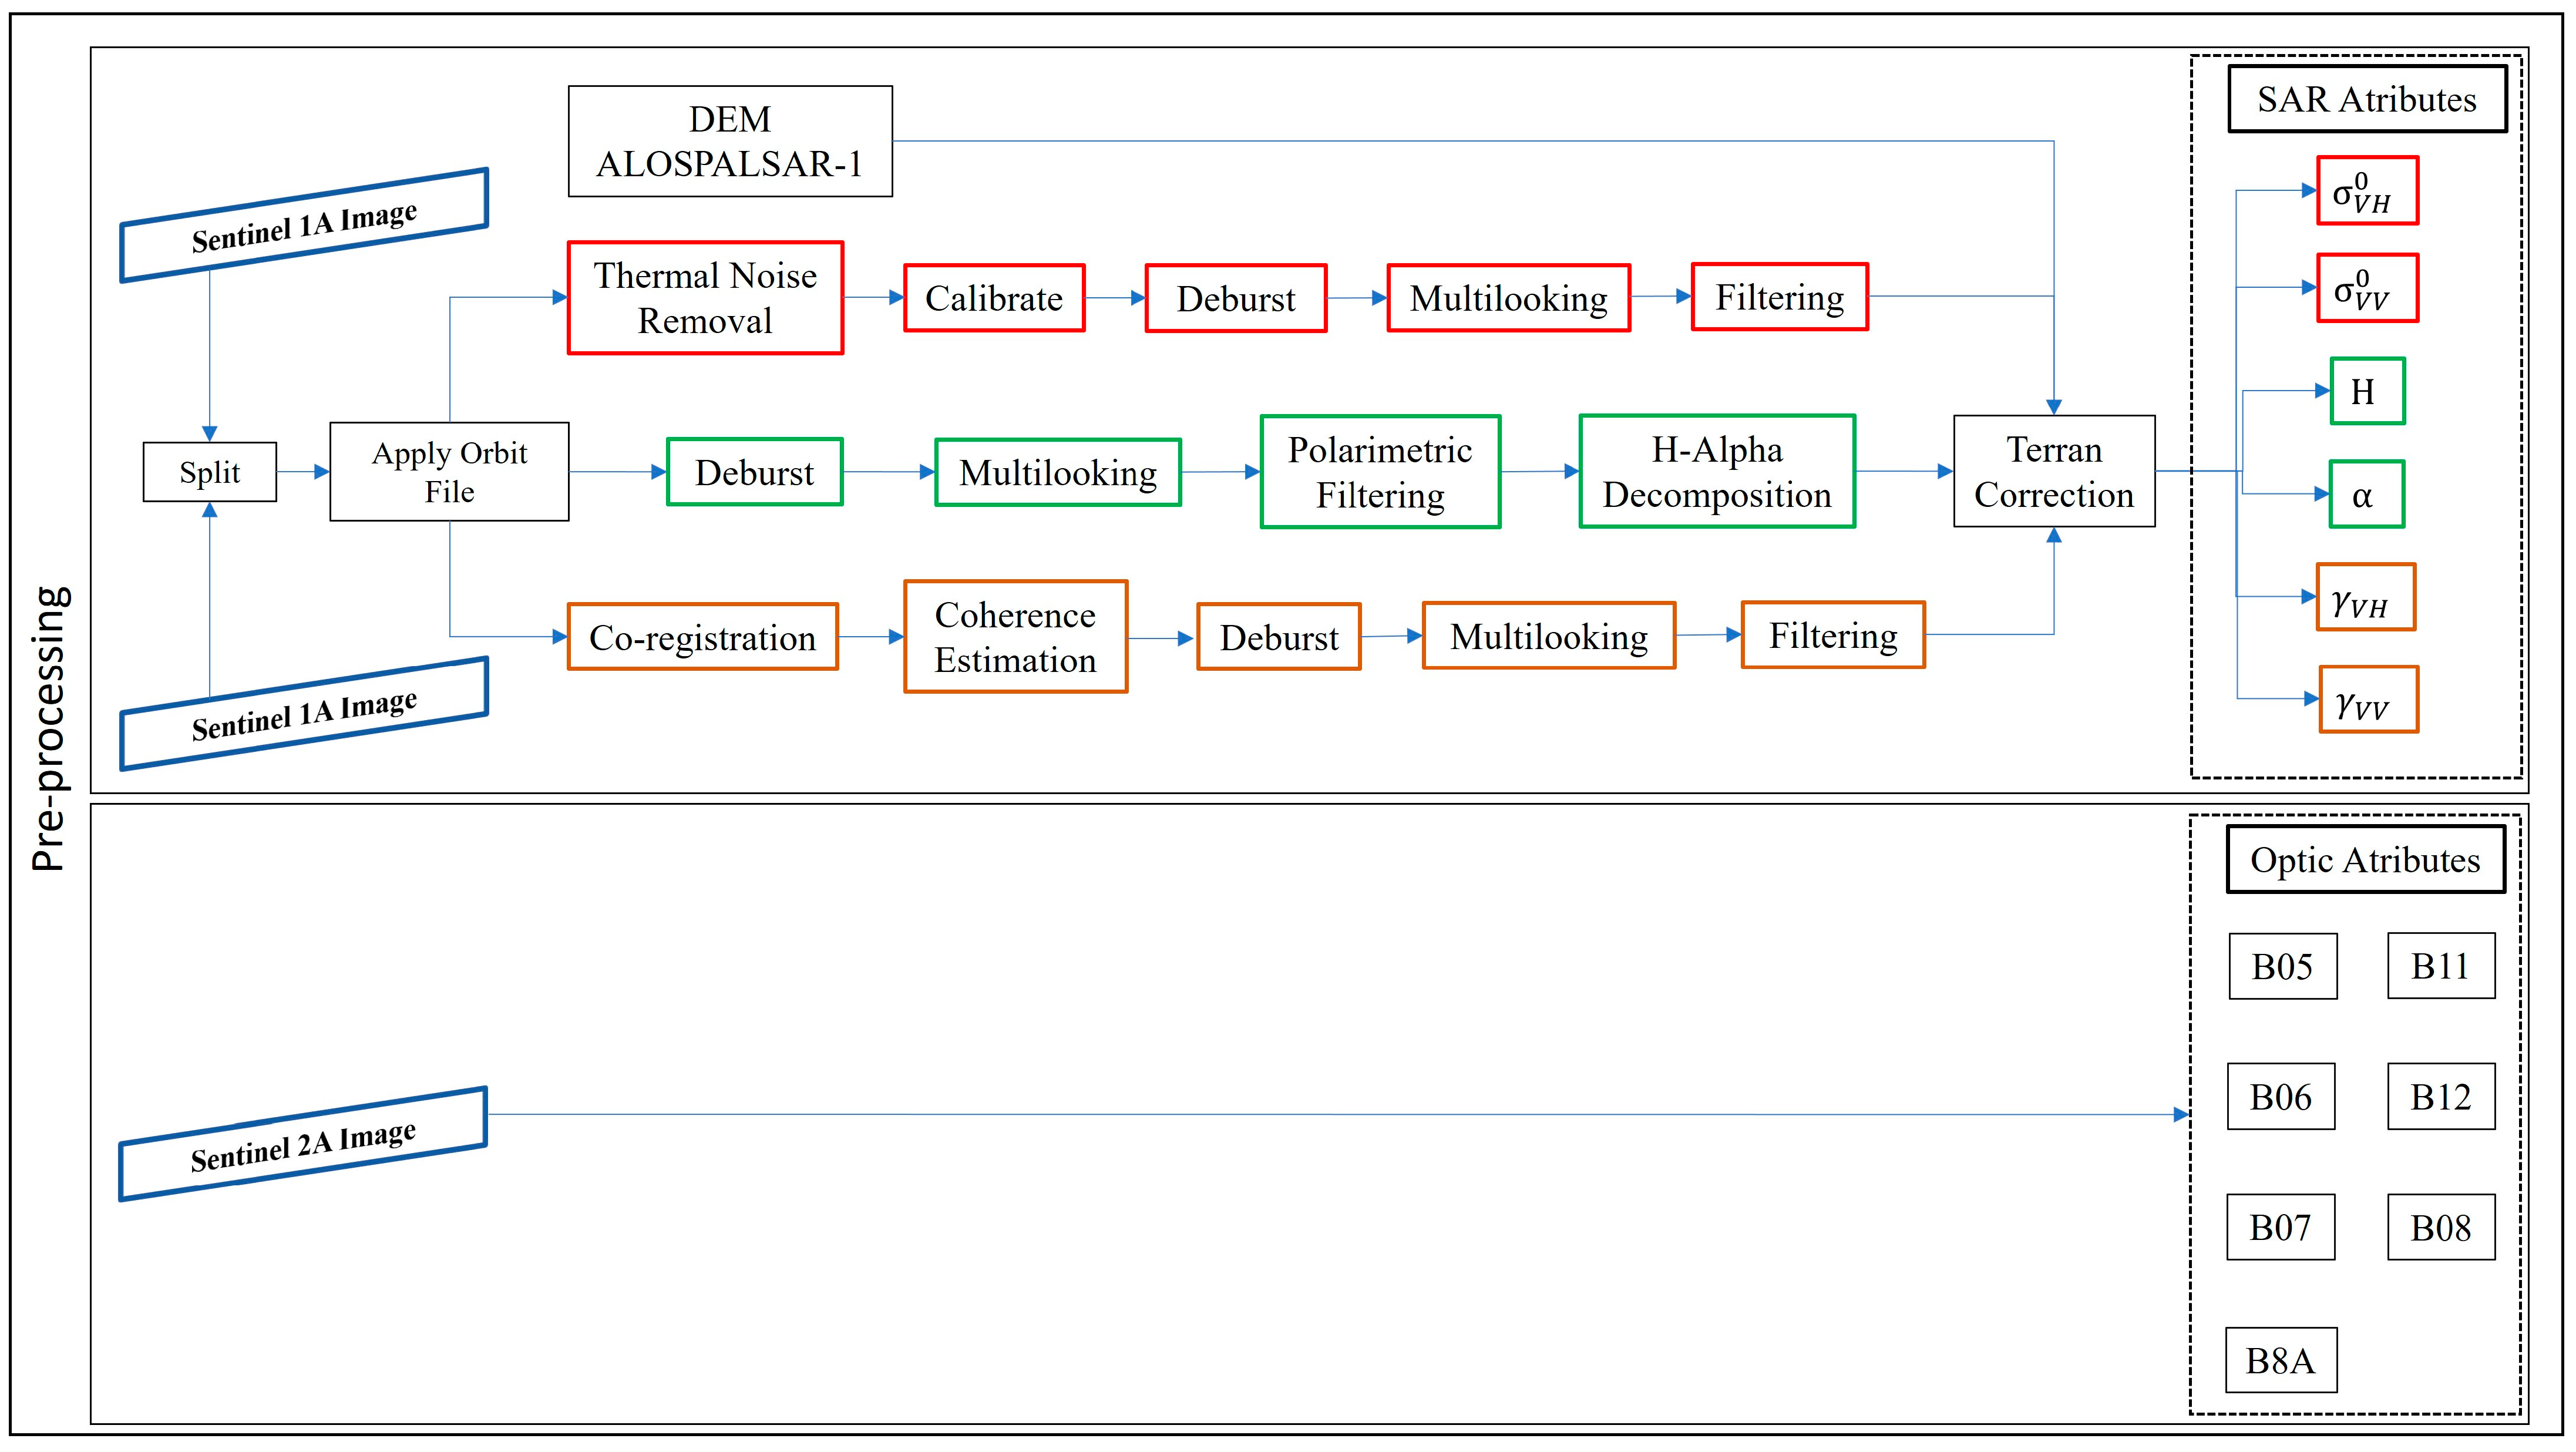
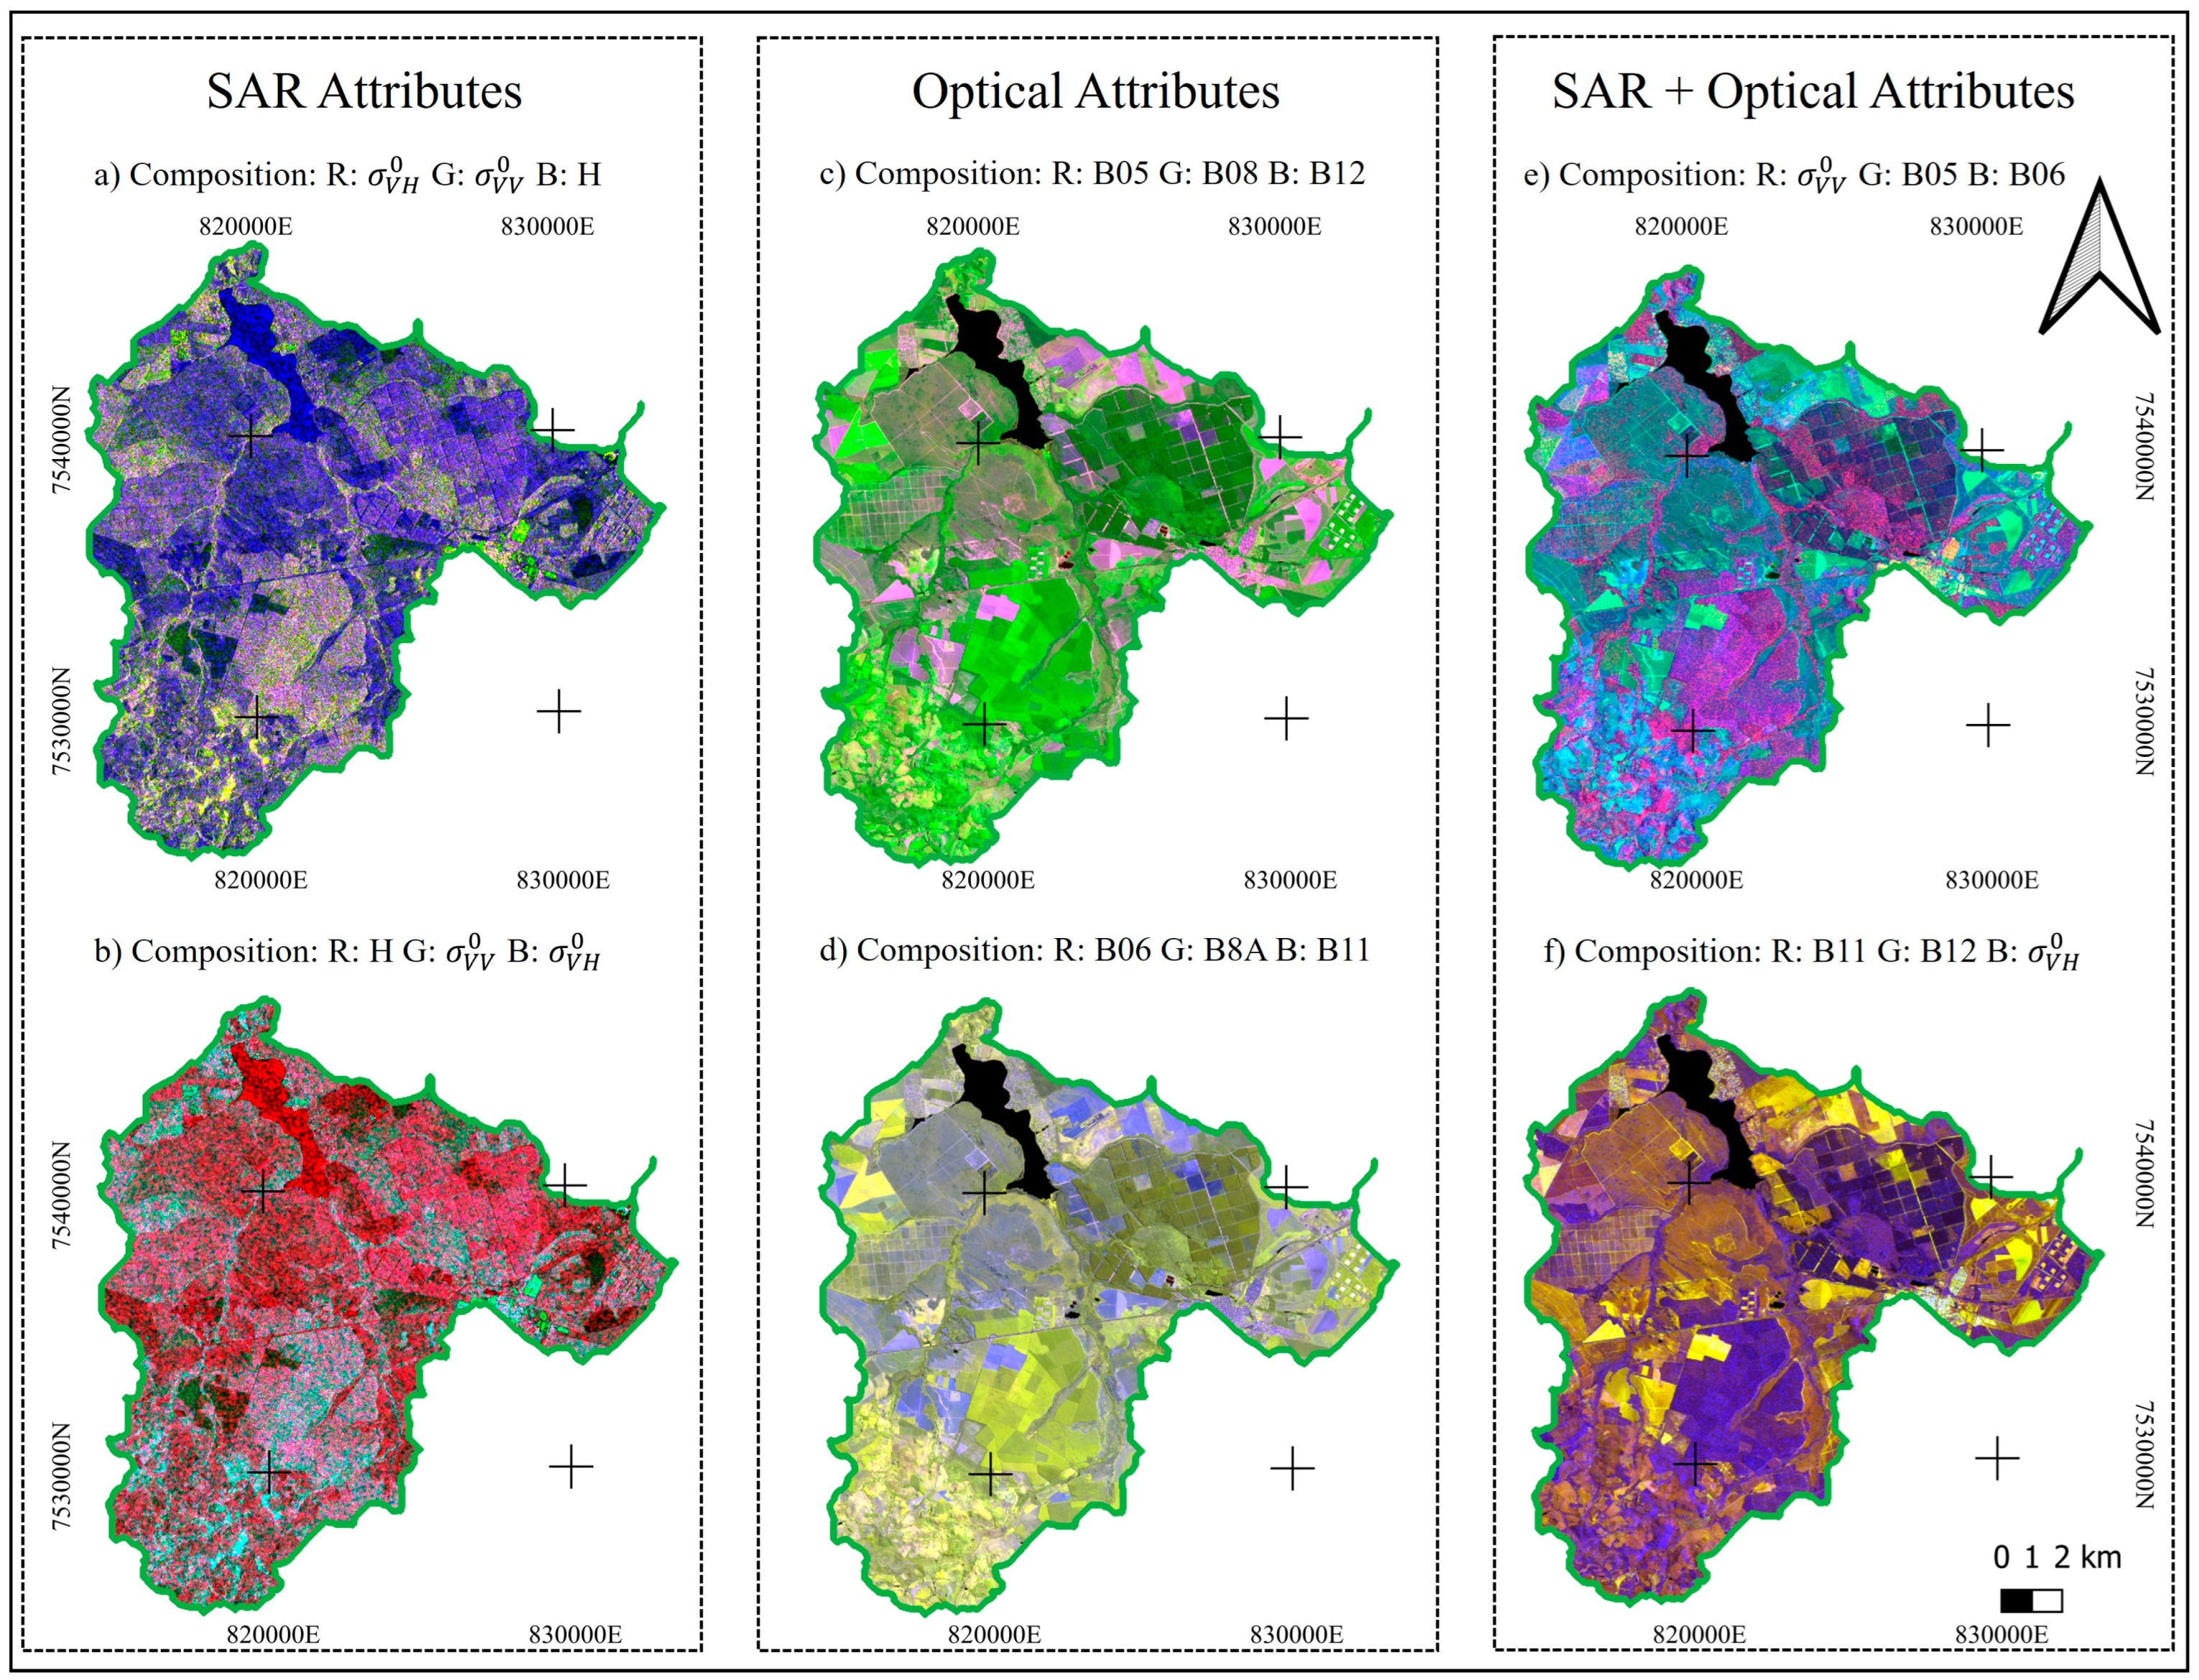
2.3. LULC Classification Attributes from Integrated Optical and SAR Data

Sentinel-1A data were preprocessed using SNAP 8.0 software to obtain SAR attributes, and RStudio 2024.04.0 Build 735 software was used to obtain optical attributes. As the study’s assessment of the spatial composition of native vegetation in transitional regions between the Brazilian Cerrado and Atlantic Forest interface was confined to the LRHB, the spatial pattern of its water ecosystem services could be examined with greater accuracy. The digital elevation model (DEM) was obtained free of charge from the European Space Agency’s Copernicus Open Access Hub website [29], collected by the Advanced Spaceborne Thermal Emission and Reflection Radiometer (ASTER) sensor in the year 2015 [30]. The outline of the hydrographic basin was attained from DEM to delimit the study area and drainage network. Figure 2 depicts the preprocessing of LULC classification.
In the initial preprocessing step, the two Sentinel-1A SLC images were subconfigured through split processing considering the bandwidth covering the LRHB extension and to minimize SNAP data processing time. Apply Orbit File was applied to this subset to update the information in the image metadata. Thermal noise removal was applied to remove additive noise in subswaths and reduce discontinuities between subswaths. To determine backscatter values (σ0VH and σ0VV), radiometric calibration was applied to provide imagery in which the pixel values can be directly related to the radar backscatter intensity, using sensor calibration parameters in the Ground Range Detected (GRD) metadata. This process consists of converting digital numbers of the GRD metadata into backscatter values per area (σ0, Equation (1)), to represent Earth surface targets as physical units , where DNi are the pixels’ digital numbers. Ai is obtained from the application of absolute calibration constant found in the lookup table (LUT) (Sentinel-1 data processing products by European Space Agency), which is a range-dependent gain to produce σ0.
σ i 0 = DN i 2 A i 2
The Sentinel-1A data present only two polarizations, and the calculation of polarimetric decomposition was carried out using the dual-form coherence matrix (Tdual). The 2 × 2 coherence matrix was created using dual polarization data to attain the entropy (H) and alpha (α). Cloude [33] proposed it as an adaptation of the 3 × 3 coherence matrix applied to quad-pol data and implemented in SNAP (Equations (2) and (3)):
T dual = T 11 T 12 T 21 T 22 = U λ 1 λ 2 U H = λ 1 u 1 u 1 H + λ 2 u 2 u 2 H
H = i = 1 2 ( P i log 2 P i )       and       α = i = 1 2 P i cos 1 u 1 i
where Pi represents the relative importance of the eigenvalues of the coherence matrix (λi) and is obtained from Equation (4):
P i = λ i j = 1 2 λ j i = 1 , 2
The two Sentinel-1A images were acquired within 12 days, allowing coregistration to obtain interferometric coherence ( γ VH and γ VV ). The interferometric coherence calculation (Equation (5)) was performed using a 10 × 3 window.
γ = S 1 x S 2 x S 1 x 2 S 2 x 2
where γ represents the interferometric coherence, S1 and S2 are two SLC images from different dates, and ⟨⟩ is the mean over window size.
Deburst processing was applied to merge the subtracts, Multilook (4 × 1 looks) and Lee filter with 3 × 3 window [34] for speckle noise reduction. Finally, the topographic correction of the SAR attributes was performed with range Doppler terrain correction, using DEM Alos-PalSAR-1, with 12.5 m spatial resolution, from Alaska Satellite Facilities.

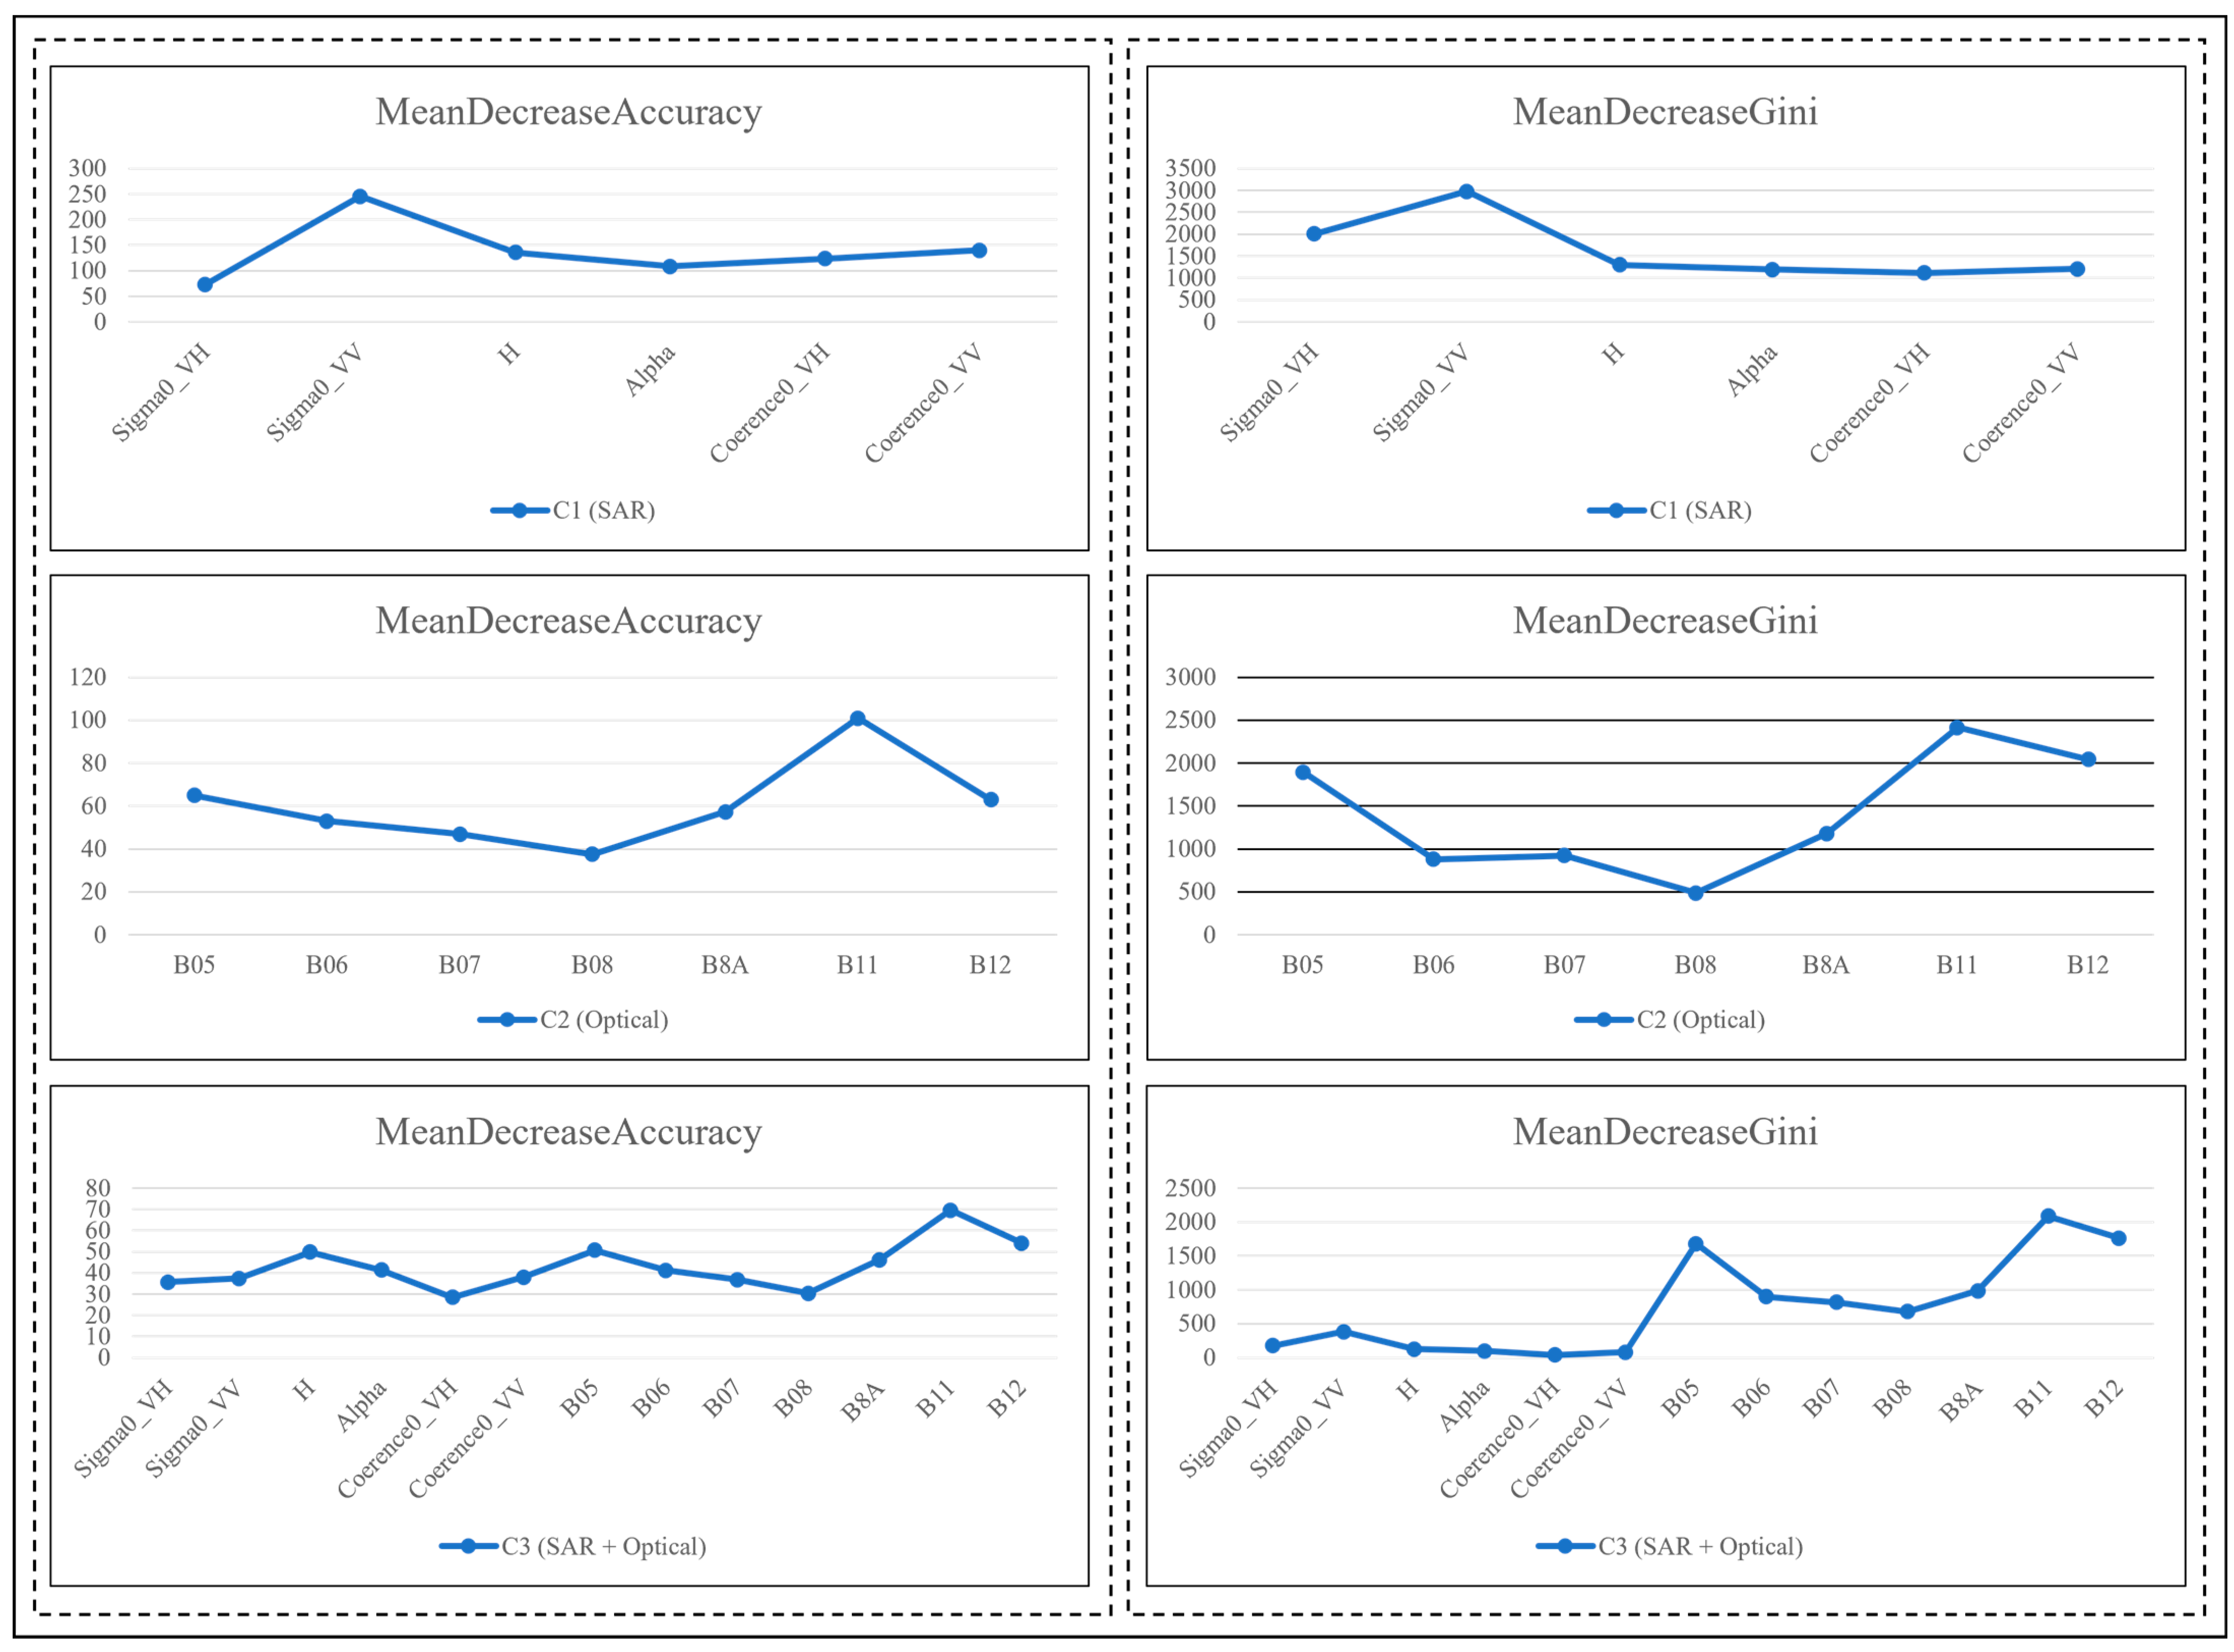
2.4. Image Classification and Accuracy Assessment

The LULC map was derived from random forest (RF) algorithm classification [35,36], using R 2.07.2022 software and the SIRGAS 2000 geodetic reference system in the Universal Transversal Mercator cartographic projection, Zone 23 South. For RF, the parameters Ntree were defined as 500, and Mtry as the square root of the number of input variables. Firstly, ten training sample polygons were collected for each LULC class that were chosen for the purpose of study. Then, the RF algorithm was used to classify, pixel by pixel, from a training of collected samples and generate a model that derived the LULC map. The ten identified classes were agriculture, water (reservoir), wetlands, urban area, Brazilian Cerrado, native vegetation (Atlantic Forest), pasture, experimental reforestation (Itirapina Experimental Station), productive reforestation (wood production), and exposed soil. The study classified native vegetation of the Brazilian Cerrado and experimental reforestation distinctly from productive reforestation to better understand the relevance of each type of activity that uses land for economic and social development.
To evaluate the use of attributes from the Sentinel-1A and Sentinel-2A satellites in LULC mapping, three settings were classified and compared, using the attributes for SAR and optical data separately and integrated (Table 2).
From field observations at forty-seven points (Figure 1) widely distributed in the basin, new pixel samples were collected for precision tests related to each LULC class as a field reference [37,38,39]. The field visit was conducted on 23 April 2023. The elaboration of the LULC map was used as support in preprocessing the interpretation of high-resolution satellite images with optical and radar data, through the RGB combination of spectral bands and radar, in addition to high-resolution images via Google Earth [4,14,40]. The results were analyzed using a confusion matrix to evaluate the classification accuracy by comparing it with field reference data [37,38,39]. From the confusion matrix of the reference and prediction data, the producer and user accuracy values, omission, and inclusion errors for each class, as well as the overall classification accuracy, were identified.

3. Results

3.1. Detailed LULC Classification for Integrated SAR and Optical Data

Figure 3 presents the separability of LULC classes by attribute value in box plot graphs created from the 10 training samples collected per class, with upper, lower, median, mean, maximum, and minimum values for each class. Regarding SAR attributes, the urban area class demonstrated the highest separability, while for optical attributes, urban area, pasture, exposed soil, and water showed the greatest variation.
Figure 4 depicts values for each band. This fundamental RF algorithm result shows the importance of each attribute in classifying data. The figure plots mean decrease accuracy (MDA) shows the precision the model loses by excluding each variable. Accordingly, the more a variable decreases in precision, the greater its importance for sound classification. The mean decrease gini (MDG) is a measure of how each variable contributes to the homogeneity of nodes and leaves in RF. The greater the precision value of its MDA or MDG rating, the greater the importance of the variable in the model. In Figure 4, it is observed that when SAR data are used exclusively (C1), the importance values are high, highlighting the backscatter coefficients (σ0VH e σ0VV). When they are integrated with optical data, greater homogeneity is observed for MDA importance values. MDG importance values, however, demonstrate that integrating SAR and optical data (C3) resulted in high use of optical data, with emphasis on spectral bands B05, B11 and B12, while still using SAR attributes, with emphasis on the backscatter coefficients (σ0VH e σ0VV).
Figure 5 depicts RGB band compositions for C1, C2, and C3. The C1 bands present greater homogeneity in differentiating classes, enabling differentiation of water, pasture, urban area, and native vegetation, while the C2 bands present greater heterogeneity, which facilitates the collection of RF training samples. Finally, the C3 bands clearly differentiate the classes, highlighting distinctions between experimental and productive reforestation, native vegetation and Brazilian Cerrado, exposed soil, and wetlands.

3.2. LULC and Accuracy Assessment

The overall accuracy (OA) values attained through RF classification for C1, C2, and C3 were 55.73%, 94.78%, and 96.54%, respectively. Figure 6 depicts the spatial composition of transitional regions between the Brazilian Cerrado and Atlantic Forest interface. The classes identified were agriculture, water, flooded and urban areas, Brazilian Cerrado, native vegetation (Atlantic Forest), pasture, experimental and productive reforestation, and exposed soil. Figure 7 provides photographic records of field reference data for each LULC class observed.
The accuracy assessment for C1, C2, and C3 used the confusion matrix. Figure 8 presents the producer (PA) and user (UA) accuracy values, omission (OE) and inclusion (IE) errors for each class, as well as the overall accuracy (OA). The results indicate that using only SAR data makes it difficult to attain high PA and UA values for some classes. The agriculture, wetlands, pasture, and Brazilian Cerrado classes obtained low PA and UA values and, consequently, high OE and IE values, while water and urban area classes attained high accuracy values.
As Figure 8 indicates, both C2 and C3 present higher values of OA, PA, and UA than C1. However, C3 modestly exceeded C2, with nearly 2% greater GA, fewer classes with EO and EI, and more classes with higher values of PA and UA, having little difficulty in distinguishing EO in wetlands, productive reforestation, exposed soil, and native vegetation, using the RF algorithm.

4. Discussion

Evaluation of the methodological approach used in this study verifies the integrated use of data from the Sentinel-1 and Sentinel-2 satellites to classify the spatial composition of native vegetation in transitional areas between the Brazilian Cerrado and Atlantic Forest interface. The composition of the basin’s native vegetation (Figure 6) is formed by PPAs, in the margins along rivers and streams and close to springs, as fragments of the Atlantic Forest, and the area comprising the Itirapina Ecological Station, composed of characteristic vegetation of the Brazilian Cerrado biome. Mapping such areas comprising the basin’s native vegetation types is essential for evaluative studies of water ecosystem services [16], as they play a vital role filtering sediment that would otherwise be deposited in waterways and reservoirs [9,41,42,43]. In addition, they represent conservation areas that seek to preserve the basin’s natural resources [4,26].
This study’s analysis of the importance of attributes for LULC classification depicted in Figure 4 indicated that in C1 the most important, in order of descending importance, were the backscatter coefficients (σ0VH e σ0VV), the H-α polarimetric decomposition, and, finally, the interferometric coherence ( γ VH   e   γ VV ). In C2, the order was B11, B12, B05, B8A, B06, B07, and B08, and in C3, the order was that of C2 followed by that of C1.
The C1 confusion matrix demonstrated the difficulties of LULC classification using solely radar data, as it attained the worst values of the three methods assessed in the study, achieving only 55.73% OA. The RF algorithm was extremely difficult to classify, confusing the wetlands and water classes, representing 100% OE and IE. As Figure 3 indicates, the only SAR variable able to differentiate them was the backscatter coefficient σ0VH. The basin’s water class is primarily composed of the Lobo Reservoir, formed from the rivers and streams that constitute the basin drainage network. However, the other watercourses with small width are difficult to distinguish from wetlands of native vegetation in RGB band composition using only radar data (Figure 5). Ref. [44] noted that wetlands, in addition to being spatially complex, are temporally variable, and suggest that temporal information from Sentinel-1 has greater discriminatory effectiveness over forested and nonforested wetlands and nonwetlands. While this study did not use time series, it was able to attain sufficient precision for the wetlands class in C3 with 77.78% PA and 94.92% UA, in which all optical data differentiated the two classes quite well and optimized the SAR classification.
In addition, the capacity of σ0VH to distinguish wooded and nonwooded wetlands is related to sensitivity to volume dispersion, which largely depends on the vegetative structures of the tree canopy [45]. While this variability is evident in the boxplot graphs, depicting the variables by class (Figure 3), it was not possible to observe the same distinction during the collection of training samples, likely due to the small transitional gradient among the basin’s natural characteristics.
Among the difficulties in LULC classification using only SAR data, the RF algorithm did not distinguish pasture well, confusing it with agriculture and Brazilian Cerrado, and attaining 84.73% EO and 45.36% EI. Agriculture was confused with experimental reforestation and exposed soil, attaining 81.18% EO and 90.75% EI. Ref. [46] used C-band backscatter coefficient values (RISAT-1) to map rice, vegetation, buildings, and water bodies, through HH and VH polarizations, obtaining 88.57% OA, while [31] mapped the agricultural land, dense vegetation, sparse vegetation, building, fallow, water bodies, and sand classes and obtained 80.27% (OA) accuracy with only backscattering and 87.7% when adding textural variables.
In this study, the land use classes were divided into ten categories (Figure 7) with the aim of spatializing the distribution of native vegetation (Atlantic Forest and Brazilian Cerrado) and conservation areas (experimental reforestation and wetlands) that are present in the LRHB (transitional Brazilian-Cerrado and Atlantic Forest interface). The number of distinct classes can make the classification procedure more difficult, and for this reason, C1 achieved only 55.73% OA, with the backscatter coefficients being the most significant variable (Figure 4). Differently, several studies achieve a good percentage of global accuracy when dividing land use classes into a smaller number of distinct categories [17,31,43,45,46].
The inclusion of SAR data did not significantly improve RF performance in relation to general accuracy, but the methodology can be used to improve classification when it comes to many distinct categories. The relatively small improvement found in our study is due to the image’s clear atmospheric conditions. Images with bad atmospheric conditions were not used, such as moments of large cloud cover. Generally, studies that present the comparison of optical data with SAR data use images with some degree of cloudiness, so the range of improvement is greater when SAR data are integrated [31,43,45,46]. In this study, we were able to assess and show that SAR data can also be used to improve cases containing favorable atmospheric conditions, considering that it demonstrates great potential to perform urban or anthropized classes, in addition to assisting in the more stratified differentiation of classes in the same region. By integrating SAR and optical data, C3 increased OA to 96.54%. The results indicate that while SAR data are widely used because they can differentiate some LULC classes, when used in isolation, they encounter difficulties, for example, in visual interpretation during training sample collection.
The study maps the basin’s native vegetation, but C1 encountered difficulties, with the Brazilian Cerrado class registering OE and IE rates of 62.42% and 67.03%, respectively, and was confused with experimental reforestation. In addition, the native vegetation class, which obtained 49.25% OE and 20.80% IE, was confused with productive reforestation. This type of class confusion is reported by other studies as well, and [17] observed that the polarimetric decomposition attributes (H-α) were crucial in the stratified identification of different classes in the Brazilian Amazon Forest; however, certain similarities were noted in the distribution of forest and agriculture classes.
In Figure 3, the values of entropy and alpha (H-α) for the Brazilian Cerrado were, on average, slightly higher (0.76–0.88) than those for native vegetation (Atlantic Forest) (0.70–0.80) and resemble those of pasture, wetlands, and experimental reforestation classes. According to [47], this may result from the presence of trees or shrubs in pasture areas, which increase surface roughness, generating an SAR signal similar to forest areas and savannah and grassland forests (Brazilian Cerrado).
Ref. [32] noted an increase in mean entropy values (0.6–0.7) in some areas of dry tropical deciduous forests in India, while [17] obtained mean entropy values (0.65–0.75) for Amazon Forest classes. Thus, the SAR variable best able to distinguish Brazilian Cerrado and native vegetation (Atlantic Forest), as well as other classes, was the backscatter coefficient σ0VH, corroborating the results presented in Figure 4. Integrating optical data in classification, the RF algorithm attained PA and UA values of 100% and 97.76%, respectively, for the Brazilian Cerrado and 94.21% and 91.97%, respectively, for native vegetation (Atlantic Forest).
The overall accuracy of 96.54% attained by C 3 conforms with results in other studies integrating SAR and optical data [10,16,21,22,23,37,38,39]. Ref. [10] evaluated the integrated use of Sentinel-1 and Sentinel-2 data for LULC mapping in a Mediterranean region and attained 90.33% OA. Ref. [23] assessed the same data integration for mapping woody plants in savannas and attained 93% OA. Accordingly, the study’s objective was achieved, with an overall accuracy slightly better than in some studies [10,16,21,22,23].

5. Conclusions

By evaluating the use of SAR and optical data separately and in an integrated manner, the study demonstrated differences between preprocessing attributes, classification, and accuracy. Using optical data as variables is easier and faster than using SAR data, particularly in preprocessing. The sole use of either SAR or optical data, however, may fail to meet expectations when a study’s objective is complex and may require, for example, more detailed stratification of LULC classes or obtaining data on days with considerable atmospheric interference. The use of integrated SAR and optical data offers an improvement to optimize LULC mapping in tropical regions, due to the low influence of the atmosphere on images in the microwave range.

Author Contributions

A.R.S.: Conceptualization, methodology, formal analysis, investigation, writing—original draft, writing—review and editing, funding acquisition. M.A.G.A.B.: Conceptualization, methodology, formal analysis, investigation, writing—review and editing, funding acquisition. P.S.A.: Conceptualization, methodology, formal analysis, investigation, writing—review and editing, funding acquisition. D.P.: Conceptualization, methodology, formal analysis, investigation, writing—review and editing, funding acquisition. F.F.M.: Resources, project administration, supervision. All authors have read and agreed to the published version of the manuscript.

Funding

This research received no external funding.

Data Availability Statement

The original contributions presented in the study are included in the article, further inquiries can be directed to the corresponding author.

Acknowledgments

We would like to thank Coordination of Superior Level Staff Improvement (CAPES) and The National Council for Scientific and Technological Development (CNPq), University of São Paulo (USP) and Graduate Program in Environmental Engineering Sciences (PPG-SEA) Brazil, for supporting this research.

Conflicts of Interest

The authors declare no conflicts of interest.

References

  1. Akbari, M.; Neamatollahi, E.; Neamatollahi, P. Evaluating Land Suitability for Spatial Planning in Arid Regions of Eastern Iran Using Fuzzy Logic and Multi-Criteria Analysis. Ecol. Indic. 2019, 98, 587–598. [Google Scholar] [CrossRef]
  2. Neves, G.L.; Guimarães, T.T.; Anjinho, P.S.; Barbosa, M.A.; DOS Santos, A.R.; Filho, J.S.V.; Mauad, F.F. Spatial and Seasonal Assessment of Water Quality in the Lobo Stream River Basin, Brazil Using Multivariate Statistical Techniques. An. Acad. Bras. Cienc. 2021, 93, e20210072. [Google Scholar] [CrossRef] [PubMed]
  3. da Anjinho, P.S.; Barbosa, M.A.G.A.; Costa, C.W.; Mauad, F.F. Environmental Fragility Analysis in Reservoir Drainage Basin Land Use Planning: A Brazilian Basin Case Study. Land Use Policy 2021, 100, 104946. [Google Scholar] [CrossRef]
  4. Santos, A.R.; Barbosa, M.A.G.A.; Bolleli, T.; Anjinho, P.S.; Roque, R.; Mauad, F.F. Assessment of Water Ecosystem Integrity (WEI) in a Transitional Brazilian Cerrado–Atlantic Forest Interface. Water 2023, 15, 775. [Google Scholar] [CrossRef]
  5. Souza, C.M.; Shimbo, J.Z.; Rosa, M.R.; Parente, L.L.; Alencar, A.A.; Rudorff, B.F.T.; Hasenack, H.; Matsumoto, M.; Ferreira, L.G.; Souza-Filho, P.W.M.; et al. Reconstructing Three Decades of Land Use and Land Cover Changes in Brazilian Biomes with Landsat Archive and Earth Engine. Remote Sens. 2020, 12, 2735. [Google Scholar] [CrossRef]
  6. Ustaoglu, E.; Aydınoglu, A.C. Suitability Evaluation of Urban Construction Land in Pendik District of Istanbul, Turkey. Land Use Policy 2020, 99, 104783. [Google Scholar] [CrossRef]
  7. DeFries, R.S.; Floey, J.A.; Asner, G.P. Land-Use Choices: Balancing Human Needs and Ecosystem Function. Front. Ecol. Environ. 2004, 2, 249–257. [Google Scholar] [CrossRef]
  8. Tundisi, J.G.; Matsumura-Tundisi, T. The Ecology of UHE Carlos Botelho (Lobo-Broa Reservoir) and Its Watershed, São Paulo, Brazil. Freshw. Rev. 2013, 6, 75–91. [Google Scholar] [CrossRef]
  9. Tundisi, J.G.; Tundisi, T.M. Integrating Ecohydrology, Water Management, and Watershed Economy: Case Studies from Brazil. Ecohydrol. Hydrobiol. 2016, 16, 83–91. [Google Scholar] [CrossRef]
  10. De Luca, G.; Silva, J.M.N.; Di Fazio, S.; Modica, G. Integrated Use of Sentinel-1 and Sentinel-2 Data and Open-Source Machine Learning Algorithms for Land Cover Mapping in a Mediterranean Region. Eur. J. Remote Sens. 2022, 55, 52–70. [Google Scholar] [CrossRef]
  11. WWF. Cerrado, the Brazilian Savanna. Available online: https://wwf.panda.org/discover/knowledge_hub/where_we_work/cerrado/ (accessed on 19 September 2022).
  12. Projeto MapBiomas. Projeto MapBiomas—Mapeamento Anual de Cobertura e Uso da Terra No Cerrado—Coleção 7; Projeto MapBiomas Brasil: Sao Paulo, Brazil, 2022. [Google Scholar]
  13. Projeto MapBiomas. Projeto MapBiomas—Mapeamento Anual de Cobertura e Uso da Terra Na Mata Atlântica—Coleção 7; Projeto MapBiomas Brasil: Sao Paulo, Brazil, 2022. [Google Scholar]
  14. dos Santos, A.R.; da Silva, R.C.F.; de Assis, L.C.; Mauad, F.F. Defining Environmental Conservation Levels Considering Anthropic Activity in the Uberaba River Basin Protected Area. Ambient. Agua-Interdiscip. J. Appl. Sci. 2019, 14, 1. [Google Scholar] [CrossRef]
  15. Maxwell, A.E.; Warner, T.A.; Fang, F. Implementation of Machine-Learning Classification in Remote Sensing: An Applied Review. Int. J. Remote Sens. 2018, 39, 2784–2817. [Google Scholar] [CrossRef]
  16. Wen, D.; Ma, S.; Zhang, A.; Ke, X. Spatial Pattern Analysis of the Ecosystem Services in the Guangdong-Hong Kong-Macao Greater Bay Area Using Sentinel-1 and Sentinel-2 Imagery Based on Deep Learning Method. Sustainability 2021, 13, 7044. [Google Scholar] [CrossRef]
  17. de Diniz, J.M.F.S.; Gama, F.F.; Adami, M. Evaluation of Polarimetry and Interferometry of Sentinel-1A SAR Data for Land Use and Land Cover of the Brazilian Amazon Region. Geocarto Int. 2020, 37, 1482–1500. [Google Scholar] [CrossRef]
  18. Eibedingil, I.G.; Gill, T.E.; Scott Van Pelt, R.; Tong, D.Q. Combining Optical and Radar Satellite Imagery to Investigate the Surface Properties and Evolution of the Lordsburg Playa, New Mexico, USA. Remote Sens. 2021, 13, 3402. [Google Scholar] [CrossRef]
  19. Ienco, D.; Interdonato, R.; Gaetano, R.; Ho Tong Minh, D. Combining Sentinel-1 and Sentinel-2 Satellite Image Time Series for Land Cover Mapping via a Multi-Source Deep Learning Architecture. ISPRS J. Photogramm. Remote Sens. 2019, 158, 11–22. [Google Scholar] [CrossRef]
  20. Morin, D.; Planells, M.; Guyon, D.; Villard, L.; Mermoz, S.; Bouvet, A.; Thevenon, H.; Dejoux, J.F.; Le Toan, T.; Dedieu, G. Estimation and Mapping of Forest Structure Parameters from Open Access Satellite Images: Development of a Generic Method with a Study Case on Coniferous Plantation. Remote Sens. 2019, 11, 1275. [Google Scholar] [CrossRef]
  21. Nikaein, T.; Iannini, L.; Molijn, R.A.; Lopez-Dekker, P. On the Value of Sentinel-1 InSAR Coherence Time-Series for Vegetation Classification. Remote Sens. 2021, 13, 3300. [Google Scholar] [CrossRef]
  22. Numbisi, F.N.; Van Coillie, F.M.B.; De Wulf, R. Delineation of Cocoa Agroforests Using Multiseason Sentinel-1 SAR Images: A Low Grey Level Range Reduces Uncertainties in GLCM Texture-Based Mapping. ISPRS Int. J. Geo-Inf. 2019, 8, 179. [Google Scholar] [CrossRef]
  23. Zhang, W.; Brandt, M.; Wang, Q.; Prishchepov, A.V.; Tucker, C.J.; Li, Y.; Lyu, H.; Fensholt, R. From Woody Cover to Woody Canopies: How Sentinel-1 and Sentinel-2 Data Advance the Mapping of Woody Plants in Savannas. Remote Sens. Environ. 2019, 234, 111465. [Google Scholar] [CrossRef]
  24. Fang, B.; Li, Y.; Zhang, H.; Chan, J.C.W. Collaborative Learning of Lightweight Convolutional Neural Network and Deep Clustering for Hyperspectral Image Semi-Supervised Classification with Limited Training Samples. ISPRS J. Photogramm. Remote Sens. 2020, 161, 164–178. [Google Scholar] [CrossRef]
  25. Campregher, R.; Martins, R.C. O “Modelo Broa” e a Produção de Conhecimento Científico Sobre o Meio Ambiente. Desenvolv. Meio Ambient. 2017, 40, 141–158. [Google Scholar] [CrossRef]
  26. dos Santos, A.R.; da Anjinho, P.S.; Neves, G.L.; Barbosa, M.A.G.A.; de Assis, L.C.; Mauad, F.F. Dynamics of Environmental Conservation: Evaluating the Past for a Sustainable Future. Int. J. Appl. Earth Obs. Geoinf. 2021, 102, 102452. [Google Scholar] [CrossRef]
  27. Governo do Estado de São Paulo. Declara Área de Proteção Ambiental Regiões Situadas Em Diversos Municípios, Dentre Os Quais Corumbatai, Botucatu e Tejupa; Diário Oficial do Estado: São Paulo, Brasil, 1983. [Google Scholar]
  28. Intituto Federal do Estado de São Paulo. Plano de Manejo Integrado Das Estações Ecológica e Experimetnal de Itirapina/SP; Diário Oficial do Estado: São Paulo, Brasil, 2006. [Google Scholar]
  29. ESA. Copernicus Open Access Hub. Available online: https://scihub.copernicus.eu/dhus/#/home (accessed on 24 April 2023).
  30. United States Geological Survey. Digital Elevation Model (DEM), Advanced Spaceborne Thermal Emis-Sion and Re-flec-Tion Radiometer (ASTER). Copernicus Open Access Hub Eur. Sp. Agency. 2015. Available online: https://scihub.copernicus.eu/ (accessed on 4 September 2023).
  31. Mishra, V.N.; Prasad, R.; Rai, P.K.; Vishwakarma, A.K.; Arora, A. Performance Evaluation of Textural Features in Improving Land Use/Land Cover Classification Accuracy of Heterogeneous Landscape Using Multi-Sensor Remote Sensing Data. Earth Sci. Inform. 2019, 12, 71–86. [Google Scholar] [CrossRef]
  32. Varghese, A.O.; Suryavanshi, A.; Joshi, A.K. Analysis of Different Polarimetric Target Decomposition Methods in Forest Density Classification Using C Band SAR Data. Int. J. Remote. Sens. 2016, 37, 694–709. [Google Scholar] [CrossRef]
  33. Cloude, S. The Dual Polarization Entropy/Alpha Decomposition: A PALSAR Case Study. ESASP 2007, 644, 2. [Google Scholar]
  34. Lee, J. Sen Digital Image Enhancement and Noise Filtering by Use of Local Statistics. IEEE Trans. Pattern Anal. Mach. Intell. 1980, PAMI-2, 165–168. [Google Scholar] [CrossRef] [PubMed]
  35. Belgiu, M.; Drăgu, L. Random Forest in Remote Sensing: A Review of Applications and Future Directions. ISPRS J. Photogramm. Remote Sens. 2016, 114, 24–31. [Google Scholar] [CrossRef]
  36. Breiman, L. Random Forests. Mach. Learn. 2001, 45, 5–32. [Google Scholar] [CrossRef]
  37. Foody, G.M. Status of Land Cover Classification Accuracy Assessment. Remote Sens. Environ. 2002, 80, 185–201. [Google Scholar] [CrossRef]
  38. Foody, G.M. Explaining the Unsuitability of the Kappa Coefficient in the Assessment and Comparison of the Accuracy of Thematic Maps Obtained by Image Classification. Remote Sens. Environ. 2020, 239, 111630. [Google Scholar] [CrossRef]
  39. Story, M.; Congalton, R.G. Accuracy Assessment: A User’s Perspective. Photogramm. Eng. Remote Sens. 1986, 52, 397–399. [Google Scholar]
  40. Heidarlou, H.B.; Shafiei, A.B.; Erfanian, M.; Tayyebi, A.; Alijanpour, A. Effects of Preservation Policy on Land Use Changes in Iranian Northern Zagros Forests. Land Use Policy 2019, 81, 76–90. [Google Scholar] [CrossRef]
  41. Calijuri, M.L.; de Castro, J.S.; Costa, L.S.; Assemany, P.P.; Alves, J.E.M. Impact of Land Use/Land Cover Changes on Water Quality and Hydrological Behavior of an Agricultural Subwatershed. Environ. Earth Sci. 2015, 74, 5373–5382. [Google Scholar] [CrossRef]
  42. Mishra, P.K.; Rai, A.; Rai, S.C. Land Use and Land Cover Change Detection Using Geospatial Techniques in the Sikkim Himalaya, India. Egypt. J. Remote Sens. Sp. Sci. 2020, 23, 133–143. [Google Scholar] [CrossRef]
  43. Periotto, N.A.; Tundisi, J.G. Serviĉos Ecossistêmicos Do Reservatório Da UHE Carlos Botelho (Lobo-Broa): Uma Nova Abordagem Para o Gerenciamento e Planejamento Dos Múltiplos Usos de Represas. Braz. J. Biol. 2013, 73, 471–482. [Google Scholar] [CrossRef]
  44. Li, Z.; Chen, H.; White, J.C.; Wulder, M.A.; Hermosilla, T. Discriminating Treed and Non-Treed Wetlands in Boreal Ecosystems Using Time Series Sentinel-1 Data. Int. J. Appl. Earth Obs. Geoinf. 2020, 85, 102007. [Google Scholar] [CrossRef]
  45. Freeman, A.; Durden, S.L. A Three-Component Scattering Model for Polarimetric SAR Data. IEEE Trans. Geosci. Remote Sens. 1998, 36, 963–973. [Google Scholar] [CrossRef]
  46. Mishra, V.N.; Prasad, R.; Kumar, P.; Srivastava, P.K.; Rai, P.K. Knowledge-Based Decision Tree Approach for Mapping Spatial Distribution of Rice Crop Using C-Band Synthetic Aperture Radar-Derived Information. J. Appl. Remote Sens. 2017, 11, 1. [Google Scholar] [CrossRef]
  47. Delgado-Aguilar, M.J.; Fassnacht, F.E.; Peralvo, M.; Gross, C.P.; Schmitt, C.B. Potential of TerraSAR-X and Sentinel 1 Imagery to Map Deforested Areas and Derive Degradation Status in Complex Rain Forests of Ecuador. Int. For. Rev. 2017, 19, 102–118. [Google Scholar] [CrossRef]
Figure 1. South America (a), São Paulo State (b) and Lobo Reservoir Hydrographic Basin (c) localization and points used for field validation.
Remotesensing 16 02559 g001
Figure 2. Preprocessing flowchart of LULC classification.
Remotesensing 16 02559 g002
Figure 3. SAR attributes and optical data with values for each class.
Remotesensing 16 02559 g003
Figure 4. Importance of variables for mean decrease accuracy and mean decrease gini.
Remotesensing 16 02559 g004
Figure 5. RGB band compositions for C1, C2, and C3.
Remotesensing 16 02559 g005
Figure 6. LULC for C1, C2, and C3 with native vegetation in transition between Brazilian Cerrado and Atlantic Forest interface.
Remotesensing 16 02559 g006
Figure 7. Photographic record for each LRHB class.
Remotesensing 16 02559 g007
Figure 8. Producer and user accuracy values, omission, and inclusion errors for each class for C1, C2, and C3.
Remotesensing 16 02559 g008
Table 1. Types of data, source, acquisition date, and resolution used to create the LULC map.
Data SourceAcquiredAcquisitionResolution
LULCSentinel 1 image19 December 2022[29]5 × 20 m
31 December 2022
Sentinel 2 image25 March 2023[29]20 m
WaterwaysDigital elevation model, Advanced Spaceborne Thermal Emission and Reflection Radiometer 2015[30]1:50,000
LRHB contour
Table 2. Evaluation of SAR and optical attributes separately and combined.
SetAttributesData Type
C1σ0VH + σ0VV   +   H + α + γ V H + γ V V SAR
C2B05 + B06 + B07 + B08 + B8A + B11 + B12Optical
C3σ0VH + σ0VV   +   H + α + γ V H + γ V V +
B05 + B06 + B07 + B08 + B8A + B11 + B12
Integrated
Disclaimer/Publisher’s Note: The statements, opinions and data contained in all publications are solely those of the individual author(s) and contributor(s) and not of MDPI and/or the editor(s). MDPI and/or the editor(s) disclaim responsibility for any injury to people or property resulting from any ideas, methods, instructions or products referred to in the content.

