Article

Construction of a High-Resolution Waterlogging Disaster Monitoring Framework Based on the APSIM Model: A Case Study of Jingzhou and Bengbu

1
School of Remote Sensing and Information Engineering, Wuhan University, Wuhan 430079, China
2
Hubei Luojia Laboratory, Wuhan 430079, China
3
Institute of Spatial Information Technology Application, Yangtze River Scientific Research Institute, Wuhan 430014, China
4
Yunnan Institute of Water and Hydropower Engineering Investigation, Design and Research, Kunming 650021, China
5
Honghe Prefecture Large Irrigation District Administration Bureau, Mengzi 661100, China
*
Author to whom correspondence should be addressed.
Remote Sens. 2024, 16(14), 2581; https://doi.org/10.3390/rs16142581
Submission received: 31 May 2024 / Revised: 9 July 2024 / Accepted: 12 July 2024 / Published: 14 July 2024

Abstract

:
This study investigates waterlogging disasters in winter wheat using the Agricultural Production Systems Simulator (APSIM) model. This research explores the effects of soil hypoxia on wheat root systems and the tolerance of wheat at different growth stages to waterlogging, proposing a model to quantify the degree of waterlogging in wheat. Remote sensing data on soil moisture and wheat distribution are utilized to establish a monitoring system for waterlogging disasters specific to winter wheat. The analysis focused on affected areas in Bengbu and Jingzhou. Experimental results from 2017 to 2022 indicate that the predominant levels of waterlogging disasters in Bengbu and Jingzhou were moderate and mild, with the proportion of mild waterlogging ranging from 30.1% to 39.3% and moderate waterlogging from 14.8% to 25.6%. A combined analysis of multi-source remote sensing data reveals the key roles of precipitation, evapotranspiration, and altitude in waterlogging disasters. This study highlights regional disparities in the distribution of waterlogging disaster risks, providing new strategies and tools for precise assessment of waterlogging disasters.

1. Introduction

Waterlogging refers to the condition where soil is saturated with water for extended periods, adversely affecting plant growth and soil quality [1,2,3]. This phenomenon often occurs due to excessive rainfall, poor drainage, or rising groundwater levels. In agriculture, waterlogging is a significant concern, as it can lead to reduced oxygen availability in the soil, hindering root respiration and overall plant health [4,5,6]. The prolonged presence of water disrupts the balance of nutrients, gases, and thermal conditions in the soil, leading to diminished crop yields and compromised soil structure. Effective monitoring and management of waterlogging are crucial to mitigate its impact on agricultural productivity and soil sustainability [7,8,9].
Research on the assessment and monitoring of waterlogging risks is relatively limited. Quantitative standards are needed to analyze and evaluate the impact of waterlogging disasters, with waterlogging disaster indices being key tools in this field. Early studies often focused on meteorological factors as the causative agents of waterlogging disasters in monitoring and assessment efforts [10,11]. For instance, Yu et al. analyzed winter wheat meteorological yields in the Jianghuai region, establishing a winter wheat waterlogging disaster classification index model primarily based on precipitation, precipitation days, and sunshine hours [12]. However, these methods mostly focused on the frequency of disasters or meteorological factors and did not fully consider other key factors determining stagnant water damage risks, such as soil, topography, and hydrology; thus, their assessment results do not fully depict the overall risk of waterlogging disasters [13].
With the development of remote sensing technology, there has been extensive research on remote sensing-based waterlogging disaster indices. Chowdary et al. used NDVI to delineate waterlogged areas in the Satluj region of Bihar, India [14]. Sahu et al. employed multiple spectral indices to extract waterlogged areas in the Moyna Basin of India, but the accuracy of these indices was not compared [15]. Singh et al. found that the Modified Normalized Difference Water Index (MNDWI) was more effective than the original Normalized Difference Water Index (NDWI) in extracting waterlogged areas [16]. However, the aforementioned studies often overlooked meteorological factors when analyzing the impact of waterlogging disasters on crops, potentially resulting in less targeted analysis outcomes [17,18]. Therefore, it is necessary to consider multiple factors when constructing comprehensive indices to provide more accurate analysis.
Furthermore, these methods primarily consider causative factors but overlook the changing characteristics of crop tolerance to waterlogging [19,20,21]. Because various factors such as topography, climate, soil properties, and land use affect root systems through soil moisture, further improving modeling strategies involves incorporating soil moisture data into assessments. Crop root systems exhibit significant differences in response to soil waterlogging (such as low oxygen or anoxic stress) during different growth stages. The decrease in oxygen content in winter wheat soil is mainly associated with a reduction in gas volume in soil pores or a decrease in oxygen concentration, often caused by soil oversaturation or high groundwater levels [22,23]. Currently, to consider the impact of waterlogging disasters on crop yields, many crop growth models regard soil water content or groundwater depth as key influencing factors to assess the degree of waterlogging [24]. Some models, such as the DRAINMOD model [25], the APSIM model [26], and the SWAGMAN Destiny model [27], quantitatively evaluate waterlogging disasters by analyzing the effect of soil water content on root growth under low oxygen pressure. Researchers like Attia et al. successfully introduced low oxygen or anoxic pressure factors into the CERES-Wheat model, effectively analyzing the impact of waterlogging disasters [28]. Further refinement of waterlogging disaster indices requires integrating key physiological indicators at different stages, fully considering the vulnerability of crops to water stress at different growth stages, thus constructing comprehensive risk assessment models to provide a scientific basis for rational irrigation and crop yield increase.
This study delves into the effects of soil hypoxia on root systems and the tolerance of winter wheat at different growth stages through the application of the APSIM model. Based on this, a model quantifying the degree of waterlogging is proposed. The research utilized remote sensing data on soil moisture and winter wheat distribution to establish a monitoring system for waterlogging disasters affecting winter wheat. This system was then employed to analyze the affected areas in Bengbu and Jingzhou cities.

2. Research Area and Data
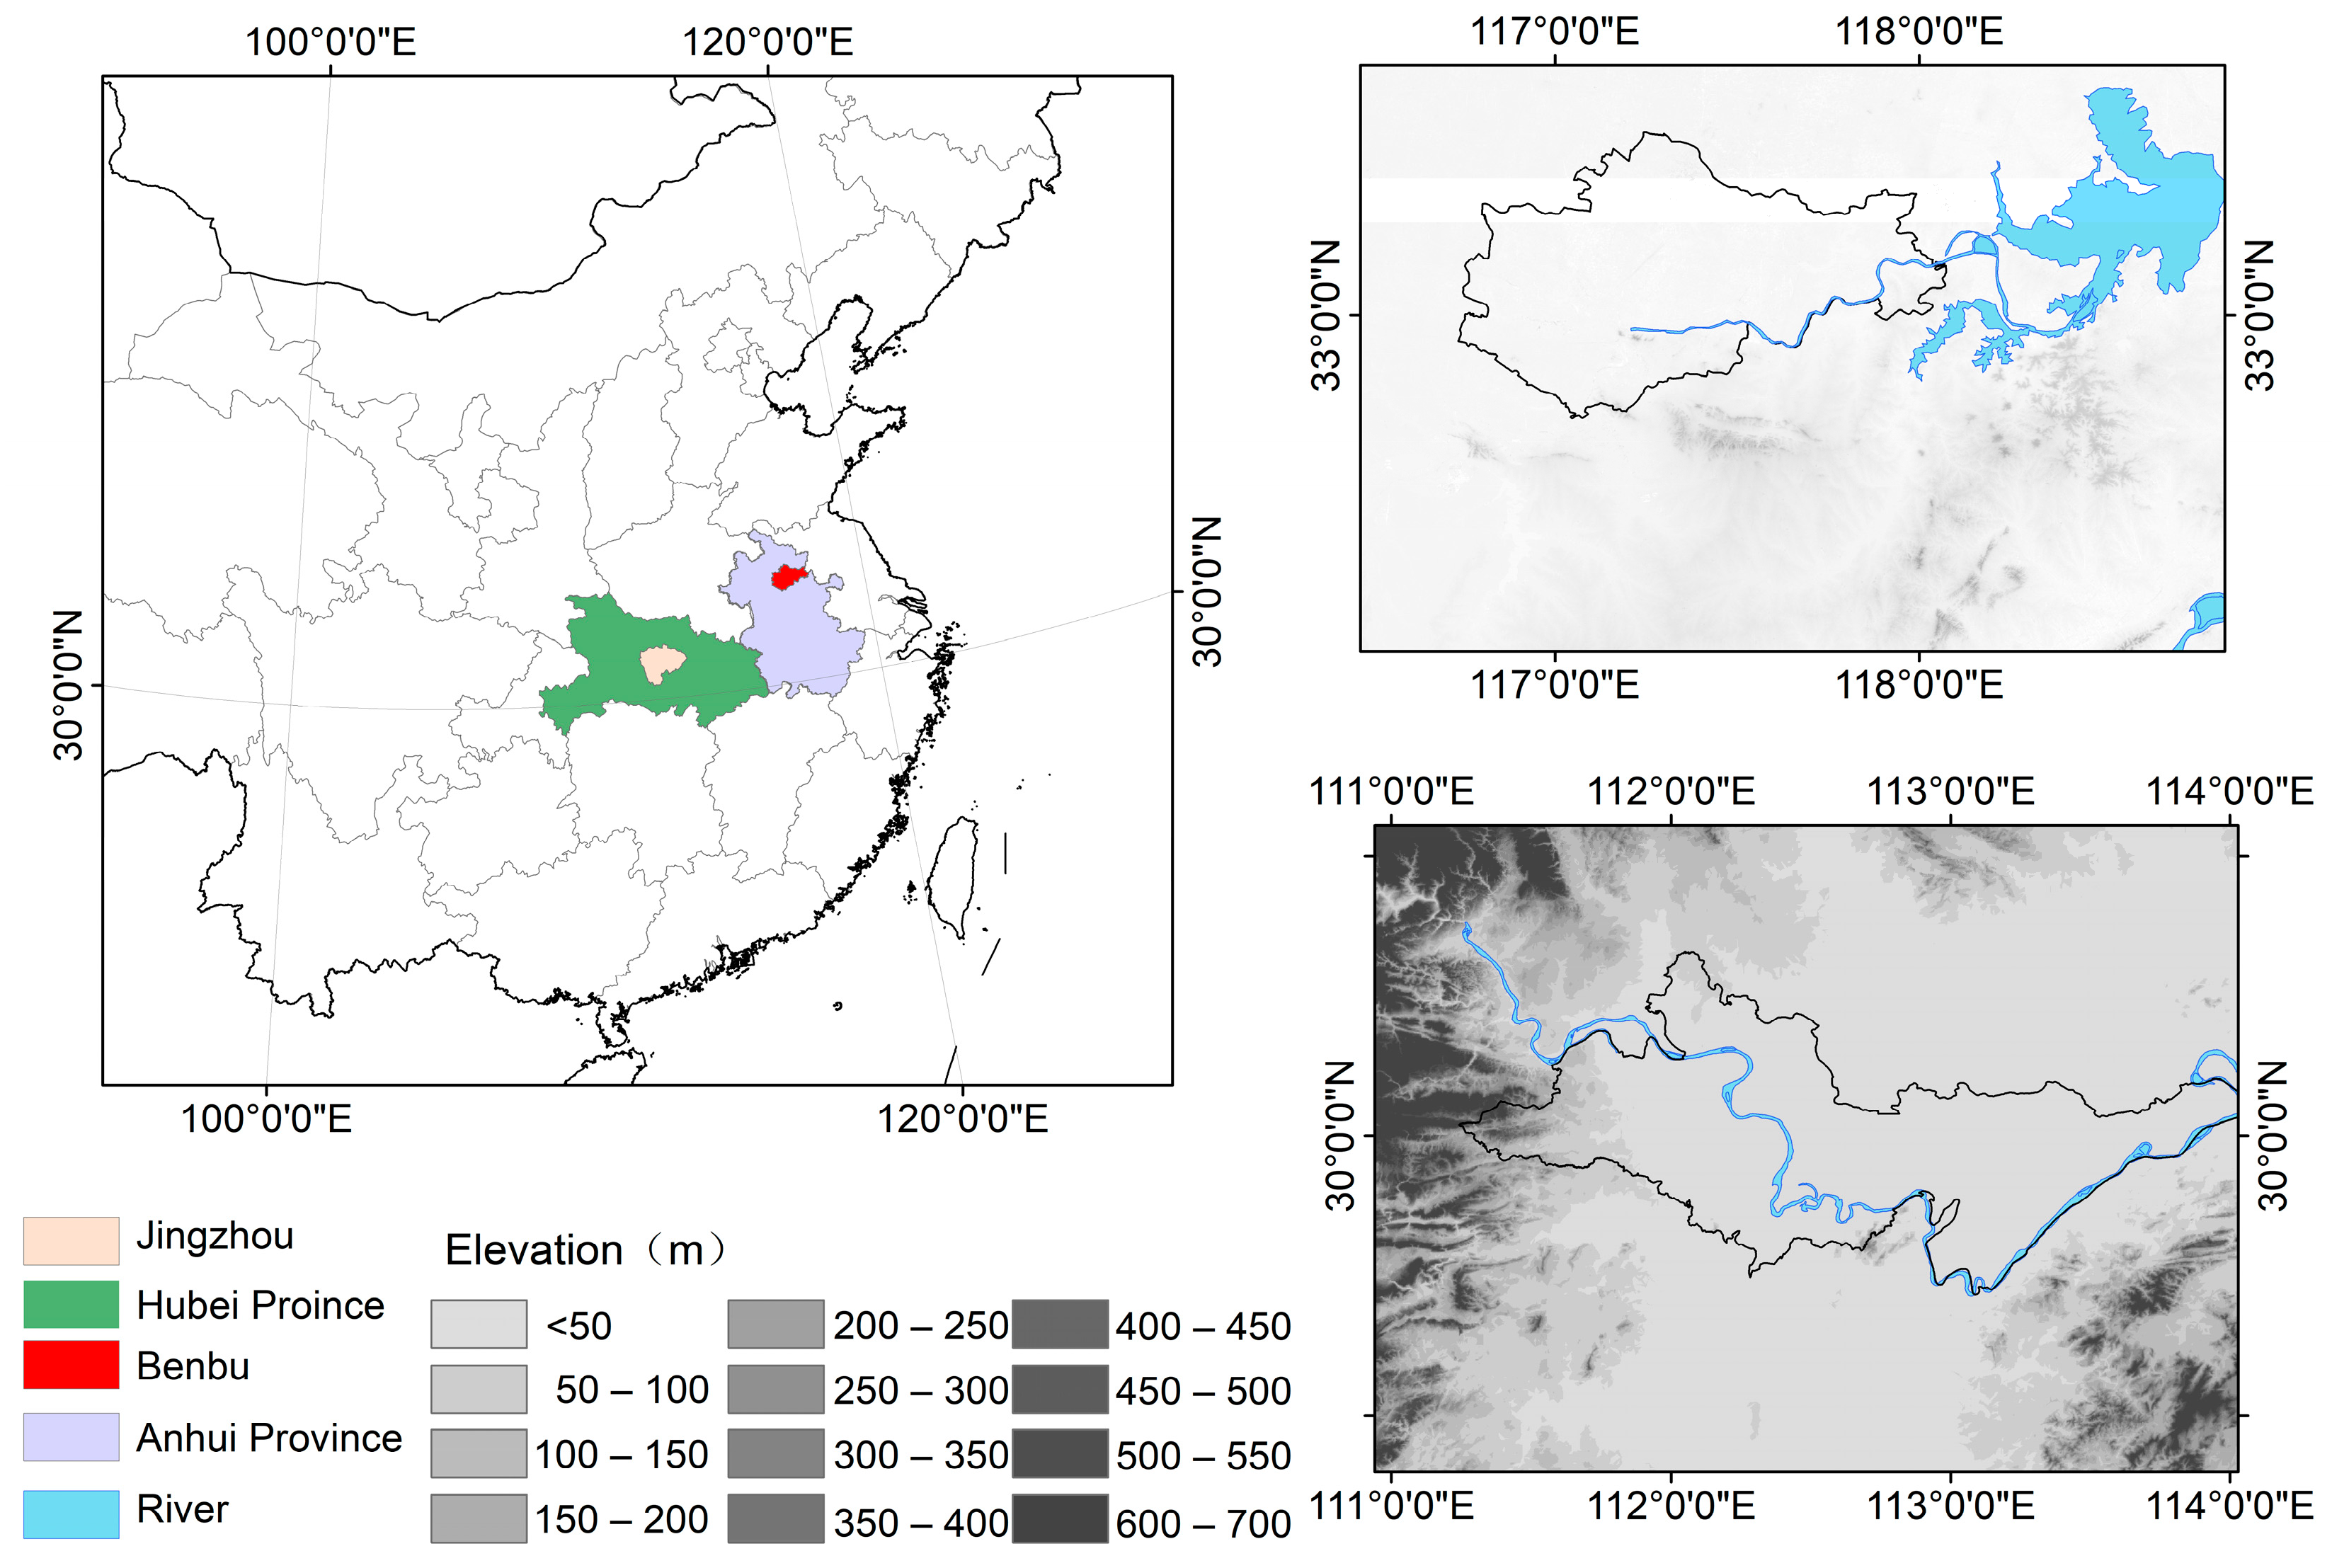
2.1. Research Area

This study used Jingzhou and Bengbu in China as two research areas to verify the reliability of the proposed method. Jingzhou and Bengbu frequently experience waterlogging due to their geographical and climatic conditions. Jingzhou, located in the floodplain of the Yangtze River, is prone to heavy rainfall and river overflow, which leads to soil saturation. Bengbu, situated near the Huai River, faces similar issues with seasonal floods and inadequate drainage systems, resulting in prolonged water saturation in agricultural fields. Figure 1 illustrates the geographical location of the study area.
Jingzhou is situated between approximately 112°26′ to 113°21′ east longitude and 30°64′ to 29°54′ north latitude, near the Yangtze River. The study area is characterized by flat terrain, with an average elevation of less than 100 m. The climate is mild, with distinct seasons and moderate rainfall, and the soil is classified as paddy soil, with deep surface layers, light texture, porous structure, and good soil conservation. The average sunshine hours are 2163.8 h per year, with annual rainfall ranging from 636.1 to 663.9 mm, and the average annual vegetation evaporation is 993.2 mm. The main cereal crops in the study area are winter wheat and rice.
Bengbu lies between approximately 33°10′ to 33°30′ north latitude and 117°02′ to 117°36′ east longitude. It spans about 47 km from east to west and approximately 51 km from north to south, with a total area of approximately 1363 square kilometers. The area is an important region for winter wheat cultivation. Statistics indicate that there is relatively low precipitation in the early stages of winter wheat growth, with the least rainfall occurring from December to January of the following year and the most from April to May. The average number of rainy days from October to January in the study area was relatively low, while the intensity of precipitation in the later stages of winter wheat growth was significantly greater than in the earlier stages.

2.2. Remote Sensing Satellite Data

The remote sensing image data used in this study comes from the European Space Agency (ESA) under the Copernicus program, specifically the Sentinel series of Earth observation satellites. Currently, this series includes seven satellites in orbit (S1A/B, S2A/B, S3A/B, S5P), and their data products are freely available to all users. These satellites offer global coverage and long-term continuous observation, providing various types of data, including optical images, radar images, and hyperspectral data. Specifically, the Sentinel-1 satellite focuses on all-weather, day-and-night radar imaging of land and ocean, offering diverse SAR product data to meet different application needs [29]. The Sentinel-2 satellite provides global land surface multispectral, high-resolution optical observation services, enabling the systematic collection of high-frequency multispectral images globally, effectively complementing the Landsat series satellites’ multispectral observation capabilities [30].

2.3. Auxiliary Data

The auxiliary datasets used in this paper include remote sensing meteorological data, soil texture data, digital elevation data, and hydrological data. These data are crucial for the hydrological model and related analyses presented. The usage of each data type is detailed below.
  • Remote Sensing Meteorological Data
For remote sensing meteorological data, this study utilized the ERA5-Land dataset [31], which updates hourly and is a high-resolution reanalysis dataset that provides a consistent record of land variable changes over the past decades. Compared with ERA5, ERA5-Land has higher spatial resolution and is generated by processing the land component of ECMWF’s ERA5 climate reanalysis data. This reanalysis method combines model data with observations from around the world, forming a coherent and comprehensive global dataset that accurately reflects historical climate changes.
The MODIS evapotranspiration products include MOD16A2/A3, which provide global evapotranspiration estimates at 8-day and monthly scales with a spatial resolution of 500 m, covering a long-term time series starting from 2000, facilitating the analysis of long-term evapotranspiration trends [32].
These evapotranspiration data can be accessed through NASA’s Earthdata Search website (https://search.earthdata.nasa.gov/, accessed on 14 July 2023), the USGS Earth Resources Observation and Science (EROS) Center (https://www.usgs.gov/centers/eros, accessed on 10 May 2023), or other related data service platforms. The required datasets can be downloaded according to geographic location, time period, and research needs.
  • Soil Texture Data
The soil texture information was provided by the International Soil Reference and Information Center (ISRIC) and can be accessed and downloaded directly from the ISRIC website (https://www.isric.org/, accessed on 3 February 2023).
Soil texture is an important attribute that describes the particle size composition of the solid portion of the soil, involving the proportions of sand, silt, and clay. This information is crucial for understanding soil physical properties, water retention capacity, and nutrient supply capacity. The soil texture data provided by ISRIC include information on different soil depth layers, which is helpful for analyzing the characteristics of the soil vertical profile and its impact on water and nutrient dynamics.
  • Digital Elevation Data
The elevation data were provided by the United States Geological Survey (USGS) Geographic Data Center (https://earthexplorer.usgs.gov/, accessed on 17 May 2023) through the Shuttle Radar Topography Mission (SRTM) data. This is a high-resolution global digital elevation model widely used in hydrology, terrain analysis, and environmental research. The SRTM mission was executed by NASA in 2000 with the primary goal of acquiring high-precision elevation data of the Earth’s surface. SRTM data cover global land areas between 60°N and 56°S latitudes, providing high-quality elevation information for most of the Earth’s land. There are two main types of SRTM data resolution: 30 m high-resolution data (SRTM-1) and 90 m resolution data (SRTM-3). This study used the 30 m resolution SRTM-1 data [33].
  • Hydrological Data
This study utilized the HydroSHEDS (Hydrological data and maps based on Shuttle Elevation Derivatives at multiple Scales) dataset developed by the World Wildlife Fund (WWF) [34]. This is a global river network and hydrological terrain information database constructed based on high-resolution elevation data obtained from SRTM. HydroSHEDS provides various spatial resolution options ranging from 90 m to 500 m, covering most global land areas, and offers detailed and comprehensive data for terrain analysis, watershed delineation, and river network extraction. This information is automatically extracted based on terrain, including flow direction and hydrological unit data, which are crucial for determining the flow direction of water between grid cells and identifying major river channels and tributary systems. Additionally, HydroSHEDS provides watershed boundary data and hydrological terrain attributes such as elevation and slope, which are important for studying hydrological dynamics within specific watersheds. The data were obtained from the HydroSHEDS website (https://www.hydrosheds.org/, accessed on 29 August 2023) and analyzed in detail according to research needs. Local calibration and validation are required when applying these global data to specific geographic regions to ensure the accuracy and reliability of research results.
Table 1 shows all the remote sensing data sources used in this study. This paper utilized remote sensing data from various sources with different spatial resolutions to achieve a comprehensive understanding of soil moisture and waterlogging risks. To ensure consistency and facilitate data integration, all data were resampled to a common spatial resolution of 10 m. This unified resolution matches the highest resolution data available from Sentinel-1, allowing for detailed and accurate spatial analysis. By standardizing the resolution, discrepancies were minimized, and all data layers could be effectively integrated into the APSIM and HYDRUS-1D models. This approach enhanced the overall accuracy of the waterlogging assessments and improved the reliability of the results in evaluating the impact on crop growth.

3. Research Methodology

3.1. Acquisition of Soil Moisture

In this study, the process of obtaining soil moisture data, specifically the daily soil surface volumetric water content, is crucial for assessing waterlogging risks. The APSIM model, which is designed to simulate crop growth and development, integrates these data to estimate the impact of hypoxia stress on plant roots. This study used a combination of remote sensing data and model simulations to acquire the necessary soil moisture data.
The Sentinel-1 satellite data from the European Space Agency (ESA) under the Copernicus program provides Synthetic Aperture Radar (SAR) data. These high-resolution data were processed using the Water Cloud Model to retrieve soil moisture values, correcting for vegetation cover effects. The HYDRUS-1D model was then used to simulate soil moisture dynamics, requiring input parameters such as soil hydraulic properties, weather data (precipitation, temperature), and initial soil moisture conditions. The soil moisture values retrieved from Sentinel-1 were integrated with simulated values from the HYDRUS-1D model using a particle filter assimilation algorithm. This method enhances the accuracy of soil moisture estimation by combining observed data with model predictions.
The input data for these models include soil hydraulic properties obtained from field measurements and literature values, such as soil water retention curves and hydraulic conductivity. Weather data were sourced from the ERA5-Land dataset, which provides high-resolution reanalysis data for land variables, including hourly updates on precipitation, temperature, and other meteorological parameters. Initial soil conditions were set based on field observations and historical data to initialize the model simulations.
The calibration and validation of the HYDRUS-1 model involved several steps. Data on soil moisture and temperature were collected from multiple field sites over different seasons to capture variability. Initial parameters for soil hydraulic properties, such as soil water retention and hydraulic conductivity, were set based on soil texture analysis and literature values. Initial simulations were run using the collected field data, with simulated soil moisture values compared to observed values. Parameters were iteratively adjusted to minimize the difference between observed and simulated soil moisture values. Optimization was carried out using the inverse modeling capabilities of HYDRUS-1, adjusting parameters to best fit the observed data. An independent set of soil moisture data not used in the calibration was then collected from different field sites. The calibrated model was run using this independent data set, and the simulated soil moisture values were compared with the observed values. Nash–Sutcliffe efficiency (NSE) was used to evaluate the model’s accuracy.
By integrating these methods, this study ensures accurate and reliable estimation of daily soil surface volumetric water content, which is crucial for assessing waterlogging risks and impacts on crop growth. This approach allows for continuous monitoring and improves the spatial resolution of the soil moisture data used in the APSIM model.
The APSIM model then calculated the overall impact of hypoxia stress on roots through several steps. First, it obtained the daily soil surface volumetric water content. Then, it calculated the soil pore water content, which resides within the pores of the soil. By knowing the soil bulk density and water content, the soil pore water content could be calculated. These data are crucial for estimating the hypoxia impact on roots, as low-oxygen environments can significantly affect root growth and function. The model analyzes soil pore water content and other environmental factors to estimate the extent of hypoxia’s impact on the roots. The specific method is described in the next section.

3.2. Calculate the Overall Impact of Hypoxia Stress with the APSIM Model

APSIM version 7.10 is a simulation software jointly developed by the Commonwealth Scientific and Industrial Research Organisation (CSIRO) and state government agricultural departments in Australia [35]. It is designed to simulate the complex biophysical processes of crop growth, development, and yield within agricultural systems, providing a platform for accurately predicting and studying the impact of agricultural management strategies on crop performance.
The APSIM model is used to assess the effects of low oxygen stress on the root system by simulating soil moisture dynamics. The model calculates the volume water content of the soil pores by computing the volumetric soil water content at the soil surface layer each day. Volumetric water content is a key indicator of soil moisture status, which affects the availability of oxygen in the soil because excess water can occupy the space originally intended for air pores, leading to a decrease in soil oxygen content. By utilizing these data, the model calculates characteristic quantities of low oxygen’s impact on root systems. This computation takes into account the influence of soil moisture conditions on the oxygen supply to the roots. Additionally, consideration is given to the duration of continuous waterlogging days, which refers to the length of time the soil remains oversaturated. This factor is crucial because the longer the soil remains saturated, the longer the roots experience low oxygen conditions, which can have a greater impact on their growth and function. By combining these data and calculations, an overall impact factor of low oxygen on root systems can be estimated, reflecting the extent of low oxygen stress on the overall health and functionality of the roots [36]. The specific steps for constructing a waterlogging disaster index based on the APSIM model are as follows:
In the APSIM model, the characteristic quantity of low oxygen’s impact on root systems is a key parameter used to simulate and quantify the extent of the effect on roots under low oxygen or anoxic conditions. Since soil moisture affects the diffusion of oxygen in soil pores and the respiration of roots, a characteristic quantity ranging from 0 to 1 can be constructed by calculating the volumetric water content of soil pores to represent the impact of low oxygen on roots, where 0 indicates complete anaerobic conditions in soil pores (extremely unfavorable for root growth), and 1 indicates sufficient oxygen in soil pores (suitable for root growth). The specific calculation formula is given as:
A e r f = { 1 S WWFPS     C WFPS 1     C WFPS S WWFPS C WFPS 1 S WWFPS < C WFPS ,
where C WFPS represents the critical soil pore water content, and S WWFPS is the soil pore water content, also known as soil moisture saturation, expressed as follows:
S WWFPS = S W / ( 1 B D / S D ) ,
where S W represents the volumetric soil water content, which is the proportion of water volume to total volume in a unit volume of soil, and B D is the bulk density of dry soil; the value is taken with reference to the study by Yu et al. [37]; S D is the density of soil solid particles, which is close to the average density of minerals, taken as 2.65 g/cm3, with ( 1 B D / S D ) representing the total porosity of the soil.
Waterlogging days refer to the number of days when the soil moisture exceeds the crop’s requirements, leading to oxygen deficiency or low oxygen conditions, thereby affecting the functionality of crop roots and overall growth. For winter wheat, under the soil conditions in the central region, waterlogging does not significantly affect crop root function until after 3 days, and the impact remains relatively unchanged after 60 days. Therefore, waterlogging days can be expressed as follows:
Dtime   ( t ) = { 0 S WWFPS , t < C WFPS min ( Dtime   ( t 1 ) + 1 ,   60 ) C 3   &   S WWFPS , t C WFPS 1 C = 3   &   S WWFPS , t C WFPS Dtime   ( t 1 ) Other ,
where t represents the number of days since October 1st of the previous year, and C is the number of consecutive days of waterlogging. When the soil pore water content is less than the critical soil pore water content, the waterlogging days are set to 0, indicating that the moisture conditions have not yet adversely affected the crops. When the soil pore water content is greater or equal to the critical soil pore water content, each additional day increases the waterlogging days by one. When the waterlogging days exceed or equal 60 days, they are fixed at 60 days, indicating that after 60 days, the impact of waterlogging on crops stabilizes and does not increase with time. The critical value for soil pore water content in this paper is taken as 0.65, referencing the values in the relevant literature [38].
The impact function represents the tolerance of crops to waterlogging (the coefficient of reaction to waterlogging disasters). For the entire growth cycle of winter wheat, the coefficient of reaction to waterlogging disasters follows an “S”-shaped curve. Generally, the impact of waterlogging during the wintering period is minimal, with a small value. However, during the jointing, booting, and grain-filling stages, it gradually increases. Therefore, a sigmoid function is used to simulate this characteristic, and the calculation formula is obtained as follows:
C o e f , t = 1 1 + e ( 0.06 × t + 5.0 )
According to Equation (4), the curve of the calculated values varying with dates can be seen in Figure 2.
Considering the soil moisture conditions (characteristic quantity of low oxygen impact), waterlogging days, and the impact of crop tolerance to waterlogging (coefficient of reaction to waterlogging disasters), a root daily impact function can be constructed to quantify the daily impact of waterlogging conditions on plant roots. Its calculation formula is given as follows:
L aff , t = [ ( 1 A erf , t ) Dtime   ( t ) 0.167 ] × C oef , t
The values of the root daily impact function range between 0 and 1. When the value of this function approaches 1, it indicates that the roots are significantly affected by waterlogging disasters. Conversely, when the value is close to 0, it means that the roots have not been affected by waterlogging disasters.
For the daily impact function of winter wheat throughout the entire growth cycle, the first step is to calculate its average value. Subsequently, this average value is normalized to obtain the waterlogging index covering the entire growth period. The calculation formula is obtained as follows:
W = 1 n i = 1 n L aff , t ,
where W represents the number of days in the entire growth period of winter wheat. Referring to the study by Sairam et al. [39], the research area is divided into four waterlogging disaster levels: no waterlogging, mild waterlogging ( 0 . 1 W < 0 . 3 ), moderate waterlogging ( 0 . 3 W < 0 . 6 ), and severe waterlogging areas ( W 0 . 6 ).

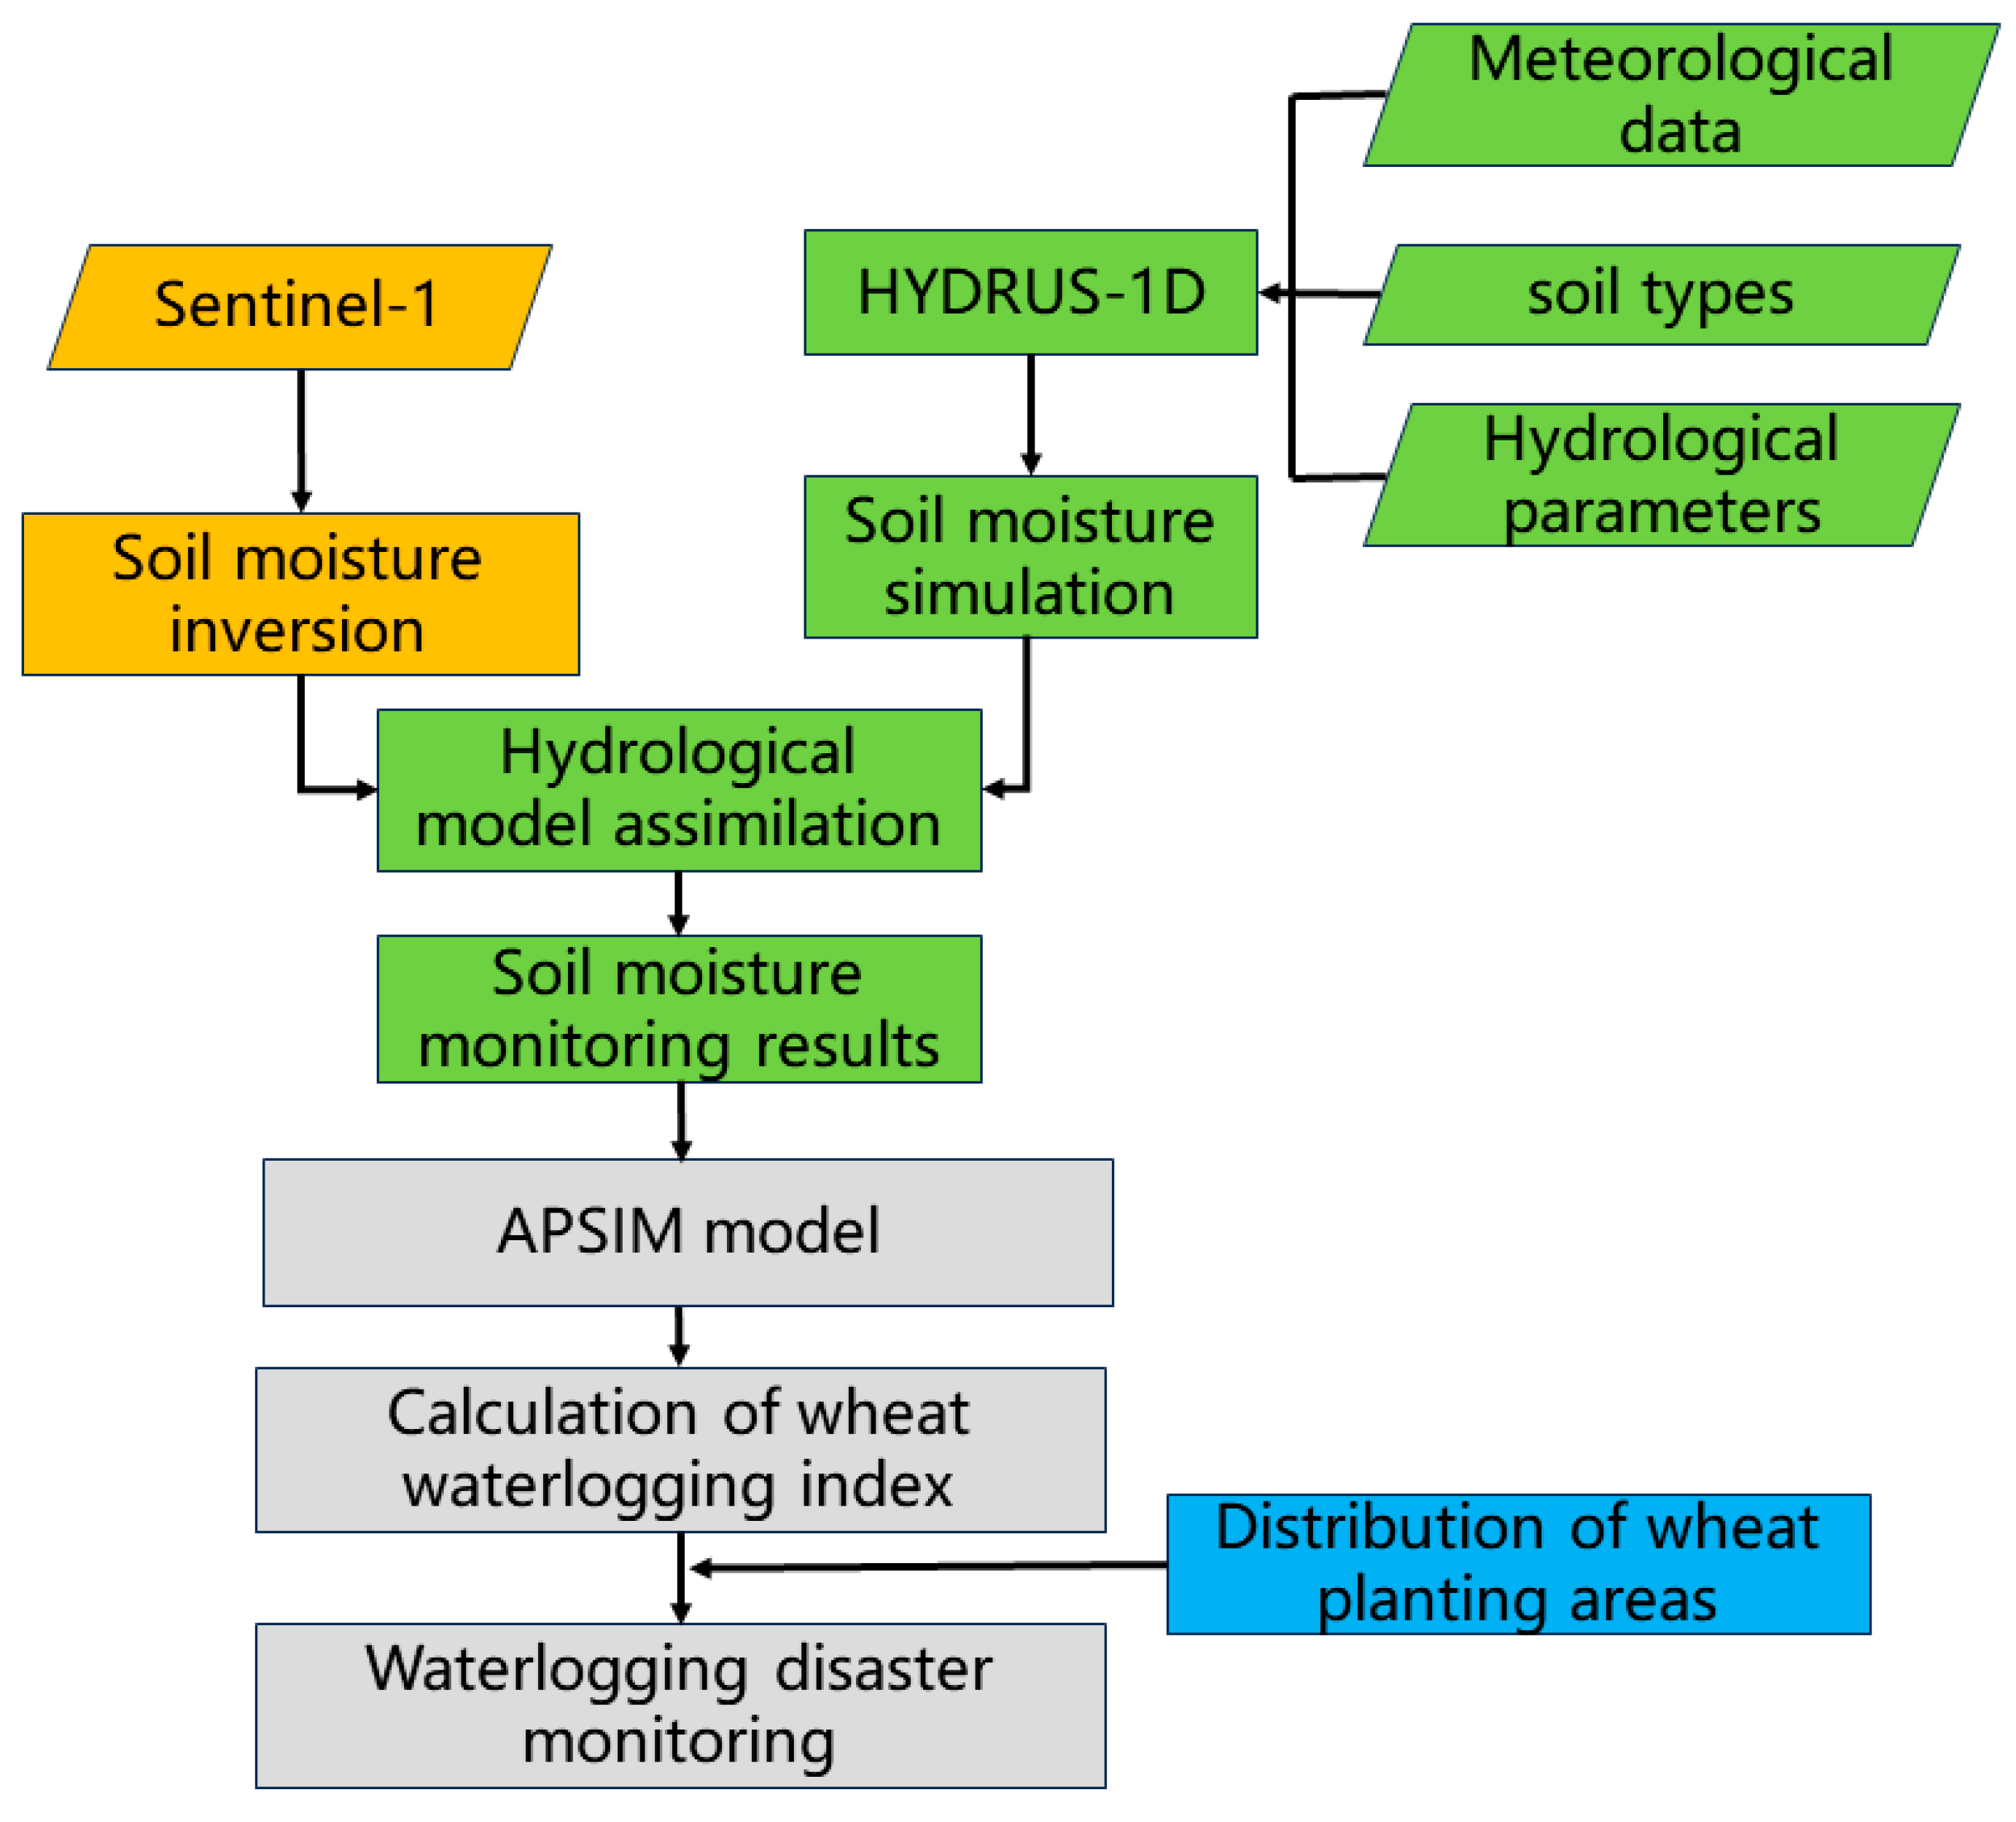
3.3. Waterlogging Disaster Monitoring Framework

Based on the above research, this paper proposes a systematic method for monitoring winter wheat waterlogging disasters using spaceborne synthetic aperture radar data. The structure of this method is shown in Figure 3. To achieve high-resolution monitoring of waterlogging distribution, soil moisture acquisition references the method from Jian Zhang et al. [40]. Firstly, soil moisture observations were retrieved using Sentinel-1, and the Water Cloud Model was used to eliminate the influence of vegetation cover, as indicated by the yellow icon in the figure. Then, combined with the soil moisture simulation values obtained using the HYDRUS-1D model, a particle filter assimilation algorithm was applied to the remote sensing retrieved soil moisture data to obtain soil moisture data for the winter wheat-covered areas, as indicated by the green icon in the figure. In addition to soil moisture data, spatial distribution data of winter wheat planting areas was also needed. This study used the 30 m resolution winter wheat planting distribution dataset for China produced by Jie Dong et al. [41], as indicated by the blue icon in the figure. Finally, in the winter wheat planting areas, soil moisture monitoring data were combined with the waterlogging disaster monitoring index described in this paper to monitor waterlogging disasters, as indicated by the gray icon in the figure. The bilinear interpolation resampling method was used to normalize the resolution of the multi-source data to the 30 m resolution. Bilinear interpolation calculates new pixel values based on the weighted average of the four nearest pixels in the original data, ensuring spatial alignment and accuracy for subsequent integrated analysis [42].

4. Results

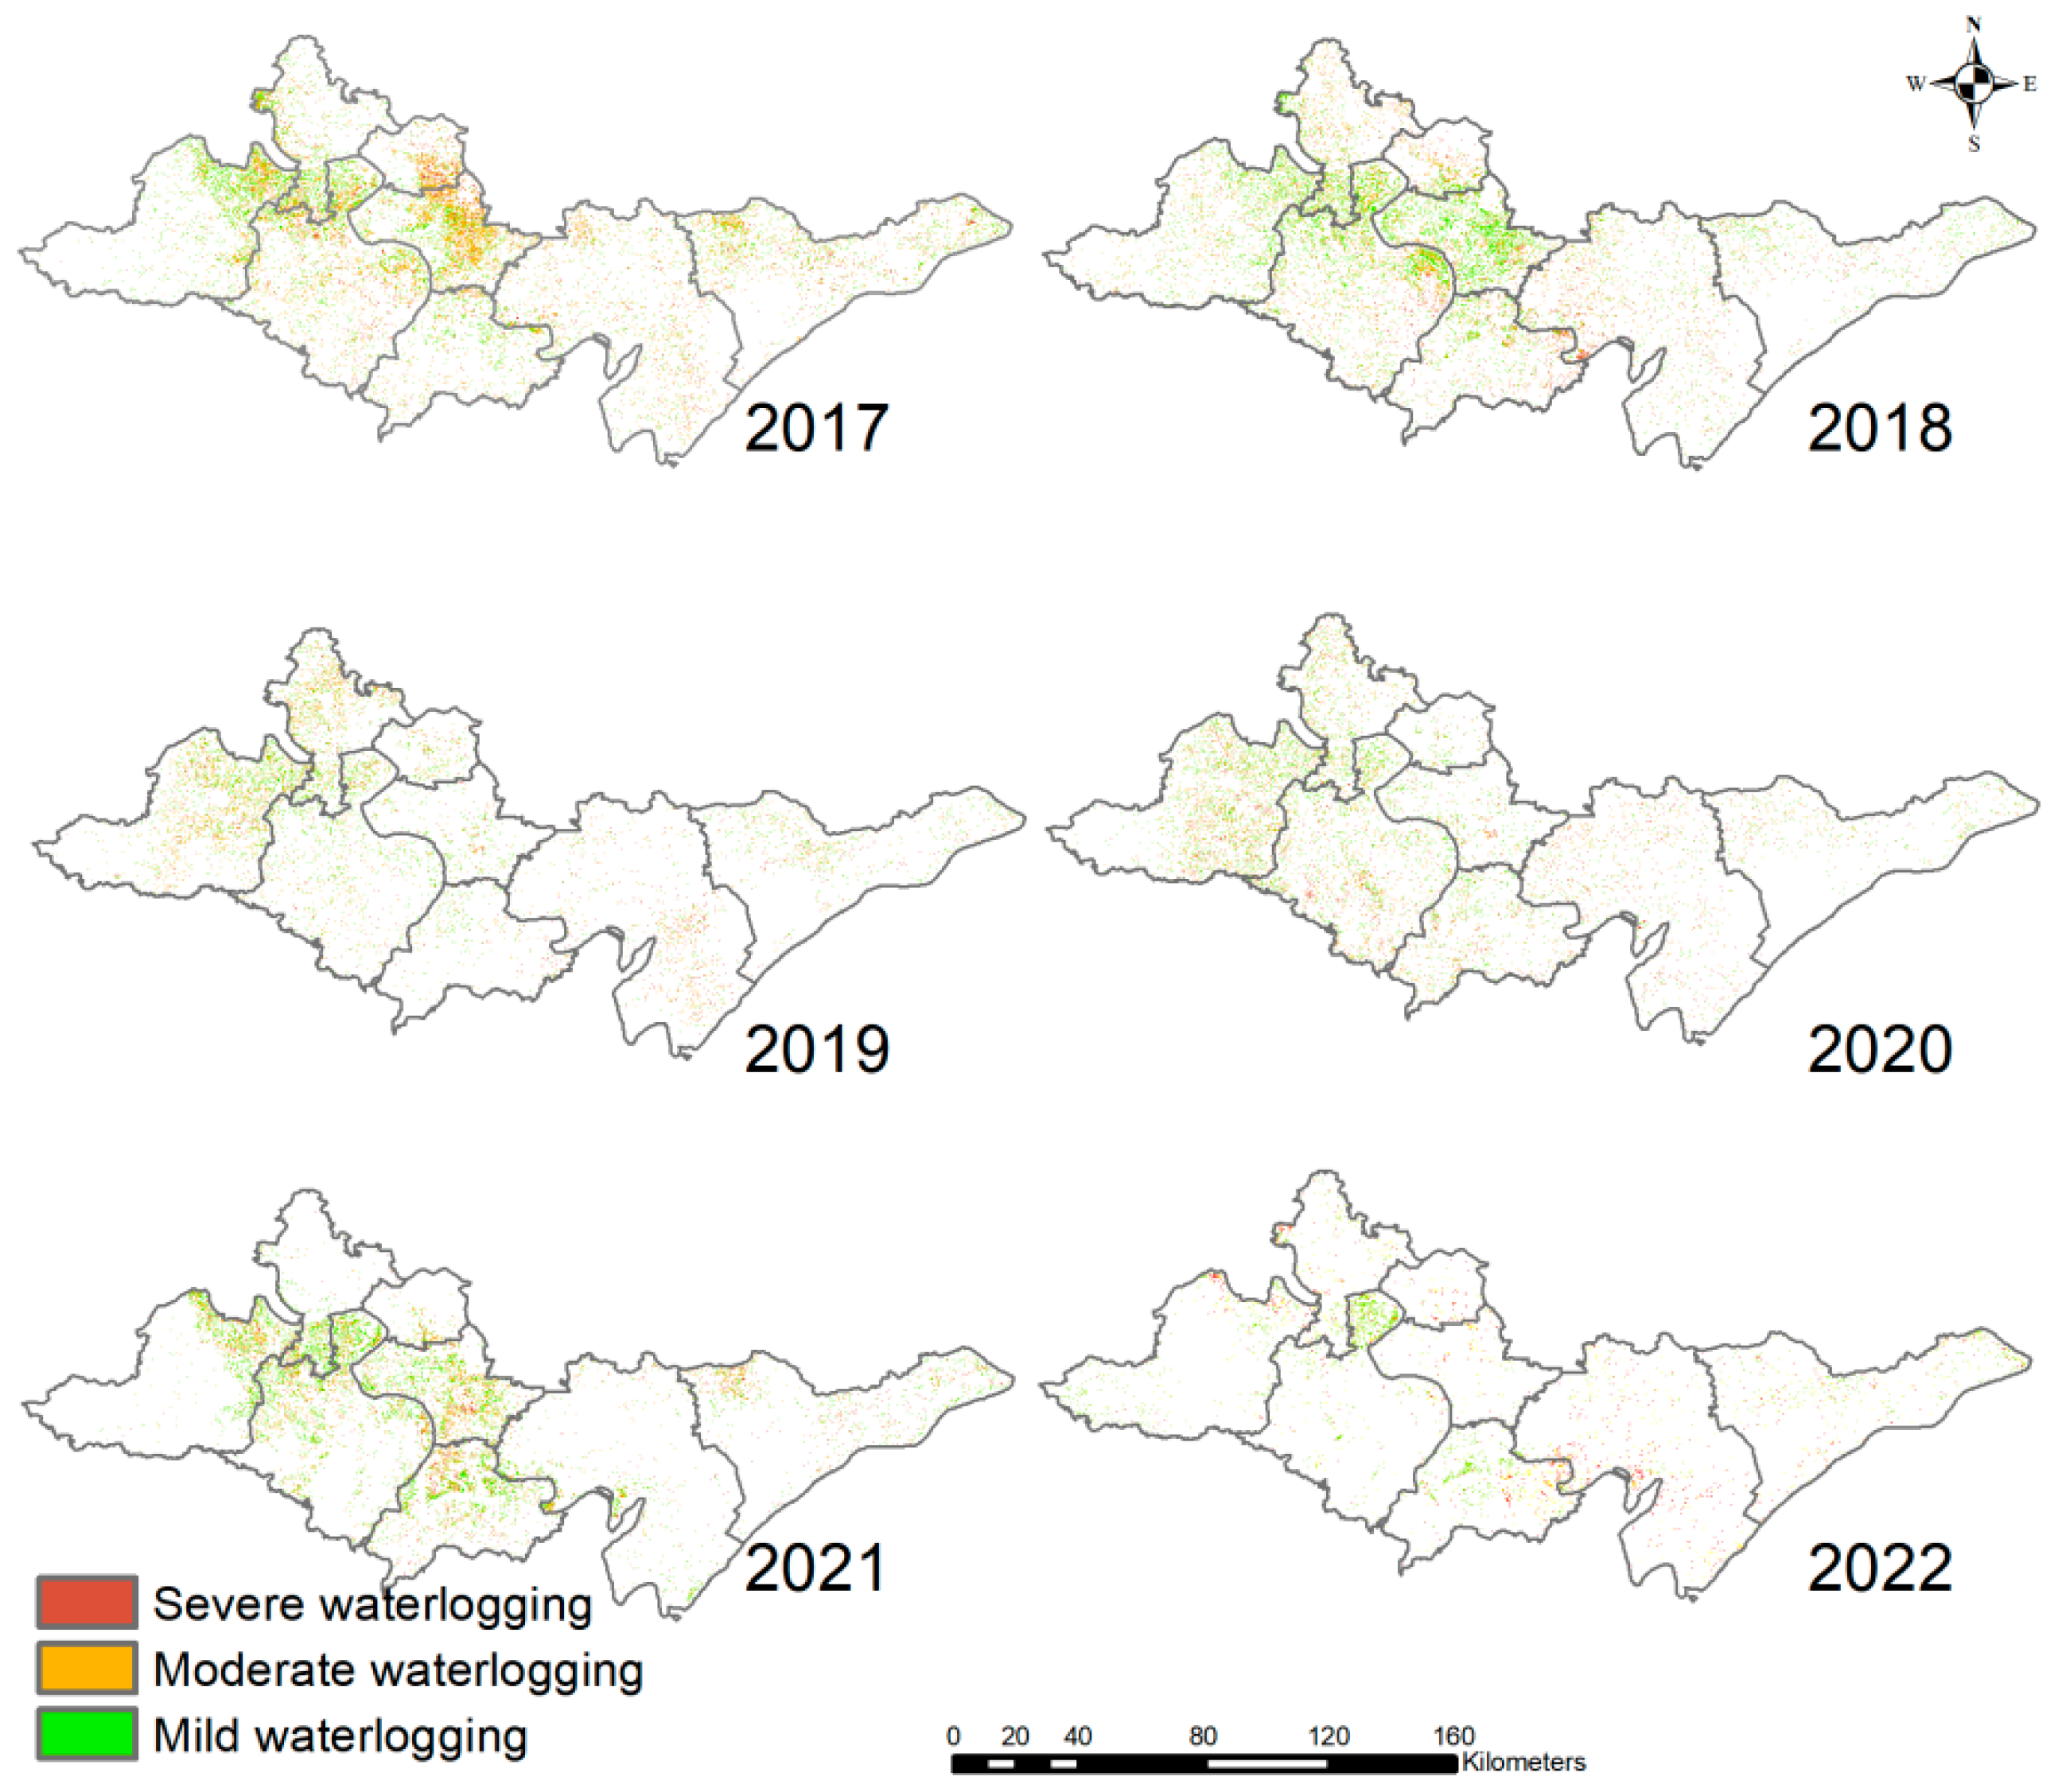
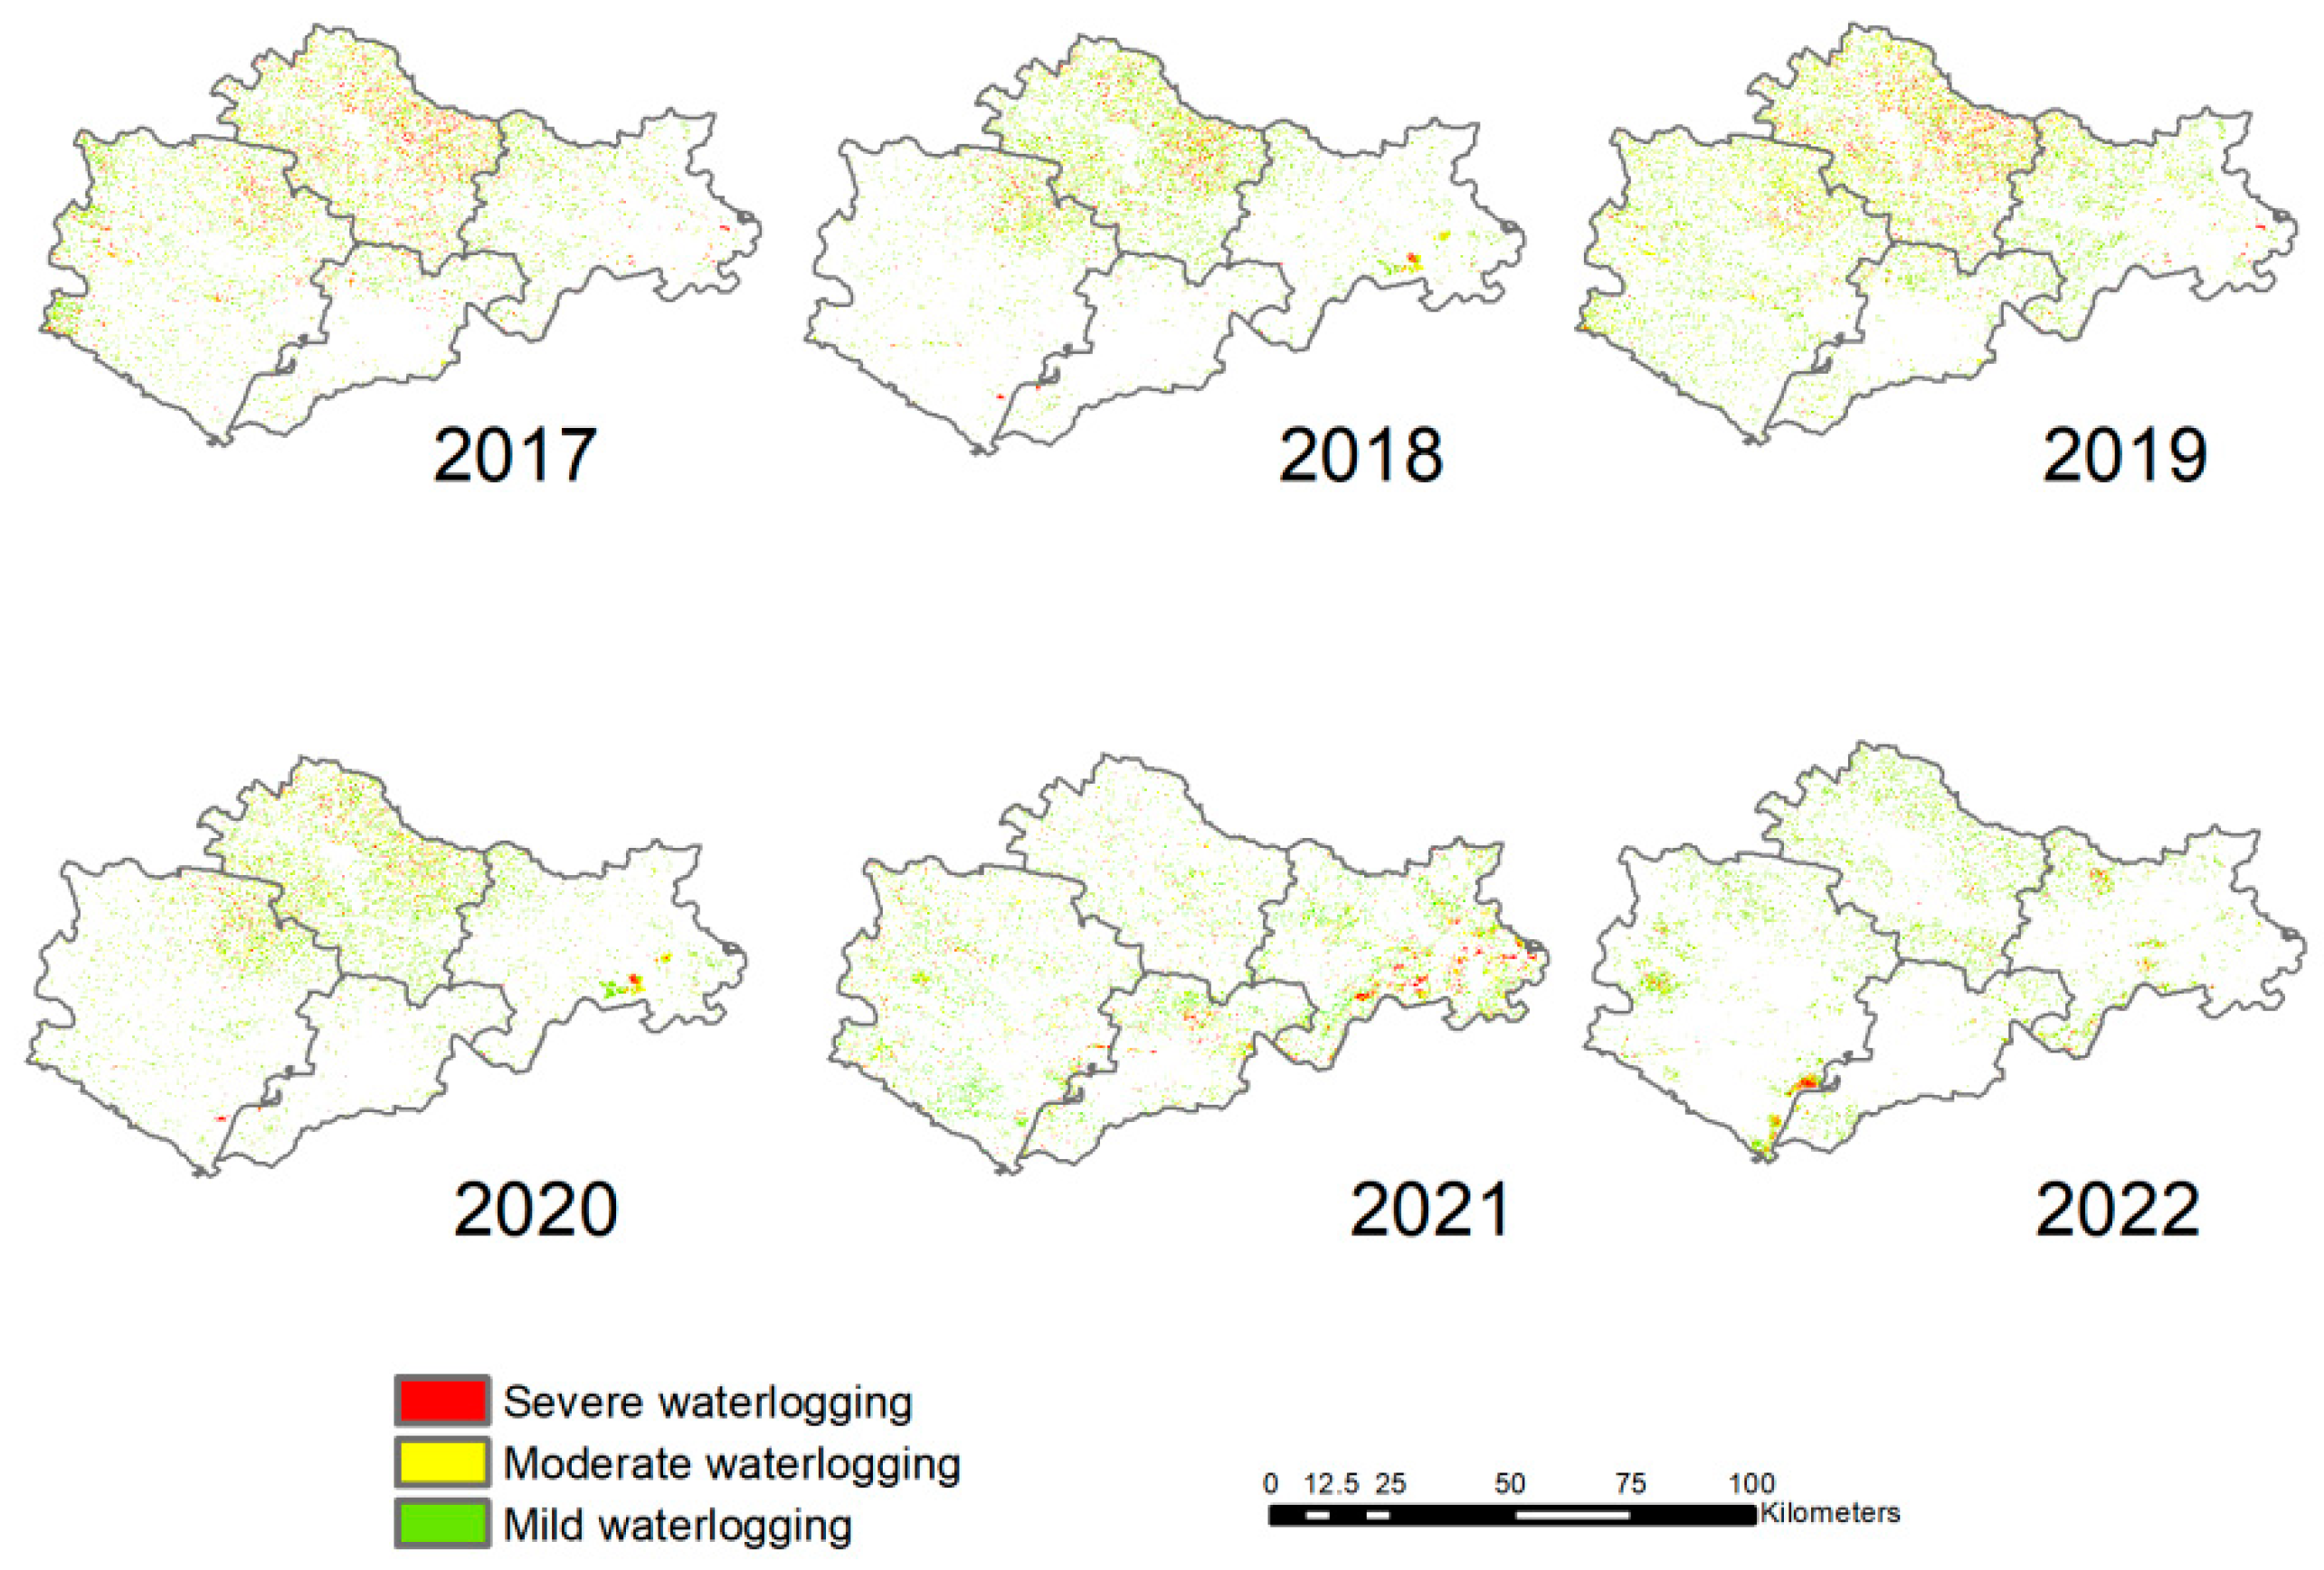
4.1. Winter Wheat Waterlogging Disaster Risk Monitoring

The winter wheat waterlogging disaster risk in Bengbu and Jingzhou from 2017 to 2022 was evaluated using the waterlogging disaster monitoring framework proposed in this paper. In Section 2.3, it is mentioned that to ensure consistency and to facilitate data integration, all data were resampled to a common spatial resolution of 10 m. So, the spatial resolution of the resultant maps was 10 m. This resolution aligns with the high-resolution input data used in this study, ensuring a detailed and accurate representation of waterlogging disaster risks across the study areas. The waterlogging disaster risk map of Jingzhou is shown in Figure 4. It illustrates the annual variations in waterlogging disaster risk in Jingzhou from 2017 to 2022, depicting the spatial distribution of different waterlogging levels using different colors. Starting from the top left corner in 2017, the red areas in the map represent regions experiencing severe waterlogging; orange indicates moderate waterlogging, green represents mild waterlogging, and white shows areas unaffected by waterlogging. In the consecutive years depicted, it can be observed that the red and orange areas, indicating more severe waterlogging, gradually diminish each year, especially in densely populated or intensively utilized land areas. The green areas occupy a large area in each annual map, indicating that mild waterlogging is the most common risk type, but its distribution is becoming more dispersed, reflecting the improvement in disaster prevention capabilities in local areas. Compared with the earlier years, the range of areas unaffected by disasters expanded in 2022, indicating an increase in the areas unaffected by waterlogging, attributed to improvements in flood control measures. As time progresses, the images display subtle changes in the distribution of waterlogging disaster risk in Jingzhou, which are influenced by various factors, including annual fluctuations in climate patterns, improvements in hydraulic infrastructure, and the implementation of regional water and soil conservation and land management policies. The reduction in areas with severe and moderate waterlogging implies that improved disaster prevention strategies have been effective, while the widespread distribution of areas with mild waterlogging emphasizes the importance of continuous monitoring and disaster response preparedness. Overall, these images provide valuable information for understanding the waterlogging disasters in Jingzhou and providing visual decision support for disaster prevention and mitigation in local communities.
It can be observed from Table 2 that the proportion of areas unaffected by waterlogging fluctuated slightly over the six-year period, showing a slight upward trend overall. The proportion of areas unaffected by waterlogging increased gradually from 31.2% to 37.2%, indicating a yearly increase in the proportion of areas unaffected by waterlogging. As for areas with mild waterlogging, their proportion fluctuated between years, but the proportion in 2022 decreased compared with 2017, with the proportion of areas with mild waterlogging decreasing slightly from 30% to 28.7%, indicating a decrease in the proportion of areas with mild waterlogging. The proportion of areas with moderate waterlogging showed a downward trend from 2017 to 2020, reaching its lowest point in 2020, followed by a slight rebound in 2021 and 2022, reflecting changes in the frequency of moderate waterlogging or the effectiveness of disaster prevention and mitigation measures. The proportion of areas with severe waterlogging showed little change over these years, remaining relatively stable in the range of 13.2% to 12.6%.
The risk map of waterlogging disasters in Bengbu is shown in Figure 5. From the distribution of affected areas, most of the waterlogged areas are of mild severity, with a few areas of moderate and severe waterlogging. The map shows the changes in waterlogging disasters in Bengbu over six years. By observing the color changes, we can visually see the expansion or contraction of areas affected by different degrees of waterlogging.
It can be seen that the data on the proportion of waterlogging disaster areas in Bengbu from 2017 to 2022 show a certain trend in Table 3. The proportion of areas without waterlogging increased from 30.9% in 2017 to 41.8% in 2020. Although it declined slightly afterward, it still remained at 40.1% in 2022. This indicates that Bengbu has made positive progress in reducing waterlogged areas.
The proportion of mildly affected areas showed an overall decreasing trend, dropping from 34.2% in 2017 to 27.6% in 2022, indicating improvement in mildly affected areas. The proportions of moderately and severely affected areas also showed a decreasing trend, especially the severely affected areas, which experienced fluctuations before eventually decreasing to 14.2% in 2022.
These changes were influenced by various factors such as climate change, improvements in local water conservancy projects, and government disaster prevention and mitigation measures. Overall, the data reflect that Bengbu has made progress in mitigating waterlogging disasters in recent years. If effective management and prevention strategies continue to be implemented, further improvements in waterlogging conditions are expected in the future.

4.2. Assessment of Waterlogging Monitoring Results

Winter wheat yield reduction data from 2017 to 2022 for each district and county under the jurisdiction of Bengbu and Jingzhou were obtained from the statistical yearbook. Waterlogging disasters mainly concentrate in relatively low-lying areas and watersheds. Most townships have relatively low yield reduction rates, with slightly higher rates in townships located in low-lying areas near rivers. Jingzhou includes eight administrative units, as shown in Figure 6a.
To eliminate the influence of changes in planting area on yield and to make the yield data between different counties and cities comparable, the relationship between agricultural waterlogging monitoring results and winter wheat yield using unit yield reduction rates was analyzed. The correlation between the percentage of waterlogging disaster areas and yield reduction rate in each township from 2017 to 2022 was calculated, as shown in Figure 6b. Correlation coefficients (R) were used to measure the correlation between the rate of yield reduction and the affected area. The results indicate that there is a highly significant positive correlation between the percentage of waterlogging disaster areas and the winter wheat yield reduction rate (R = 0.75). Overall, winter wheat yield reduction rates based on statistical data show good consistency with the proportion of affected farmland assessed based on internal waterlogging identification criteria. However, the yield reduction rates in some townships do not increase with the increase in the affected area. This is mainly because grain yield reduction is caused by multiple factors. In addition to waterlogging disasters, strong winds and hailstorms during agricultural meteorological disasters also cause grain yield reduction. According to the disaster records of agricultural meteorological stations, from 2017 to 2018, during the growing season, Gong’an County and Jiangling County were affected by pests, diseases, and strong winds, while from 2019 to 2020, during the growing season, Jianli City and Honghu City’s winter wheat yield reduction was caused by drought. This indicates that not all yield reductions are caused by waterlogging disasters. In summary, there is a significant correlation between the proportion of Waterlogging disaster risk areas and the winter wheat yield reduction rate, which can serve as an important indicator of winter wheat yield reduction due to waterlogging disasters.
Bengbu includes four districts and counties: Huaiyuan County, Guzhen County, Wuhe County, and Bengbu Urban District, as shown in Figure 7a. Waterlogging disaster areas mainly concentrate in relatively low-lying areas and watersheds. Most township yield reduction rates are low, with slightly higher rates in townships located in low-lying areas near rivers. In the process of agricultural waterlogging monitoring, the correlation between waterlogging monitoring results and crop yield is a key link in evaluating the effectiveness of waterlogging index monitoring.
Winter wheat yield data from 2017 to 2022 for four districts and counties were collected. Further analysis was conducted on the relationship between waterlogging monitoring results and winter wheat yield reduction rates. From Figure 7b, it can be observed that the percentage of disaster-prone areas in each district and county is highly positively correlated with the reduction rate of winter wheat yield (R = 0.78). Overall, there is good consistency between winter wheat yield reduction rates based on statistical data and the proportion of disaster-stricken farmland assessed based on waterlogging disaster index.

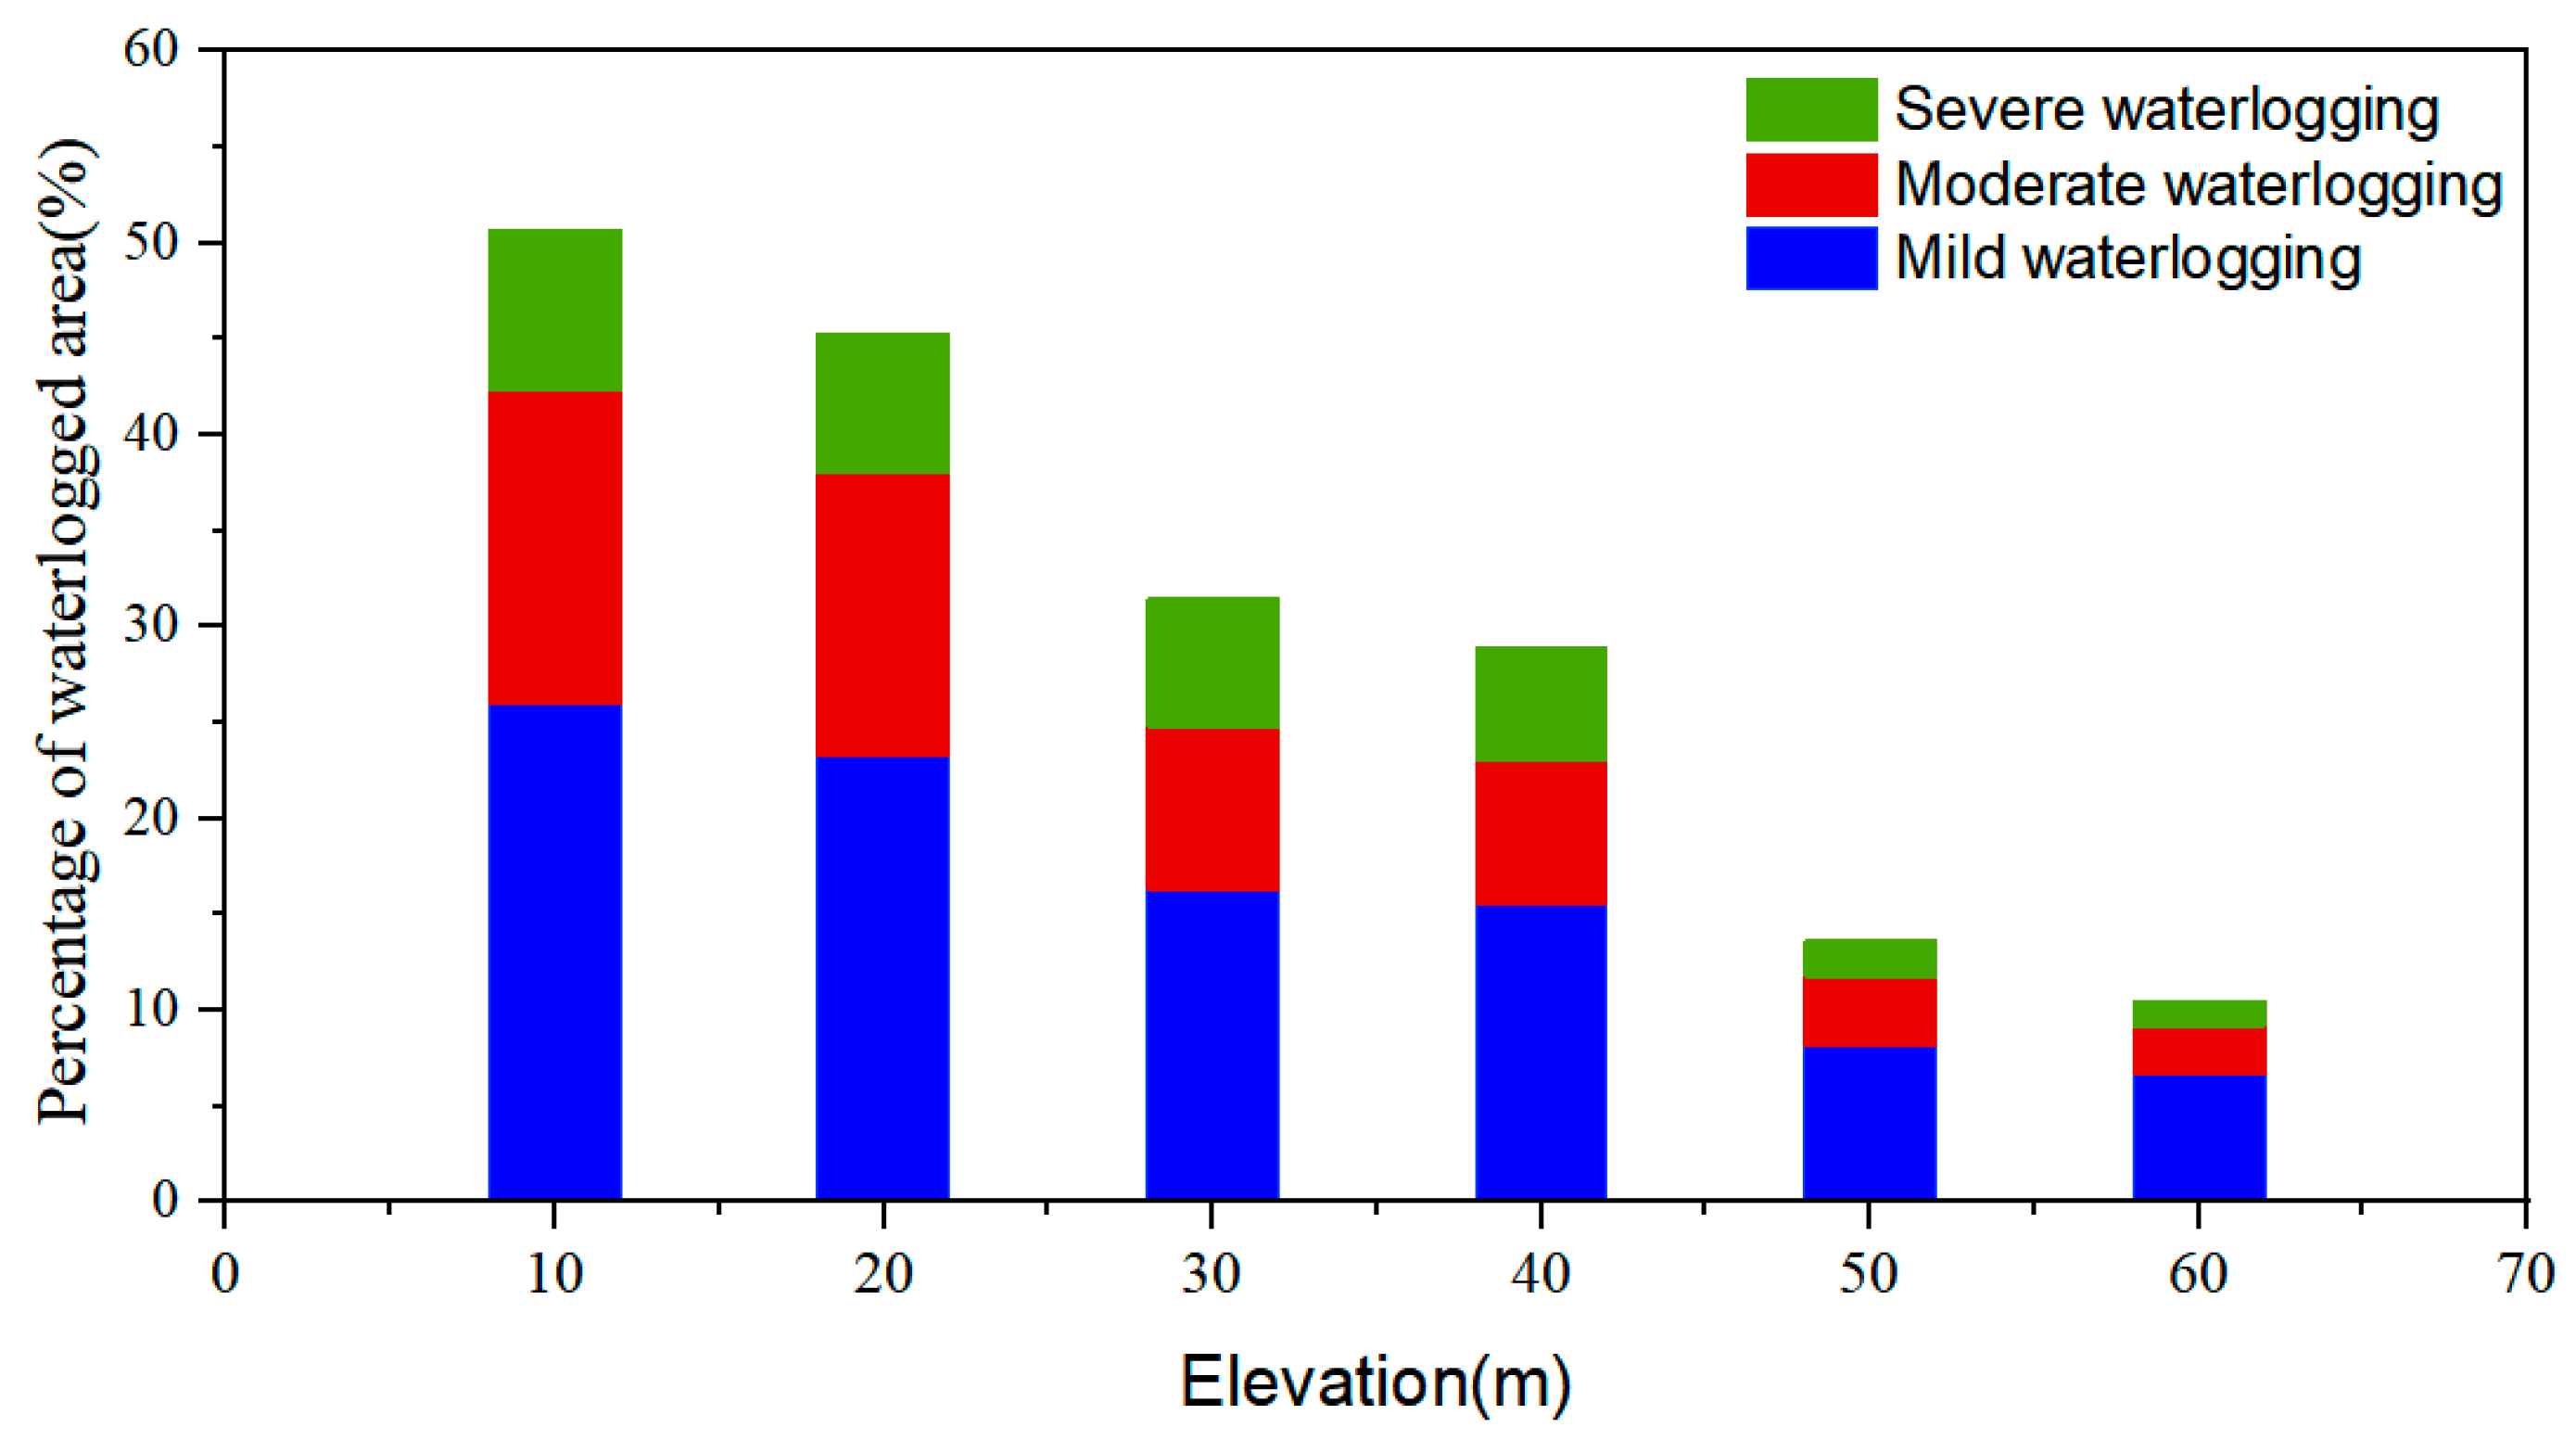
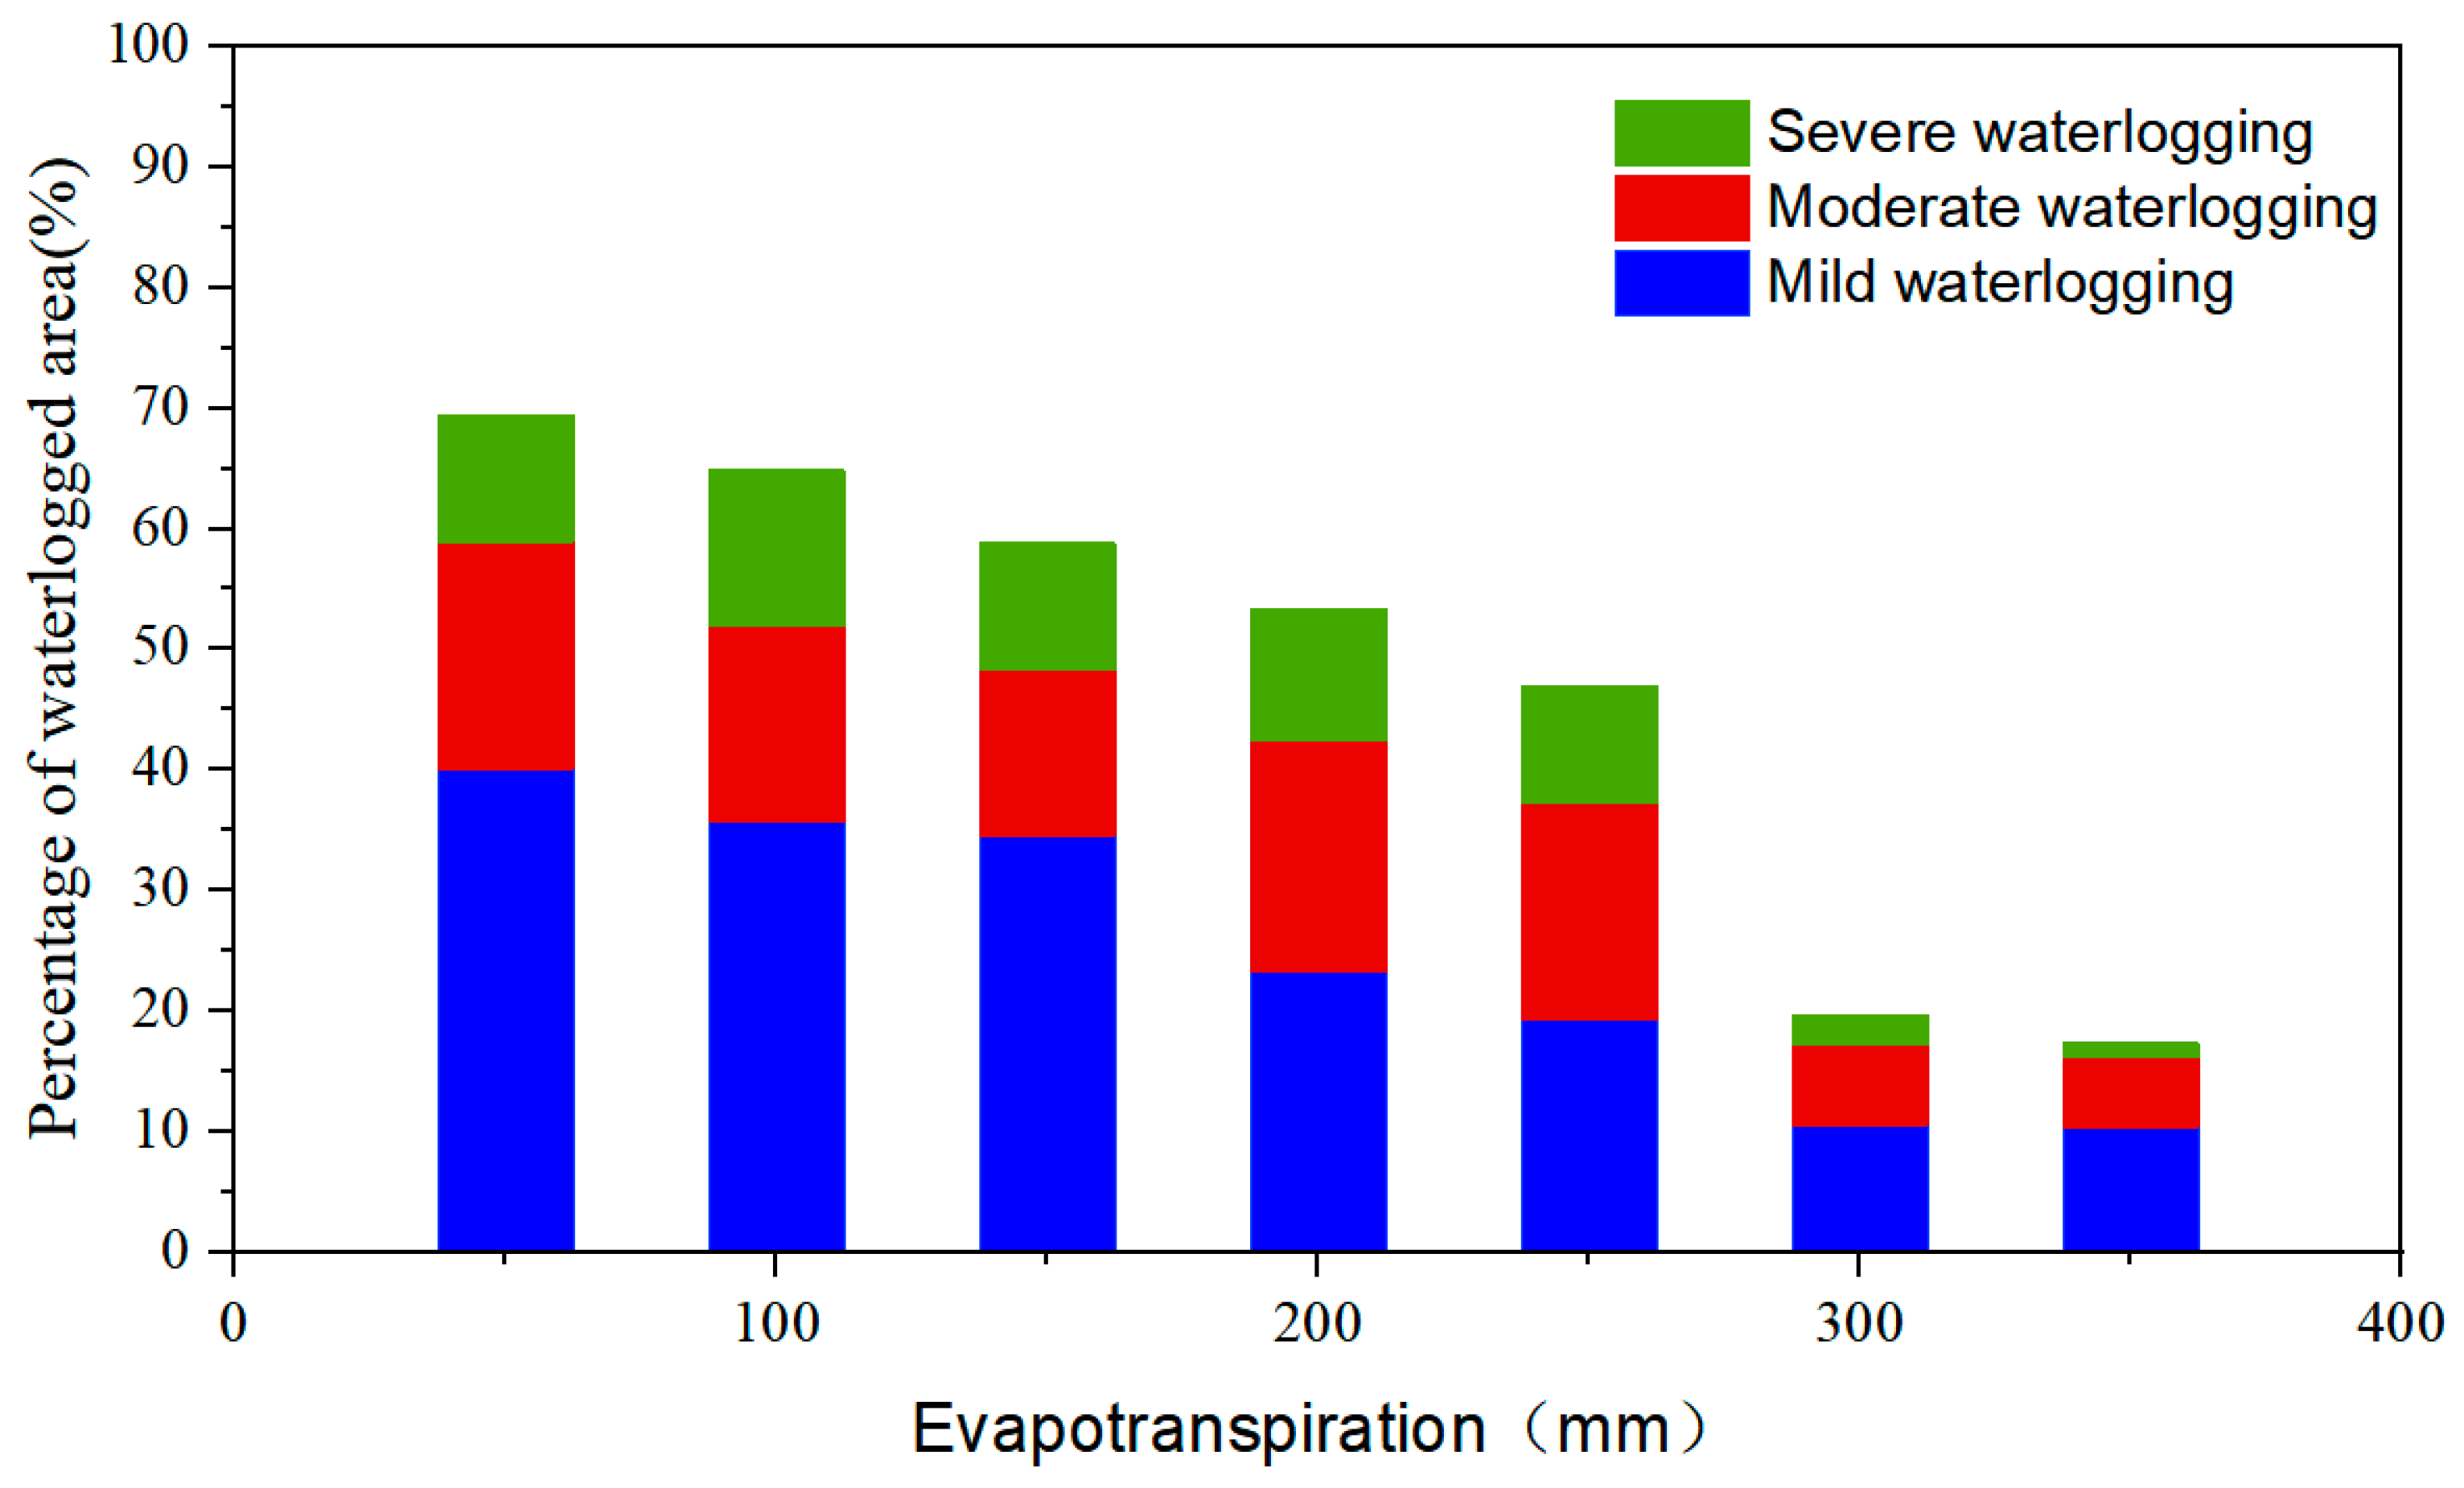
4.3. Analysis of the Spatiotemporal Variation Characteristics of Waterlogging Disasters

The occurrence of waterlogging disasters is caused by multiple factors. This section investigates the relationship between the scope of waterlogging disasters and these factors and analyzes the spatiotemporal distribution characteristics of waterlogging areas in the study area.
The occurrence of waterlogging disasters is not only closely related to climate factors such as precipitation and evapotranspiration but is also closely linked to topographical conditions. This section first studies the spatiotemporal distribution of waterlogging disasters in relation to topography, showing how topographical factors influence the occurrence and distribution of waterlogging disasters.
This study used NASA’s SRTM data to analyze the relationship between waterlogging disasters and terrain elevation. By combining SRTM elevation data with the waterlogging disaster monitoring data obtained in this paper, the distribution characteristics of waterlogging disasters in different elevation ranges were analyzed.
As shown in Figure 8, in lower elevation ranges, the area affected by waterlogging disasters significantly increases, indicating that low-lying areas are more prone to waterlogging disasters. This is due to their weaker water drainage capacity, leading to water accumulation. Conversely, in higher elevation ranges, the affected area significantly decreases, indicating that areas with higher terrain are less likely to experience waterlogging disasters due to better water drainage conditions.
However, in the elevation range of 30 m to 40 m, the decreasing trend of the affected area by waterlogging disasters slows down. This is related to specific terrain features (such as slope and soil type) or human factors (such as the construction of drainage systems), which influence the occurrence and distribution of waterlogging disasters.
Next, data from the Global Precipitation Measurement (GPM) project were utilized to analyze the relationship between waterlogging disasters and precipitation. GPM is an international cooperation project that provides high temporal and spatial resolution precipitation data through satellite observations, covering almost all regions globally. This study collected and analyzed precipitation data provided by GPM from 2017 to 2022, analyzing the relationship between annual precipitation and the spatiotemporal distribution of waterlogging disasters.
As shown in Figure 9, it can be observed that with the increase in precipitation, the area affected by waterlogging disasters shows an overall increasing trend. Especially in the range where annual precipitation exceeds 1000 mm, the increase in the affected area is particularly significant, indicating a close correlation between high precipitation events and severe waterlogging disaster occurrences. However, in lower precipitation ranges, although there is an increase in the affected area, the magnitude of the increase is smaller, suggesting that light to moderate precipitation events have a relatively minor impact on the affected area by waterlogging disasters. Furthermore, through detailed analysis of the bar chart, it was also observed that high precipitation does not lead to the expected extensive waterlogging disasters, which are attributed to factors such as terrain, soil type, and drainage systems mitigating the impact of precipitation on specific areas.
Overall, the results in Figure 9 emphasize the positive correlation between precipitation and the area affected by waterlogging disasters, especially in cases of high precipitation where the risk of waterlogging disasters significantly increases. This finding is crucial for understanding the extent of the impact of different precipitation levels on waterlogging disasters and provides data support for the formulation of effective disaster prevention and mitigation measures. In future disaster prevention efforts, attention should be focused on improving high precipitation warnings and the drainage capacity of relevant areas to mitigate the losses caused by waterlogging disasters.
Evapotranspiration is a crucial process through which water enters the atmosphere from the land surface. It has a profound impact on surface water circulation and the occurrence and development of waterlogging disasters. In agricultural production, especially in winter wheat planting areas, the evapotranspiration process is not only closely related to crop growth conditions but also directly affects soil moisture and surface water accumulation. Therefore, this paper further investigates the relationship between the spatiotemporal distribution of waterlogging disasters and the evapotranspiration process.
MODIS (Moderate Resolution Imaging Spectroradiometer) satellite sensor data, specifically MOD16A2/A3 evapotranspiration data, were utilized to analyze the relationship between waterlogging disasters and surface evapotranspiration processes. MODIS data, owing to their high temporal resolution and global coverage capability, provide accurate estimates of evapotranspiration, which are crucial for understanding the occurrence patterns of waterlogging disaster events under different geographical and climatic conditions.
By integrating MODIS annual evapotranspiration data with the waterlogging disaster occurrence monitored, it is possible to thoroughly investigate how the evapotranspiration process affects the intensity of waterlogging disaster occurrences. By analyzing evapotranspiration data from 2017 to 2022 and combining them with the waterlogging disaster monitoring results, statistical methods were applied to assess the spatiotemporal impact of evapotranspiration on waterlogging disaster occurrences. Preliminary analysis results, as shown in Figure 10, reveal a clear trend: in regions with lower evapotranspiration rates, the area affected by waterlogging disasters significantly increases. This indicates that when the evapotranspiration efficiency is low, moisture on the land surface and in the soil is less effectively evaporated, thus increasing the risk of surface water accumulation and waterlogging disasters. Conversely, in regions with higher evapotranspiration rates, the area affected by waterlogging disasters decreases, reflecting that stronger evapotranspiration processes facilitate soil moisture evaporation, thereby reducing the risk of waterlogging disasters.
It is noteworthy that in the mid-to-low evapotranspiration rate ranges, the affected area also decreases, but the extent of reduction is not as significant as in the high evapotranspiration rate ranges. This is because there is a certain threshold effect of evapotranspiration processes in mitigating waterlogging disaster risks, whereby the contribution to reducing waterlogging disaster risks becomes more evident once the evapotranspiration rate reaches a certain level.
Through the analysis of the relationship between evapotranspiration and the area affected by waterlogging disasters, further validation of the critical role of the evapotranspiration process in regulating surface water balance and mitigating the impact of waterlogging disasters was achieved. This finding is of great significance for understanding the impact of evapotranspiration on waterlogging disaster risks and provides important references for water resources management and waterlogging disaster prevention and control strategies.

5. Discussion

5.1. Limitations and Uncertainties in Model

Despite the comprehensive framework and methodologies employed in this study, several limitations and uncertainties should be acknowledged.
The model uses a constant bulk density for soil across different field sites and soil depths. This assumption can introduce inaccuracies in the simulation of soil moisture and water retention. Variations in bulk density can affect the porosity and hydraulic conductivity of the soil, leading to potential errors in estimating soil moisture content and waterlogging risks.
A uniform total bulk density was assumed throughout the study area. Total bulk density influences the soil’s capacity to store and transmit water. Variations due to differences in soil compaction, organic matter content, and soil texture were not accounted for, which may have resulted in misestimations of soil moisture dynamics and the extent of waterlogging.
While the HYDRUS-1 and APSIM models were calibrated using available field data, the accuracy of the calibration is dependent on the quality and representativeness of the data. Limited or biased calibration data can affect the model’s performance. Validation was performed using independent data sets; however, uncertainties remain due to potential discrepancies between the modeled and observed conditions. These discrepancies can arise from measurement errors, spatial variability in soil properties, and temporal changes in environmental conditions.
The accuracy of remote sensing data (e.g., soil moisture from Sentinel-1) is subject to sensor limitations, atmospheric conditions, and preprocessing algorithms. Any errors in remote sensing data can propagate through the model, affecting the final outputs. The temporal resolution of remote sensing data may not fully capture short-term variations in soil moisture, which can be critical for understanding the dynamics of waterlogging events.
The potential impact of climate change on waterlogging risks was not explicitly addressed in the model. Changes in precipitation patterns, temperature, and extreme weather events can alter soil moisture regimes and exacerbate waterlogging conditions. The model does not fully account for the influence of topographical variations and land use changes on water movement and accumulation. These factors can significantly impact the spatial distribution of waterlogging.
Simplifications in representing complex hydrological processes, such as runoff, infiltration, and subsurface flow, can introduce uncertainties. The assumptions made to simplify these processes may not hold true under all conditions, leading to potential biases in the results.

5.2. Impact of Climate Change

Climate change can significantly alter precipitation patterns, increase the frequency and intensity of extreme weather events, and affect temperature regimes, all of which can exacerbate waterlogging conditions. Changes in precipitation patterns can lead to more frequent and severe waterlogging events, especially in regions already prone to heavy rainfall. Higher temperatures can increase evapotranspiration rates, potentially reducing soil moisture but also altering crop water requirements and stress responses. Extreme weather events, such as intense storms and flooding, can overwhelm existing drainage systems and increase the risk of prolonged waterlogging. Future assessments should consider these factors by incorporating climate change projections into the models to better understand and mitigate the potential impacts of climate change on waterlogging risks and agricultural productivity.

5.3. Comparative Analysis of Models

In this study, we mentioned several models used for assessing waterlogging risks and crop growth, including DRAINMOD, SWAGMAN Destiny, and CERES-Wheat. The DRAINMOD model is primarily used to simulate the effects of drainage and water management practices on soil water content and crop yield. Its strength lies in the detailed simulation of water table dynamics and drainage systems. However, it focuses mainly on drainage and may not fully capture the complexities of crop growth under varying waterlogging conditions.
The SWAGMAN Destiny model is designed to manage waterlogging and salinity in irrigated agricultural systems. It integrates water and salinity management, providing comprehensive solutions for areas prone to both issues. Nonetheless, its primary focus on salinity management may reduce its effectiveness in regions where salinity is not a significant issue.
The CERES-Wheat model simulates the growth and development of wheat, incorporating the effects of environmental factors and management practices. While it offers a detailed representation of wheat physiology and response to water stress, it may not fully integrate soil moisture dynamics as comprehensively as models specifically designed for waterlogging assessment.
The APSIM model, on the other hand, provides several advantages over these models. It effectively integrates soil moisture dynamics with crop growth processes, offering a comprehensive tool for assessing waterlogging impacts on crop yield. APSIM’s flexibility allows for customization to fit specific conditions and crops, making it versatile for different agricultural systems and regions. Additionally, the model incorporates detailed physiological processes, enabling the accurate simulation of crop responses to varying environmental conditions, including waterlogging. APSIM is scalable from field to regional levels, making it suitable for both detailed local studies and broader landscape assessments. Moreover, APSIM has been extensively validated and widely used in agricultural research, demonstrating its reliability and accuracy in simulating complex agricultural systems. By using the APSIM model, this study benefits from its comprehensive integration of soil and crop processes, flexibility, and proven accuracy, providing a robust framework for assessing waterlogging risks and their impacts on crop production.

5.4. Factors Contributing to Disparities

Several factors contribute to the observed disparities in waterlogging risks across different regions. Understanding these factors provides valuable context to our findings and helps in devising more effective water management strategies. Variations in topography significantly influence waterlogging risks. Low-lying areas and regions with poor drainage are more prone to water accumulation, leading to higher waterlogging risks. In contrast, elevated areas with better natural drainage are less likely to experience prolonged water saturation. For instance, the lower elevation ranges in our study areas showed a higher incidence of waterlogging disasters due to their limited drainage capacity.
Soil composition plays a crucial role in determining water retention and infiltration rates. Soils with high clay content tend to retain more water and have lower infiltration rates, making them more susceptible to waterlogging. Conversely, sandy soils, with their higher infiltration rates and lower water retention capacity, are less prone to waterlogging. In our study areas, regions with predominantly clayey soils experienced more severe waterlogging compared with those with sandy or loamy soils.
Agricultural practices, urban development, and land management strategies also impact waterlogging risks. Areas with intensive agricultural activities, especially those employing irrigation, may face higher waterlogging risks due to increased soil moisture levels. Urbanization often leads to increased impervious surfaces, reducing natural infiltration and increasing runoff, which can exacerbate waterlogging. Effective land use planning and the implementation of sustainable agricultural practices can mitigate these risks.
Variability in precipitation patterns and extreme weather events contribute to waterlogging disparities. Regions experiencing higher rainfall or more frequent extreme weather events are more likely to face waterlogging issues. Additionally, changes in climate patterns, such as increased precipitation due to climate change, can alter the waterlogging dynamics in these regions.
The presence and effectiveness of natural and artificial drainage systems influence the extent of waterlogging. Areas with well-maintained drainage infrastructure can manage excess water more effectively, reducing the risk of waterlogging. Conversely, regions with inadequate drainage systems are more vulnerable to prolonged water saturation.
Vegetation plays a role in water absorption and soil stabilization. Areas with dense vegetation cover can absorb more water, reducing runoff and the risk of waterlogging. In contrast, regions with sparse vegetation or degraded land cover may experience higher runoff and increased waterlogging risks. By analyzing these factors in detail, we can better understand the spatial variability in waterlogging risks and develop targeted strategies to mitigate these risks. Future research should continue to explore these factors and their interactions to enhance our ability to predict and manage waterlogging in agricultural and urban landscapes.

6. Conclusions

The waterlogging disaster monitoring index proposed based on the APSIM model is scientifically rigorous, effectively quantifying the degree of waterlogging of winter wheat and considering differences in waterlogging tolerance during different growth stages of winter wheat. The waterlogging disaster monitoring framework established using this index successfully assessed the waterlogging disaster levels in Jingzhou and Bengbu. The results show that the areas where winter wheat is affected by waterlogging disasters in Jingzhou and Bengbu are mainly characterized by moderate to low levels of waterlogging. There is a strong correlation between the proportion of waterlogging disaster-affected areas in Bengbu and Jingzhou and the officially reported crop yield reduction rates. Finally, the spatiotemporal distribution of waterlogging disasters and their relationship with climate, terrain, and other factors were analyzed. This study provides a reliable method and means for fine-scale risk assessment of crop waterlogging disasters, laying a solid foundation for future research in related fields.

Author Contributions

Conceptualization, B.P.; methodology, J.Z.; resources, Y.Z., S.G., J.C. and Q.X.; validation, W.S. All authors have read and agreed to the published version of the manuscript.

Funding

This research was funded by a demonstration project of comprehensive government management and large-scale industrial application of the major special project of CHEOS, grant number 89-Y50G31-9001-22/23-05.

Data Availability Statement

The raw data supporting the conclusions of this article will be made available by the authors on request.

Acknowledgments

We express our sincere gratitude to the scientists of Sentinel data and other data used in this study.

Conflicts of Interest

The authors declare no conflict of interest.

References

  1. Muhammad, A.A. Waterlogging stress in plants: A review. Afr. J. Agric. Res. 2012, 7, 1976–1981. [Google Scholar]
  2. Irfan, M.; Hayat, S.; Hayat, Q.; Afroz, S.; Ahmad, A. Physiological and biochemical changes in plants under waterlogging. Protoplasma 2010, 241, 3–17. [Google Scholar] [CrossRef] [PubMed]
  3. Collaku, A.; Harrison, S. Losses in wheat due to waterlogging. Crop Sci. 2002, 42, 444–450. [Google Scholar] [CrossRef]
  4. Pan, J.; Sharif, R.; Xu, X.; Chen, X. Mechanisms of waterlogging tolerance in plants: Research progress and prospects. Front. Plant Sci. 2021, 11, 627331. [Google Scholar] [CrossRef] [PubMed]
  5. Langan, P.; Bernád, V.; Walsh, J.; Henchy, J.; Khodaeiaminjan, M.; Mangina, E.; Negrão, S. Phenotyping for waterlogging tolerance in crops: Current trends and future prospects. J. Exp. Bot. 2022, 73, 5149–5169. [Google Scholar] [CrossRef] [PubMed]
  6. Pais, I.P.; Moreira, R.; Semedo, J.N.; Ramalho, J.C.; Lidon, F.C.; Coutinho, J.; Maçãs, B.; Scotti-Campos, P. Wheat crop under waterlogging: Potential soil and plant effects. Plants 2022, 12, 149. [Google Scholar] [CrossRef] [PubMed]
  7. Ploschuk, R.A.; Miralles, D.J.; Striker, G.G. A quantitative review of soybean responses to waterlogging: Agronomical, morpho-physiological and anatomical traits of tolerance. Plant Soil 2022, 475, 237–252. [Google Scholar] [CrossRef]
  8. Xu, Z.; Shen, Q.; Zhang, G. The mechanisms for the difference in waterlogging tolerance among sea barley, wheat and barley. Plant Growth Regul. 2022, 96, 431–441. [Google Scholar] [CrossRef]
  9. Huang, C.; Zhang, W.; Wang, H.; Gao, Y.; Ma, S.; Qin, A.; Liu, Z.; Zhao, B.; Ning, D.; Zheng, H. Effects of waterlogging at different stages on growth and ear quality of waxy maize. Agric. Water Manag. 2022, 266, 107603. [Google Scholar] [CrossRef]
  10. den Besten, N.; Steele-Dunne, S.; de Jeu, R.; van der Zaag, P. Towards monitoring waterlogging with remote sensing for sustainable irrigated agriculture. Remote Sens. 2021, 13, 2929. [Google Scholar] [CrossRef]
  11. Islam, M.R.; Abdullah, H.M.; Ahmed, Z.U.; Islam, I.; Ferdush, J.; Miah, M.G.; Miah, M.M.U. Monitoring the spatiotemporal dynamics of waterlogged area in southwestern Bangladesh using time series Landsat imagery. Remote Sens. Appl. Soc. Environ. 2018, 9, 52–59. [Google Scholar] [CrossRef]
  12. Yu, W.; Feng, L.; Sheng, S.; Shi, L.; Li, D. Analysis of the dynamics and characteristics of grain filling in summer maize under waterlogging stress. Chin. J. Eco-Agric. 2015, 23, 1142–1149. [Google Scholar]
  13. Zheng, W.; Liu, C.; Xin, Z.; Wang, Z. Flood and waterlogging monitoring over Huaihe River Basin by AMSR-E data analysis. Chin. Geogr. Sci. 2008, 18, 262–267. [Google Scholar] [CrossRef]
  14. Chowdary, V.; Chandran, R.V.; Neeti, N.; Bothale, R.; Srivastava, Y.; Ingle, P.; Ramakrishnan, D.; Dutta, D.; Jeyaram, A.; Sharma, J. Assessment of surface and sub-surface waterlogged areas in irrigation command areas of Bihar state using remote sensing and GIS. Agric. Water Manag. 2008, 95, 754–766. [Google Scholar] [CrossRef]
  15. Sahu, A.S.; Bengal, N.-W. Detection of water-logged areas using geoinformatics techniques and relationship study in Panskura-Tamluk flood plain (India). Trans. Inst. Indian Geogr. 2018, 40, 9–24. [Google Scholar]
  16. Singh, K.V.; Setia, R.; Sahoo, S.; Prasad, A.; Pateriya, B. Evaluation of NDWI and MNDWI for assessment of waterlogging by integrating digital elevation model and groundwater level. Geocarto Int. 2015, 30, 650–661. [Google Scholar] [CrossRef]
  17. Rashid, M.B. Monitoring of drainage system and waterlogging area in the human-induced Ganges-Brahmaputra tidal delta plain of Bangladesh using MNDWI index. Heliyon 2023, 9, e17412. [Google Scholar] [CrossRef] [PubMed]
  18. He, T.; Xiao, W.; Zhao, Y.; Deng, X.; Hu, Z. Identification of waterlogging in Eastern China induced by mining subsidence: A case study of Google Earth Engine time-series analysis applied to the Huainan coal field. Remote Sens. Environ. 2020, 242, 111742. [Google Scholar] [CrossRef]
  19. Fei, X.; LI, Y.-z.; Yun, D.; Feng, L.; Yi, Y.; Qi, F.; Xuan, B. Monitoring perennial sub-surface waterlogged croplands based on MODIS in Jianghan Plain, middle reaches of the Yangtze River. J. Integr. Agric. 2014, 13, 1791–1801. [Google Scholar]
  20. Arnous, M.O.; Green, D.R. Monitoring and assessing waterlogged and salt-affected areas in the Eastern Nile Delta region, Egypt, using remotely sensed multi-temporal data and GIS. J. Coast. Conserv. 2015, 19, 369–391. [Google Scholar] [CrossRef]
  21. French, C. Some thoughts on the monitoring and preservation of waterlogged archeological sites in eastern England. Wiley Interdiscip. Rev. Water 2017, 4, e1204. [Google Scholar] [CrossRef]
  22. Alam, R.; Quayyum, Z.; Moulds, S.; Radia, M.A.; Sara, H.H.; Hasan, M.T.; Butler, A. Dhaka city water logging hazards: Area identification and vulnerability assessment through GIS-remote sensing techniques. Environ. Monit. Assess. 2023, 195, 543. [Google Scholar] [CrossRef] [PubMed]
  23. Adegoye, G.A.; Olorunwa, O.J.; Alsajri, F.A.; Walne, C.H.; Wijewandana, C.; Kethireddy, S.R.; Reddy, K.N.; Reddy, K.R. Waterlogging effects on soybean physiology and hyperspectral reflectance during the reproductive stage. Agriculture 2023, 13, 844. [Google Scholar] [CrossRef]
  24. Loshakov, A.; Odintsov, S.; Kasmynina, M.; Melnik, M.; Gorbachev, S. Monitoring of flooded and waterlogged agricultural land of the Stavropol territory. Res. J. Pharm. Biol. Chem. Sci. 2018, 9, 1611–1617. [Google Scholar]
  25. Skaggs, R.W.; Youssef, M.; Chescheir, G. DRAINMOD: Model use, calibration, and validation. Trans. ASABE 2012, 55, 1509–1522. [Google Scholar] [CrossRef]
  26. Probert, M.; Dimes, J.; Keating, B.; Dalal, R.; Strong, W. APSIM’s water and nitrogen modules and simulation of the dynamics of water and nitrogen in fallow systems. Agric. Syst. 1998, 56, 1–28. [Google Scholar] [CrossRef]
  27. Godwin, D.; Humphreys, E.; Smith, D.; Timsina, J.; Xevi, E.; Meyer, W. Application of SWAGMANÒ Destiny to rice-wheat cropping systems. In Modelling Irrigated Cropping Systems, with Special Attention to Rice-Wheat Sequences Raised Bed Planting; CSIRO: Canberra, Australia, 2002; p. 69. [Google Scholar]
  28. Attia, A.; Rajan, N.; Xue, Q.; Nair, S.; Ibrahim, A.; Hays, D. Application of DSSAT-CERES-Wheat model to simulate winter wheat response to irrigation management in the Texas High Plains. Agric. Water Manag. 2016, 165, 50–60. [Google Scholar] [CrossRef]
  29. Torres, R.; Snoeij, P.; Geudtner, D.; Bibby, D.; Davidson, M.; Attema, E.; Potin, P.; Rommen, B.; Floury, N.; Brown, M. GMES Sentinel-1 mission. Remote Sens. Environ. 2012, 120, 9–24. [Google Scholar] [CrossRef]
  30. Phiri, D.; Simwanda, M.; Salekin, S.; Nyirenda, V.R.; Murayama, Y.; Ranagalage, M. Sentinel-2 data for land cover/use mapping: A review. Remote Sens. 2020, 12, 2291. [Google Scholar] [CrossRef]
  31. Muñoz-Sabater, J.; Dutra, E.; Agustí-Panareda, A.; Albergel, C.; Arduini, G.; Balsamo, G.; Boussetta, S.; Choulga, M.; Harrigan, S.; Hersbach, H. ERA5-Land: A state-of-the-art global reanalysis dataset for land applications. Earth Syst. Sci. Data 2021, 13, 4349–4383. [Google Scholar] [CrossRef]
  32. Mu, Q.; Zhao, M.; Running, S.W. MODIS global terrestrial evapotranspiration (ET) product (NASA MOD16A2/A3). Algorithm Theor. Basis Doc. Collect. 2013, 5, 600. [Google Scholar]
  33. Reuter, H.I.; Nelson, A.; Jarvis, A. An evaluation of void-filling interpolation methods for SRTM data. Int. J. Geogr. Inf. Sci. 2007, 21, 983–1008. [Google Scholar] [CrossRef]
  34. Gong, L.; Halldin, S.; Xu, C.Y. Global-scale river routing—An efficient time-delay algorithm based on HydroSHEDS high-resolution hydrography. Hydrol. Process. 2011, 25, 1114–1128. [Google Scholar] [CrossRef]
  35. Kivi, M.S.; Blakely, B.; Masters, M.; Bernacchi, C.J.; Miguez, F.E.; Dokoohaki, H. Development of a data-assimilation system to forecast agricultural systems: A case study of constraining soil water and soil nitrogen dynamics in the APSIM model. Sci. Total Environ. 2022, 820, 153192. [Google Scholar] [CrossRef] [PubMed]
  36. Keating, B.A.; Carberry, P.S.; Hammer, G.L.; Probert, M.E.; Robertson, M.J.; Holzworth, D.; Huth, N.I.; Hargreaves, J.N.; Meinke, H.; Hochman, Z. An overview of APSIM, a model designed for farming systems simulation. Eur. J. Agron. 2003, 18, 267–288. [Google Scholar] [CrossRef]
  37. Yu, X.; Drnevich, V.P. Soil water content and dry density by time domain reflectometry. J. Geotech. Geoenvironmental Eng. 2004, 130, 922–934. [Google Scholar] [CrossRef]
  38. Chen, Y.; Huang, J.; Song, X.; Gao, P.; Wan, S.; Shi, L.; Wang, X. Spatiotemporal characteristics of winter wheat waterlogging in the middle and lower reaches of the Yangtze River, China. Adv. Meteorol. 2018, 2018, 3542103. [Google Scholar] [CrossRef]
  39. Sairam, R.; Kumutha, D.; Ezhilmathi, K.; Deshmukh, P.; Srivastava, G. Physiology and biochemistry of waterlogging tolerance in plants. Biol. Plant. 2008, 52, 401–412. [Google Scholar] [CrossRef]
  40. Zhang, J.; Pan, B.; Shi, W.; Zhang, Y. Monitoring Waterlogging Damage of Winter Wheat Based on HYDRUS-1D and WOFOST Coupled Model and Assimilated Soil Moisture Data of Remote Sensing. Remote Sens. 2023, 15, 4133. [Google Scholar] [CrossRef]
  41. Dong, J.; Fu, Y.; Wang, J.; Tian, H.; Fu, S.; Niu, Z.; Han, W.; Zheng, Y.; Huang, J.; Yuan, W. Early-season mapping of winter wheat in China based on Landsat and Sentinel images. Earth Syst. Sci. Data 2020, 12, 3081–3095. [Google Scholar] [CrossRef]
  42. Patil, M.S.M.M. Interpolation techniques in image resampling. Int. J. Eng. Technol. 2018, 7, 567–570. [Google Scholar]
Figure 1. Location map of the study area. The left side of the figure shows the geographical locations of the two research areas, while the right side shows the elevation of the research areas.
Remotesensing 16 02581 g001
Figure 2. Weight coefficient of waterlogging damage during the entire growth season of winter wheat.
Remotesensing 16 02581 g002
Figure 3. Waterlogging disaster monitoring framework.
Remotesensing 16 02581 g003
Figure 4. Distribution of waterlogging disasters in Jingzhou from 2017 to 2022.
Remotesensing 16 02581 g004
Figure 5. Distribution of waterlogging disasters in Bengbu from 2017 to 2022.
Remotesensing 16 02581 g005
Figure 6. Analysis of the correlation between waterlogging disaster fields and the yield reduction rate in Jingzhou: (a) Distribution of administrative regions in Jingzhou; (b) scatter plot analysis of yield reduction rate and proportion of affected areas in different administrative regions.
Remotesensing 16 02581 g006
Figure 7. Analysis of the correlation between waterlogging disaster fields and yield reduction rate in Bengbu: (a) Distribution of administrative regions in Bengbu; (b) scatter plot analysis of yield reduction rate and proportion of affected areas in different administrative regions.
Remotesensing 16 02581 g007
Figure 8. Comparison of waterlogging disaster with elevation.
Remotesensing 16 02581 g008
Figure 9. Comparison of waterlogging disasters with precipitation.
Remotesensing 16 02581 g009
Figure 10. Comparison of waterlogging disasters with evapotranspiration.
Remotesensing 16 02581 g010
Table 1. Table of all the remote sensing data sources used, with corresponding spatial and spectral resolution as applicable.
Data SourceSatellite/ProgramSpatial ResolutionSpectral Resolution
Sentinel-1Copernicus Program(ESA)10 mC-band SAR
Sentinel-2Copernicus Program(ESA)20 m13 spectral bands
(VNIR, SWIR)
ERA5-LandECMWF9 kmReanalysis dataset
(various)
MOD16A2/A3NASA500 mEvapotranspiration
estimates
SRTMShuttle Radar Topography30 mElevation data
Table 2. Proportion of areas affected by different degrees of waterlogging disasters in Jingzhou from 2017 to 2022.
Waterlogging Degree201720182019202020212022
No waterlogging31.2%32.8%36.3%38.6%38.3%37.2%
Mild waterlogging30.0%30.4%29.2%35.3%31.9%28.7%
Moderate waterlogging25.6%20.2%16.4%13.8%17.4%21.5%
Severe waterlogging13.2%16.6%18.1%12.3%12.4%12.6%
Table 3. Proportion of areas affected by different degrees of waterlogging disasters in Bengbu from 2017 to 2022.
Waterlogging Degree201720182019202020212022
No waterlogging30.9%32.3%33.3%41.8%41.6%40.1%
Mild waterlogging34.2%32.6%34.3%30.5%32.1%27.6%
Moderate waterlogging21.4%18.8%18.2%17.4%16.7%18.1%
Severe waterlogging13.5%16.3%14.2%10.3%9.6%14.2%
Disclaimer/Publisher’s Note: The statements, opinions and data contained in all publications are solely those of the individual author(s) and contributor(s) and not of MDPI and/or the editor(s). MDPI and/or the editor(s) disclaim responsibility for any injury to people or property resulting from any ideas, methods, instructions or products referred to in the content.

