Abstract
Numerous policies have been proposed by international and supranational institutions, such as the European Union, to surveil Earth from space and furnish indicators of environmental conditions across diverse scenarios. In tandem with these policies, different initiatives, particularly on both sides of the Atlantic, have emerged to provide valuable data for environmental management such as the concept of essential climate variables. However, a key question arises: do the available data align with the monitoring requirements outlined in these policies? In this paper, we concentrate on Earth Observation (EO) optical data applications for environmental monitoring, with a specific emphasis on ocean colour. In a rapidly changing climate, it becomes imperative to consider data requirements for upcoming space missions. We place particular significance on the application of these data when monitoring lakes and marine protected areas (MPAs). These two use cases, albeit very different in nature, underscore the necessity for higher-spatial-resolution imagery to effectively study these vital habitats. Limnological ecosystems, sensitive to ice melting and temperature fluctuations, serve as crucial indicators of a climate in change. Simultaneously, MPAs, although generally small in size, play a crucial role in safeguarding marine biodiversity and supporting sustainable marine resource management. They are increasingly acknowledged as a critical component of global efforts to conserve and manage marine ecosystems, as exemplified by Target 3 of the Kunming–Montreal Global Biodiversity Framework (GBF), which aims to effectively conserve 30% of terrestrial, inland water, coastal, and marine areas by 2030 through protected areas and other conservation measures. In this paper, we analysed different policies concerning EO data and their application to environmental-based monitoring. We also reviewed and analysed the existing relevant literature in order to find gaps that need to be bridged to effectively monitor these habitats in an ecosystem-based approach, making data more accessible, leading to the generation of water quality indicators derived from new high- and very high-resolution satellite monitoring focusing especially on Chlorophyll-a concentrations. Such data are pivotal for comprehending, at small and local scales, how these habitats are responding to climate change and various stressors.
1. Introduction
Monitoring Earth: From Oceans to Lakes and MAPs
Our understanding of the Earth’s environmental systems has undergone a transformative shift, akin to a second Copernican revolution, emphasising the paramount importance of comprehending the global environment for the effective implementation of policies [1]. A remarkable revolution in understanding the Earth’s system as a whole has been made possible through the continuous advancements in technology and the launch of Earth-observing satellites, marking a significant milestone in planetary monitoring. Among the various components of the Earth system, the watery expanse stands out as the one benefiting most profoundly from space-derived data. Oceanography, traditionally a resource-intensive science, has seen a revolutionary shift, with satellites providing synoptic views and enabling the continuous monitoring of critical oceanic variables. Consequently, a comprehensive grasp of EO’s role in shaping policy, as well as identifying existing gaps, is imperative for both current policies and future governance. While satellite data have long been acknowledged as an essential governance tool, we must now explore the new demands and opportunities to bridge the gap between policies and effective monitoring. Previous research has outlined that EO data are only present in 9% of lake shift studies, but its use is increasing over the last few years [2]. In this paper, we identify possible reasons on why EO data are not widely used to study marine protected areas and could be improved in limnological scenarios. Other environments such as rivers or lagoons are not part of this study since studying shifts over these areas is more challenging from a standpoint of satellite data alone.
The oceans play a vital role in Earth’s climate due to their capacity to redistribute heat across the globe and to absorb and store greenhouse gases, primary productivity of the oceans accounts for 48.5 Pentagrams of carbon per year (0.65 Pg C y−1), which corresponds to almost half of total Earth primary production [3]. In particular, the mixed layer of the oceans has an effective heat capacity 20 times that of the effective heat capacity of the entire atmosphere [4,5]. The oceans have taken up more than 90% of the excess heat in the climate system that results from the anthropogenic greenhouse gases (GhG) emissions [6], making them a critical regulator of our climate’s thermal balance. They also play a vital role in the thermal memory of the climate system since deep currents govern climate change in a millennia timescale and the surface currents do the same in the short term (years) [7]. Satellites have been crucial in estimating not only primary production at sea [8] but also on deriving EO data on oceanic heat content [9,10,11,12]. However, as we will see, the resolutions used are not sufficient to study smaller regions that must be incorporated in environmental variables.
Lakes, although not matching the oceans in heat storage capacity, are vital in terms of primary production, with a substantial global impact. Global gross primary production (GPP) in lakes is estimated to be 0.65 Pg C y−1 [13]. The rate of organic carbon burial in inland water sediments exceeds that of organic carbon sequestration on the ocean floor [14]. Additionally, lakes serve as sensitive indicators of climate change through shifts in phytoplankton phenology, ice melting patterns, and temperature variations [15]. They also play a significant role in regulating greenhouse gases, and the shrinking of lakes—combined with surface runoff, atmospheric deposition, and biogeochemical transformation—amplifies greenhouse gas re-emission, particularly in smaller (less than 1 km2) lakes [16].
There are more than 117 million lakes in the world [17]. Moreover, very small ponds, of less than 0.001 km2, comprise 8.6% of lakes and ponds by area globally, but account for 15.1% of CO2 emissions and 40.6% of diffusive CH4 emissions [18]. Furthermore, lakes influence regional climate, acting as local coolants [19] and by dampening the variability in near-surface temperature such as in the Great Lakes area, affecting the living of millions of people [20]. Finally, saline lakes contribute two times more to the emission of CO2 than freshwater lakes [21]. The importance of satellites for the monitoring of lakes has been stated by previous research [2]; however, we review the bottlenecks on the use of EO for lake monitoring and assess if monitoring of lakes health and water quality parameters is already possible on a global scale so as to include lake colour as an essential climate parameter.
Despite their importance, most lakes are small and shallow. It is [22] estimated that 304 million lakes exist globally, of which 91% are of the smallest size (0.001–0.01 km2), and the average lake is 0.012 km2 [22]. Most lakes, therefore, are typically shallow with plenty of light and nutrients but they emit similar amounts of carbon to the atmosphere as the global terrestrial net ecosystem production [14]. Studying very small lakes or water bodies over extensive areas and different habitats can be of great value to better understand climate change. For further reference, we define “very small lakes” in this paper as less than 0.4 km2; such a value is important since the resolution of Sentinel-3 is 300 m, which is not suitable to study water bodies less than 600 m in extension or 0.36 km2. The resolution of Sentinel-2 is 20 m (HR2) and of Landsat-8 is 40 m (MR1). Whilst some studies have delved into the use of these satellites for Chlorophyll-a estimations, their low spectral resolutions suggested that these satellites can still be used but are sub-optimal to effectively assess these ecosystems since Chlorophyll-a detection is only possible under very specific conditions [23,24,25].
Marine protected areas (MPAs) exhibit similarities with lakes in terms of ecological significance, social benefits, and economic value. They also play a role in biodiversity conservation, fisheries management, and carbon capture. MPAs, especially those preserving specific ecosystems like seagrass beds and mangroves, have the potential to store significant amounts of carbon, contributing to climate change mitigation. It has been assumed that ocean habitats such as seagrasses and mangroves (and associated food webs) can sequester carbon dioxide from the atmosphere at rates up to four times higher than terrestrial forests can [26]. However, estimations of this “blue carbon” sequestration rate can be two orders of magnitudes higher when considered on a “per area” basis [27]. Mangroves and other coastal habitats are some of the most carbon-rich ecosystems [28] although discussions about the precise contributions and menaces of blue carbon sequestrations are still elusive and new advances are dependable on EO data [29].
Because of the natural habitats they encompass, MPAs are very sensitive to climate change and other environmental impacts. The definition of MPA objectives should also be enlarged as in many cases they are restricted to non-take areas and should comply to a more effective ecosystem-based management approach [30]. High-resolution satellites, already used to survey fishing activities in sensitive areas [31], are critical to address other aspects of MPAs ensuring ocean health and better marine conservation.
The role of higher-resolution satellites in addressing diverse aspects of MPAs and lakes, and their sensitivity to climate change and environmental threats cannot be overstated. From such methods, we can derive indicators to assess the status and help to meet important environmental targets, such as the Kunming–Montreal Global Biodiversity Framework. Nevertheless, the challenge lies in developing methods for consistent and synoptic monitoring, particularly in areas that are often isolated or too small for satellite observation, limited not by technology but by policies and restrictions on the collection, use and exploitation of VHR data.
This article will analyse the EO-based environmental surveillance assets at the European level. Since Copernicus is currently seen as the largest EO programme in the world in terms of budget, scope, and applications, we want to analyse what are the current scientific applications of EO data in small water bodies such as lakes and MPAs. Then, we move to the prospectives on the feasibility of high- and very high-resolution satellites for lake and ocean colour by revising many studies that have considered and tested the feasibility of data outside of the Copernicus programme to monitor water quality. Finally, we discuss the application to governance of this ecosystem-based monitoring and conclude on the needs for future data.
2. Materials and Methods
In this paper, we analysed the role of EO policies and initiatives that provide monitoring on ecosystem-based management and support decision making, framing these initiatives considering the EU Space Regulation and the Essential Climate Variables initiative. However, this analysis should be accompanied with research on current needs and bottlenecks of the scientific community, given that space EO missions not only serve scientific purposes but also societal ones like surveillance. In performing this literature search, we have used Web of Science and the VOSviewer for visualisation. The VOSviewer is a computer program developed by van Eck et al. [32] for creating, visualising, and exploring bibliometric maps of science. The program, freely available at www.vosviewer.com, was used to analyse co-occurrence relations between scientific terms and how these occurrences appeared in different periods. The specific queries in Web of Science are outlined in the results Section 4. Additionally, we also reviewed the current available EO data providers not limited to public initiatives such as Copernicus. We reviewed the current available technology from both public and privately owned satellites and what studies have used these data to retrieve water colour parameters.
Then, we derive conclusions on the applications of these data to governance and ecosystem-based monitoring.
3. Results on EO Policies and Decision-Making Structures
3.1. The EU Space Programme and Copernicus
Copernicus is the EO component of the EU Space Programme, established in 2014 by the European Union through EU Regulation 377/2014 and coordinated by the European Commission. This EU’s flagship initiative for EO is backed by a substantial budget of nearly 6 billion EUR for the period 2021–2027. The program’s primary aim is to enhance the European Union’s capacity in EO, enabling it to address global challenges such as emergency response, global food security, climate change mitigation, and national security. Copernicus is divided into three main components: the space segment, in situ data, and various public services. The programme is implemented in partnership with ESA, entrusted with the space component, and benefits from contributions from partner agencies and organisations (see https://www.copernicus.eu/en/about-copernicus, accessed on 17 May 2024).
The space component of the Copernicus includes the Sentinel family of missions, which are Sentinel-1 (providing all-weather radar imagery), Sentinel-2 (providing high-resolution optical imagery), and Sentinel-3 (providing optical data for marine and land services). Additionally, Sentinel-4 and Sentinel-5 offer atmospheric composition monitoring from geostationary and polar orbits, respectively. Sentinel-5 Precursor bridges the gap between Envisat and Sentinel-5 (for sciamachy data), while Sentinel-6 provides radar altimetry data for oceanography and climate studies (see https://sentiwiki.copernicus.eu/web/sentiwiki, accessed on 16 May 2024).
Copernicus (Figure 1) also comprises six service component, which includes Atmosphere, Marine Environment, Land, Climate Change, Emergency, and Security services. These services are provided free of charge to users, but data collected and processed via the Security component are request driven and might be subject to restricted access, an example of the restrictions identified by [33].
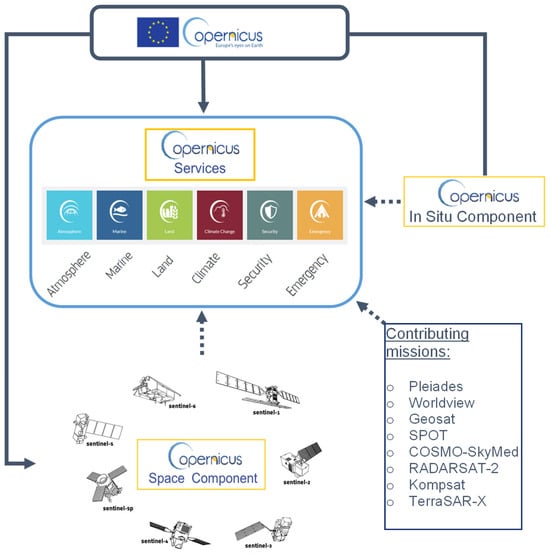
Figure 1.
Overview of the three Copernicus components: space, in situ and services. Contribution missions are not part of the space component. They can be included directly in the provision of Copernicus services.
Figure 2 provides an overview of the available resolutions outlining the fact that satellites in VHR are commercially owned. Cortosat-3 is the only public optical satellite in VHR, owned by the government of India [34]. The privately owned satellites shown in Figure 2 provide additional data to Copernicus through an activity entrusted to ESA under Copernicus Contributing Missions, CCM. As some of these services are heavily reliant on high- and very high-resolution missions, the new EU Space Regulation (EU) 2021/696 foresees a cautionary use of such data due to security factors but simultaneously supporting third-party engagement to facilitate the integration of VHR data across the Copernicus Service Components:
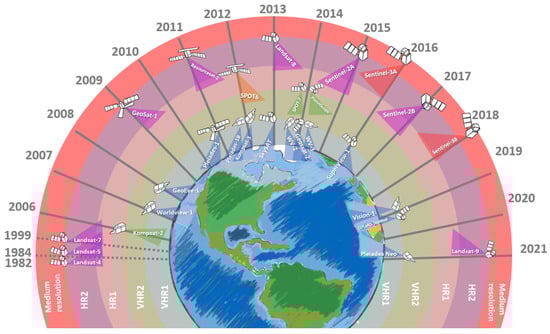
Figure 2.
Overview of the resolutions available for Copernicus Space segment and contributing missions. VHR resolutions, needed for the monitoring of very small lakes and MPAs are only available through contributing missions. All satellites in blue, green and orange are privately owned.
“(Article 38) The Commission should work with data providers to agree licensing conditions for third-party data to facilitate their use within Copernicus, in compliance with this Regulation and applicable third-party rights. As some Copernicus data and Copernicus information, including high-resolution images, may have an impact on the security of the Union or Member States, in duly justified cases, measures in order to deal with risks and threats to the security of the Union or Member States may be adopted.”from EU Space Regulation (EU) 2021/696
Although understanding the security risks imposed by such type of high-resolution imagery, this paper reflects on how specific environments—such as very small lakes and marine protected areas—could benefit from lifting restrictions for the creation of high-resolution variables such as ocean colour and water reflectance. Ocean colour should be read in its wider term as the retrieval of water quality parameters in different scenarios not restricted to the oceans.
We have organised available missions along a clear definition of resolution categories:
A benchmark of resolution classes is not yet practiced in the literature. We believe that the definition proposed in this paper, summarised in Table 1, could be used to organise and clarify the potential use of private and publicly owned data when applied to specific scenarios.

Table 1.
Resolution classes definition.
3.2. Essential Climate Variables
In accordance with the requirements of the United Nations Framework Convention on Climate Change (UNFCCC), outlined in the Second GCOS Adequacy Report [35], a set of Essential Climate Variables (ECVs) have been defined by the Global Climate Observing System (GCOS). Figure 3 provides a representation of the whole set of variables, their related geophysical areas and concerned organisations. GCOS is a program that systematically evaluates the status of global climate observations and offers guidance for their enhancement. Additionally, GCOS facilitates and encourages the accessibility of climate observations for both national and international organisations. At present, there are 54 variables that comprehensively represent the observations needed to consistently monitor Earth’s climate and other physical and biological changes. Experts regularly develop plans to maintain, coordinate and improve these physical, chemical, and biological observations.
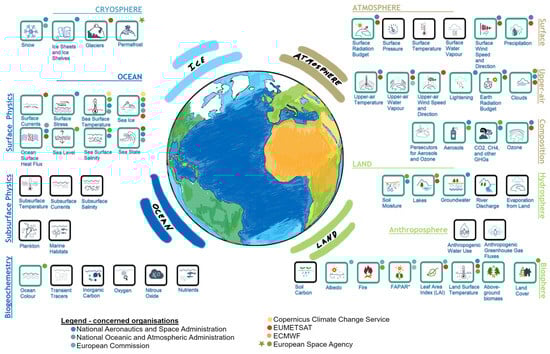
Figure 3.
From the 56 ECVs, 36 (highlighted in green) rely on EO data. Some of the concerned organisations are depicted on the top right of each ECV. The concerned organisations are given as examples since many more are involved in providing products for each ECV. For example, nine organisations are involved in providing data for the Precipitation ECV. Only NASA manages the Lightening ECV and only ESA is responsible for the Ocean Colour ECV. The star represents a future engagement of ESA in the Permafrost ECV.
ECVs hold paramount importance in our comprehension and prediction of the Earth’s climate system. The variables encompass critical parameters such as temperature, precipitation, atmospheric and oceanic circulation, and greenhouse gas concentrations, among others. The significance of ECVs arises from their fundamental role as key indicators of climate change. By consistently monitoring these variables, scientists can detect trends, patterns, and anomalies within the climate system, providing essential insights into its state, behaviour, and potential impacts on ecosystems, society, and the economy.
Furthermore, ECVs serve as the foundation for climate modelling and forecasting, facilitating the projection of future climate scenarios. This, in turn, empowers policy makers to make informed decisions on climate change mitigation and adaptation strategies. Moreover, ECVs play a pivotal role in international climate agreements, providing standardised parameters for assessing global climate change. The availability of consistent ECV data supports evidence-based decision making, allowing policy makers to formulate effective climate policies and strategies [36].
Next, we identify four ECVs that currently benefit from satellite medium resolutions but for which spatial resolution could eventually be increased due to allow for the monitoring of the two specific habitats addressed in this paper.
Sea Surface Temperature (SST) is vital for the climate system as it influences energy, momentum, and gas exchanges between the ocean and atmosphere. SST largely controls the ocean-atmosphere interaction at both weather and climate time scales. Daily SST variations exceed 3 degrees Celsius, impacting the surface energy budget by over 10 Wm-2 in the tropics and subtropics. SST and its gradients are crucial for atmospheric–ocean coupling, particularly in sub-seasonal to seasonal predictions. SST patterns reveal ocean dynamics, including fronts, eddies, coastal upwelling, and exchanges between coastal and open ocean regions. Sea Surface Temperature is studied at resolutions between 1 and 100 km [37].
Ocean colour is the radiance from the ocean normalised by the illuminating irradiance. It provides information on ocean albedo, seawater constituents like Chlorophyll-a, and phytoplankton pigments. Ocean colour remote sensing (OCRS) products assess ecosystem health, productivity, marine resource management, the global carbon cycle, and quantify climate impacts. Currently, the resolutions for Ocean colour have been defined at 4 km for both water leaving radiance and Chlorophyll-a concentrations [38,39]. However, ocean colour provision as an ECV is provided under ESA’s Climate Change Initiative through the Sentinel-3 OCLI sensor at a resolution of 300 m. As discussed in the literature reviewed, there is a consistent gap in resolutions < 10 m, which is useful for inland water detection of Chlorophyll-a and other water quality parameters [2,3,15,24,25,40,41]. This need gives rise to the term “lake colour”, which is not consistently used in the literature and as seen below could provide more maturity (in terms of definition of measurable parameters) to the “Lakes” ECV.
Sea ice is a key climate indicator in polar regions, impacting albedo, energy budget, and air–sea exchanges. Parameters like concentration, area, extent, motion, and thickness define its state, influencing water masses and freezing/melting processes. The decreasing sea ice surface extension in the Arctic has a significant impact on the Earth’s albedo and contributes to the Arctic amplification of temperature [42]. Furthermore, the weaker surface temperature gradient between the Arctic and regions to the south affect the polar jet stream patterns and the weather in mid-latitudes [43].
Lakes variable provides information on changes at the lake level and area, required monthly for climate assessment purposes. Approximately 95% of the volume of water held globally in approximately 4,000,000 lakes is contained in the world’s 80 largest lakes. Lakes ECV includes the following: Lake Water Level, Lake Water Extent, Lake Surface Water temperature, Lake Ice Cover and Thickness, and Lake Surface Reflectance. Although lake colour, i.e., the estimation of Chlorophyll-a in lakes, is foreseen as part of this ECV there is currently no operational worldwide product providing these data. Nevertheless, there have been efforts to provide such estimates in local scenarios based on high-resolution data, such as from the Landsat family [25]. We make the case in this paper that privately owned satellite data could be used to feed this ECV, providing a clearer definition of variables such as Chlorophyll-a estimations and other water quality parameters monitoring, which is not currently done.
EO data, when combined with the definition of these ECV variables, are extremely valuable to support the sustainable development goals (SDGs). For lakes, SDGs 3, 6, 11, 14 and 16 are applicable and dependent on EO data [44]. The production of satellite-based timeseries of some of these ECVs has been crucial in many environmental studies and the discussion of higher temporal and spatial resolution, a constant subject in specialised scientific meeting [45]. In the following pages, we will analyse the resolution bottlenecks that, if surmounted, could provide higher resolution data to finally implement operational products such as the lake colour.
4. Results and Analysis on the Current Scientific Demand of Satellite Data to MPAs and Lake Research
Based on Web of Science, we have performed a literature search focusing on the application of satellite data usage for gathering knowledge on MPAs and lakes. We have devised three groups of queries:
- Query A: Research on MPAs or marine reserves: ALL = (“marine protected area” OR “marine reserve”).
- Query B: The former applied to satellite data: ALL = ((“marine protected area” OR “marine reserve”) AND (“satellite data” OR “satellite” OR “Earth Observation”)).
- Query C: Lake research that already focused on the use of satellite data: ALL = (“lake” AND (“satellite data” OR “satellite” OR “Earth Observation”)).
Our results (Figure 4) show that the number of results for query A is 41%, 2% for query B and for 57% for query C. Additionally, there is a well-established relationship between the use of satellite data and the study of lakes, equivalent to the general literature on MPAs or marine reserves (not considering the inclusion of satellite data).
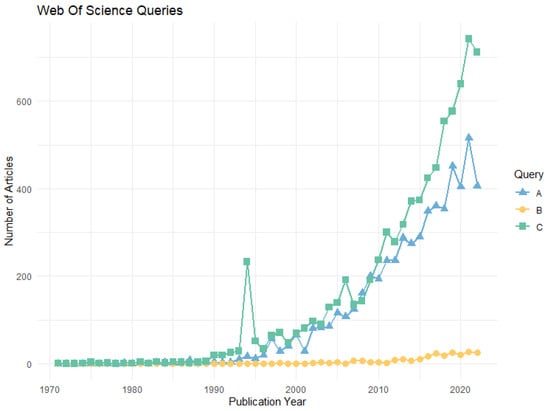
Figure 4.
Results from the Web of Science query.
Gathering the results from queries B and C, we exported the full abstract and titles of each output article and preformed a text mining on the corpus of these texts.
For query B, we have defined a minimum threshold of 50 co-occurrences to create a map, we have also deleted terms specific to countries and regions since our study attempts to review the literature independently of geographical boundaries.
The created map (Figure 5) clearly shows how lake research is closely tied with remote sensing. Furthermore, more recent publications are including terms such as “algal blooms”, “eutrophication”, “water quality” and “machine learning” proving that this area of research is in the forefront of satellite technology. The most relevant satellites presented in this map are exactly the optical ones publicly available in resolutions much higher (HR1 and HR2) than the only satellite (Sentinel-1, OLCI sensor, MR2) devoted to ocean colour estimations: the Landsat family, being used before 2018 and Sentinel-2 being used more recently, after 2018. It should also be noted that Sentinel-2, being launched in mid-2015, can only now start to have sufficient data for timeline creation and analyses. Out of the 8054 articles analysed, 2640 mentioned the use of HR or VHR satellite data [(“lake” AND (“satellite data” OR “satellite” OR “Earth Observation”) AND (“high resolution” OR “WorldView” OR “Geoeye” OR “SPOT” OR “Landsat” OR “Hyperion” OR “RapidEyE”))].
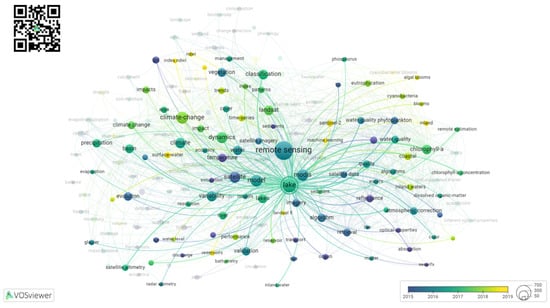
Figure 5.
VOSviewer map of co-occurrences in the 8054 abstracts analysed, showing how lake research and satellite remote sensing are close subjects.
Studies that use satellite data on MPAs are still rare. We have considered both terms “MPAs” and “marine reserves” since it has been clear in previous research that most MPAs do not address ecosystem base management and lack other objectives aside from conservation and limitation on fisheries [30]. For example, marine protected areas usually do not consider eutrophication from land-sourced nutrients which can be an important indicator of how healthy an ecosystem is in an MPA. Access to high-resolution data would be of the utmost importance to generate further knowledge on these topics. Furthermore, several MPAs include shallow waters, where seagrasses prairies, macroalgae or other benthic substrates could be assessed by remote sensing, depending on their dimensions.
Our second map, in Figure 6, shows how terms such as “remote sensing” and “satellite” are part of the papers on MPA research; however, they still do not have the same weight as in the case of lakes (Figure 5). The results also show how “satellite tracking” is also part of the text on MPAs, which is a field not related to EO. In fact, based on our results, satellites can be used to monitor MPAs for a variety of needs from tracking species [46], monitoring corals [47] or maritime surveillance [48]. A common application of satellite images in MPAs is the support to law enforcement in the detection of vessels not transmitting positioning information. Such vessels are often involved in illegal, unreported or unregulated fishing activities in restricted areas [48,49,50]. These satellite data, although not directly related to environmental assessment of the MPAs, is being used in remote locations such as the Ascension Island Exclusive Economic Zone for surveillance and law enforcement purposes [49].
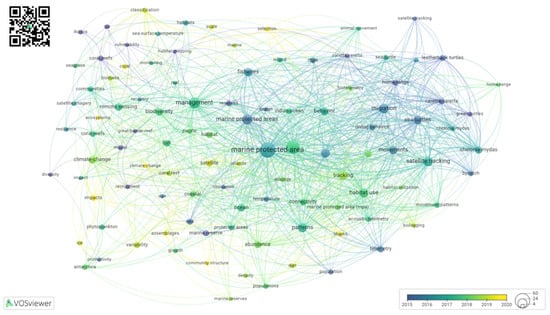
Figure 6.
VOSviewer map of co-occurrences in the 231 abstracts analysed, showing how marine protected areas and satellite remote sensing are not co-occurring in the scientific literature. The map can be accessed through the QR code with the possibility to explore the clusters.
Figure 6 also shows that terms like “climate change“ and “satellite” have only been used in the more recent literature about MPAs, not presenting the kind of maturity seen for lakes. The occurrence of high-resolution satellite data in MPA-related data are 11.2%. However, amongst these, the number of articles using satellites for tracking of species in MPA contexts is 30.5%, and the rest on the surveillance of such areas for the detection of vessels involved in illegal activities such as fisheries.
5. Discussing Prospectives on the Feasibility of High- and Very High-Resolution Optical Satellites for Ocean and Lake Colour
There is already a clear scientific consensus on the need for better spatial resolution to respond to some environmental monitoring. A resolution gap in high-resolution (<10 m) and very high-resolution (submeter) observations of ocean (and lake colour) has been identified [39]. It should be noted that at resolutions between 10 and 100 m, Sentinel-2 MSI and Landsat 8 have proved useful to provide data on sediment plumes, floating vegetation and phytoplankton [25,39,50,51]; however, these satellites cannot provide the type of data needed for an effective and constant monitoring of small water surfaces.
A new policy can be put forward to facilitate the access to long-term data without compromising, and even boosting the activity of the private sector. According to article 38 seen above, this is in line with the new EU Space Regulation (EU) 2021/696. Privately owned satellite data responds to a need on time criticality which, in the context of long-term datasets, is no longer the case. It is strongly suggested to put forward a roadmap for public access of high-resolution data in non-politically sensitive areas. Such data entails the application of averaging and mosaicking of different singular data products and therefore individual images do not need to be facilitated, thus avoiding security threats.
In Table 2, we have included a summary of potential high- and very high-resolution private and public satellites that could be used to respond to the demands of such higher resolution monitoring for both lakes and small MPAs. The available options are many and some of these missions are already part of the Copernicus Contributing Missions. A recent study has showed the usefulness of privately owned satellites such has PlanetScope to monitor small water reservoirs and an advantage to estimate Chlorophyll-a in cases where the water bodies are too small to be monitored by coarser resolution satellites like Landsat-8 and Sentinel-2 [52]. The PlanetScope satellites have a resolution of 3 m, which fall within the very high-resolution definition of this paper (VHR1). Furthermore, Formosat-2, a satellite owned and operated by the National Space Organisation (NSPO) of Taiwan, was the first mission in very HR1 capable of estimating Chlorophyll-a in small reservoirs [53,54]. One study provided a good model (R2 = 0.78) between surface reflectance and Chlorophyll-a back in 2005 [53]. Proving that a public-private initiative to monitor small lakes and MPAs in HR and VHR will make the construction of long data series possible. In sum, as outlined in Table 2, Chlorophyll-a detection is possible in all resolution classes defined in our paper. However, there is a gap in publicly available data of with resolution below 10 m (HR1 or better).
Table 2.
Resolution class of each satellite mission, spatial and temporal resolution, launch dates and water quality parameters viability. This table was inspired by an often-cited report [55] but updated with recent research and more comprehensive list of satellite missions. Characteristics of KOMPSAT were assumed since the bands for this satellite are like those of Landsat-5. Symbols:  “highly suitable”,
  “suitable” and
  “potential”. The symbol
  refers to variables that in the original table were regarded has “potential” but some research made efforts that Chlorophyll-a can be inferred from Landsat systems [25].
“highly suitable”, “suitable” and “potential”. The symbol refers to variables that in the original table were regarded has “potential” but some research made efforts that Chlorophyll-a can be inferred from Landsat systems [25].
6. Applications to Governance and Ecosystem-Based Management of the Cases Studied [Discussion]
6.1. Lakes and Inland Water Systems—A Much-Needed Variable for Ecosystem-Based Management
ECVs play a critical role in ocean governance by providing the necessary data to understand and predict the changes in the ocean’s climate, identify the impacts of climate change in the ocean domain and its resources, and inform decision making on how to adapt and manage these changes. Essential Climate Variables related to the aquatic ecosystems biological carbon pump have reached high levels of maturity [55]; however, we see that the same is not true for the corresponding variables of the lakes. Additionally, other variables such as the lake level and water temperature, are reaching high levels of maturity. As an example, not only it is possible to map lakes worldwide [17] but also water occurrence is now available in high resolution [59] and available online (https://global-surface-water.appspot.com/map, accessed on 17 May 2024) to create temporal profiles of water occurrence, change and seasonality worldwide. This tool provides worldwide maps that are essential for local and worldwide governance.
Other ECVs related to lakes are still at a relatively low level of maturity. For example, measurements of ice cover, evaporation, or solar radiation have not been widely used or have not been consistently measured over a long period of time. Additionally, some ECVs such as water quality, have a moderate level of maturity, and there is a good understanding of the methods and techniques used to measure them, but data availability and consistency may be limited.
In general, the level of maturity for ECVs related to lakes is increasing as more research is conducted and new technologies are developed to monitor and measure these variables. However, there is still a need for more consistent and comprehensive monitoring, as well as for the development of new methods and techniques to improve the measurement and understanding of these variables.
Very High-Resolution satellite data could be highly beneficial for both the monitoring of very small lakes and small MPAs. Applications are many, for example Harmful Algal Blooms from cyanobacteria have been possible in a relatively small area of Lake Erie, even constructing a 20-year timeseries based on data from the SeaWiFS sensor [41]. This study showed that blooms from cyanobacteria became longer and longer lasting in recent years and accelerating after 2010 (it includes data until 2018). In another study, lakes across the US with frequent cyanobacterial algal blooms have been quantified based on satellite monitoring [60]. Another example is the Science and Policy Integration for Coastal Systems Assessment (SPICOSA) project [61] aimed at integrating data from ocean colour in coastal zones with the participation of different stakeholders. In the case of very small lakes, due to their value in different local communities, similar projects would be highly beneficial.
Although these are important examples, they do not apply to very small lakes and effective analysis of algae phenology is only possible when a long timeseries is freely available. Having long term analyses is paramount to better understand changing patterns in algal phenology due to climate variability [15] or specific algal events. For example, in Botswana, a landscape-wide cyanobacteria bloom might have been the root cause of one of the most severe elephant population die-off [40]. The authors clearly state how current resolutions limit the satellites that can be used in these studies.
In summary, while some Essential Climate Variables related to lakes have a relatively high level of maturity, many of them are still at a relatively low level of maturity, and more research and development is needed to improve their measurement and understanding.
6.2. Marine Protected Areas
As of 2021, approximately 7.7% of the world’s oceans are designated as marine protected areas (MPAs). This includes different regimes of protection and treaties for their definition: from fully protected areas, where all human activities are banned to partially protected areas, where some activities are allowed [62].
This percentage has been increasing in recent years, as more countries and organisations have recognised the importance of protecting marine environments and have established new MPAs, albeit it has long been seen that established goals have not been reached and definition of MPAs, especially large ones, is not without criticism. One of the arguments for the establishment of MPAs in remote areas is the lack of surveillance methods essential for their enforcement [63]. The goal set by the Convention on Biological Diversity (CBD), also known as the Aichi targets, was to protect at least 10% of coastal and marine areas by 2020 (Target 11, [64]). This goal has not been reached four years past, and the situation, especially in terms of the coverage of MPAs is far from being a success. A new goal, known as the 30 × 30 target, consists of protecting 30% of the World’s oceans by 2030 and was first proposed by the United Nations Decade on Ocean Science for Sustainable Development. The 30 × 30 target has been endorsed by several other organisations, including the United Nations Framework Convention on Climate Change and the United Nations Convention to Combat Desertification. This new goal aims to conserve and protect marine biodiversity, habitats, and ecosystem services, and to enhance their resilience to the impacts of human activities and climate change. In addition, it also aims to support the achievement of other sustainable development goals, such as those related to food security, poverty reduction, and climate change mitigation and adaptation.
It is important to note that the coverage of MPAs alone does not guarantee the protection of marine biodiversity and ecosystems. The effectiveness of MPAs in conserving biodiversity and ecosystems depends on many factors, such as the size, location, and management of the MPA, as well as the level of enforcement of the regulations [30].
In terms of their need for high temporal and spatial resolution, MPA monitoring lacks the same type of systematic monitoring as very small lakes. In fact, based on data from the Marine Protection Atlas [65], 37% of MPAs are of very small size (<10 km2), which renders current open and free EO technology inefficient in terms of observing such small areas.
Our literature search outlined in Figure 6 was refined to include benthos and seagrass (in Web of Science: (“seagrass” or “benthos”) and “satellite” and “marine protected area”). There were no results for benthos but 16 results for “seagrass” co-occurrence with “satellite” and “marine protected area”. These mostly reveal studies on the usage of high- and very high-resolution data for the environmental management in specific scenarios. The ALOS AVNIR-2 and Landsat-2 satellites were used to assess the dynamics of seagrass beds in the Cu Lao Cham MPA, underlining a loss of seagrass area [66].
GeoEye-1 was used in Karimunjawa National Park for the assessment and distribution of seagrass [67].
In summary, the status of MPA conservation and environmental-based monitoring is not mature. The satellite resources to monitor MPAs have been mostly related to the use of satellite tracking for tracking species and detection of illegal activities, environmental monitoring of Chlorophyll a is practically non-existent.
7. Conclusions: Changing Climate, Changing EO Needs
ECVs are critical for understanding and monitoring the Earth’s climate system. These variables provide important information about the Earth’s biogeochemical processes and help to improve our understanding of the climate system and its response to natural and human-induced changes. In a changing climate, ECVs provide an important example on the possibility to create coherent timeseries of temperature, ocean colour and many other variables. But lake extent, lake colour, and ocean colour in small oceanic regions are still not possible. By monitoring these and other ECVs, scientists and policy makers can better understand the causes and consequences of climate change and develop strategies to mitigate its impacts. However, there is a spatial and radiometric resolution gap to monitor small yet very important habitats. Privately own satellites are integrated into services such as Copernicus but, currently, there is no public access to long-time series derived from such data. The same algorithms and processing methods used for ocean colour can be applied to data from other sensors to assess the water quality and phytoplankton abundance in lakes and other small water bodies [25]. The lack of VHR1 and VHR2 resolution imagery provides a significant limitation not only on the science that can be done in the two use cases (lakes and MPAs) but also a potential operational water quality monitoring system in high resolution.
Effective ecosystem-based management (EBM) in MAPs offers a variety of factors not restricted to sustainable fisheries and conservation measures [30]. The capabilities of high-resolution data, specifically in terms of detection of Harmful Algal Blooms, euphotic depth, CDOM and organic matter might contribute to a more pressing view of MPA monitoring, but the literature is not yet mature in terms of use cases. However, the applications of EO data in the scope of MPAs are vast and due their remoteness, satellites are vital to monitor such zones.
A previous study identified 21 policy statements for EO data, identifying that most of the current policies abide for some type of free and open data access. Nonetheless, when all the exceptions are outlined across all these policy statements, the situations are extensive and potentially very restrictive. In most cases, the application of these restrictions is too broad to be applied [33]. As seen before, VHR is needed for effective environmental monitoring. There are three main arguments, protecting VHR satellite owners and concerns surrounding security threats, considering that the provision of the creation of a long time series from VHR imagery of the ocean is not time critical:
- (1)
- The maritime picture, being highly dynamic and constantly changing, is not subject to the same risks and threats posed by land imagery.
- (2)
- Creation of timeseries on water quality parameters could be specific to MPAs where military activities are in principle not foreseen.
- (3)
- Although the images themselves could still be protected by user rights, their scientific derived products do not need to be, especially considering these data are not sensitive.
The usage of EO data for lakes and MPAs is currently only possible via some privately owned satellites especially considering the necessary EO data characteristics (higher spatial, spectral, and temporal resolutions). The EO methods necessary to perform analysis on an environmental basis (such as the retrieval of algorithms) are not suitable to produce long timeseries, with the biggest disadvantage being scientists needing to purchase an entire collection of privately owned data to study these small environments. However, the challenges are clear: studying small lakes and monitoring MPAs over long timespans is crucial.
Albeit not addressed in this article, LiDAR (“light detection and ranging”) is capable of detecting Chlorophyll in water, though it is not as commonly used as an optical remote sensing method. Its high resolution and ability to provide subsurface information make it a valuable tool in certain applications, despite its higher cost and complexity [68]. For routine monitoring of Chlorophyll concentrations, traditional optical methods remain the preferred approach.
Funding
The PhD research grant PD/BD/113932/2015, given by the Portuguese Fundação para a Ciência e a Tecnologia (FCT), funded this work and the authors are thankful for such fundamental support. This project received funding from the European Union’s Horizon 2020 research and innovation programme under grant agreement nº 810139. This work was also supported by funding from the European Union’s Horizon 2020 Research and Innovation Programme grant agreement N 810139: Project Portugal Twinning for Innovation and Excellence in Marine Science and Earth Observation—PORTWIMS.
Data Availability Statement
Data is contained within the article.
Acknowledgments
The authors would like to thank the MARE—Marine and Environmental Sciences Centre, the cE3c—Centre for Ecology, Evolution and Environmental Changes and the CCIAM—Climate Change Impacts and Adaptation Measures.
Conflicts of Interest
The authors declare no conflicts of interest. The content of this study does not necessarily reflect the official opinion of the European Maritime Safety Agency. Responsibility for the information and views expressed in this study lies entirely with the authors.
References
- Schellnhuber, H.J. ‘Earth System’ Analysis and the Second Copernican Revolution. Nature 1999, 402, C19–C23. [Google Scholar] [CrossRef]
- Calamita, E.; Lever, J.J.; Albergel, C.; Woolway, R.I.; Odermatt, D. Detecting Climate-Related Shifts in Lakes: A Review of the Use of Satellite Earth Observation. Limnol Ocean. 2024, 69, 723–741. [Google Scholar] [CrossRef]
- Field, C.B.; Behrenfeld, M.J.; Randerson, J.T.; Falkowski, P. Primary Production of the Biosphere: Integrating Terrestrial and Oceanic Components. Science 1998, 281, 237–240. [Google Scholar] [CrossRef] [PubMed]
- Dias, J.M.; Babanin, A.; Teresa De Castro Rodríguez, M.; Soldatenko, S. On the Effects of Mixed and Deep Ocean Layers on Climate Change and Variability. J. Mar. Sci. Eng. 2022, 10, 1216. [Google Scholar] [CrossRef]
- Soldatenko, S.A.; Yusupov, R.M. Sensitivity and Feedback Loops of a Zerodimensional Climate Model in the Context of the Weather and Earth’s Climate Control. SPIIRAS Proc. 2017, 3, 5–31. [Google Scholar] [CrossRef][Green Version]
- Pörtner, H.-O.; Roberts, D.C.; Masson-Delmotte, V.; Zhai, P.; Tignor, M.; Poloczanska, E.; Mintenbeck, K.; Alegría, A.; Nicolai, M.; Okem, A. IPCC, 2019: IPCC Special Report on the Ocean and Cryosphere in a Changing Climate. In The Ocean and Cryosphere in a Changing Climate; Cambridge University Press: Cambridge, UK, 2022. [Google Scholar]
- Schiermeier, Q. Climate Change: A Sea Change. Nature 2006, 439, 256–260. [Google Scholar] [CrossRef] [PubMed]
- Westberry, T.K.; Silsbe, G.M.; Behrenfeld, M.J. Gross and Net Primary Production in the Global Ocean: An Ocean Color Remote Sensing Perspective. Earth Sci. Rev. 2023, 237, 104322. [Google Scholar] [CrossRef]
- Irrgang, C.; Saynisch, J.; Thomas, M. Estimating Global Ocean Heat Content from Tidal Magnetic Satellite Observations. Sci. Rep. 2019, 9, 7839. [Google Scholar] [CrossRef] [PubMed]
- Maturi, E.M.; Shay, L.N.; Donahue, D.R.; Byrne, D.A. NOAA’s Operational Satellite Ocean Heat Content Products. J. Oper. Oceanogr. 2024, 17, 93–102. [Google Scholar] [CrossRef]
- Jayne, S.R.; Wahr, J.M.; Bryan, F.O. Observing Ocean Heat Content Using Satellite Gravity and Altimetry. J. Geophys. Res. Ocean. 2003, 108, 3031. [Google Scholar] [CrossRef]
- Smale, D.A.; Wernberg, T. Satellite-Derived SST Data as a Proxy for Water Temperature in Nearshore Benthic Ecology. Mar. Ecol. Prog. Ser. 2009, 387, 27–37. [Google Scholar] [CrossRef]
- Pace, M.L.; Prairie, Y.T. Respiration in Lakes. Respir. Aquat. Ecosyst. 2005, 1, 103–122. [Google Scholar] [CrossRef]
- Tranvik, L.J.; Downing, J.A.; Cotner, J.B.; Loiselle, S.A.; Striegl, R.G.; Ballatore, T.J.; Dillon, P.; Finlay, K.; Fortino, K.; Knoll, L.B.; et al. Lakes and Reservoirs as Regulators of Carbon Cycling and Climate. Limnol. Ocean. 2009, 54, 2298–2314. [Google Scholar] [CrossRef]
- Maeda, E.E.; Lisboa, F.; Kaikkonen, L.; Kallio, K.; Koponen, S.; Brotas, V.; Kuikka, S. Temporal Patterns of Phytoplankton Phenology across High Latitude Lakes Unveiled by Long-Term Time Series of Satellite Data. Remote Sens. Environ. 2019, 221, 609–620. [Google Scholar] [CrossRef]
- Pi, X.; Luo, Q.; Feng, L.; Xu, Y.; Tang, J.; Liang, X.; Ma, E.; Cheng, R.; Fensholt, R.; Brandt, M.; et al. Mapping Global Lake Dynamics Reveals the Emerging Roles of Small Lakes. Nat. Commun. 2022, 13, 5777. [Google Scholar] [CrossRef] [PubMed]
- Verpoorter, C.; Kutser, T.; Seekell, D.A.; Tranvik, L.J. A Global Inventory of Lakes Based on High-Resolution Satellite Imagery. Geophys. Res. Lett. 2014, 41, 6396–6402. [Google Scholar] [CrossRef]
- Holgerson, M.A.; Raymond, P.A. Large Contribution to Inland Water CO2 and CH4 Emissions from Very Small Ponds. Nat. Geosci. 2016, 9, 222–226. [Google Scholar] [CrossRef]
- Rouse, W.R.; Oswald, C.M.; Binyamin, J.; Blanken, P.D.; Schertzer, W.M.; Spence, C. Interannual and Seasonal Variability of the Surface Energy Balance and Temperature of Central Great Slave Lake. J. Hydrometeorol. 2003, 4, 720–730. [Google Scholar] [CrossRef]
- Notaro, M.; Holman, K.; Zarrin, A.; Fluck, E.; Vavrus, S.; Bennington, V. Influence of the Laurentian Great Lakes on Regional Climate. J. Clim. 2013, 26, 789–804. [Google Scholar] [CrossRef]
- Duarte, C.M.; Prairie, Y.T.; Montes, C.; Cole, J.J.; Striegl, R.; Melack, J.; Downing, J.A. CO2 Emissions from Saline Lakes: A Global Estimate of a Surprisingly Large Flux. J. Geophys. Res. Biogeosci. 2008, 113, 4041. [Google Scholar] [CrossRef]
- Downing, J.A.; Prairie, Y.T.; Cole, J.J.; Duarte, C.M.; Tranvik, L.J.; Striegl, R.G.; McDowell, W.H.; Kortelainen, P.; Caraco, N.F.; Melack, J.M.; et al. The Global Abundance and Size Distribution of Lakes, Ponds, and Impoundments. Limnol. Ocean. 2006, 51, 2388–2397. [Google Scholar] [CrossRef]
- Beck, R.; Zhan, S.; Liu, H.; Tong, S.; Yang, B.; Xu, M.; Ye, Z.; Huang, Y.; Shu, S.; Wu, Q.; et al. Comparison of Satellite Reflectance Algorithms for Estimating Chlorophyll-a in a Temperate Reservoir Using Coincident Hyperspectral Aircraft Imagery and Dense Coincident Surface Observations. Remote. Sens. Environ. 2016, 178, 15–30. [Google Scholar] [CrossRef]
- Boucher, J.; Weathers, K.C.; Norouzi, H.; Steele, B. Assessing the Effectiveness of Landsat 8 Chlorophyll a Retrieval Algorithms for Regional Freshwater Monitoring. Ecol. Appl. 2018, 28, 1044–1054. [Google Scholar] [CrossRef] [PubMed]
- Lisboa, F.; Brotas, V.; Santos, F.D.; Kuikka, S.; Kaikkonen, L.; Maeda, E.E. Spatial Variability and Detection Levels for Chlorophyll-a Estimates in High Latitude Lakes Using Landsat Imagery. Remote Sens. 2020, 12, 2898. [Google Scholar] [CrossRef]
- Searles Jones, J. To Solve Climate Change, Remember the Ocean. Nature 2019. [Google Scholar] [CrossRef] [PubMed]
- McLeod, E.; Chmura, G.L.; Bouillon, S.; Salm, R.; Björk, M.; Duarte, C.M.; Lovelock, C.E.; Schlesinger, W.H.; Silliman, B.R. A Blueprint for Blue Carbon: Toward an Improved Understanding of the Role of Vegetated Coastal Habitats in Sequestering CO2. Front. Ecol. Environ. 2011, 9, 552–560. [Google Scholar] [CrossRef] [PubMed]
- Donato, D.C.; Kauffman, J.B.; Murdiyarso, D.; Kurnianto, S.; Stidham, M.; Kanninen, M. Mangroves among the Most Carbon-Rich Forests in the Tropics. Nat. Geosci. 2011, 4, 293–297. [Google Scholar] [CrossRef]
- Pham, T.D.; Ha, N.T.; Saintilan, N.; Skidmore, A.; Phan, D.C.; Le, N.N.; Viet, H.L.; Takeuchi, W.; Friess, D.A. Advances in Earth Observation and Machine Learning for Quantifying Blue Carbon. Earth Sci. Rev. 2023, 243, 104501. [Google Scholar] [CrossRef]
- Halpern, B.S.; Lester, S.E.; McLeod, K.L. Placing Marine Protected Areas onto the Ecosystem-Based Management Seascape. Proc. Natl. Acad. Sci. USA 2010, 107, 18312–18317. [Google Scholar] [CrossRef]
- Hamel, M.A.; Andréfouët, S. Using Very High Resolution Remote Sensing for the Management of Coral Reef Fisheries: Review and Perspectives. Mar. Pollut. Bull. 2010, 60, 1397–1405. [Google Scholar] [CrossRef]
- van Eck, N.J.; Waltman, L. Software Survey: VOSviewer, a Computer Program for Bibliometric Mapping. Scientometrics 2010, 84, 523–538. [Google Scholar] [CrossRef] [PubMed]
- Harris, R.; Baumann, I. Open Data Policies and Satellite Earth Observation. Space Policy 2015, 32, 44–53. [Google Scholar] [CrossRef]
- Cubaynes, H.C.; Fretwell, P.T. Whales from Space Dataset, an Annotated Satellite Image Dataset of Whales for Training Machine Learning Models. Sci. Data 2022, 9, 245. [Google Scholar] [CrossRef] [PubMed]
- Mason, P.J.; Manton, M.; Harrison, D.E.; Belward, A.; Thomas, A.R.; Dawson, D.K. The Second Report on the Adequacy of the Global Observing Systems for Climate in Support of the UNFCCC; WMO: Geneva, Switzerland, 2003. [Google Scholar]
- Bojinski, S.; Verstraete, M.; Peterson, T.C.; Richter, C.; Simmons, A.; Zemp, M. The Concept of Essential Climate Variables in Support of Climate Research, Applications, and Policy. Bull. Am. Meteorol. Soc. 2014, 95, 1431–1443. [Google Scholar] [CrossRef]
- GHRSST Project Office; Beggs, H.; Karagali, I.; Castro, S. Sea Surface Temperature: An Introduction to Users on the Set of GHRSST Formatted Products; GHRSST Project Office: Copenhagen, Denmark, 2013. [Google Scholar] [CrossRef]
- GCOS-200. The Global Observing System for Climate Implementation Needs; World Meteorological Organization: Geneva, Switzerland, 2016. [Google Scholar]
- Groom, S.B.; Sathyendranath, S.; Ban, Y.; Bernard, S.; Brewin, B.; Brotas, V.; Brockmann, C.; Chauhan, P.; Choi, J.K.; Chuprin, A.; et al. Satellite Ocean Colour: Current Status and Future Perspective. Front Mar. Sci. 2019, 6, 485. [Google Scholar] [CrossRef]
- Veerman, J.; Kumar, A.; Mishra, D.R. Exceptional Landscape-Wide Cyanobacteria Bloom in Okavango Delta, Botswana in 2020 Coincided with a Mass Elephant Die-off Event. Harmful Algae 2022, 111, 102145. [Google Scholar] [CrossRef] [PubMed]
- Sayers, M.J.; Grimm, A.G.; Shuchman, R.A.; Bosse, K.R.; Fahnenstiel, G.L.; Ruberg, S.A.; Leshkevich, G.A. Satellite Monitoring of Harmful Algal Blooms in the Western Basin of Lake Erie: A 20-Year Time-Series. J. Great. Lakes. Res. 2019, 45, 508–521. [Google Scholar] [CrossRef]
- Osman, M.B.; Coats, S.; Das, S.B.; McConnell, J.R.; Chellman, N. North Atlantic Jet Stream Projections in the Context of the Past 1,250 Years. Proc. Natl. Acad. Sci. USA 2021, 118, e2104105118. [Google Scholar] [CrossRef] [PubMed]
- Ballari, D.; Vilches-Blázquez, L.M.; Orellana-Samaniego, M.L.; Salgado-Castillo, F.; Ochoa-Sánchez, A.E.; Graw, V.; Turini, N.; Bendix, J. Satellite Earth Observation for Essential Climate Variables Supporting Sustainable Development Goals: A Review on Applications. Remote Sens. 2023, 15, 2716. [Google Scholar] [CrossRef]
- Choi, K.T.H. Space, Satellite and Solutions: Essential Climate Variables and the Future of Climate Monitoring from Space. Weather 2018, 73, 390–391. [Google Scholar] [CrossRef]
- Catry, P.; Senhoury, C.; Sidina, E.; El Bar, N.; Bilal, A.S.; Ventura, F.; Godley, B.J.; Pires, A.J.; Regalla, A.; Patrício, A.R. Satellite Tracking and Field Assessment Highlight Major Foraging Site for Green Turtles in the Banc d’Arguin, Mauritania. Biol. Conserv. 2023, 277, 109823. [Google Scholar] [CrossRef]
- Eakin, C.M.; Nim, C.J.; Brainard, R.E.; Aubrecht, C.; Elvidge, C.; Gledhill, D.K.; Muller-Karger, F.; Mumby, P.J.; Skirving, W.J.; Strong, A.E.; et al. Monitoring Coral Reefs from Space. Oceanography 2010, 23, 118–133. [Google Scholar] [CrossRef]
- Rowlands, G.; Brown, J.; Soule, B.; Boluda, P.T.; Rogers, A.D. Satellite Surveillance of Fishing Vessel Activity in the Ascension Island Exclusive Economic Zone and Marine Protected Area. Mar. Policy 2019, 101, 39–50. [Google Scholar] [CrossRef]
- Appleby, T.; Studley, M.; Moorhouse, B.; Brown, J.; Staddon, C.; Bean, E. Sea of Possibilities: Old and New Uses of Remote Sensing Data for the Enforcement of the Ascension Island Marine Protected Area. Mar. Policy 2021, 127, 103184. [Google Scholar] [CrossRef]
- Toonen, H.M.; Bush, S.R. The Digital Frontiers of Fisheries Governance: Fish Attraction Devices, Drones and Satellites. J. Environ. Policy Plan. 2020, 22, 125–137. [Google Scholar] [CrossRef]
- O’Reilly, J.E.; Werdell, P.J. Chlorophyll Algorithms for Ocean Color Sensors—OC4, OC5 & OC6. Remote Sens. Environ. 2019, 229, 32–47. [Google Scholar] [CrossRef]
- Pahlevan, N.; Chittimalli, S.K.; Balasubramanian, S.V.; Vellucci, V. Sentinel-2/Landsat-8 Product Consistency and Implications for Monitoring Aquatic Systems. Remote Sens. Environ. 2019, 220, 19–29. [Google Scholar] [CrossRef]
- Mansaray, A.S.; Dzialowski, A.R.; Martin, M.E.; Wagner, K.L.; Gholizadeh, H.; Stoodley, S.H. Comparing PlanetScope to Landsat-8 and Sentinel-2 for Sensing Water Quality in Reservoirs in Agricultural Watersheds. Remote Sens. 2021, 13, 1847. [Google Scholar] [CrossRef]
- Chang, C.H.; Liu, C.C.; Wen, C.G.; Cheng, I.F.; Tam, C.K.; Huang, C.S. Monitoring Reservoir Water Quality with Formosat-2 High Spatiotemporal Imagery. J. Environ. Monit. 2009, 11, 1982–1992. [Google Scholar] [CrossRef] [PubMed]
- Liu, C.C.; Shieh, C.L.; Lin, J.C.; Wu, A.M. Classification of Non-Vegetated Areas Using Formosat-2 High Spatiotemporal Imagery: The Case of Tseng-Wen Reservoir Catchment Area (Taiwan). Int. J. Remote Sens. 2011, 32, 8519–8540. [Google Scholar] [CrossRef]
- IOCCG Earth Observations in Support of Global Water Quality Monitoring. IOCCG Report Series, No. 17, International Ocean Colour Coordinating Group, Dartmouth, Canada. Reports and Monographs of the International OceanColour Coordinating Group 2018. Available online: https://repository.oceanbestpractices.org/handle/11329/535 (accessed on 12 May 2024).
- Sakuno, Y.; Miño, E.R.; Nakai, S.; Mutsuda, H.; Okuda, T.; Nishijima, W.; Castro, R.; García, A.; Peña, R.; Rodríguez, M.; et al. Chlorophyll and Suspended Sediment Mapping to the Caribbean Sea from Rivers in the Capital City of the Dominican Republic Using ALOS AVNIR-2 Data. Environ. Monit. Assess. 2014, 186, 4181–4193. [Google Scholar] [CrossRef] [PubMed]
- Murakami, H.; Dupouy, C. Atmospheric Correction and Inherent Optical Property Estimation in the Southwest New Caledonia Lagoon Using AVNIR-2 High-Resolution Data. Appl. Opt. 2013, 52, 182–198. [Google Scholar] [CrossRef] [PubMed]
- Aoyama, T. Algorithm for Estimating the Chlorophyll-a Concentrations in Water Areas with Different Qualities from Satellite Data. Remote Sens. Coast. Ocean Land Atmos. Environ. 2010, 7858, 785819. [Google Scholar] [CrossRef]
- Pekel, J.-F.; Cottam, A.; Gorelick, N.; Belward, A.S. High-Resolution Mapping of Global Surface Water and Its Long-Term Changes. Nature 2016, 540, 418–422. [Google Scholar] [CrossRef] [PubMed]
- Coffer, M.M.A.; Schaeffer, B.A.; Urquhart, E.A.; Darling, J.A.; Salls, W.B. A Method for Quantifying the Number of U.S. Lakes with Cyanobacterial Harmful Algal Blooms Using Satellite Remote Sensing. In Remote Sensing and Modeling of Ecosystems for Sustainability XV; SPIE-International Society for Optics and Photonics: California, CA, USA, 2018; Volume 10767, pp. 60–72. [Google Scholar] [CrossRef]
- Kratzer, S.; Therese Harvey, E.; Philipson, P. The Use of Ocean Color Remote Sensing in Integrated Coastal Zone Management—A Case Study from Himmerfjärden, Sweden. Mar. Policy 2014, 43, 29–39. [Google Scholar] [CrossRef]
- Blasiak, R.; Yagi, N. Shaping an International Agreement on Marine Biodiversity beyond Areas of National Jurisdiction: Lessons from High Seas Fisheries. Mar. Policy 2016, 71, 210–216. [Google Scholar] [CrossRef]
- Delfour-Samama, O.; Leboeuf, C. Review of Potential Legal Frameworks for Effective Implementation and Enforcement of MPAs in the High Seas. ICES J. Mar. Sci. 2014, 71, 1031–1039. [Google Scholar] [CrossRef]
- Carr, H.; Abas, M.; Boutahar, L.; Caretti, O.N.; Chan, W.Y.; Chapman, A.S.A.; De Mendonça, S.N.; Engleman, A.; Ferrario, F.; Simmons, K.R.; et al. The Aichi Biodiversity Targets: Achievements for Marine Conservation and Priorities beyond 2020. PeerJ 2020, 8, e9743. [Google Scholar] [CrossRef]
- Home | Marine Protection Atlas. Available online: https://mpatlas.org/ (accessed on 15 May 2024).
- Tin, H.C.; Uyen, N.T.; Hieu, D.V.; Ni, T.N.K.; Tu, N.H.C.; Saizen, I. Decadal Dynamics and Challenges for Seagrass Beds Management in Cu Lao Cham Marine Protected Area, Central Vietnam. Environ. Dev. Sustain. 2020, 22, 7639–7660. [Google Scholar] [CrossRef]
- Prasetya, J.D.; Ambariyanto; Supriharyono; Purwanti, F. Diversity Based Sustainable Management for Seagrass Ecosystem: Assessing Distribution and Diversity of Seagrass in Marine Protected Area. Adv. Sci. Lett. 2017, 23, 2413–2415. [Google Scholar] [CrossRef]
- Zheng, H.; Ma, Y.; Huang, J.; Yang, J.; Su, D.; Yang, F.; Wang, X.H. Deriving Vertical Profiles of Chlorophyll-a Concentration in the Upper Layer of Seawaters Using ICESat-2 Photon-Counting Lidar. Opt. Express 2022, 30, 33320–33336. [Google Scholar] [CrossRef] [PubMed]


Disclaimer/Publisher’s Note: The statements, opinions and data contained in all publications are solely those of the individual author(s) and contributor(s) and not of MDPI and/or the editor(s). MDPI and/or the editor(s) disclaim responsibility for any injury to people or property resulting from any ideas, methods, instructions or products referred to in the content. |
© 2024 by the authors. Licensee MDPI, Basel, Switzerland. This article is an open access article distributed under the terms and conditions of the Creative Commons Attribution (CC BY) license (https://creativecommons.org/licenses/by/4.0/).