Article

Evaluating the Snow Cover Service Value on the Qinghai–Tibet Plateau

1
Observation and Research Station of Eco-Hydrology and National Park by Stable Isotope Tracing in Alpine Region, Gansu Qilian Mountains Ecology Research Center, Key Laboratory of Ecological Safety and Sustainable Development in Arid Lands, Northwest Institute of Eco-Environment and Resources, Chinese Academy of Sciences, Lanzhou 730000, China
2
University of Chinese Academy of Sciences, Beijing 100049, China
3
Institute of County Economic Development & Institute of Rural Revitalization Strategy, Lanzhou University, Lanzhou 730000, China
*
Author to whom correspondence should be addressed.
Remote Sens. 2024, 16(14), 2600; https://doi.org/10.3390/rs16142600
Submission received: 8 June 2024 / Revised: 9 July 2024 / Accepted: 13 July 2024 / Published: 16 July 2024
(This article belongs to the Section Ecological Remote Sensing)

Abstract

:
The Snow Cover Service Value (SCSV) is an important component of the ecological assets of the Qinghai–Tibet Plateau (QTP). Exploring the SCSVs on the QTP is the key to maintaining the functions of climate regulators and Asian water towers, and it is also an important theoretical basis for maintaining the ecological security of ecological barrier areas. Using multi-source data such as daily and monthly observation data sets and related statistical yearbooks, an evaluation framework for the SCSVs on the QTP was constructed for the first time. The results showed that the average annual SCSV of the QTP from 2001 to 2020 was 6.99 trillion yuan, and the average annual climate regulation value was 5.81 trillion yuan, which was the most important SCSV. The Inner Plateau Basin, the Brahmaputra Basin, and the Yangtze Basin had the highest SCSVs, while the Yellow Basin had the lowest unit SCSV, where it was the most vulnerable area of snow cover resources on the QTP, and the SCSV of the Yellow Basin was significantly correlated with rainfall. The correlation between the SCSV and the temperature in the Indus and Ganges Basins was significant. The freshwater supply value of the snow in the Indus Basin and Tarim Basin was found to be able to reach 30% of the whole year in June, where it would be necessary to pay attention to the risk of flooding caused by snowmelt during the melting period. Finally, this paper discussed the strategies for the protection and development of snow resources in each basin based on the spatial distribution characteristics, seasonal variation characteristics, and influencing factors of the SCSVs. The research can provide reference for the rational allocation of snow resources and ecological protection on the QTP.

Graphical Abstract

1. Introduction

As an important part of the global cryosphere, snow cover interacts with and is influenced by other geospheres, and it plays an important role in global hydrology, surface temperature, and energy balance [1]. Snow cover constitutes a crucial water resource, pivotal for the economic development of oases and the stability of ecosystems in arid regions, with more than one-sixth of the world’s population depending on melted ice and snow for their drinking water [2]. It has been estimated that 60% of the population relies on snowmelt water for agricultural irrigation, and as the temperature rises in the future, agricultural production will become more dependent on snowmelt water [3]. In the Himalayan watershed on the Qinghai–Tibet Plateau, more than 50% of runoff comes from seasonal snowmelt [4]. In terms of air temperature, as the snow cover diminishes, the surface albedo decreases accordingly, thereby enhancing the ground’s absorption of solar energy, which, in turn, leads to an increase in temperature. When the snow depth is greater than 10 cm, snow cover can cause the daily maximum (low) temperature to drop by 4.5 °C (2.6 °C) [5]. However, when the snow cover decreases, the surface albedo correspondingly decreases significantly [6], and the decrease in snow albedo leads to an increase in surface temperature of more than 10 °C in spring in high-latitude land areas [7]. In addition, snow cover also provides social and cultural services for human beings, such as aesthetics and entertainment, scientific research, environmental education, religion and culture, etc. [8]. From 4500 to 5000 years ago, ice and snow tourism appeared in Norway, Finland, Sweden, Russia, and other countries [9]. In 2021, the number of people participating in ice and snow entertainment in China reached 254 million [10], indicating that residents’ interest in ice and snow recreation is increasingly growing and demonstrating the significant economic benefits that winter sports can generate.
In recent years, the scarcity of ice and snow resources has increased and the degradation of snow cover has become a more serious issue on a global scale [11], as the maximum snow depth continues to decrease [12] and the water equivalent of snow cover has changed significantly [13]. Studies have shown that temperature is highly sensitive to changes in some snow characteristics, such as snowfall, snowmelt, and snow temperature. [14,15,16]. In warm, arid regions that depend on the winter snow for their water supply due to the challenging climate, the trend towards snow cover reduction is of considerable concern [17]. It is estimated that by the middle and late 21st century, the daily snowfall will decrease by 8%, while the average snowfall will decrease by 65% [18]. The melting or even disappearing of snow cover has had extensive and profound negative impacts on the economic and social systems [19,20]. Therefore, there is an increasing demand for effective management of dwindling snow cover service value, and it is necessary to explore the changes in snow cover service value and its service functions in order to provide better management decisions.
Ecosystem service value (ESV) refers to the benefits that humans derive directly or indirectly from ecosystems [21]. This primarily includes the provision of useful materials and energy to the economic and social systems, the reception and transformation of waste generated by these systems, and the direct provision of services to the members of human society. There are many studies on the ESVs of oceans, forests, deserts, and grasslands [22,23,24,25]. However, early research on the ESV did not quantify the value of snow cover services, which may be attributed to the fact that, compared to other ecosystems, the snow cover ecosystem is not a steady-state system and exhibits significant seasonal variations. Moreover, the measurement of changes in SCSVs is complex, and a mature evaluation framework has not yet been established. Until 2015, the theoretical framework of cryosphere function and service was not proposed [8]. Recently, some researchers assessed the ESVs provided by glaciers in the Tianshan Mountains of China by analyzing the changes in glacier area and volume [26]. Some studies have also established the glacier service value and its changes in the Three River Source Region by constructing an evaluation system that combined the glacier volume equation, service price per unit area, and inflation rate [27]. However, there has been little research on the SCSVs. On the watershed scale, some researchers estimated the value and loss of snow cover by calculating the amount of change in snow mass and estimated that the annual loss of the SCSV in the Irtysh River Basin was about 196 million yuan [28]. The high albedo of snow cover and its heat absorption during the melting process in spring and summer significantly reduced the heat absorbed by the ground thus providing an essential climate regulation service to humanity; some researchers calculated that the climate service value of snow cover could reach 3.9 (±2.1) trillion yuan by analyzing the radiative forcing of snow cover in China [29].
This research utilized multi-source data including daily and monthly remote sensing observations of snow characteristics as well as social statistical yearbooks to calculate and analyze the spatiotemporal distribution characteristics of the SCSV and its influencing factors on the QTP. This study aimed to contribute to the effective management and sustainable use of snow cover resources in light of climatic changes and increasing human demands. To systematically address the research aims, we proposed the following specific research questions: 1) What are the temporal and spatial characteristics of SCSVs in different basins of the QTP? 2) What are their main influencing factors? 3) How to develop and utilize the snow resources on the QTP? The answers to these questions would provide a theoretical foundation for developing an evaluation system that links snow cover with the ecological environment and socioeconomic benefits.

2. Study Area

The Qinghai–Tibet Plateau (26°00′–39°47′N, 73°19′–104°47′E), covering an area of approximately 2.5 million km2 and with elevations ranging from 4000 to 5000 m, is the largest plateau and the highest in China, known as “the roof of the world” and “the third pole” (Figure 1). The QTP is characterized by a landscape that is heavily populated with numerous mountains and rivers, the terrain is steep and changeable, the climate fluctuates between dry and wet, the winter is long and dry, and the summer is warm and rainy. The annual average temperature is between −5 and 15.5 °C, decreasing from southeast to northwest [30]. The plateau enjoys abundant sunshine, with annual total sunshine hours of between 2500 and 3200 [31], and there is an abundance of snow and glaciers all year round, where the meltwater of the ice and snow is the main source of runoff in the upper reaches of many large rivers in the region [32]. Snowfall distribution indicates that the southern windward slope, where cold and warm air flows meet, receives more snow, whereas the northern leeward slope receives less [33]. The number of snow days showed a spatial distribution pattern of more snow days in the central eastern, southwestern, and northeastern margins of the plateau, with fewer snow days in the southern valleys and northern lake basins [34]. In recent years, the snow cover area on the QTP has shown a shrinking trend, and studies have shown that the daily reduction rate of snow cover in this area has reached 1–3 d/10 a [35], with the reduction amounting to 55.3% of the total area of the region [36].

3. Data and Methods

3.1. Data Sources

The raster data and sources in this paper are listed in Table 1. Due to the large scale of the QTP, which covers an area of 2.5 million km2, the raster data in this study were uniformly processed and adopted a resolution of 1 km. Statistical data such as population, GDP, tourism income, Engel coefficient, and scientific research funding came from official statistical bulletin and website.

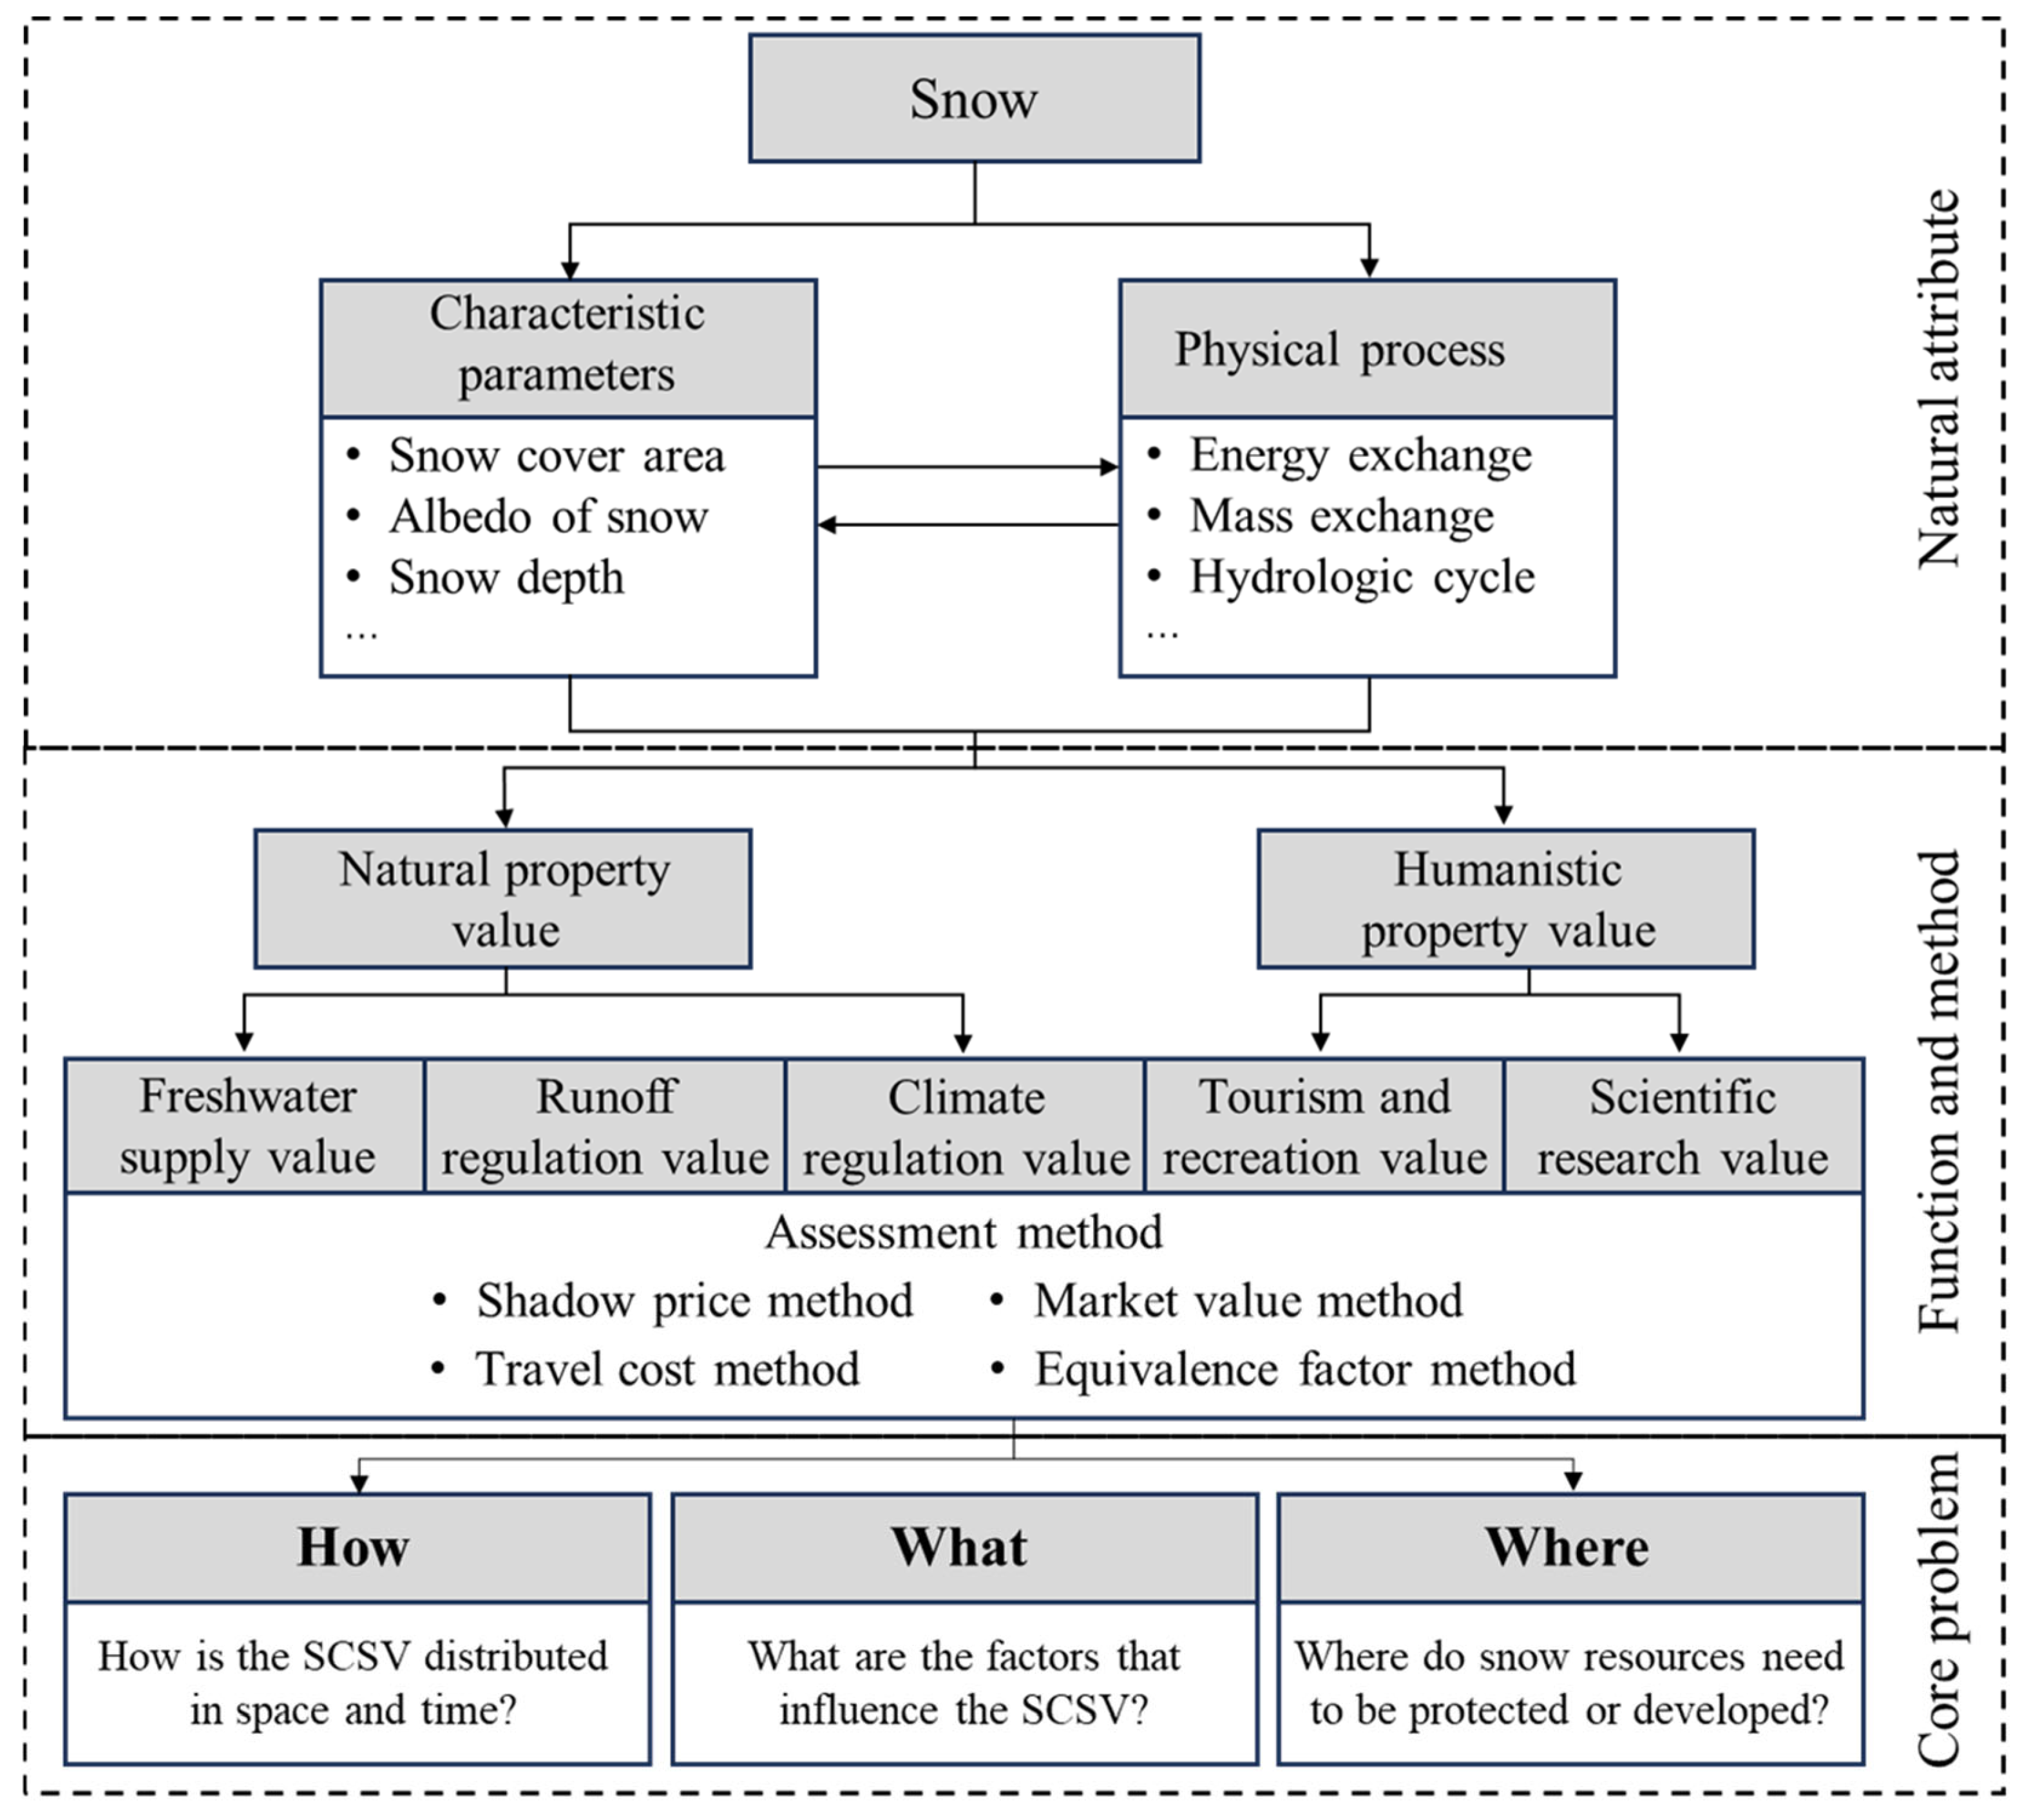
3.2. Evaluation System of Snow Cover Service Value

Compared with other environmental elements, the salient features of snow cover are high albedo, high thermal insulation, and existence in the form of solid water. The snow cover accumulation process includes complex feedback processes such as energy exchange, material exchange, and water cycle, which play an important regulatory role in the earth system at different scales. These are the characteristics and processes that endow snow cover with service functions and values. Thus, we referred to the cryosphere service function framework [8] and summarized the service function value of snow cover into natural property value and humanistic property value according to whether it was naturally generated or benefited by human active participation. The value of natural generation was provided by the characteristic attributes of snow cover as follows: snowmelt provided the freshwater supply value (FSV); the existing solid snow was regarded as a huge reservoir, which could regulate the hydrological cycle and provide the runoff regulation value (RRV); and the strong albedo of the snow cover reduced the accumulated surface temperature, improved the regional climate environment, and thus provided the climate regulation value (CRV). The humanistic property value encompassed the functional benefits obtained by human activities from snow environmental elements. For example, snow landscape and entertainment, as well as leisure activities, provided the tourism and recreation value (TRV); and scientific investigations and theoretical studies related to snow cover provided scientific research value (SRV). Finally, it was necessary to pay attention to the core problems of the SCSVs in the three aspects of “how”, “what”, and “where”. Continuous exploration of these three core problems would help to clarify the socioeconomic benefits of snow cover and other ecosystem, as well as provide a scientific basis for coping with future climate change and better managing the QTP for policy makers (Figure 2).
For some economic terms uncommon in the field of remote sensing or first appearing in this article, Appendix A (Table A1) provides detailed explanations and definitions for each of these terms.

3.3. Assessment Methods Snow Cover Service Value

We mainly used the shadow price method, market value method, travel cost method and equivalent factor method to evaluate the snow cover service values on the QTP. Table 2 shows the specific calculation formulas, parameters, and calculation basis of the five SCSVs.

4. Results

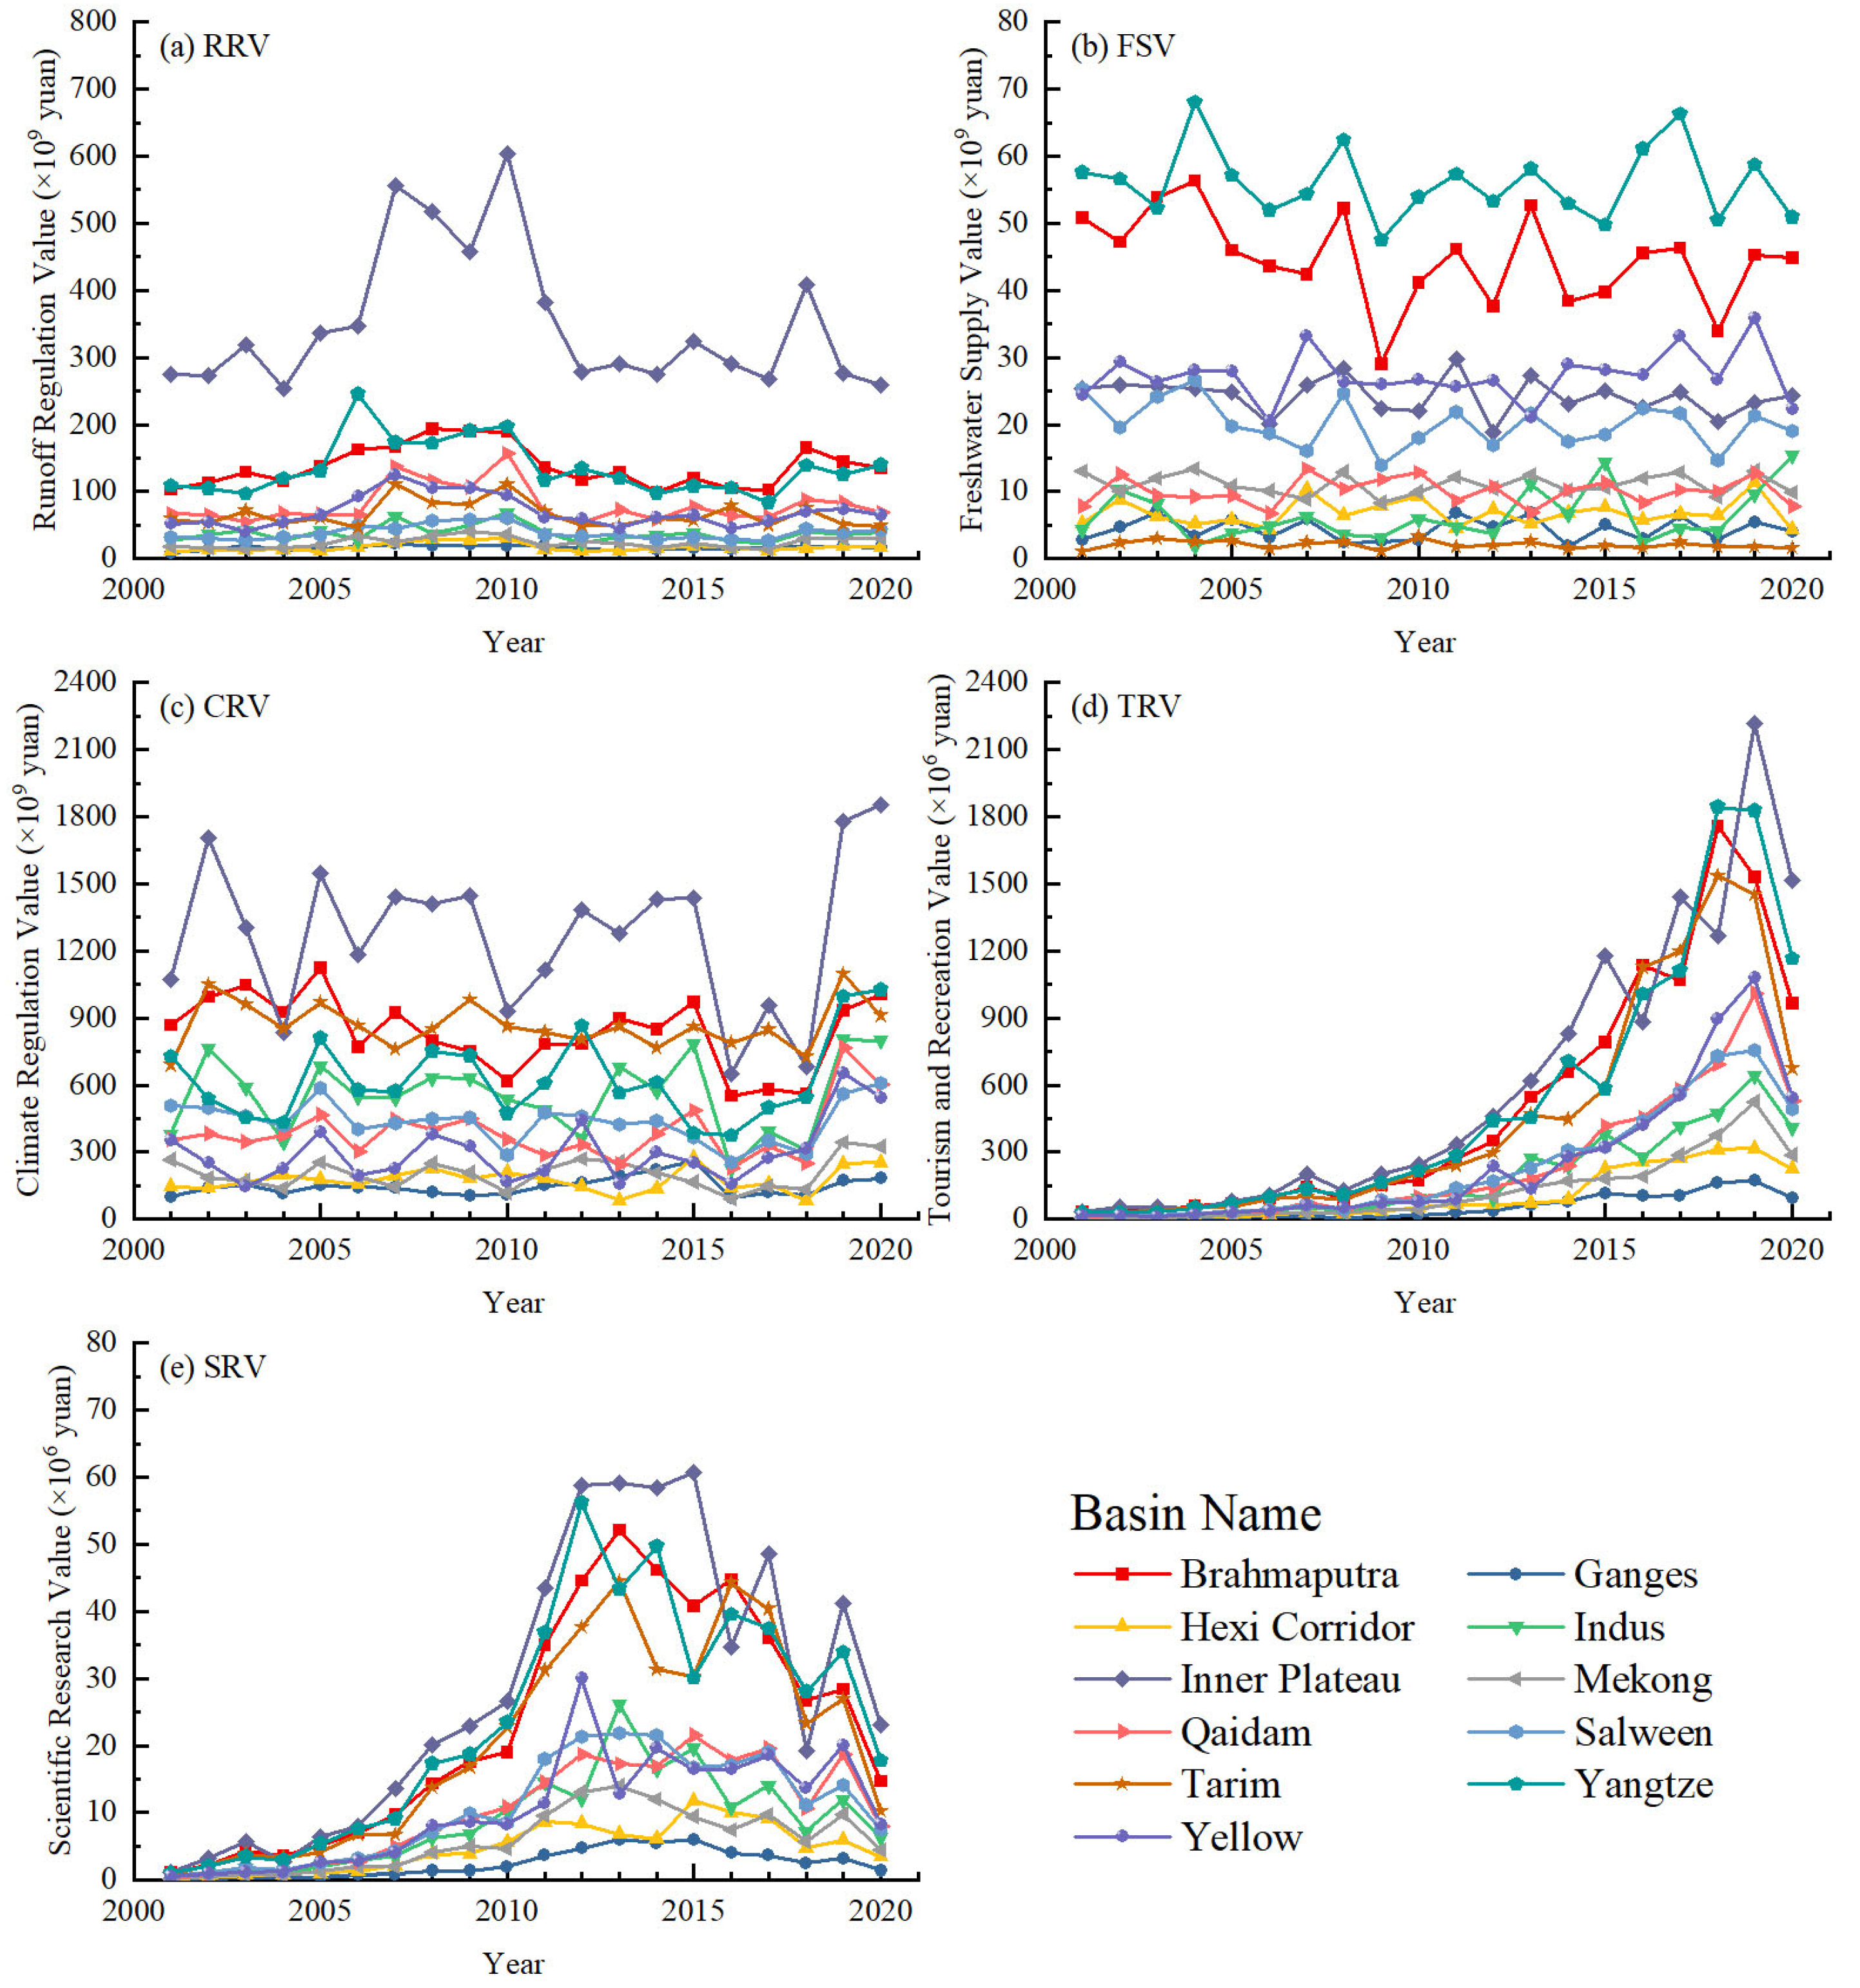
4.1. Temporal Variation of the Snow Cover Service Value

Throughout the two decades from 2001 to 2020, the QTP exhibited significant temporal variations in the values of snow cover services, with an annual average total of 6.99 trillion yuan. The annual average total change in SCSV was a decrease of 51.96 million yuan per year, primarily due to a significant reduction in the freshwater supply value of snow cover on the QTP. These values were distributed unevenly across different service categories, where climate regulation led with an annual value of 5.81 trillion yuan, highlighting its essential role in moderating regional climate. In contrast, the more modest figures for tourism and recreation (3.24 billion yuan) and scientific research (146 million yuan) underscored their localized yet crucial contributions to the region’s ecosystem services (Table 3).
The analysis of different basins unveiled distinct roles in the ecosystem services provided by snow cover. The Inner Plateau Basin, the largest on the QTP, not only posted the highest average annual runoff regulation value at 349.25 billion yuan but also showcased the unique geographical and climatic conditions that support such ecosystem services [54]. Conversely, the Brahmaputra and Yangtze Basins, with their greater seasonal temperature fluctuations, exhibited higher values for freshwater supply (44.66 billion yuan and 56.02 billion yuan, respectively), attributable to quicker snowmelt processes. These variations were pivotal for understanding the regional water resource management strategies. Additionally, the Inner Plateau Basin and the Tarim Basin, being more arid and cloud-free, effectively harnessed their extensive snow-covered areas to reflect solar radiation [40] and thus their significant contributions to climate regulation, valued at 1272.56 billion yuan and 866.48 billion yuan annually (Figure 3).
From the perspective of changing trends, the runoff regulation value, freshwater supply value, and climate regulation value of each river basin have shown a fluctuating downward trend. The shrinkage of the snow cover area on the QTP in the past 20 years has led to a decline in the natural property value of snow cover, and this trend may continue in the future and pose a serious threat to the ecological security of the QTP. On the other hand, the tourism and recreation value in each basin has increased exponentially, indicating the growing interest of residents in ice and snow entertainment, a trend that underscores the increasingly significant economic benefits derived from snow-related activities. In addition, although the scientific research value maintained a high growth trend like the tourism and recreation value before 2010, it has increased in the past 10 years (Figure 3).

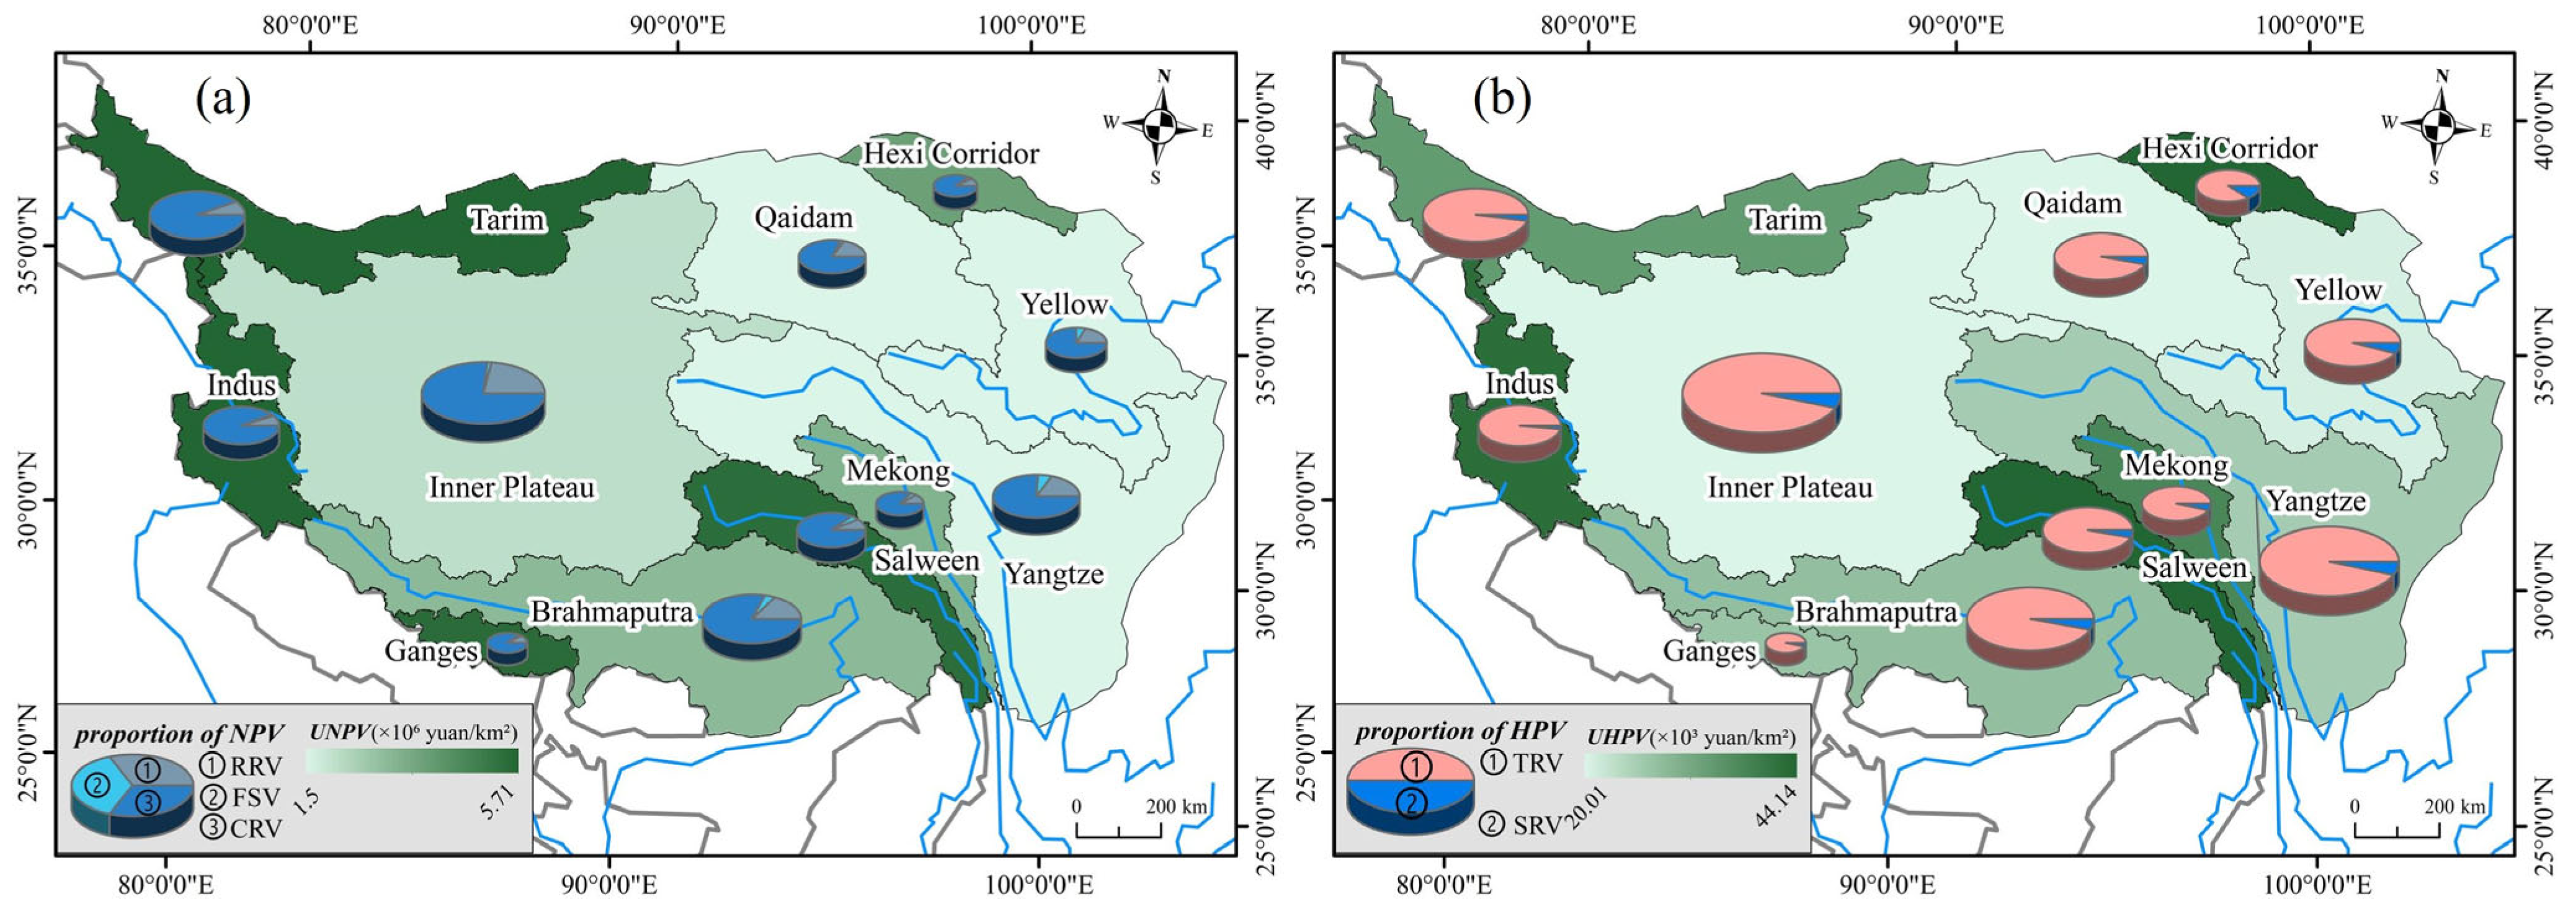
4.2. Spatial Variation of the Snow Cover Service Value

From the perspective of spatial distribution, the unit natural property value of snow cover is generally in a distribution pattern with more in the west and less in the east. This may be related to the terrain of the QTP, which is higher in the west and lower in the east, because most precipitation in high-elevation areas falls in the form of snow. The ratio of the runoff regulation value, freshwater supply value, and climate regulation value in the natural property value of the QTP is about 14.4%:3%:82.6%. The runoff regulation value, freshwater supply value and climate regulation value of the Inner Plateau Basin, Yangtze Basin and Tarim Basin have the highest comparative advantages in their respective regions, accounting for 22.01%, 7.02% and 92.59% of the natural property value, respectively. The unit natural property value of the QTP is 2.6 million yuan/km2. At the basin scale, the Indus Basin has the highest unit natural property value, which is 5.71 million yuan/km2, and the lowest is the Yellow Basin, which is 1.51 million yuan/km2. The unit natural property value in other basins from high to low is as follows: Tarim > Ganges > Salween > Hexi Corridor > Mekong > Brahmaputra > Inner Plateau > Qaidam > Yangtze. It is worth noting that areas with higher unit natural property value also have a relatively higher proportion of climate regulation value (Figure 4a).
The average annual unit humanistic property value of the QTP is 25,860 yuan/km2, and the ratio of regional tourism and recreation value to scientific research value is approximately 95.7%:4.3%. The Salween Basin and the Hexi Corridor Basin have the highest unit humanistic property value, at 44,140 yuan/km2 and 40,300 yuan/km2, respectively. The Salween Basin is rich in snow tourism resources. There are more than 20 snow peaks above 4000 m. It is also a gathering place for Chinese national culture. The high humanistic property value in the Hexi Corridor Basin may be related to the high intensity of human activities in the area, where it is an important node on the Silk Road and a bridge connecting China and Central Asia, offering comparative advantages in tourism, culture, scientific research, and politics due to its unique geographical location. The unit humanistic property values in the Qaidam Basin and the Inner Plateau Basin are the lowest, at 20,010 yuan/km2 and 20,440 yuan/km2, respectively. This may be related to the fact that the two regions are deeply inland, with vast land and sparsely populated areas (Figure 4b).

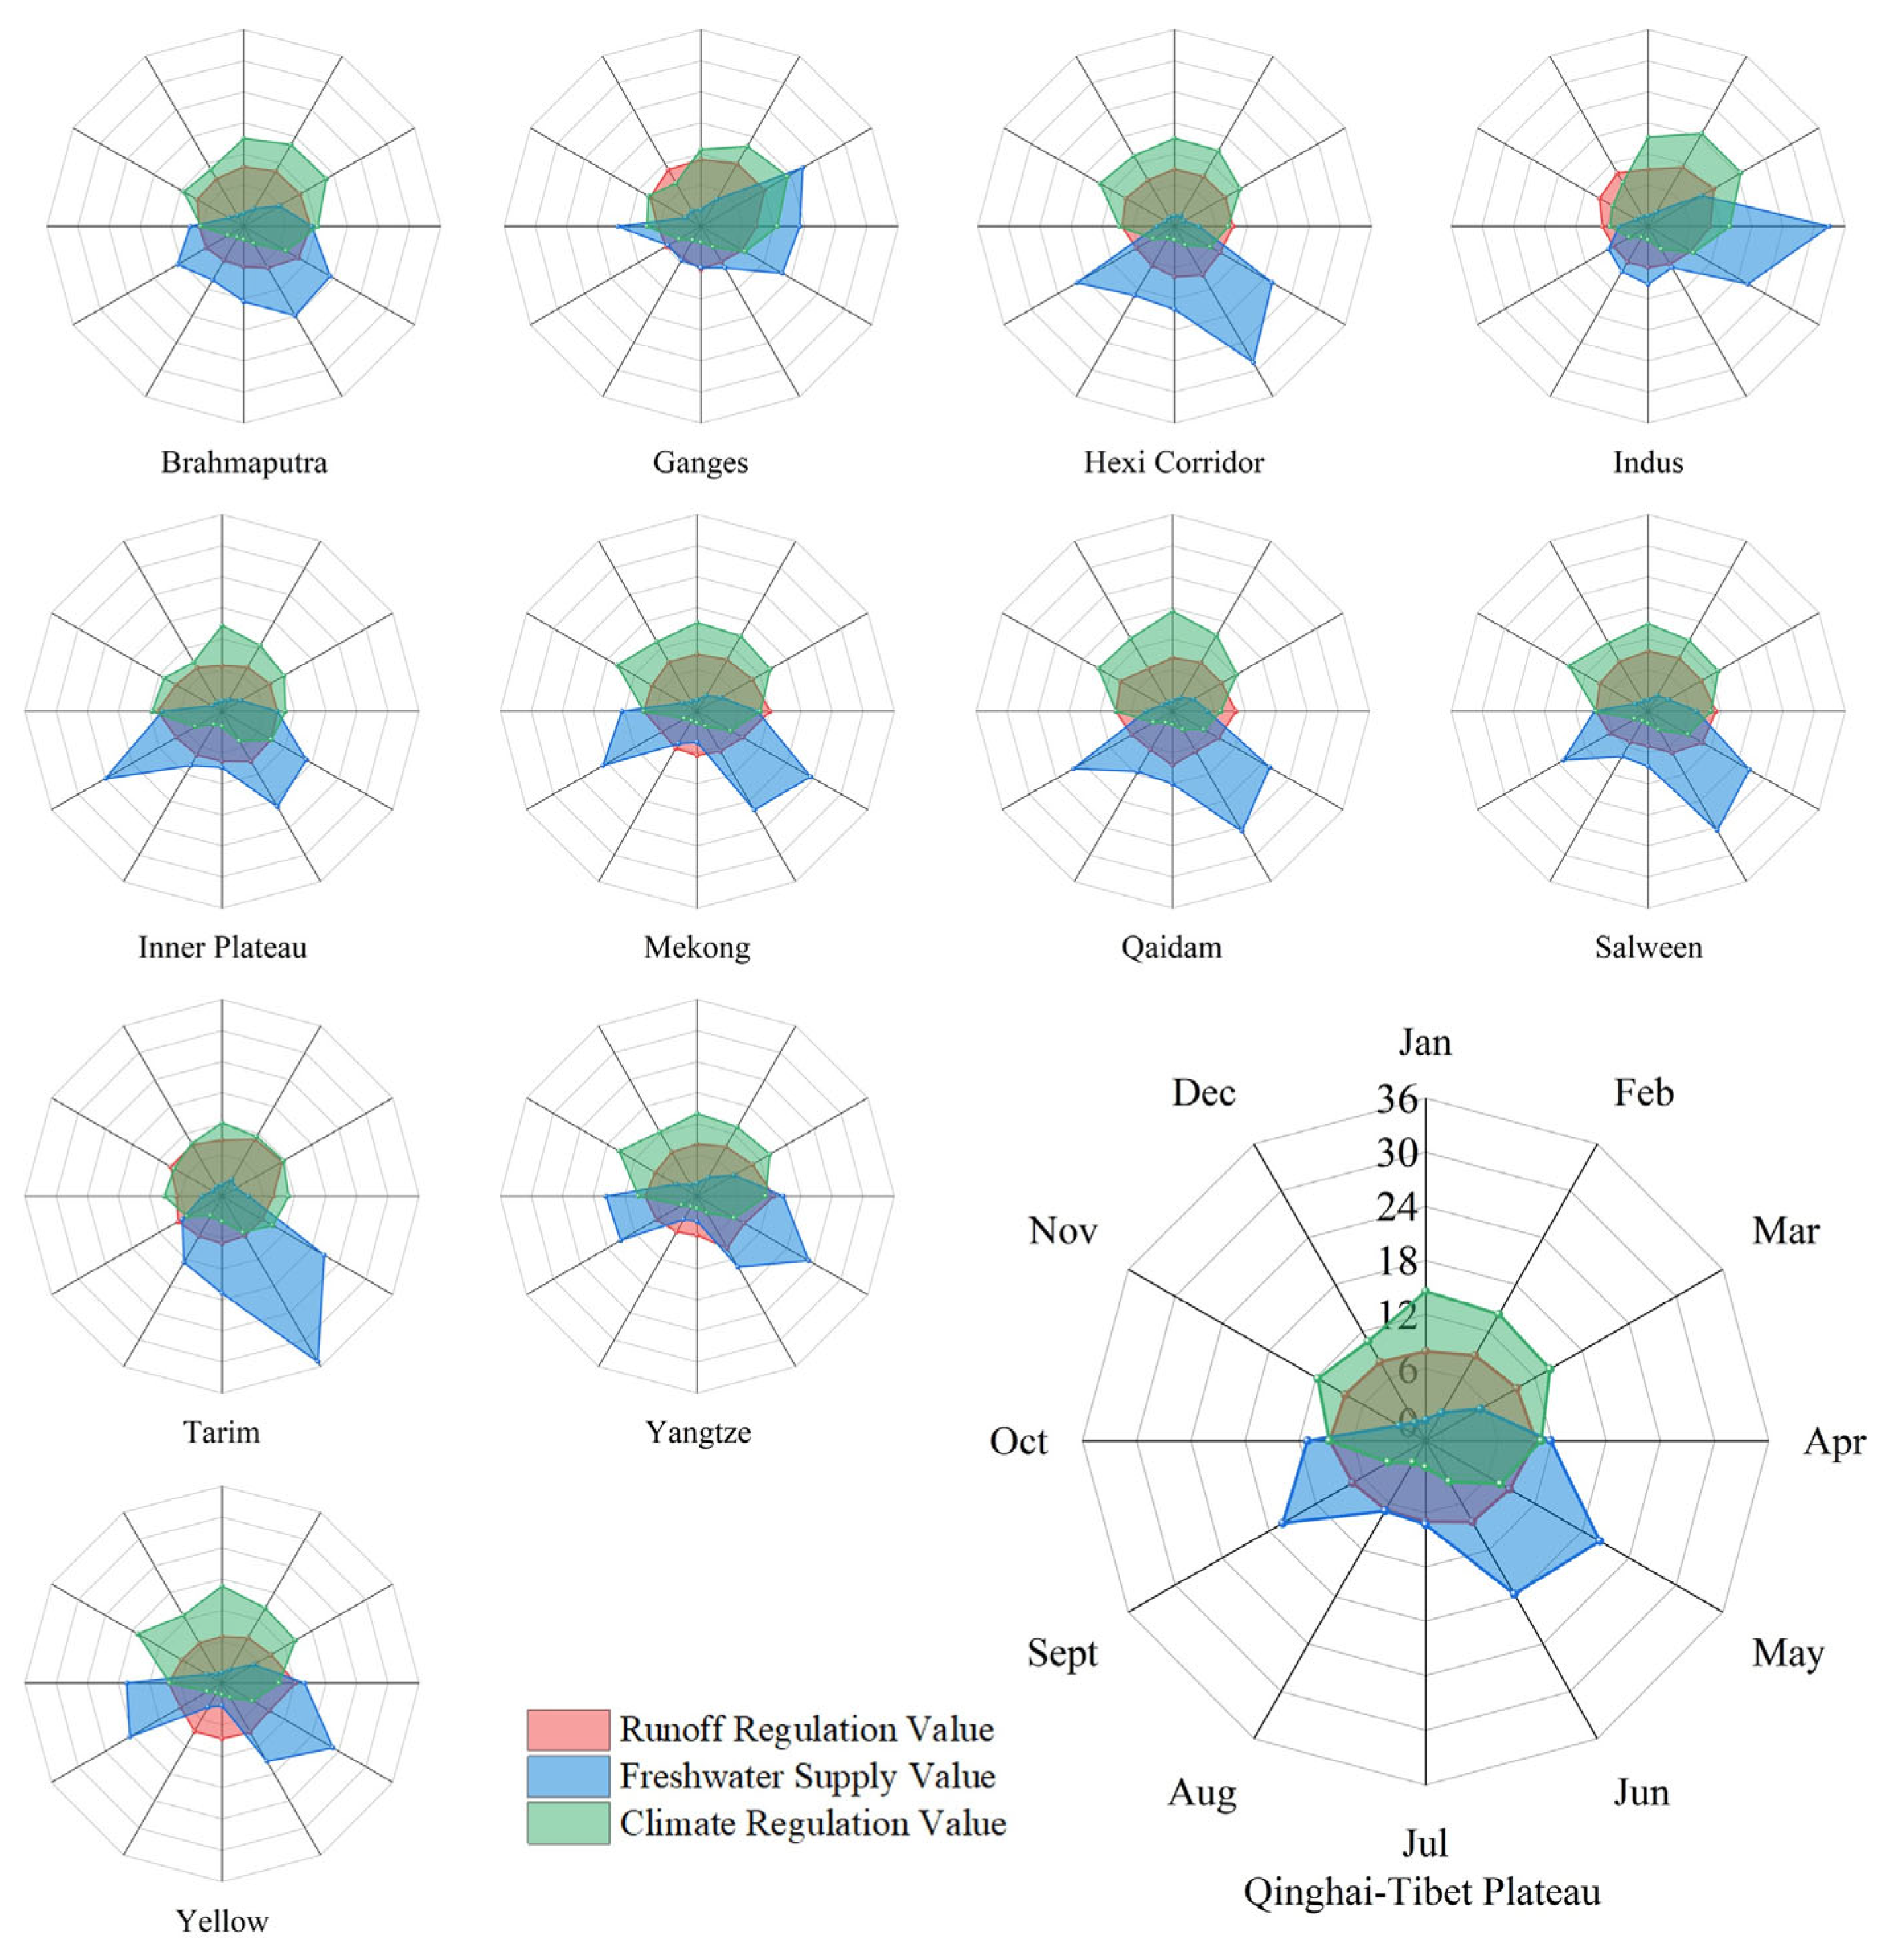
4.3. Monthly Variation in Snow Cover Service Value

Compared to other ecosystems, the dynamics of snow cover change are particularly pronounced, making it crucial to discuss the monthly variations in SCSVs. Snow cover has a freezing period and a melting period, and the snow cover on the plateau is mainly concentrated from October to May of the following year [55], making the changes in the SCSVs on a time scale more significant. It is difficult to quantify changes in the humanistic property value of snow cover on a monthly scale, so this study only quantified monthly changes in the natural property value of snow cover. The results show that the high-value period of freshwater supply value is concentrated from April to October, and the high-value period of climate regulation value is concentrated from October to May of the following year, which is opposite to the change trend of the freshwater supply value, while the runoff regulation value is relatively stable. The runoff regulation value is affected by snow reserves. Snow cover on the QTP is mostly distributed in mountains with low temperatures and high elevation, and solid form all year round. The period when the freshwater supply value of the snow cover is relatively high coincides with the melting period, and the period when the climate regulation value is concentrated in the freezing period. Therefore, the growth of snow cover during the freezing period contributes to regional climate regulation, and the growth of snow cover during the melting period may increase the regional freshwater supply in a short period of time. The monthly distribution of the natural property value of snow cover in each basin differs significantly, and the instability of the runoff regulation value of snow cover is particularly high. For example, the freshwater supply value of the Indus Basin reaches its peak in April, and that of the Tarim Basin in June, and the freshwater supply value in the peak month accounts for more than 30% of the total annual value. These two regions need to pay special attention to the risk of flooding caused by seasonal snowmelt. In addition, the high value range of freshwater supply value of the Ganges Basin begins in March, while the Inner Plateau Basin, Mekong Basin, Qaidam Basin, and Salween Basin begin in May. In particular, the high-value period of freshwater supply value in the Qaidam Basin is only from May to September (Figure 5).

4.4. Comparison of Different Ecosystem Services Value

The QTP has diverse ecosystems, including snow cover, glacier, forest, grassland, wetland, and urban area. These ecosystems constitute a regional composite ecosystem, which are interdependent and mutually restrictive. We counted the proportion of various ecosystems service values in different regions of the QTP in recent years. Although the evaluation indicators of the ecosystem service value in each study are different, and there are certain limitations in the comparison of the contribution rates of different types of various ecosystems services, these ecosystems share the similar alpine characteristics of the QTP, providing a basis for evaluating the contribution of ecological service value by different ecosystems. The runoff regulation/water conservation and climate regulation have comparative advantages in this composite ecosystem on the QTP, demonstrating that the important climate regulator function and the function of the “Asian water tower” of the QTP are the result of the joint action of various ecosystems. The sum of the contribution rates of runoff regulation/water conservation and climate regulation in snow cover, glacier, forest, grassland, wetland, and urban area accounts for 96.94%, 93.84%, 26.72%, 50.68%, 78.24% and 41.57%, respectively, especially for the snow cover and glacier ecosystems; the sum of these two types of contribution rates is relatively high, with both above 93.84%. Since snow cover has diurnal and seasonal variation characteristics, it would be significantly underestimated if the unit service value of snow cover was calculated based on the total area of the QTP and compared with the unit ecosystem service value of other ecosystems; in this way, the value would be 2.64 million yuan/km2. In order to enhance the comparability of the snow cover ecosystem service value with other ecosystem service values, the unit snow cover service value was calculated based on the area of perennial snow cover areas on the QTP, and the result was 23.34 million yuan/km2. Thus, the order of unit ecosystem service value different ecosystems on the QTP is as follows: snow cover ecosystem (23.34 million yuan/km2) > glacier ecosystem (15.24 million yuan/km2) > wetland ecosystem (12.5 million yuan/km2) > urban area ecosystem (7.76 million yuan/km2) > forest ecosystem (7.47 million yuan/km2) > grassland ecosystem (973,900 yuan/km2). The snow cover ecosystem not only has complete service functions like other ecosystems, but also has the highest unit ecosystem service value, especially the contribution rate of the climate regulation value and runoff regulation value of snow cover is as high as 96.94% (Table 4).

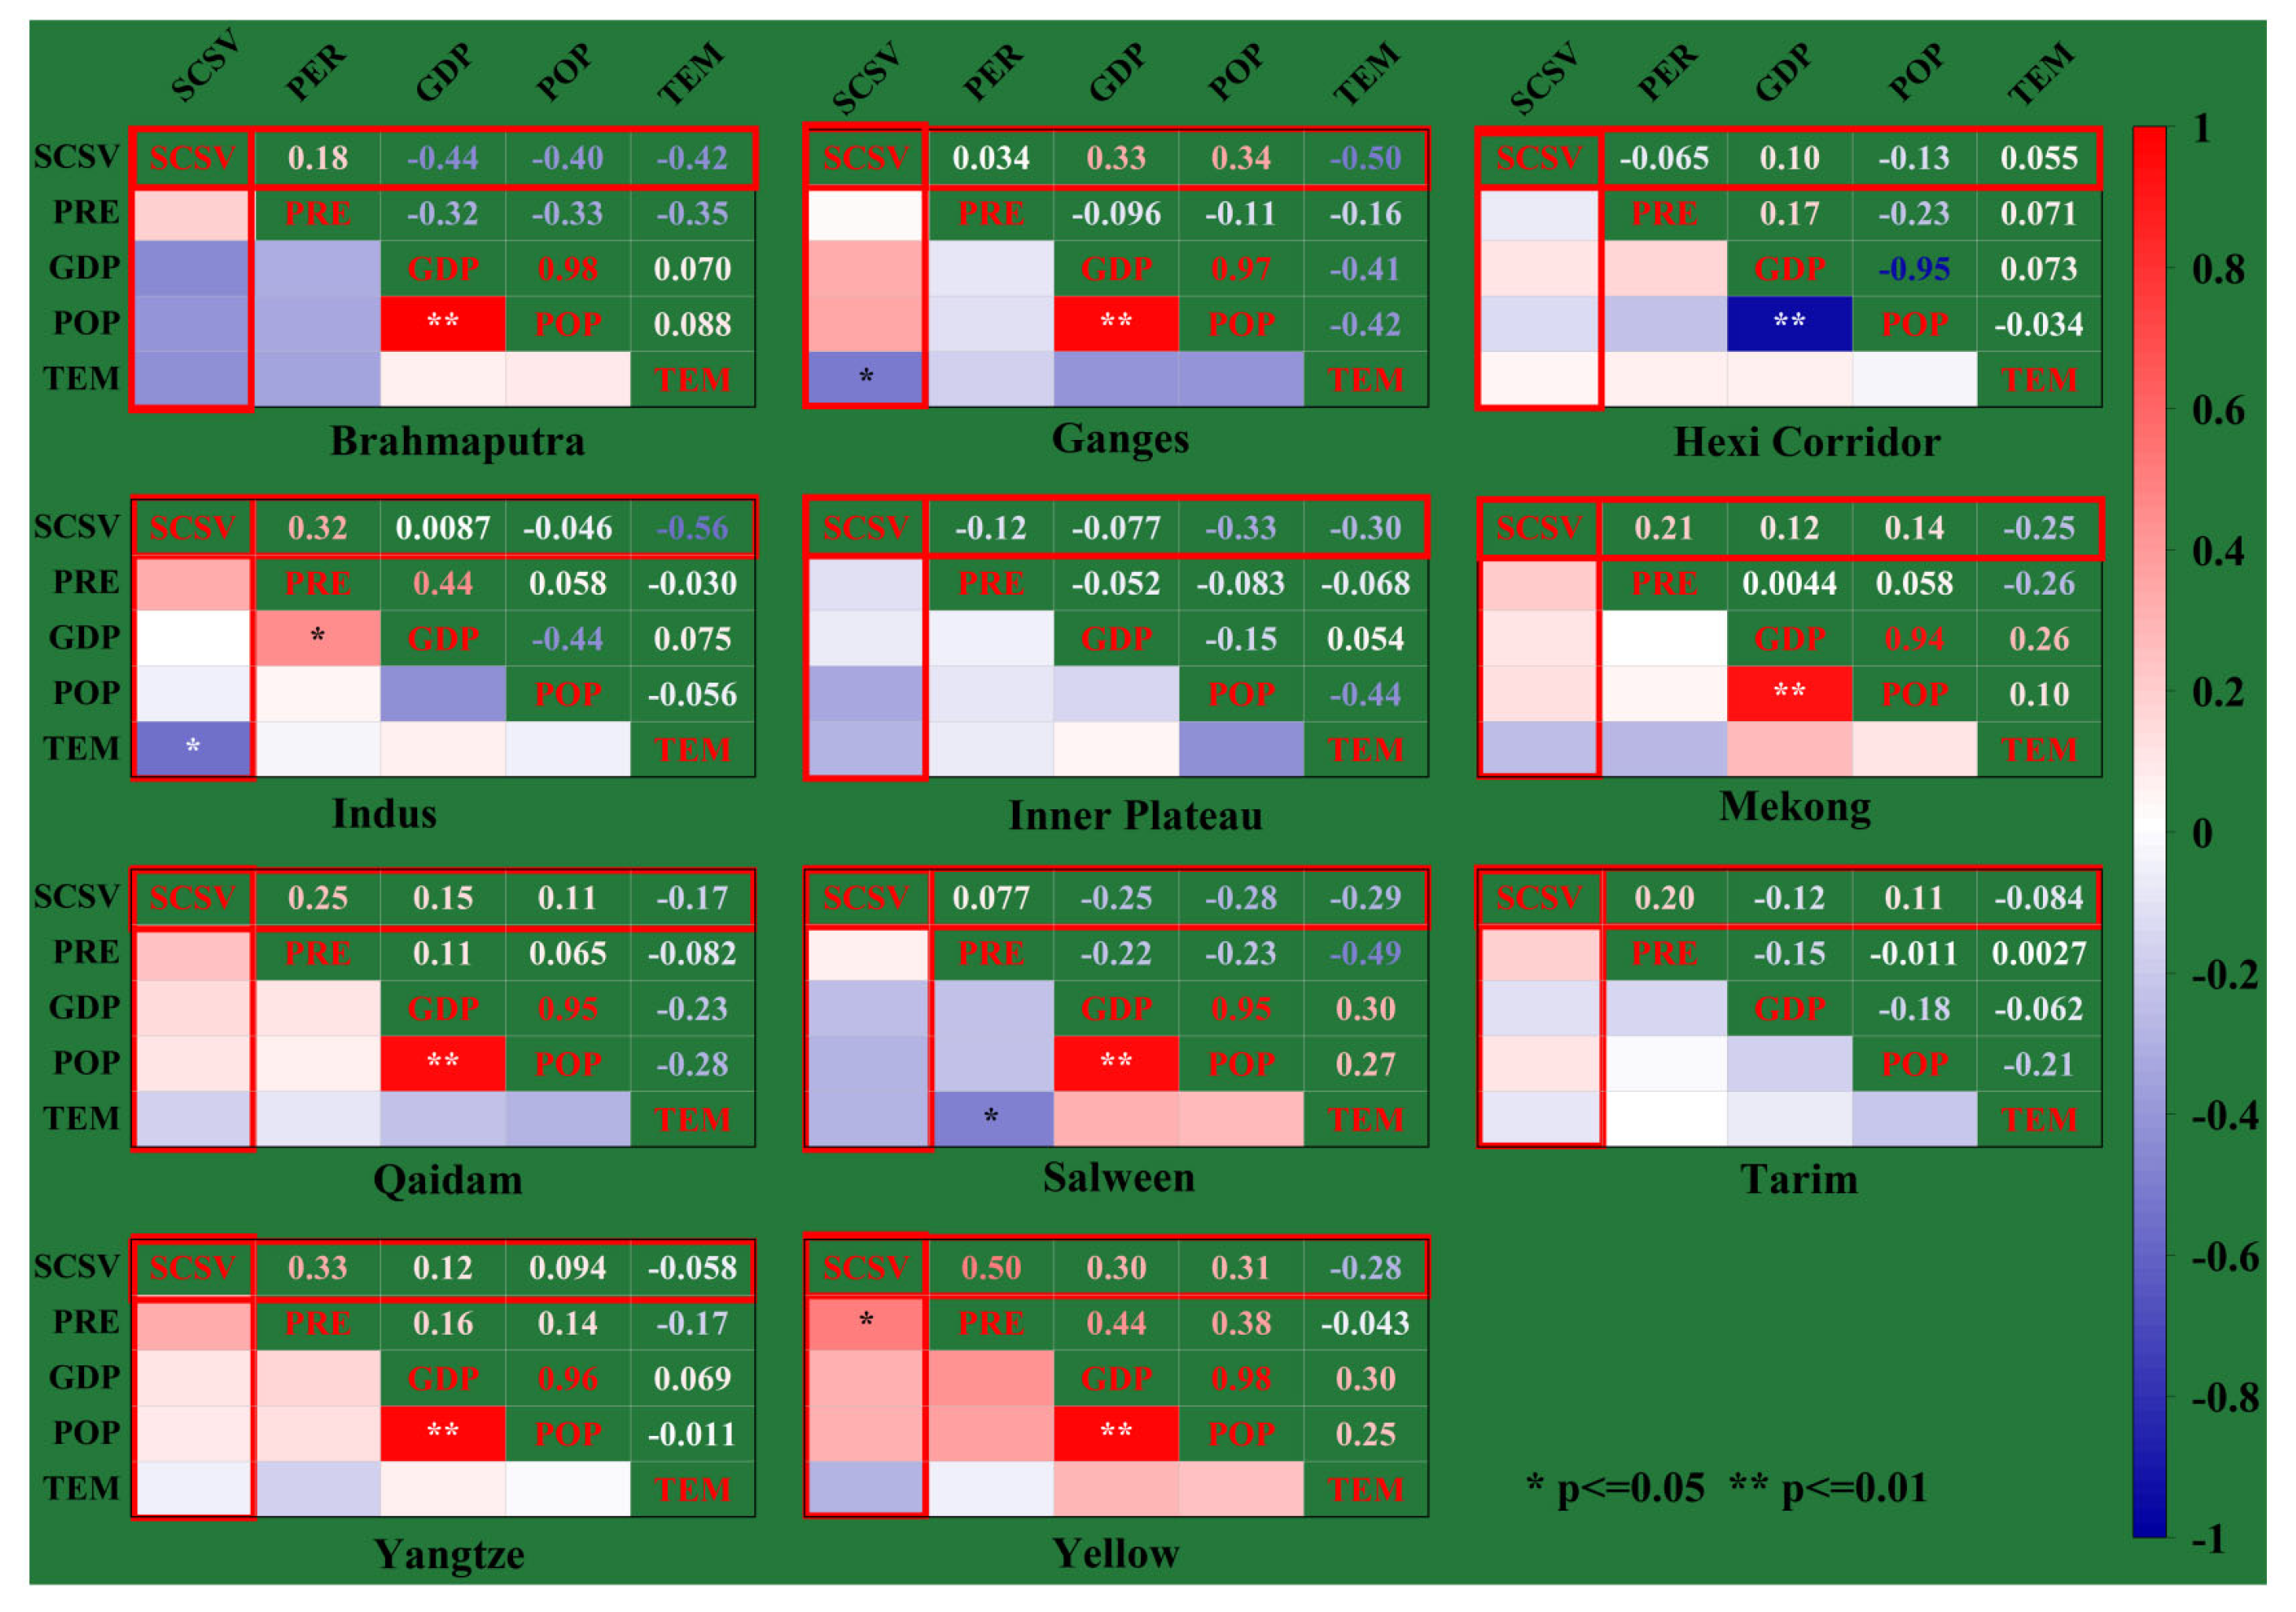
4.5. Influencing Factors of Snow Cover Service Value

In most basins on the QTP, SCSV is positively correlated with precipitation and negatively correlated with temperature. There is a significant correlation between the SCSV and precipitation in the Yellow Basin (p < 0.05), thus this region needs to be alert to the risk of snow cover degradation caused by drought. The correlation between the SCSV and temperature in the Ganges Basin and the Indus Basin is significant (p < 0.05), indicating that the snow cover in these two regions is highly sensitive to temperature changes. Under the background of future climate warming, these two regions may become the areas with the most severely degraded SCSVs on the QTP. The population and economy can reflect the impact of human activities on changes in SCSV to a certain extent. The correlation among the SCSVs, GDP, and population in the Brahmaputra Basin, Inner Plateau Basin, and Salween Basin is negative, indicating that human activities in this region may crowd out snow cover resources. While the correlation between the SCSVs, GDP, and population in the Ganges Basin and Yellow Basin is positive, the correlation between the SCSVs, GDP, and population in the other basins is not significant. For most regions, although population and GDP develop in tandem, the rapid growth of GDP and population also causes the occupation of snow cover resources, which requires sufficient attention (Figure 6).

5. Discussion

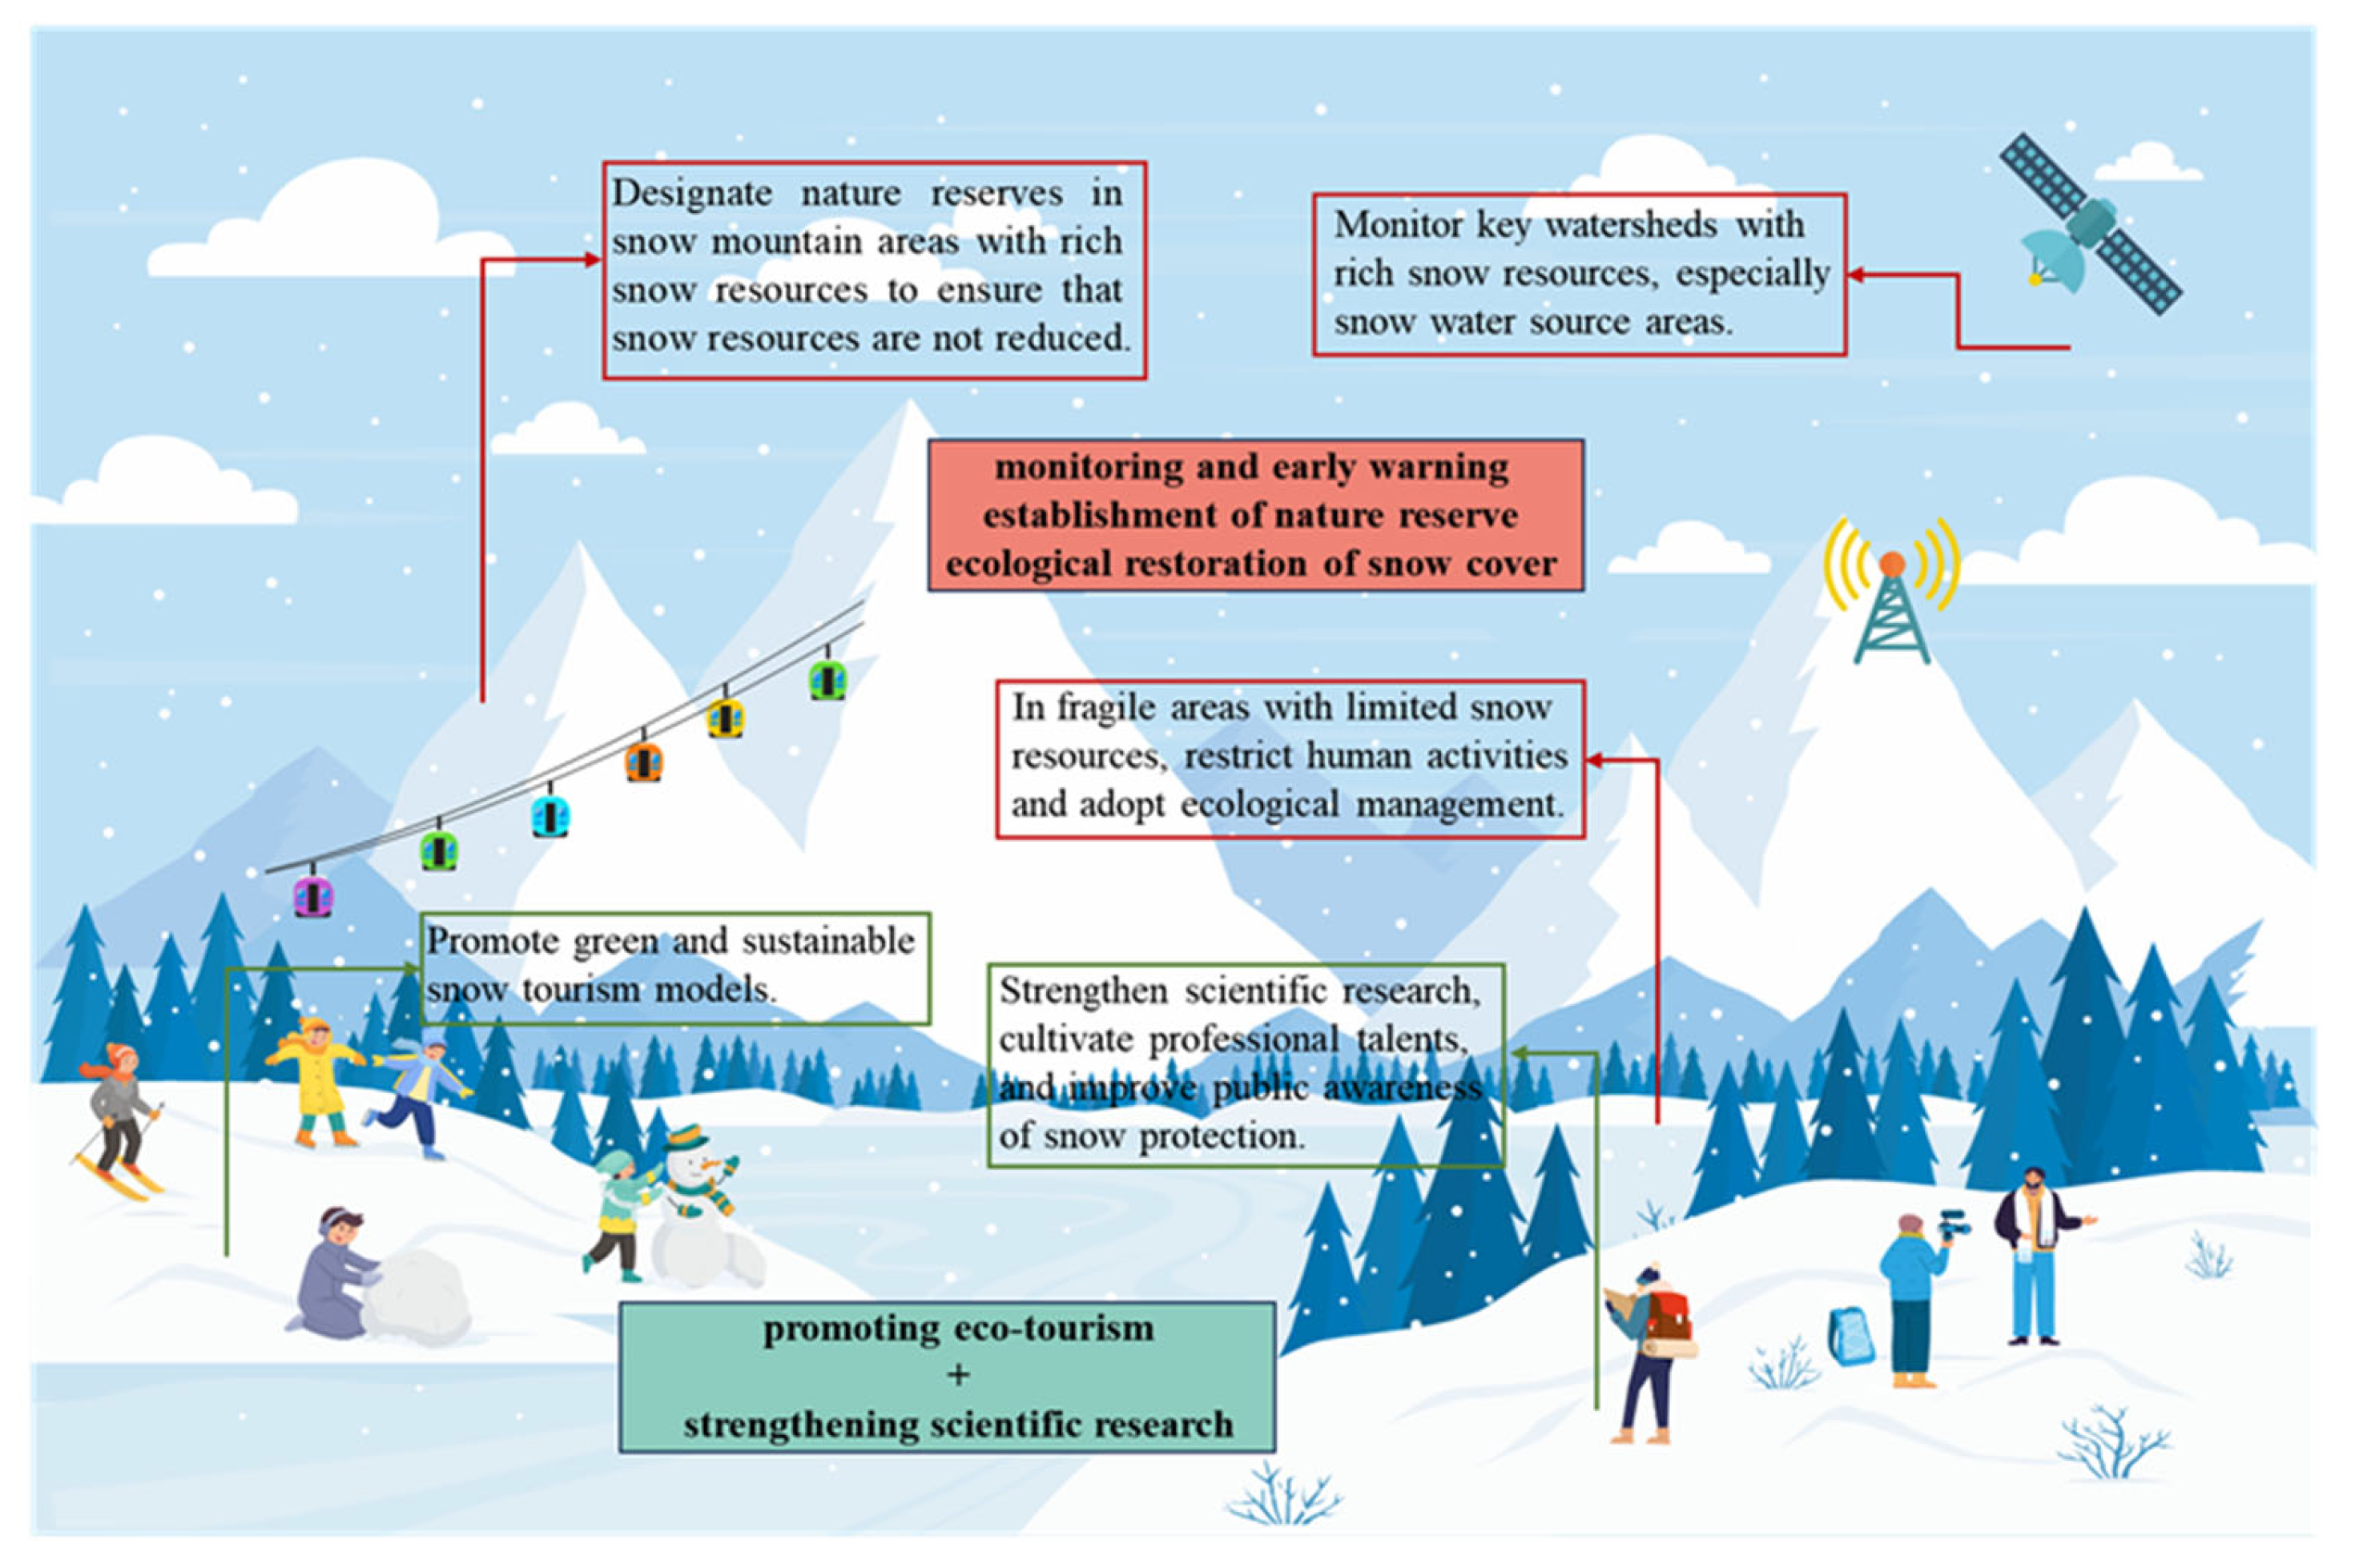
5.1. Recommendations for Protection and Development

Based on the fluctuating downward trends of the RRV, FSV, CRV, as well as the continuously increasing values of TRV and SRV, it has been observed that the total volume of snow resources is decreasing while human interactions with snow cover are intensifying. Therefore, to ensure the sustainable development of snow resources, it is crucial to enhance the monitoring and protection of snow resources, as well as their ecologically sound utilization. Figure 7 demonstrates the model for the protection and development of snow resources on the QTP. For key basins with abundant snow resources, a robust monitoring system should be established, and the prediction capabilities should be strengthened, to promptly understand and manage changes in snow resources and respond to snow disaster risks. In areas with dense snow resources and high unit SCSV, nature reserves should be established, and development within these reserves should be restricted, to ensure the preservation of snow resources. Additionally, considering the trend of humanistic property values, protection measures such as “promoting eco-tourism and enhancing scientific research” should be adopted. Furthermore, each basin should adopt countermeasures consistent with regional characteristics to support the sustainable development of snow cover service functions.
Each basin should be guided by the above protection and development framework and adopt countermeasures consistent with regional characteristics to support the sustainable development of snow cover service functions. The Inner Plateau, Brahmaputra, and Yangtze basins, important natural reservoirs, require long-term monitoring and early warning systems especially focused on changes in snow water source areas. Basins such as the Indus, Ganges, Tarim, Salween, and Mekong with rich snow resources would benefit from establishing nature reserves to protect these resources. Additionally, the Hexi Corridor, Indus, and Salween basins have high humanistic property values, enabling the development of snow eco-tourism and enhancing scientific research to promote regional snow resource development and economic growth. The Yellow and Yangtze basins have relatively low unit SCSV and fragile snow cover functions, necessitating management and restoration. Considering the monthly variations in SCSVs, the freshwater supply value in the Indus and Tarim Basins during April and June accounts for over 30% of the annual total, necessitating attention to flood risks due to seasonal snowmelt. The dry climate of the Qaidam Basin results in a short melting period, marking it as a vulnerable area for snow resources. The SCSV of the Ganges, Indus, and Yellow basins significantly correlates with temperature and precipitation, requiring close monitoring of these elements in the snow-covered areas (Table 5).

5.2. Limitations and Outlook

The geographical environment and climatic conditions of the QTP are very complex. We provided the theoretical framework for snow cover service value assessment, and we used daily and monthly characteristic parameters such as snow water equivalent, snowmelt, net solar radiation, and snow albedo to evaluate the natural property value of the QTP. However, the use of remote sensing products to assess SCSV on the QTP has limitations. The spatial resolution and update frequency of remote sensing data may not capture rapidly changing environmental conditions accurately. Additionally, cloud cover and errors in processing algorithms can affect result accuracy. Future research should explore higher-resolution remote sensing technologies and integrate ground monitoring data to enhance assessment precision and utility. On the other hand, since the calculation of SCSV involves many remote sensing observation data of different snow parameters, these data have certain errors in spatial resolution and accuracy; therefore, we could only roughly estimate the SCSV of the QTP. In the future, the SCSVs should be evaluated more precisely at the same scale through continuous observations of regional snow-related characteristic parameters. The models and algorithms relied upon in this study might have limitations under complex environmental and climatic conditions, especially in the high-elevation and extreme climate regions of the Qinghai–Tibet Plateau. Future research should improve the precision of SCSV assessments through higher accuracy data and refined models and reduce reliance on remote sensing data by validating them with field verifications to enhance the reliability of the results. Moreover, if factors such as the residence time and the refreezing rate of snowmelt are considered, the runoff regulation value and freshwater supply value would be overestimated. Therefore, in future research on the small watershed scale, the combination of remote sensing observation and field measurement can be used to reduce the calculation error.
Currently, no studies specifically address the SCSV. Considering that glaciers and snow cover are important components of the cryosphere with similar characteristics, we have chosen to compare our findings with existing glacier service value research. For instance, it was found that the glacier area in the Tianshan Mountains decreased by 13.9% between 1970 and 2010, which aligns with the glacier retreat trends observed in our study [48]. It has also been emphasized in studies that glaciers contribute to hydrological and climate regulation [27], which corresponds with our findings that snow cover ecological service values are primarily reflected in their climate and hydrological regulation functions. Our research further underscores the significance of cryosphere functions for regional and global ecosystems. While the quantification of snow cover’s ecological service values, such as hydrological and climate regulation, is grounded in robust scientific methodologies similar to those used in glacier studies, the assessment of humanistic values presents unique challenges. Unlike ecological services, which can often be quantified and modeled, humanistic values are deeply intertwined with cultural practices and perceptions, which are less amenable to straightforward quantification. This divergence in assessment methodologies underscores the complexity of fully capturing the diverse values snow cover provides to societies. We only took the tourism and recreation value and the SRV scientific research value, which are relatively easy to quantify, as the humanistic property value of snow cover. However, the humanistic property includes any snow culture that humans participate in, such as igloos, snow house, and other cultural creations formed in snow environments, as well as snow sports such as cross-country skiing, snowboarding, and ski jumping. At the same time, landscape features such as snow mountains are endowed with spiritual and cultural value under the influence of religious beliefs. For example, the indigenous people in the mountainous areas of Tibet believe that snow mountains are the material manifestations of different deities and are an integral part of cosmology and worship [60]. In addition, it is precisely because of living in the snow cover environment all the year round that the Eskimos, Laputes, and Mishan people have formed a unique social and cultural structure in the local area [61]. Most of the humanistic property value of snow cover has certain added value. For example, snow houses not only provide the aborigines with the value of living, but also promote the development of local tourism and transportation. This type of snow cover service value calculation involves more added value, and the results of different evaluation methods are quite different. Therefore, it is difficult to accurately and quantitatively evaluate the value of more types of humanistic property value of snow cover, which often requires qualitative methods to explore the relationship between human activities and snow service functions.

6. Conclusions

This study constructed a snow cover service value assessment framework and estimated the spatiotemporal distribution, monthly changes, composition structure and influencing factors of five different types of SCSVs. The results show that the natural property value of the 11 river basins on the QTP showed a fluctuating and declining trend, while the tourism and recreation value showed an exponential rising trend, and the scientific research value experienced an initial rising and then declining trend. The spatial distribution showed a spatial pattern of more in the west and less in the east. This provides guidance for the spatial and temporal distribution characteristics of SCSVs on the QTP. At the same time, exploring the monthly changes in the SCSV is considered to be an effective way to manage, develop, and utilize snow resources. For example, the freshwater supply value in the Indus Basin and Tarim Basin can reach 30% of the whole year in June, which requires special attention to the risk of flooding caused by melting snow in the summer. This study explored the correlation among the four factors of precipitation, temperature, GDP, and population, and the SCSV. Due to the complexity of the SCSV, these factors can only reflect the relationship between climate change, human activities, and SCSVs to a certain extent, but this still provides a reference for the development and utilization of snow cover. Since the SCSV has been estimated for the first time, this study compared the service value of snow cover with other types of ecosystem services value. The results showed that the unit SCSV was significantly higher than the other ecosystem service values, which shows that the SCSV has been ignored in the past. Finally, this study proposed corresponding protection and development strategies based on the characteristics of SCSV in each basin. Basins with high snow cover resources such as the Inner Plateau, the Brahmaputra, and the Yangtze, as natural reservoirs on the QTP, are important river origins which require snow cover monitoring, especially regarding the changes in snow water source areas. For areas with rich and dense snow cover resources, such as the Indus Basin, Ganges Basin, and Tarim Basin, snow nature reserves should be established. For basins with fragile snow functions, especially Yangtze Basin and Yellow Basin, it is necessary to manage and restore snow cover resources.
The snow cover ecosystem on the QTP is of great significance to maintaining climate change and water resource security in the region and even in Asia. Exploring the SCSVs on the QTP is related to the sustainable development of the regional economy and the stability of the ecosystem.

Author Contributions

Formal analysis, X.G. and W.L.; writing—original draft, X.G., B.Z. and J.X.; writing—review and editing, X.G., W.L., X.D. and M.Z.; supervision, Q.F.; project administration, Q.F. All authors have read and agreed to the published version of the manuscript.

Funding

This project was supported by the National Key Research and Development Program of China (2022YFF1303301 and 2022YFF1302603), National Nature Science Foundation of China (52179026), Strategic Research and Consulting Project of the Chinese Academy of Engineering (2023-XZ-80), Consulting and Research Project of the Gansu Research Institute of Chinese Engineering Science and Technology Development Strategy (GS2022ZDI03).

Data Availability Statement

The original contributions presented in the study are included in the article, further inquiries can be directed to the corresponding author.

Acknowledgments

The data set of snow water equivalent, snowmelt, and snow cover days are provided by National Cryosphere Desert Data Center (http://www.ncdc.ac.cn), accessed on 15 July 2024. The data sets of snow albedo, precipitation, and temperature are provided by National Tibetan Plateau Data Center (http://data.tpdc.ac.cn), accessed on 15 July 2024. The dataset of net solar radiation is provided by National Ecosystem Science Data Center, National Science & Technology Infrastructure of China (http://www.nesdc.org.cn), accessed on 15 July 2024.

Conflicts of Interest

The authors declare no conflicts of interest.

Appendix A

Table A1. Definition and function of the main terms related to the economy.
NameDefinition and Function
SCSV (Snow Cover Service Value)This refers to the benefits that humans derive directly or indirectly from snow cover. In the article, SCSV is used to assess the overall economic value of snow cover on the Qinghai–Tibet Plateau, including aspects such as climate regulation and water supply.
RRV (Runoff Regulation Value)This represents the value of snow cover in regulating runoff. In the article, RRV is estimated using the shadow price method, calculating how snow cover supports water resource management by regulating surface water flows.
FSV (Freshwater Supply Value)This reflects the economic contribution of snow cover through providing meltwater resources to human water systems. In the article, FSV is calculated using the market value method.
CRV (Climate Regulation Value)This involves the economic impact of snow cover in regulating the regional climate by reflecting solar radiation. The article assesses CRV using the equivalent factor method, highlighting the importance of snow cover in climate regulation.
TRV (Tourism and Recreation Value)This reflects the economic value of snow cover as a tourism and recreation resource. In the article, TRV is estimated using the travel cost method, indicating the contribution of snowscapes and related activities to the tourism industry.
SRV (Scientific Research Value)This denotes the economic value provided by snow cover for scientific research. In the article, SRV is estimated by linking snow cover to research funding, emphasizing the importance of snow cover research to the scientific community.
Shadow price method Used to evaluate the economic value of environmental resources or public goods, typically employed when market prices are unavailable. This method is used in the article to estimate RRV [52].
Market value methodDirectly uses market prices to assess the value of goods or services. In the article, this method is used to calculate FSV, evaluating the supply value of snow water through market water prices [52].
Travel cost methodUsed to assess the value of natural or leisure resources based on the travel costs required to access these resources. This method is used in the article to estimate TRV [27].
Equivalent factor methodConverts non-market values (such as environmental services) into economic values, often relying on utility or efficiency factors. This method is used in the article to calculate CRV, showing the cooling costs saved by changing the surface albedo [28,29,30,31,32,33,34,35,36,37,38,39,40,41,42,43,44,45,46,47,48,49,50,51,52,53,54].
Engel’s coefficient Measures the proportion of household expenditure on food to total expenditure, commonly used to assess economic development levels and living standards. In the article, this coefficient is used to measure tourists’ willingness to pay for snow tourism [27].
Peel’s growth curveA model that describes the stages of technological or economic development. In the article, this model is used to predict growth trends in snow tourism [27].

References

  1. Sharma, R.C.; Tateishi, R.; Hara, K. A new water-resistant snow index for the detection and mapping of snow cover on a global scale. Int. J. Remote Sens. 2016, 37, 2706–2723. [Google Scholar] [CrossRef]
  2. Barnett, T.P.; Adam, J.C.; Lettenmaier, D.P. Potential impacts of a warming climate on water availability in snow-dominated regions. Nature 2005, 438, 303–309. [Google Scholar] [CrossRef] [PubMed]
  3. Qin, Y.; Hong, C.P.; Zhao, H.Y.; Siebert, S.; Abatzoglou, J.T.; Huning, L.S.; Sloat, L.L.; Park, S.; Li, S.Y.; Munroe, D.K.; et al. Snowmelt risk telecouplings for irrigated agriculture. Nat. Clim. Change 2022, 12, 1007–1015. [Google Scholar] [CrossRef]
  4. Bormann, K.J.; Brown, R.D.; Derksen, C.; Painter, T.H. Estimating snow-cover trends from space. Nat. Clim. Change 2018, 8, 923–927. [Google Scholar] [CrossRef]
  5. Mote, T.L. On the role of snow cover in depressing air temperature. J. Appl. Meteorol. Climatol. 2008, 47, 2008–2022. [Google Scholar] [CrossRef]
  6. Qu, X.; Hall, A. What controls the strength of snow-albedo feedback? J. Clim. 2007, 20, 3971–3981. [Google Scholar] [CrossRef]
  7. Abe, M. Impact of snow-albedo feedback termination on terrestrial surface climate at midhigh latitudes: Sensitivity experiments with an atmospheric general circulation model. Int. J. Climatol. 2022, 42, 3838–3860. [Google Scholar] [CrossRef]
  8. Xiao, C.; Wang, S.; Qin, D. A preliminary study of cryosphere service function and value evaluation. Adv. Clim. Change Res. 2015, 6, 181–187. [Google Scholar] [CrossRef]
  9. Lutz, J. Skiing from Top to Bottom: The History of Skiing in Canaan Valley. Southeast. Nat. 2015, 14, 447–454. [Google Scholar] [CrossRef]
  10. Liu, S.; Guo, Q. Image perception of ice and snow tourism in China and the impact of the Winter Olympics. PLoS ONE 2023, 18, e0287530. [Google Scholar] [CrossRef]
  11. Ding, Y.J.; Mu, C.C.; Wu, T.H.; Hu, G.J.; Zou, D.F.; Wang, D.; Li, W.P.; Wu, X.D. Increasing cryospheric hazards in a warming climate. Earth-Sci. Rev. 2021, 213, 103500. [Google Scholar] [CrossRef]
  12. Kunkel, K.E.; Robinson, D.A.; Champion, S.; Yin, X.G.; Estilow, T.; Frankson, R.M. Trends and Extremes in Northern Hemisphere Snow Characteristics. Curr. Clim. Change Rep. 2016, 2, 65–73. [Google Scholar] [CrossRef]
  13. Brown, R.D. Northern hemisphere snow cover variability and change, 1915–97. J. Clim. 2000, 13, 2339–2355. [Google Scholar] [CrossRef]
  14. Wang, Z.B.; Wu, R.G.; Huang, G. Low-frequency snow changes over the Tibetan Plateau. Int. J. Climatol. 2018, 38, 949–963. [Google Scholar] [CrossRef]
  15. Euskirchen, E.S.; McGuire, A.D.; Chapin, F.S. Energy feedbacks of northern high-latitude ecosystems to the climate system due to reduced snow cover during 20th century warming. Glob. Change Biol. 2007, 13, 2425–2438. [Google Scholar] [CrossRef]
  16. Chen, X.; Wei, W.S.; Liu, M.Z. Characteristics of temperature variation in seasonal snow in the Western Tianshan Mountains, China. Meteorol. Appl. 2013, 20, 457–465. [Google Scholar] [CrossRef]
  17. Yao, T.; Qin, D.; Shen, Y.; Zhao, L.; Wang, N.; Lu, A. Cryospheric changes and their impacts on regional water cycle and ecological conditions in the Qinghai Tibetan Plateau. Chin. J. Nat. 2013, 35, 179–186. [Google Scholar]
  18. O’Gorman, P.A. Contrasting responses of mean and extreme snowfall to climate change. Nature 2014, 512, 416–418. [Google Scholar] [CrossRef]
  19. Wang, S.; Xu, X.; Dou, W.; Qin, D. Special regionalization of cryosphere culture service in China. Acta Geogr. Sin. 2022, 77, 16–34. [Google Scholar]
  20. Wang, S.; Ding, Y.; Xiao, C. Integrated impacts of cryosphere change on the economic and social system and its adaptive management strategies. J. Glaciol. Geocryol. 2018, 40, 863–874. [Google Scholar]
  21. Costanza, R.; dArge, R.; deGroot, R.; Farber, S.; Grasso, M.; Hannon, B.; Limburg, K.; Naeem, S.; Oneill, R.V.; Paruelo, J.; et al. The value of the world’s ecosystem services and natural capital. Nature 1997, 387, 253–260. [Google Scholar] [CrossRef]
  22. Xiao, H.; Hu, C.; Chi, Y.K. Preliminary Evaluation Of Ecosystem Service Value Of Natural Grassland In China. Fresenius Environ. Bull. 2021, 30, 2670–2685. [Google Scholar]
  23. Liu, H.; Wang, R.Z.; Sun, H.Y.; Cao, W.J.; Song, J.; Zhang, X.F.; Wen, L.; Zhuo, Y.; Wang, L.X.; Liu, T.J. Spatiotemporal evolution and driving forces of ecosystem service value and ecological risk in the Ulan Buh Desert. Front. Environ. Sci. 2023, 10, 1053797. [Google Scholar] [CrossRef]
  24. Fujii, H.; Sato, M.; Managi, S. Decomposition Analysis of Forest Ecosystem Services Values. Sustainability 2017, 9, 687. [Google Scholar] [CrossRef]
  25. Barbier, E.B.; Hacker, S.D.; Kennedy, C.; Koch, E.W.; Stier, A.C.; Silliman, B.R. The value of estuarine and coastal ecosystem services. Ecol. Monogr. 2011, 81, 169–193. [Google Scholar] [CrossRef]
  26. Zhang, Z.Y.; Liu, L.; He, X.L.; Li, Z.Q.; Wang, P.Y. Evaluation on glaciers ecological services value in the Tianshan Mountains, Northwest China. J. Geogr. Sci. 2019, 29, 101–114. [Google Scholar] [CrossRef]
  27. Sun, M.P.; Ma, W.Q.; Yao, X.J.; Zhang, Y.; Yang, Y. Evaluation of glacier service function and value in the Sanjiangyuan Nature Reserve in China (SNRC). J. Clean. Prod. 2023, 412, 137284. [Google Scholar] [CrossRef]
  28. Yang, Y.; Wu, X.J.; Liu, S.W.; Xiao, C.D.; Wang, X.M. Valuating service loss of snow cover in Irtysh River Basin. Adv. Clim. Change Res. 2019, 10, 109–114. [Google Scholar] [CrossRef]
  29. Liu, S.; Wang, X.; Xiao, C.; Yang, Y.; Wu, X. Evaluating climate regulation service of snow cover in China. Progress. Inquisitiones Mutat. Clim. 2020, 16, 536–544. [Google Scholar]
  30. Chen, X.Q.; An, S.; Inouye, D.W.; Schwartz, M.D. Temperature and snowfall trigger alpine vegetation green-up on the world’s roof. Glob. Change Biol. 2015, 21, 3635–3646. [Google Scholar] [CrossRef]
  31. Liang, L.Q.; Li, L.J.; Liu, C.M.; Cuo, L. Climate change in the Tibetan Plateau Three Rivers Source Region: 1960–2009. Int. J. Climatol. 2013, 33, 2900–2916. [Google Scholar] [CrossRef]
  32. Zhu, J.; Shi, J.C.; Wang, Y.H. Subpixel snow mapping of the Qinghai-Tibet Plateau using MODIS data. Int. J. Appl. Earth Obs. Geoinf. 2012, 18, 251–262. [Google Scholar] [CrossRef]
  33. Jiang, W.; Jiala; Xiao, T.; Luobu, J.; Zhou, Z. Climate change and spatial distribution of winter snowfall over the Tibetan Plateau during 1971–2010. J. Glaciol. Geocryol. 2016, 38, 1211–1218. [Google Scholar]
  34. Chu, D.; Luosang, Q.; Yang, Z.; Yang, Y. Spatiotemporal Variations of Snowfall Days over the Tibetan Plateau from 1981 to 2010. J. Appl. Meteorolgical Sci. 2017, 28, 292–305. [Google Scholar]
  35. Zhu, X.; Zhang, M.; Wang, S.; Li, X.; Dong, L.; Ren, Z. Spatiotemporal variation patterns of the beginning and ending dates of snowfall, and snowfall days in Qinghai Province during 1962 to 2012. Chin. J. Ecol. 2014, 33, 761–770. [Google Scholar]
  36. Wang, W.; Huang, X.D.; Deng, J.; Xie, H.J.; Liang, T.G. Spatio-Temporal Change of Snow Cover and Its Response to Climate over the Tibetan Plateau Based on an Improved Daily Cloud-Free Snow Cover Product. Remote Sens. 2015, 7, 169–194. [Google Scholar] [CrossRef]
  37. Wang, J.; Che, T.; Li, Z.; Li, H.; Hao, X.; Zheng, Z.; Xiao, P.; Li, X.; Huang, X.; Zhong, X.; et al. Investigation on Snow Characteristics and Their Distribution in China. Adv. Earth Sci. 2018, 33, 12–26. [Google Scholar]
  38. Jiang, L.; Yang, J.; Zhang, C.; Wu, S.; Li, Z.; Dai, L.; Li, X.; Qiu, Y. Daily snow water equivalent product with SMMR, SSM/I and SSMIS from 1980 to 2020 over China. Big Earth Data 2022, 6, 420–434. [Google Scholar] [CrossRef]
  39. Yang, Y.; Chen, R.S.; Liu, G.H.; Liu, Z.W.; Wang, X.Q. Trends and variability in snowmelt in China under climate change. Hydrol. Earth Syst. Sci. 2022, 26, 305–329. [Google Scholar] [CrossRef]
  40. Zhang, Z.; Xiao, P.; Zhang, X.; Feng, X.; Yang, Y.; Hu, R.; Sheng, G.; Liu, H. Analysis of the Characteristics of Snow Albedo during the Snowmelt Period of the Qinghai-Tibet Plateau. Remote Sens. Technol. Appl. 2019, 34, 1146–1154. [Google Scholar] [CrossRef]
  41. Ye, L.Z.; Xiao, P.F.; Zhang, X.L.; Feng, X.Z.; Hu, R.; Ma, W.; Li, H.X.; Song, Y.N.; Ma, T.Y. Evaluating Snow Bidirectional Reflectance of Models Using Multiangle Remote Sensing Data and Field Measurements. IEEE Geosci. Remote Sens. Lett. 2022, 19, 2000205. [Google Scholar] [CrossRef]
  42. Sheng, G.; Xiao, P.; Zhang, X.; Feng, X.; Yang, Y.; Hu, R.; Liu, H.; Zhang, Z. Differences in snow albedo between Tianshan Mountains and northern Xinjiang. Arid Land Geogr. 2019, 42, 774–781. [Google Scholar]
  43. Liu, H.; Xiao, P.; Zhang, X.; Feng, X.; Yang, Y.; Hu, R.; Zhang, Z.; Sheng, G. The characteristics of snow cover albedo in Northeast China. J. Glaciol. Geocryol. 2019, 41, 554–562. [Google Scholar]
  44. Wang, Z.S. Satellite-Observed Effects from Ozone Pollution and Climate Change on Growing-Season Vegetation Activity over China during 1982–2020. Atmosphere 2021, 12, 1390. [Google Scholar] [CrossRef]
  45. Zhao, Q.; Hao, X.; Wang, J.; Sun, X.; Li, H. A dataset of snow cover phenology in China based on MODIS during 2000–2020. China Sci. Data 2022, 7, 6. [Google Scholar]
  46. Qinghai Provincial Bureau of Statistics. Available online: http://tjj.qinghai.gov.cn/tjData/qhtjnj/ (accessed on 3 July 2024).
  47. Tibet Autonomous Region Bureau of Statistics. Available online: https://tjj.xizang.gov.cn/xxgk/tjxx/tjgb/ (accessed on 3 July 2024).
  48. National Bureau of Statistics of China. Available online: https://data.stats.gov.cn/easyquery.htm?cn=C01 (accessed on 3 July 2024).
  49. National Natural Science Foundation of China (NSFC). Available online: https://www.citexs.com/nsfc (accessed on 3 July 2024).
  50. Peng, S.Z.; Gang, C.C.; Cao, Y.; Chen, Y.M. Assessment of climate change trends over the Loess Plateau in China from 1901 to 2100. Int. J. Climatol. 2018, 38, 2250–2264. [Google Scholar] [CrossRef]
  51. Peng, S.Z.; Ding, Y.X.; Wen, Z.M.; Chen, Y.M.; Cao, Y.; Ren, J.Y. Spatiotemporal change and trend analysis of potential evapotranspiration over the Loess Plateau of China during 2011–2100. Agric. For. Meteorol. 2017, 233, 183–194. [Google Scholar] [CrossRef]
  52. Zhang, Z.; He, X.; Liu, L.; Li, Z.; Wang, P. Ecological service functions and value estimation of glaciers in the Tianshan Mountains, China. Acta Geogr. Sin. 2018, 73, 856–867. [Google Scholar]
  53. Du, H.; Yu, S.; Zhang, P.; Zhang, L. Assessing payment for ecosystem services based on water retention value flow in Beijing-Tianjin-Hebei region. Acta Ecol. Sin. 2022, 42, 9871–9885. [Google Scholar]
  54. Sun, M.P.; Ma, W.Q.; Yao, X.J.; Zhao, L.L.; Li, Z.Q.; Qin, D.H. Evaluation and spatiotemporal characteristics of glacier service value in the Qilian Mountains. J. Geogr. Sci. 2020, 30, 1233–1248. [Google Scholar] [CrossRef]
  55. Shen, L.; Wu, T.; You, Q.; Jiang, G.; Xie, X.; Zhu, L.; Yin, J. Analysis of the characteristics of spatial and temporal variations of snow depth and their causes over the central and eastern Tibetan Plateau. J. Glaciol. Geocryol. 2019, 41, 1150–1161. [Google Scholar]
  56. Wang, Y.; Guo, S.; Wang, J.; Yuan, H.; Xu, B.; Wang, D. Estimation of Forest Ecosystem Service Value in the Qilian Mountains National Nature Reserve in Gansu of China. J. Desert Res. 2013, 33, 1905–1911. [Google Scholar]
  57. Chen, C.; Tao, Z.; Wang, H.; Dai, J. Ecosystem Service Assessment of Grasslands in the Sanjiangyuan Region. Prog. Geogr. 2012, 31, 978–984. [Google Scholar]
  58. Yi-Qun, W. Evaluation of Wetland Ecosystem Service in Keluke Lake–Toson Lake Nature Reserve of Qinghai. Shaanxi For. Sci. Technol. 2017, 4, 39–42. [Google Scholar]
  59. Xiao-Mei, W.; Yan-Wei, C.; Cai, C.; Yi-Jun, B.U. Impact Assessment of Ecological Service Value in the Rapid Urbanization Areas of Qinghai-Tibet Plateau:A Case Study of Xining. China Popul. Resour. Environ. 2014, 24, 435–439. [Google Scholar]
  60. Wang, S.J.; Qin, D.H. Mountain inhabitants’ perspectives on climate change, and its impacts and adaptation based on temporal and spatial characteristics analysis: A case study of Mt. Yulong Snow, Southeastern Tibetan Plateau. Environ. Hazards-Hum. Policy Dimens. 2015, 14, 122–136. [Google Scholar]
  61. Xiao, C.; Wang, S.; Qin, D. A Preliminary Study on Cryosphere Service Function and Its Value Estimation. Progress. Inquisitiones Mutat. Clim. 2016, 12, 45–52. [Google Scholar]
Figure 1. Overview of the study area. The base map data is sourced from the National Cryosphere Desert Data Center.
Remotesensing 16 02600 g001
Figure 2. Evaluation system of snow cover service value.
Remotesensing 16 02600 g002
Figure 3. Temporal variation of the snow cover service value in each basin on the QTP. (a) Runoff Regulation Value; (b) Freshwater Supply Value; (c) Climate Regulation Value; (d) Tourism and Recreation Value; (e) Scientific Research Value.
Remotesensing 16 02600 g003
Figure 4. Spatial variation in SCSV in each basin on the QTP. (a) Natural property value; (b) humanistic property value.
Remotesensing 16 02600 g004
Figure 5. Monthly variation in the natural property value of snow cover in each basin on the QTP.
Remotesensing 16 02600 g005
Figure 6. Correlation of snow cover service value with precipitation, GDP, population, and temperature across different basins.
Remotesensing 16 02600 g006
Figure 7. Protection and development model of snow resources on the QTP.
Remotesensing 16 02600 g007
Table 1. Data Types and Sources.
NameTypeResolutionData Source
Snow water equivalentRaster25 kmSnow water equivalent 25 km daily product in China from 1980 to 2020 [37,38]
SnowmeltRaster1 kmMonthly snowmelt dataset in China during 1951–2020 [39]
Snow albedoRaster1 kmChina cloud-removal snow albedo product data set (2000–2020) [40,41,42,43]
Net solar radiationRaster1 kmChina’s net solar radiation data set based on era5 from 1982 to 2020 [44]
Snow cover daysRaster1 kmA dataset of snow phenology in China based on MODIS from 2000 to 2020 [45]
Tourism incomeStatistical data1 yearQinghai Province National Economic and Social Development Statistical Bulletin (2001–2020) [46]
Statistical Bulletin on National Economic and Social Development of Tibet Autonomous Region (2001–2020) [47]
Engel coefficientStatistical data1 yearStatistical Bulletin of the People’s Republic of China on National Economic and Social Development (2001–2020) [48]
research fundingStatistical data1 yearNational Natural Science Foundation of China [49]
temperatureRaster1 km1-km monthly mean temperature dataset for China (1901–2022) [50]
precipitationRaster1 km1-km monthly precipitation dataset for China (1901–2022) [51]
Table 2. Evaluation methods and parameters on snow cover service value the Qinghai–Tibet Plateau.
TypeFormulaParametersCalculation Basis
RRVShadow price method [52]
V r = d = 1 d = 365 ( S a d × S r d × P r × 10 3 365 )
Where V r is the RRV of the average annual snow cover (yuan), S a d is the daily snow cover area (km2), S r d is the daily snow water equivalent (mm), and P r is the unit reservoir cost (yuan/m3), which was 8.39 yuan/m3 in 2018 [53]. Calculated according to the fixed asset price index, the unit reservoir cost in 2020 is 8.4 yuan/m3.Convert snowmelt water into mountain reservoir capacity, then calculate the runoff regulation value by combining it with the unit cost of reservoir storage.
FSVMarket value method [52]
V f = m = 1 m = 12 ( S a m × S w m × P w 0.001 )
Where V f is the FSV of snow cover in a certain year (yuan), S a m is the snow cover area of a certain month (km2), S w m is the equivalent of snow melting water in a certain month (mm), and P w is the average water supply price on the QTP, which is 1.87 yuan/m3.Calculate the total amount of snow water by using the total snow area and snowmelt equivalent, and then determine the freshwater supply value by combining it with the market water price.
CRVEquivalent factor method [54]
V c = W × η × P c
W = α × F × S × T
Where V c is the CRV of snow cover (yuan), η is the air-conditioning refrigeration efficiency ratio, which is taken as 0.3, and P c is the average price of electricity on the QTP, which is taken as 0.52 yuan/kw·h; W is the contribution rate of solar radiation reflected by snow cover in a year (kw·h), α is the land surface albedo caused by snow cover, F is the net surface radiation flux caused by albedo changes (W/m2),   S is the proportion of snow cover accumulation time in a certain place in the year, and T is the annual average solar radiation time, which is 3000 h/year.Calculate the climate regulation value by equating the solar radiation reflected by the snow surface to the equivalent amount of heat reduction during air conditioning cooling.
TRVTravel cost method [27]
L = 1 1 + e x p 1 E n 1
V t = T j × L × S
Where L is the willingness to pay for tourism, E n is the Engel coefficient, V t is the TRV of snow cover (yuan), and T j is the total tourism income (yuan).Determine the tourism and recreation value by calculating people’s willingness to pay for tourism and combining it with snow tourism income.
SRVEquivalent factor method [28]
V s = R
Where V s is the SRV of snow cover (yuan), and R is the sum of relevant scientific research funds (yuan).Estimate the scientific research value based on the total amount of snow-related projects in the QTP funded by the National Natural Science Foundation of China, although this might somewhat overestimate the value.
Table 3. Average annual SCSVs and the annual average variation in each river basin.
Basin NameRRV (×109 yuan)FSV (×109 yuan)CRV (×109 yuan)TRV (×106 yuan)SRV (×106 yuan)
ValuesVariationValuesVariationValuesVariationValuesVariationValuesVariation
Brahmaputra137.76−0.0144.66−0.35836.74−0.01498.140.0122.650.25
Ganges16.260.254.350.06146.860.0451.880.102.401.97
Hexi Corridor17.380.046.790.26174.960.02105.160.054.741.20
Indus37.49−0.056.460.50553.720.002184.160.038.750.54
Inner Plateau349.25−0.0124.25−0.571272.560.001594.410.0127.860.19
Mekong24.080.1511.11−0.25204.170.01127.880.045.800.92
Qaidam79.85−0.0110.030.05389.340.01239.810.0210.280.65
Salween38.520.00420.11−0.55436.20−0.01228.550.0210.440.56
Tarim65.69−0.052.05−2.46866.48−0.003442.310.0120.030.28
Yangtze135.47−0.0256.02−0.12626.780.01518.040.0123.180.25
Yellow69.47−0.0227.220.28298.440.02246.780.0210.260.54
Total971.22−0.002213.04−0.055806.250.0013237.120.002146.390.04
RRV stands for Runoff Regulation Value; FSV for Freshwater Supply Value; CRV for Climate Regulation Value; TRV for Tourism and Recreation Value; and SRV for Scientific Research Value.
Table 4. The ecosystem services value composition of different types on the QTP.
Service TypesThe Proportion of Each Ecosystem Service Value (%)
Snow Cover aGlacier bForest cGrassland dWetland eUrban Area f
Freshwater supply/Product supply3.015.22-19.852.465.97
Runoff regulation/Water conservation13.9633.1414.031.9954.1227.31
Climate regulation82.9860.712.6948.6924.1214.26
Soil conservation--46.599.930.1211.23
Habitat Support/Biodiversity-0.0526.6819.3718.2934.87
Travel and recreation/Aesthetics0.0470.850.010.180.776.36
Scientific research0.0030.04--0.12-
a. On the Qinghai–Tibet Plateau (this article), b. In the Qilian Mountains [54], c. In the Qilian Mountains [56], d. In the Three River Source Region [57], e. In Qinghai Province [58], f. Rapid urbanization areas of Qinghai–Tibet Plateau [59].
Table 5. Main protection and development strategies for snow resources in each basin.
Target AreaFeatureSuggestions and Measures
BrahmaputraSCSV accounts for 14.58%Long-term monitoring and early warning, pay attention to changes in water source areas.
GangesUnit SCSV is 1.76 times the average value, and sensitive to temperatureEstablish a snow nature reserve and pay attention to temperature changes in snow-covered areas.
Hexi CorridorUnit humanistic property value is 1.44 times the average valuePromote eco-tourism and strengthen scientific research.
IndusUnit SCSV is 2.21 times the average value, snow melt water is concentrated, and the SCSV is sensitive to temperatureEstablish a snow nature reserve, pay attention to seasonal snow melt water disasters, and pay attention to temperature changes.
Inner PlateauSCSV is accounts for 23.54%Long-term monitoring and early warning, and pay attention to changes in snow water source areas.
MekongUnit SCSV is 1.13 times the average valueEstablish a snow nature reserve.
QaidamSnow melt period is shorterPrevent drought disaster.
SalweenUnit SCSV is 1.7 times the average valueEstablish a snow nature reserve.
TarimUnit SCSV is 1.74 times the average value, snow melt water is concentratedEstablish a snow nature reserve and pay attention to seasonal snow melt water disasters.
YangtzeSCSV accounts for 11.71%, while the unit SCSV is 0.69 times the average valueLong-term monitoring and early warning, manage and restore snow cover resources.
YellowUnit SCSV is 0.58 times the average value, the SCSV is sensitive to precipitationManage and restore snow cover resources, pay special attention to monitoring precipitation changes in snow-covered areas.
Disclaimer/Publisher’s Note: The statements, opinions and data contained in all publications are solely those of the individual author(s) and contributor(s) and not of MDPI and/or the editor(s). MDPI and/or the editor(s) disclaim responsibility for any injury to people or property resulting from any ideas, methods, instructions or products referred to in the content.

