Abstract
Efficiently monitoring and quantifying the response of genotypes to water stress is critical in developing resilient crop cultivars in water-limited environments. The objective of this study was to assess water stress in cotton (Gossypium hirsutum L.) using high-resolution unmanned aerial system (UAS) images and identify water-stress-resistant cultivars in plant breeding. Various vegetation indices (VIs) and the crop water stress index (CWSI) derived from UAS images were applied to assess water stress in eight cotton cultivars under four irrigation treatments (90%, 60%, 30%, and 0% ET). The enhanced vegetation index (EVI), green normalized difference vegetation index (GNDVI), normalized difference red-edge index (NDRE), normalized difference vegetation index (NDVI), and crop water stress index (CWSI) were effective in detecting the effects of the irrigation treatments during the growing season. These VIs effectively differentiated cultivars in the middle and late seasons, while the CWSI detected cultivar differences in the mid–late growing season. The NDVI, GNDVI, NDRE, and EVI had a strong positive relationship with cotton yield starting from the mid-growing season in two years (R2 ranged from 0.90 to 0.95). Cultivars under each irrigation treatment were clustered into high-, medium-, and low-yielding groups based on the VIs at the mid–late growing seasons using hierarchical cluster analysis (HCA). The EVI derived from UAS images with high temporal and spatial resolutions can effectively screen drought-resistant cotton varieties under 30% and 60% irrigation treatments. The successful classification of cultivars based on UAS images provides critical information for selecting suitable varieties in plant breeding to optimize irrigation management based on water availability scenarios. This technology enables the targeted selection of water-stress-resistant cotton cultivars and facilitates site-specific crop management and yield prediction, ultimately contributing to precision irrigation and sustainable agriculture in water-limited environments.
1. Introduction
Agriculture faces a major challenge to meet the increasing demand for food and fiber with a growing population under a changing climate [,]. Arid and semi-arid regions cover more than 40% of the world’s land area and one-third of the population []. In these areas, drought is the most critical environmental stressor affecting the sustainable development of agriculture [,]. The limited supply of water resources during the plant-growing season results in a significant reduction in production [,]. A key factor in addressing these challenges is understanding and mitigating crop water stress. Crop water stress is a condition where plants have suboptimal water availability that causes decreased leaf water potential, resulting in reduced plant growth and development. The effects on plants depend on the duration and severity of water stress, plant genetics, and developmental stages. Plant water stress ultimately affects crop yields []. Therefore, improving drought or water stress resistance in crops is essential for sustaining agricultural productivity in water-limited environments. Drought resistance is a mechanism ensuring minimum loss of yield in water-limited environments relative to the maximum yield under water-sufficient conditions. Plants exhibit drought resistance through mechanisms such as drought escape and drought tolerance. Plant traits related to drought resistance involve making appropriate use of available water to ensure reproductive growth and yield. These traits serve as important breeding tools in identifying stress-resistant genotypes [].
Selecting water-stress-resistant cultivars in breeding programs is an effective strategy to maintain crop production with limited water supply [,]. Quantitative plant phenotyping becomes more critical in breeding for specific traits to improve breeding efficiency and enhance yields in water-constrained environments [,]. As breeding programs evolve to target specific traits for improved efficiency and enhanced yields, quantitative plant phenotyping becomes increasingly pivotal. However, traditional phenotyping methods in phenotypic data collection and quantitative analysis are labor-intensive and time-consuming, especially for large-scale breeding programs [,].
Unmanned aerial system (UAS) technology empowers the acquisition of large amounts of image data for high-throughput plant phenotyping [,], reducing the limitations of revisit time, weather factors, and operating costs [,]. Equipped with various sensors, UAS platforms enable thermal and multispectral imaging, fluorescence analysis, and laser 3D scanning, thus greatly augmenting the ability to characterize diverse plant traits [,,]. The large and high-quality images greatly enrich the data sources for real-time plant growth monitoring, especially in crops’ phenotypic characterization [,]. Consequently, UAS technology has become an increasingly important tool for phenotyping, providing invaluable support for plant breeding [,]. For instance, vegetation indices (VIs) derived from high-resolution images have been used to extract crop traits such as leaf area index (LAI), biomass, maturity, relative water content, and yield [,,]. Furthermore, thermal imagery has proven instrumental in detecting crop water stress by establishing correlations between canopy temperature, canopy conductance, and leaf water potential [,,]. One such application, the crop water stress index (CWSI), leverages temperature differences between the air and the canopy as a metric for water stress conditions [,]. In summary, VIs and temperature-based indices have exhibited effectiveness in evaluating or determining plant growth, canopy temperature, and water stress.
The potential of leveraging UAS remote sensing for selecting water stress-resistant cultivars is underexplored, despite its high capacity in monitoring crop growth conditions under environmental stresses [,]. Studies employing UAS to estimate or predict crop LAI, maturity and yield have demonstrated tremendous potential in expediting plant breeding endeavors [,]. However, limited studies have reported the applicability of high-resolution UAS data in screening crop cultivars. Tattaris et al. [] evaluated the viability of the UAS-derived VIs as selection tools by examining their relationship with the crop performance characteristics of different breeding materials growing in various simulated target environments. Some researchers have identified genotypic differences and analyzed the dynamics and development trends of maize cultivars during different growth stages based on UAS images []. Additionally, Zhou et al. (2019) developed a method to estimate the maturity dates of soybean breeding lines using a UAS-based imaging system [].
Cotton is a crucial fiber crop cultivated under diverse climatic conditions across the globe. The Texas High Plains area ranks first in US cotton production but has long faced drought conditions in cotton cultivation. There is a growing need to identify and breed drought-tolerant varieties to maintain sustainable cotton production. UAS presents a valuable opportunity to monitor crops using remote sensing imagery with high spatial and temporal resolutions that are capable of improving the assessment of water stress for irrigation management. The applicability of UAS-derived information in cotton breeding remains underexplored, presenting an opportunity to enhance breeding efficiency. The objective of this study was to assess water stress in cotton using high-resolution UAS images to identify water-stress-resistant cotton cultivars for plant breeding. The enhanced vegetation index (EVI), green normalized difference vegetation index (GNDVI), normalized difference red-edge index (NDRE), normalized difference vegetation index (NDVI), and crop water stress index (CWSI) were assessed for their effectiveness in discriminating cotton cultivars subjected to varying water stress levels across different growth stages throughout the growing season.
2. Materials and Methods
2.1. Study Site
This study was conducted in a research field (33°35′5.45″N, 101°46′46.96″W) in Lubbock County, Texas, in 2019 and 2020. The local climate is semi-arid, characterized by large day-to-day and diurnal temperature variations. The 50-year average (1971–2020) annual rainfall is 471 mm, and the mean annual temperature is 23.3 °C. The soil type of the study field is Amarillo fine sandy loam (fine–loamy, mixed, superactive, thermic Aridic Paleustalfs), with slopes of 0 to 1 percent. The top layer of this soil (0–30 cm) has a sandy loam texture. Irrigation was applied using a subsurface drip irrigation system. Conventional tillage was practiced, and beds were prepared in 2019 and 2020. Weather data, including rainfall, temperature, wind speed, relative humidity, and solar radiation, were obtained from a weather station at the study site.
2.2. Experimental Design
The experiment was implemented as a split-plot randomized complete block design, with irrigation as the whole-plot factor and cultivar as the split-plot factor. Eight cotton cultivars with various levels of harvest maturity, growth patterns, and drought stress tolerance were included in this study (Table 1). Four irrigation treatments, including 0%, 30%, 60%, and 90% cotton evapotranspiration (ET) replacements, were implemented to represent corresponding levels of water stress. Weekly irrigation was determined by first totaling the cotton ET over the past seven days for the full irrigation rate. The 30%, 60%, and 90% ET treatments were then determined by multiplying this weekly ET total by their respective irrigation treatment rates, using weather station data and the Kansched2 program developed by Kansas State University (https://milab.ksu.edu/kansched2, accessed on 1 May 2024). Irrigation treatments were implemented 43 and 56 days after planting (DAP) in 2019 and 2020, respectively. After the irrigation treatments started, no irrigation was applied in the 0% ET treatment.

Table 1.
Maturity groups, growth patterns, and drought tolerance of eight cotton cultivars for assessing crop response to water stress.
In these two seasons, the cotton was planted on 30 May 2019 and 19 May 2020, at a seeding rate of 130,000 per hectare, using a cone planter (ALMACO, Nevada, IA, USA) equipped with a real-time kinematic GPS receiver (Trimble, Sunnyvale, CA, USA). Each plot was 8 m long and 1 m wide. Mechanical harvesting of the plots was performed using a John Deere 7460 (John Deere, Moline, IL, USA) cotton stripper equipped with calibrated load cells to weigh the samples.
After the implementation of the irrigation treatments, UAS images were acquired approximately every two weeks in 2019 and 2020. The experimental scheme of the UAS image acquisition relative to days after planting/irrigation and the cotton growth stages is shown in Table 2.
Table 2.
UAS image acquisitions under four irrigation treatments at different cotton growth stages in 2019 and 2020.
2.3. UAS Platform and Sensors
A DJI Matrice 600 UAS (DJI, Shenzhen, China) was applied as a platform to acquire high-resolution images (Figure 1). A red-edge sensor (MicaSense, Seattle, WA, USA) was used to collect multispectral images, with central wavelengths at 475, 560, 668, 717, and 840 nm corresponding to the blue, green, red, red-edge, and near-infrared (NIR) bands, respectively. This sensor has dimensions of 87 mm × 59 mm × 45 mm and a weight of 350 g. The focal length of the sensor is 5.4 mm, with a field of view of 47.2°. A thermal infrared (TIR) sensor, DJI Zenmuse XT Radiometric (FLIR System, Shenzhen, China), was used to acquire thermal images. This sensor has dimensions of 103 mm × 74 mm × 102 mm and a weight of 270 g. It is capable of capturing the wavelength range of 7.5 to 13.5 µm with 30 Hz full frame rates. This sensor is sensitive to the temperature range of −25 to 135 °C. The focal length of the sensor is 19 mm, with a digital image format of 640 × 512 pixels in radiometric JPEG, JPEG (8-bit), and TIFF (14-bit) (FLIR System, Shenzhen, China, 2016).
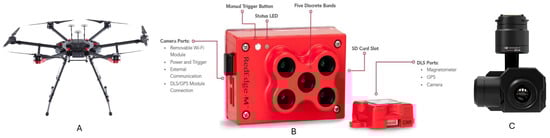
Figure 1.
UAS platform and sensors for acquiring multispectral and thermal images: (A) DJI Matrice 600 Pro UAS platform; (B) MicaSense RedEdge multispectral sensor; (C) DJI Zenmuse XT Radiometric thermal sensor.
2.4. UAS Image Acquisition
In 2019 and 2020, after the start of the irrigation treatments, UAS images were acquired approximately every two weeks, depending on weather conditions. Flight plans for image acquisition were designed and executed using the Pix4D software version 4.5.6 (Pix4D S.A., Prilly, Switzerland). The red-edge sensor and TIR sensor were flown separately, with a gap of 10 min. For both sensors, the forward and side overlaps were assigned 75% and 80%, respectively. The flight height was 40 m for both sensors, resulting in ~4 cm and ~3 cm image resolutions for the thermal and multispectral images, respectively. These image acquisitions were completed approximately one hour around the local solar noon (12:00–1:00 pm). To obtain consistent reflectance in changing illumination conditions, the RedEdge Downwelling Light Sensor (DLS) was used in conjunction with MicaSense’s Calibrated Reflectance Panel (CRP) to enable improved reflectance calibrations in situations where ambient light conditions were changing in the middle of a flight. The DLS was mounted on the top of the UAS, facing up towards the sky, for the red-edge sensor to measure incoming irradiance in the five individual bands []. Before and after each UAS flight, spectral calibration was conducted by acquiring an image of a MicaSense Calibrated Reflectance Panel (CRP) (Seattle, Washington, USA). The CRP has known reflectance values across the visible and near-infrared light spectra [,]. To calibrate the thermal infrared images, a total of 96 marked points, including temperatures of the soil (32 points), plant canopy (32 points), and calibration panels (32 points) were measured simultaneously using a handheld MI-220 thermal infrared sensor (Apogee Electronics, Santa Monica, CA, USA) during the collection of thermal infrared images with the UAS. The accuracy of this sensor is ±0.1 °C. The image-derived temperature was consistent with the in-situ temperature measurements (R2 = 0.93 and RMSE = 2.09 °C).
2.5. Image Processing
The thermal images were stitched using the Structure from Motion (SfM) workflow in the Agisoft PhotoScan Professional software version 1.4.5 (Agisoft LLC, St. Petersburg, Russia). The stitched thermal images were converted to digital temperature using the calibration curve derived from the ground temperature data. The multispectral images were calibrated using the reflectance values of the MicaSense calibration panel. Pix4D was applied to stitch and calibrate the multispectral images acquired using the MicaSense sensor. The georeferencing process of the thermal and multispectral imagery was performed in ArcGIS (Version 10.5, Esri, Redlands, CA, USA) using the positional information of the ground control panels.
Four VIs, including the NDVI, GNDVI, EVI, and NDRE, were derived from the multispectral images using the following equations:
where B, G, R, RE, and NIR represent the reflectance of the blue, green, red, red-edge, and near-infrared (NIR) bands, respectively.
The CWSI was applied for the detection and evaluation of crop water stress based on the thermal image data. The CWSI was calculated as described by Jones []:
where Tcanopy is the canopy temperature obtained from the thermal image. Twet and Tdry are the lower and upper boundary temperatures, representing a fully transpiring leaf with open stomata and a non-transpiring leaf with closed stomata, respectively. Tdry was estimated by adding 6 °C to the measured dry-bulb temperature (air temperature), as suggested by Bellvert et al. []. Twet was derived from the energy balance [,], as follows:
where Ta is the air temperature, rHR is the resistance to heat and radiative transfer using a characteristic leaf dimension of 0.1 m, raW is the boundary layer resistance for water vapor [], γ is the psychrometric constant, Rni is the net radiation, ρa is the air density, cp is the specific heat of dry air at constant pressure, s is the slope of the saturation vapor–pressure curve, and VPD (kPa) is the vapor pressure deficit [].
2.6. Data Analysis
Statistical analyses were performed using the R language version 3.5 (R Core Team, 2020). A two-way ANOVA was performed using the rstatix package to evaluate the effects of irrigation, cultivar, and their interaction on each VI at different growth stages and cotton lint yields. Multiple comparisons of cotton yield were performed using Tukey’s range test in the agricolae package. The hierarchical cluster analysis (HCA) was performed to classify the cotton cultivars based on the values of the VIs []. HCA is a method of data analysis that creates a hierarchical representation of clusters in a dataset. It quantifies the distance (or similarity) between data according to predefined metrics and uses a dendrogram to present these distances and reveal hierarchical relationships. The optimal number of clusters was determined using the elbow method in the fviz_nbclust package [].
3. Results
3.1. Weather Conditions and Water Input
The daily reference evapotranspiration (ET0), accumulated precipitation (AP), and total water input (TWI), including irrigation and precipitation for each treatment during the growing seasons of 2019 and 2020, are shown in Figure 2. The accumulated ET0, from planting to the termination of irrigation, was 646 mm for the 2019 season and 1064 mm for the 2020 season. The accumulated precipitation for the same period was 70 mm for 2019 and 115 mm for 2020. In addition, the precipitation patterns were substantially different between these two seasons. In the 2019 season, precipitation was abundant (53.4 mm) from planting (31 May) to early summer (before 10 June), negligible (6 mm) during the second half of the summer (11 June to 6 September), and normal after the irrigation treatments (8 September). However, in 2020, precipitation was fairly regular through June (43.4 mm) and July (40.1 mm), but negligible in August (4.3 mm) and normal in September. The higher level of ET requirement in 2020 than in 2019 led to a greater irrigation amount. The total irrigation increased by 41%, 44%, and 19% for the 30%, 60%, and 90% ET treatments, respectively.
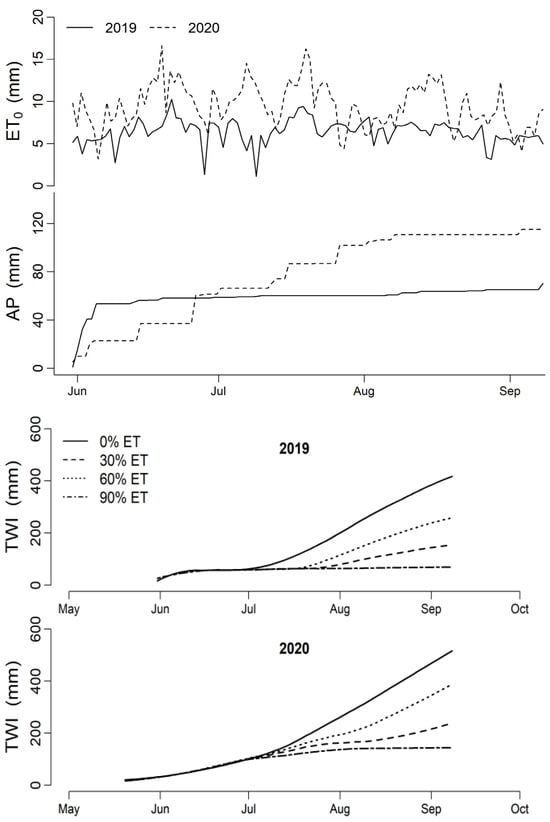
Figure 2.
Reference evapotranspiration (ET0), accumulated precipitation (AP), and total water input (TWI) applied to four irrigation treatments during the growing seasons of 2019 and 2020 in a research field in Lubbock County, Texas.
3.2. Yield Responses of Cotton Cultivars to Irrigation Rates
Irrigation and cultivar had significant effects on the cotton lint yield in the 2019 and 2020 seasons. In addition, the interaction between irrigation and cultivar had significant effects on yield in both seasons (p < 0.001 (Table S1)). For the 0% ET treatment, CRV5916 had the highest yield, followed by CRV4392 and CRV7205, in the 2019 season (Table 3). For the 30% ET, 60% ET, and 90% ET treatments, CRV4392 had a significantly higher yield than the other cultivars, followed by CRV5916, in 2019. In 2020, the yield of CRV7205, CRV5916, and CRV4392 was higher under the 0% and 30% ET treatments. CRV5916 and CRV4392 had higher yields under the 60% ET treatment. The yield of CRV4392 was significantly higher than that of the other cultivars under the 90% ET treatment. Although there were differences in weather conditions and water input, cultivars CRV7205, CRV5916, and CRV4392 had higher yields under limited irrigation conditions (e.g., 0%, 30% ET) in two years, indicating that these cultivars have greater drought resistance potential.
Table 3.
Multiple comparisons of cotton lint yield (kg ha−1) among eight cultivars under four irrigation treatments in a research field in Lubbock County, Texas, in 2019 and 2020.
In 2020, the cotton lint yield showed an increase compared to 2019 across the 0% ET, 30% ET, and 60% ET irrigation treatments. In contrast, the lint yield for the 90% ET treatment varied between 2019 and 2020, depending on the cultivar, suggesting less influence of the irrigation amount on lint yield.
3.3. Vegetation Indices and CWSI in Discriminating Cotton Growth Characteristics
3.3.1. VIs in Assessing the Response of Cotton Cultivars to Water Treatments
Irrigation, cultivar, and their interactions had significant effects on the VIs and CWSI in the mid-late stages of the two seasons (Tables S2 and S3). The irrigation effect was significant on all VIs after the implementation of water treatments in both seasons, and it became increasingly significant with the progression of the growing season. The cultivar had a significant effect on all VIs at the middle and late growth stages in both seasons, indicating that all of the tested VIs were effective in detecting the differences between cultivars. However, these VIs were only effective in detecting the cultivar effects in the mid-late season. In addition, the interaction effect between irrigation and cultivar was significant on VIs in the middle (56 DAP)-to-late stages (99 DAP) in 2019, while it was significant on these VIs throughout the growing season in 2020, except for the NDVI and GNDVI at 99 DAP.
The interaction between irrigation and cultivar was only significant on the CWSI at the late growth stage in 2020 (113 DAP). The irrigation effect was significant on CWSI at the mid–late stages in both seasons, suggesting that the CWSI is effective in detecting the differences between irrigation treatments. However, the CWSI was only effective in detecting the cultivar effects in the mid-season in 2019 (71 DAP and 85 DAP) and the late season in 2020 (113 DAP). This means that the CWSI cannot achieve consistent results in distinguishing cultivar performance under water stress. This may be related to the instantaneous nature of the CWSI for evaluating water stress at a specific growth stage, which is easily influenced by environmental conditions and the crop growth stages during the thermal image collection.
3.3.2. Relationship between VIs and Cotton Yield
There was a strong positive relationship between cotton yield and VIs starting from the mid-season in 2019 and 2020. This strong correlation began to present at 56 DAP in 2019 and 71 DAP in 2020 (Figure 3). It continued and stabilized before the cotton matured. The relationship between cotton yield and EVI reached the highest value (R2 = 0.95) at 71 DAP and 85 DAP in 2019, while this happened at 99 DAP (R2 = 0.90) in 2020 for the EVI and NDRE. The relationship between VIs and cotton yield was stronger in the middle and late stages, suggesting that VIs can be used to estimate the cotton yield in the middle and late growth stages.
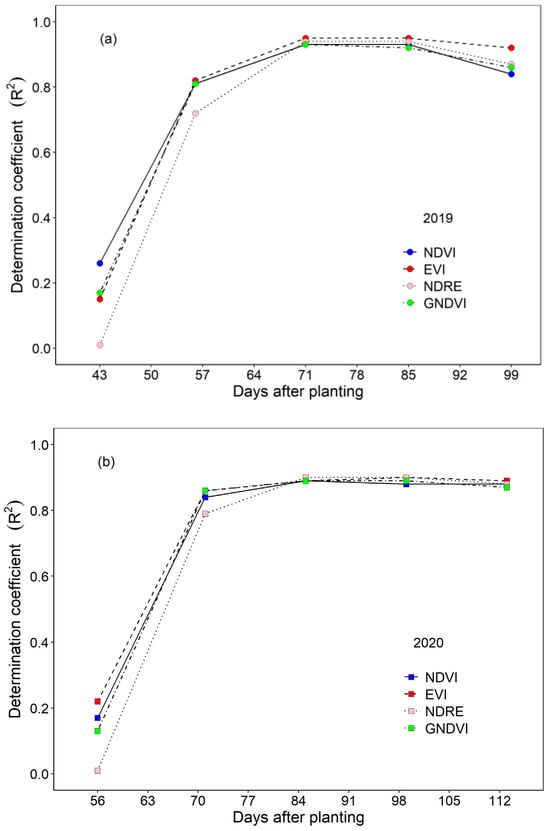
Figure 3.
Relationship between cotton yield and VIs derived from UAS images. (a) Trends in R2 values for cotton yield correlations with NDVI, EVI, NDRE, and GNDVI in the 2019 season. (b) Trends in R2 values for cotton yield correlations with NDVI, EVI, NDRE, and GNDVI in the 2020 season.
3.4. Cultivar Response to Water Stress as Classified by VIs
The cultivars were classified into three groups, Group 1 (red), Group 2 (cluster), and Group 3 (green), according to the values of VIs at 85 DAP in 2019 (Figure 4) and 99 DAP in 2020 under each irrigation treatment (Figure 5). Cultivars with the same color belong to the same group. For example, CRV5916 and CRV4392 had similar VI values under the 30% ET treatments and were classified into Group 3 in 2019 (Figure 4b) and Group 2 in 2020 (Figure 5b).
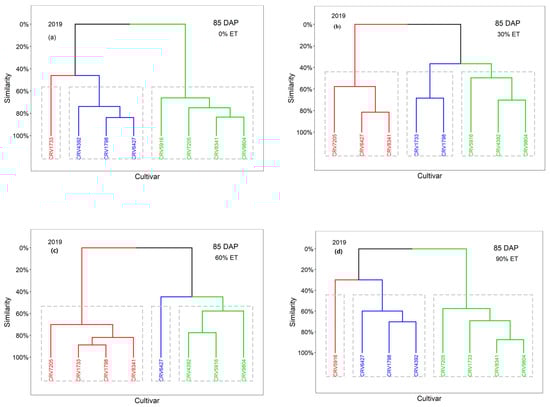
Figure 4.
Hierarchical cluster analysis of cultivars under different irrigation rates ((a): 0% ET, (b): 30% ET, (c): 60% ET, (d): 90% ET) at 85 DAP in 2019 (DAP: days after planting).
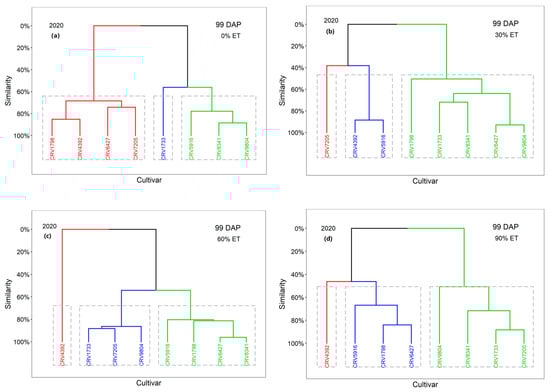
Figure 5.
Hierarchical cluster analysis of cultivars under different irrigation rates ((a): 0% ET, (b): 30% ET, (c): 60% ET, (d): 90% ET) at 99 DAP in 2020 (DAP: days after planting).
For the 0% ET treatment, the classifications of the cultivars were similar between these two seasons. CRV1733 was classified into a group by itself in two seasons (Figure 4a and Figure 5a). This cultivar was associated with lower VI values in both years, indicating reduced vegetative growth under extreme water stress (e.g., 0% ET). Group 2 consisted of CRV5916, CRV7205, CRV8341, and CRV9804 in 2019; CRV7205 was not classified into Group 3 with the other cultivars in 2020. Group 3 was composed of CRV4392, CRV1798, and CRV6427 in 2019. These cultivars, together with CRV7250, were classified into Group 2 in 2020. Generally, these cultivars had moderate VI values. The VI-based classification of the cultivars was dependent on the season under extreme water stress.
For the 30% ET treatment, cultivars with higher yield potential had similarities in their VI values. CRV4392, CRV5916, and CRV9804 were classified into Group 3 in 2019 (Figure 4b). This is consistent with the cultivar yield results, except for CRV9804. CRV9804 had higher VI values but had the lowest yield, and it was grouped with high-yielding cultivars (Figure 4b). In addition, CRV5916 and CRV4392 were grouped with higher VI values, corresponding to the second (1055 kg ha−1) and third yields (1042 kg ha−1) in 2020. When cultivars exhibit a strong relationship between vegetation growth and yield, VIs derived from UAS images have great potential in screening drought-resistant cotton cultivars under limited water supply conditions (e.g., 30% ET rate).
For the 60% ET treatment, cultivars with higher yield potential also had great similarity in VI values and showed similar classification results to the 30% ET treatment. CRV4392 and CRV5916 were classified into Group 3 in 2019 (Figure 4c). CRV9804 was also classified into Group 3, with high VI values and the lowest yield. This association of high VI values with low yield was similar to the case for the 30% ET treatment in 2019. Group 2 consisted of CRV6427 alone in 2019, with a medium VI level corresponding to the third-highest yield. In 2020, CRV4392 was grouped into Group 1 (Figure 5c), with the highest values in VIs, corresponding to the highest yield. However, although CRV5916 had the second-highest values of VIs, it was not classified into Group 1 with CRV4392 in 2020. This shows that a high irrigation rate is not favorable for screening drought-resistant cotton cultivars.
For the 90% ET treatment, water supply beyond sufficient levels masked the effects of other factors (e.g., weather) and kept the VIs and cotton yield of each cultivar at a close level for two years. In 2019, CRV5916 was classified into a group by itself with the highest VI values (Figure 4d), associated with the second-highest yield. CRV4392 and CRV1798 were grouped with higher VI values, corresponding to the first (2539 kg ha−1) and third yields (1971 kg ha−1), with CRV6427 in this group. In 2020, CRV4392 was grouped into a cluster by itself (Figure 5d) with the highest values of VIs, corresponding to the highest yield (2207 kg ha−1). CRV5916 and CRV1798 were grouped with higher VI values, corresponding to the second (2092 kg ha−1) and third yields (1942 kg ha−1), with CRV6427 also in this group. CRV5916, CRV4392, and CRV1798 had higher values of VIs in both years, indicating a greater amount of vegetative growth under sufficient water supply conditions.
4. Discussion
The yield discrepancies of the cotton cultivars between these two years were mainly attributed to the differences in weather patterns, irrigation amounts, and planting dates. The higher yield in the 0% ET treatment can be attributed to increased precipitation during the growing season. Conversely, the increased yields in the 30% and 60% ET treatments in 2020 were likely due to the greater irrigation amounts needed to meet the high ET demands. The precipitation in August of these two seasons was similar: 5.0 mm in 2019 and 4.5 in 2020. However, the accumulated ET0 of 2020 (292.0 mm) in this month was higher than in 2019 (197.3 mm), leading to higher ET requirements and a greater amount of irrigation for the three irrigation treatments in 2020 (Figure 2). Moreover, the cotton was planted 12 days earlier in 2020 than in 2019, facilitating a longer growing season in 2020. These factors resulted in a significantly higher yield for the 0%, 30%, and 60% ET treatments in 2020 than in 2019. However, there was no significant difference in cotton yield for the 90% ET treatment between these two seasons. This indicates that water supply beyond sufficient levels (e.g., 90% ET) does not cause an increase in cotton yield, and it may mask the effects of other weather factors, such as temperature. In addition, cultivars CRV4392 and CRV5916 had higher yields under limited irrigation conditions (e.g., 30% ET and 60% ET) in both seasons, indicating a greater yield potential under water stress. These two cultivars also had higher yields under high irrigation levels (e.g., 90% ET). Therefore, these two cultivars perform better in terms of high water-use efficiency under limited and sufficient water input conditions.
VIs have the potential to screen phenotypes in terms of water stress resistance, especially in the middle and late seasons. However, the performance of the tested VIs varied with irrigation treatments at different growth stages in this study. For example, CRV4392 had a significantly higher yield under the 60% ET and 90% ET treatments in 2020. Accordingly, the NDVI for CRV4392 was significantly higher than for the other cultivars in the mid-season (71 DAP in 2020), but it failed to differentiate cultivars under the 60% ET and 90% ET treatments in the late growing season due to saturation issues. On the other hand, the GNDVI for CRV4392 was significantly higher than for the other cultivars under the 90% ET treatment at 85 DAP and the 60% ET irrigation treatment at 99 DAP in 2020. The GNDVI is sensitive in estimating photosynthetic activity and is commonly used to determine water uptake into the plant canopy []. It has fewer saturation issues when measuring the reflectance of crops and assessing plant growth []. However, both the GNDVI and NDVI failed to differentiate cultivars under the 90% ET treatment at 99 DAP in 2020, while the EVI for CRV4392 was significantly higher than for the other cultivars. In both years, the EVI outperformed the other VIs in detecting cultivars’ response to water stress in the late growth stages under high irrigation levels (e.g., 90% ET). The EVI accounts for the nonlinear distortion from the soil background, reduces atmospheric contamination of the red band, and incorporates aerosol effects. This makes the EVI more responsive to variations in LAI, biomass, and canopy structure, especially in high-biomass areas []. Thus, the EVI is more effective than the other VIs in detecting plant growth in the mid-late growing season, indicating great potential in differentiating cultivars in cotton breeding.
The CWSI could only differentiate cultivars in response to water stress at the middle stage in 2019 and the late stage in 2020. The CWSI is based on canopy and air temperature measurements, which are more susceptible to environmental conditions. Canopy temperature fluctuates rapidly with changes in radiation, wind speed, and air temperature. However, the response of cultivars to water stress is a long-term and complex process. The use of the CWSI with transient characteristics to evaluate the performance of cultivars under water stress carries significant uncertainty. Although the CWSI failed to achieve consistent results in distinguishing cultivar performance under water stress in both years, it was able to detect differences in cotton growth between irrigation treatments. The CWSI can be used to measure the spatial distribution of crop water status and provide a real-time assessment on the canopy scale based on thermal images from UASs. Further research is needed to assess the robustness of the CWSI regarding timing and environmental conditions in selecting drought-resistant cultivars for plant breeding.
The growth characteristics of cultivars also impact the effectiveness of VIs’ detection. For example, CRV4392 and CRV5916 are early- and medium-maturing cultivars with high levels of drought stress tolerance (Table 1). In 2019, with negligible AP and a shorter growing season, CRV4392 and CRV5916 exhibited strong drought resistance, with higher vegetative growth and yields than the other cultivars, under 30% and 60% ET. Therefore, for cultivars exhibiting a strong relationship between vegetation growth and yield, VIs from UAS images can be used to screen cultivars under water stress conditions. However, screening based on VIs may be misleading for genotypes with low efficiency in converting vegetative growth to reproductive growth. For example, CRV9804 had high values of VIs but had a low yield, and it was classified into the same group as high-yielding cultivars under 30% and 60% ET rates. Meanwhile, CRV6427 was classified as a high-yielding cultivar with high VI values, but it had a significantly lower yield than the other cultivars in the 90% ET treatment (Table 3). These cultivars had higher values of VIs, indicating a higher level of vegetative growth during the season. However, the high level of drought stress tolerance and the aggressive growth of CRV9804 and CRV6427 did not translate into higher reproductive growth and yield (Table 1). This is consistent with previous studies that found that higher vegetative growth of some cultivars did not lead to higher yields [,].
Plants’ response to water stress is a complex process, and the resulting phenotypic traits tend to have extremely high dimensions []. High-throughput phenotyping using UAS images can provide large datasets and valuable information at high spatial and temporal scales. This technology holds great potential to bridge the genotype-to-phenotype gap in plant breeding by enabling the non-destructive extraction of the phenotypic characteristics of plant growth. In this study, VIs derived from UAS images were combined with the HCA for clustering cultivars. This method can reveal plant growth patterns within the multi-data set and uncover the natural groupings among different cotton cultivars. UAS images with high temporal and spatial resolution have great potential for understanding the similarities and differences between cotton cultivars under different environmental stress levels. However, these VIs do not directly indicate the specific plant traits contributing to the observed clustering. Therefore, further research is needed to identify traits using VIs, such as the relationships between plant biomass, leaf area, canopy structure, and VIs derived from UAS images.
5. Conclusions
This study applied the EVI, GNDVI, NDRE, NDVI, and CWSI derived from UAS images to assess the response of cotton cultivars to water deficit stress. Overall, the EVI, GNDVI, NDRE, and NDVI effectively differentiated cultivars in the middle and late seasons. The CWSI performed the best in detecting cultivars’ response to water stress at the middle stage when plants required the highest water supply in 2019 and at the late stage in 2020. The NDVI, GNDVI, NDRE, and EVI had a strong positive relationship with cotton yield starting from the mid-season. In addition, among these indicators, the EVI performed well in detecting differences in cotton cultivars under water stress and had the strongest relationship with yield in both years. In general, for cultivars exhibiting a strong relationship between vegetation growth and yield, the cotton cultivars were classified into high-yielding and low-yielding cultivars based on the VIs using the HCA method under 30% ET, 60% ET, and 90% ET irrigation rates during the late growing season. The EVI derived from UAS images with high temporal and spatial resolutions can effectively screen drought-resistant cotton varieties under 30% and 60% irrigation treatments. The successful classification of cultivars based on UAS images provides critical information for selecting suitable varieties in plant breeding to optimize irrigation management based on water availability scenarios. This technology enables the targeted selection of water-stress-resistant cotton cultivars, ultimately contributing to precision irrigation and sustainable agriculture in water-limited environments. Further studies are required to identify phenotypic traits using VIs to accelerate plant breeding processes through high-resolution UAS remote sensing.
Supplementary Materials
The following supporting information can be downloaded at https://www.mdpi.com/article/10.3390/rs16142609/s1: Table S1: Analysis of variance for cotton lint yield in response to irrigation treatment and cultivar at a research field in Lubbock County, Texas, in 2019 and 2020; Table S2: p-Values of two-way ANOVA showing effects of irrigation and cultivar on VIs and CWSI derived from UAS images in 2019; Table S3: p-Values of two-way ANOVA showing effects of irrigation and cultivar on VIs and CWSI derived from UAS images in 2020.
Author Contributions
Conceptualization, W.G., C.M. and H.G.; methodology, H.G., C.M. and W.G.; software, H.G.; validation, H.G., W.G., G.L.R. and C.M.; formal analysis, H.G.; investigation, H.G., C.M. and W.G.; resources, C.M. and W.G.; data curation, H.G.; writing—original draft preparation, H.G.; writing—review and editing, W.G., C.M. and G.L.R.; visualization, H.G.; supervision, W.G. and C.M.; project administration, C.M. and W.G.; funding acquisition, W.G. and C.M. All authors have read and agreed to the published version of the manuscript.
Funding
This research was funded by BASF and Texas Tech University.
Data Availability Statement
The original contributions presented in the study are included in the article, further inquiries can be directed to the corresponding author.
Conflicts of Interest
The authors declare no conflicts of interest.
References
- Chen, X.; Cui, Z.; Fan, M.; Vitousek, P.; Zhao, M.; Ma, W.; Wang, Z.; Zhang, W.; Yan, X.; Yang, J. Producing more grain with lower environmental costs. Nature 2014, 514, 486–489. [Google Scholar] [CrossRef] [PubMed]
- Vörösmarty, C.J.; Green, P.; Salisbury, J.; Lammers, R.B. Global water resources: Vulnerability from climate change and population growth. Science 2000, 289, 284–288. [Google Scholar] [CrossRef] [PubMed]
- Stewart, B.A. Dryland Farming. In Reference Module in Food Science; Elsevier: Amsterdam, The Netherlands, 2016. [Google Scholar]
- Omoyo, N.N.; Wakhungu, J.; Oteng’i, S. Effects of climate variability on maize yield in the arid and semi arid lands of lower eastern Kenya. Agric. Food Secur. 2015, 4, 8. [Google Scholar] [CrossRef]
- Kumar, V.; Joshi, S.; Pant, N.C.; Sangwan, P.; Yadav, A.N.; Saxena, A.; Singh, D. Molecular approaches for combating multiple abiotic stresses in crops of arid and semi-arid region. In Molecular Approaches in Plant Biology and Environmental Challenges; Springer: Berlin/Heidelberg, Germany, 2019; pp. 149–170. [Google Scholar]
- Lesk, C.; Rowhani, P.; Ramankutty, N. Influence of extreme weather disasters on global crop production. Nature 2016, 529, 84–87. [Google Scholar] [CrossRef] [PubMed]
- Lafitte, H.; Yongsheng, G.; Yan, S.; Li, Z. Whole plant responses, key processes, and adaptation to drought stress: The case of rice. J. Exp. Bot. 2007, 58, 169–175. [Google Scholar] [CrossRef] [PubMed]
- Khanna-Chopra, R.; Singh, K. Drought Resistance in Crops: Physiological and Genetic Basis of Traits for Crop Productivity. In Stress Responses in Plants; Tripathi, B., Müller, M., Eds.; Springer: Cham, Switzerland, 2015. [Google Scholar]
- Guo, W.; Gu, H.; Adedeji, O.; Ghimire, B. Advances in Remote/aerial Sensing of Crop Water Status. In Advances in Sensor Technology for Sustainable Crop Production; Burleigh Dodds Science Publishing: Sawston, UK, 2023. [Google Scholar]
- Fukai, S.; Cooper, M. Development of drought-resistant cultivars using physiomorphological traits in rice. Field Crops Res. 1995, 40, 67–86. [Google Scholar] [CrossRef]
- Xu, Y.; Crouch, J.H. Marker-assisted selection in plant breeding: From publications to practice. Crop Sci. 2008, 48, 391–407. [Google Scholar] [CrossRef]
- Richards, R.; Hunt, J.; Kirkegaard, J.; Passioura, J. Yield improvement and adaptation of wheat to water-limited environments in Australia—A case study. Crop Pasture Sci. 2014, 65, 676–689. [Google Scholar] [CrossRef]
- Araus, J.L.; Cairns, J.E. Field high-throughput phenotyping: The new crop breeding frontier. Trends Plant Sci. 2014, 19, 52–61. [Google Scholar] [CrossRef]
- Park, S.; Ryu, D.; Fuentes, S.; Chung, H.; Hernández-Montes, E.; O’Connell, M. Adaptive Estimation of Crop Water Stress in Nectarine and Peach Orchards Using High-Resolution Imagery from an Unmanned Aerial Vehicle (UAV). Remote Sens. 2017, 9, 828. [Google Scholar] [CrossRef]
- Aasen, H.; Honkavaara, E.; Lucieer, A.; Zarco-Tejada, P.J. Quantitative Remote Sensing at Ultra-High Resolution with UAV Spectroscopy: A Review of Sensor Technology, Measurement Procedures, and Data Correction Workflows. Remote Sens. 2018, 10, 1091. [Google Scholar] [CrossRef]
- Xu, J.; Gu, H.; Meng, Q.; Cheng, J.; Liu, Y.; Sheng, J.; Deng, J.; Bai, X. Spatial pattern analysis of Haloxylon ammodendron using UAV imagery-A case study in the Gurbantunggut Desert. IJAEO 2019, 83, 101891. [Google Scholar] [CrossRef]
- Mogili, U.R.; Deepak, B. Review on application of drone systems in precision agriculture. Procedia Comput. Sci. 2018, 133, 502–509. [Google Scholar] [CrossRef]
- Gu, H.; Lin, Z.; Guo, W.; Deb, S. Retrieving Surface Soil Water Content Using a Soil Texture Adjusted Vegetation Index and Unmanned Aerial System Images. Remote Sens. 2021, 13, 145. [Google Scholar] [CrossRef]
- Pajares, G. Overview and current status of remote sensing applications based on unmanned aerial vehicles (UAVs). Photogramm. Eng. Remote Sens. 2015, 81, 281–330. [Google Scholar] [CrossRef]
- Matese, A.; Toscano, P.; Di Gennaro, S.F.; Genesio, L.; Vaccari, F.P.; Primicerio, J.; Belli, C.; Zaldei, A.; Bianconi, R.; Gioli, B. Intercomparison of UAV, aircraft and satellite remote sensing platforms for precision viticulture. Remote Sens. 2015, 7, 2971–2990. [Google Scholar] [CrossRef]
- Primicerio, J.; Di Gennaro, S.F.; Fiorillo, E.; Genesio, L.; Lugato, E.; Matese, A.; Vaccari, F.P. A flexible unmanned aerial vehicle for precision agriculture. Precis. Agric. 2012, 13, 517–523. [Google Scholar] [CrossRef]
- Rebetzke, G.; Jimenez-Berni, J.; Fischer, R.; Deery, D.; Smith, D. High-throughput phenotyping to enhance the use of crop genetic resources. Plant Sci. 2019, 282, 40–48. [Google Scholar] [CrossRef]
- Ostos-Garrido, F.J.; De Castro, A.I.; Torres-Sánchez, J.; Pistón, F.; Peña, J.M. High-throughput phenotyping of bioethanol potential in cereals using UAV-based multi-spectral imagery. Front. Plant Sci. 2019, 10, 948. [Google Scholar] [CrossRef]
- Sankaran, S.; Zhou, J.; Khot, L.R.; Trapp, J.J.; Mndolwa, E.; Miklas, P.N. High-throughput field phenotyping in dry bean using small unmanned aerial vehicle based multispectral imagery. Comput. Electron. Agric. 2018, 151, 84–92. [Google Scholar] [CrossRef]
- Matese, A.; Baraldi, R.; Berton, A.; Cesaraccio, C.; Di Gennaro, S.; Duce, P.; Facini, O.; Mameli, M.; Piga, A.; Zaldei, A. Estimation of Water Stress in Grapevines Using Proximal and Remote Sensing Methods. Remote Sens. 2018, 10, 114. [Google Scholar] [CrossRef]
- Watanabe, K.; Guo, W.; Arai, K.; Takanashi, H.; Kajiya-Kanegae, H.; Kobayashi, M.; Yano, K.; Tokunaga, T.; Fujiwara, T.; Tsutsumi, N.; et al. High-Throughput Phenotyping of Sorghum Plant Height Using an Unmanned Aerial Vehicle and Its Application to Genomic Prediction Modeling. Front. Plant Sci. 2017, 8, 421. [Google Scholar] [CrossRef] [PubMed]
- Ballesteros, R.; Ortega, J.F.; Hernandez, D.; Moreno, M.A. Onion biomass monitoring using UAV-based RGB imaging. Precis. Agric. 2018, 19, 840–857. [Google Scholar] [CrossRef]
- Blanco, V.; Blaya-Ros, P.J.; Castillo, C.; Soto-Vallés, F.; Torres-Sánchez, R.; Domingo, R. Potential of UAS-Based Remote Sensing for Estimating Tree Water Status and Yield in Sweet Cherry Trees. Remote Sens. 2020, 12, 2359. [Google Scholar] [CrossRef]
- Alchanatis, V.; Cohen, Y.; Cohen, S.; Moller, M.; Sprinstin, M.; Meron, M.; Tsipris, J.; Saranga, Y.; Sela, E. Evaluation of different approaches for estimating and mapping crop water status in cotton with thermal imaging. Precis. Agric. 2009, 11, 27–41. [Google Scholar] [CrossRef]
- Gonzalez-Dugo, V.; Goldhamer, D.; Zarco-Tejada, P.J.; Fereres, E. Improving the precision of irrigation in a pistachio farm using an unmanned airborne thermal system. Irrig. Sci. 2014, 33, 43–52. [Google Scholar] [CrossRef]
- Shivers, S.W.; Roberts, D.A.; McFadden, J.P. Using paired thermal and hyperspectral aerial imagery to quantify land surface temperature variability and assess crop stress within California orchards. Remote Sens. Environ. 2019, 222, 215–231. [Google Scholar] [CrossRef]
- Bian, J.; Zhang, Z.; Chen, J.; Chen, H.; Cui, C.; Li, X.; Chen, S.; Fu, Q. Simplified Evaluation of Cotton Water Stress Using High Resolution Unmanned Aerial Vehicle Thermal Imagery. Remote Sens. 2019, 11, 267. [Google Scholar] [CrossRef]
- Bellvert, J.; Marsal, J.; Girona, J.; Zarco-Tejada, P.J. Seasonal evolution of crop water stress index in grapevine varieties determined with high-resolution remote sensing thermal imagery. Irrig. Sci. 2014, 33, 81–93. [Google Scholar] [CrossRef]
- Jang, G.; Kim, J.; Yu, J.-K.; Kim, H.-J.; Kim, Y.; Kim, D.-W.; Kim, K.-H.; Lee, C.W.; Chung, Y.S. Review: Cost-Effective Unmanned Aerial Vehicle (UAV) Platform for Field Plant Breeding Application. Remote Sens. 2020, 12, 998. [Google Scholar] [CrossRef]
- Su, W.; Zhang, M.; Bian, D.; Liu, Z.; Huang, J.; Wang, W.; Wu, J.; Guo, H. Phenotyping of Corn Plants Using Unmanned Aerial Vehicle (UAV) Images. Remote Sens. 2019, 11, 2021. [Google Scholar] [CrossRef]
- Rallo, P.; de Castro, A.I.; López-Granados, F.; Morales-Sillero, A.; Torres-Sánchez, J.; Jiménez, M.R.; Jiménez-Brenes, F.M.; Casanova, L.; Suárez, M.P. Exploring UAV-imagery to support genotype selection in olive breeding programs. Sci. Hortic. 2020, 273, 109615. [Google Scholar] [CrossRef]
- Yang, G.; Li, C.; Yu, H.; Xu, B.; Feng, H.; Gao, L.; Zhu, D. UAV based multi-load remote sensing technologies for wheat breeding information acquirement. Trans. Chin. Soc. Agric. Eng. 2015, 31, 184–190. [Google Scholar]
- Tattaris, M.; Reynolds, M.P.; Chapman, S.C. A Direct Comparison of Remote Sensing Approaches for High-Throughput Phenotyping in Plant Breeding. Front. Plant Sci. 2016, 7, 1131. [Google Scholar] [CrossRef]
- Han, L.; Yang, G.; Yang, H.; Xu, B.; Li, Z.; Yang, X. Clustering Field-Based Maize Phenotyping of Plant-Height Growth and Canopy Spectral Dynamics Using a UAV Remote-Sensing Approach. Front. Plant Sci. 2018, 9, 1638. [Google Scholar] [CrossRef]
- Zhou, J.; Yungbluth, D.; Vong, C.N.; Scaboo, A.; Zhou, J. Estimation of the Maturity Date of Soybean Breeding Lines Using UAV-Based Multispectral Imagery. Remote Sens. 2019, 11, 2075. [Google Scholar] [CrossRef]
- Micasense. Downwelling Light Sensor (DLS) Integration Guide and User Manual. Available online: https://support.micasense.com/hc/en-us/article_attachments/115005797168 (accessed on 25 May 2024).
- Honkavaara, E.; Eskelinen, M.A.; Pölönen, I.; Saari, H.; Ojanen, H.; Mannila, R.; Holmlund, C.; Hakala, T.; Litkey, P.; Rosnell, T. Remote sensing of 3-D geometry and surface moisture of a peat production area using hyperspectral frame cameras in visible to short-wave infrared spectral ranges onboard a small unmanned airborne vehicle (UAV). ITGRS 2016, 54, 5440–5454. [Google Scholar] [CrossRef]
- Jones, M. Plant microclimate. In Photosynthesis and Production in a Changing Environment; Springer: Berlin/Heidelberg, Germany, 1993; pp. 47–64. [Google Scholar]
- Guilioni, L.; Jones, H.; Leinonen, I.; Lhomme, J.-P. On the relationships between stomatal resistance and leaf temperatures in thermography. Agric. For. Meteorol. 2008, 148, 1908–1912. [Google Scholar] [CrossRef]
- Jones, H. Use of thermography for quantitative studies of spatial and temporal variation of stomatal conductance over leaf surfaces. Plant Cell Environ. 1999, 22, 1043–1055. [Google Scholar] [CrossRef]
- Ben-Gal, A.; Agam, N.; Alchanatis, V.; Cohen, Y.; Yermiyahu, U.; Zipori, I.; Presnov, E.; Sprintsin, M.; Dag, A. Evaluating water stress in irrigated olives: Correlation of soil water status, tree water status, and thermal imagery. Irrig. Sci. 2009, 27, 367–376. [Google Scholar] [CrossRef]
- Chen, D.; Neumann, K.; Friedel, S.; Kilian, B.; Chen, M.; Altmann, T.; Klukas, C. Dissecting the phenotypic components of crop plant growth and drought responses based on high-throughput image analysis. Plant Cell 2014, 26, 4636–4655. [Google Scholar] [CrossRef]
- Liu, F.; Deng, Y. Determine the number of unknown targets in Open World based on Elbow method. IEEE Trans. Fuzzy Syst. 2020, 29, 986–995. [Google Scholar] [CrossRef]
- Candiago, S.; Remondino, F.; De Giglio, M.; Dubbini, M.; Gattelli, M. Evaluating Multispectral Images and Vegetation Indices for Precision Farming Applications from UAV Images. Remote Sens. 2015, 7, 4026–4047. [Google Scholar] [CrossRef]
- Ma, B.; Morrison, M.J.; Dwyer, L.M. Canopy light reflectance and field greenness to assess nitrogen fertilization and yield of maize. Agron. J. 1996, 88, 915–920. [Google Scholar] [CrossRef]
- Gao, X.; Huete, A.R.; Ni, W.; Miura, T. Optical–biophysical relationships of vegetation spectra without background contamination. Remote Sens. Environ. 2000, 74, 609–620. [Google Scholar] [CrossRef]
- Mao, L.; Zhang, L.; Zhao, X.; Liu, S.; van der Werf, W.; Zhang, S.; Spiertz, H.; Li, Z. Crop growth, light utilization and yield of relay intercropped cotton as affected by plant density and a plant growth regulator. Field Crops Res. 2014, 155, 67–76. [Google Scholar] [CrossRef]
- Pettigrew, W.T. Moisture Deficit Effects on Cotton Lint Yield, Yield Components, and Boll Distribution. Agron. J. 2004, 96, 377–383. [Google Scholar] [CrossRef]
Disclaimer/Publisher’s Note: The statements, opinions and data contained in all publications are solely those of the individual author(s) and contributor(s) and not of MDPI and/or the editor(s). MDPI and/or the editor(s) disclaim responsibility for any injury to people or property resulting from any ideas, methods, instructions or products referred to in the content. |
© 2024 by the authors. Licensee MDPI, Basel, Switzerland. This article is an open access article distributed under the terms and conditions of the Creative Commons Attribution (CC BY) license (https://creativecommons.org/licenses/by/4.0/).