Article

Estimation of Rice Leaf Area Index Utilizing a Kalman Filter Fusion Methodology Based on Multi-Spectral Data Obtained from Unmanned Aerial Vehicles (UAVs)

National Engineering and Technology Center for Information Agriculture, Engineering and Research Center of Smart Agriculture (Ministry of Education), Key Laboratory for Crop System Analysis and Decision Making (Ministry of Agriculture and Rural Affairs), Jiangsu Key Laboratory for Information Agriculture, Jiangsu Collaborative Innovation Center for Modern Crop Production, Nanjing Agricultural University, 1 Weigang Road, Nanjing 210095, China
*
Author to whom correspondence should be addressed.
These authors contributed equally to this work.
Remote Sens. 2024, 16(12), 2073; https://doi.org/10.3390/rs16122073
Submission received: 29 April 2024 / Revised: 3 June 2024 / Accepted: 5 June 2024 / Published: 7 June 2024
(This article belongs to the Special Issue UAS Technology and Applications in Precision Agriculture)

Abstract

:
The rapid and accurate estimation of leaf area index (LAI) through remote sensing holds significant importance for precise crop management. However, the direct construction of a vegetation index model based on multi-spectral data lacks robustness and spatiotemporal expansibility, making its direct application in practical production challenging. This study aimed to establish a simple and effective method for LAI estimation to address the issue of poor accuracy and stability that is encountered by vegetation index models under varying conditions. Based on seven years of field plot trials with different varieties and nitrogen fertilizer treatments, the Kalman filter (KF) fusion method was employed to integrate the estimated outcomes of multiple vegetation index models, and the fusion process was investigated by comparing and analyzing the relationship between fixed and dynamic variances alongside the fusion accuracy of optimal combinations during different growth stages. A novel multi-model integration fusion method, KF-DGDV (Kalman Filtering with Different Growth Periods and Different Vegetation Index Models), which combines the growth characteristics and uncertainty of LAI, was designed for the precise monitoring of LAI across various growth phases of rice. The results indicated that the KF-DGDV technique exhibits a superior accuracy in estimating LAI compared with statistical data fusion and the conventional vegetation index model method. Specifically, during the tillering to booting stage, a high R2 value of 0.76 was achieved, while at the heading to maturity stage, it reached 0.66. In contrast, within the framework of the traditional vegetation index model, the red-edge difference vegetation index (DVIREP) model demonstrated a superior performance, with an R2 value of 0.65, during tillering to booting stage, and 0.50 during the heading to maturity stage, respectively. The multi-model integration method (MME) yielded an R2 value of 0.67 for LAI estimation during the tillering to booting stage, and 0.53 during the heading to maturity stage. Consequently, KF-DGDV presented an effective and stable real-time quantitative estimation method for LAI in rice.

1. Introduction

Leaf area index (LAI) is half of the total intercepting area per unit ground surface area [1]. It serves as a crucial parameter and physiological indicator for crop photosynthesis, productivity, and water utilization [2]. The quantitative inversion of LAI through remote sensing technology holds immense significance in achieving precise crop management strategies [3].
In recent years, consumer unmanned aerial vehicles equipped with multi-spectral sensors have garnered significant interest in the field of LAI monitoring [4,5,6]. Given the close relationship between spectral information from vegetation leaves and photosynthesis, the development of a vegetation index model based on remote sensing imagery stands as the primary approach for LAI inversion due to its simplicity and high computational efficiency. The estimation methods can be broadly categorized into four groups. Firstly, there is the direct application of classical vegetation indices, entailing the establishment of quantitative models that directly relate these indices to LAI. For instance, Zhou et al. [7] conducted a comparative analysis on the correlation between various classical vegetation indices and LAI, revealing that the vegetation index comprising of red-edge band and near-infrared band exhibited a superior monitoring efficacy for LAI compared to other indices. The second type involves the development of a novel vegetation index, wherein the classical vegetation index is modified to enhance the estimation accuracy under specific conditions. For instance, Li et al. [8] devised the red-edge difference index to address inaccuracies in LAI estimation caused by straw background in rice–wheat rotation fields. The third category is radiative transfer models. Roosjen et al. [9] employed a multi-spectral camera mounted on an unmanned aerial vehicle (UAV) to capture spectral data from multiple angles. These data were then used as input parameters for the radiative transfer model, resulting in an improved estimation accuracy for LAI and leaf chlorophyll content (LCC). The fourth category encompasses the comprehensive utilization of vegetation indices, entailing the simultaneous inversion of LAI using multiple vegetation indices. As an illustration, Brede et al. [10] proposed a hybrid retrieval approach that combines various vegetation indices with non-parametric machine learning regression algorithms and a vegetation radiative transfer model. This method enabled the rapid and precise monitoring of LAI, yielding an optimal inversion model with an RMSE value of 0.91. Despite the simplicity and computational efficiency of the vegetation index model, selecting an optimal vegetation index across different studies remains challenging, leading to a lack of continuity in the study and utilization of novel vegetation indices.
Although various vegetation indices have been proposed for background elimination, their sensitivity to specific indicators and other issues prevent any single index from integrating all advantages simultaneously. When dealing with the same set of remote sensing data, different vegetation indices yield distinct outcomes due to their inherent limitations and biases, whereas employing a multi-model integration approach can effectively mitigate the bias associated with individual models, thereby enhancing the estimation accuracy [11,12]. Simultaneously, this method enables the amalgamation of each model’s strengths in LAI estimation, facilitating more precise and dependable results. Commonly employed multi-model integration techniques for LAI estimation encompass three categories. The first method is the average or median method, which involves the simple average or weighted fusion of LAI outputs from different models. The resulting performance surpasses that of a single vegetation index model [13]. The second approach involves the utilization of machine learning techniques, wherein multiple vegetation indices and measured data are employed to train a model for predicting LAI [14,15]. Furthermore, a comprehensive integration of the aforementioned methods was adopted. For instance, Yue et al. [16] utilized a vegetation index weighting method to estimate LAI from RGB and hyperspectral images captured using UAVs, which was further enhanced by incorporating the random forest regression technique to improve the estimation accuracy of LAI. It is evident that the integration of multiple models can significantly enhance the accuracy of LAI estimation. The multi-model integration of machine learning methods is a black box model, which lacks a mechanism and its use is more complex, as well as its precision essentially being dependent on the quantity and dimension of the sample [17]. Consequently, there is a need for a multi-model integration method that exhibits simplicity in application, mechanical rationality, and robustness in practical scenarios.
The Kalman filter (KF) fusion technique is a state model estimation-based weighted fusion method that effectively mitigates the uncertainty level of the fusion model by leveraging uncertainty information for accurate state prediction and estimation [18,19]. In comparison with other multi-model integration methods, KF fusion is more real-time and is capable of processing large amounts of data within a short time frame [20]. Recently, KF fusion has gained widespread adoption across various research fields. For instance, Jin et al. [21] proposed a novel assimilation scheme based on the Ensemble Kalman Filter, which effectively integrated multi-temporal and multi-resolution remote sensing observations to estimate LAI. This approach successfully captured temporal changes in LAI across multiple scales, thereby enhancing the accuracy of LAI estimation. Lai et al. [22] have developed an adaptive KF fusion method, which exhibits a superior estimation accuracy in terms of unknown delay and loss probability compared to existing methods. In summary, while KF fusion effectively addresses the uncertainty associated with a single model, there is a dearth of feature analysis and adaptive algorithm enhancements for fusion targets in LAI estimation studies.
A practical and robust approach for estimating LAI should possess simplicity, accuracy, repeatability, and versatility. Current studies on LAI monitoring primarily rely on machine learning and other sophisticated methods to enhance accuracy. Nevertheless, these approaches are relatively intricate and lack practical advantages. Although the vegetation index model method is straightforward, it lacks sufficient robustness and universality. In this study, multiple groups of vegetation indices were calculated based on the Mini-MCA multi-spectral imager, and their quantitative relationship with LAI was investigated. Several vegetation index models exhibiting a high correlation were selected for KF fusion to improve the accuracy and stability of the estimation results. Therefore, the aims of this study are as follows: (1) to quantify the uncertainty of diverse vegetation index models and construct KF fusion models; (2) to develop a multi-model integrated monitoring approach for the LAI of rice that accounts for different growth stages and varying combinations of vegetation index models; and (3) to assess the impact of various multi-model integration techniques on the precision of LAI monitoring models.

2. Materials and Methods

2.1. Experimental Design

The experiments were conducted at the National Information Agriculture Engineering Technology Center (NETCIA) test station in Rugao, Jiangsu Province, China. The study consisted of nine field plot experiments where furrow plots were mulched and irrigated with distinct drainage systems. These experiments included different years, nitrogen fertilizer levels, planting densities, and rice varieties as varying factors. Remote sensing images were obtained using the Mini-MCA multi-spectral imager for experiments 1–8 and Airphen for experiment 9. The specific test design and sampling times are shown in Table 1.

2.2. UAV Multi-Spectral Data Acquisition and LAI Determination

The UAV utilized in this study is the DJI M600 PRO, a six-rotor drone manufactured by DJI in Shenzhen, China. During experiments 1–8, the UAV was equipped with the MiniMCA-6 multi-spectral camera (Tetracam, Inc., Chatsworth, CA, USA). This camera captures images across various spectral bands, as follows: B1 (490 nm), B2 (550 nm), B3 (680 nm), B4 (720 nm), B5 (800 nm), and B6 (900 nm). In experiment 9, an Airphen multi-spectral camera (Hiphen, Inc., Avignon, France) was mounted on the drone for data collection purposes. The flights were conducted during the critical growth period in rice under favorable weather conditions between 10 a.m. and 2 p.m., ensuring clear skies and minimal wind or low wind speeds. Image processing procedures referred to the methods of Li et al. [23]. Following each UAV flight session, a destructive sampling took place within each test plot where three typical plant holes were selected for leaf area index determination. After sampling, the green leaves were separated from the stems and the leaf area was measured using the LI-3100C laser plant meter (LI-3100C; LICOR Inc., Lincoln, NE, USA). According to planting density, the LAI was calculated for each treated plot.

2.3. Vegetation Index

To fully exploit the multi-band information captured using a multi-spectral camera, 12 widely used vegetation indices were selected in this study. The calculation formulas are presented in Table 2. Additionally, the modeling accuracy of each vegetation index and LAI in both linear and exponential forms was analyzed.

2.4. Multi-Model Fusion Approach

(1) The multi-model integration method (MME) based on simple statistical analysis includes three methods. The first is the average method, which assigns equal weight to the estimated results of all vegetation index models. The second is the average after de-minimization method, which calculates the average after removing the maximum and minimum values. The third is the median method, which arranges the estimated results of all vegetation index models in order and takes the median.
(2) The multi-model integration method based on a KF is a data assimilation technique proposed by Evensen [35]. The uncertainty of the measurement is taken into account to provide a more accurate state estimate. By calculating the predicted value and variance of the fusion model using μ and σ from each individual model, this approach effectively leverages uncertainty information to achieve state prediction and estimation. Therefore, the KF fusion algorithm was employed to filter and fuse the estimated results obtained from vegetation index models in this study. Two exemplary models utilizing the classical KF fusion formula were used to illustrate this approach. In this context, μ represents the mean of the model, σ represents the standard deviation of the model, and f(x) denotes a function that describes the system’s state transition. The variable x typically denotes the state vector of the system, while i is used to distinguish the empirical models being fused. μ′ represents the mean of the new model, and σ′ represents the standard deviation of the new model.
(1)
The model prediction equation represents the probability density function of a normal distribution. Here, fi(x) is the probability density of the variable x for the i-th model.
f i x = 1 2 π σ i x μ i 2 2 σ i 2
(2)
Prediction equation after fusion of two models. When combining two normal distributions, the resulting function f(x) represents the fused prediction. The means and variances from both models are incorporated into a single exponent, implying the combined influence of both distributions on the variable x.
f x = 1 2 π σ 1 σ 2 x μ 1 2 2 σ 1 2 + x μ 2 2 2 σ 2 2
(3)
If f x = 0 , the inclusion center of the function, which represents the average value in the prediction model, can be determined. This formula gives the new mean μ′ after fusing two models. It is a weighted average of the means μ1 and μ2 of the individual models, where the weights are determined by the variances σ 1 2   a n d   σ 2 2 .
  μ = μ 1 + σ 1 2 μ 2 μ 1 σ 1 2 + σ 2 2
(4)
If f x = 0 , the degree of dispersion of the function, that is, the variance of the prediction model, can be obtained as follows:
σ 2 = σ 1 2 σ 2 2 σ 1 2 + σ 2 2
(5)
If multiple models are fused, they form a new prediction model. This extends the concept of fusing two models to i models. The resulting fused prediction model f(x) incorporates the influence of i different normal distributions.
f x = 1 2 π σ 1 σ 2 σ i x μ 1 2 2 σ 1 2 + x μ 2 2 2 σ 2 2 + + x μ i 2 2 σ i 2
(6)
Find the predicted value and variance of the fusion model, f x = 0 and f x = 0 .
The multi-model integration method, based on the fusion of dynamic variance KF, was devised to address the necessity for vegetation index monitoring models with different LAI to account for inversion errors within specific ranges. Specifically, it aims to ensure that more than 68% of these errors fall within one standard deviation, more than 95% fall within two standard deviations, and more than 99% fall within three standard deviations. To accomplish this objective, a dynamic equation for σ is formulated and incorporated into the new prediction model.
KF-DGDV is a specialized application that utilizes the traditional KF method, integrating data through a variety of vegetation indices across distinct growth stages in order to optimize outcomes. Compared to the previous KF fusion method, this approach better aligns with the variation characteristics of LAI.
The technical roadmap for this study is illustrated in Figure 1.

2.5. Data Utilization and Analysis

Correlation analysis was performed to examine the relationship between the calculated vegetation index and the LAI value of rice. Subsequently, a set of vegetation indices exhibiting a strong correlation were selected as the input variables for the aforementioned data fusion process, aiming to assess the accuracy of various data fusion models.
To assess the accuracy of data fusion, coefficients of determination (R2), root mean square error (RMSE), and mean absolute percentage error (MAPE) were employed to compare the measured value with the remote-sensed value. Here, O and P represent the measured and predicted values, respectively, while n represents the number of samples.
R 2 = i = 1 n O i O ¯ P i P ¯ Σ = 1 n O i O ¯ 2 2
R M S E = Σ = 1 n O i P i 2 n
M A P E = 100 % n i = 1 n P i O i O i
The nine aforementioned experiments were categorized into four experimental groups. The whole growth period was divided into two growth stages—the tillering–booting stage (S1) and the heading–maturity stage (S2)—and the effect difference of the whole growth stage modeling (WM) and growth stage modeling (SM) was compared.
The entire dataset was utilized for analyzing the relationship between the spectrum and the LAI, as well as investigating the impact of data fusion. The model was constructed using different test groups, and the generalization ability was verified by the remaining test experiments.
Detailed information regarding specific test groups and datasets can be found in Table 3.

3. Results

3.1. Vegetation Index Estimation Model of Rice LAI

3.1.1. Relationship between LAI and Vegetation Index of Rice during the Whole Growth Period

Studies have demonstrated a discernible association between the LAI and the vegetation index throughout all the growth stages of rice (Table 4). Most vegetation indices displayed a significant correlation with the LAI, with the exception of certain experiments where the ratio vegetation index (RVI) and the enhanced vegetation index (EVI) exhibited an insignificant correlation. Compared to the non-red-edged vegetation index, the red-edged vegetation index of the same type exhibited a superior performance, with an average increase in R2 of 0.27. It was noteworthy that RVIREP demonstrated the most significant enhancement in accuracy when compared to RVI.
Among the three groups, DVIREP (Figure 2a) exhibited the highest and most significant correlations, followed by NDVIREP (Figure 2b). A comprehensive analysis of all test results revealed that DVIREP demonstrated the strongest correlation, with an R2 value of 0.61. However, for LAI > 6.0, the model inversion results displayed a greater divergence, leading to larger deviations compared to NDVIREP.

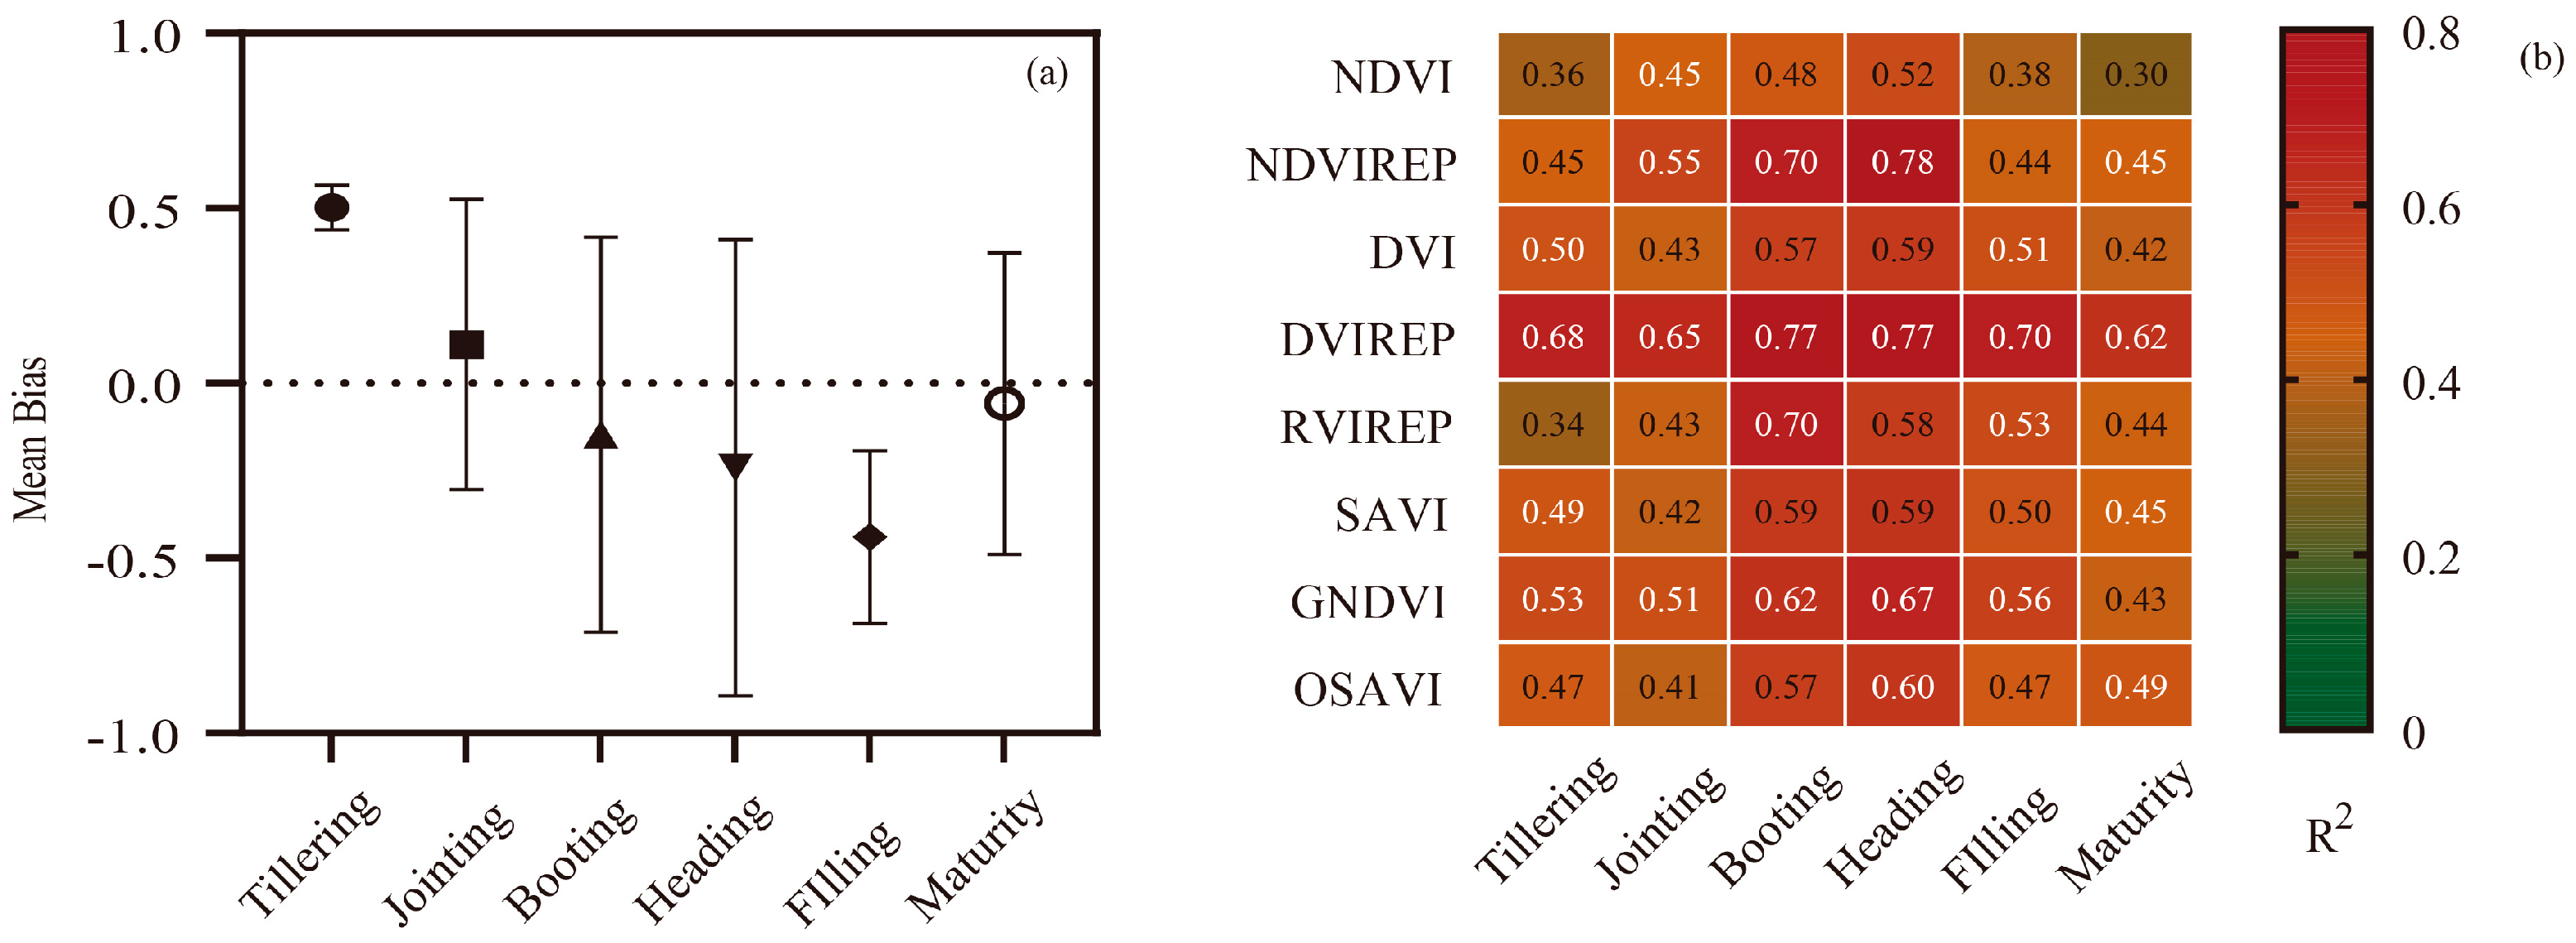
3.1.2. Relationship between LAI and Vegetation Index of Rice at Different Growth Stages

The LAI throughout the entire rice growth stage was divided into two stages—the tillering–booting stage and the heading–maturity stage. The results showed that both the RMSE (Figure 3a) and the MAPE (Figure 3b) exhibited a consistent reduction across all trial groups. On average, there was a decrease of 0.29 in the RMSE, and a reduction of 13.2% in the MAPE, with most differences being statistically significant. Significantly, group 3, which is based on multiple varieties, demonstrated the most pronounced improvement in error reduction, particularly during the pre-heading stage. Compared with the DVIREP model that is constructed using data from the entire growth period (Figure 2a), the models based on the stages before (Figure 4a) and after heading (Figure 4b) resulted in an enhanced accuracy of LAI estimation and an improved convergence, as depicted using scatter plot analysis.

3.2. Estimation of Rice LAI Based on Statistical Data Fusion

The most commonly employed data fusion method for estimating multiple vegetation index models in this study involves utilizing statistical techniques such as mean and median for ensemble forecasting. To improve the modeling accuracy, the two vegetation indices with the poorest performance, namely RVI and EVI, were excluded. Subsequently, data fusion methods including average, average after de-extremum removal, and median were applied to the remaining ten vegetation indices (Figure 5). The results indicated that these three statistical-based data fusion methods effectively enhance the accuracy of LAI estimation and reduce errors, particularly during the tillering to booting stage. By employing these statistical fusion methods instead of directly using a vegetation index model at these stages, significant improvements were observed, with a decrease in RMSE of 0.1 and a decrease in MAPE of 12.3%. Similarly, throughout the heading to maturity stage, there was an average decrease of 0.04 in RMSE, and 2.2% in MAPE. In particular, after removing the extreme values, the average method exhibited a superior accuracy, with the lowest RMSE observed among all approaches considered. Furthermore, compared to the other two methods, it is evident that the median method demonstrates enhanced convergence capabilities for outliers, while maintaining minimal mean absolute percentage error levels.

3.3. Estimation of Rice LAI Based on KF Fusion Method

3.3.1. Estimation of Rice LAI Based on Classical KF Fusion Method

The foundation of KF fusion lies in the recognition that every vegetation index model is subject to errors, which follow a Gaussian distribution. First, the normal distribution of the discrepancy between the estimated results of ten vegetation index models employed in this study and the measured LAI was assessed. Subsequently, the variance as an input parameter for KF fusion was determined in subsequent steps. Table 5 presents the disparity results between all vegetation index models and the measured LAI. The absolute value of kurtosis was below 10 and skewness falls within a range less than 3, satisfying both Gaussian distribution requirements and fundamental conditions for KF fusion. The fusion results are depicted in Figure 6. During the tillering to booting stage, the KF fusion method demonstrated a comparable estimation accuracy to the three statistical data fusion methods. However, as maturity is approached, a notable improvement was observed, with an average decrease of 0.12 in RMSE, and a 2.8% reduction in MAPE compared to the statistical data fusion method, indicating an enhanced performance.
The results showed that KF fusion exhibits a superior prediction accuracy for LAI for the heading to maturity stage, with lower RMSE and MAPE values compared to other fusion methods. Independent analysis of the fusion results from different experimental groups indicated that across all experimental groups, KF fusion outperformed statistical data fusion methods such as the average method, in terms of prediction accuracy. This superiority was particularly evident in the experimental group characterized by a poor estimation accuracy and a greater uncertainty of vegetation index model.

3.3.2. Estimation of Rice LAI using KF Fusion Method Based on Dynamic Variance

The LAI of rice exhibited a gradual increase from the tillering to booting stage, followed by a subsequent decrease from the heading to maturity stage. In particular, during the tillering to booting stage, lower LAI values were predominantly observed. Nevertheless, if a vegetation index model was employed for LAI estimation, the mean variance exceeds 1 at each growth stage. Utilizing smaller LAI values and larger variances as the input parameters for the KF fusion method poses challenges in fully harnessing its advantages in uncertainty fusion and reduction. This observation may also elucidate why the accuracy of LAI estimation based on the classical KF fusion method during the tillering to booting stage does not significantly differ from other fusion methods.
By formulating a dynamic equation (Table 6), the results indicated that the dynamic σ method effectively reduced the average σ value by 30.9% during the tillering to booting stage, and by 20.4% during the heading to maturity stage compared with the fixed σ approach. Moreover, through employing dynamic σ KF fusion, significant improvements were observed in terms of the R2 coefficient of determination across all experiments. Additionally, the RMSE was reduced by 0.15 in the tillering stage, and by 0.12 in the maturity stage, respectively, while the MAPE successfully exhibited a decrease of 5.5% from the tillering to booting stage, and a reduction of 1% from the heading to maturity stage.

3.4. Adaptive Optimization of KF Fusion Method

3.4.1. Determination of the Number of Optimal Coupled Vegetation Indices

The presence of multicollinearity was initially assessed using the variance inflation factor (VIF). Variables with VIF values exceeding 10 generally indicate severe multicollinearity and should be eliminated. VIF analysis was conducted to examine multicollinearity among variables (Figure 7); the results showed that most vegetation indices exhibited a variance expansion factor below 5. DVI and SAVI demonstrate a higher variance expansion factor due to shared components in their calculation formulas. On the contrary, there was a heavy multilinearity observed between NDVI, kNDVI, and NIRv. Therefore, the next study selected the more commonly used NDVI and no longer analyzed kNDVI and NIRv.
According to the average correlation between the rice LAI and each vegetation index in this study, the descending order was conducted, and the data fusion of all eight vegetation index models was compared; the fusion number was successively reduced until the fusion accuracy of the two vegetation index models with the best correlation was reached (Table 7). The results indicated that there was an initial increase followed by a decrease in the coefficient of determination, as the coupling number decreased. Similarly, both RMSE and MAPE values initially decreased but then increased with decreased coupling number. The trends observed for fixed error and dynamic error were essentially similar. It is worth noting that if the four vegetation indices that exhibit the highest correlation with LAI were fused using KF fusion, it yielded a superior performance in terms of determination coefficients, RMSE, and MAPE values.

3.4.2. Effects of Different Vegetation Index Combinations in Different Growth Periods on Fusion Accuracy

Figure 8a shows that most vegetation index models exhibit a tendency to overestimate during the tillering and jointing stages, while underestimating during the filling and ripening stages. Simultaneously, in the KF fusion evaluation of various vegetation index models, it was found that the fusion effect of the four models with the highest correlation was better than that of other models. Consequently, in terms of data fusion, the KF-DGDV method was used, which integrated different growth periods and different combinations of vegetation indices. Four vegetation index models with the highest correlation were selected, denoted by white numbers at each growth stage (Figure 8b).
Using different combinations of vegetation index models across various growth stages (Figure 9), the results showed that the KF-DGDV method effectively enhances the LAI estimation accuracy of rice and outperformed other KF fusion methods. In comparison to DVIREP, which exhibited a superior performance in the single vegetation index model, the KF-DGDV method expressively improved the LAI estimation accuracy by increasing the average R2 value by 0.13 and performed well in reducing the MAPE and RMSE values. The average decrease in RMSE was 0.23, whereas the decline in MAPE amounted to 7.2%. These findings indicated a significant enhancement in LAI estimation compared to traditional vegetation index model methods.

3.5. Prediction Results of Each LAI Estimation Model under Different Scenarios

The transferability of vegetation index model, MME, and KF-DGDV fusion across different years and rice varieties was further compared and analyzed (Table 8). The results revealed that the transfer of the vegetation index model exhibited a poor performance between different years and rice varieties, particularly among diverse rice varieties. Moreover, it was observed that the transferability of models varied before and after heading, but remained relatively consistent across different varieties in rice. Both the MME and KF-DGDV models effectively addressed the issue of inadequate transferability in contrast to conventional vegetation index models. Notably, KF-DGDV demonstrated a superior performance, with a reduction in RMSE of 0.23 during the tillering to booting stage, and of 0.41 during the heading to maturity stage. This enhancement can be attributed to accurately capturing model uncertainty levels while minimizing the overall uncertainty levels.
Finally, the fusion performance of the vegetation index model, MME, and KF-DGDV was validated using another multi-spectral sensor (Figure 10). Compared to the remote sensing data obtained using AIRPHEN, all three LAI estimation models demonstrated consistency with the results from the Mini-MCA sensor. Moreover, both the average method and KF-DGDV effectively improved the low estimation accuracy of a single vegetation index model. Remarkably, KF-DGDV exhibited a superior effectiveness, as evidenced by a decrease in RMSE of 0.45 from the tillering to booting stage, and of 0.21 from the heading to maturity stage. These results indicated that the KF-DGDV method proposed in this study was also applicable to other multi-spectral sensors.

4. Discussion

The primary limitation of the conventional vegetation index model method for estimating LAI resides in its insufficient adaptability, which impeded the expansion and application of the model [36,37]. Different crop varieties and agricultural management practices can result in significant variations in vegetation growth characteristics, thereby directly impacting the accuracy and stability of conventional vegetation index models during monitoring processes [38]. Due to the inherent limitations of traditional vegetation index models in accurately capturing the growth status of individual crops, there may be potential errors when monitoring diverse varieties and fields managed under different agricultural approaches.
Data fusion is a methodology employed to enhance the precision and robustness of outcomes, constituting a widely debated subject across various disciplines. The prevailing consensus asserts that amalgamating multiple data sources through data fusion can augment accuracy and yield more precise inferences compared to relying solely on individual datasets [39]. Studies have demonstrated that the fusion of multiple vegetation index models can lead to a higher accuracy in the monitoring of the LAI of rice compared with using a single index alone, thereby emphasizing the significance of data fusion [40]. Firstly, this study unveiled the advantage of dividing modeling process into two distinct growth stages, namely pre-heading and post-heading; the main reason for this was that the LAI increased before the heading stage and decreased after the heading stage, which aligned with previous research findings [41]. Secondly, both statistical data fusion and KF fusion techniques applied to various vegetation indices contribute prominently towards enhancing LAI estimation accuracy. This underscores the immense potential of data fusion in effectively monitoring crop growth dynamics [42,43]. Previous studies have primarily focused on applying and comparing fusion methods to optimize efficiency, enhance accuracy through increased parameters, or employ machine learning for big data fusion, which often overlook analyzing and leveraging the inherent characteristics of the study target itself.
The robustness of the model may be influenced by multicollinearity among variables [44,45]. To address this, a multicollinearity test was initially conducted in the proposed fusion method. The selected vegetation index demonstrated no evidence of multicollinearity. Additionally, it is worth noting that each vegetation index exhibits a varying performance and accuracy across different growth stages [46]. In this study, a superior performance was achieved through KF fusion using distinct combinations of vegetation indices during different growth stages. This outcome can be attributed to the unique and complementary information provided by each vegetation index due to their diverse band combinations, aligning with previous findings [47]. In KF data fusion research, it is common practice to fix parameters after calculating σ and proceed with the fusion process. However, since the uncertainty of LAI inversion using the vegetation index model increased with the increase in LAI value, the error also increased if the LAI value was minor and the unified σ was adopted.
Compared to the conventional KF filtering fusion method, this study integrated the uncertainty characteristics of LAI [48] and proposed a dynamic variance method for filtering fusion. The accuracy of this approach surpasses that of the traditional fixed variance method. Different vegetation index models have their own strengths and limitations in monitoring the rice leaf area index. For instance, NDVI and DVI are more effective for early stage monitoring, while DVIREP and NDVIREP with red edges exhibit a higher accuracy during later growth periods [49]. The SAVI model can effectively eliminate ground background interference, thereby enhancing monitoring precision [50]. In this study, we applied the SAVI index to monitor the tillering and maturity stages. Considering the variations in vegetation index performance and uncertainty across different growth stages [51], we developed the KF-DGDV method to improve the LAI estimation accuracy for rice; our results indicate that this approach outperforms classical Kalman filter fusion methods [52]. Unlike methods involving radiative transfer models that yield a large variety of data types, or deep learning methods that often lack interpretability, KF-DGDV can be directly applied to enhance the accuracy of traditional empirical models, making it both stable and effective. Prominently, the KF-DGDV algorithm offered several advantages—it effectively incorporates changes in LAI inversion accuracy and uncertainty throughout different growth periods, enabling the better utilization of uncertain estimation results, while minimizing their impact. In comparison with alternative approaches such as machine learning, this methodology stands out due to its simplicity, computational efficiency, and lack of requirement for extensive sample modeling [53].
Excellent fusion results were demonstrated in this study; however, it is important to acknowledge some limitations. While various factors such as different varieties, years, and cultivation treatments were considered, it is crucial to note that these data are solely derived from a single geographical location. Therefore, future studies should aim to further investigate the performance of the proposed fusion method across diverse ecological points. Furthermore, although this paper primarily focuses on LAI indicators, it is worth mentioning that this method holds potential for enhancing the accuracy of other agricultural remote sensing parameters such as leaf chlorophyll content (Cab), leaf nitrogen accumulation (LNA), and aboveground biomass (AGB). Additionally, future research could explore the introduction of improved indices to mitigate the impact of saturation effects on estimation accuracy. Research could integrate more diverse data sources, such as hyperspectral remote sensing data and UAV data, to enhance the accuracy and applicability of the model.

5. Conclusions

In this study, the relationship between various classical vegetation index models and rice LAI under different cultivation conditions was investigated based on the vegetation index obtained from multi-spectral cameras. A highly accurate monitoring model for rice LAI was developed, which is based on the integration of multiple models using the KF-DGDV fusion method. The KF-DGDV fusion method effectively incorporates LAI changes throughout growth stages, inversion accuracy, and uncertainty variations among different index models, thereby prominently enhancing the estimation precision of LAI. The results showed that the R2 of the KF-DGDV method reached 0.76 in the tillering to booting stage, and 0.66 in the heading to maturity stage, which was superior to statistical data fusion and traditional vegetation index model. In addition, the KF-DGDV method also shows a strong stability and transferability, and has a wide applicability across different years, rice varieties, and sensors.

Author Contributions

Conceptualization, Data curation, Formal analysis, Methodology, Software, and Writing—original draft, M.Y.; Conceptualization, Data curation, Funding acquisition, Methodology, and Writing—review and editing, J.H.; Investigation, Methodology, and Software, W.L.; Software, Validation, and Funding acquisition, H.Z.; Investigation and Methodology, X.W.; Supervision and Methodology, X.Y.; Supervision and Methodology, T.C.; Investigation, Methodology, and Funding acquisition, X.Z.; Supervision and Project administration, Y.Z.; Supervision and Project administration, W.C.; Conceptualization, Formal analysis, Supervision, Writing—review and editing, and Funding acquisition, Y.T. All authors have read and agreed to the published version of the manuscript.

Funding

This work was supported by the Key Technologies Research and Development Program of China (2023YFD2300500, 2022YFD2001103), the National Natural Science Foundation of China (32371990, 32101617), the Key R&D project of Jiangsu Province (BE2023368), the Agricultural Science and Technology Independent Innovation Project of Jiangsu Province (CX(23)1023), and the China Postdoctoral Science Foundation (2023M741754).

Data Availability Statement

Data will be made available upon request.

Acknowledgments

We would like to thank Zhou Xiang and Lu Jinshan for giving data support. We thank the National Engineering and Technology Center for Information Agriculture (Rugao base) for providing the experimental base. We are grateful to the editors and anonymous reviewers for their constructive and helpful comments, which improved the quality of this paper.

Conflicts of Interest

The authors declare no conflicts of interest.

References

  1. Chen, J.M.; Black, T. Defining leaf area index for non-flat leaves. Plant Cell Environ. 1992, 15, 421–429. [Google Scholar] [CrossRef]
  2. Brown, L.A.; Meier, C.; Morris, H.; Pastor-Guzman, J.; Bai, G.; Lerebourg, C.; Gobron, N.; Lanconelli, C.; Clerici, M.; Dash, J. Evaluation of global leaf area index and fraction of absorbed photosynthetically active radiation products over North America using Copernicus Ground Based Observations for Validation data. Remote Sens. Environ. 2020, 247, 111935. [Google Scholar] [CrossRef]
  3. Ma, H.; Liang, S. Development of the GLASS 250-m leaf area index product (version 6) from MODIS data using the bidirectional LSTM deep learning model. Remote Sens. Environ. 2022, 273, 112985. [Google Scholar] [CrossRef]
  4. Qiao, L.; Gao, D.; Zhao, R.; Tang, W.; An, L.; Li, M.; Sun, H. Improving estimation of LAI dynamic by fusion of morphological and vegetation indices based on UAV imagery. Comput. Electron. Agr. 2022, 192, 106603. [Google Scholar] [CrossRef]
  5. Zhang, J.; Cheng, T.; Shi, L.; Wang, W.; Niu, Z.; Guo, W.; Ma, X. Combining spectral and texture features of UAV hyperspectral images for leaf nitrogen content monitoring in winter wheat. Int. J. Remote Sens. 2022, 43, 2335–2356. [Google Scholar] [CrossRef]
  6. Jiang, J.; Johansen, K.; Stanschewski, C.S.; Wellman, G.; Mousa, M.A.A.; Fiene, G.M.; Asiry, K.A.; Tester, M.; McCabe, M.F. Phenotyping a diversity panel of quinoa using UAV-retrieved leaf area index, SPAD-based chlorophyll and a random forest approach. Precis. Agric. 2022, 23, 961–983. [Google Scholar] [CrossRef]
  7. Zhou, X.; Zheng, H.B.; Xu, X.Q.; He, J.Y.; Ge, X.K.; Yao, X.; Cheng, T.; Zhu, Y.; Cao, W.X.; Tian, Y.C. Predicting grain yield in rice using multi-temporal vegetation indices from UAV-based multispectral and digital imagery. ISPRS J. Photogramm. 2017, 130, 246–255. [Google Scholar] [CrossRef]
  8. Li, W.; Li, D.; Liu, S.Y.; Baret, F.; Ma, Z.Y.; He, C.; Warner, T.A.; Guo, C.L.; Cheng, T.; Zhu, Y.; et al. RSARE: A physically-based vegetation index for estimating wheat green LAI to mitigate the impact of leaf chlorophyll content and residue-soil background. ISPRS J. Photogramm. 2023, 200, 138–152. [Google Scholar] [CrossRef]
  9. Roosjen, P.P.J.; Brede, B.; Suomalainen, J.M.; Bartholomeus, H.M.; Kooistra, L.; Clevers, J.G.P.W. Improved estimation of leaf area index and leaf chlorophyll content of a potato crop using multi-angle spectral data–potential of unmanned aerial vehicle imagery. Int. J. Appl. Earth Obs. 2018, 66, 14–26. [Google Scholar] [CrossRef]
  10. Brede, B.; Verrelst, J.; Gastellu-Etchegorry, J.-P.; Clevers, J.G.P.W.; Goudzwaard, L.; den Ouden, J.; Verbesselt, J.; Herold, M. Assessment of Workflow Feature Selection on Forest LAI Prediction with Sentinel-2A MSI, Landsat 7 ETM+ and Landsat 8 OLI. Remote Sens. 2020, 12, 915. [Google Scholar] [CrossRef]
  11. Li, L.; Ma, H. Saliency-Guided Nonsubsampled Shearlet Transform for Multisource Remote Sensing Image Fusion. Sensors 2021, 21, 1756. [Google Scholar] [CrossRef]
  12. Marzougui, A.; McGee, R.J.; Van Vleet, S.; Sankaran, S. Remote sensing for field pea yield estimation: A study of multi-scale data fusion approaches in phenomics. Front. Plant Sci. 2023, 14, 1111575. [Google Scholar] [CrossRef] [PubMed]
  13. Kang, Y.; Özdoğan, M.; Zipper, S.C.; Román, M.O.; Walker, J.; Hong, S.Y.; Marshall, M.; Magliulo, V.; Moreno, J.; Alonso, L.; et al. How Universal Is the Relationship between Remotely Sensed Vegetation Indices and Crop Leaf Area Index? A Global Assessment. Remote Sens. 2016, 8, 597. [Google Scholar] [CrossRef] [PubMed]
  14. Estévez, J.; Vicent, J.; Rivera-Caicedo, J.P.; Morcillo-Pallarés, P.; Vuolo, F.; Sabater, N.; Camps-Valls, G.; Moreno, J.; Verrelst, J. Gaussian processes retrieval of LAI from Sentinel-2 top-of-atmosphere radiance data. ISPRS J. Photogramm. 2020, 167, 289–304. [Google Scholar] [CrossRef] [PubMed]
  15. Wu, S.; Deng, L.; Guo, L.; Wu, Y. Wheat leaf area index prediction using data fusion based on high-resolution unmanned aerial vehicle imagery. Plant Met. 2022, 18, 68. [Google Scholar] [CrossRef] [PubMed]
  16. Yue, J.; Feng, H.; Jin, X.; Yuan, H.; Li, Z.; Zhou, C.; Yang, G.; Tian, Q. A Comparison of Crop Parameters Estimation Using Images from UAV-Mounted Snapshot Hyperspectral Sensor and High-Definition Digital Camera. Remote Sens. 2018, 10, 1138. [Google Scholar] [CrossRef]
  17. Yang, G.; Ye, Q.; Xia, J. Unbox the black-box for the medical explainable AI via multi-modal and multi-centre data fusion: A mini-review, two showcases and beyond. Inf. Fus. 2022, 77, 29–52. [Google Scholar] [CrossRef] [PubMed]
  18. Kordestani, M.; Dehghani, M.; Moshiri, B.; Saif, M. A New Fusion Estimation Method for Multi-Rate Multi-Sensor Systems With Missing Measurements. IEEE Access 2020, 8, 47522–47532. [Google Scholar] [CrossRef]
  19. Lu, F.; Wang, Y.; Huang, J.; Huang, Y.; Qiu, X. Fusing unscented Kalman filter for performance monitoring and fault accommodation in gas turbine. J. Aerospace Eng. 2016, 232, 556–570. [Google Scholar] [CrossRef]
  20. Sun, X.; Yang, G. Multi-sensor optimal weighted fusion incremental Kalman smoother. J. Syst. Eng. Electron. 2018, 29, 262–268. [Google Scholar] [CrossRef]
  21. Jin, H.; Li, A.; Yin, G.; Xiao, Z.; Bian, J.; Nan, X.; Jing, J. A Multiscale Assimilation Approach to Improve Fine-Resolution Leaf Area Index Dynamics. IEEE Trans. Geosci. Remote 2019, 57, 8153–8168. [Google Scholar] [CrossRef]
  22. Lai, X.; Huang, J.; Ye, C.; Sun, F.; Liu, Y. Adaptive multinoulli-based Kalman filter with randomly unknown delayed and lost measurements. Dig. Sign. Proce. 2022, 129, 103653. [Google Scholar] [CrossRef]
  23. Li, W.; Wu, W.; Yu, M.; Tao, H.; Yao, X.; Cheng, T.; Zhu, Y.; Cao, W.; Tian, Y. Monitoring rice grain protein accumulation dynamics based on UAV multispectral data. Field. Crop. Res. 2023, 294, 108858. [Google Scholar] [CrossRef]
  24. Rouse, J.W. Monitoring the Vernal Advancement of Retrogradation (Green Wave Effect) of Natural Vegetation; Nasa: Washington, DC, USA, 1974. [Google Scholar]
  25. Fitzgerald, G.J.; Rodriguez, D.; Christensen, L.K.; Belford, R.; Sadras, V.O.; Clarke, T.R. Spectral and thermal sensing for nitrogen and water status in rainfed and irrigated wheat environments. Precis. Agric. 2006, 7, 233–248. [Google Scholar] [CrossRef]
  26. Jordan, C.F. Derivation of leaf area index from light quality of the forest floor. Ecology 1969, 50, 663–666. [Google Scholar] [CrossRef]
  27. Roujean, J.-L.; Breon, F.-M. Estimating PAR absorbed by vegetation from bidirectional reflectance measurements. Remote Sens. Environ. 1995, 51, 375–384. [Google Scholar] [CrossRef]
  28. Deng, F.; Chen, J.M.; Plummer, S.; Chen, M.; Pisek, J. Algorithm for global leaf area index retrieval using satellite imagery. IEEE Trans. Geosci. Remote 2006, 44, 2219–2229. [Google Scholar] [CrossRef]
  29. Huete, A.R. A soil-adjusted vegetation index (SAVI). Remote Sens. Environ. 1988, 25, 295–309. [Google Scholar] [CrossRef]
  30. Taddeo, S.; Dronova, I.; Depsky, N. Spectral vegetation indices of wetland greenness: Responses to vegetation structure, composition, and spatial distribution. Remote Sens. Environ. 2019, 234, 111467. [Google Scholar] [CrossRef]
  31. Wu, C.; Niu, Z.; Tang, Q.; Huang, W. Estimating chlorophyll content from hyperspectral vegetation indices: Modeling and validation. Agr. Forest. Meteorol. 2008, 148, 1230–1241. [Google Scholar] [CrossRef]
  32. Jiang, Z.; Huete, A.R.; Didan, K.; Miura, T. Development of a two-band enhanced vegetation index without a blue band. Remote Sens. Environ. 2008, 112, 3833–3845. [Google Scholar] [CrossRef]
  33. Camps-Valls, G.; Campos-Taberner, M.; Moreno-Martínez, Á.; Walther, S.; Duveiller, G.; Cescatti, A.; Mahecha, M.D.; Muñoz-Marí, J.; García-Haro, F.J.; Guanter, L. A unified vegetation index for quantifying the terrestrial biosphere. Sci. Adv. 2021, 7, eabc7447. [Google Scholar] [CrossRef] [PubMed]
  34. Badgley, G.; Field, C.B.; Berry, J.A. Canopy near-infrared reflectance and terrestrial photosynthesis. Sci. Adv. 2017, 3, e1602244. [Google Scholar] [CrossRef] [PubMed]
  35. Evensen, G. The Ensemble Kalman Filter: Theoretical formulation and practical implementation. Ocean Dynam. 2003, 53, 343–367. [Google Scholar] [CrossRef]
  36. Liu, Z.; Jin, G. Improving accuracy of optical methods in estimating leaf area index through empirical regression models in multiple forest types. Trees-Struct. Funct. 2016, 30, 2101–2115. [Google Scholar] [CrossRef]
  37. Liu, Z.; Wang, C.; Chen, J.M.; Wang, X.; Jin, G. Empirical models for tracing seasonal changes in leaf area index in deciduous broadleaf forests by digital hemispherical photography. For. Ecol. Manag. 2015, 351, 67–77. [Google Scholar] [CrossRef]
  38. Rischen, T.; Frenzel, T.; Fischer, K. Biodiversity in agricultural landscapes: Different non-crop habitats increase diversity of ground-dwelling beetles (Coleoptera) but support different communities. Biodivers. Conserv. 2021, 30, 3965–3981. [Google Scholar] [CrossRef]
  39. Haas, J.; Ban, Y. Sentinel-1A SAR and sentinel-2A MSI data fusion for urban ecosystem service mapping. Remote Sens. Appl. Sco. Environ. 2017, 8, 41–53. [Google Scholar] [CrossRef]
  40. Oliveira, R.A.; Nsi, R.; Niemelinen, O.; Nyholm, L.; Alhonoja, K.; Kaivosoja, J.; Jauhiainen, L.; Viljanen, N.; Nezami, S.; Markelin, L. Machine learning estimators for the quantity and quality of grass swards used for silage production using drone-based imaging spectrometry and photogrammetry. Remote Sens. Environ. 2020, 246, 111830. [Google Scholar] [CrossRef]
  41. Zhang, Y.; Hui, J.; Qin, Q.; Sun, Y.; Zhang, T.; Sun, H.; Li, M. Transfer-learning-based approach for leaf chlorophyll content estimation of winter wheat from hyperspectral data. Remote Sens. Environ. 2021, 267, 112724. [Google Scholar] [CrossRef]
  42. Zhu, X.; Cai, F.; Tian, J.; Williams, T.K. Spatiotemporal Fusion of Multisource Remote Sensing Data: Literature Survey, Taxonomy, Principles, Applications, and Future Directions. Remote Sens. 2018, 10, 527. [Google Scholar] [CrossRef]
  43. Cheng, M.; Jiao, X.; Liu, Y.; Shao, M.; Yu, X.; Bai, Y.; Wang, Z.; Wang, S.; Tuohuti, N.; Liu, S.; et al. Estimation of soil moisture content under high maize canopy coverage from UAV multimodal data and machine learning. Agr. Water. Manag. 2022, 264, 107530. [Google Scholar] [CrossRef]
  44. Jafarbiglu, H.; Pourreza, A. A comprehensive review of remote sensing platforms, sensors, and applications in nut crops. Comput. Electron. Agr. 2022, 197, 106844. [Google Scholar] [CrossRef]
  45. Kalarikkal, R.K.; Kim, Y.; Ksiksi, T. Incorporating satellite remote sensing for improving potential habitat simulation of Prosopis cineraria (L.) Druce in United Arab Emirates. Glob. Ecol. Conserv. 2022, 37, e02167. [Google Scholar] [CrossRef]
  46. Xie, Y.; Wang, P.; Bai, X.; Khan, J.; Zhang, S.; Li, L.; Wang, L. Assimilation of the leaf area index and vegetation temperature condition index for winter wheat yield estimation using Landsat imagery and the CERES-Wheat model. Agr. Forest. Meteorol. 2017, 246, 194–206. [Google Scholar] [CrossRef]
  47. Lee, H.; Wang, J.; Leblon, B. Using Linear Regression, Random Forests, and Support Vector Machine with Unmanned Aerial Vehicle Multispectral Images to Predict Canopy Nitrogen Weight in Corn. Remote Sens. 2020, 12, 2071. [Google Scholar] [CrossRef]
  48. Yang, K.; Gong, Y.; Fang, S.; Duan, B.; Yuan, N.; Peng, Y.; Wu, X.; Zhu, R. Combining Spectral and Texture Features of UAV Images for the Remote Estimation of Rice LAI throughout the Entire Growing Season. Remote Sens. 2021, 13, 3001. [Google Scholar] [CrossRef]
  49. Xie, Q.; Dash, J.; Huang, W.; Peng, D.; Qin, Q.; Mortimer, H.; Casa, R.; Pignatti, S.; Laneve, G.; Pascucci, S.; et al. Vegetation Indices Combining the Red and Red-Edge Spectral Information for Leaf Area Index Retrieval. IEEE J.-Stars. 2018, 11, 1482–1493. [Google Scholar] [CrossRef]
  50. Ren, H.; Zhou, G.; Zhang, F. Using negative soil adjustment factor in soil-adjusted vegetation index (SAVI) for aboveground living biomass estimation in arid grasslands. Remote Sens. Environ. 2018, 209, 439–445. [Google Scholar] [CrossRef]
  51. Zhang, Q.; Zhang, W.; Li, T.; Sun, Y. Accuracy and uncertainty analysis of staple food crop modelling by the process-based Agro-C model. Int. J. Biometeorol. 2021, 65, 587–599. [Google Scholar] [CrossRef]
  52. Movassagh, S.; Fatehi, A.; Sedigh, A.K.; Shariati, A. Kalman Filter Fusion With Smoothing for a Process With Continuous-Time Integrated Sensor. IEEE Sens. J. 2023, 23, 7279–7287. [Google Scholar] [CrossRef]
  53. Radočaj, D.; Jurišić, M.; Gašparović, M. The Role of Remote Sensing Data and Methods in a Modern Approach to Fertilization in Precision Agriculture. Remote Sens. 2022, 14, 778. [Google Scholar] [CrossRef]
Figure 1. Overall technical flowchart.
Remotesensing 16 02073 g001
Figure 2. Correlations of LAI with DVIREP (a) and NDVIREP (b) at all growth stages in rice.
Remotesensing 16 02073 g002
Figure 3. RMSE (a) and MAPE (b) analysis of rice LAI subsection modeling and whole growth period modeling results. * F-test statistical significance at 0.05 probability level; ** F-test statistical significance at 0.01 probability level; *** F-test statistical significance at 0.001 probability level.
Remotesensing 16 02073 g003
Figure 4. Correlation between tillering–booting stage (a) and heading–maturity stage (b) and LAI in rice.
Remotesensing 16 02073 g004
Figure 5. Rice LAI estimation based on the statistical fusion of multiple vegetation indices. Average method (a); median method (b); and average after removing the extreme value method (c).
Remotesensing 16 02073 g005
Figure 6. Rice LAI estimation based on Kalman filter fusion of multiple vegetation indices. Tillering–booting stage (a); heading–maturity stage (b).
Remotesensing 16 02073 g006
Figure 7. Test of variance inflation factor between variables.
Remotesensing 16 02073 g007
Figure 8. Average deviation of vegetation index in different growth stages (a) and correlation with vegetation index model (b).
Remotesensing 16 02073 g008
Figure 9. LAI estimation of rice based on KF fusion of optimized combination form. Tillering–booting stage (a); heading–maturity stage (b).
Remotesensing 16 02073 g009
Figure 10. LAI estimation of rice based on Airphen single vegetation index model, average method and fusion of KF. Vegetation index method (a); average method (b); KF-DGDV method (c).
Remotesensing 16 02073 g010
Table 1. Details of the field treatments used in this study.
Experiment
(Exp.)
Rice VarietyNitrogen Fertilization
Rate (kg·ha−1)
Plant Density
(cm × cm)
Imagery Acquisition Date
Exp. 1 (2014)Wuyunjing24 (V1), Eryou1 (V2)0 (N0), 100 (N1)
200 (N2), 300 (N6)
30 × 15 (D1)
50 × 15 (D2)
07/14, 07/26, 08/05, 08/18,
08/29, 09/05, 09/21, 10/02
Exp. 2 (2015)Wuyunjing24 (V1), Eryou1 (V2)0 (N0), 100 (N1)
200 (N2), 300 (N6)
30 × 15 (D1)
50 × 15 (D2)
07/22, 07/28, 08/04, 08/17,
08/28, 09/04, 09/20
Exp. 3 (2016)Wuyunjing24 (V1), Eryou1 (V2)0 (N0), 100 (N1)
200 (N2), 300 (N6)
30 × 15 (D1)
50 × 15 (D2)
07/22, 08/02, 08/11, 08/25,
09/09, 09/18, 10/03
Exp. 4 (2017)Wuyunjing27 (V3), Eryou728 (V4)100 (N1), 300 (N6)30 × 15 (D1)07/16, 07/25, 08/13, 08/23,
09/06, 09/14, 10/02
Exp. 5 (2018)Wuyunjing27 (V3), Eryou728 (V4)100 (N1), 300 (N6)30 × 15 (D1)07/20, 08/05, 08/14, 08/23,
08/28, 09/04,09/14
Exp. 6 (2019)Wuyunjing27 (V3), Sueryou295 (V5)100 (N1), 300 (N6)30 × 15 (D1)07/23, 08/05, 08/14, 08/19,
09/07, 09/20, 10/03
Exp. 7 (2018)W30 (V6), Tianlong619 (V7),
Tianlong6 (V8), Suxiang3 (V9),
Suxiang100 (V10),
Fengyouxiangzhan (V11),
Changyou5 (V12), Huaidao5 (V13), Ningjing8 (V14), Wuyunjing30 (V15), Nanjing5055 (V16), Nanjing46 (V17),
240 (N4), 270 (N5)30 × 15 (D1)07/20, 07/28, 08/05, 08/14,
08/23, 08/28, 09/04, 09/14,
09/22, 10/01
Exp. 8 (2019)Tianlong619 (V7), Tianlong6 (V8),
Fengyouxiangzhan (V11), Changyou5 (V12), Huaidao5 (V13), Ningxiangjing8 (V14),
Wuyunjing30 (V15), Nanjing5055 (V16),
Nanjing46 (V17), Huajing5 (V18),
Yangiing3012 (V19), Nanjing9108 (V20)
225 (N3), 270 (N5)30 × 15 (D1)
60 × 15 (D3)
07/23, 07/29, 08/05, 08/14,
08/19, 08/22, 09/07, 09/12,
09/20, 09/28, 10/03
Exp. 9 (2020)Suxiang100 (V10), Fengyouxiangzhan (V11), Changyou5 (V12), Huaidao5 (V13), Ningxiangjing8 (V14),
Wuyunjing30 (V15), Nanjing5055 (V16),
Nanjing46 (V17), Huajing5 (V18),
Yangiing3012 (V19), Nanjing9108 (V20), Changnongjing10 (V21)
225 (N3)
270 (N5)
30 × 15 (D1)
60 × 15 (D3)
07/17, 07/24, 08/18, 08/23,
09/03, 09/13, 09/24, 10/05
Table 2. Selected vegetation indices and corresponding multi-spectral camera band calculation formulas.
Vegetation IndexFull NameCalculation FormulaReference
NDVINormalized difference vegetation index(B5 − B3)/(B5 + B3)Rouse [24]
NDVIREPRed-edge normalized difference vegetation index(B5 − B4)/(B5 + B4)Fitzgerald et al. [25]
DVIDifference vegetation indexB5 − B3Jordan [26]
DVIREPRed-edge difference vegetation indexB5 − B4Jordan [26]
RVIRatio vegetation indexB5/B3Roujean et al.,
Deng et al. [27,28]
RVIREPRed-edge ratio vegetation indexB5/B4Roujean et al. [27]
SAVISoil-adjusted vegetation index1.5 × (B5 − B3)/(B3 + B5 + 0.5)Huete [29]
GNDVIGreen normalized difference vegetation index(B5 − B2)/(B5 + B2)Taddeo et al. [30]
OSAVIOptimized soil-adjusted vegetation index(B5 − B3)/(B3 + B5 + 0.16)Wu et al. [31]
EVIEnhanced vegetation index2.5 × (B5 − B3)/(B5 + 6 × B3 − 7.5 × B2 + 1)Jiang et al. [32]
kNDVIkernel Normalized difference vegetation indextanh(NDVI2)Gustau et al. [33]
NIRvNear-infrared reflectance of vegetation(NDVI − 0.08) × B5Badgley et al. [34]
Table 3. Experiment group and testing dataset usage description.
ExperimentExperimental GroupDatasetInterannual Generalization TestIntervarietal Generalization TestInter-Sensor Generalization Test
Exp. 1Group 1G1S1WM
G1S1SM
G1S2WM G1S2SM
model buildingmodel buildingmodel building
Exp. 2model validationmodel buildingmodel building
Exp. 3model buildingmodel buildingmodel building
Exp. 4Group 2G2S1WM G2S1SM
G2S2WM
G2S2SM
model buildingmodel buildingmodel building
Exp. 5model validationmodel buildingmodel building
Exp. 6model buildingmodel buildingmodel building
Exp. 7Group 3G3S1WM G3S1SM
G3S2WM G3S2SM
model validationmodel validationmodel building
model building
Exp. 8model buildingmodel validation
Exp. 9Group 4///model validation
Table 4. Coefficients of determination between the LAI and the vegetation indices at all the growth stages in rice under a linear model.
ExperimentNDVINDVIREPDVIDVIREPRVIRVIREPSAVIGNDVIOSAVIEVIkNDVINIRv
Group 10.480.690.570.670.110.650.580.610.570.420.650.65
Group 20.360.450.490.660.020.340.490.530.470.250.570.58
Group 30.270.490.220.500.010.440.280.380.310.040.450.28
All experiments0.380.550.440.610.030.490.450.500.440.240.540.53
Table 5. Normal distribution test of difference between rice vegetation index modeling results and measured LAI and parameter calculation.
NDVINDVIREPDVIDVIREPRVIREPSAVIGNDVIOSAVIkNDVINIRv
μ0.00460.00460.00470.00470.02320.00460.00480.00470.03970.0401
Sigma1.96471.60841.50250.98211.32991.54751.44171.62693.01893.0761
Skew1.050.220.520.370.090.670.890.84−1.60−1.49
Kurtosis2.274.711.011.205.261.252.211.644.794.80
Table 6. Fusion accuracy of different σ determination methods.
Precision Evaluation IndexSigma Determination MethodTillering–Booting StageHeading–Maturity Stage
G1G2G3AverageG1G2G3Average
Average σFixed sigma1.72641.72641.72641.72641.85491.85491.85491.8549
Dynamic σ1.25941.38591.28231.31851.56191.48271.58481.5413
R2Fixed sigma0.800.730.490.670.670.630.450.58
Dynamic σ0.820.760.530.700.690.650.500.61
RMSEFixed σ1.011.012.071.361.451.152.201.59
Dynamic σ0.960.971.921.281.391.091.931.47
MAPEFixed σ50.2%28.8%55.4%44.8%26.1%29.7%35.5%30.5%
Dynamic σ49.9%26.5%49.9%42.1%25.2%28.7%31.7%29.5%
Table 7. Accuracy evaluation of different quantitative vegetation index model data fusion.
Number of Couplings8765432
R2Fixed variance0.6410.6650.6770.6950.7040.6960.674
Dynamic variance0.6700.6830.6920.7130.7180.7220.693
RMSEFixed variance1.4431.4251.4191.4051.4061.3991.416
Dynamic variance1.3481.3281.3131.3081.2971.2991.310
MAPEFixed variance40.2%37.8%35.6%34.3%34.0%35.7%34.8%
Dynamic variance37.9%36.4%34.5%33.4%33.5%35.1%34.7%
Table 8. Accuracy evaluation of single vegetation index model, MME, and KF fusion in different year and rice variety scenarios.
Precision Evaluation IndexScenesTillering–Booting StageHeading–Booting Stage
DVIREPAverageKF-DGDVDVIREPAverageKF-DGDV
R2Year0.650.630.670.510.560.55
Variety0.550.570.590.540.550.57
RMSEYear1.461.431.262.011.901.59
Variety1.621.591.351.831.551.43
MAPEYear44.0%46.2%43.8%33.5%33.8%32.2%
Variety53.5%49.4%47.4%28.6%27.2%26.7%
Disclaimer/Publisher’s Note: The statements, opinions and data contained in all publications are solely those of the individual author(s) and contributor(s) and not of MDPI and/or the editor(s). MDPI and/or the editor(s) disclaim responsibility for any injury to people or property resulting from any ideas, methods, instructions or products referred to in the content.

