


Impacts of the Middle Route of the South-to-North Water Diversion Project on Land Surface Temperature and Fractional Vegetation Coverage in the Danjiang River Basin


Abstract
1. Introduction
2. Data and Methods
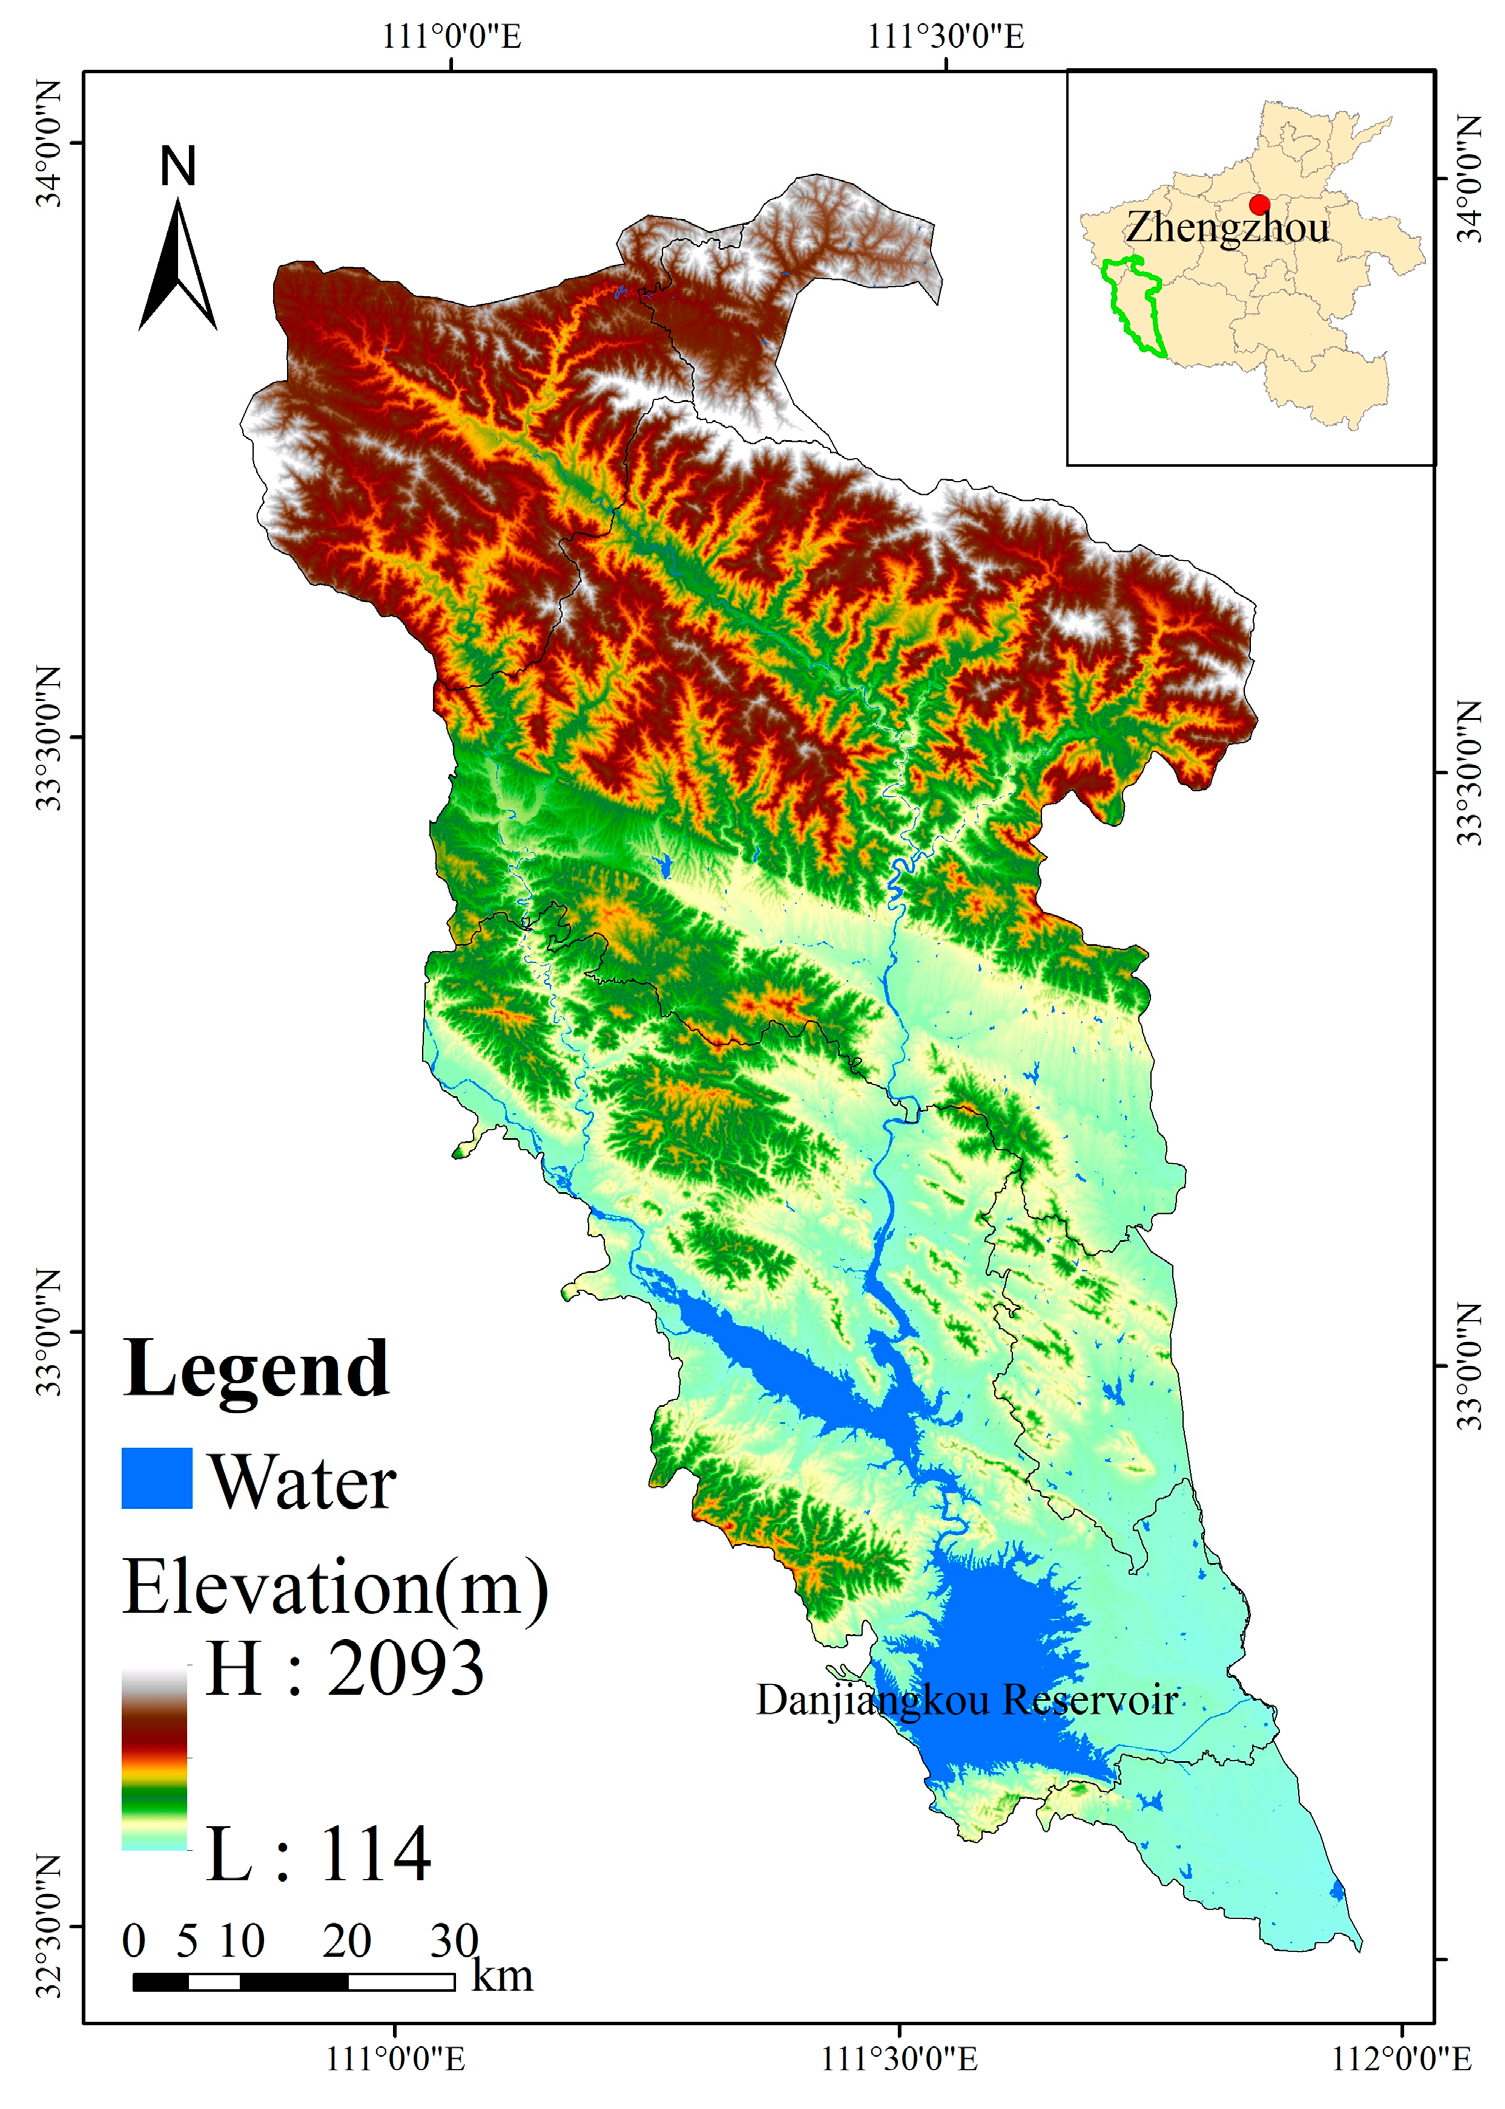
2.1. Study Area
2.2. Data Sources
2.3. Study Methods
2.3.1. IMA Algorithm Based on DEM Improvement (DEM-IMA)
2.3.2. Temperature Effect Change Intensity Index
2.3.3. Thermoregulation Effect
2.3.4. Inversion of Surface FVC
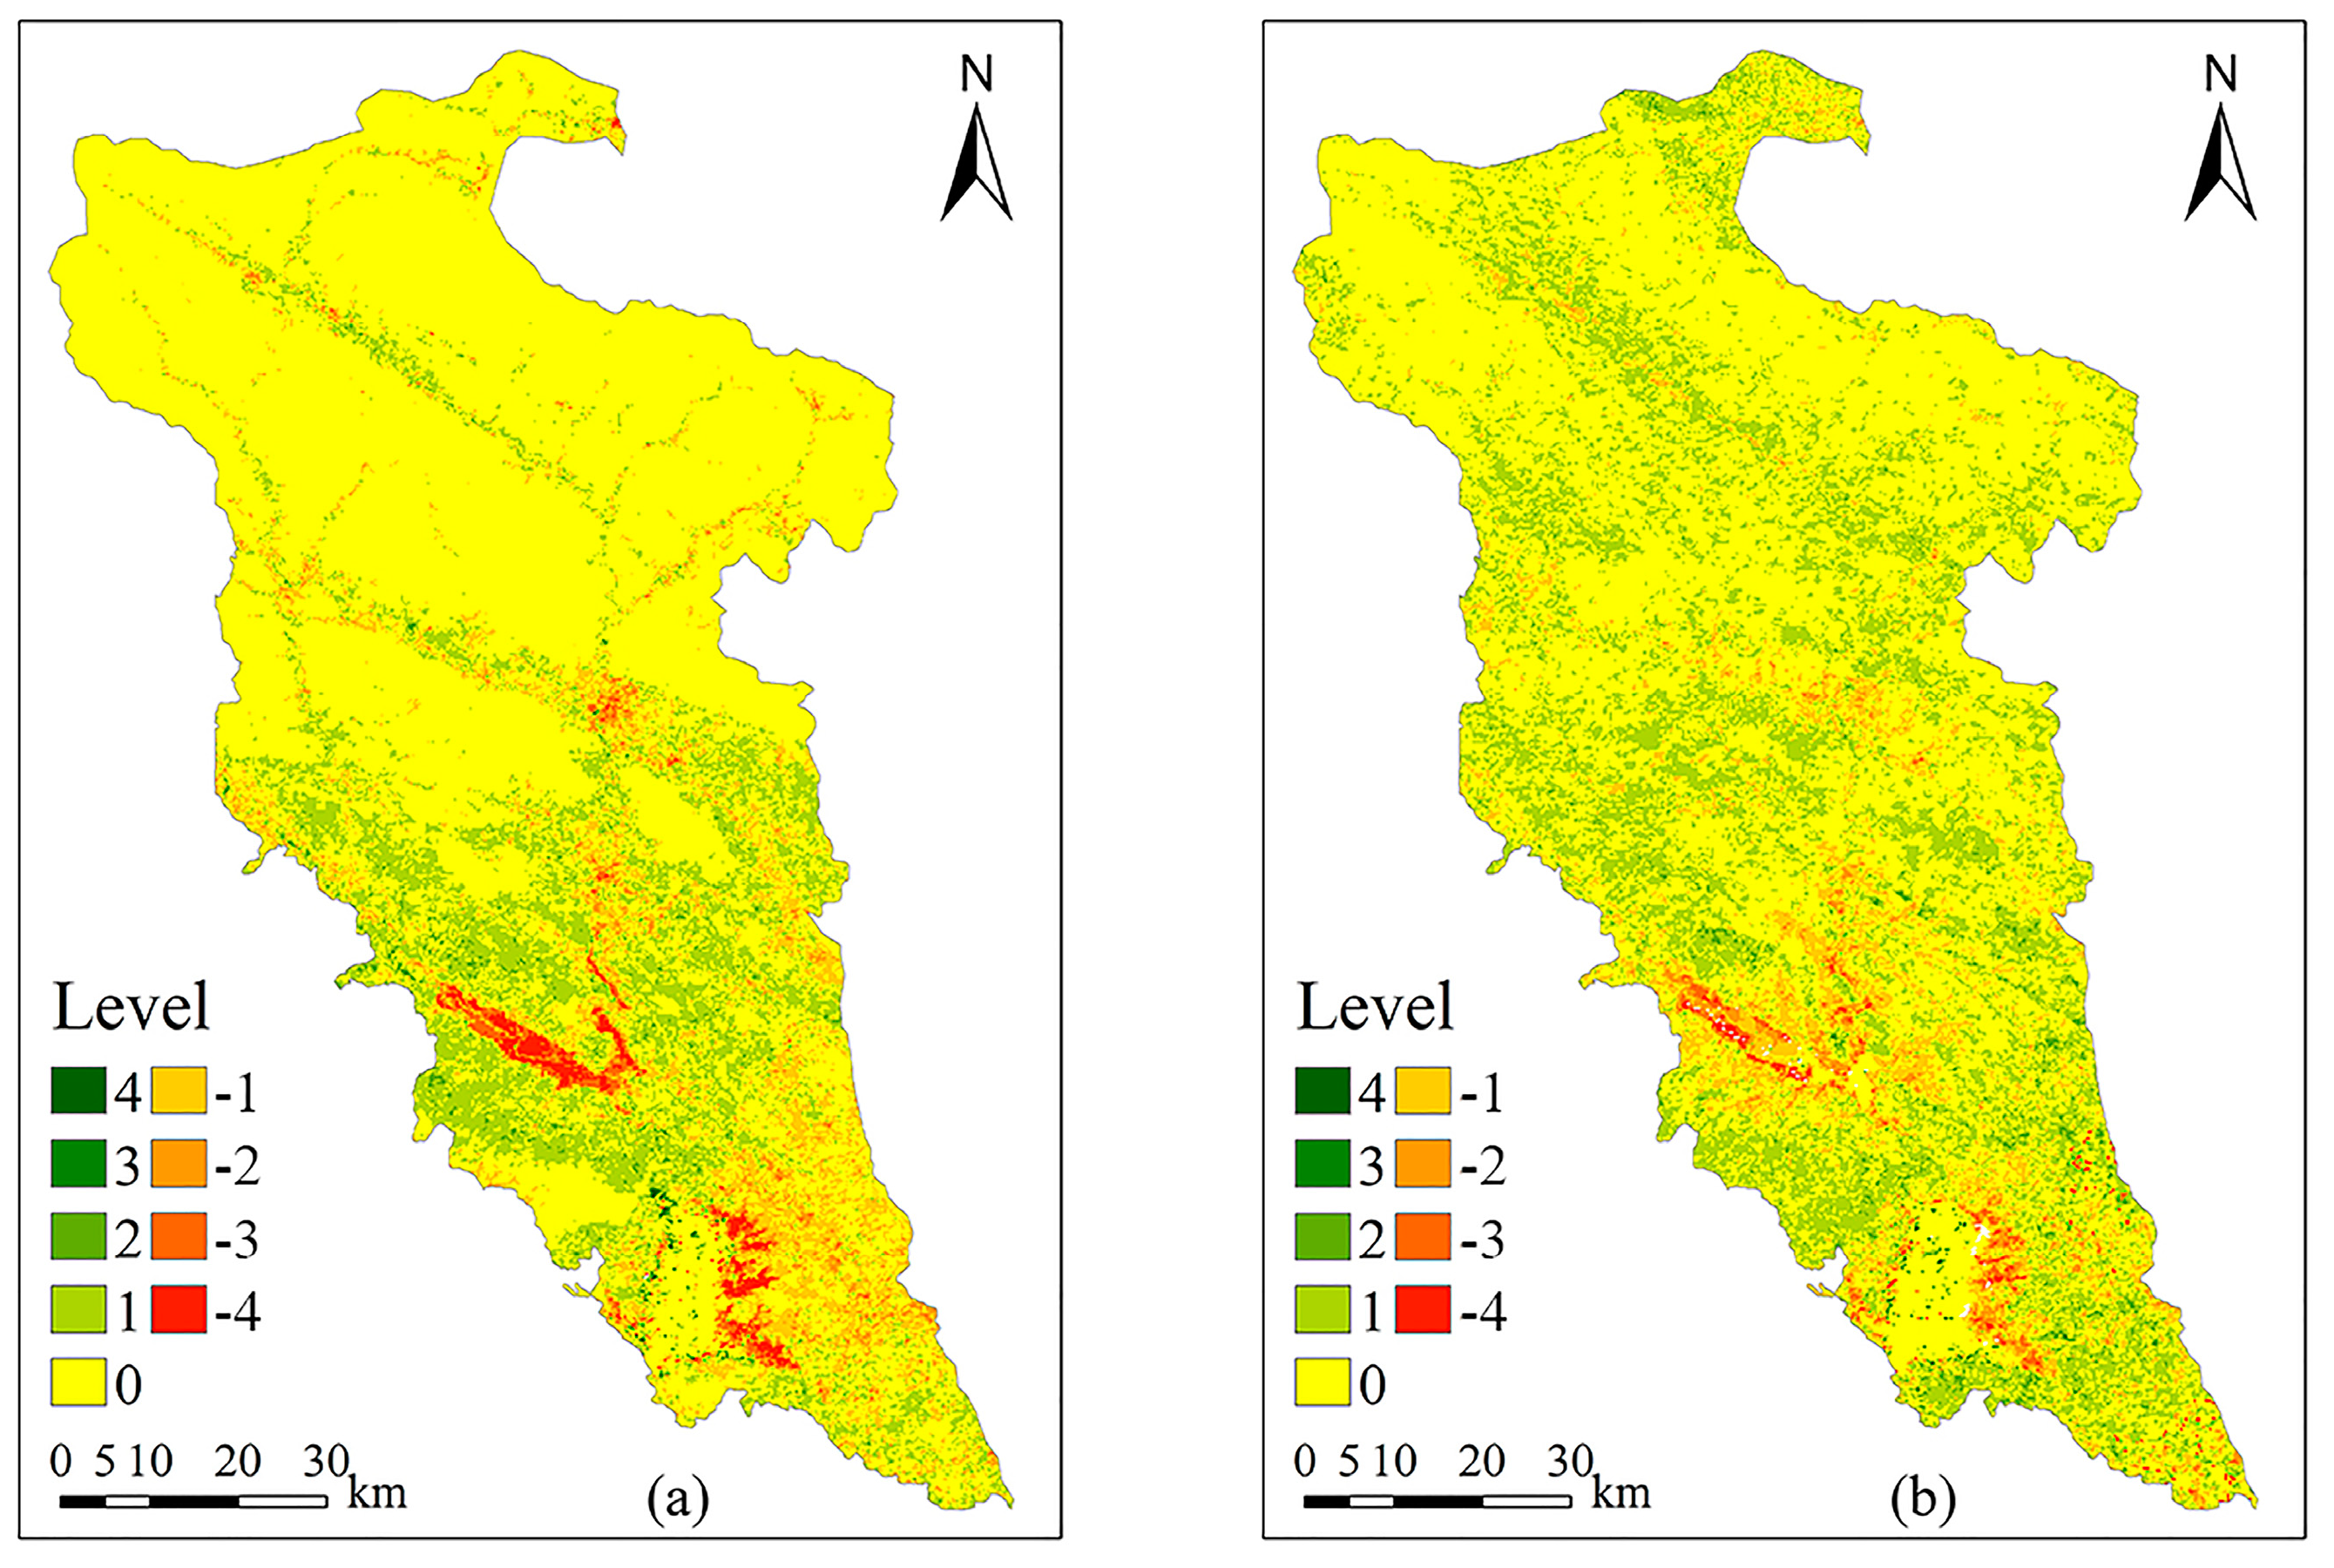
2.3.5. FVC Shift Direction Level
3. Results
3.1. Analysis of the Impact of the Middle Route of the South-to-North Water Diversion Project on LST Changes in the Danjiang River Basin
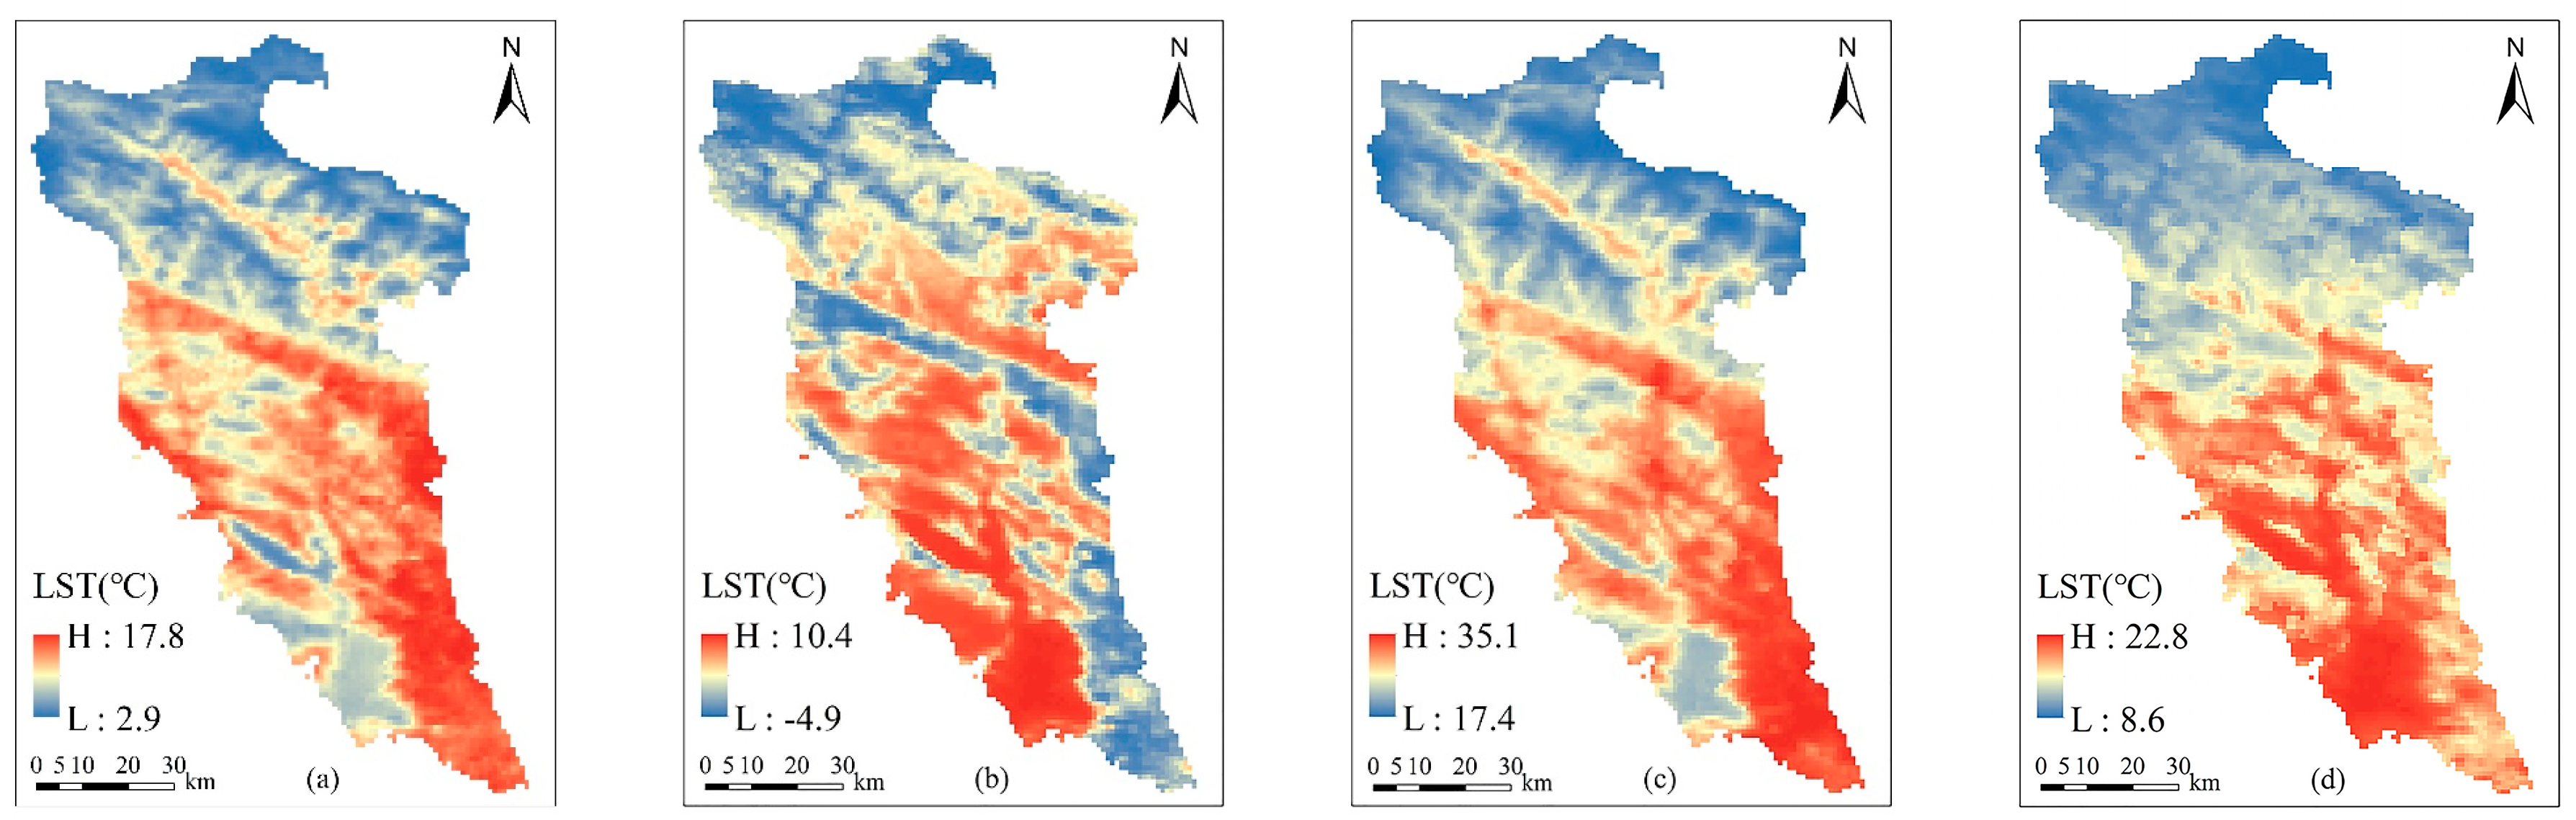
3.1.1. Analysis of Temporal Changes in LST and Characteristics
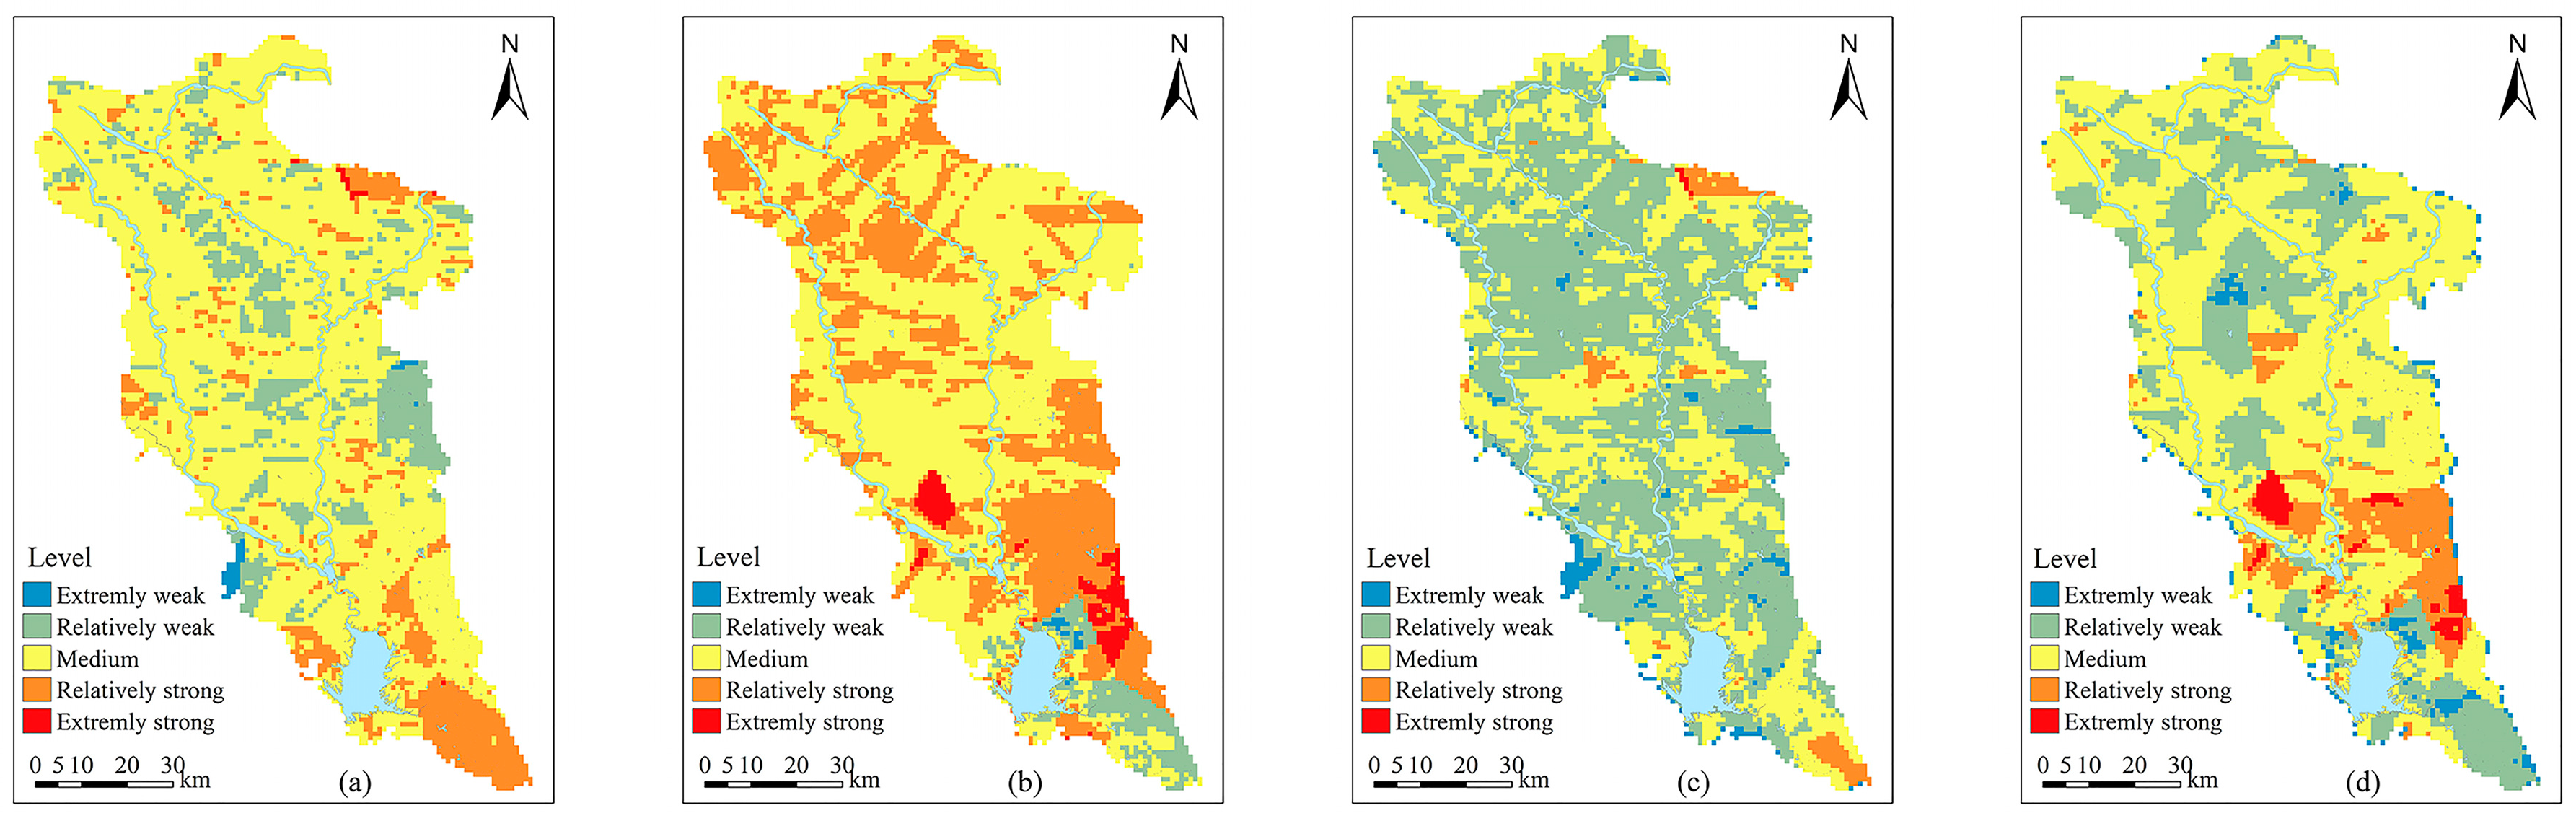
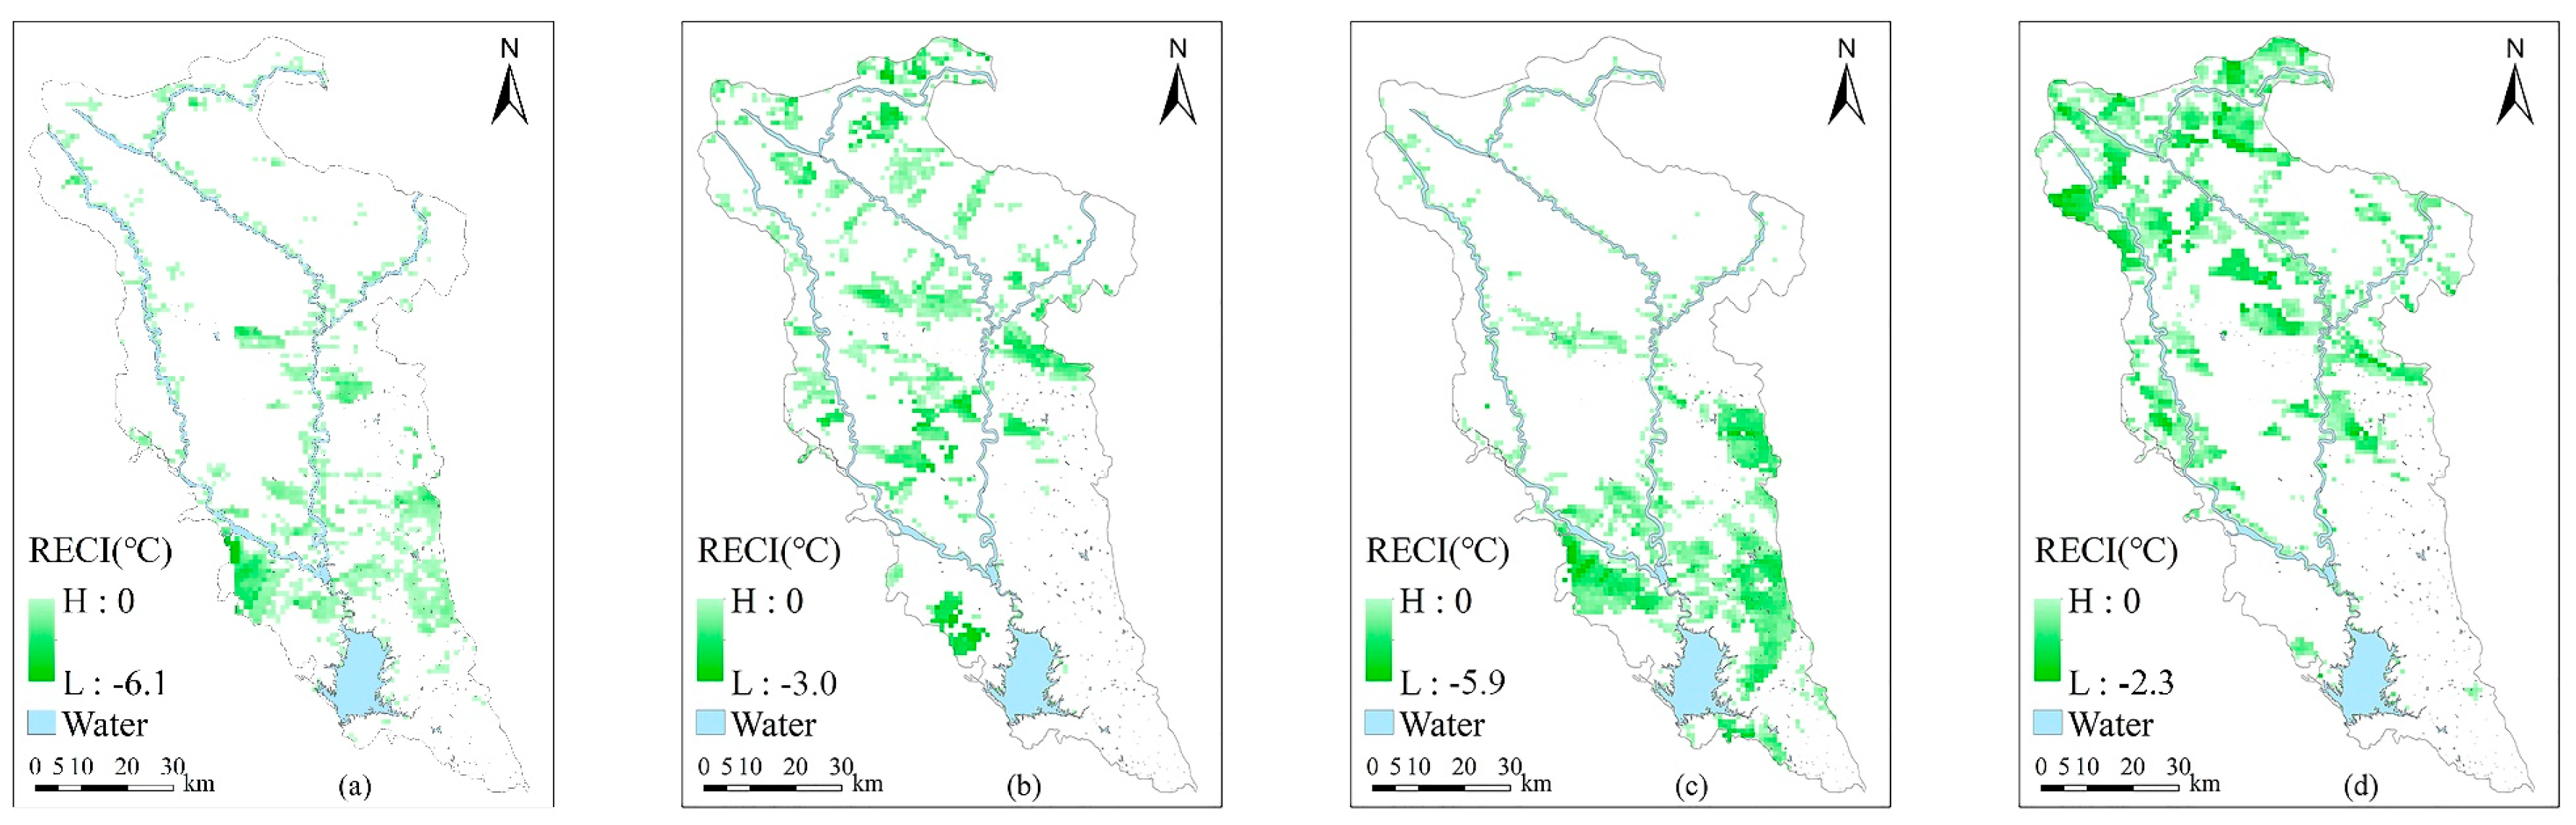
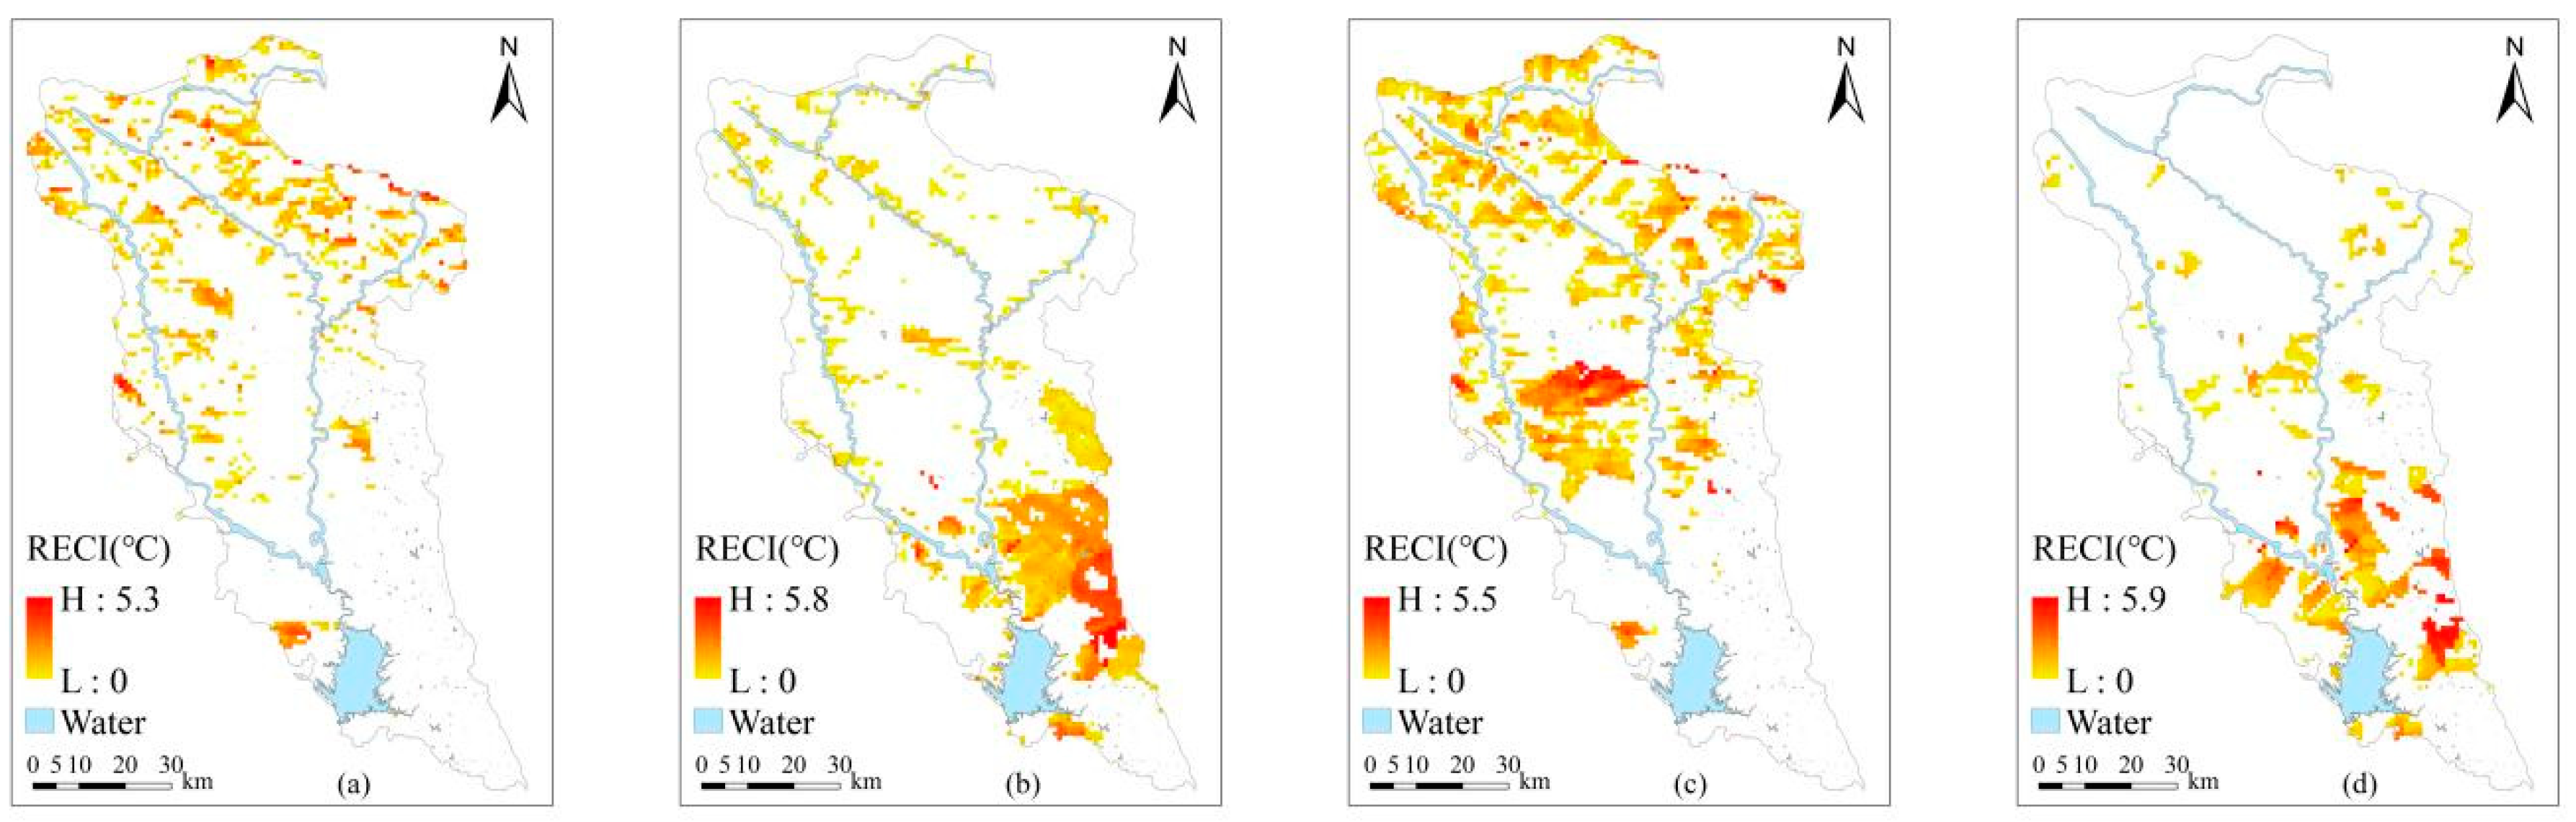
3.1.2. Analysis of the Temperature Regulation Effect of the Middle Route of the South-to-North Water Diversion Project
- (1)
- Cooling effect of the Middle Route of the South-to-North Water Diversion Project
- (2)
- Warming effect of the Middle Route of the South-to-North Water Diversion Project
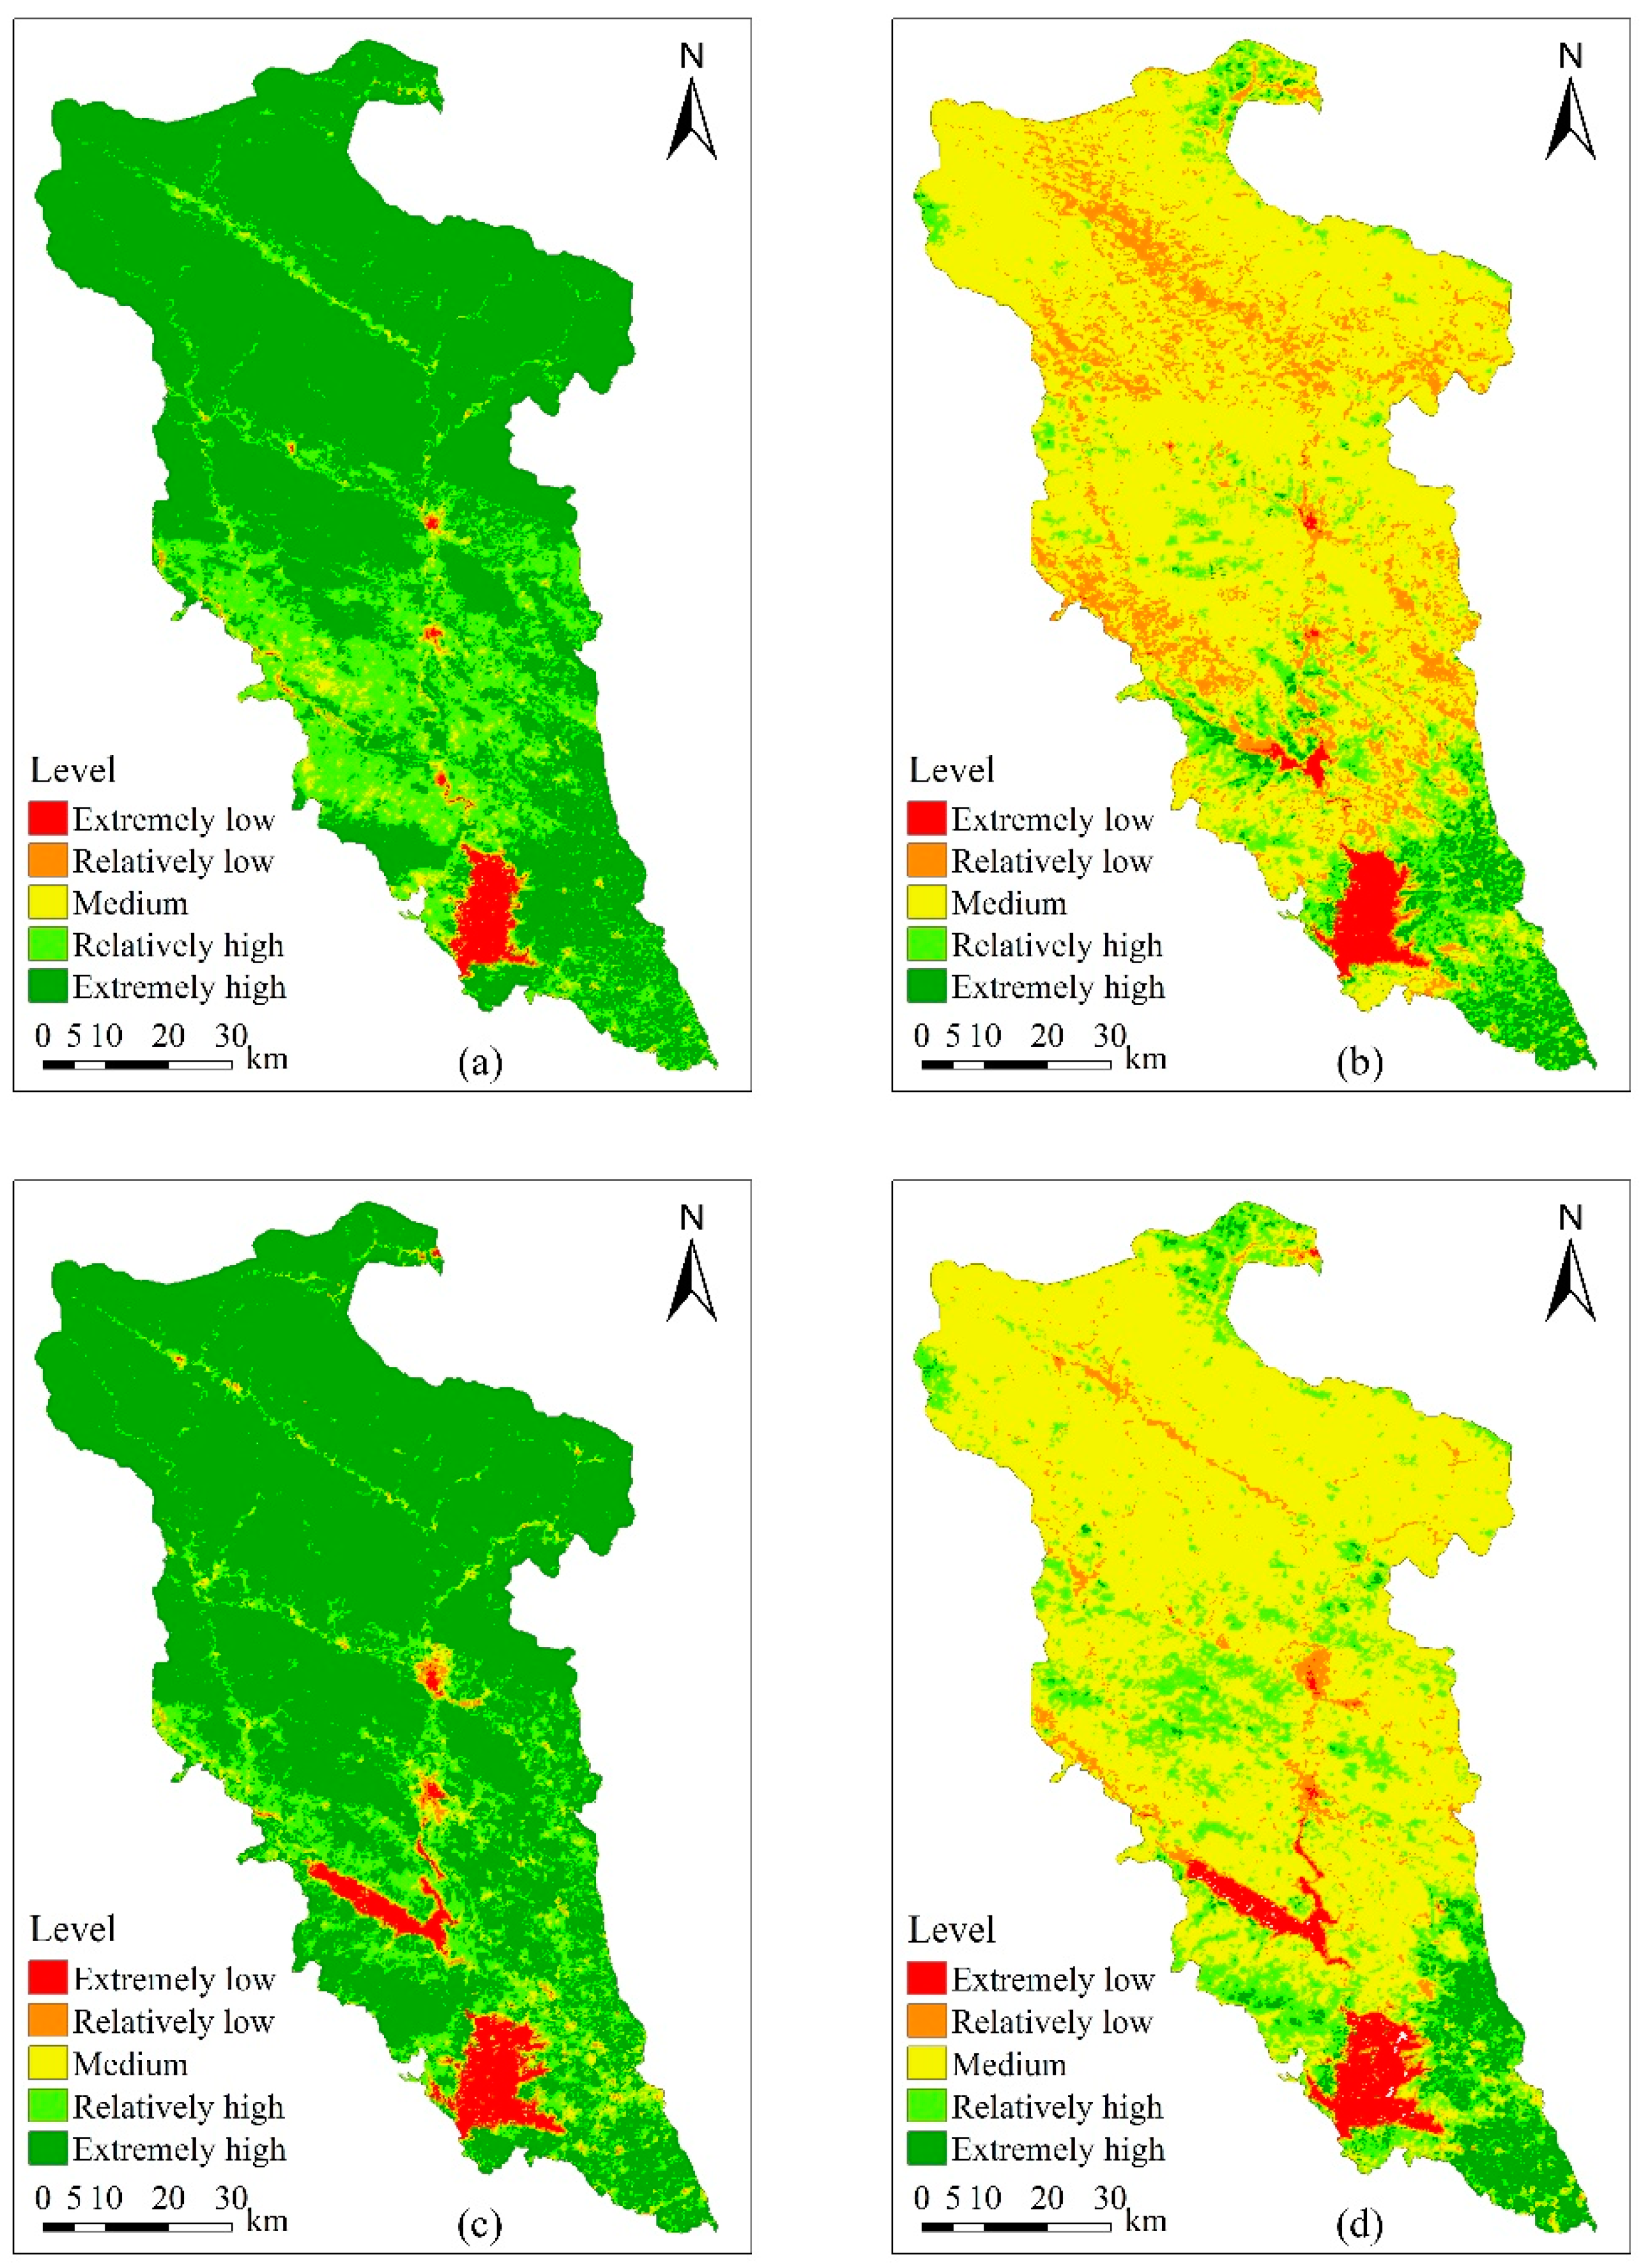
3.2. Analysis of the Impact of the Middle Route of the South-to-North Water Diversion Project on FVC Changes in the Danjiang River Basin
3.2.1. Analysis of Temporal Changes in FVC
3.2.2. Spatial Variation Analysis of FVC
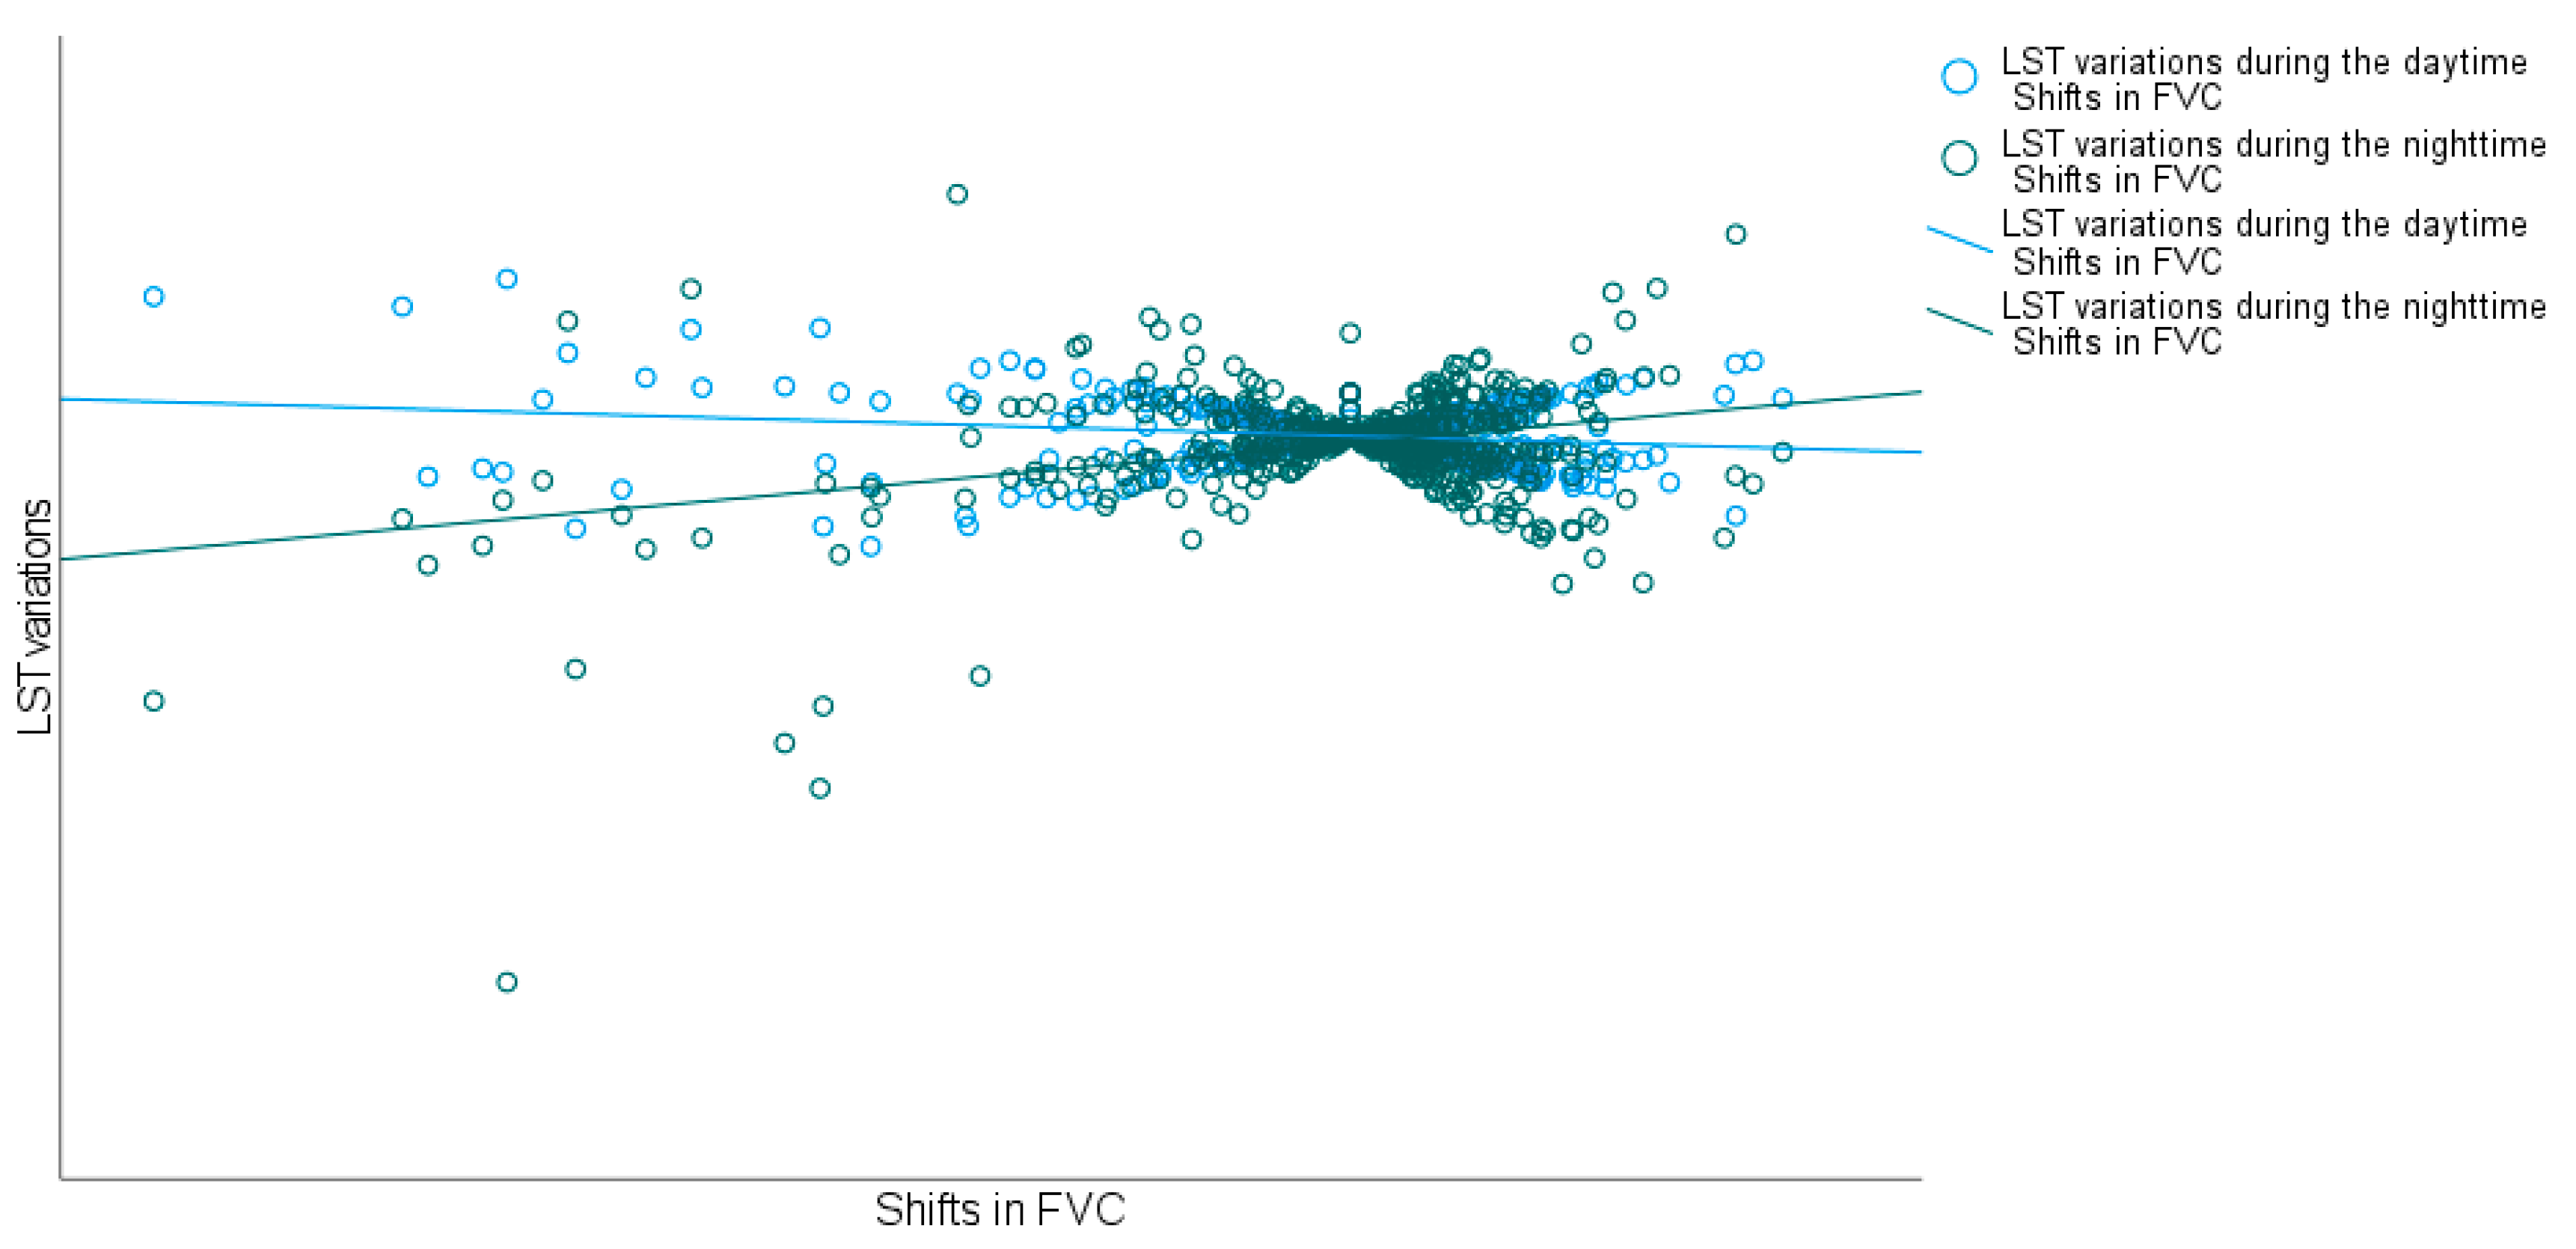
3.3. Correlation Analysis of LST Change and FVC Change in the Danjiang River Basin
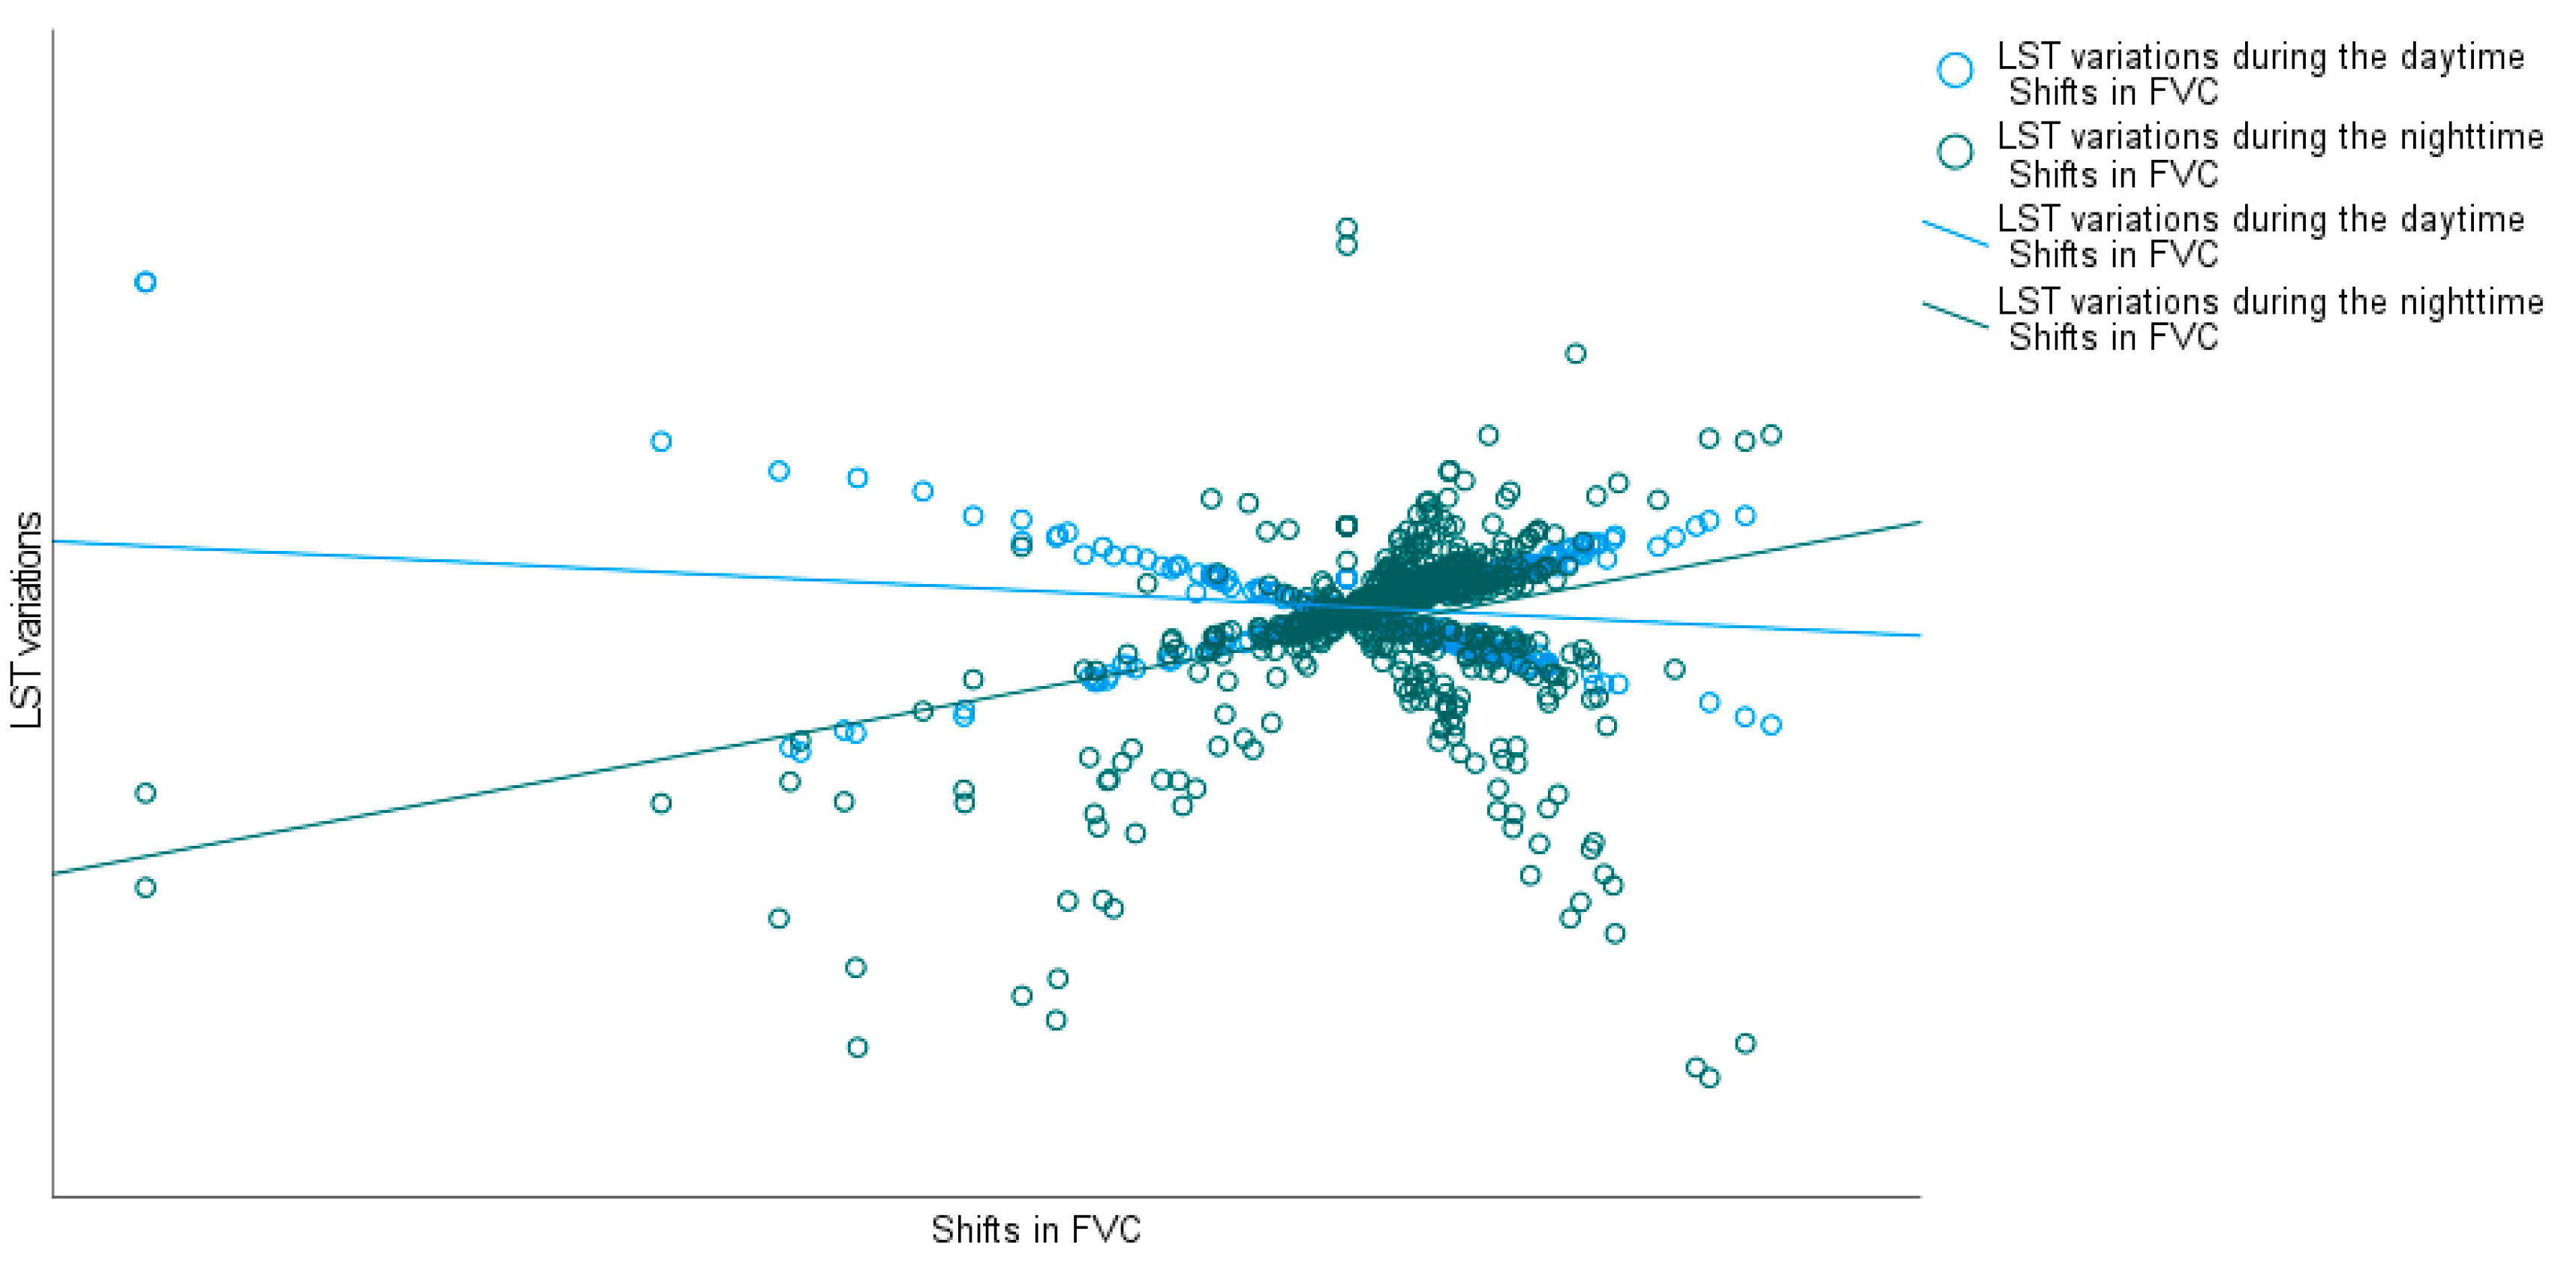
3.3.1. Correlation Analysis of Temperature Change and FVC Change during the Wet Season
- (1)
- A negative correlation (r = −0.195, p < 0.001) was observed between the change in FVC and the change in daytime LST during the wet season. This implies that the greater the change in daytime temperature during these periods, the lesser the change in vegetation transfer.
- (2)
- A positive correlation (r = 0.315, p < 0.001) was seen between the change in FVC and the change in nighttime LST during the wet season. This suggests that the greater the change in nighttime temperature during these periods, the greater the shift in vegetation.
3.3.2. Correlation Analysis of Temperature Change and FVC Change during the Dry Season
- (1)
- There was a significant but relatively weak negative correlation (r = −0.184, p < 0.001) between changes in FVC and temperature during the daytime dry season. In other words, a greater temperature change during the daytime dry season corresponds with a smaller shift in FVC during the same period.
- (2)
- Conversely, a significant positive correlation (r = 0.305, p < 0.001) was found between changes in FVC and nighttime temperature during the dry season. This suggests that a greater temperature change during the nighttime dry season correlates with a greater shift in FVC during the same period.
4. Discussion
4.1. Impact of the Middle Route of the South-to-North Water Diversion Project on LST in the Danjiang River Basin
4.2. Impact of the Middle Route of the South-to-North Water Diversion Project on FVC in the Danjiang River Basin
4.3. Interaction of LST and FVC
4.4. Limitations and Perspectives of the Study
- (1)
- The resolution of MODIS satellite data is limited. The accuracy and resolution of the two MODIS satellites are insufficient for the data requirements of future studies due to scientific and technological constraints. Therefore, it is essential to investigate how to utilize higher-accuracy data in future studies. For example, Landsat, GOES (Geostationary Operational Environmental Satellite), ASTER (Advanced Spaceborne Thermal Emission and Reflection Radiometer), and other series of high-resolution satellite data [70,71,72] can be used to supplement experimental analysis to improve the robustness of the results. This will help to provide a more precise characterization of the study area, thereby enabling a more accurate assessment of the Middle Route of the South-to-North Water Diversion Project’s impact.
- (2)
- This paper primarily investigates the correlation and influence of elevation on LST and FVC, focusing on regions with significant topographic relief and apparent elevation differences. The correlation may vary slightly, contingent upon the slope direction and other factors in different regions. Therefore, the influence of elevation on LST and FVC should be assessed in conjunction with topographic factors.
- (3)
- The water diversion project carries a substantial impact, with intricate interactions between regional precipitation, FVC, and LST. Precipitation quantity also influences LST and FVC, with the flow of surface runoff in the reservoir area being closely connected. Hence, there is a need for further comprehensive investigation into the temperature regulation effect of the Middle Route of the South-to-North Water Diversion Project. This should incorporate an in-depth analysis of precipitation and various environmental and climatic factors.
5. Conclusions
- (1)
- The Middle Route of the South-to-North Water Diversion Project has a regulatory effect on the LST in the Danjiang River Basin. Average LST has risen overall before and after project implementation, with a more significant increase during the wet season. The construction of the project has a more noticeable dampening effect on warming during the dry season. During both daytime and nighttime, the cooling effect is more pronounced in the wet season compared to the dry season, with differences of 3.6 °C and 3.1 °C, respectively. Conversely, the warming effect shows a decrease during the wet season in both daytime and nighttime, with differences of −0.6 °C and −0.4 °C, respectively.
- (2)
- The Middle Route of the South-to-North Water Diversion Project has positively influenced FVC in the Danjiang River Basin. FVC distribution shows higher levels in the wet season and pre-project, and lower levels in the dry season and post-project, particularly in plains and river valleys. The proportion of the area where FVC showed benign development during the dry season reached 24.89% of the total study area, a 9.62% increase compared to the wet season. Thus, the construction of the project has significantly contributed to the benign development of FVC and ecological environment stability.
- (3)
- A correlation exists between LST changes and FVC changes in the Danjiang River Basin. The change in FVC is negatively correlated with the change in daytime temperature and positively correlated with the change in nighttime temperature during both the wet and dry seasons. The higher the intensity of FVC variation, the stronger the temperature regulation effect of the project. An inverse regulation direction exists between daytime and nighttime, and the correlation between the intensity of FVC variation and the temperature regulation effect is more pronounced during the dry season.
Author Contributions
Funding
Data Availability Statement
Acknowledgments
Conflicts of Interest
References
- Zhao, H.M.; Alimujiang, K.S.M. Analysis of spatial and temporal evolution of thermal environment in Urumqi based on Landsat data. Ecol. Sci. 2021, 40, 21–29. [Google Scholar]
- Allen, M.A.; Roberts, D.A.; McFadden, J.P. Reduced urban green cover and daytime cooling capacity during the 2012–2016 California drought. Urban Clim. 2021, 36, 100768. [Google Scholar] [CrossRef]
- Lemoine-Rodríguez, R.; Inostroza, L.; Zepp, H. Intraurban heterogeneity of space-time land surface temperature trends in six climate-diverse cities. Sci. Total Environ. 2022, 804, 150037. [Google Scholar] [CrossRef] [PubMed]
- Chen, Q.J.; Hang, M.R.; Guo, Z. Spatial and temporal evolution characteristics of surface temperature in Xi’an during summer. Mapp. Sci. 2020, 45, 139–146. [Google Scholar]
- Geng, X.; Wang, X.M.; Fang, H.L.; Ye, J.S.; Han, L.K.; Gong, Y.; Cai, D.W. Vegetation coverage of desert ecosystems in the Qinghai-Tibet Plateau is underestimated. Ecol. Indic. 2022, 137, 108780. [Google Scholar] [CrossRef]
- Wusiman, A.; Manlike, A.; Rusuli, Y.; Zhang, F.; Chen, Y.H. Study on the spatial and temporal variation of vegetation cover of grassland in Xinjiang section of Tianshan Mountains and north and south foothills. J. Northwest For. Acad. 2023, 38, 153–161. [Google Scholar]
- Haq, M.A.; Baral, P.; Yaragal, S.; Rahaman, G. Assessment of trends of land surface vegetation distribution, snow cover and temperature over entire Himachal Pradesh using MODIS datasets. Nat. Resour. Model. 2020, 33, e12262. [Google Scholar] [CrossRef]
- Naga Rajesh, A.; Abinaya, S.; Purna Durga, G.; Lakshmi Kumar, T.V. Long-term relationships of MODIS NDVI with rainfall, land surface temperature, surface soil moisture and groundwater storage over monsoon core region of India. Arid Land Res. Manag. 2023, 37, 51–70. [Google Scholar] [CrossRef]
- Duan, S.B.; Li, Z.L.; Leng, P. A framework for the retrieval of all-weather land surface temperature at a high spatial resolution from polar-orbiting thermal infrared and passive microwave data. Remote Sens. Environ. 2017, 195, 107–117. [Google Scholar] [CrossRef]
- Ge, J.R.; Wang, H.J.; He, S.W.; Huang, X.X.; Hong, S. Seasonal spatial distribution and driving forces of surface temperature in the urban development area of Wuhan City. Yangtze River Basin Resour. Environ. 2021, 30, 351–360. [Google Scholar]
- Zhang, X.L.; Kasimu, A.; Liang, H.W. Analysis of spatial and temporal variation of surface temperature in Shihezi Oasis and coordination of urban development. J. Ecol. Rural Environ. 2023, 39, 324–334. [Google Scholar]
- Tang, T.B.; Zhou, B.; Jin, X.M.; Wei, S.l.J.; Ma, T.; Zhang, Y.Y. A study of summer surface temperature variation in the Yellow River source area. Arid Zone Geogr. 2023, 46, 1–14. [Google Scholar]
- Zhao, Q.; Tan, L.; Fang, Q.S.; Liu, C.Y.; Ma, K.; Zhu, S.G. Spatial and temporal evolution of heat island effect in Hefei city and its influence factors based on satellite data. J. Atmos. Environ. Opt. 2023, 18, 153–167. [Google Scholar]
- Zhu, W.B.; Lű, A.F.; Jia, S.F.; Yan, J.B.; Mahmood, R. Retrievals of all-weather daytime air temperature from MODIS products. Remote Sens. Environ. 2017, 189, 152–163. [Google Scholar] [CrossRef]
- Hu, G.T.; Wang, G.; Yang, C.J. Spatial distribution of green areas in Yangjiang City and its thermal environment analysis. Remote Sens. Inf. 2017, 32, 156–161. [Google Scholar]
- Shi, C.X.; Pan, Y.; Gu, J.X.; Xu, B.; Han, S.; Zhu, Z.; Zhang, L.; Sun, S.; Jiang, Z.W. A review of multi-source meteorological date fusion products. Acta Meteorol. Sin. 2019, 4, 774–783. [Google Scholar]
- Zhou, J.; Jia, L.; Menenti, M.; Liu, X. Optimal estimate of global biome—Specific parameter settings to reconstruct NDVI time series with the Harmonic ANalysis of Time Series (HANTS) method. Remote Sens. 2021, 13, 4251. [Google Scholar] [CrossRef]
- Tahooni, A.; Kakroodi, A.A.; Kiavarz, M. Monitoring of land surface albedo and its impact on land surface temperature (LST) using time series of remote sensing data. Ecol. Inform. 2023, 75, 102118. [Google Scholar] [CrossRef]
- Yang, H.; Cheng, Y.X.; Li, G.H. A denoising method for ship radiated noise based on Spearman variational mode decomposition, spatial-dependence recurrence sample entropy, improved wavelet threshold denoising, and Savitzky-Golay filter. Alex. Eng. J. 2021, 60, 3379–3400. [Google Scholar] [CrossRef]
- Lin, M.; Hou, L.Z.; Qi, Z.M.; Wan, L. Impacts of climate change and human activities on vegetation NDVI in China’s Mu Us Sandy Land during 2000–2019. Ecol. Indic. 2022, 142, 109164. [Google Scholar] [CrossRef]
- Wei, X.S.; Gao, Y.L.; Fan, Y.Q.; Lin, L.; Mao, J. Responses of the net primary productivity of vegetation to phenological changes in Beijing of China. Trans. Chin. Soc. Agric. Eng. 2022, 38, 167–175. [Google Scholar]
- Li, T.Q.; Zhu, X.F.; Pan, Y.Z.; Liu, X.F. Study on reconstruction methods of MODIS LST products. J. Beijing Norm. Univ. (Nat. Sci.). [CrossRef]
- Mao, K.B.; Yan, Y.B.; Cao, M.M.; Yuan, Z.j.; Qin, Z.H. Reconstruction of surface temperature data and analysis of spatial and temporal variability in North America. Nat. Resour. Remote Sens. 2022, 34, 203–215. [Google Scholar]
- Hua, A.K.; Ping, O.W. The influence of land-use/land-cover changes on land surface temperature: A case study of Kuala Lumpur metropolitan city. Eur. J. Remote Sens. 2018, 51, 1049. [Google Scholar] [CrossRef]
- Mishra, K.; Garg, R.D. Assessing variations in land cover-land use and surface temperature dynamics for Dehradun, India, using multi time and multi-sensor landsat data. Environ. Monit. Assess. 2023, 195, 373–403. [Google Scholar] [CrossRef] [PubMed]
- Ullah, W.; Ahmad, K.; Ullah, S.; Tahir, A.A.; Javed, M.F.; Nazir, A.; Abbasi, A.M.; Aziz, M.; Mohamed, A. Analysis of the relationship among land surface temperature (LST), land use land cover (LULC), and normalized difference vegetation index (NDVI) with topographic elements in the lower Himalayan region. Heliyon 2023, 9. [Google Scholar] [CrossRef] [PubMed]
- Zablotskii, V.R.; Zenkov, I.V.; Vu, D.T.; Dao, K.H. Relationship between the Land Surface Temperature and Land Cover Types, a Case Study in Hanoi City, Vietnam. Izv. Atmos. Ocean. Phys. 2023, 58, 1111–1120. [Google Scholar]
- Feng, F.; Yang, X.; Jia, B.Q.; Li, X.W.; Li, X.; Xu, C.Y.; Wang, K.C. Variability of urban fractional vegetation cover and its driving factors in 328 cities in China. Sci. China Earth Sci. 2024, 67, 466–482. [Google Scholar] [CrossRef]
- Mao, P.P.; Zhang, J.; Li, M.; Liu, Y.L.; Wang, X.; Yan, R.R.; Shen, B.B.; Zhang, X.; Shen, J.; Zhu, X.Y.; et al. Spatial and temporal variations in fractional vegetation cover and its driving factors in the Hulun Lake region. Ecol. Indic. 2022, 135, 108490. [Google Scholar] [CrossRef]
- Deng, Y.J.; Wang, J.C.; Xu, J.; Du, Y.D.; Chen, J.Y.; Chen, D.C. Spatial and temporal variability of NDVI in Guangdong Province and its response to climate factors. J. Ecol. Environ. 2021, 30, 37–43. [Google Scholar]
- Liu, L.; Zheng, J.H.; Guan, J.Y.; Han, W.Q.; Liu, Y.J. Grassland cover dynamics and their relationship with climatic factors in China from 1982 to 2021. Sci. Total Environ. 2023, 905, 167067. [Google Scholar] [CrossRef]
- Chen, M.Z.; Xue, Y.Y.; Xue, Y.B.; Peng, J.; Guo, J.W.; Liang, H.B. Assessing the effects of climate and human activity on vegetation change in Northern China. Environ. Res. 2024, 247, 118233. [Google Scholar] [CrossRef] [PubMed]
- Wufuer, T.; Lv, T.T.; Sai, B.; Feng, C.Y. Spatial and temporal patterns of vegetation cover in Bayinbruck alpine grassland and factors influencing it. J. Environ. Eng. Technol. 2022, 12, 1395–1401. [Google Scholar]
- Zhao, S.N.; Wang, Y.; Qiao, X.N.; Zhao, T.Q. Analysis of spatial and temporal variation and drivers of FVC in Huaihe River Basin from 1987–2021. J. Agric. Mach. 2023, 54, 180–190. [Google Scholar]
- Mohanasundaram, S.; Baghel, T.; Thakur, V.; Udmale, P.; Shrestha, S. Reconstructing NDVI and land surface temperature for cloud cover pixels of Landsat-8 images for assessing vegetation health index in the Northeast region of Thailand. Environ. Monit. Assess. 2022, 195, 211–244. [Google Scholar] [CrossRef] [PubMed]
- Kang, Z.W.; Zhang, Z.Y.; Liu, L.; Wang, T.X.; Tian, H.; Chen, H.J.; Zhang, X.Y. Analysis of spatial and temporal variation of surface temperature in Xinjiang based on MODIS. Geogr. Res. 2022, 41, 997–1017. [Google Scholar]
- Kikon, N.; Kumar, D.; Ahmed, S.A. Quantitative assessment of land surface temperature and vegetation indices on a kilometer grid scale. Environ. Sci. Pollut. Res. Int. 2023, 30, 107236–107258. [Google Scholar] [CrossRef] [PubMed]
- Wang, Y.N.; Kong, X.B.; Zhao, C.J.; Yao, G.Q.; Guo, K. Analysis of spatial and temporal pattern changes of vegetation cover on Loess Plateau from 2000 to 2020. J. Soil Water 2022, 36, 130–137. [Google Scholar]
- Liu, Y.X.; Yang, Y.B.; Hu, J.; Meng, X.J.; Kuang, K.X.; Hu, J.J.D.; Bao, Y. Temporal and spatial characteristics of urban heat island intensity over China based on long-temporal MODIS data. J. Geoinf. Sci. 2022, 5, 981–995. [Google Scholar]
- Guo, J.X.; Sang, H.Y.; Zhai, L. Spatial and temporal variation characteristics of vegetation cover and its drivers on the Tibetan Plateau. J. Ecol. 2023, 42, 1–13. [Google Scholar]
- Li, Y.L.; Wang, X.Q.; Chen, Y.Z.; Wang, M.M. Land surface temperature variations and their relationship to fractional vegetation coverage in subtropical regions: A case study in Fujian Province, China. Int. J. Remote Sens. 2020, 41, 2081–2097. [Google Scholar] [CrossRef]
- Mal, S.; Rani, S.; Maharana, P. Estimation of spatio-temporal variability in land surface temperature over the Ganga River Basin using MODIS data. Geocarto Int. 2022, 37, 3817–3839. [Google Scholar] [CrossRef]
- Liu, J.L.; Liu, S.W.; Tang, X.G.; Ding, Z.; Ma, M.G.; Yu, P.J. The response of land surface temperature changes to the vegetation dynamics in the Yangtze River Basin. Remote Sens. 2022, 14, 5093. [Google Scholar] [CrossRef]
- Song, Z.; Liang, S.L.; Feng, L.; He, T.; Song, X.P.; Zhang, L. Temperature changes in Three Gorges Reservoir Area and linkage with Three Gorges Project. J. Geophys. Res. Atmos. 2017, 122, 4866–4879. [Google Scholar] [CrossRef]
- Jiao, H.; Ding, Y.; Duan, S.J.; Xiao, H. Spatially coupled seasonal variation of vegetation cover and surface temperature in the Three Gorges reservoir area. J. Ecol. Rural Environ. 2022, 38, 1604–1612. [Google Scholar]
- He, G.H.; Zhao, Y.; Wang, J.H.; Wang, Q.M.; Zhu, Y.N. Impact of large-scale vegetation restoration project on summer land surface temperature on the Loess Plateau, China. J. Arid Land 2018, 10, 892–904. [Google Scholar] [CrossRef]
- Do, L.; Wu, M.; Lin, L.; Tao, J.X. Impact of the Middle Route of the South-to-North Water Diversion Project on phytoplankton community structure in Danjiangkou Reservoir. Environ. Sci. Technol. 2021, 44, 1–7. [Google Scholar]
- Yang, L.Y.; Shi, L.; Kong, H. Analysis of surface temperature evolution pattern and influencing factors in Maowusu sandy area from 2000–2019. J. Irrig. Drain. 2022, 41, 126–133. [Google Scholar]
- Tian, S.R.; Zhu, W.B.; Zhou, S.J. Near surface air temperature estimation based on MODIS atmospheric profile product over Qinghai Province. Prog. Geogr. 2021, 40, 1386–1396. [Google Scholar] [CrossRef]
- Ojha, R. Identification of homogeneous regions of near surface air temperature lapse rates across India. Int. J. Climatol. 2019, 39, 4288–4304. [Google Scholar] [CrossRef]
- Yue, J.B.; Guo, W.; Yang, G.J.; Zhou, C.Q.; Feng, H.K.; Qiao, H.B. Method for accurate multi-growth-stage estimation of fractional vegetation cover using unmanned aerial vehicle remote sensing. Plant Methods 2021, 17, 51. [Google Scholar] [CrossRef]
- Liu, C.X.; Zhang, X.D.; Wang, T.; Chen, G.Z.; Zhu, K.; Wang, Q.; Wang, J. Detection of vegetation coverage changes in the Yellow River Basin from 2003 to 2020. Ecol. Indic. 2022, 138, 108818. [Google Scholar] [CrossRef]
- Ma, M.Y.; Wang, Q.M.; Liu, R.; Zhao, Y.; Zhang, D.Q. Effects of climate change and human activities on vegetation coverage change in northern China considering extreme climate and time-lag and-accumulation effects. Sci. Total Environ. 2023, 860, 160527. [Google Scholar] [CrossRef] [PubMed]
- Qiao, R.R.; Dong, C.Y.; Ji, S.X.; Chang, X.L. Spatial Scale Effects of the Relationship between Fractional Vegetation Coverage and Land Surface Temperature in Horqin Sandy Land, North China. Sensors 2021, 21, 6914. [Google Scholar] [CrossRef] [PubMed]
- Li, X.; Zhang, G.; Chen, Y. Vegetation cover change and driving factors in the agro-pastoral ecotone of Liaohe River Basin of China from 2010 to 2019. Trans. Chin. Soc. Agric. Eng. 2022, 38, 63–72. [Google Scholar]
- Liu, Q.Y.; Zhang, T.L.; Li, Y.Z.; Li, Y.; Bu, C.F.; Zhang, Q.F. Comparative analysis of fractional vegetation cover estimation based on multi-sensor data in a semi-arid sandy area. Chin. Geogr. Sci. 2019, 29, 166–180. [Google Scholar] [CrossRef]
- Chen, S.J.; Xu, G.C.; Lu, Z.P.; Ma, M.Y.; Li, H.Y.; Zhu, Y.Y. Spatial and temporal evolution of vegetation cover in China and its response to climate change and urbanization. Geogr. Arid Reg. 2023, 46, 742–752. [Google Scholar]
- Qian, H.R.; Zhai, J.Q.; Ma, M.Y.; Zhao, Y.; Ling, M.H.; Wang, Q.M. Spatial and temporal variation of vegetation cover in the Haihe River Basin during the growing season and analysis of the driving forces. Soil Water Conserv. Res. 2023, 30, 309–317. [Google Scholar]
- Mao, K.B.; Yan, Y.B.; Zhao, B.; Yuan, Z.J.; Cao, M.M. Analysis of spatial and temporal variability of land surface temperature and driving factors in China. Disaster Sci. 2023, 38, 60–73. [Google Scholar]
- LU, L.J.; Wang, L.H.; Li, Y.; Zhao, P.C.; Yang, Q.C.; Feng, Q.; Xiao, F.; Du, Y.; Ling, F. Remote Sensing Monitoring and Spatial Temporal Pattern Evolution Analysis of the Vegetation Ecosystem Quality in the Danjiangkou Reservoir Area from 2001 to 2020. Resour. Environ. Yangtze Basin 2023, 6, 1291–1304. [Google Scholar]
- Jarchow, C.J.; Nagler, P.L.; Glenn, E.P. Greenup and evapotranspiration following the Minute 319 pulse flow to Mexico: An analysis using Landsat 8 Normalized Difference Vegetation Index (NDVI) data. Ecol. Eng. 2017, 106, 776–783. [Google Scholar] [CrossRef]
- Gao, W.W.; Zeng, Y.; Zhao, D.; Wu, B.F.; Ren, Z.Y. Land cover changes and drivers in the water source area of the Middle Route of the South-to-North Water Diversion Project in China from 2000 to 2015. Chin. Geogr. Sci. 2020, 30, 115–126. [Google Scholar] [CrossRef]
- Sun, Z.D.; Chang, N.B.; Opp, C.; Hennig, T. Evaluation of ecological restoration through vegetation patterns in the lower Tarim River, China with MODIS NDVI data. Ecol. Inform. 2011, 6, 156–163. [Google Scholar] [CrossRef]
- Bao, A.M.; Huang, Y.; Ma, Y.G.; Guo, H.; Wang, Y.Q. Assessing the effect of EWDP on vegetation restoration by remote sensing in the lower reaches of Tarim River. Ecol. Indic. 2017, 74, 261–275. [Google Scholar] [CrossRef]
- Liu, H.; Liu, F.; Yuan, H.M.; Zheng, L.; Zhang, Y. Assessing the relative role of climate and human activities on vegetation cover changes in the up-down stream of Danjiangkou, China. J. Plant Ecol. 2022, 15, 180–195. [Google Scholar] [CrossRef]
- Wang, S.D.; Cui, D.Y.; Wang, L.; Peng, J.Y. Applying deep-learning enhanced fusion methods for improved NDVI reconstruction and long-term vegetation cover study: A case of the Danjiang River Basin. Ecol. Indic. 2023, 155, 111088. [Google Scholar] [CrossRef]
- Zhao, H.B.; Tan, J.T.; Ren, Z.B.; Wang, Z.Y. Spatiotemporal Characteristics of Urban Surface Temperature and Its Relationship with Landscape Metrics and Vegetation Cover in Rapid Urbanization Region. Complexity 2020, 2020, 7892362. [Google Scholar] [CrossRef]
- Zhang, Y.S.; Balzter, H.; Li, Y. Influence of Impervious Surface Area and Fractional Vegetation Cover on Seasonal Urban Surface Heating/Cooling Rates. Remote Sens. 2021, 13, 1263. [Google Scholar] [CrossRef]
- Li, Y.L.; Wang, X.Q.; Chen, Y.Z.; Wang, M.M. Correlation analysis of surface temperature and vegetation cover in Fujian Province. J. Geoinf. Sci. 2019, 21, 445–454. [Google Scholar]
- Meng, X.C.; Cheng, J.; Guo, H.; Guo, Y.H.; Yao, B.B. Accuracy evaluation of the Landsat 9 land surface temperature product. IEEE J. Sel. Top. Appl. Earth Obs. Remote Sens. 2022, 15, 8694–8703. [Google Scholar] [CrossRef]
- Lee, J.; Dessler, A.E. Improved Surface Urban Heat Impact Assessment Using GOES Satellite Data: A Comparative Study with ERA-5. Geophys. Res. Lett. 2024, 51, e2023GL107364. [Google Scholar] [CrossRef]
- Sattari, F.; Hashim, M.; Sookhak, M.; Banihashemi, S.; Pour, A.B. Assessment of the TsHARP method for spatial downscaling of land surface temperature over urban regions. Urban Clim. 2022, 45, 101265. [Google Scholar] [CrossRef]


| Data Type | Data Name | Data Source |
|---|---|---|
| Raster data | MODIS remote sensing image data (MYD11A2) | https://www.nasa.gov/ |
| MODIS remote sensing image data (MYD13Q1) | https://www.nasa.gov/ | |
| DEM data | https://www.gscloud.cn/ | |
| Landsat 7 remote sensing image data | https://www.gscloud.cn/ | |
| Meteorological data | Daily average temperature data | https://data.cma.cn/ |
| Level | NRECI |
|---|---|
| Extremely weak zone of variation | 0.0–0.2 |
| Relatively weak zone of variation | 0.2–0.4 |
| Medium zone of variation | 0.4–0.6 |
| Relatively strong zone of variation | 0.6–0.8 |
| Extremely strong zone of variation | 0.8–1.0 |
| No. | Land Surface Temperature Difference before the Construction of the Middle Route of the South-to-North Water Diversion Project | Land Surface Temperature Difference after the Construction of the Middle Route of the South-to-North Water Diversion Project | RECI | Cooling Effect | Warming Effect | No Effect |
|---|---|---|---|---|---|---|
| 1 | >0 | >0 | ≥0 | √ | ||
| 2 | >0 | ≥0 | <0 | √ | ||
| 3 | >0 | <0 | ≥0 | √ | ||
| 4 | >0 | ≤0 | <0 | √ | ||
| 5 | <0 | ≥0 | >0 | √ | ||
| 6 | <0 | >0 | ≤0 | √ | ||
| 7 | <0 | ≤0 | >0 | √ | ||
| 8 | <0 | <0 | ≤0 | √ |
| Level | FVC |
|---|---|
| Extremely high coverage | >70% |
| Relatively high coverage | 50–70% |
| Medium coverage | 30–50% |
| Relatively low coverage | 10–30% |
| Extremely low coverage | <10% |
| Benign Development of FVC | Malignant Development of FVC | ||
|---|---|---|---|
| Level | Intensity | Level | Intensity |
| 0 | Not | −1 | weak |
| 1 | Weak | −2 | strong |
| 2 | strong | −3 | relatively strong |
| 3 | relatively strong | −4 | extremely strong |
| 4 | extremely strong | ||
| Time Period/FVC Level | Extremely High Coverage | Relatively High Coverage | Medium Coverage | Relatively Low Coverage | Extremely Low Coverage | ||
|---|---|---|---|---|---|---|---|
| Before the implementation of the project | wet season | area (km2) | 6085.62 | 1957.13 | 189.65 | 38.00 | 141.18 |
| proportion (%) | 72.35 | 23.27 | 2.25 | 0.45 | 1.68 | ||
| dry season | area (km2) | 378.61 | 1094.40 | 5675.17 | 1064.89 | 198.51 | |
| proportion (%) | 4.50 | 13.01 | 67.47 | 12.66 | 2.36 | ||
| After the implementation of the project | wet season | area (km2) | 6481.92 | 1354.79 | 226.76 | 79.60 | 268.50 |
| proportion (%) | 77.06 | 16.11 | 2.70 | 0.95 | 3.19 | ||
| dry season | area (km2) | 487.85 | 1515.87 | 5768.67 | 334.95 | 304.24 | |
| proportion (%) | 5.80 | 18.02 | 68.58 | 3.98 | 3.62 | ||
| Correlation | ||||
|---|---|---|---|---|
| Shifts in FVC | LST variations during the daytime | LST variations during the nighttime | ||
| Shifts in FVC | Pearson Correlation | 1 | −0.195 ** | 0.315 ** |
| Significance (two-tailed) | <0.001 | <0.001 | ||
| Number of cases | 651 | 651 | 651 | |
| Correlation | ||||
|---|---|---|---|---|
| Shifts in FVC | LST variations during the daytime | LST variations during the nighttime | ||
| Shifts in FVC | Pearson Correlation | 1 | −0.184 ** | 0.328 ** |
| Significance (two-tailed) | <0.001 | <0.001 | ||
| Number of cases | 651 | 651 | 651 | |
Disclaimer/Publisher’s Note: The statements, opinions and data contained in all publications are solely those of the individual author(s) and contributor(s) and not of MDPI and/or the editor(s). MDPI and/or the editor(s) disclaim responsibility for any injury to people or property resulting from any ideas, methods, instructions or products referred to in the content. |
© 2024 by the authors. Licensee MDPI, Basel, Switzerland. This article is an open access article distributed under the terms and conditions of the Creative Commons Attribution (CC BY) license (https://creativecommons.org/licenses/by/4.0/).
Share and Cite
Wang, S.; Liu, Y.; Guo, J.; Liu, J.; Chai, H. Impacts of the Middle Route of the South-to-North Water Diversion Project on Land Surface Temperature and Fractional Vegetation Coverage in the Danjiang River Basin. Remote Sens. 2024, 16, 2665. https://doi.org/10.3390/rs16142665
Wang S, Liu Y, Guo J, Liu J, Chai H. Impacts of the Middle Route of the South-to-North Water Diversion Project on Land Surface Temperature and Fractional Vegetation Coverage in the Danjiang River Basin. Remote Sensing. 2024; 16(14):2665. https://doi.org/10.3390/rs16142665
Chicago/Turabian StyleWang, Shidong, Yuanyuan Liu, Jianhua Guo, Jinping Liu, and Huabin Chai. 2024. "Impacts of the Middle Route of the South-to-North Water Diversion Project on Land Surface Temperature and Fractional Vegetation Coverage in the Danjiang River Basin" Remote Sensing 16, no. 14: 2665. https://doi.org/10.3390/rs16142665
APA StyleWang, S., Liu, Y., Guo, J., Liu, J., & Chai, H. (2024). Impacts of the Middle Route of the South-to-North Water Diversion Project on Land Surface Temperature and Fractional Vegetation Coverage in the Danjiang River Basin. Remote Sensing, 16(14), 2665. https://doi.org/10.3390/rs16142665