
Validation and Conformity Testing of Sentinel-3 Green Instantaneous FAPAR and Canopy Chlorophyll Content Products

 , ,
, ,  ,
,  ,
,  and
and
Abstract
:1. Introduction
2. Materials and Methods
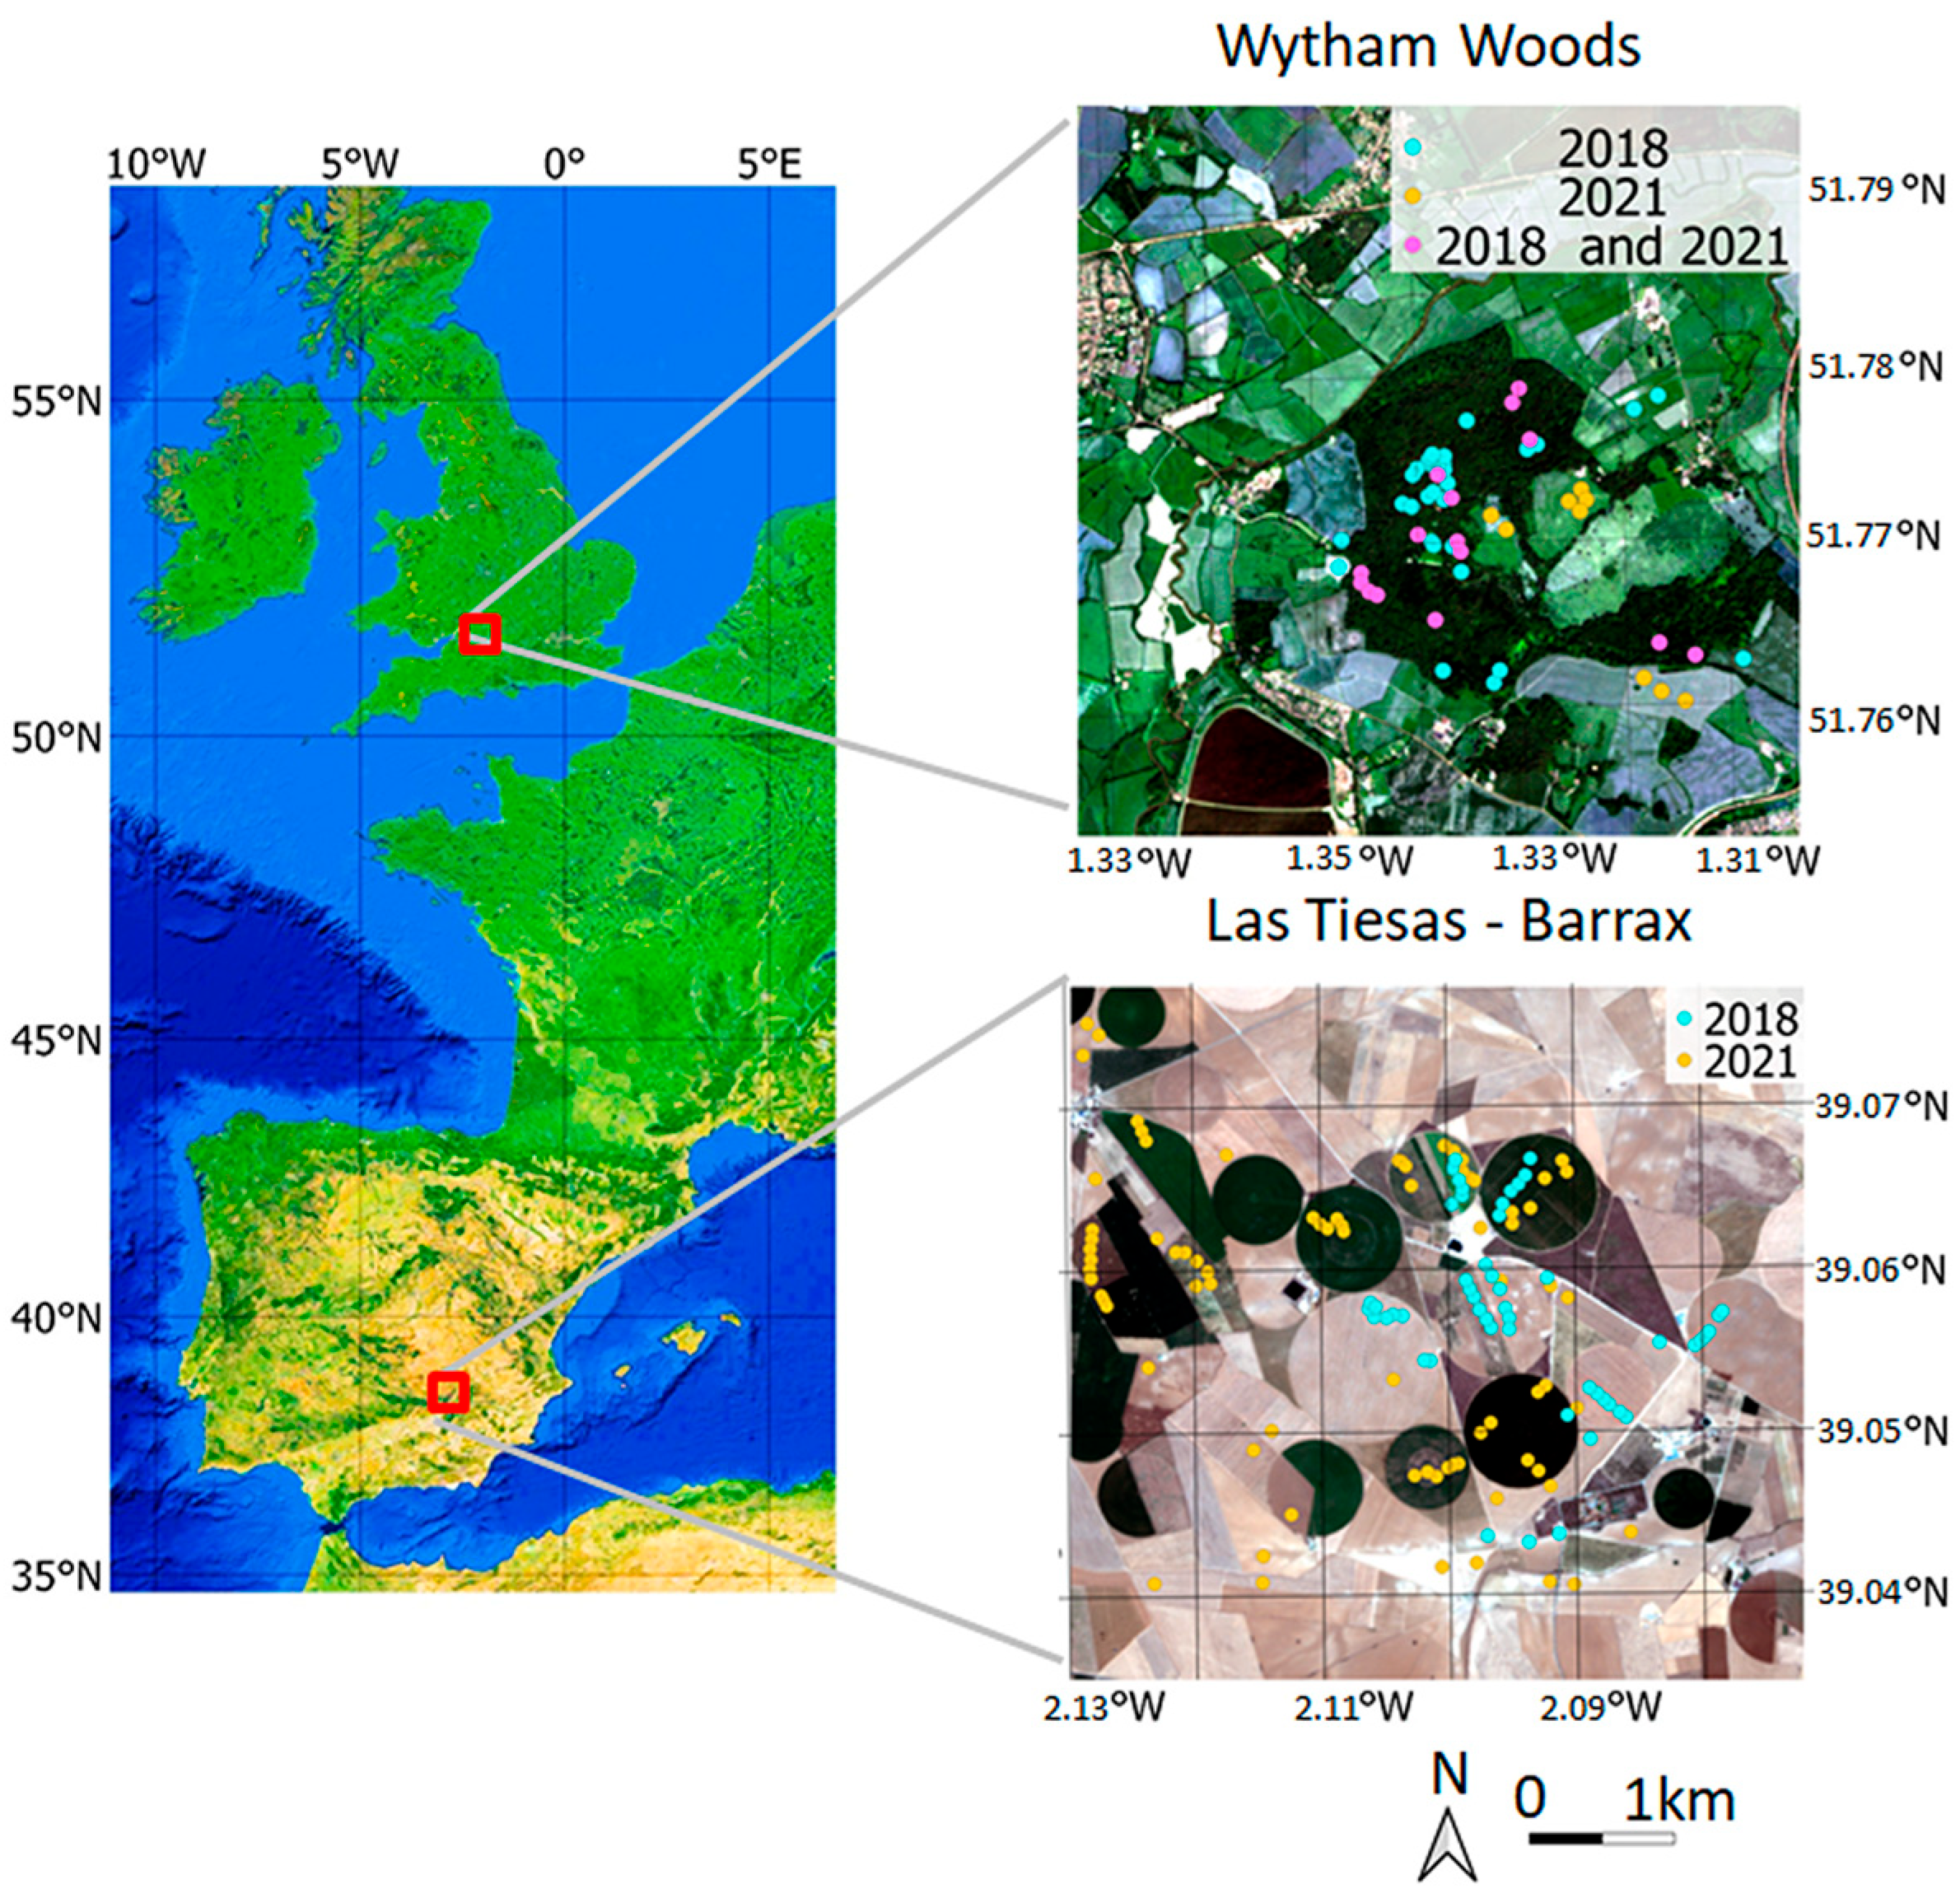
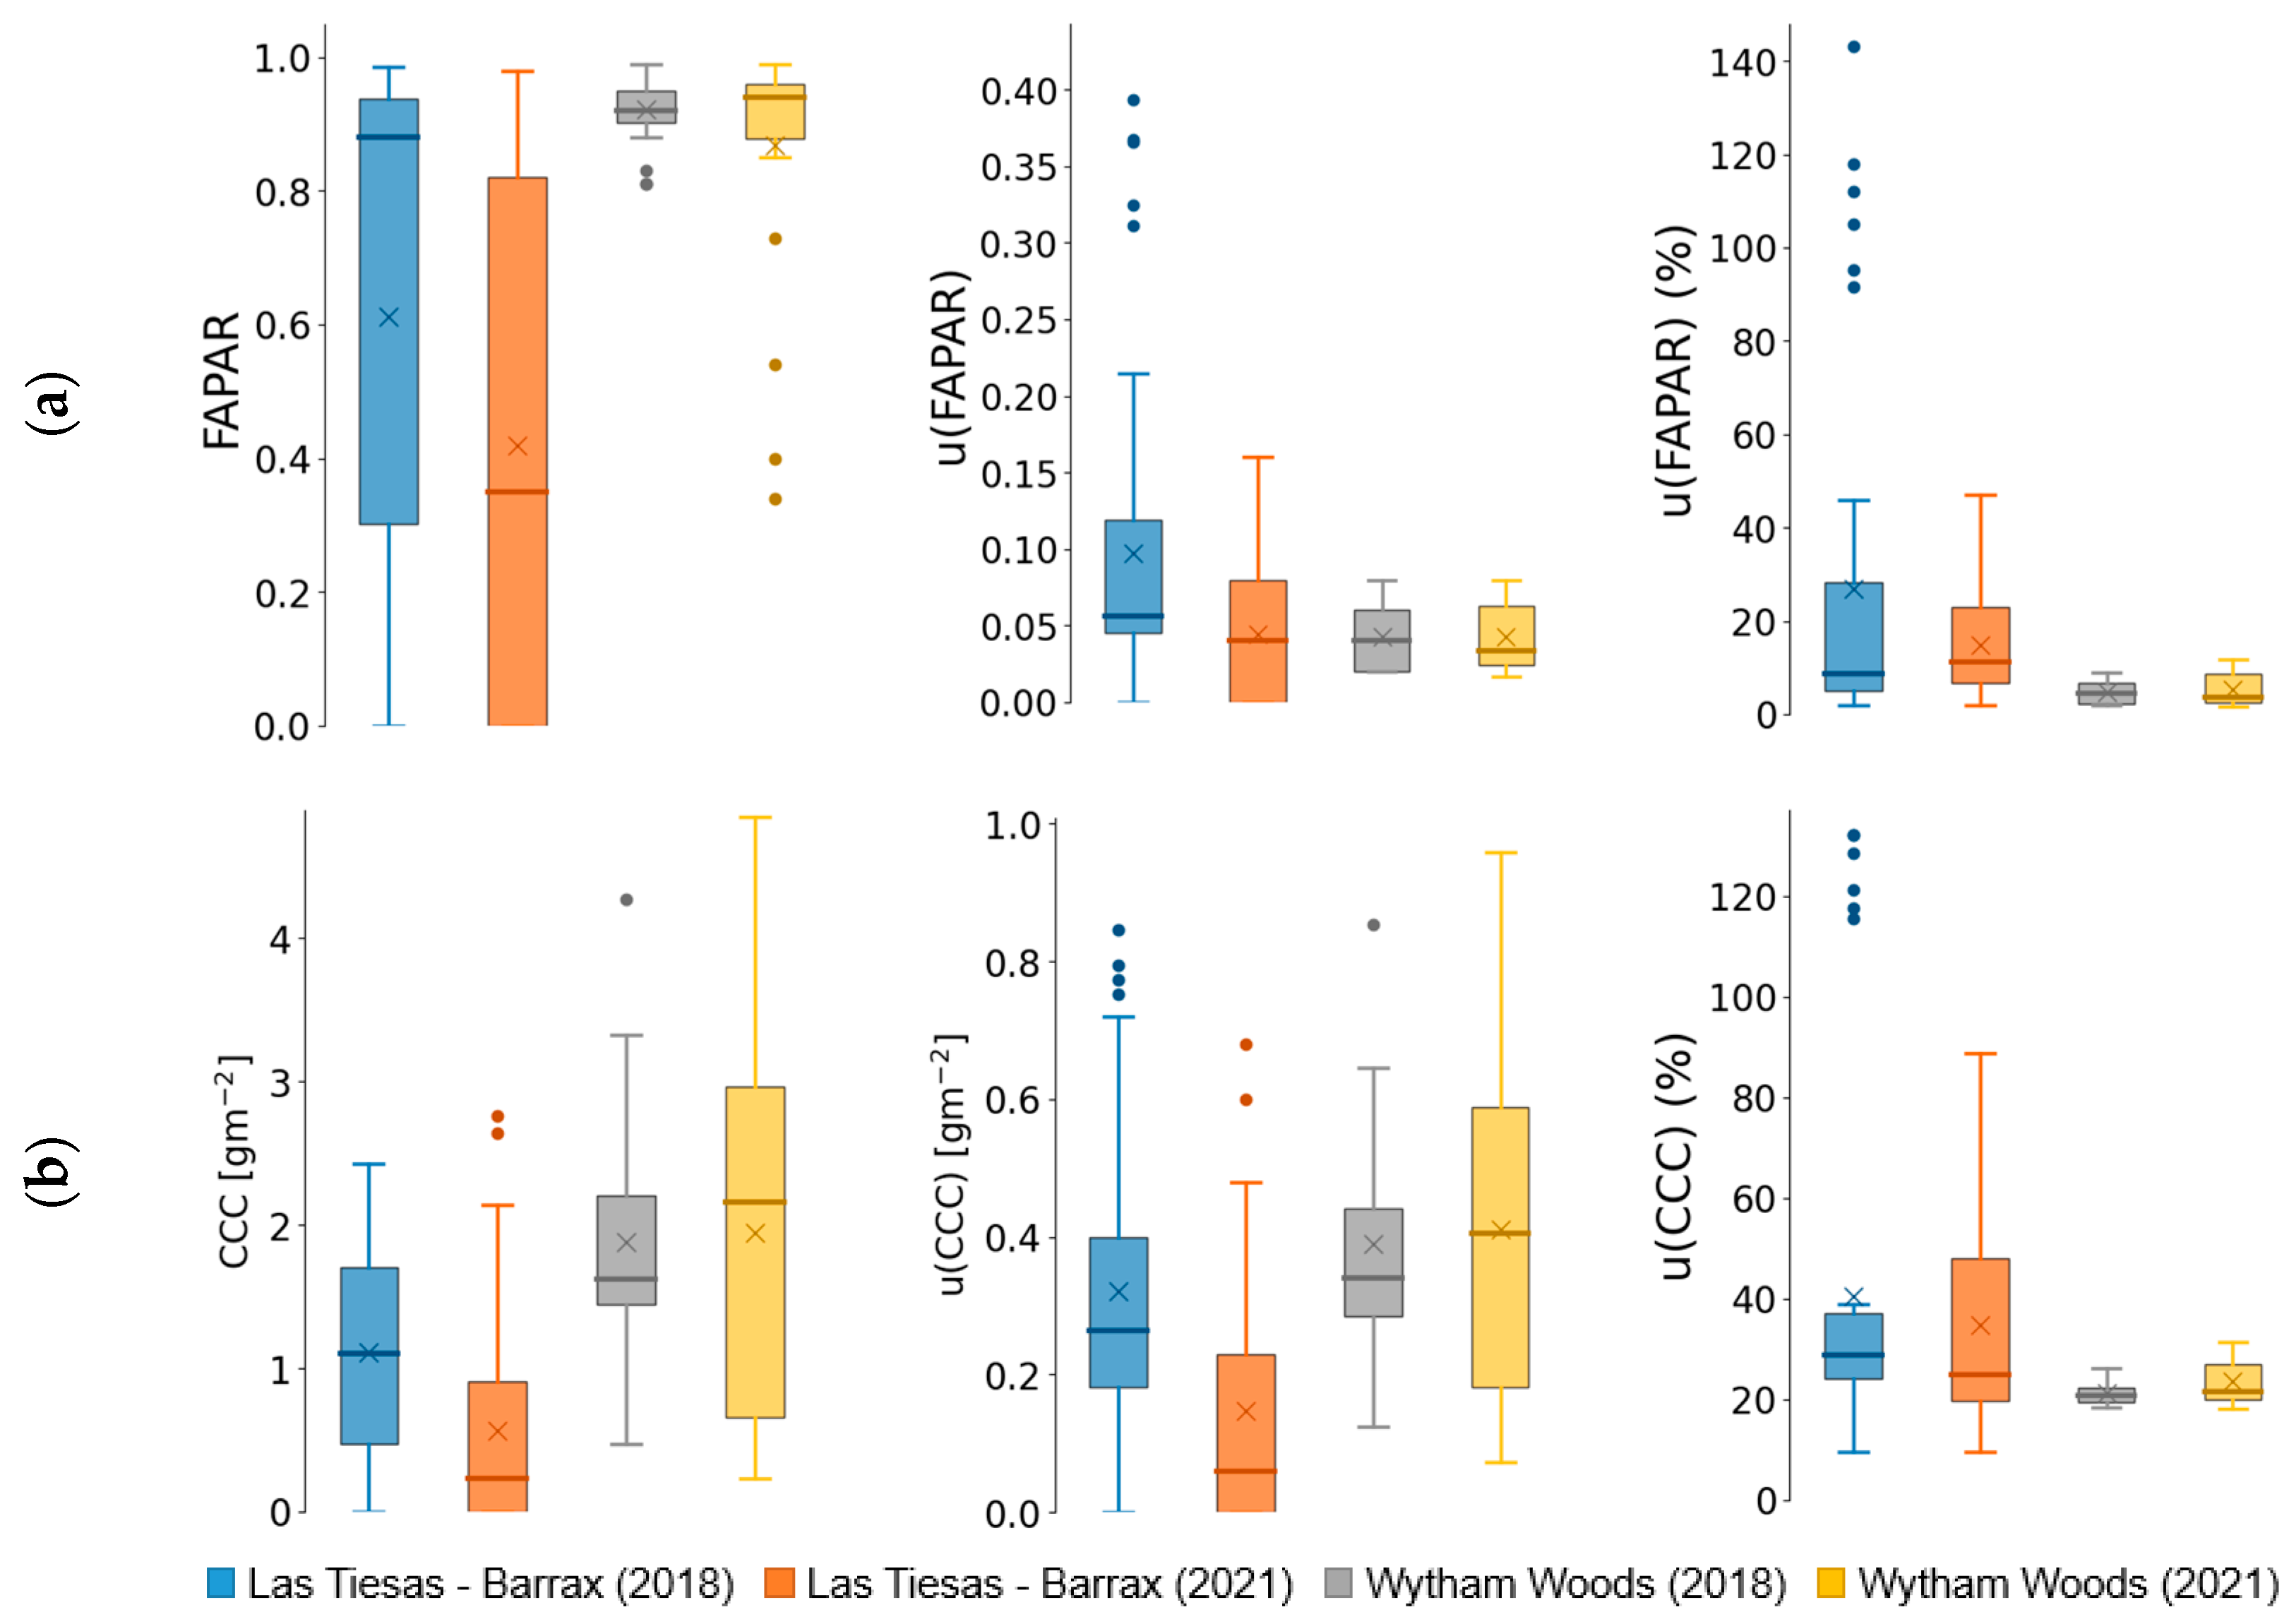
2.1. Campaigns and Fiducial Reference Measurements
2.2. FRM-Based Sentinel-2 Reference Maps
2.3. Sentinel-3 OLCI Bio-Geophysical Products
2.3.1. GIFAPAR
2.3.2. OTCI—CCC
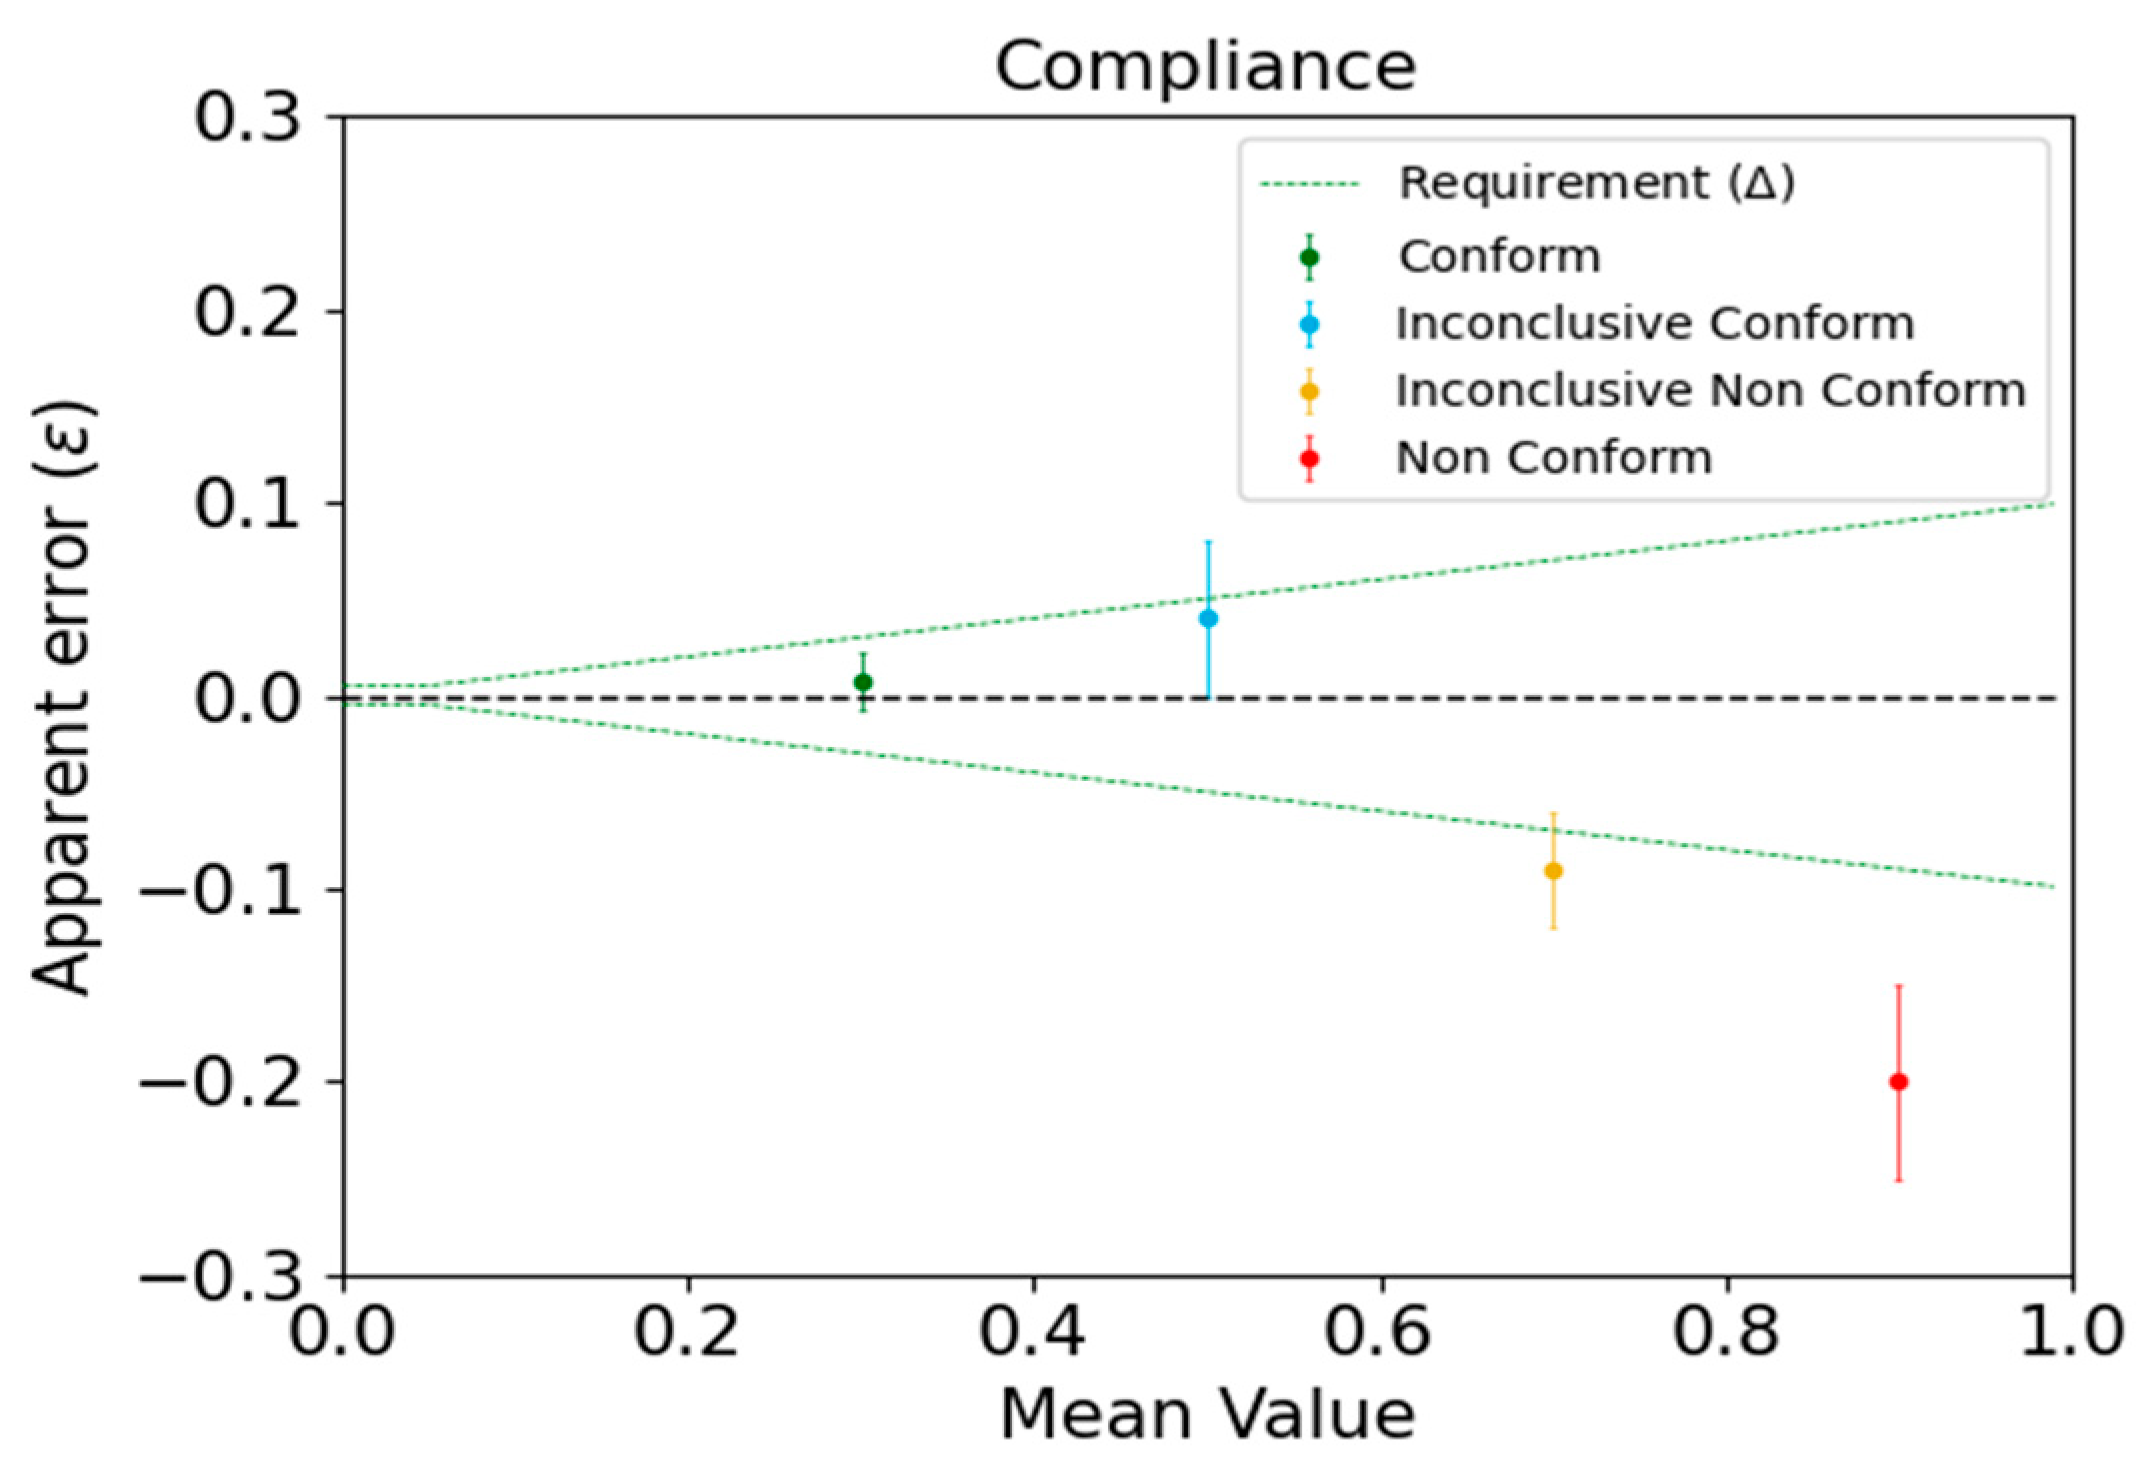
2.4. Validation and Conformity Testing
- Conclusively conforming (guarded acceptance): If the apparent error absolute value and its expanded uncertainty are lower or equal to the maximum permissible error:
- Conclusively non-conforming (guarded rejection): If the apparent error absolute value and its expanded uncertainty are greater than the maximum permissible error:
- Inconclusively conforming: If the apparent error absolute value is lower or equal to the maximum permissible error, but the expanded uncertainty is greater than the maximum permissible error:
- Inconclusively non-conforming: If the apparent error absolute value is greater than the maximum permissible error, but the expanded uncertainty is lower or equal to the maximum permissible error:
2.5. Aggregation of FRM-Based Reference Maps to OLCI’s Native Resolution
3. Results
3.1. Agricultural Site
3.1.1. GIFAPAR
3.1.2. CCC
3.2. Deciduous Forest Site
3.2.1. GIFAPAR
3.2.2. CCC
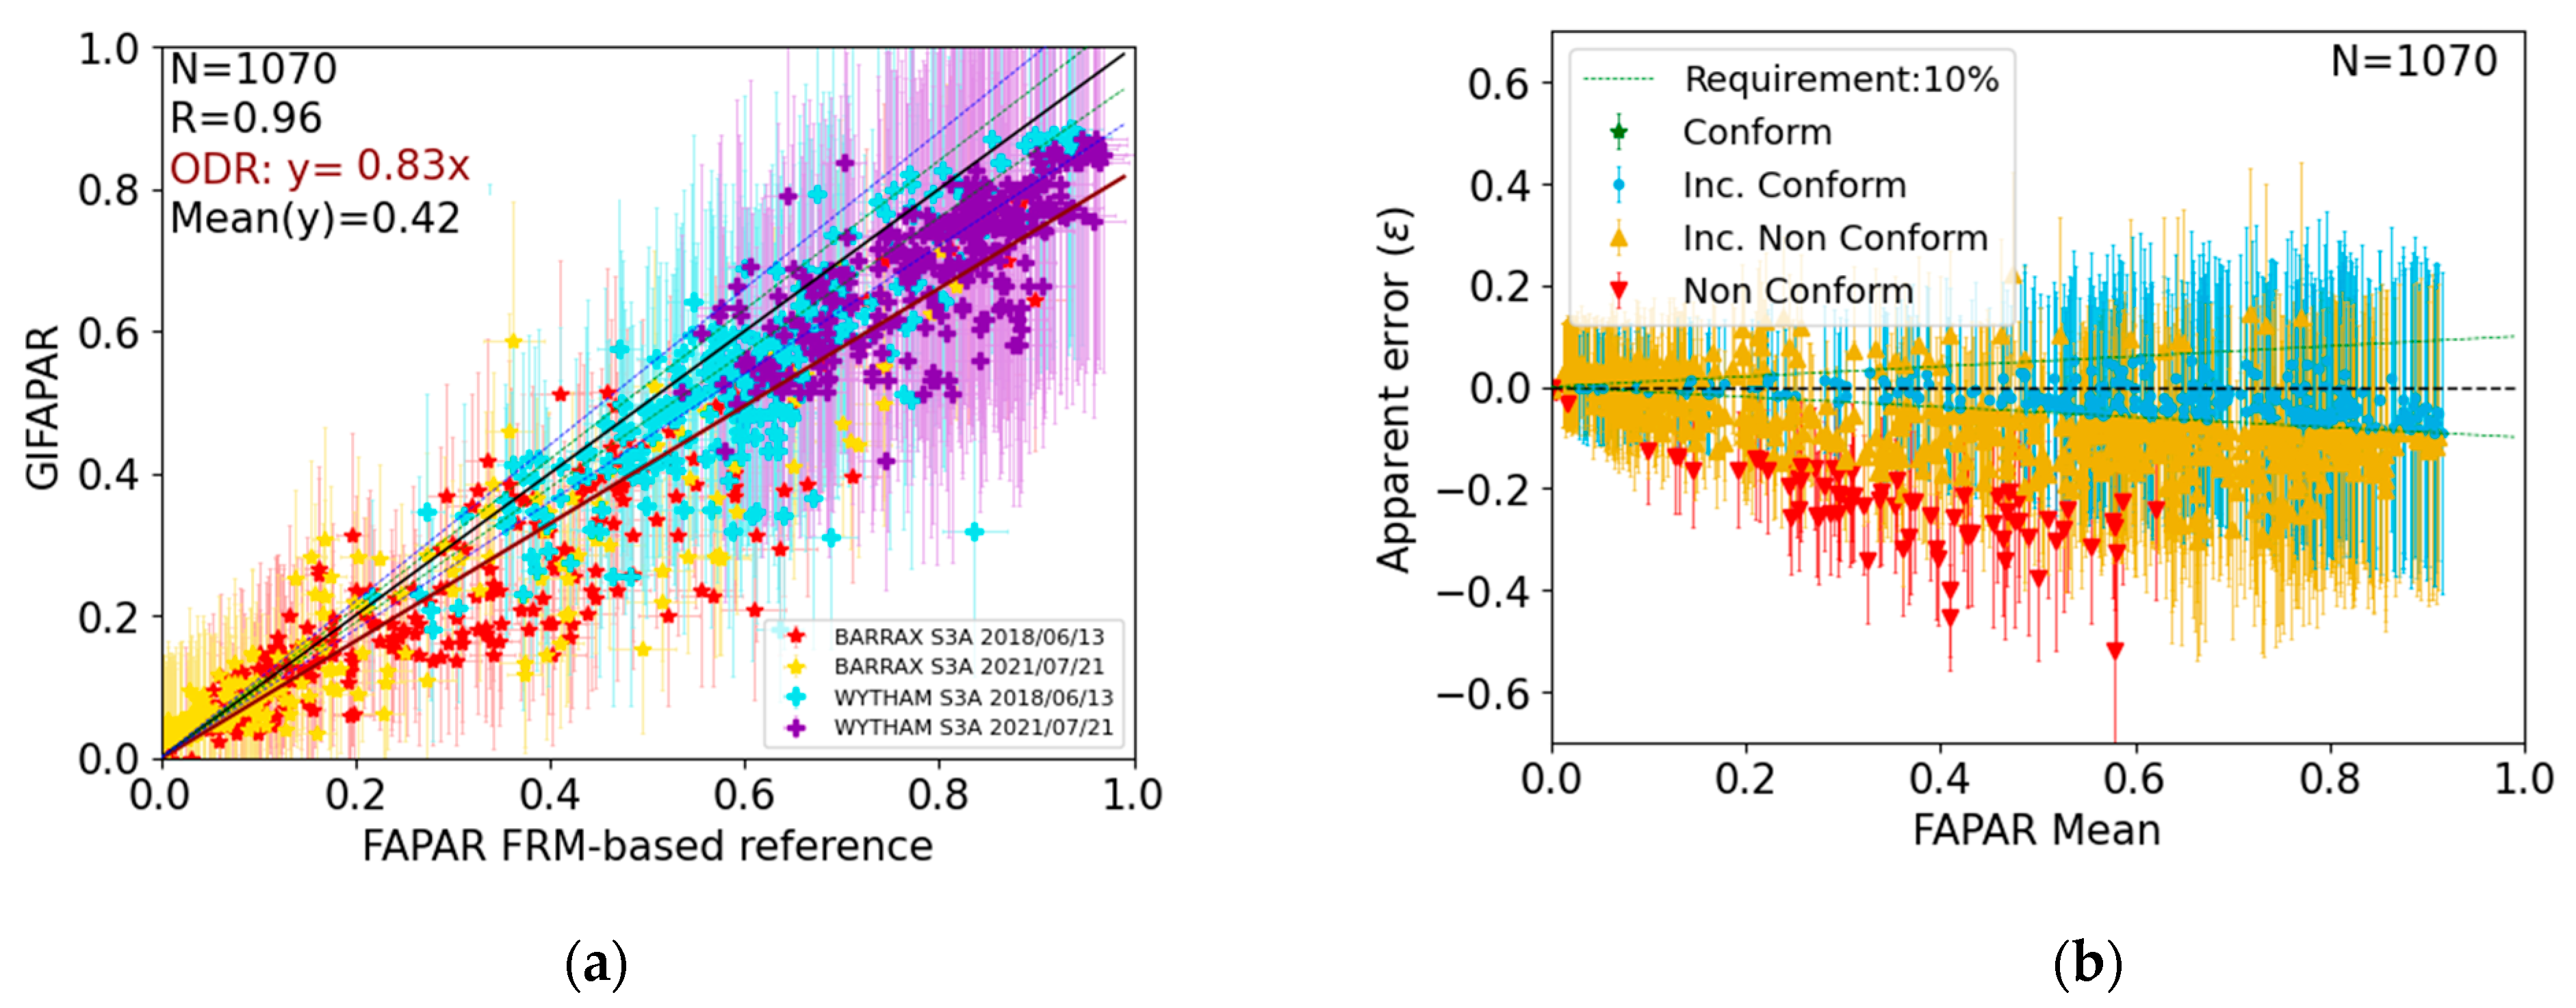
3.3. Overall Results
3.3.1. GIFAPAR
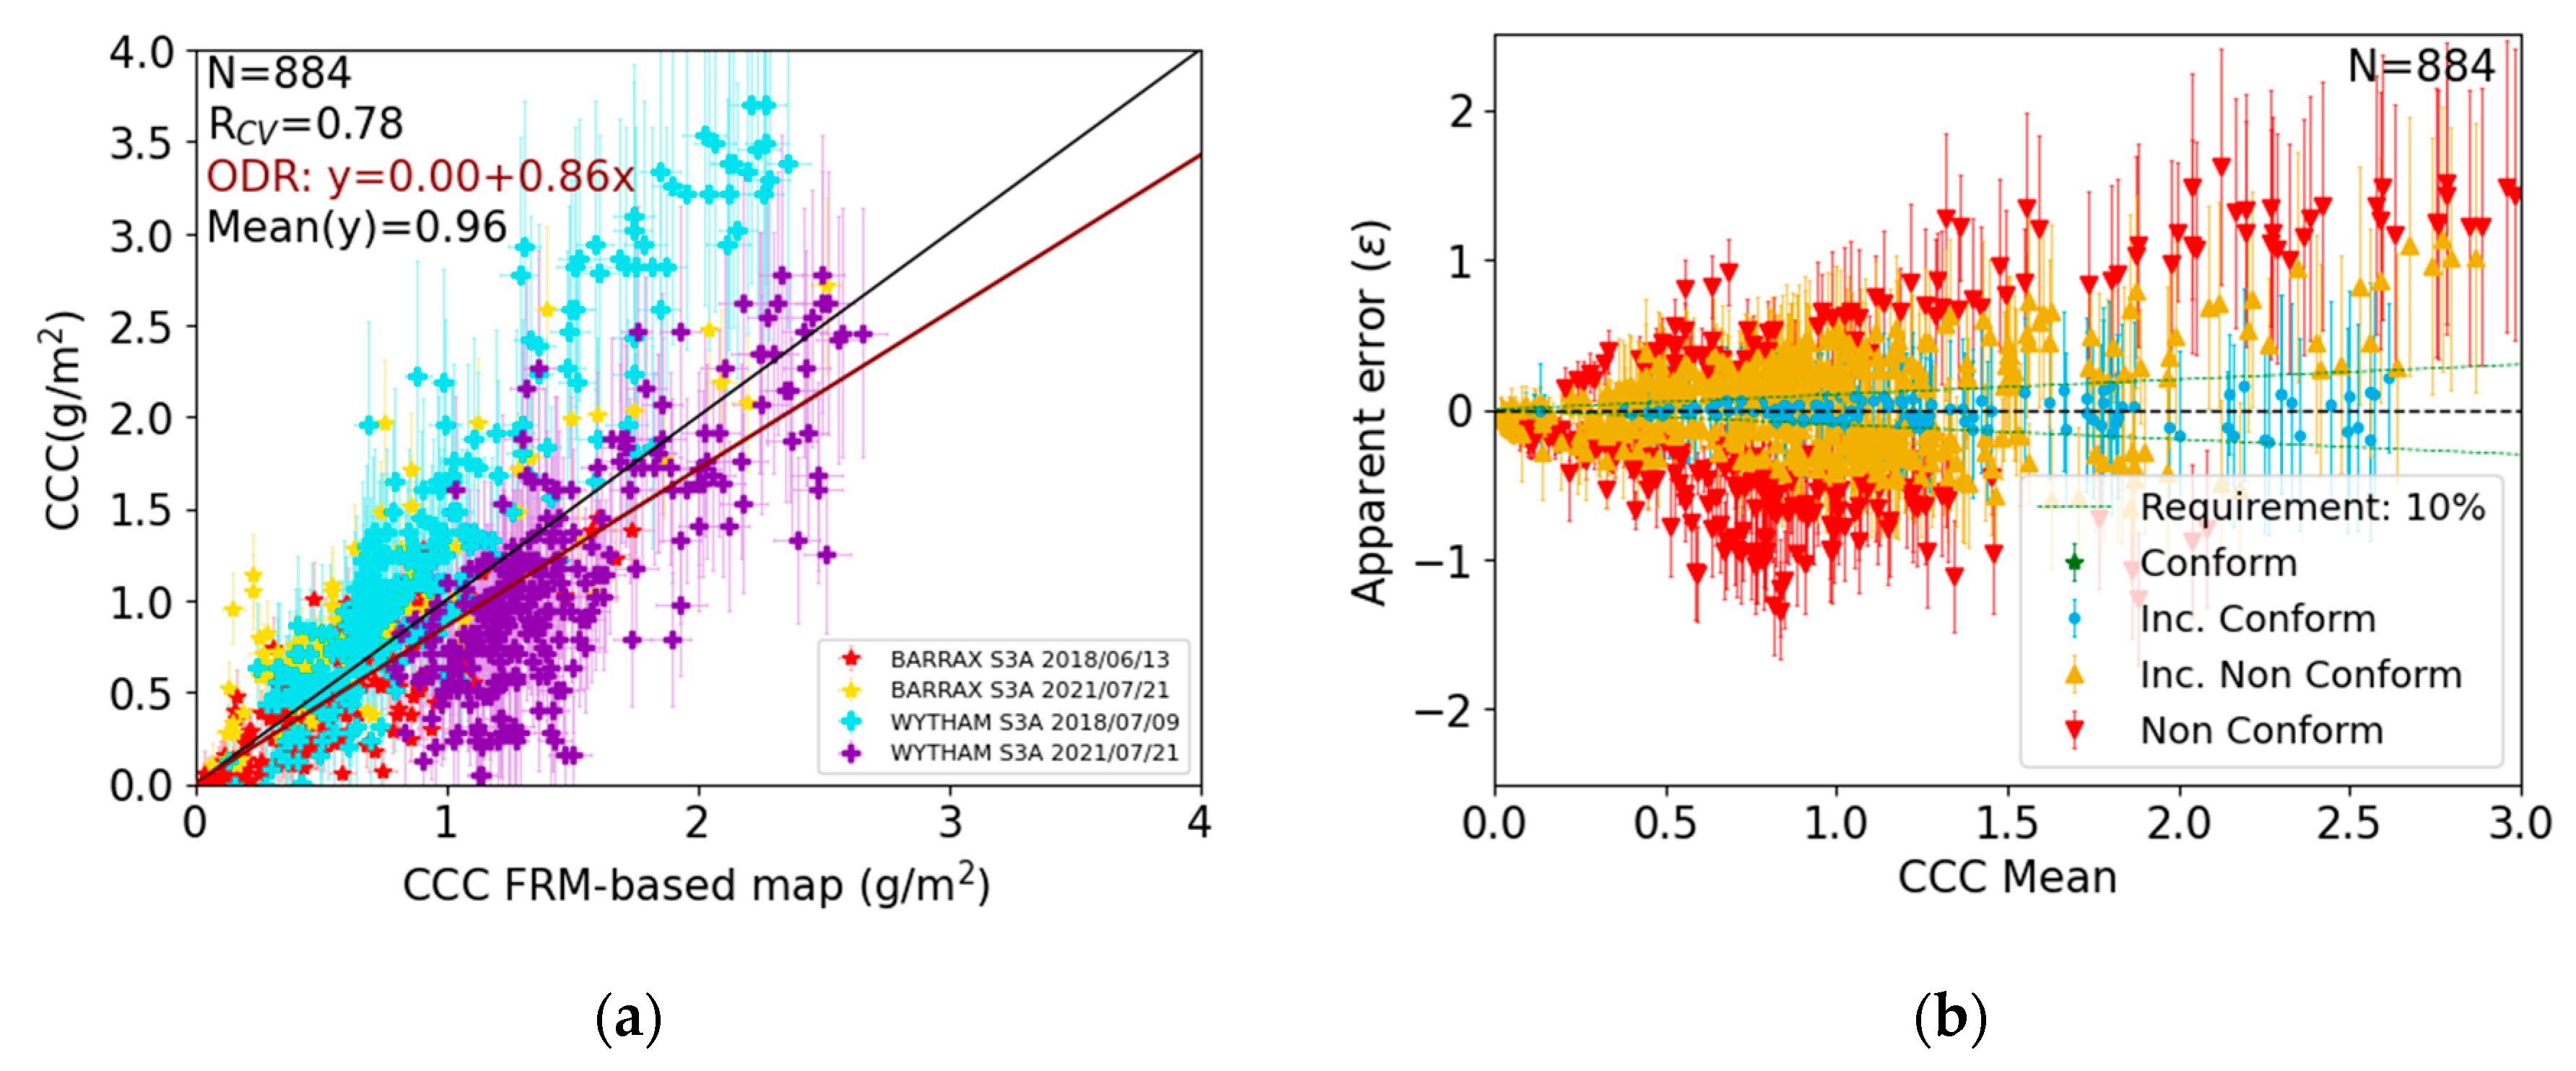
3.3.2. CCC
4. Discussion
4.1. Performance of the Products
4.2. Mission Requirements and Attainable Reference Data Uncertainty
5. Conclusions
Author Contributions
Funding
Data Availability Statement
Acknowledgments
Conflicts of Interest
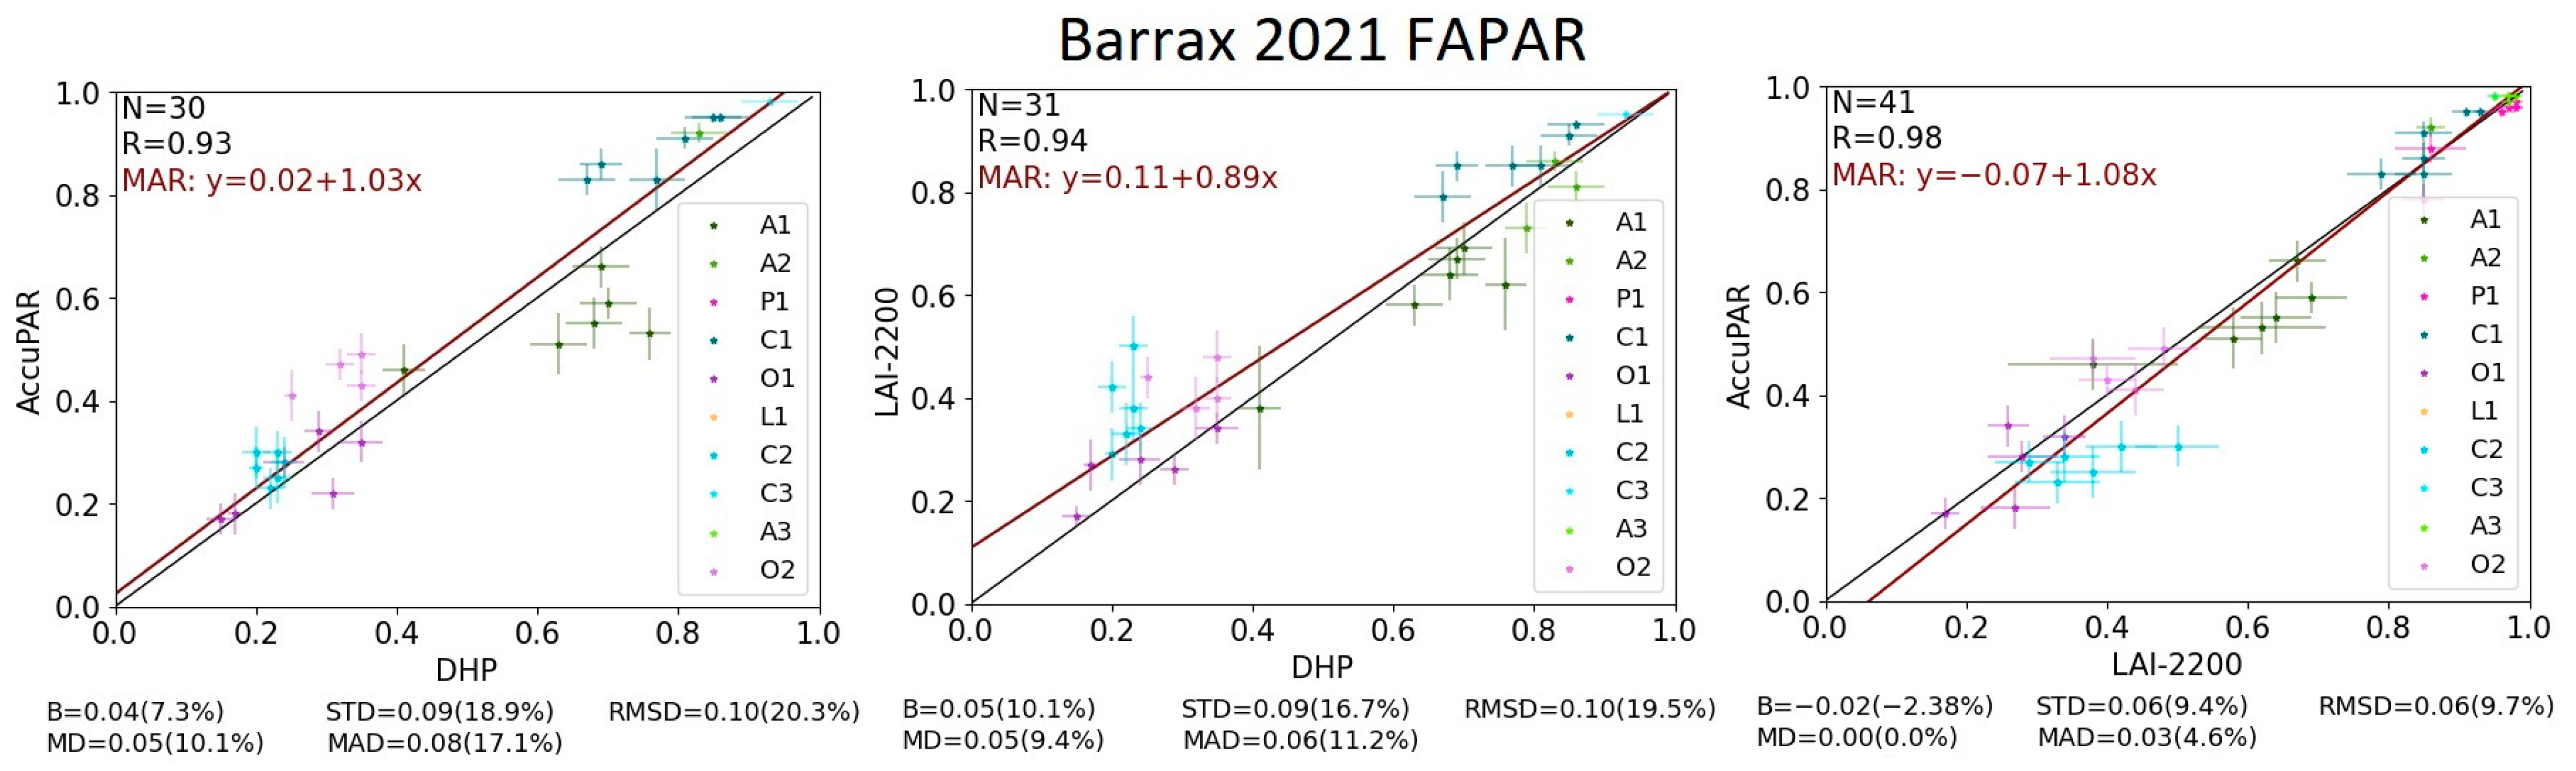
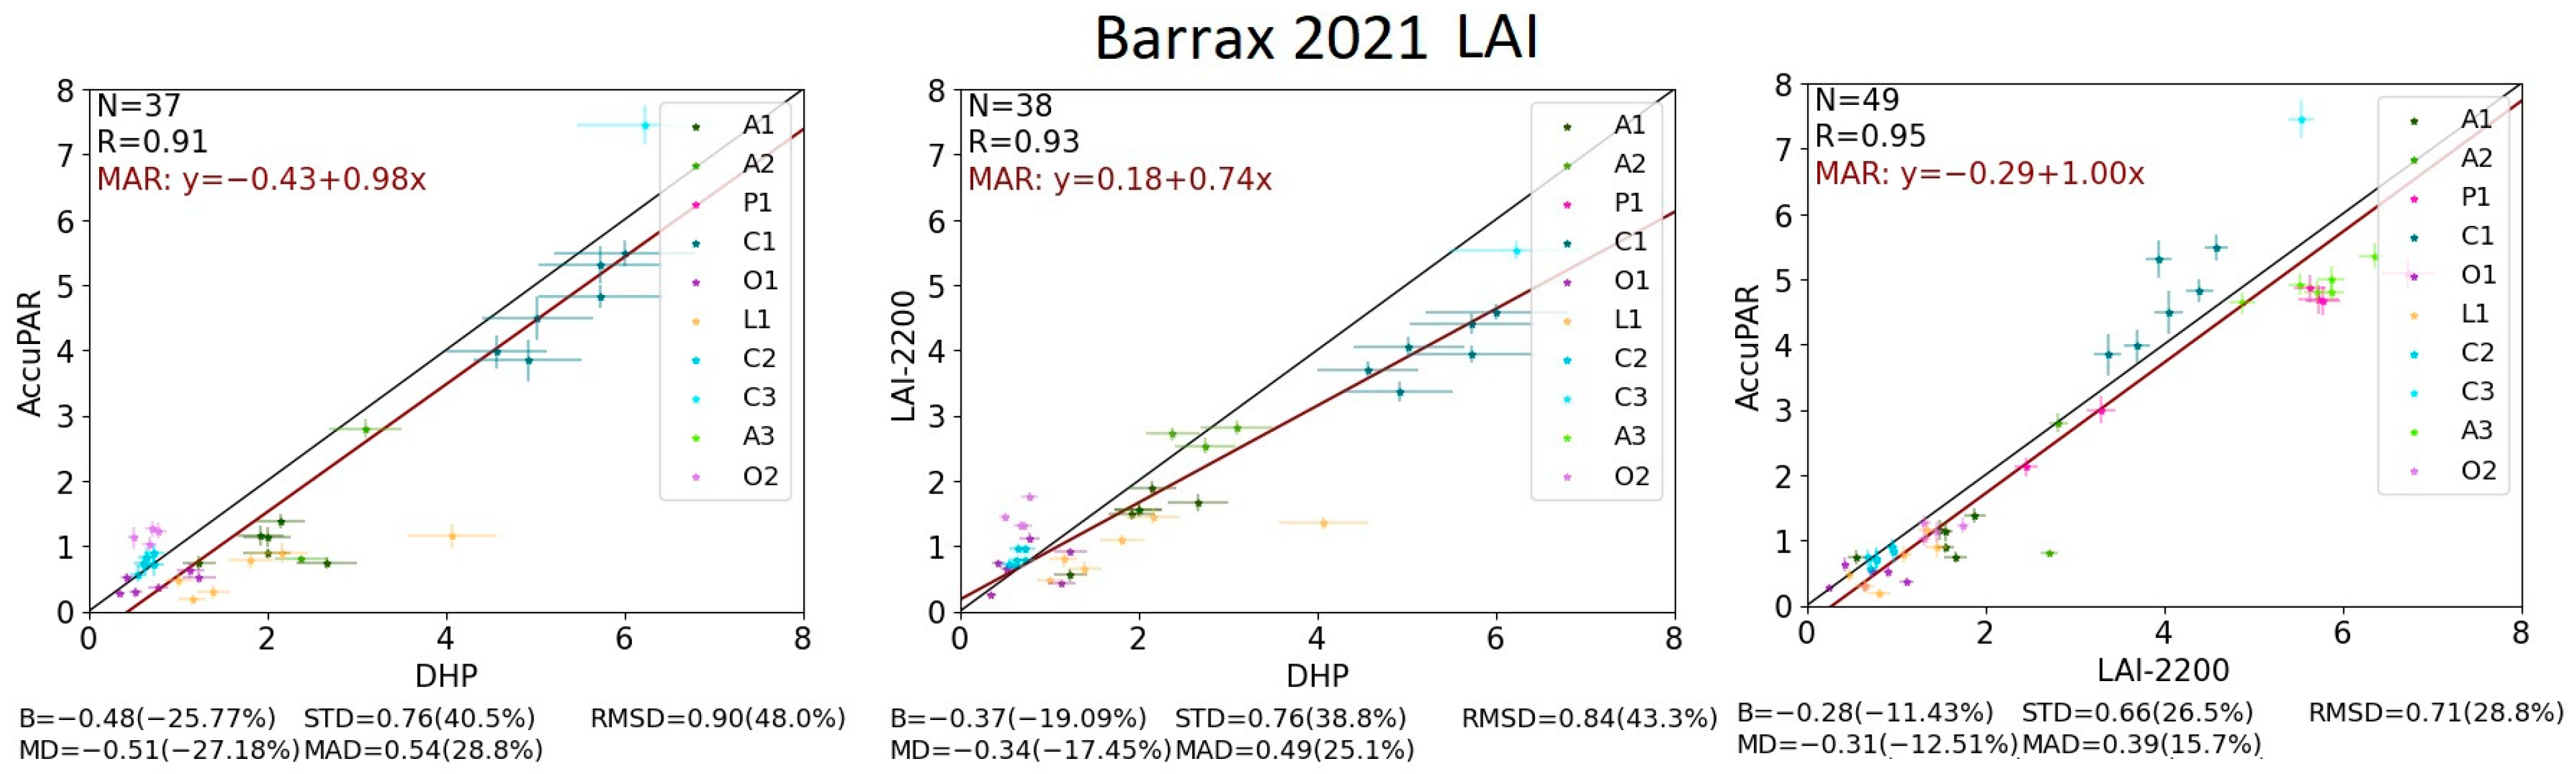
Appendix A. Intercomparison of FAPAR and LAI Retrieved from LAI 2200 PCA, AccuPAR and DHP
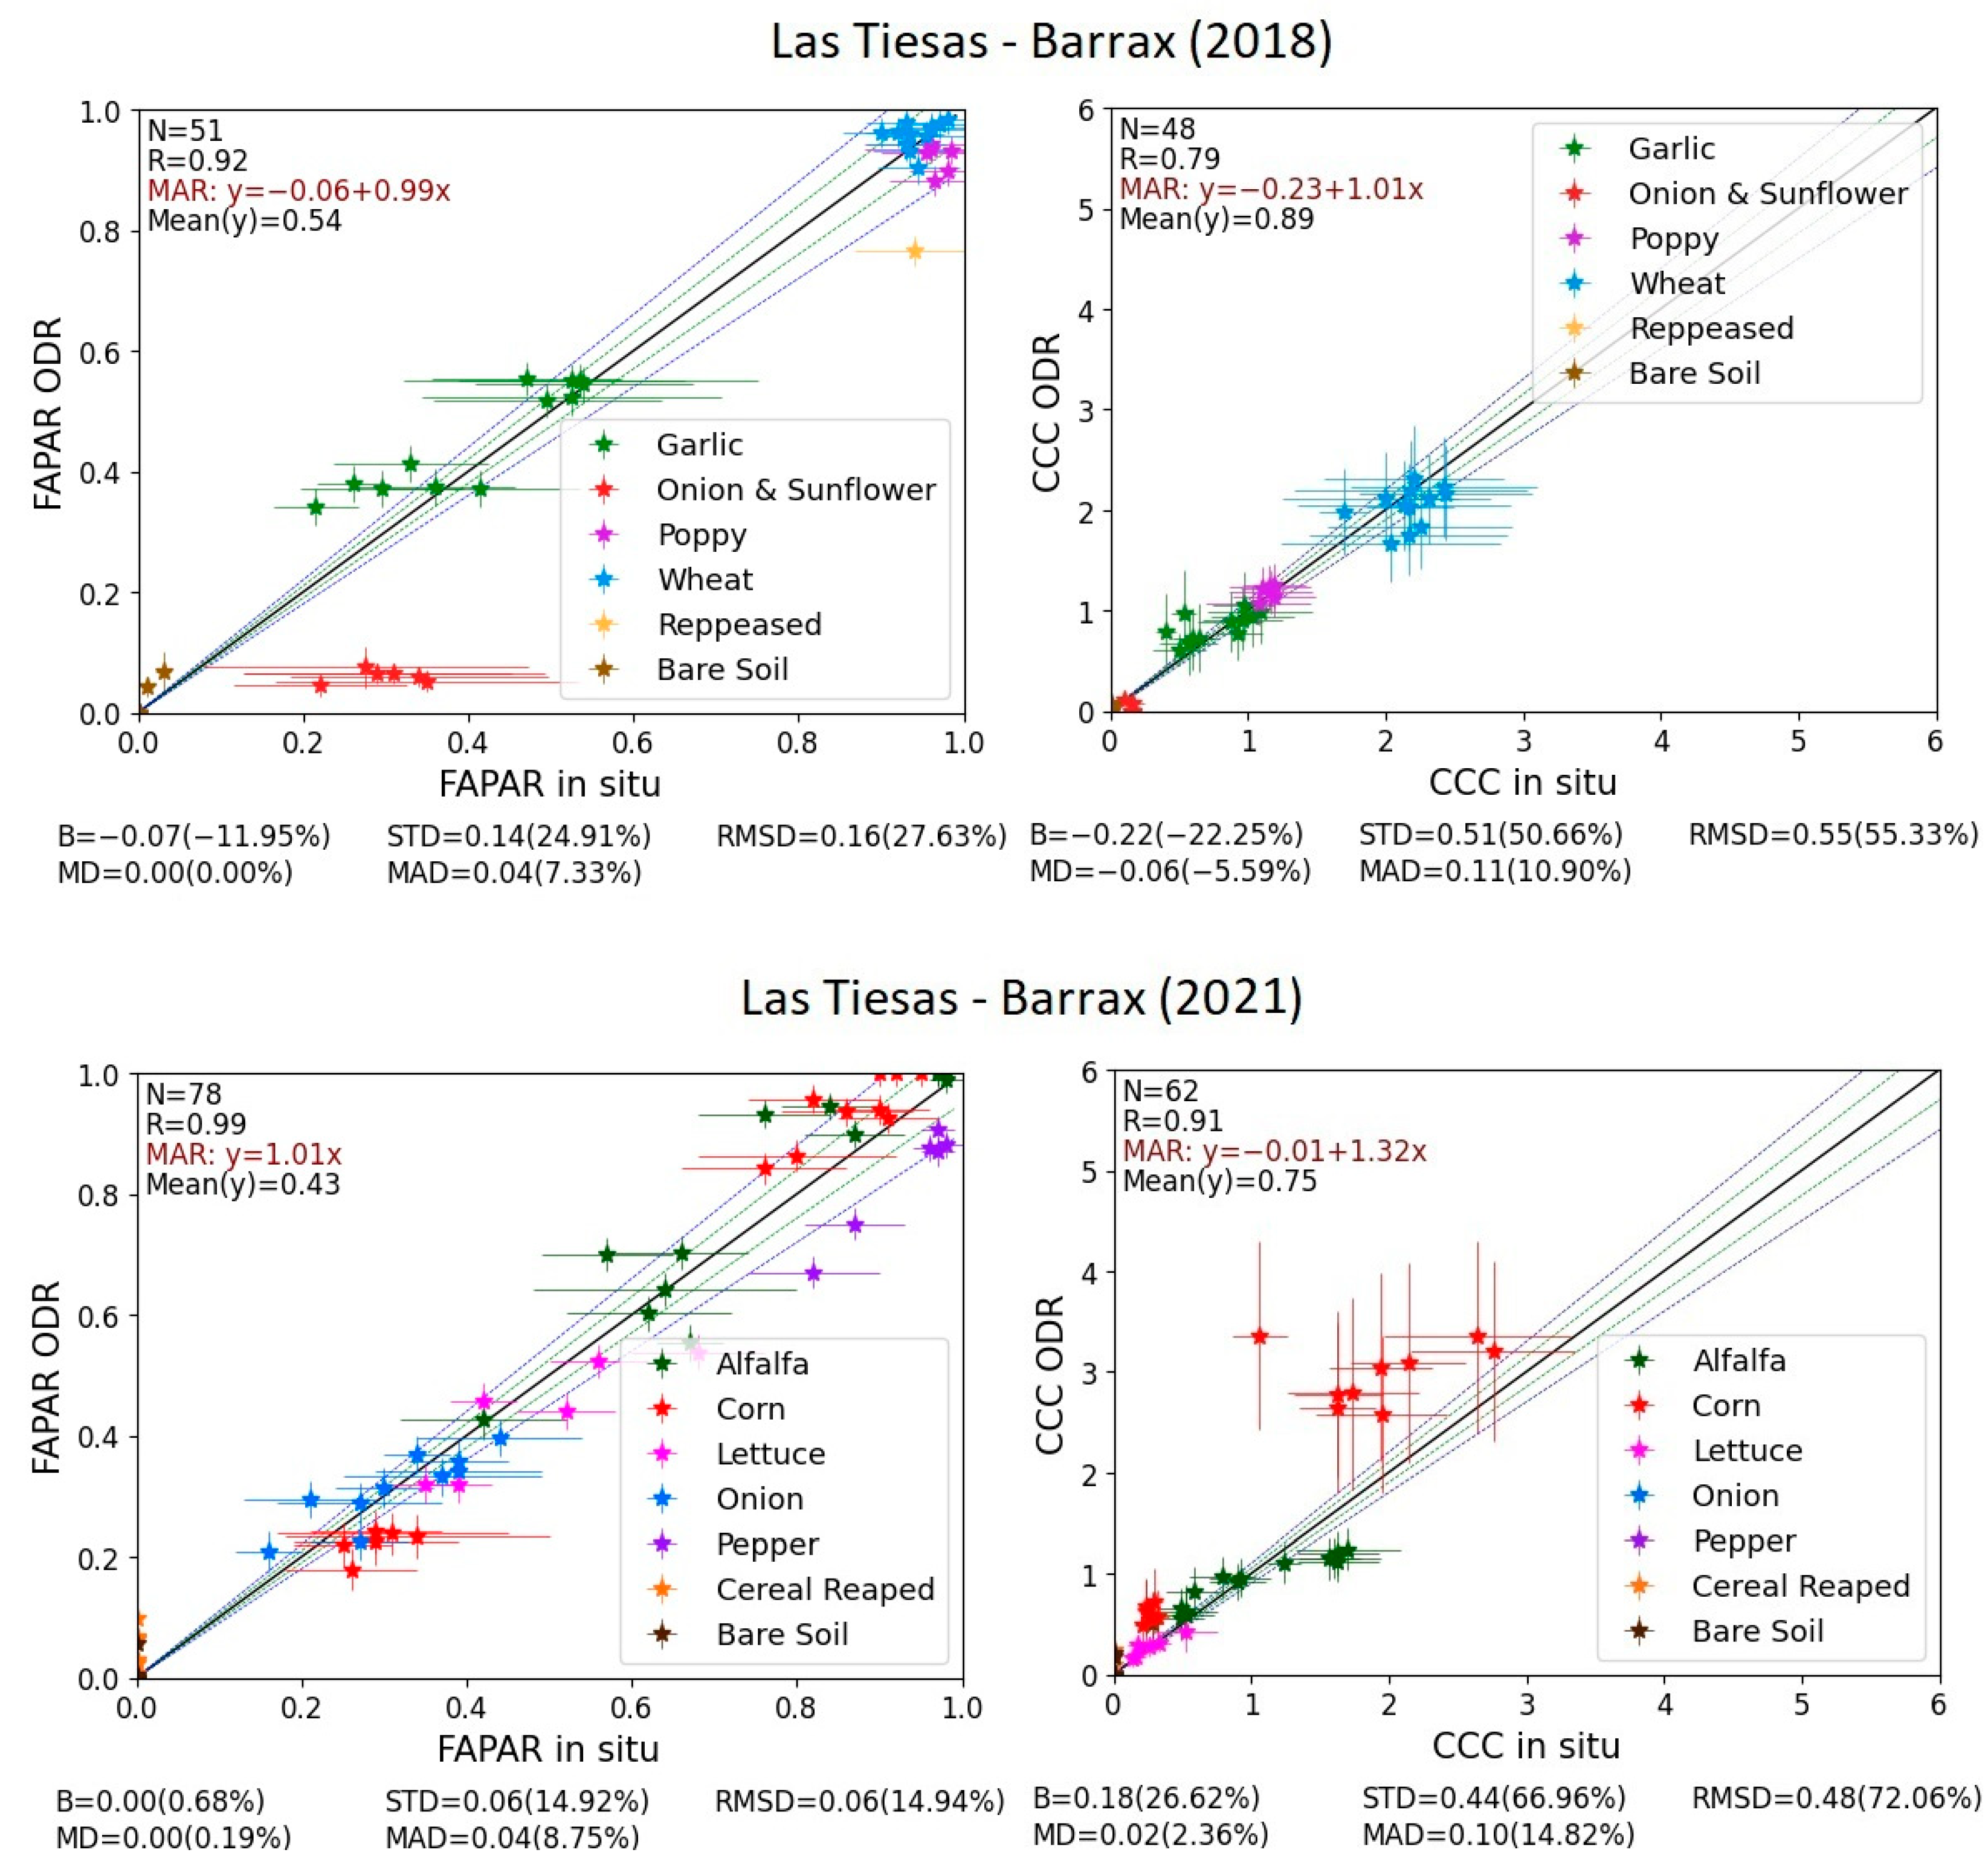
Appendix B. Performance of the FRM-Based Upscaled Reference Maps with In-Situ FRM

Appendix C. Overall Validation and Conformity Testing Results for Sentinel-3A GIFAPAR and OTCI-Based CCC

| α | β | |
|---|---|---|
| Las Tiesas—Barrax | 1.66 ± 0.14 | 1.25 ± 0.09 |
| Wytham Woods | 0.66 ± 0.08 | 1.61 ± 0.10 |
| Validation Metric | Requirement on Accuracy | Compliance (%) | ||
|---|---|---|---|---|
| N | 1070 | Goal (5%) | Conclusively conforming | 0.0 |
| R | 0.96 | Inconclusively conforming | 12.2 | |
| ODR | Y = 0.83x | Inconclusively non-conforming | 78.7 | |
| B | −0.07 (−14.5%) | Conclusively non-conforming | 9.1 | |
| MD | −0.06 (−12.2%) | Threshold (10%) | Conclusively conforming | 0.0 |
| STD | 0.09 (18.9%) | Inconclusively conforming | 29.6 | |
| MAD | 0.06 (13.3%) | Inconclusively non-conforming | 63.3 | |
| RMSD | 0.11 (23.8%) | Conclusively non-conforming | 7.1 | |
| Validation Metric | Requirement on Accuracy | Compliance (%) | ||
|---|---|---|---|---|
| N | 884 | Goal (5%) | Conclusively conforming | 0.0 |
| R | 0.78 | Inconclusively conforming | 7.7 | |
| ODR | Y = 0.86x − 0.00 | Inconclusively non-conforming | 56.6 | |
| B | 0.00 (0.2%) | Conclusively non-conforming | 35.7 | |
| MD | −0.04 (−4.2%) | Threshold (10%) | Conclusively conforming | 0.0 |
| STD | 0.46 (47.6%) | Inconclusively conforming | 16.0 | |
| MAD | 0.23 (24.5%) | Inconclusively non-conforming | 53.8 | |
| RMSD | 0.46 (47.6%) | Conclusively non-conforming | 30.2 | |
References
- Balsamo, G.; Agusti-Panareda, A.; Albergel, C.; Arduini, G.; Beljaars, A.; Bidlot, J.; Bousserez, N.; Boussetta, S.; Brown, A.; Buizza, R.; et al. Satellite and In Situ Observations for Advancing Global Earth Surface Modelling: A Review. Remote Sens. 2018, 10, 2038. [Google Scholar] [CrossRef]
- Dinguirard, M.; Slater, P.N. Calibration of Space-Multispectral Imaging Sensors: A Review. Remote Sens. Environ. 1999, 68, 194–205. [Google Scholar] [CrossRef]
- Justice, C.; Belward, A.; Morisette, J.; Lewis, P.; Privette, J.; Baret, F. Developments in the “validation” of Satellite Sensor Products for the Study of the Land Surface. Int. J. Remote Sens. 2000, 21, 3383–3390. [Google Scholar] [CrossRef]
- Morisette, J.T.; Baret, F.; Privette, J.L.; Myneni, R.B.; Nickeson, J.E.; Garrigues, S.; Shabanov, N.V.; Weiss, M.; Fernandes, R.A.; Leblanc, S.G.; et al. Validation of Global Moderate-Resolution LAI Products: A Framework Proposed within the CEOS Land Product Validation Subgroup. IEEE Trans. Geosci. Remote Sens. 2006, 44, 1804–1814. [Google Scholar] [CrossRef]
- Goryl, P.; Fox, N.; Donlon, C.; Castracane, P. Fiducial Reference Measurements (FRMs): What Are They? Remote Sens. 2023, 15, 5017. [Google Scholar] [CrossRef]
- Widlowski, J.-L. Conformity Testing of Satellite-Derived Quantitative Surface Variables. Environ. Sci. Policy 2015, 51, 149–169. [Google Scholar] [CrossRef]
- QA4EO Documentation. Available online: https://qa4eo.org/documents/ (accessed on 6 March 2024).
- Niro, F.; Goryl, P.; Dransfeld, S.; Boccia, V.; Gascon, F.; Adams, J.; Themann, B.; Scifoni, S.; Doxani, G. European Space Agency (ESA) Calibration/Validation Strategy for Optical Land-Imaging Satellites and Pathway towards Interoperability. Remote Sens. 2021, 13, 3003. [Google Scholar] [CrossRef]
- Origo, N.; Gorroño, J.; Ryder, J.; Nightingale, J.; Bialek, A. Fiducial Reference Measurements for Validation of Sentinel-2 and Proba-V Surface Reflectance Products. Remote Sens. Environ. 2020, 241, 111690. [Google Scholar] [CrossRef]
- Brown, L.A.; Camacho, F.; García-Santos, V.; Origo, N.; Fuster, B.; Morris, H.; Pastor-Guzman, J.; Sánchez-Zapero, J.; Morrone, R.; Ryder, J.; et al. Fiducial Reference Measurements for Vegetation Bio-Geophysical Variables: An End-to-End Uncertainty Evaluation Framework. Remote Sens. 2021, 13, 3194. [Google Scholar] [CrossRef]
- Fernandes, R.; Plummer, S.; Nightingale, J.; Baret, F.; Camacho, F.; Fang, H.; Garrigues, S.; Gobron, N.; Lang, M.; Lacaze, R.; et al. Global Leaf Area Index Product Validation Good Practices. In Best Practice for Satellite-Derived Land Product Validation; Fernandes, R., Plummer, S., Nightingale, J., Eds.; Land Product Validation Subgroup (Committee on Earth Observation Satellites Working Group on Calibration and Validation): Greenbelt, MD, USA, 2014. [Google Scholar]
- Nestola, E.; Sánchez-Zapero, J.; Latorre, C.; Mazzenga, F.; Matteucci, G.; Calfapietra, C.; Camacho, F. Validation of PROBA-V GEOV1 and MODIS C5 & C6 FAPAR Products in a Deciduous Beech Forest Site in Italy. Remote Sens. 2017, 9, 126. [Google Scholar] [CrossRef]
- Camacho, F.; Cernicharo, J.; Lacaze, R.; Baret, F.; Weiss, M. GEOV1: LAI, FAPAR Essential Climate Variables and FCOVER Global Time Series Capitalizing over Existing Products. Part 2: Validation and Intercomparison with Reference Products. Remote Sens. Environ. 2013, 137, 310–329. [Google Scholar] [CrossRef]
- Martínez, B.; Camacho, F.; Verger, A.; García-Haro, F.J.; Gilabert, M.A. Intercomparison and Quality Assessment of MERIS, MODIS and SEVIRI FAPAR Products over the Iberian Peninsula. Int. J. Appl. Earth Obs. Geoinf. 2012, 21, 463–476. [Google Scholar] [CrossRef]
- Brown, L.A.; Meier, C.; Morris, H.; Pastor-Guzman, J.; Bai, G.; Lerebourg, C.; Gobron, N.; Lanconelli, C.; Clerici, M.; Dash, J. Evaluation of Global Leaf Area Index and Fraction of Absorbed Photosynthetically Active Radiation Products over North America Using Copernicus Ground Based Observations for Validation Data. Remote Sens. Environ. 2020, 247, 111935. [Google Scholar] [CrossRef]
- Fuster, B.; Sánchez-Zapero, J.; Camacho, F.; García-Santos, V.; Verger, A.; Lacaze, R.; Weiss, M.; Baret, F.; Smets, B. Quality Assessment of PROBA-V LAI, FAPAR and FCOVER Collection 300 m Products of Copernicus Global Land Service. Remote Sens. 2020, 12, 1017. [Google Scholar] [CrossRef]
- Weiss, M.; Baret, F.; Block, T.; Koetz, B.; Burini, A.; Scholze, B.; Lecharpentier, P.; Brockmann, C.; Fernandes, R.; Plummer, S.; et al. On Line Validation Exercise (OLIVE): A Web Based Service for the Validation of Medium Resolution Land Products. Application to FAPAR Products. Remote Sens. 2014, 6, 4190. [Google Scholar] [CrossRef]
- CEOS Land Product Validation Supersites. Available online: https://lpvs.gsfc.nasa.gov/LPV_Supersites/LPVsites.html (accessed on 6 March 2024).
- LI-COR LI-COR Inc. 2200C_Manual_14112.Pdf|Con La Tecnología de Box. 2013. Available online: https://licor.app.box.com/s/fqjn5mlu8c1a7zir5qel (accessed on 9 February 2024).
- ACCUPAR LP-80—METER Group. Available online: https://metergroup.com/products/accupar-lp-80/ (accessed on 6 March 2024).
- Weiss, M.; Baret, F. CAN_EYE V6.4.91 User Manual to Cite This Version: HAL Id: Hal-02788819; INRA EMMA: Avignon, France, 2021. [Google Scholar]
- Li, W.; Fang, H.; Wei, S.; Weiss, M.; Baret, F. Critical Analysis of Methods to Estimate the Fraction of Absorbed or Intercepted Photosynthetically Active Radiation from Ground Measurements: Application to Rice Crops. Agric. For. Meteorol. 2021, 297, 108273. [Google Scholar] [CrossRef]
- Gobron, N.; Pinty, B.; Aussedat, O.; Chen, J.M.; Cohen, W.B.; Fensholt, R.; Gond, V.; Huemmrich, K.F.; Lavergne, T.; Mélin, F.; et al. Evaluation of Fraction of Absorbed Photosynthetically Active Radiation Products for Different Canopy Radiation Transfer Regimes: Methodology and Results Using Joint Research Center Products Derived from SeaWiFS against Ground-Based Estimations. J. Geophys. Res. 2006, 111, D13110. [Google Scholar] [CrossRef]
- Minolta. Chlorophyll Meter SPAD-502; Minolta: Osaka, Japan, 2009; pp. 1–22. [Google Scholar]
- Brown, L.A.; Williams, O.; Dash, J. Calibration and Characterisation of Four Chlorophyll Meters and Transmittance Spectroscopy for Non-Destructive Estimation of Forest Leaf Chlorophyll Concentration. Agric. For. Meteorol. 2022, 323, 109059. [Google Scholar] [CrossRef]
- DLR. AGRISAR 2006—Agriculural Bio-/Geophysical Retrievals from Frequent Repeat SAR and Optical Imaging: Data Aquisition Report; Deutsches Zentrum für Luft- und Raumfahrt: Oberpfaffenhofen, Germany, 2006. [Google Scholar]
- Gorroño, J.; Fomferra, N.; Peters, M.; Gascon, F.; Underwood, C.; Fox, N.; Kirches, G.; Brockmann, C. A Radiometric Uncertainty Tool for the Sentinel 2 Mission. Remote Sens. 2017, 9, 178. [Google Scholar] [CrossRef]
- Gorroño, J.; Hunt, S.; Scanlon, T.; Banks, A.; Fox, N.; Woolliams, E.; Underwood, C.; Gascon, F.; Peters, M.; Fomferra, N.; et al. Providing Uncertainty Estimates of the Sentinel-2 Top-of-Atmosphere Measurements for Radiometric Validation Activities. Eur. J. Remote Sens. 2018, 51, 650–666. [Google Scholar] [CrossRef]
- Martínez, B.; García-Haro, F.J.; Camacho, F. Derivation of High-Resolution Leaf Area Index Maps in Support of Validation Activities: Application to the Cropland Barrax Site. Agric. For. Meteorol. 2009, 149, 130–145. [Google Scholar] [CrossRef]
- Donlon, C.; Berruti, B.; Buongiorno, A.; Ferreira, M.H.; Féménias, P.; Frerick, J.; Goryl, P.; Klein, U.; Laur, H.; Mavrocordatos, C.; et al. The Global Monitoring for Environment and Security (GMES) Sentinel-3 Mission. Remote Sens. Environ. 2012, 120, 37–57. [Google Scholar] [CrossRef]
- Gobron, N.; Pinty, B.; Verstraete, M.M.; Widlowski, J.-L. Advanced Vegetation Indices Optimized for Up-Coming Sensors: Design, Performance, and Applications. IEEE Trans. Geosci. Remote Sens. 2000, 38, 2489–2505. [Google Scholar] [CrossRef]
- Rahman, H.; Pinty, B.; Verstraete, M.M. Coupled Surface-Atmosphere Reflectance (CSAR) Model: 2. Semiempirical Surface Model Usable with NOAA Advanced Very High Resolution Radiometer Data. J. Geophys. Res. 1993, 98, 20791. [Google Scholar] [CrossRef]
- Gobron, N. Ocean and Land Colour Instrument (OLCI) FAPAR and Rectified Channels over Terrestrial Surfaces Algorithm Theoretical Basis Document; European Commission Joint Research Centre: Ispra, Italy, 2010. [Google Scholar]
- Horler, D.N.H.; Dockray, M.; Barber, J. The Red Edge of Plant Leaf Reflectance. Int. J. Remote Sens. 1983, 4, 273–288. [Google Scholar] [CrossRef]
- Dash, J.; Curran, P.J. The MERIS Terrestrial Chlorophyll Index. Int. J. Remote Sens. 2004, 25, 5403–5413. [Google Scholar] [CrossRef]
- Dash, J. Algorithm Theoretical Basis Document: OLCI Terrestrial Chlorophyll Index (OTCI); University of Southampton: Southampton, UK, 2012. [Google Scholar]
- JCGM-VIM International Vocabulary of Metrology-Basic and General Concepts and Associated Terms (VIM) 3rd Edition 2008 Version with Minor Corrections; International Organization of Legal Metrology (IOLM): Paris, France, 2012.
- Drinkwater, M.; Rebhan, H. Sentinel-3: Mission Requirements Document; European Space Agency: Noordwijk, The Netherlands, 2007. [Google Scholar]
- ISO 10576:2022; Statistical Methods—Guidelines for the Evaluation of Conformity with Specified Requirements. ISO: Geneva, Switzerland, 2022. Available online: https://www.iso.org/es/contents/data/standard/07/88/78878.html?browse=ics (accessed on 6 June 2024).
- Mira, M.; Weiss, M.; Baret, F.; Courault, D.; Hagolle, O.; Gallego-Elvira, B.; Olioso, A. The MODIS (Collection V006) BRDF/Albedo Product MCD43D: Temporal Course Evaluated over Agricultural Landscape. Remote Sens. Environ. 2015, 170, 216–228. [Google Scholar] [CrossRef]
- Weiss, M.; Baret, F.; Garrigues, S.; Lacaze, R. LAI and FAPAR CYCLOPES Global Products Derived from VEGETATION. Part 2: Validation and Comparison with MODIS Collection 4 Products. Remote Sens. Environ. 2007, 110, 317–331. [Google Scholar] [CrossRef]
- Li, W.; Baret, F.; Weiss, M.; Buis, S.; Lacaze, R.; Demarez, V.; Dejoux, J.-F.; Battude, M.; Camacho, F. Combining Hectometric and Decametric Satellite Observations to Provide near Real Time Decametric FAPAR Product. Remote Sens. Environ. 2017, 200, 250–262. [Google Scholar] [CrossRef]
- Gobron, N.; Morgan, O.; Adams, J.; Brown, L.A.; Cappucci, F.; Dash, J.; Lanconelli, C.; Marioni, M.; Robustelli, M. Evaluation of Sentinel-3A and Sentinel-3B Ocean Land Colour Instrument Green Instantaneous Fraction of Absorbed Photosynthetically Active Radiation. Remote Sens. Environ. 2022, 270, 34–4257. [Google Scholar] [CrossRef]
- Wojnowski, W.; Wei, S.; Li, W.; Yin, T.; Li, X.X.; Ow, G.L.F.; Yusof, M.L.M.; Whittle, A.J. Comparison of Absorbed and Intercepted Fractions of PAR for Individual Trees Based on Radiative Transfer Model Simulations. Remote Sens. 2021, 13, 1069. [Google Scholar] [CrossRef]
- Origo, N.J. Measuring and Modelling FAPAR for Satellite Product Validation. Ph.D. Thesis, UCL, London, UK, 2023. [Google Scholar]
- Brown, L.A.; Morris, H.; Morrone, R.; Sinclair, M.; Williams, O.; Hunt, M.; Bandopadhyay, S.; Guo, X.; Akcay, H.; Dash, J. Near-Infrared Digital Hemispherical Photography Enables Correction of Plant Area Index for Woody Material during Leaf-on Conditions. Ecol. Inform. 2024, 79, 102441. [Google Scholar] [CrossRef]
- The 2022 GCOS ECVs Requirements (GCOS 245)|E-Library. Available online: https://library.wmo.int/index.php?lvl=notice_display&id=22135#.ZGI07nZBxPZ (accessed on 15 May 2023).
- Garrigues, S.; Lacaze, R.; Baret, F.; Morisette, J.T.; Weiss, M.; Nickeson, J.E.; Fernandes, R.; Plummer, S.; Shabanov, N.V.; Myneni, R.B.; et al. Validation and Intercomparison of Global Leaf Area Index Products Derived from Remote Sensing Data. J. Geophys. Res. Biogeosci. 2008, 113, G02028. [Google Scholar] [CrossRef]
- Fang, H.; Baret, F.; Plummer, S.; Schaepman-Strub, G. An Overview of Global Leaf Area Index (LAI): Methods, Products, Validation, and Applications. Rev. Geophys. 2019, 57, 739–799. [Google Scholar] [CrossRef]
- Brown, L.A.; Ogutu, B.O.; Camacho, F.; Fuster, B.; Dash, J. Deriving Leaf Area Index Reference Maps Using Temporally Continuous in Situ Data: A Comparison of Upscaling Approaches. IEEE J. Sel. Top. Appl. Earth Obs. Remote Sens. 2021, 14, 624–630. [Google Scholar] [CrossRef]
- Camacho, F.; Martinez-Sanchez, E.; Sanchez-Zapero, J.; Dash, J.; Brown, L.A.; Origo, N.; Morris, H.; Morrone, R.; Morven, S. Is the CEOS LPV 2-Stage Validation Approach Suitable for Conformity Testing of Moderate Resolution Satellite Products?: Outcomes of the FRM4Veg Project. In Proceedings of the European Space Agency Workshop on Land Product Validation and Evolution, Frascati, Italy, 12–14 June 2023. [Google Scholar]


| 2018 | 2021 | |||
|---|---|---|---|---|
| Study Site | FIPAR | CCC | FIPAR | CCC |
| Las Tiesas—Barrax | 52 | 48 | 79 | 63 |
| Wytham Woods | 47 | 30 | 29 | 29 |
| FAPAR (Dimensionless) | U(FAPAR) (Dimensionless) | |||||||
|---|---|---|---|---|---|---|---|---|
| Barrax 2018 | Barrax 2021 | Wytham 2018 | Wytham 2021 | Barrax 2018 | Barrax 2021 | Wytham 2018 | Wytham 2021 | |
| Minimum | 0.00 | 0.00 | 0.81 | 0.34 | <0.01 (2.0%) | <0.01 (2.0%) | 0.02 (2.0%) | 0.02 (1.7%) |
| Maximum | 0.99 | 0.98 | 0.99 | 0.99 | 0.39 (143.0%) | 0.16 (47.1%) | 0.08 (9.1%) | 0.08 (11.8%) |
| Mean | 0.61 | 0.42 | 0.92 | 0.87 | 0.10 (27.0%) | 0.04 (14.8%) | 0.04 (4.7%) | 0.04 (5.4%) |
| Median | 0.88 | 0.35 | 0.92 | 0.94 | 0.06 (8.8%) | 0.04 (11.1%) | 0.04 (4.4%) | 0.03 (3.5%) |
| STD | 0.36 | 0.38 | 0.04 | 0.18 | 0.10 (35.3%) | 0.04 (11.8%) | 0.02 (2.2%) | 0.02 (3.4%) |
| CCC (g·m−2) | U(CCC) (g·m−2) | |||||||
|---|---|---|---|---|---|---|---|---|
| Barrax 2018 | Barrax 2021 | Wytham 2018 | Wytham 2021 | Barrax 2018 | Barrax 2021 | Wytham 2018 | Wytham 2021 | |
| Minimum | 0.00 | 0.00 | 0.47 | 0.23 | 0.00 (9.5%) | 0.00 (9.7%) | 0.12 (18.3%) | 0.07 (18.2%) |
| Maximum | 2.43 | 2.76 | 4.27 | 4.84 | 0.85 (132.2%) | 0.68 (88.9%) | 0.85 (26.3%) | 0.96 (31.5%) |
| Mean | 1.11 | 0.56 | 1.88 | 1.94 | 0.32 (40.6%) | 0.15 (34.7%) | 0.39 (21.3%) | 0.41 (23.6%) |
| Median | 1.10 | 0.23 | 1.62 | 2.16 | 0.26 (28.9%) | 0.06 (24.8%) | 0.34 (20.8%) | 0.40 (21.5%) |
| STD | 0.78 | 0.75 | 0.84 | 1.35 | 0.23 (35.1%) | 0.18 (22.0%) | 0.15 (2.1%) | 0.26 (4.4%) |
| FAPAR (Dimensionless) | U(FAPAR) (Dimensionless) | |||||||
|---|---|---|---|---|---|---|---|---|
| Barrax 2018 | Barrax 2021 | Wytham 2018 | Wytham 2021 | Barrax 2018 | Barrax 2021 | Wytham 2018 | Wytham 2021 | |
| Minimum | 0.00 | 0.00 | 0.00 | 0.20 | 0.00 (2.5%) | 0.00 (2.0%) | 0.00 (2.3%) | 0.02 (2.3%) |
| Maximum | 0.98 | 1.00 | 0.98 | 1.00 | 0.03 (50.0%) | 0.04 (50.0%) | 0.04 (50.0%) | 0.04 (21.0%) |
| Mean | 0.53 | 0.43 | 0.85 | 0.83 | 0.02 (12.9%) | 0.02 (13.7%) | 0.02 (4.3%) | 0.03 (5.1%) |
| Median | 0.55 | 0.33 | 0.95 | 0.94 | 0.03 (5.1%) | 0.02 (6.4%) | 0.02 (2.6%) | 0.03 (3.0%) |
| STD | 0.36 | 0.38 | 0.28 | 0.25 | 0.01 (17.7%) | 0.01 (16.4%) | 0.01 (8.0%) | 0.01 (5.2%) |
| CCC (g·m−2) | U(CCC) (g·m−2) | |||||||
|---|---|---|---|---|---|---|---|---|
| Barrax 2018 | Barrax 2021 | Wytham 2018 | Wytham 2021 | Barrax 2018 | Barrax 2021 | Wytham 2018 | Wytham 2021 | |
| Minimum | 0.00 | 0.00 | 0.00 | 0.10 | 0.00 (17.3%) | 0.00 (16.8%) | 0.00 (22.0%) | 0.05 (19.2%) |
| Maximum | 2.32 | 3.36 | 3.01 | 3.50 | 0.52 (50.0%) | 0.99 (50.0%) | 0.78 (50.0%) | 0.96 (50.0%) |
| Mean | 0.83 | 0.73 | 2.06 | 1.84 | 0.22 (34.7%) | 0.23 (38.1%) | 0.52 (26.5%) | 0.47 (30.4%) |
| Median | 0.75 | 0.37 | 2.31 | 2.20 | 0.22 (34.1%) | 0.18 (42.7%) | 0.56 (24.0%) | 0.57 (26.0%) |
| STD | 0.78 | 0.92 | 0.72 | 1.09 | 0.18 (13.0%) | 0.27 (12.6%) | 0.16 (7.3%) | 0.27 (10.3%) |
| α | β | |
|---|---|---|
| Las Tiesas—Barrax | 1.70 ± 0.13 | 1.23 ± 0.08 |
| Wytham Woods | 0.87 ± 0.08 | 1.48 ± 0.10 |
| Xmax (m) | Ymax (m) | FWHMx (m) | FWHMy (m) | |
|---|---|---|---|---|
| Barrax | 900 | 450 | 540 | 450 |
| Wytham | 900 | 750 | 720 | 450 |
| Validation Metric | Requirement on Accuracy | Compliance (%) | ||
|---|---|---|---|---|
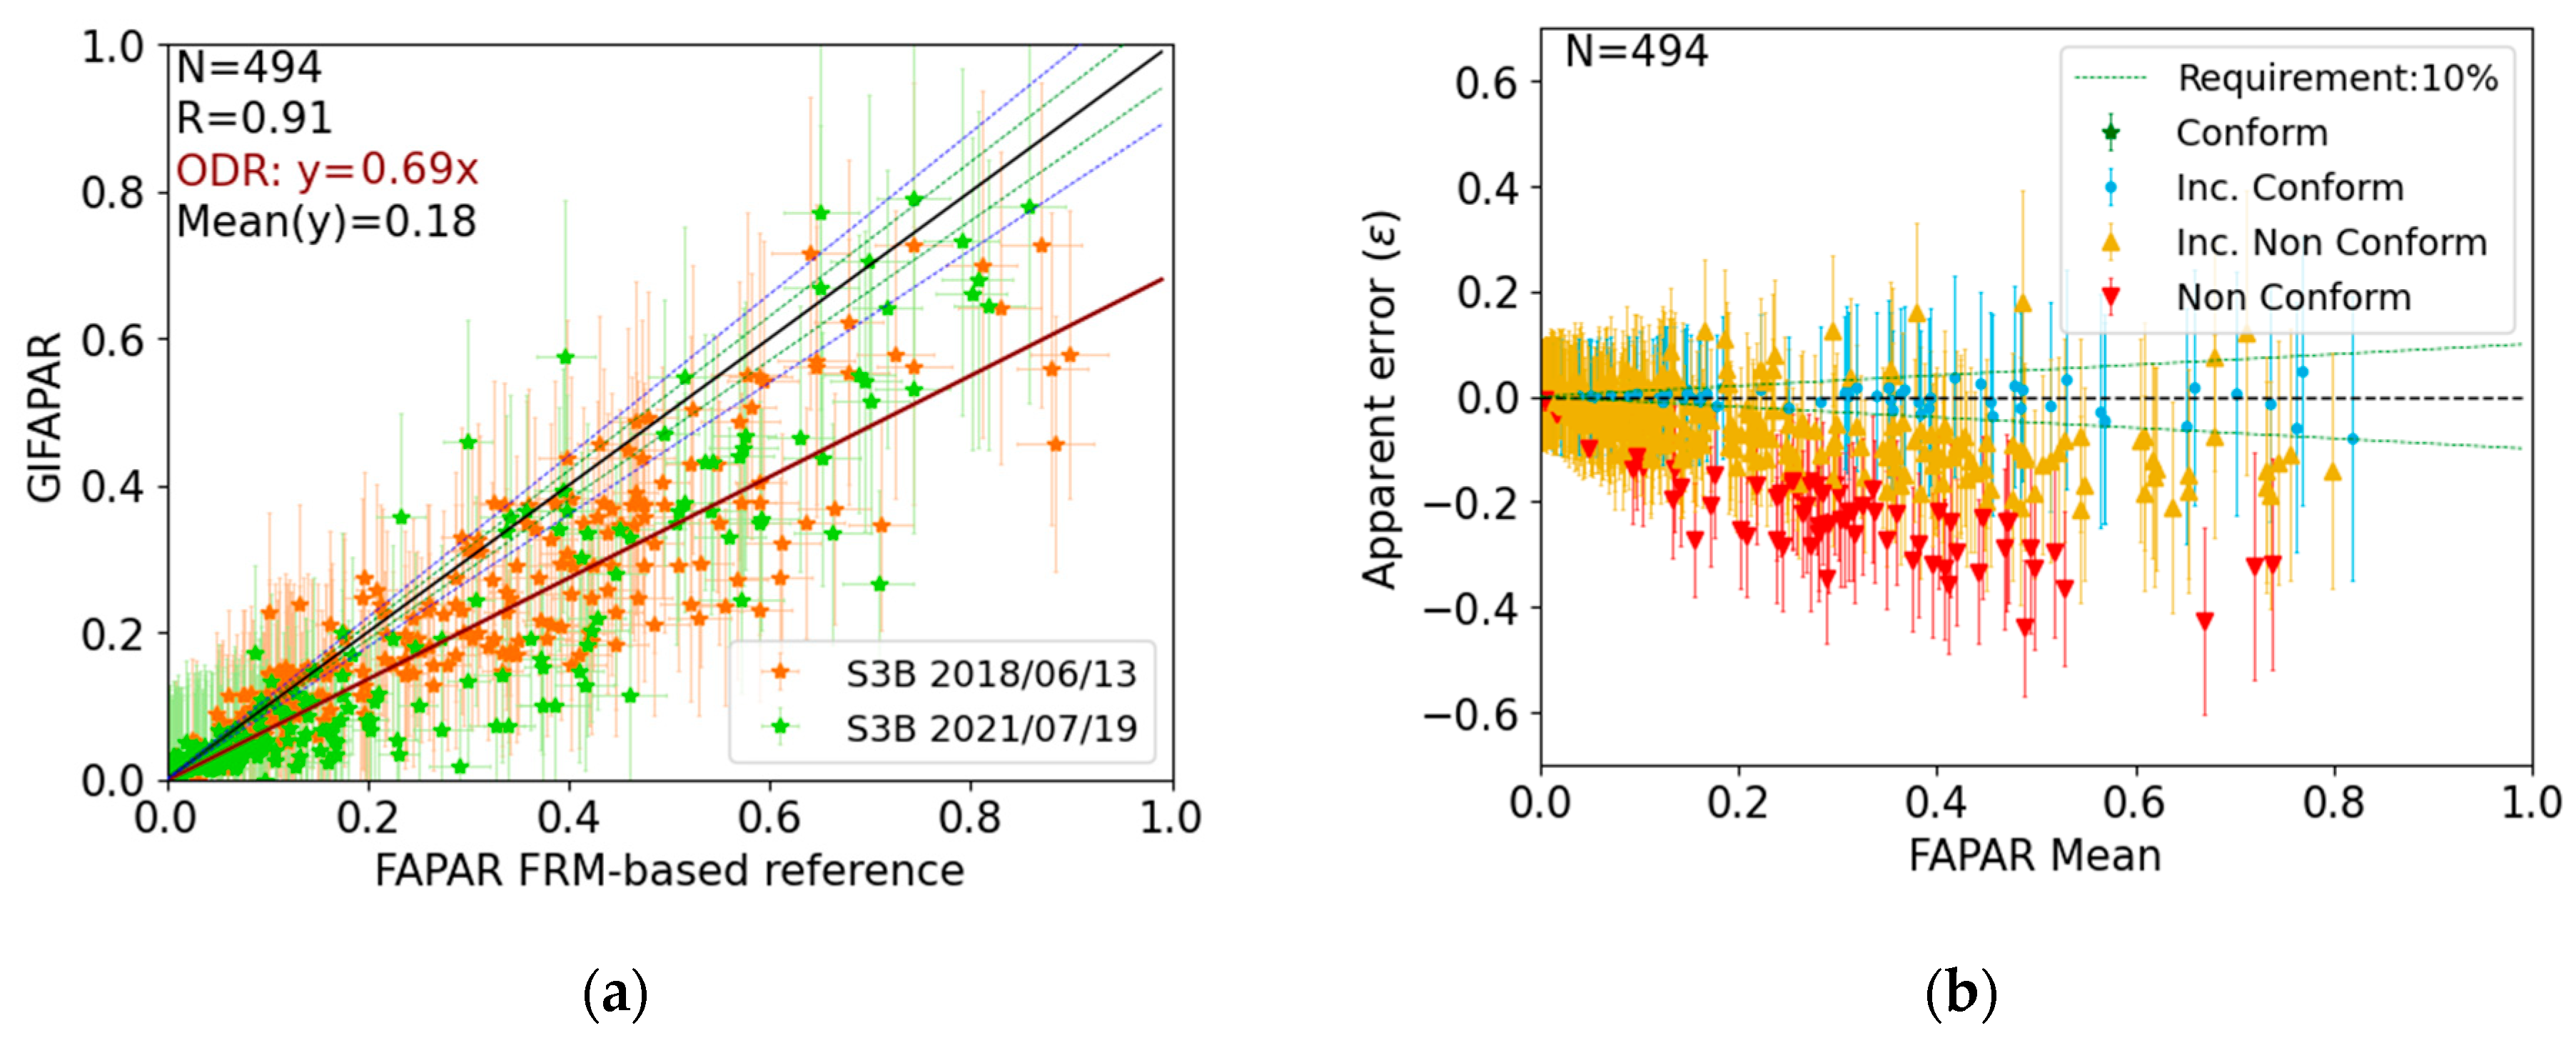
| N | 494 | Goal (5%) | Conclusively conforming | 0.0 |
| R | 0.91 | Inconclusively conforming | 8.9 | |
| ODR | Y = 0.69x | Inconclusively non-conforming | 73.7 | |
| B | −0.06 (−28.7%) | Conclusively non-conforming | 17.4 | |
| MD | −0.03 (−13.3%) | Threshold (10%) | Conclusively conforming | 0.0 |
| STD | 0.09 (44.8%) | Inconclusively conforming | 14.6 | |
| MAD | 0.04 (17.9%) | Inconclusively non-conforming | 70.9 | |
| RMSD | 0.11 (53.2%) | Conclusively non-conforming | 14.6 | |
| Validation Metric | Requirement on Accuracy | Compliance (%) | ||
|---|---|---|---|---|
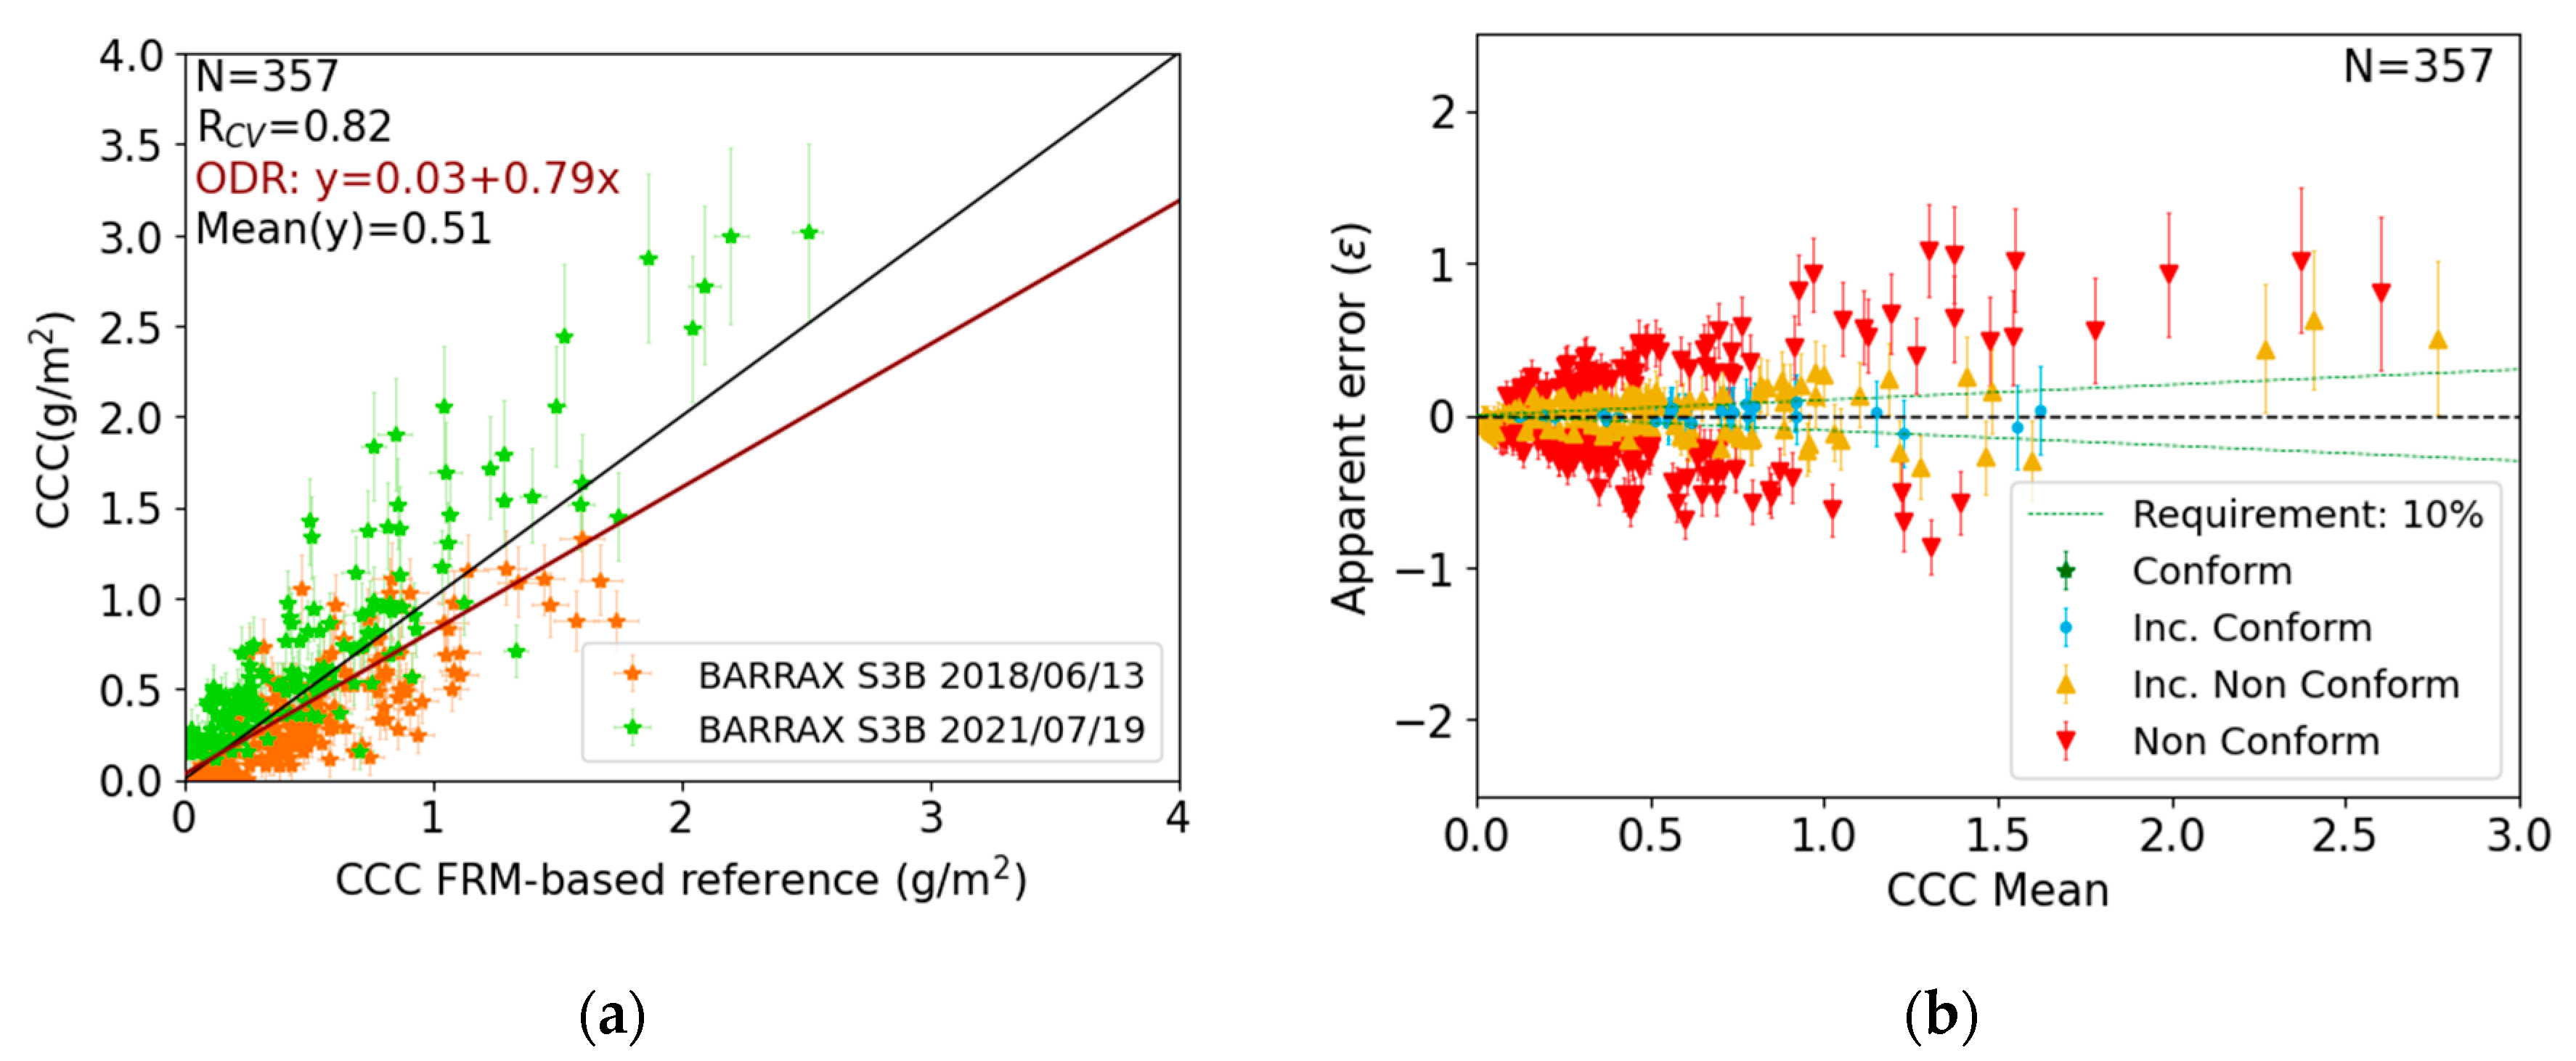
| N | 357 | Goal (5%) | Conclusively conforming | 0.0 |
| Rcv | 0.82 | Inconclusively conforming | 5.6 | |
| ODR | Y = 0.03 + 0.79x | Inconclusively non-conforming | 43.7 | |
| Bcv | 0.00 (0.7%) | Conclusively non-conforming | 50.7 | |
| MDcv | −0.04 (−7.1%) | Threshold (10%) | Conclusively conforming | 0.0 |
| STDcv | 0.29 (56.3%) | Inconclusively conforming | 10.1 | |
| MADcv | 0.15 (28.8%) | Inconclusively non-conforming | 44.5 | |
| RMSDcv | 0.29 (56.3%) | Conclusively non-conforming | 45.4 | |
| Validation Metric | Requirement on Accuracy | Compliance (%) | ||
|---|---|---|---|---|
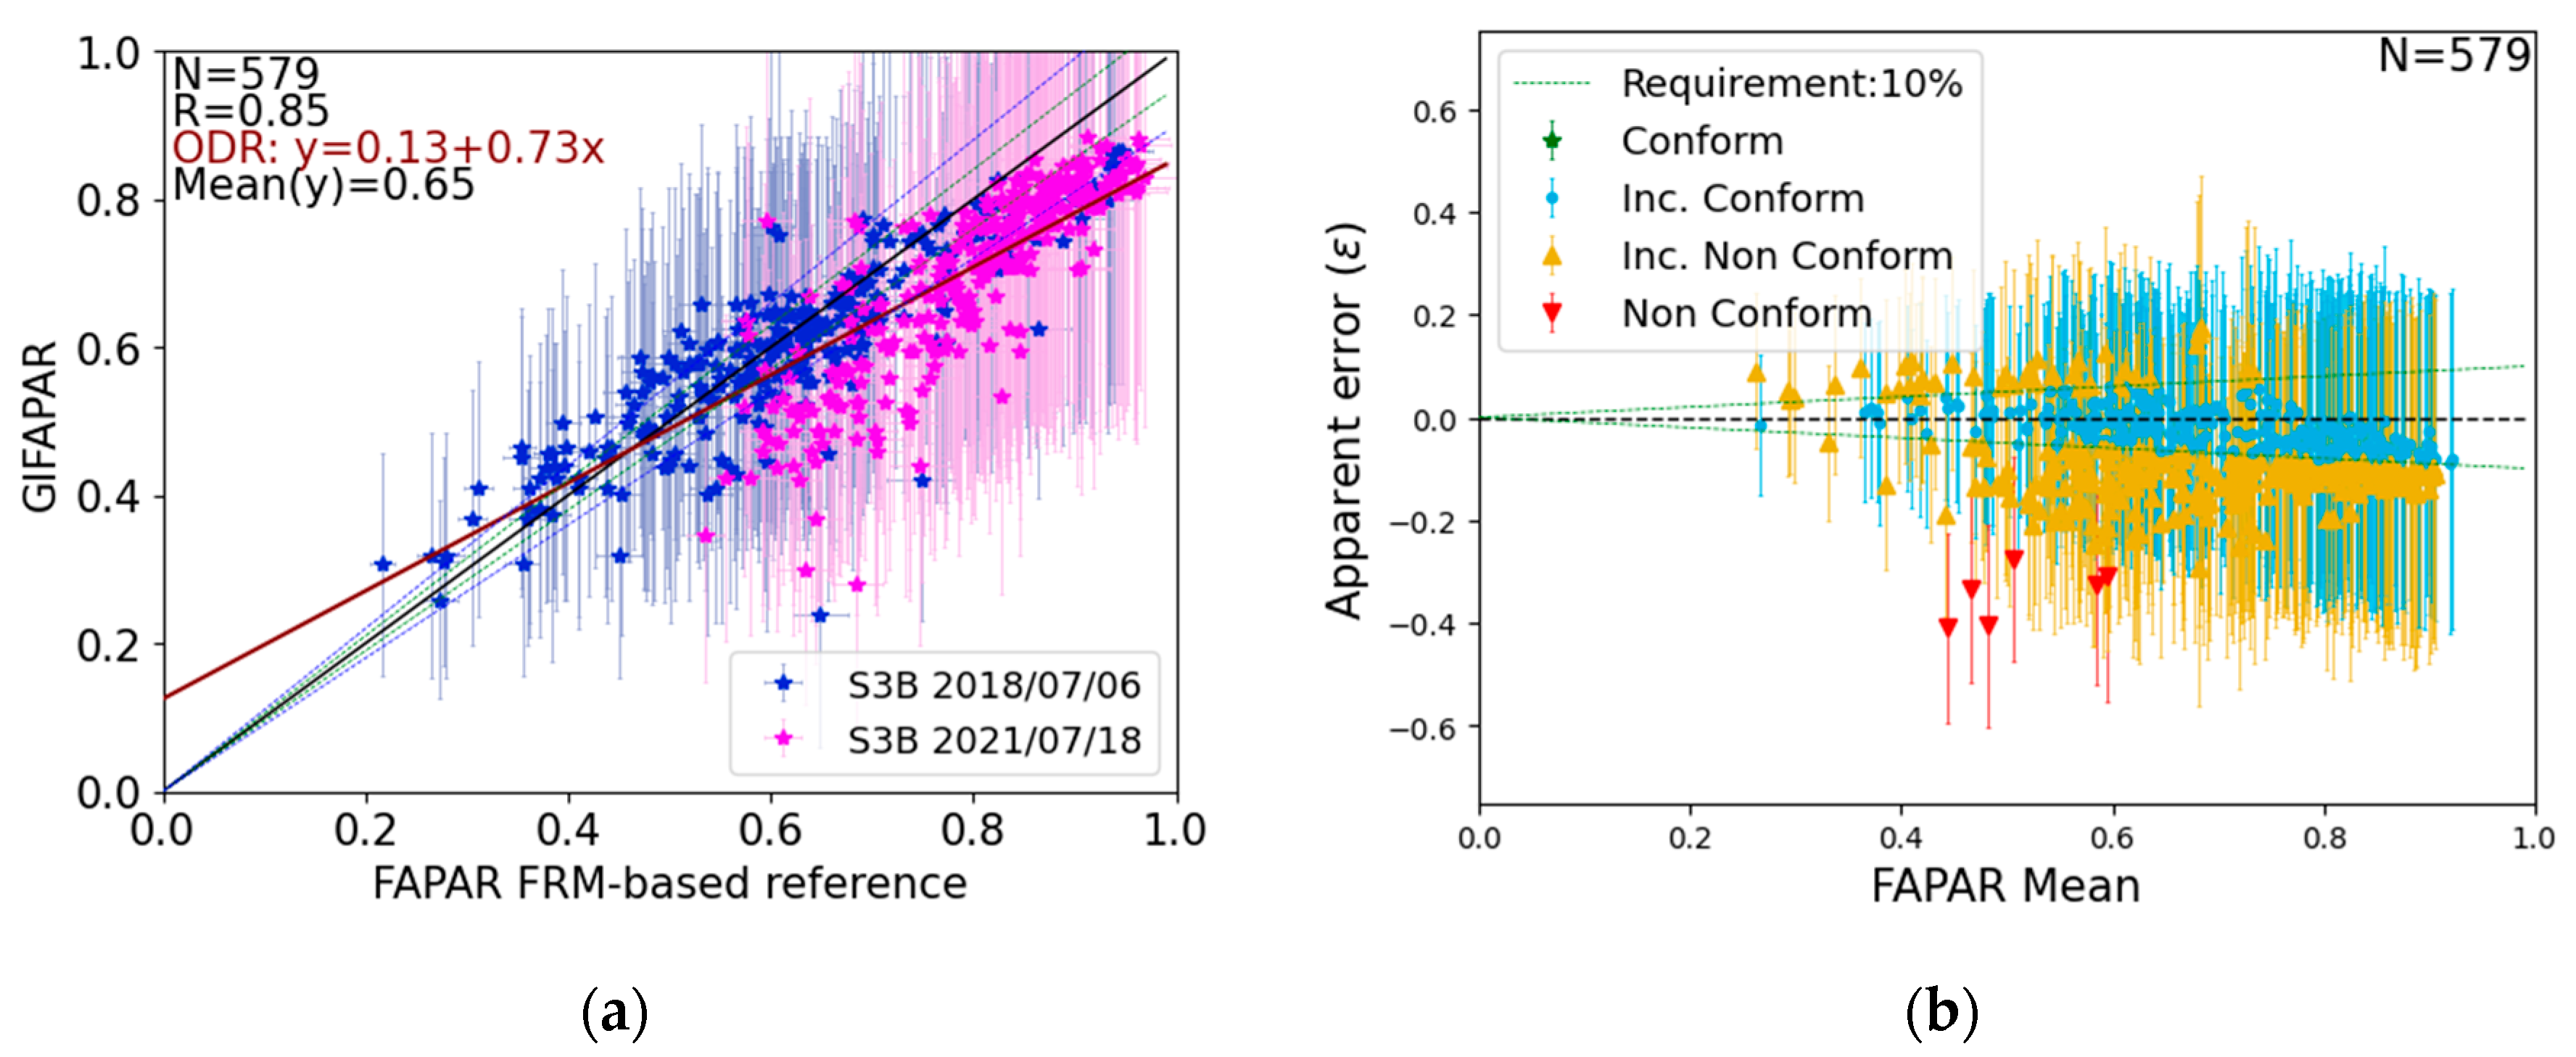
| N | 579 | Goal (5%) | Conclusively conforming | 0.0 |
| R | 0.85 | Inconclusively conforming | 24.0 | |
| ODR | Y = 0.13 + 0.73x | Inconclusively non-conforming | 74.8 | |
| B | −0.06 (−8.7%) | Conclusively non-conforming | 1.2 | |
| MD | −0.06 (−9.0%) | Threshold (10%) | Conclusively conforming | 0.0 |
| STD | 0.08 (11.6%) | Inconclusively conforming | 48.4 | |
| MAD | 0.07 (10.1%) | Inconclusively non-conforming | 50.6 | |
| RMSD | 0.10 (14.5%) | Conclusively non-conforming | 1.0 | |
| Validation Metric | Requirement on Accuracy | Compliance (%) | ||
|---|---|---|---|---|
| N | 580 | Goal (5%) | Conclusively conforming | 0.0 |
| Rcv | 0.88 | Inconclusively conforming | 15.3 | |
| ODR | Y = 0.07 + 0.89x | Inconclusively non-conforming | 69.7 | |
| Bcv | <0.01 (<0.1%) | Conclusively non-conforming | 15.0 | |
| MDcv | 0.01 (1.2%) | Threshold (10%) | Conclusively conforming | 0.0 |
| STDcv | 0.28 (24.3%) | Inconclusively conforming | 31.9 | |
| MADcv | 0.17 (14.7%) | Inconclusively non-conforming | 57.4 | |
| RMSDcv | 0.28 (24.3%) | Conclusively non-conforming | 10.7 | |
| Validation Metric | Requirement on Accuracy | Compliance (%) | ||
|---|---|---|---|---|
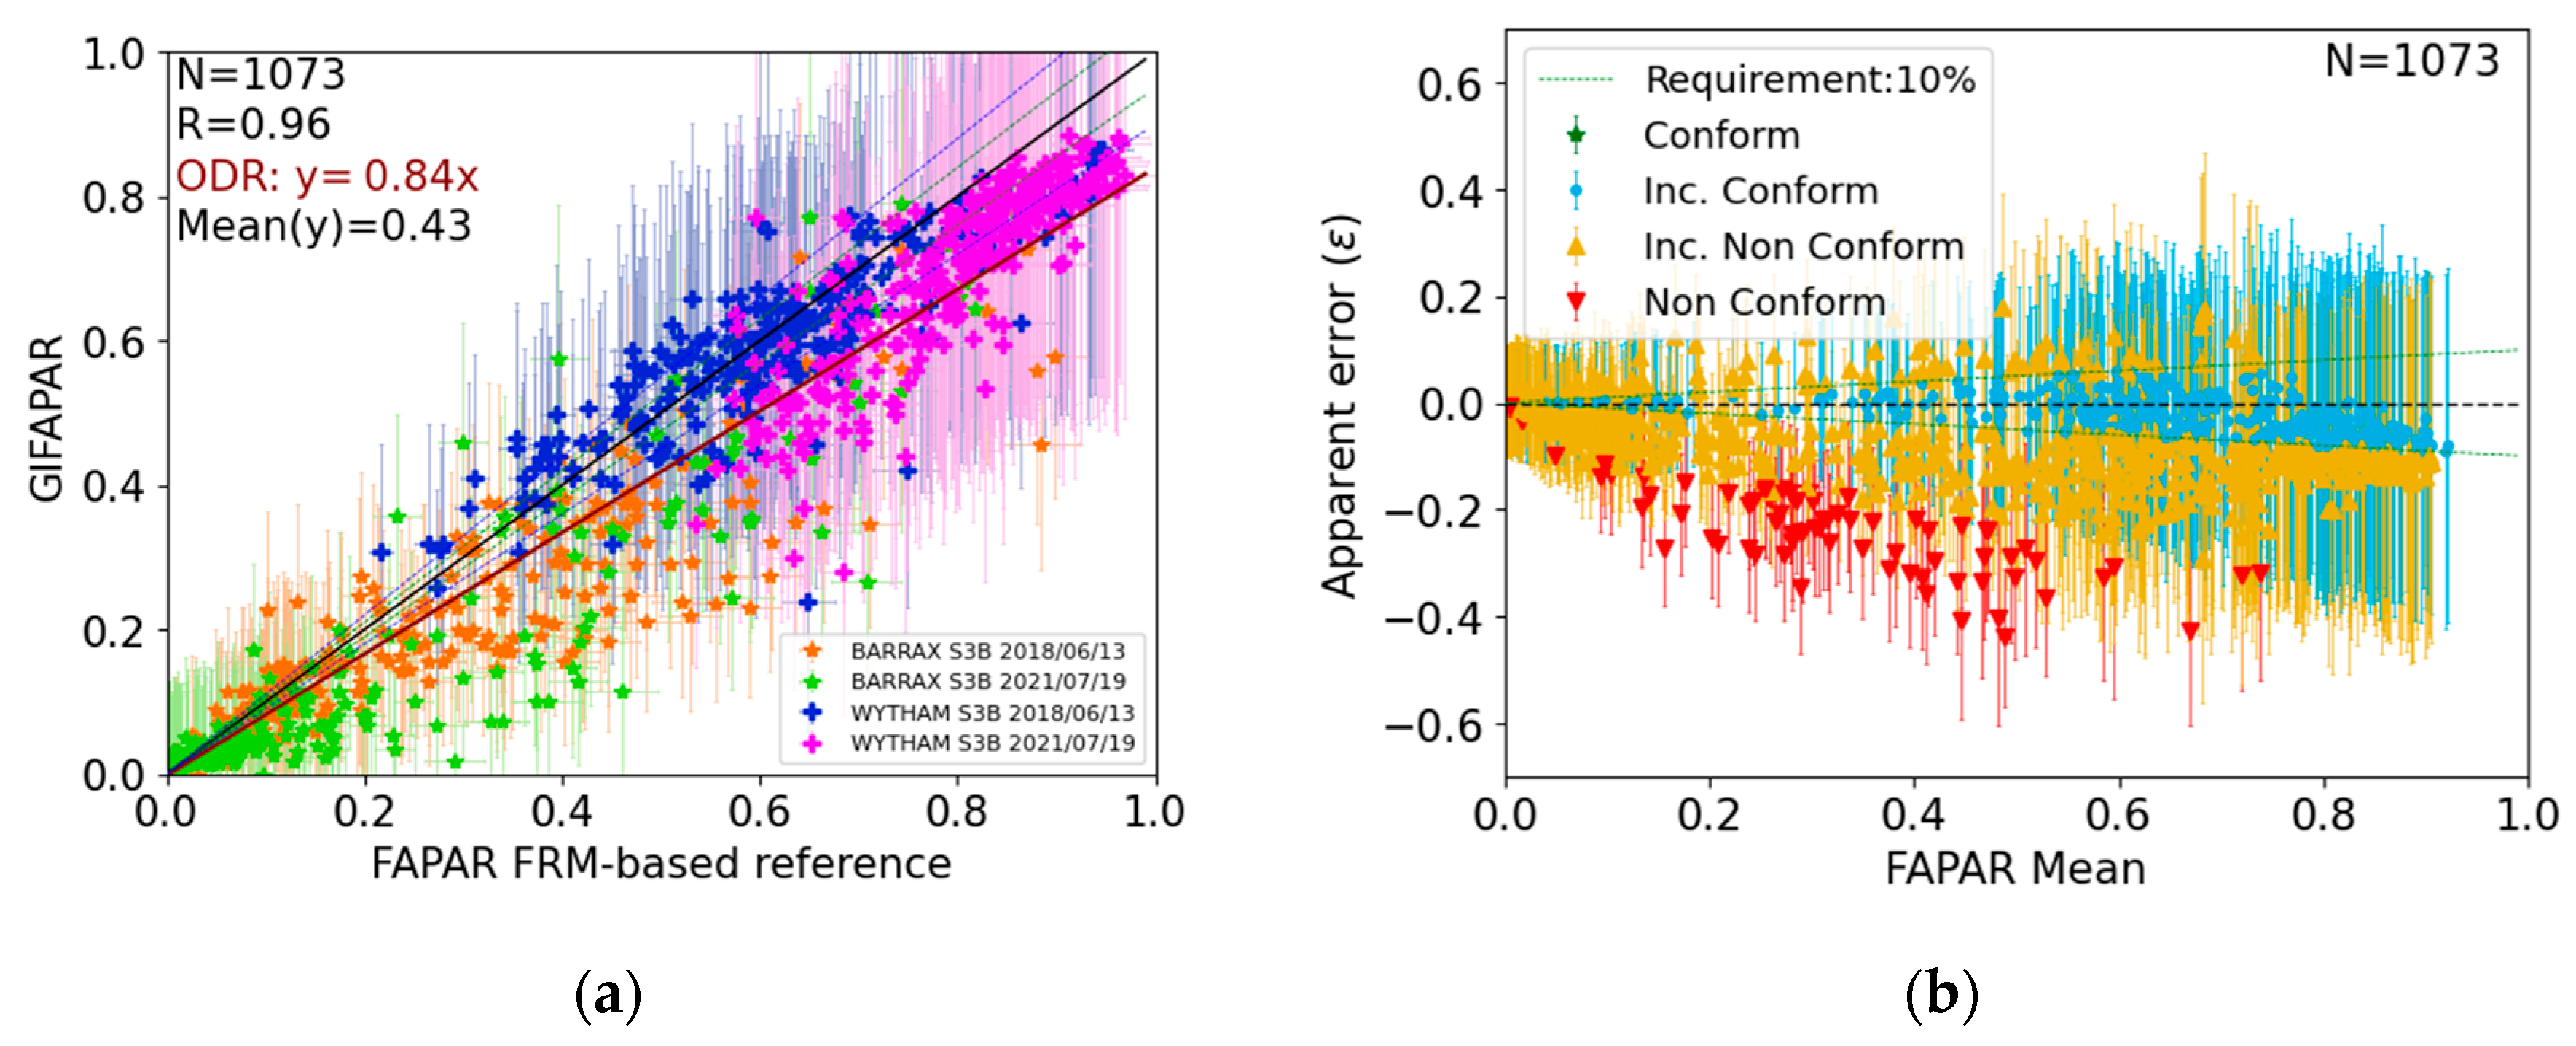
| N | 1073 | Goal (5%) | Conclusively conforming | 0.0 |
| R | 0.96 | Inconclusively conforming | 17.1 | |
| ODR | Y = 0.84x | Inconclusively non-conforming | 74.3 | |
| B | −0.06 (−12.8%) | Conclusively non-conforming | 8.7 | |
| MD | −0.05 (−10.3%) | Threshold (10%) | Conclusively conforming | 0.0 |
| STD | 0.09 (18.5%) | Inconclusively conforming | 32.8 | |
| MAD | 0.06 (12.6%) | Inconclusively non-conforming | 59.9 | |
| RMSD | 0.10 (22.5%) | Conclusively non-conforming | 7.3 | |
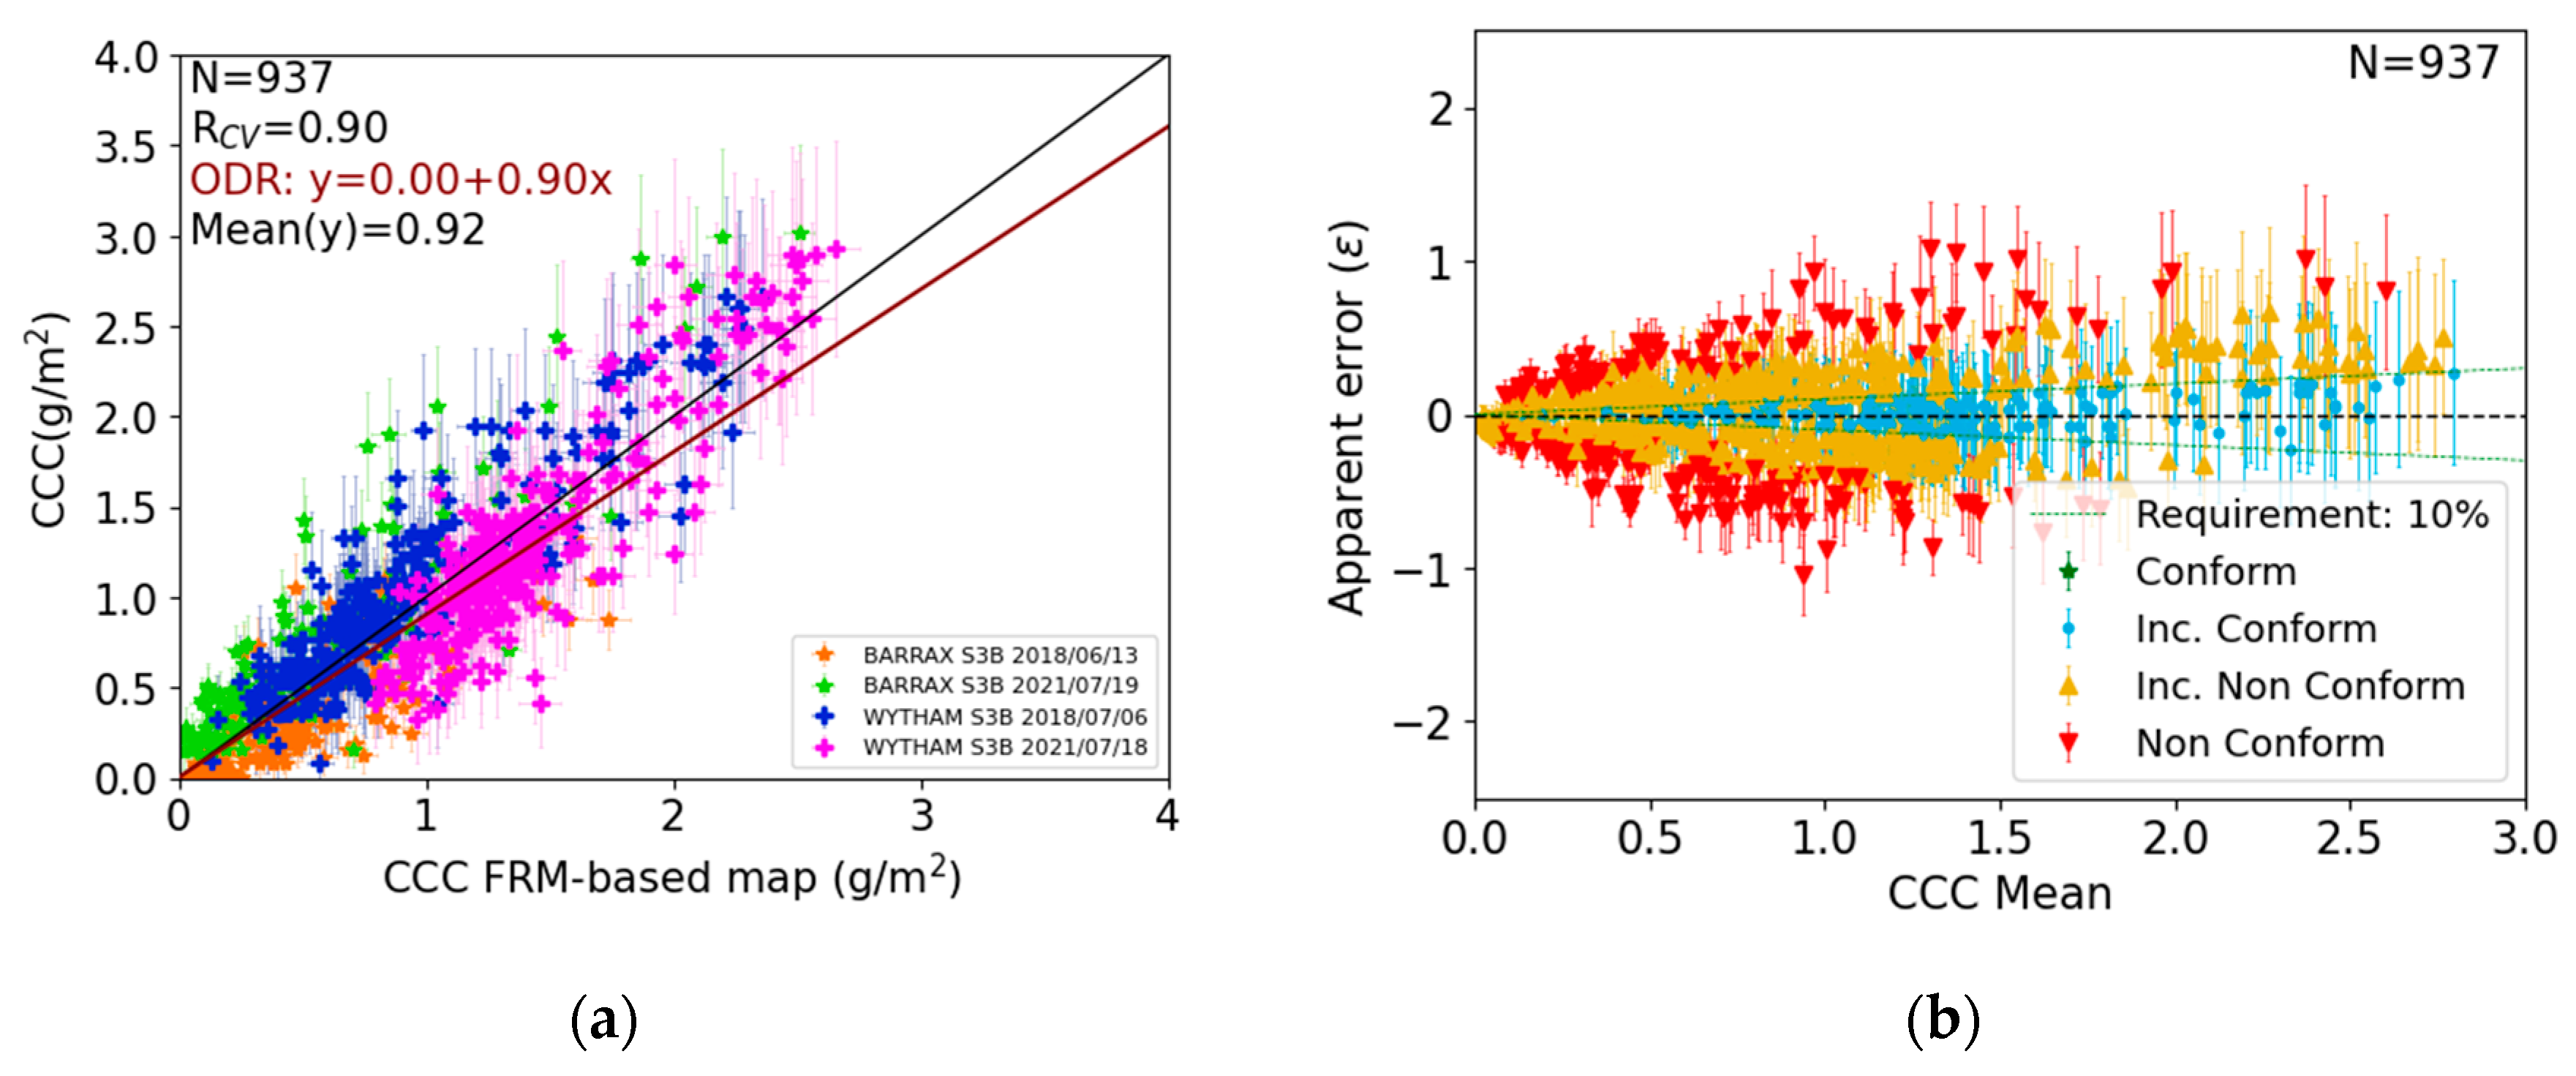
| Validation Metric | Requirement on Accuracy | Compliance (%) | ||
|---|---|---|---|---|
| N | 937 | Goal (5%) | Conclusively conforming | 0.0 |
| R | 0.90 | Inconclusively conforming | 11.6 | |
| ODR | Y = 0.90x | Inconclusively non-conforming | 59.8 | |
| B | <0.01 (0.2%) | Conclusively non-conforming | 28.6 | |
| MD | −0.01 (−0.6%) | Threshold (10%) | Conclusively conforming | 0.0 |
| STD | 0.28 (31.0%) | Inconclusively conforming | 23.6 | |
| MAD | 0.16 (17.5%) | Inconclusively non-conforming | 52.5 | |
| RMSD | 0.28 (31.0%) | Conclusively non-conforming | 23.9 | |
Disclaimer/Publisher’s Note: The statements, opinions and data contained in all publications are solely those of the individual author(s) and contributor(s) and not of MDPI and/or the editor(s). MDPI and/or the editor(s) disclaim responsibility for any injury to people or property resulting from any ideas, methods, instructions or products referred to in the content. |
© 2024 by the authors. Licensee MDPI, Basel, Switzerland. This article is an open access article distributed under the terms and conditions of the Creative Commons Attribution (CC BY) license (https://creativecommons.org/licenses/by/4.0/).
Share and Cite
Camacho, F.; Martínez-Sánchez, E.; Brown, L.A.; Morris, H.; Morrone, R.; Williams, O.; Dash, J.; Origo, N.; Sánchez-Zapero, J.; Boccia, V. Validation and Conformity Testing of Sentinel-3 Green Instantaneous FAPAR and Canopy Chlorophyll Content Products. Remote Sens. 2024, 16, 2698. https://doi.org/10.3390/rs16152698
Camacho F, Martínez-Sánchez E, Brown LA, Morris H, Morrone R, Williams O, Dash J, Origo N, Sánchez-Zapero J, Boccia V. Validation and Conformity Testing of Sentinel-3 Green Instantaneous FAPAR and Canopy Chlorophyll Content Products. Remote Sensing. 2024; 16(15):2698. https://doi.org/10.3390/rs16152698
Chicago/Turabian StyleCamacho, Fernando, Enrique Martínez-Sánchez, Luke A. Brown, Harry Morris, Rosalinda Morrone, Owen Williams, Jadunandan Dash, Niall Origo, Jorge Sánchez-Zapero, and Valentina Boccia. 2024. "Validation and Conformity Testing of Sentinel-3 Green Instantaneous FAPAR and Canopy Chlorophyll Content Products" Remote Sensing 16, no. 15: 2698. https://doi.org/10.3390/rs16152698