Article

Evaluating the Sustainable Development Science Satellite 1 (SDGSAT-1) Multi-Spectral Data for River Water Mapping: A Comparative Study with Sentinel-2

1
Shaanxi Key Laboratory of Earth Surface System and Environmental Carrying Capacity, Northwest University, Xi’an 710127, China
2
College of Urban and Environmental Sciences, Northwest University, Xi’an 710127, China
3
School of Geography and Tourism, Anhui Normal University, Wuhu 241002, China
4
Key Laboratory of Earth Surface Processes and Regional Response in the Yangtze-Huaihe River Basin, Anhui Normal University, Wuhu 241002, China
*
Author to whom correspondence should be addressed.
Remote Sens. 2024, 16(15), 2716; https://doi.org/10.3390/rs16152716
Submission received: 2 June 2024 / Revised: 21 July 2024 / Accepted: 22 July 2024 / Published: 24 July 2024

Abstract

:
SDGSAT-1, the first scientific satellite dedicated to advancing the United Nations 2030 Agenda for Sustainable Development, brings renewed vigor and opportunities to water resource monitoring and research. This study evaluates the effectiveness of SDGSAT-1 in extracting water bodies in comparison to Sentinel-2 multi-spectral imager (MSI) data. We applied a confidence thresholding method to delineate river water from land, utilizing the Normalized Differential Water Body Index (NDWI), Normalized Difference Water Index (MNDWI), and Shaded Water Body Index (SWI). It was found that the SWI works best for SDGSAT-1 while the NDWI works best for Sentinel-2. Specifically, the NDWI demonstrates proficiency in delineating a broader spectrum of water bodies and the MNDWI effectively mitigates the impact of shadows, while SDGSAT-1’s SWI extraction of rivers offers high precision, clear outlines, and shadow exclusion. SDGSAT-1’s SWI overall outperforms Sentinel-2’s NDWI in water extraction accuracy (overall accuracy: 90% vs. 91%, Kappa coefficient: 0.771 vs. 0.416, and F1 value: 0.844 vs. 0.651), likely due to its deep blue bands. This study highlights the comprehensive advantages of SDGSAT-1 data in extracting river water bodies, providing a theoretical basis for future research.

1. Introduction

Remote sensing has been effective in mapping river dynamics and developing hydrological models, which significantly reduces the need for resources during data acquisition [1]. Its high-frequency and repeatable observations are crucial for water resource investigation, planning, protection, disaster management, and modern hydrological simulation [2,3]. Currently, optical multi-spectral images obtained from satellites such as Sentinel-2, MODIS, and Landsat are the primary sources of water extraction [4]. On this foundation, the advent of SDGSAT-1, the first scientific satellite dedicated to advancing the United Nations 2030 Agenda for Sustainable Development, brings renewed vigor and opportunities to the field of water resource monitoring and research [5]. Equipped with a multi-spectral imager specifically designed to contribute to monitoring the Sustainable Development Goals (SDGs), progress evaluation, and scientific inquiries, SDGSAT-1 stands out with its two deep blue bands specifically designed to discern water composition in diverse aquatic environments, encompassing offshore seawater and lakes [6,7]. The SDGSAT-1’s multi-spectral sensor excels in water body monitoring, accurately inverting key water parameters by capturing subtle spectral reflections and radiations. This sensor boasts high spectral resolution, overcoming challenges posed by the harsh environments of the Tibetan Plateau, for precise water quality and ecology monitoring. Its dynamic spatiotemporal capture of hydrological variations is crucial for understanding water cycle mechanisms, while its remote sensing capabilities enable widespread and continuous monitoring, surpassing the limitations of ground-based methods.
Various methods and algorithms have been developed to identify river extraction in remotely sensed imagery, such as spectral feature threshold, water index [7,8], supervised/non-supervised classification [9,10], etc. Among these, the water index method stands out due to its simplicity, efficiency, and reproducibility, rendering it a preferable choice for detailed analyses [11]. This approach capitalizes on surface reflectance from the visible band to the shortwave-infrared band, facilitating water extraction with an optimal segmentation threshold that accentuates reflectance disparities between water and non-water surfaces [4,12,13]. McFeeters introduced the normalized water index (NDWI), which utilizes the near-infrared band (NIR) and green band while mitigating the influence of soil and land vegetation characteristics on water detection [8,14]. Building on the NDWI, Xu proposed the normalized difference water index (MNDWI) [15] by replacing the NIR band with the shortwave-infrared band, to minimize disturbances from built-up lands [16]. Furthermore, Li et al. [14] proposed the shadow water body index (SWI) to distinguish water bodies from mountain shadows, effectively reducing shadow-related errors and thereby improving the accuracy of water body extraction. Selecting a suitable water index for SDGSAT-1, however, is challenging due to its unique sensor characteristics. Careful consideration of satellite data, geographical conditions, and application needs is necessary to determine the optimal index. This ensures accurate and efficient water monitoring, enhancing data reliability for scientific research and practical applications. These three water indices are compatible with the band setting and resolution of the SDGSAT-1 satellite and are also adaptable to the complex conditions of the research area. Therefore, they have been selected as the preferred indices for water extraction in this study.
To evaluate the performance of SDGSAT-1 data in extracting water bodies, a comparative analysis was conducted on the Dang River located on the Qinghai–Tibet Plateau (QTP), employing the NDWI, MNDWI, and SWI for accurate extraction. The applicability and accuracy of these indices were systematically evaluated in SDGSAT-1 data, with optimization of the water body threshold segmentation method. By comparing the results from SDGSAT-1 with those from Sentinel-2 in river extraction, the effectiveness of SDGSAT-1 in monitoring rivers on the QTP under complex conditions was validated. This research deepened our understanding of SDGSAT-1 and supported water resource management and ecological protection efforts.

2. Study Area and Materials

2.1. Study Area

The Dang River basin and its vicinity waters (93°58′–97°30′E, 38°25′–40°26′N), situated in Northwest China’s inland Dunhuang City on the QTP, were selected as the study area. Originating from the Qilian Mountains, the Dang River traverses a distance of 390 km, covering an area of approximately 17,381.33 km2, with an annual runoff of 2.89 × 10⁸ m3. The rivers primarily receive water from atmospheric precipitation, groundwater, and glacier meltwater. The Dang River, a pivotal watercourse on the QTP, holds a unique position as China’s only south-to-north infiltrating river. Its distinctive flow pattern is intricately intertwined with the region’s terrain, topography, and climatic factors. Given its strategic geographical locale and vast watershed, the Dang River aptly embodies the natural geographical essence of the QTP. Through rigorous investigation of its hydrological characteristics, we can gain a profound understanding of the plateau’s natural environmental shifts and the ramifications of human activities.
This study designated three river sections in the Dang River Basin as test areas for water extraction (Figure 1). Area A is located in the north of the Dang River basin and features the Dang River reservoir, the largest in Dun Huang, covering an area of 1.66 km2 with an average runoff of 2.93 × 10⁸ m3, and a total capacity of 4.64 × 10⁷ m3. The river in Area A is narrow, with minimal obstacles in its vicinity, and its southern tributary exhibits a slender riverbed and narrowed width. Area B, in the middle reaches, is marked by fragmented water bodies and a winding course due to the surrounding Kurodaban Mountains, posing challenges for water index extraction. Area C, located in the south, encompasses the Yema River as a primary tributary of the Dang River. Despite mountainous terrain, Area C exhibits improved river continuity and a clearer demarcation between the river and its surrounding areas.

2.2. Data

2.2.1. SDGSAT-1 Data

The SDGSAT-1 satellite carries three payloads: a multi-spectral imager (MSI); a Glimmer Imager (GLI); and a Thermal Infrared Spectrometer (TIS), designed for continuous Earth observation during day and night. The MSI, equipped with two deep blue bands, provides multi-spectral data on inland water and terrestrial surfaces. The GLI and TIS capture night and thermal infrared data, respectively [5]. Orbiting in a sun-synchronous path near the poles, the MSI boasts a 300 km swath width at 505 km altitude, with 10 m spatial resolution across all bands [17]. Considering cloud cover, data quality, and the availability of SDGSAT-1, this study selected an L4-classified SDGSAT-1 image from November 5, 2022, sourced from the International Research Center for Sustainable Development (CBAS). The image underwent radiometric and atmospheric correction, along with mosaicking [18]. See Table 1 for data source details.

2.2.2. Sentinel-2 Data

Sentinel-2 data, part of the Copernicus program launched by the European Commission and ESA, is used for comparing SDGSAT-1 results. This satellite mission provides high-resolution imagery for land and coastal areas [19]. Consisting of Sentinel-2A and Sentinel-2B, the satellites orbit at 786 km and are equipped with MSI, featuring 13 spectral bands ranging from visible to short-wave infrared. Spatial resolution ranges from 10 m to 60 m, with a 290 km field of view [20]. For analysis, this study employs ESA’s Sen2cor model from SNAP software (version 9.0) for radiometric calibration, atmospheric correction, and spatial resolution resampling to 10 m on downloaded Level-1C data.

3. Methodology

This study presents a comparison among three indices on SDGSAT-1, regarding their ability for river water extraction (Figure 2). The methodology consists of four steps: (1) preprocessing of remote sensing image from SDGSAT-1 and Sentinel-2; (2) extracting river networks; (3) applying determined thresholds for accurately classifying water bodies; and (4) assessing the accuracy of water extraction.

3.1. Preprocessing

After radiometric and atmospheric corrections, Sentinel-2 and SDGSAT imagery are used to calculate water body indices. Water bodies, crucial natural features, exhibit distinct spectral responses across various wavelengths, vital for extracting water information from remote sensing images [21]. Leveraging reflectance differences between target objects across bands, this study enhances the brightness of water bodies while suppressing background brightness. Consequently, three water indices were chosen for analysis (Table 2).

3.2. River ROI

In this study, the Region of Interest (ROI) was meticulously delineated to establish a precise scope for subsequent water body extraction, effectively mitigating potential interference from unrelated regions. The FABDEM was employed, leveraging its exceptional ability to delineate river networks [17], to ensure that the ROI accurately encompassed the Dang River and its vital tributaries. Additionally, the Height Above the Nearest Drainage (HAND) index was utilized as an auxiliary analysis tool to precisely extract the river’s centerline [19]. Based on this, a 1 km buffer zone was established, defining the boundaries of the ROI. This meticulously designed and delineated ROI provides a solid foundation for subsequent water body extraction, enabling the extraction of water body information from the Dang River and its surrounding areas with greater accuracy and efficiency. This, in turn, provides robust data support for subsequent hydrological analysis, water quality monitoring, and river ecosystem studies.

3.3. Determination of the Optimal Segmentation Threshold

As an important factor in determining the drainage network, the threshold directly determines the spatial form of the river. Given the tediousness of manually thresholding multiple images, this study considered the confidence interval of the distribution histogram of the NDWI to obtain threshold values. Thresholds were divided into different confidence intervals and iteratively adjusted to ensure comprehensive water body extraction for the Dang River, minimizing false positives and optimizing the segmentation quality. Employing confidence-based thresholding for water body extraction offers speed and reliability, surpassing manual interpretation and iterative experiments. Furthermore, its broad applicability makes it suitable for water extraction tasks across diverse environments. To evaluate the effectiveness of the confidence thresholding method, based on the extraction results from SDGSAT-1, the differences between the confidence thresholding and Otsu method, manual visual interpretation, and single threshold method for water body extraction will be discussed in Section 5.2.

3.4. Accuracy Assessment

To quantify the accuracy of water extraction, a confusion matrix is constructed to calculate the overall accuracy and Kappa coefficient. The matrix classifies results into four categories: false negative (FN) refers to the not extracted water element, false positive (FP) refers to the wrong extracted water element, true negative (TN) refers to the correct extraction of the water element, and true positive (TP) refers to the correctly extracted water element [22]. The equations are as follows:
F P = F P F P + T N
F N = F N T P + F N
T represents the total number of samples.
P O = T P + T N T
F1 value ( F 1 s c o r e ) is a comprehensive measure of the precision rate and recall rate of the model and provides a balanced evaluation of the model’s ability to distinguish between water and non-water. The F1 value is calculated as:
F 1 s c o r e = 2 T P T + T P T N
The Kappa coefficient is an indicator that reflects the consistency between the classification result and the real result based on the confusion matrix, taking into account the influence of random factors.
K a p p a = T T P + T N S T T S
The S is calculated as follows:
S = T P + F P T P + F N + F N + T N F P + T N

4. Results

4.1. River Water Mapping of SDGSAT-1

The performance comparison of three water indices on SDGSAT-1 imagery covering Areas A-C has been conducted (Figure 3), with the calculated optimal thresholds (Table 3) and extracted areas summarized (Table 4). Correctly classified areas are highlighted in red circles, while misclassified areas are indicated by blue markings. The analysis reveals that SDGSAT-1 imagery can effectively extract river bodies. In Area A, the narrow river water bodies, including the prominent Dang River Reservoir, are captured. However, despite the high resolution and rich spectral information of SDGSAT-1 imagery, some non-river pixels were erroneously classified as river pixels. This area of NDWI reached an excessively high 67.78 km2, which could be attributed to the spectral similarity between these regions and rivers. The NDWI and MNDWI exhibit good river segmentation in the middle region, while the SWI performs well in the north. In Area B, where the water bodies are ice-covered and surrounded by complex terrain, the extraction task becomes significantly challenging. Nevertheless, the SWI exhibits remarkable performance in this region, demonstrating clear edge contours and detailing river expression, effectively segmenting the target. The extracted water area measures 31.64 km2, only slightly exceeding the actual area by 2.9 km2. The NDWI and MNDWI tend to misclassify mountain pixels as river pixels, with the NDWI exhibiting particularly low discrimination between the two, resulting in an extracted area that is four times larger than the actual water body area. Area C, characterized by relatively open water bodies with fragmented sections, poses challenges for extraction. Despite these difficulties, the SWI maintains superior segmentation capabilities, with clear river edges and details. For instance, while the NDWI and MNDWI demonstrate effective extraction in certain areas, their limitations in handling complex water conditions are also evident.
Through analysis, similarities between the NDWI and MNDWI in identifying river waterbodies were observed. Compared to the NDWI, the MNDWI excels in eliminating mountain shadows. Notably, the SWI method demonstrates superior performance on SDGSAT-1 imagery, continuously and accurately extracting rivers. This superiority lies in its ability to reduce erroneous and redundant water body information by suppressing classification noise from mountain shadows, and other irrelevant features. Given the presence of two deep blue bands in SDGSAT-1 imagery, the SWI exhibited greater flexibility in utilizing this information, making it a superior method for processing such imagery [16]. Overall, the SWI demonstrates superior segmentation performance across all areas, particularly in terms of edge definition and detail expression. The NDWI and MNDWI, while useful in certain contexts, require further refinement to improve mountain-river discrimination.

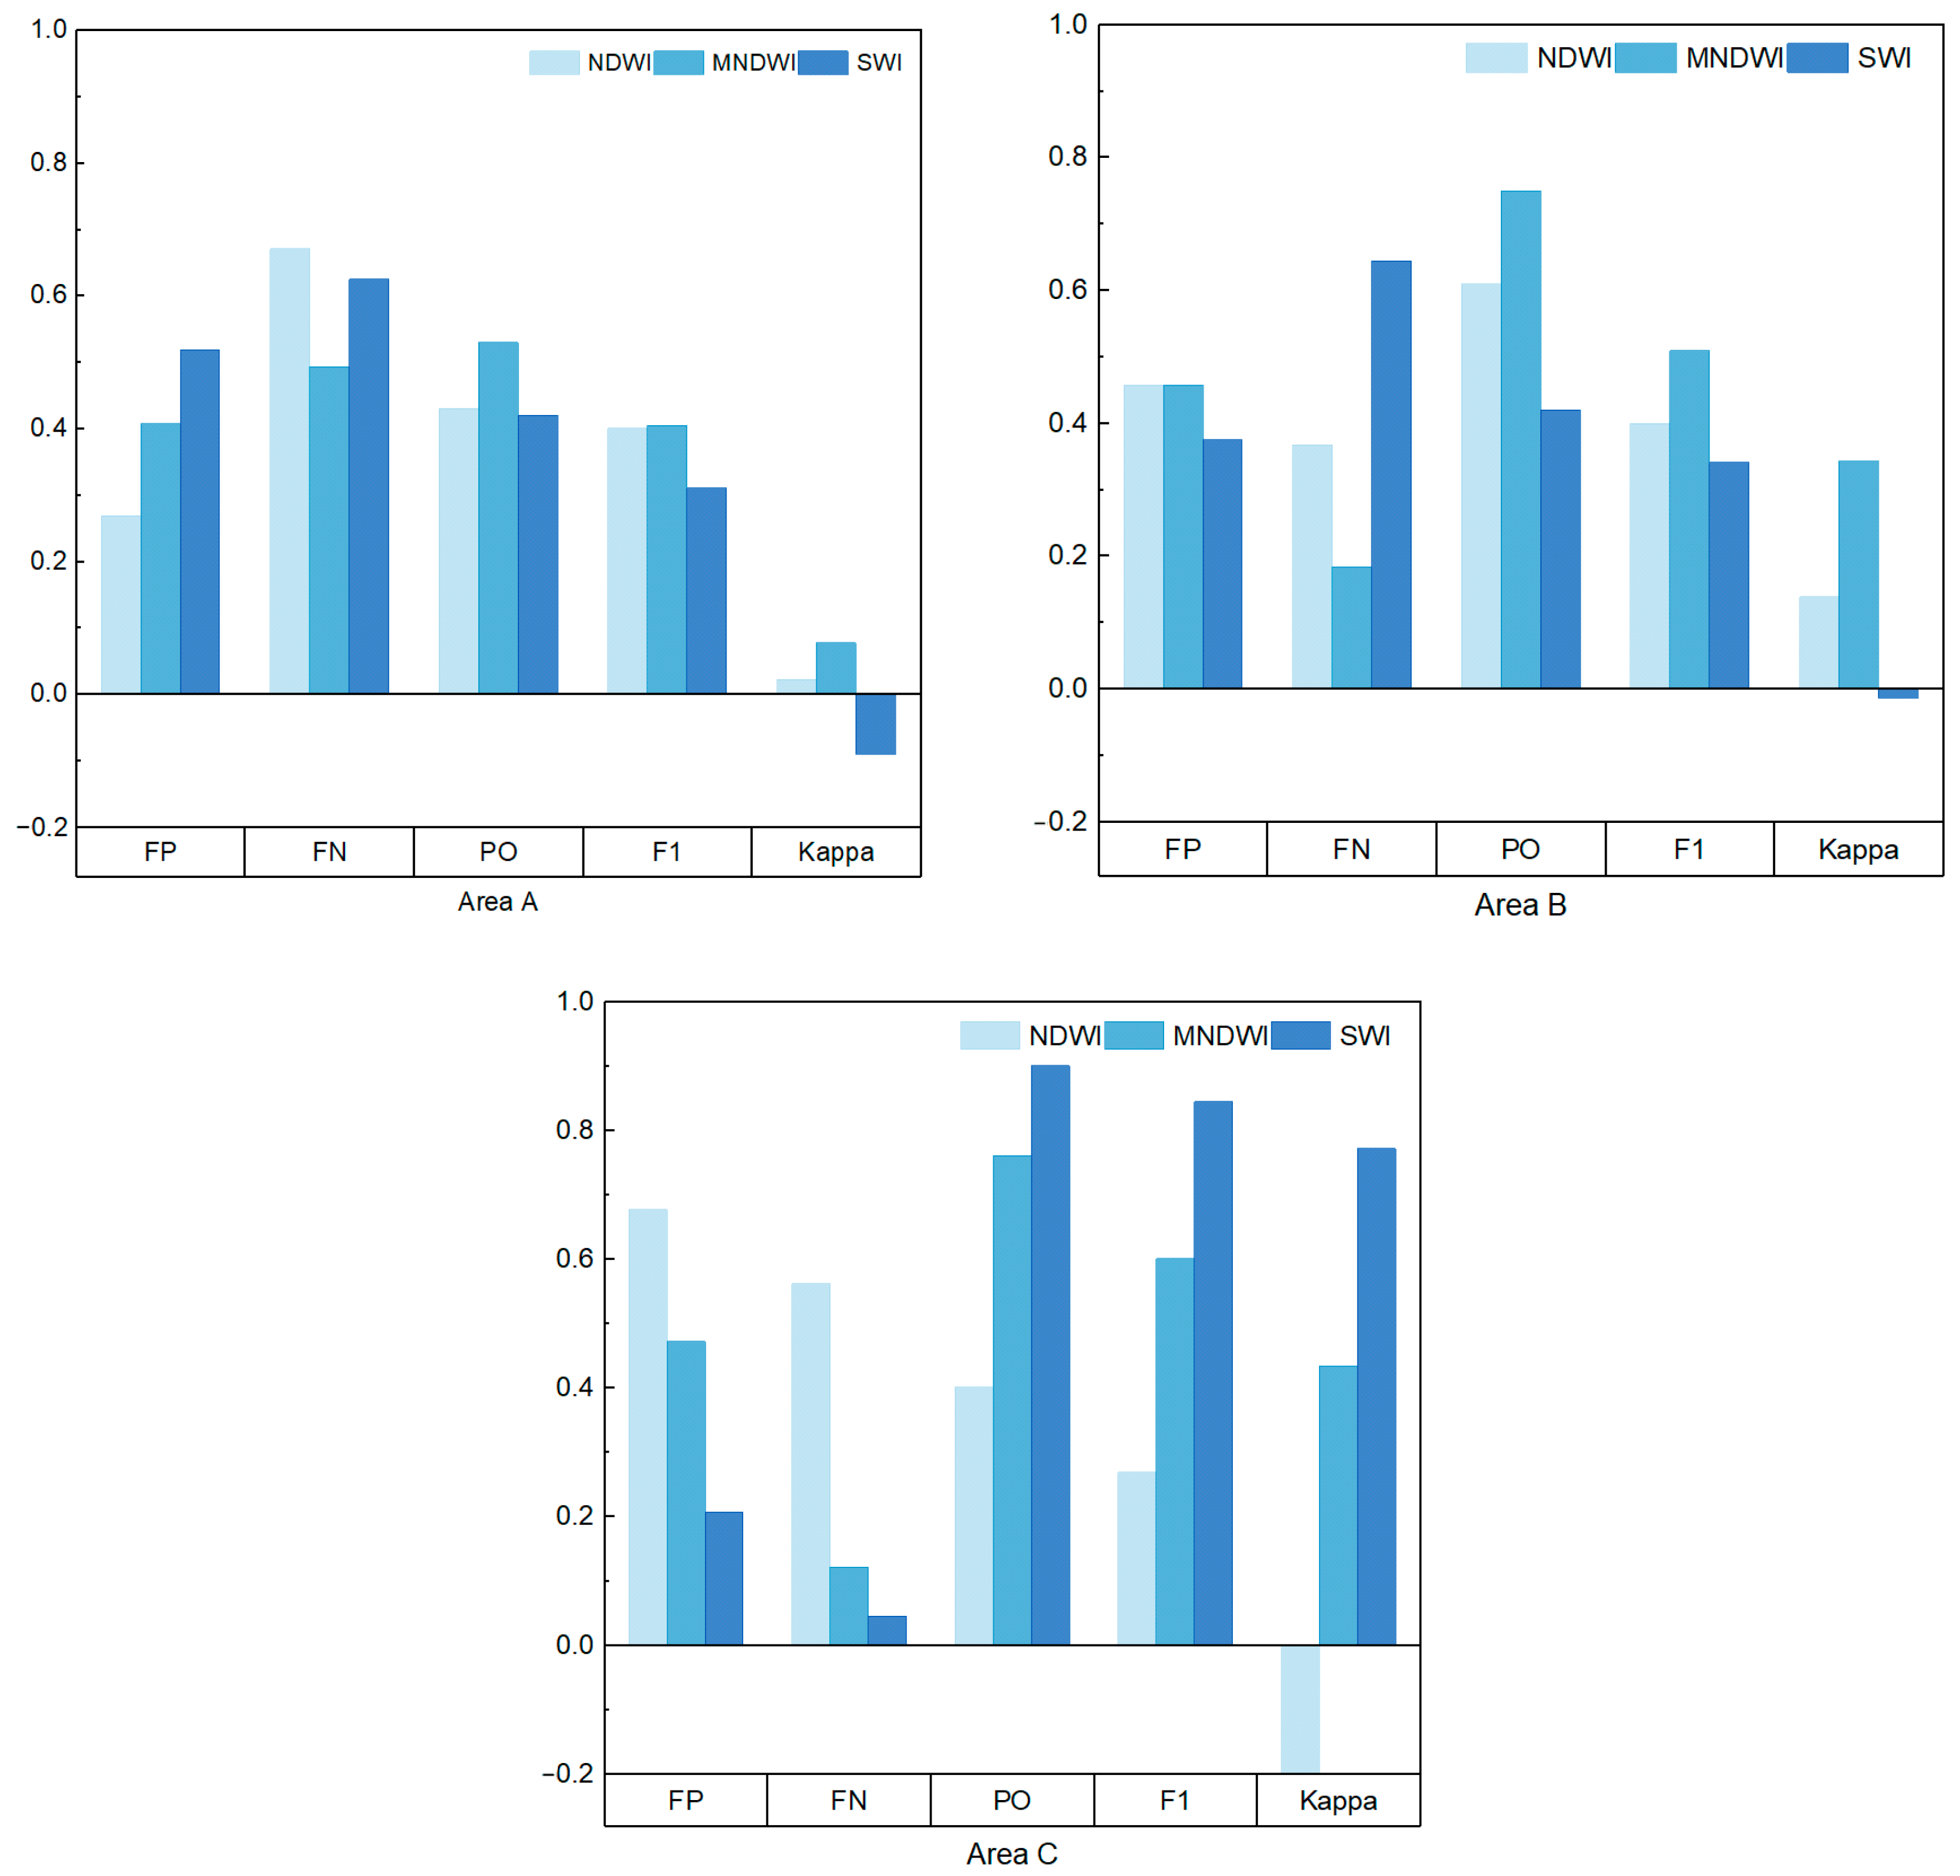
4.2. Accuracy Assessment

Utilizing the confusion matrix verification method, a thorough analysis was conducted on the relative accuracy of the Dang River information extraction results, with a comparative evaluation of three water indices (Figure 4). In Area A, the SDGSAT-1 image exhibits a high FN value of 0.65, passively indicating a significant issue: a substantial number of non-water pixels were erroneously classified as water. In Area B, the overall accuracy was superior to Area A, with all methods achieving a PO of 40%. It is noteworthy that the MNDWI exhibited superior accuracy in Area B with a low FN, suggesting its suitability for mountainous water areas and ability to mitigate the impact of mountain shadows. In Area C, the highest F1 and Kappa coefficients among the three areas underscore the importance of distinct water body characteristics for accurate extraction. Using the SWI to extract SDGSAT-1 image water bodies yielded optimal results, with an overall accuracy of 0.9, an F1 score of 0.844, and a Kappa coefficient of 0.771. This is attributed to the increase in river width as the stream order increased, facilitating satellite water detection. Overall, the distribution of extracted water bodies closely aligns with the actual water bodies, indicating a high level of consistency. SDGSAT-1 exhibits a lower omission error in river extraction. Among the various water indices, the SWI emerges as the most effective for identifying water bodies with SDGSAT-1. In terms of spectral features, SDGSAT-1’s deep blue bands (Band 1 and Band 2) hold the first and third rankings, respectively, in their ability to enhance water body extraction. The subsequent analysis underscores the pivotal role played by SDGSAT-1’s deep blue bands, spanning 374–427 nm and 410–467 nm, in enhancing water body extraction capabilities [21], crucial for precise water body identification. Therefore, future research should further explore and leverage the potential of these bands to enhance the accuracy and efficiency of water body extraction.

5. Discussion

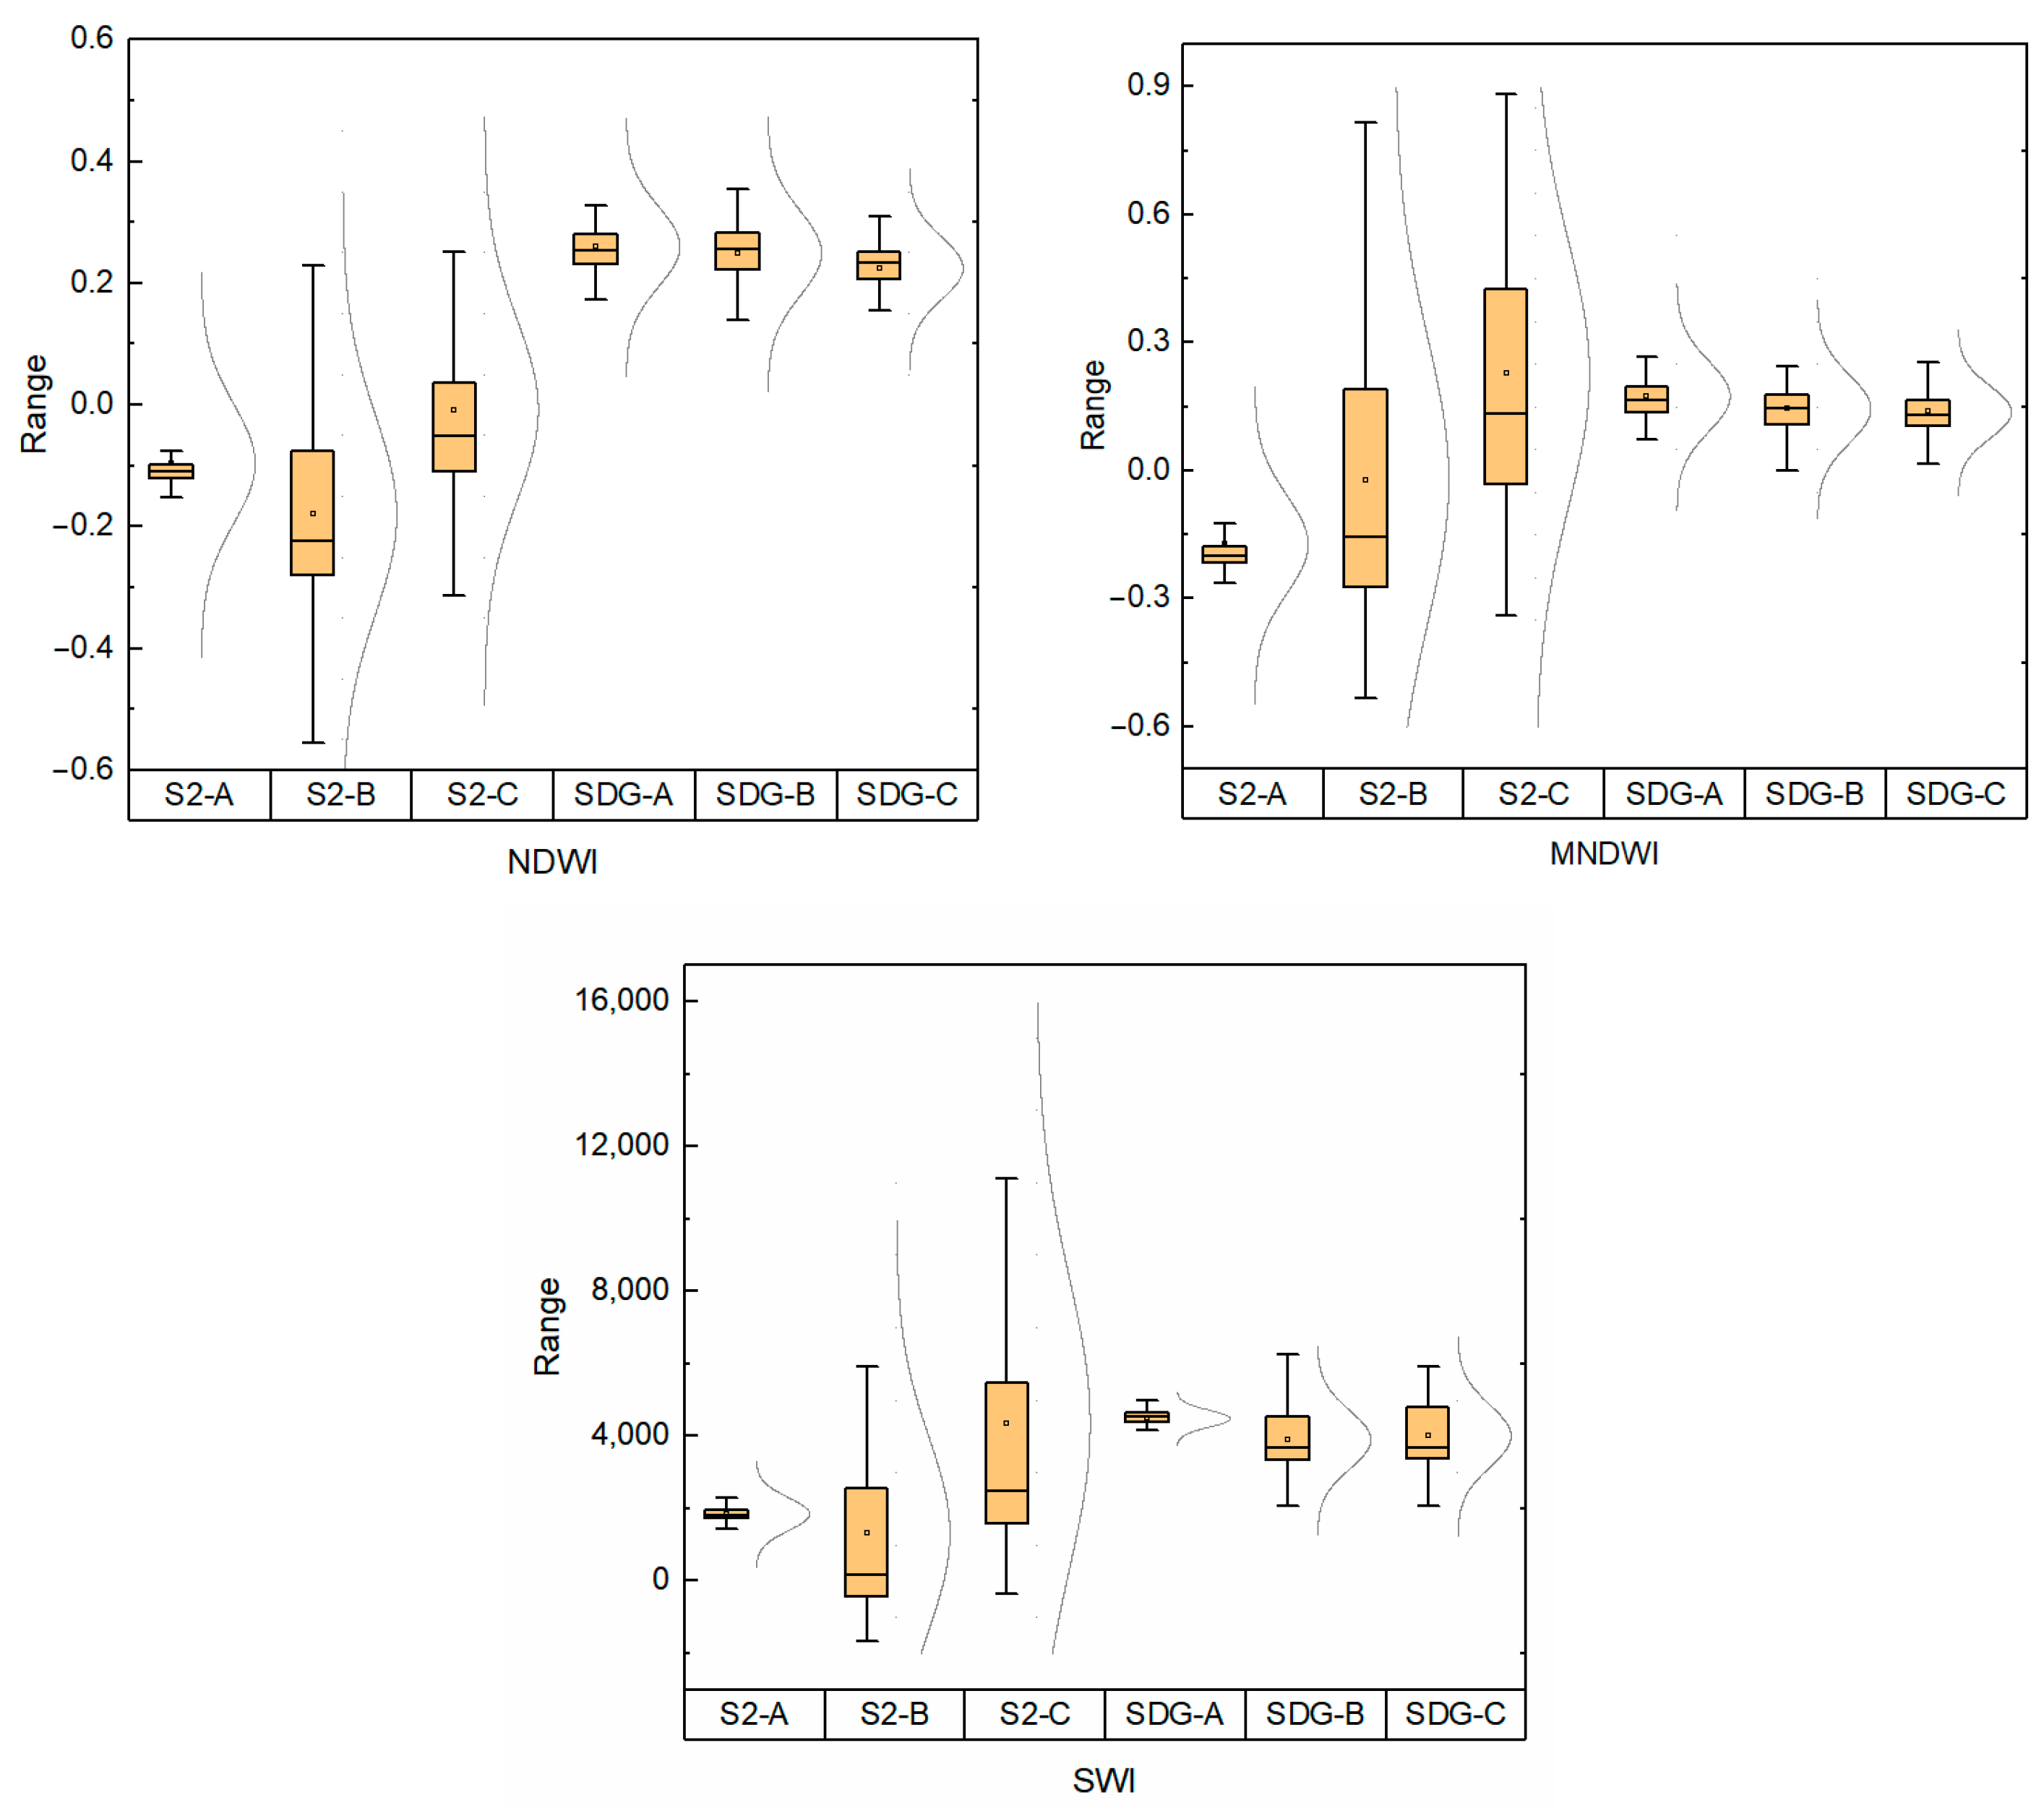
5.1. Performance Comparison of Four Threshold Methods

The various threshold selection methods have different impacts on the hydrological analysis, with studies demonstrating that regions with varying river complexities may benefit from specific threshold selection methods, enhancing the understanding and management of river systems [23]. This study, based on SDGSAT-1 satellite imagery, comparatively analyzed four thresholding methods: the visual interpretation method (visual), the Otsu method (Otsu), the single threshold method (0.200), and the confidence thresholding method (Confidence). Both visual processing and statistical analysis are employed to present local results of the mentioned methods across three distinct areas of the SDGSAT-1 image (Figure 5), with the distribution characteristics of results (Figure 6). After a thorough analysis of the application effects of threshold segmentation methods in different regions of the SDGSAT-1 imagery, it has been found that their performances are significantly influenced by a series of intricate and interconnected geographical, environmental, and image characteristics. In Area A, similar spectral characteristics between water and other surfaces hinder precise threshold setting, leading to suboptimal performance across various methods. The confidence thresholding method somewhat enhances accuracy by integrating feature data but still struggles to fully capture water bodies due to environmental complexity. In Area B, mountain shadows significantly disrupt threshold segmentation, causing the misidentification of water bodies. Despite this, the visual interpretation method and confidence thresholding method partially mitigate shadow effects by leveraging image features and knowledge, yielding more precise water edge detection, though some disturbances may persist. In Area C, the single threshold method and confidence thresholding method exhibit relatively superior performance, extracting water body information more distinctly and with more significant results. This indicates that the application effects of threshold segmentation methods vary across regions [24]. Tailoring methods to specific scenarios and enhancing them with additional techniques like manual interpretation and the confidence thresholding method is crucial.
Upon an in-depth comparative analysis of various method distributions, it has been recognized that the confidence thresholding method offers significant advantages. Specifically, Sentinel-2 satellite data exhibits greater dispersion in water body index values, whereas SDGSAT-1 satellite data demonstrates a more concentrated and stable distribution (Figure 6). The distinct distribution characteristics significantly influence the application of the confidence interval method, revealing that SDGSAT-1 data is more suitable for this approach. For the three water extraction methods—NDWI, MNDWI, and SWI—the thresholds derived from SDGSAT-1 are 0.2349, 0.1589, and 4494.32 (Table 3), respectively, all located near the median line of boxplots, indicating high stability. This revelation not only corroborates the efficacy of the confidence threshold approach for SDGSAT-1 data but also furnishes a solid foundation for ensuing endeavors in water body extraction. In comparison, significant variations in box-plot distributions for Sentinel-2 satellite data are evident across three different regions. Area A, despite its concentrated distribution, is plagued by numerous omissions, complicating threshold settings. Meanwhile, areas B and C suffer from elongated boxplot distributions due to mountain shadow effects, hindering the confidence interval method’s ability to uniformly satisfy precision requirements across all three regions. In conclusion, the confidence threshold method proves to be an efficient and precise technique for extracting water bodies from SDGSAT-1 satellite data, showing extensive applicability. With complex datasets such as those from Sentinel-2, it becomes necessary to incorporate additional techniques to improve extraction accuracy and efficiency. Future research is anticipated to further refine the application of this method, seeking optimized strategies across varied data sources and scenarios, thereby contributing substantially to the field of remote sensing image processing.

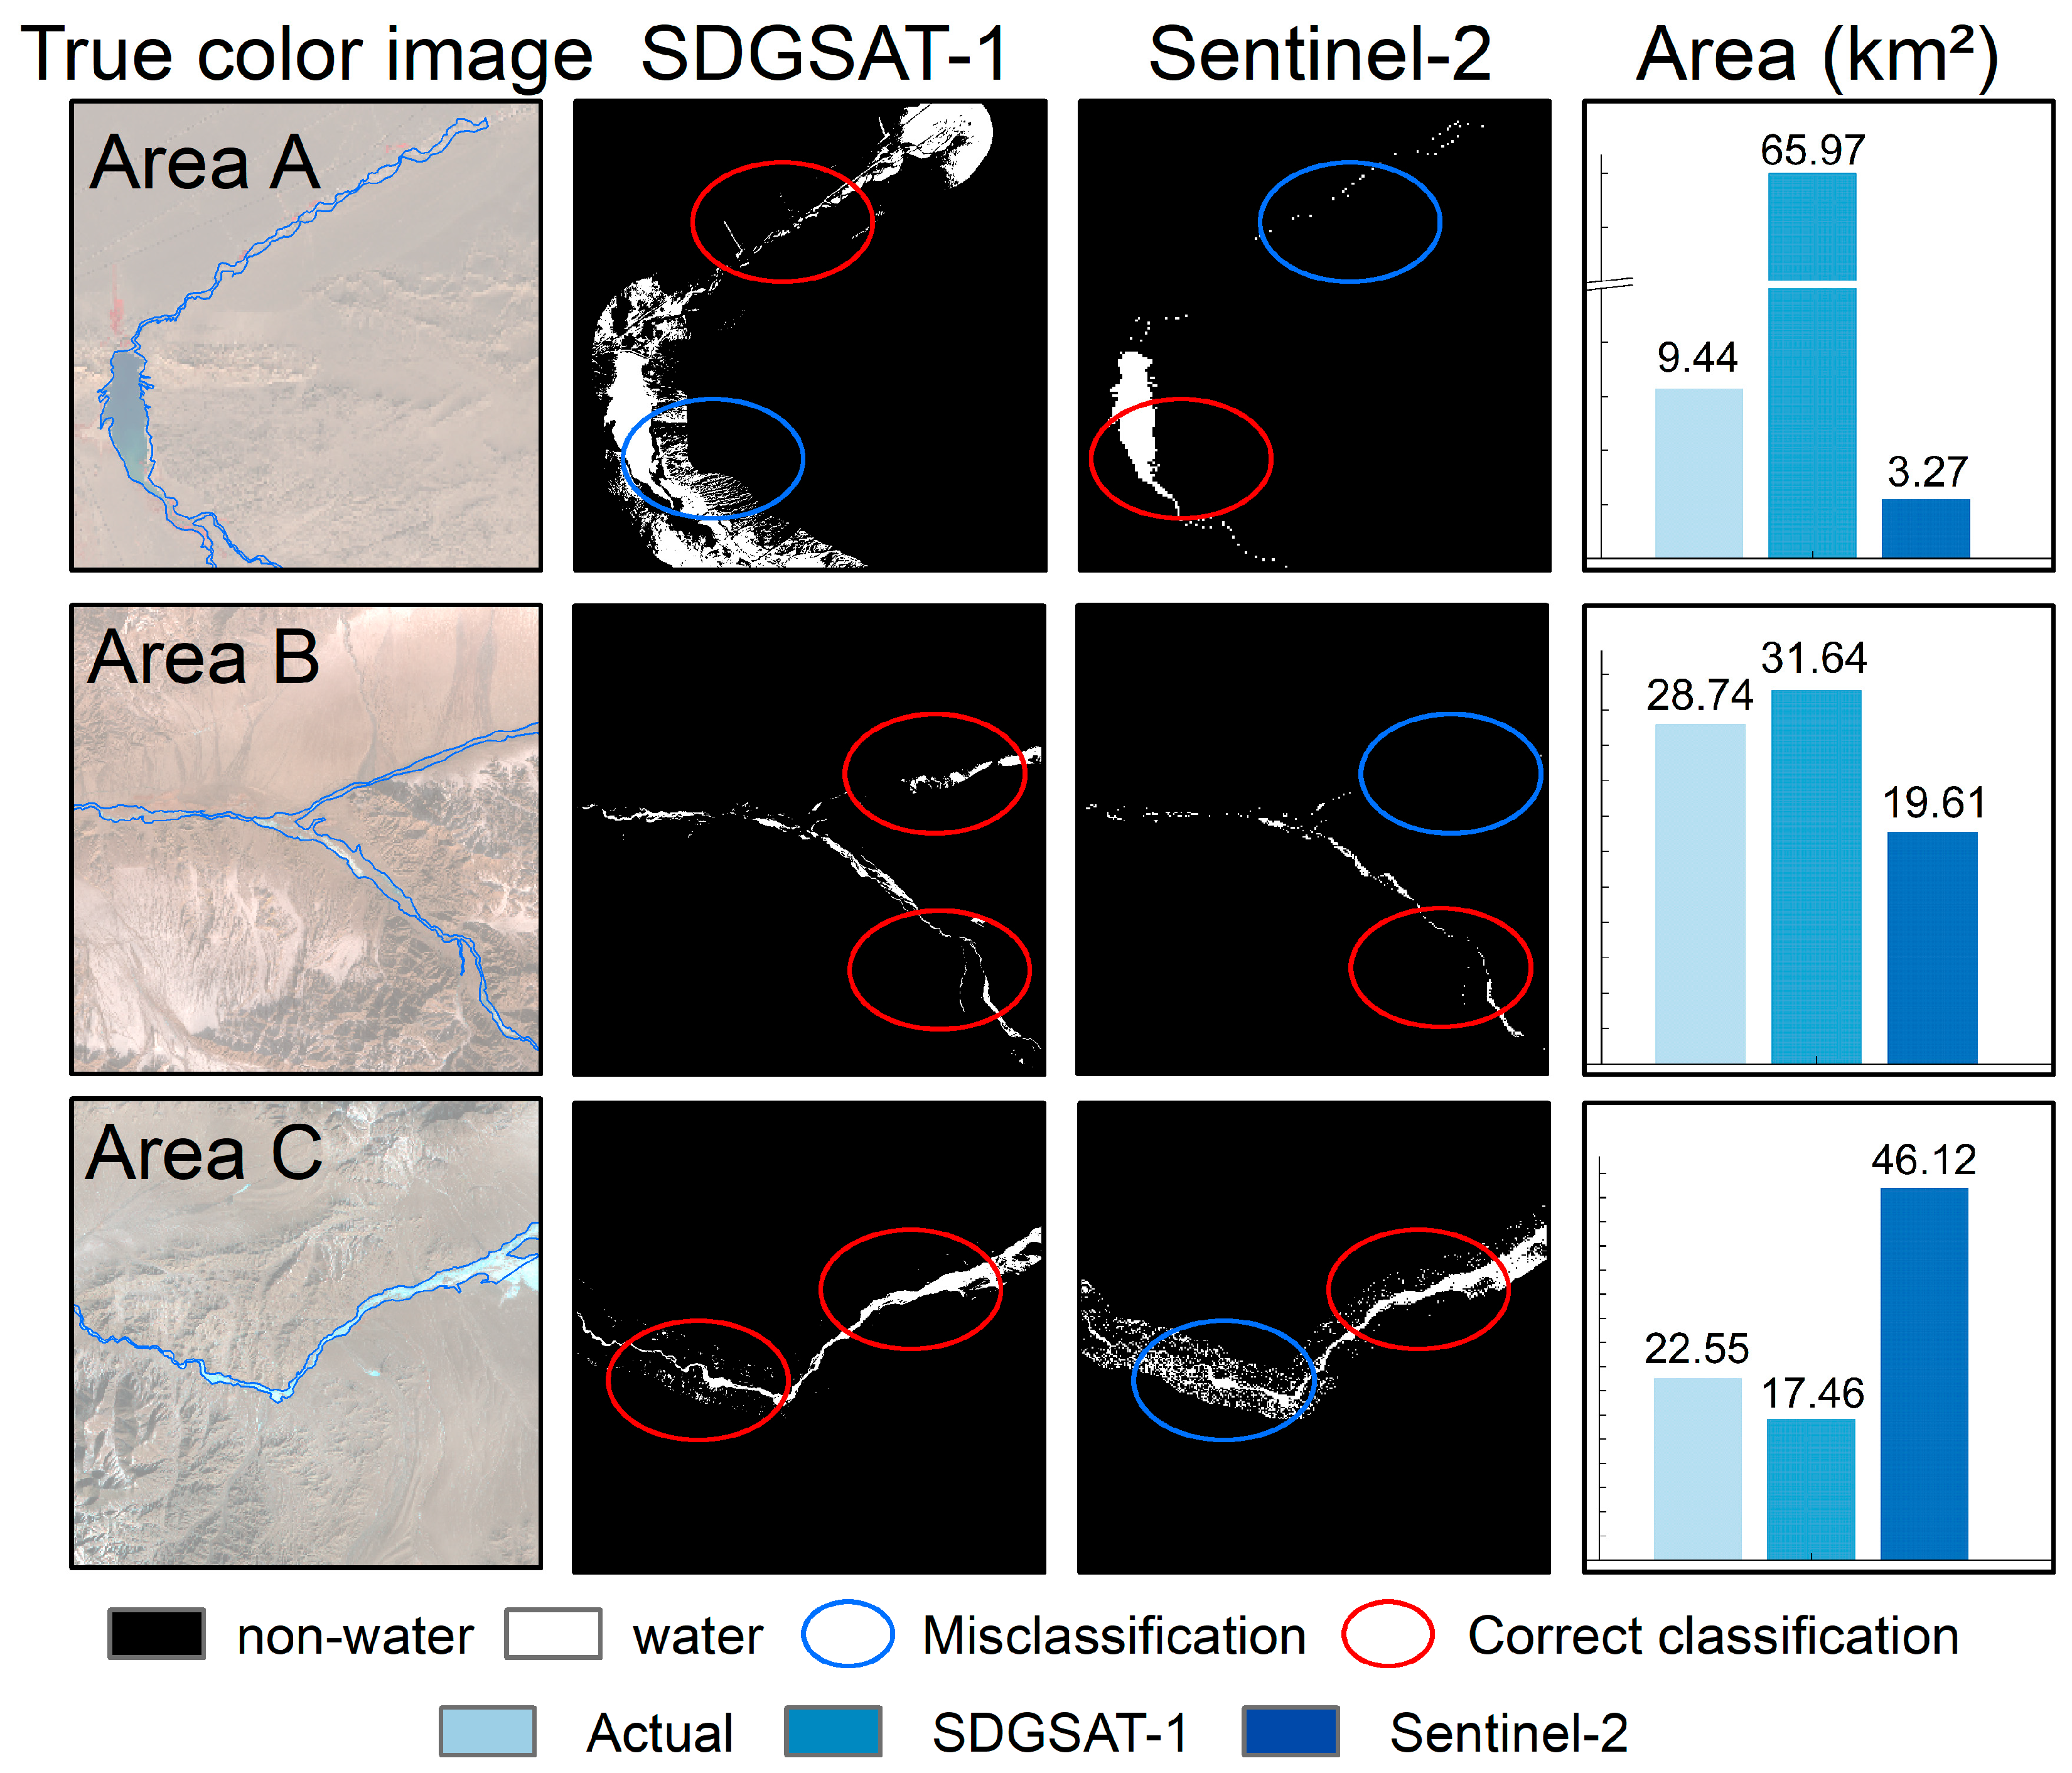
5.2. Performance Comparison of SDGSAT-1 and Sentinel-2

The Sentinel-2 satellite, armed with high-performance hyperspectral capabilities, stands as a globally accessible platform, offering a broadened spectral range that significantly enhances spectral discrimination. The inherent spectral attributes of surface features serve as robust markers across diverse land cover types, pivotal for large-scale land cover identification. Extracting water body information across vast spatial scales often necessitates sophisticated background modeling. Consequently, the Sentinel-2 satellite unequivocally excels in extracting water body information due to its spectral capabilities [25]. However, in Area A, Sentinel-2 images reveal a notable degree of omission, with the extracted water area being significantly smaller than the actual water area (Table 5). Comparative analysis reveals minimal differences in extraction performance among three water indices using Sentinel-2 images [26]. Accuracy assessments pinpoint the NDWI as the optimal index for Sentinel-2 imagery, with overall accuracies of 0.77, 0.74, and 0.91, and Kappa coefficients of 0.203, 0.244, and 0.461 across three areas, respectively. The extraction accuracy of the NDWI and MNDWI surpasses that of the SWI, with kappa in Area A being only 0.105. It is notable that in Sentinel-2’s spectral features, the first and third rankings are also occupied by the short-wave infrared bands (Band 11 and Band 12). When it comes to the visual interpretation of water bodies, the near-infrared (NIR) band is typically preferred due to its strong absorption by water and its pronounced reflection by terrestrial vegetation and dry soil. This highlights the substantial impact that the distinctive bands of these two satellites have on the classification results [22].
To comprehensively assess the performance of SDGSAT-1 imagery in river extraction, a comparative analysis was conducted between the SWI of SDGSAT-1 and the NDWI results of Sentinel-2 (Figure 7). Notably, in terms of extraction accuracy and detail depiction, SDGSAT-1’s SWI excelled, particularly in regions B and C. It not only extracted water body areas more precisely but also delineated water contours and internal details with greater finesse. This advantage mainly stems from the high resolution and advanced image processing algorithms of SDGSAT-1 imagery, enabling it to better capture subtle surface changes and complex water features. However, in Area A, the SWI demonstrated a limited capacity to distinguish water bodies from adjacent land, resulting in the extraction area far exceeding the actual extraction area. This was primarily due to the complexity of the area’s specific terrain, lighting conditions, and surface cover types. These factors resulted in significant spectral similarities between water bodies and the surrounding land, increasing the difficulty of extraction. To address this issue, further optimization of the SWI algorithm or the integration of other auxiliary data and information may be necessary to improve extraction accuracy. Contrastingly, Sentinel-2’s NDWI exhibited greater volatility and instability in extraction results. In areas A and B, only a portion of the water is extracted, while in Area C, the extraction is significantly impacted by mountain shadows. While Sentinel-2 also possesses widespread application value, it may be more suitable for large-scale water body monitoring and mapping, with relatively limited application in small-scale or complex terrain conditions. Furthermore, combining information from Figure 6 reveals a flat box in Area A, indicating a relatively isolated distribution of water bodies in this region due to the narrow main river channel and distinct characteristics of the Dang River Reservoir. This underscores the potential of SDGSAT-1 satellite images in extracting narrow river channels, offering superior delineation of water body contours and details compared to Sentinel-2.
The study delved into SDGSAT-1’s performance in extracting river features, revealing substantial accuracy declines in the Dang River’s complex terrain despite its high-resolution imagery and efficient water body indices. The Dang River Basin predominantly resides in the transition zone between the Qinghai–Tibet and Mongolian Plateaus, inheriting their distinct natural attributes and being characterized by intricate terrain. The study’s focal area traverses mountainous regions, where mountain shadows pose a pivotal constraint on water extraction accuracy. Despite demonstrating a level of precision in water body detection, the employed confidence thresholding method encounters limitations in precisely delineating river boundaries within the complex and dynamic hydrological environment of the Dang River, underscoring the challenges of technological applications in such contexts. Advanced algorithms such as machine learning or set thresholds for different regions of the river can be used to improve the confidence threshold in the future [27]. The study also suggests optimizing current water body indices by incorporating factors such as turbidity impacts or proposing improved water indices based on satellite band settings. Moreover, integrating SDGSAT-1’s data with other sources, such as radar, LiDAR, and ground observations, can offer a more comprehensive and accurate view of the river’s characteristics [28]. Dedicated preprocessing steps to mitigate the effects of mountain shadows, vegetation cover, and other spectral interferences are also recommended. Ultimately, implementing a continual monitoring and updating framework ensures river extraction aligns with dynamic environmental shifts, vital for water management and environmental protection.

6. Conclusions

The launch of SDGSAT-1 in 2021 represents a notable technological advancement, as it features multiple sensors and boasts a high resolution of 10 m. This satellite serves as an advanced technological instrument for studying human activities and water resource environments [18]. Utilizing Sentinel-2 data, this study evaluates the capabilities of SDGSAT-1 data in extracting water resources, using the Dang River on the QTP, which has a complex environmental setting, as the study area. This leads to the following conclusions:
(1)
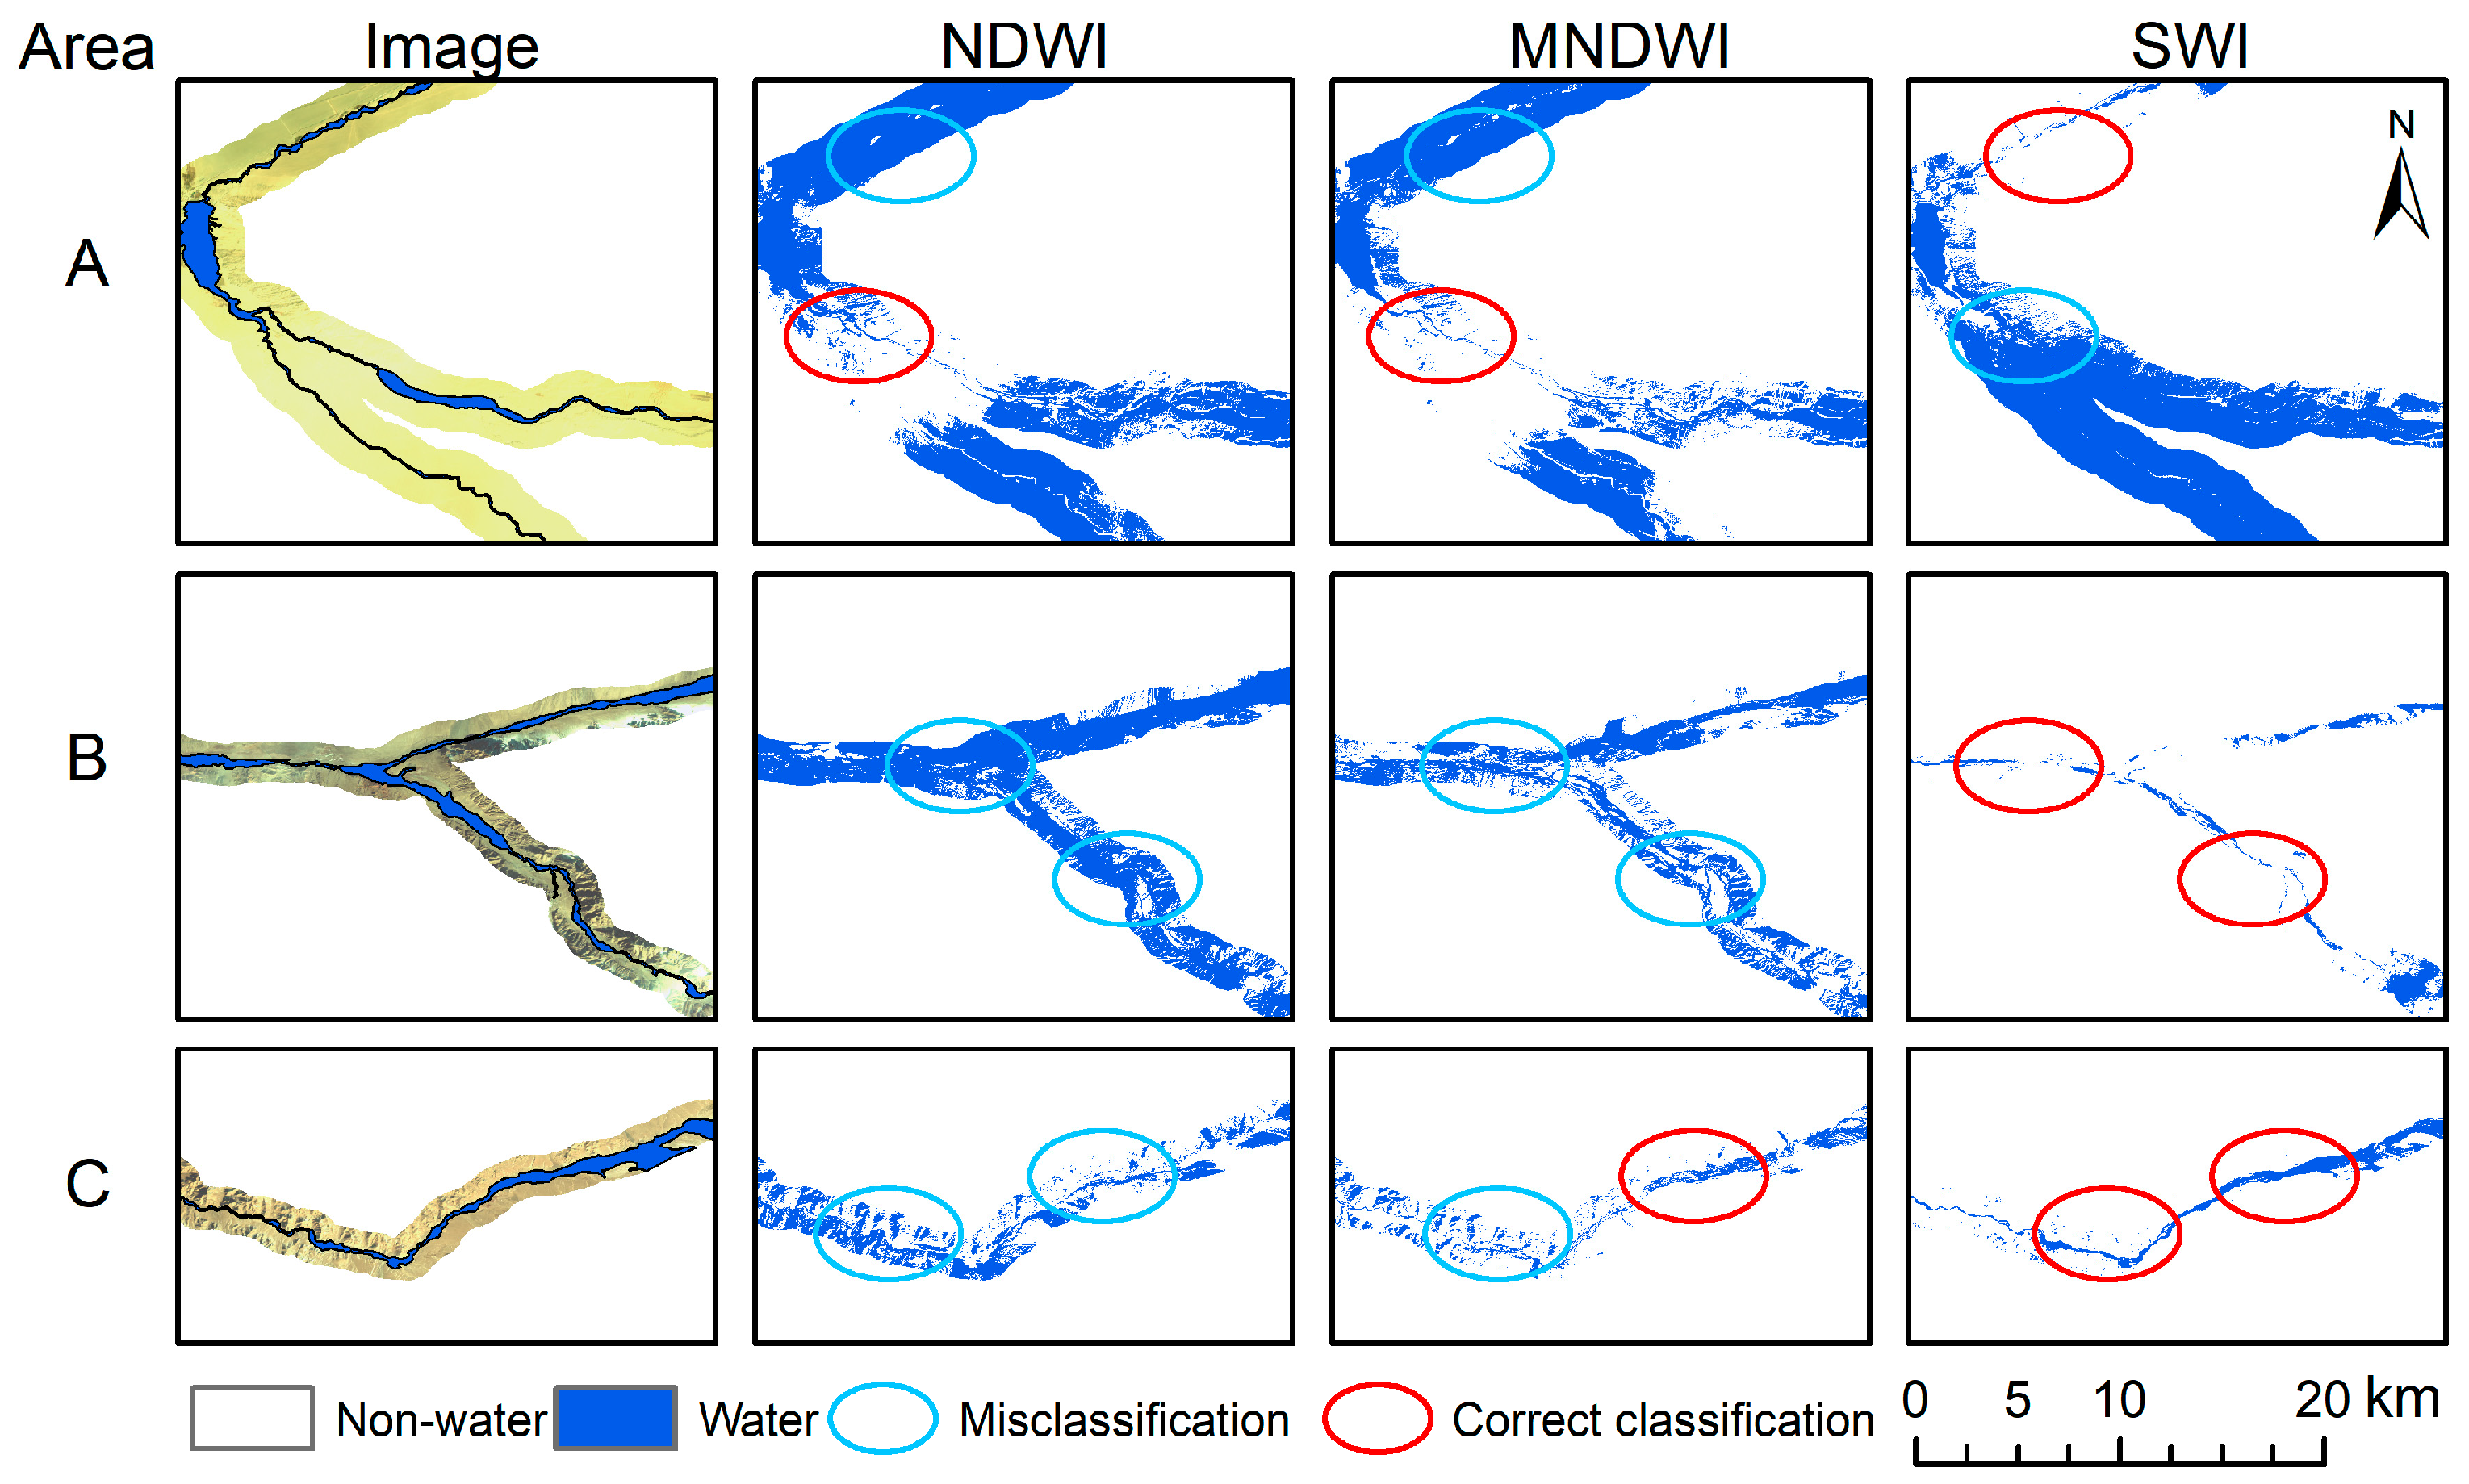
SDGSAT-1 and Sentinel-2 images exhibit strengths and weaknesses in extracting the Dang River. Equipped with two blue bands, the multi-spectral imager of SDGSAT-1 can accurately depict water characteristics vital to SDGSAT-1 studies. When paired with SWI, it effectively negated the influence of mountain shadows, highlighting the unique features of the Dang River. Conversely, Sentinel-2 excels in extracting water bodies within narrow areas, which is particularly evident in Area A.
(2)
The NDWI and MNDWI show similar accuracy in extracting the Dang River. NDWI demonstrates proficiency in delineating a broader spectrum of water bodies, whereas the MNDWI minimized shadow interference. Although the SWI’s performance in delineating water bodies on Sentinel-2 is satisfactory, the river extracted from SDGSAT-1 exhibits superior precision, with a clear outline and minimal shadow interference.
(3)
Different thresholding methods are tailored to specific river characteristics. In regions where rivers are prominently featured, water bodies were accurately delineated using the single threshold method and Otsu methods. For narrow river widths, the visual interpretation method was employed to advantage, while areas affected by mountain shadows were effectively managed utilizing the confidence thresholding method. The confidence thresholding method has proven effective for extracting water bodies from SDGSAT-1 data. With complex datasets such as those from Sentinel-2, it is imperative to integrate additional techniques to enhance accuracy and efficiency.
The NDWI excels in river extraction in open areas, while the MNDWI and SWI demonstrate strengths in mountainous rivers and shadow removal, respectively. Integrating high-resolution SDGSAT-1 satellite imagery enhances water extraction accuracy and coverage, offering a viable solution for water resource management and environmental monitoring. This efficient and practical solution not only provides accurate and reliable water body information but also offers robust support for relevant decision-making, driving the in-depth development of water resource management and environmental monitoring efforts. In summary, SDGSAT-1 satellite imagery has demonstrated significant advantages and potential in river extraction. However, we also recognize that any extraction algorithm has certain limitations and applicable conditions. It is necessary to delve deeper into the optimal application strategies and methods of SDGSAT-1 imagery in river extraction, aiming to further enhance extraction accuracy and efficiency.

Author Contributions

Conceptualization, D.J.; methodology, D.J.; software, D.J.; validation, D.J.; formal analysis, D.J.; investigation, D.J.; resources, D.J.; data curation, D.J.; writing—original draft preparation, D.J.; writing—review and editing, C.H., D.J., Q.L. and Y.L.; visualization, D.J.; supervision, C.H.; project administration, C.H. and D.J.; funding acquisition, C.H. All authors have read and agreed to the published version of the manuscript.

Funding

This work was supported by the Natural Science Foundation of China (Grant No. U2243205).

Data Availability Statement

The data presented in this study are available on request from the author.

Conflicts of Interest

The authors declare no conflicts of interest.

References

  1. Huang, C.; Li, Y.; Tarpanelli, A.; Wang, N.; Chen, Y. Observing river discharge from space: Challenges and opportunities. Innov. Geosci. 2024, 2, 100076. [Google Scholar] [CrossRef]
  2. Li, D.; Wang, G.; Qin, C.; Wu, B. River Extraction under Bankfull Discharge Conditions Based on Sentinel-2 Imagery and DEM Data. Remote Sens. 2021, 13, 2650. [Google Scholar] [CrossRef]
  3. Li, W.; Du, Z.; Ling, F.; Zhou, D.; Wang, H.; Gui, Y.; Sun, B.; Zhang, X. A Comparison of Land Surface Water Mapping Using the Normalized Difference Water Index from TM, ETM+ and ALI. Remote Sens. 2013, 5, 5530–5549. [Google Scholar] [CrossRef]
  4. Liu, S.; Wu, Y.; Zhang, G.; Lin, N.; Liu, Z. Comparing Water Indices for Landsat Data for Automated Surface Water Body Extraction under Complex Ground Background: A Case Study in Jilin Province. Remote Sens. 2023, 15, 1678. [Google Scholar] [CrossRef]
  5. Cui, Z.; Ma, C.; Zhang, H.; Hu, Y.; Yan, L.; Dou, C.; Li, X.-M. Vicarious Radiometric Calibration of the Multispectral Imager Onboard SDGSAT-1 over the Dunhuang Calibration Site, China. Remote Sens. 2023, 15, 2578. [Google Scholar] [CrossRef]
  6. Hou, Y.; Xing, Q.; Zheng, X.; Sheng, D.; Wang, F. Monitoring Suspended Sediment Concentration in the Yellow River Estuary and Its Vicinity Waters on the Basis of SDGSAT-1 Multispectral Imager. Water 2023, 15, 3522. [Google Scholar] [CrossRef]
  7. Sharma, R.; Tateishi, R.; Hara, K.; Nguyen, L. Developing Superfine Water Index (SWI) for Global Water Cover Mapping Using MODIS Data. Remote Sens. 2015, 7, 13807–13841. [Google Scholar] [CrossRef]
  8. McFeeters, S.K. The Use of the Normalized Difference Water Index (NDWI) in the Delineation of Open Water Features. Int. J. Remote Sens. 1996, 17, 1425–1432. [Google Scholar] [CrossRef]
  9. Chandrababu Naik, B.; Anuradha, B. Extraction of Spread Surface Water Body Using Supervised and Unsupervised Classification Techniques. Int. J. Recent Technol. Eng. 2020, 8, 2345–2350. [Google Scholar]
  10. Paul, A.; Tripathi, D.; Dutta, D. Application and Comparison of Advanced Supervised Classifiers in Extraction of Water Bodies from Remote Sensing Images. Sustain. Water Resour. Manag. 2018, 4, 905–919. [Google Scholar] [CrossRef]
  11. Huang, C.; Yun, C.; Shi, Z.; Wu, J. Detecting, Extracting, and Monitoring Surface Water From Space Using Optical Sensors: A Review. Rev. Geophys. 2018, 56, 333–360. [Google Scholar] [CrossRef]
  12. Xiong, L.; Deng, R.; Li, J.; Liu, X.; Qin, Y.; Liang, Y.; Liu, Y. Subpixel Surface Water Extraction (SSWE) Using Landsat 8 OLI Data. Water 2018, 10, 653. [Google Scholar] [CrossRef]
  13. Li, L.; Su, H.; Du, Q.; Wu, T. A Novel Surface Water Index Using Local Background Information for Long Term and Large-Scale Landsat Images. ISPRS J. Photogramm. Remote Sens. 2021, 172, 59–78. [Google Scholar] [CrossRef]
  14. Jiang, W.; Ni, Y.; Pang, Z.; Li, X.; Ju, H.; He, G.; Lv, J.; Yang, K.; Fu, J.; Qin, X. An Effective Water Body Extraction Method with New Water Index for Sentinel-2 Imagery. Water 2021, 13, 1647. [Google Scholar] [CrossRef]
  15. Xu, H. Modification of Normalised Difference Water Index (NDWI) to Enhance Open Water Features in Remotely Sensed Imagery. Int. J. Remote Sens. 2006, 27, 3025–3033. [Google Scholar] [CrossRef]
  16. Li, C.; Wang, S.; Bai, X.; Tan, Q.; Yang, Y.; Li, Q.; Wu, L.; Xiao, J.; Qian, Q.; Chen, F.; et al. New Automated Method for Extracting River Information Using Optimized Spectral Threshold Water Index. Arab. J. Geosci. 2019, 12, 13. [Google Scholar] [CrossRef]
  17. Anonymous. Transforming Our World: The 2030 Agenda for Sustainable Development. Civ. Eng. Mag. S. Afr. Inst. Civ. Eng. 2016, 24, 26–30. [Google Scholar]
  18. Liu, L.; Li, Q.; Niu, Z.; Huo, X. Comparative Study on Information Extraction of Urban Wetlands and Its Thermal Environment Using the SDGSAT-1 Data. Int. J. Digit. Earth 2024, 17, 2310728. [Google Scholar] [CrossRef]
  19. Van Der Meer, F.D.; Van Der Werff, H.M.A.; Van Ruitenbeek, F.J.A. Potential of ESA’s Sentinel-2 for Geological Applications. Remote Sens. Environ. 2014, 148, 124–133. [Google Scholar] [CrossRef]
  20. Drusch, M.; Del Bello, U.; Carlier, S.; Colin, O.; Fernandez, V.; Gascon, F.; Hoersch, B.; Isola, C.; Laberinti, P.; Martimort, P.; et al. Sentinel-2: ESA’s Optical High-Resolution Mission for GMES Operational Services. Remote Sens. Environ. 2012, 120, 25–36. [Google Scholar] [CrossRef]
  21. Cai, L.; Tang, D.; Li, C. An Investigation of Spatial Variation of Suspended Sediment Concentration Induced by a Bay Bridge Based on Landsat TM and OLI Data. Adv. Space Res. 2015, 56, 293–303. [Google Scholar] [CrossRef]
  22. Hai, W.; Shen, Y.; Liang, L.; Yu, Y.; Yan, Y.; Guang, L. River Extraction from Remote Sensing Images in Cold and Arid Regions Based on Attention Mechanism. Wirel. Commun. Mob. Comput. 2022, 2022, 9410381. [Google Scholar]
  23. Hancock, G.R. The Use of Digital Elevation Models in the Identification and Characterization of Catchments over Different Grid Scales. Hydrol. Process. 2005, 19, 1727–1749. [Google Scholar] [CrossRef]
  24. Liu, X.; Deng, R.; Xu, J.; Zhang, F. Coupling the Modified Linear Spectral Mixture Analysis and Pixel-Swapping Methods for Improving Subpixel Water Mapping: Application to the Pearl River Delta, China. Water 2017, 9, 658. [Google Scholar] [CrossRef]
  25. Ngoc, D.D.; Loisel, H.; Jamet, C.; Vantrepotte, V.; Duforêt-Gaurier, L.; Minh, C.D.; Mangin, A. Coastal and Inland Water Pixels Extraction Algorithm (WiPE) from Spectral Shape Analysis and HSV Transformation Applied to Landsat 8 OLI and Sentinel-2 MSI. Remote Sens. Environ. 2019, 223, 208–228. [Google Scholar] [CrossRef]
  26. Li, X.; Lyu, X.; Tong, Y.; Li, S.; Liu, D. An Object-Based River Extraction Method via Optimized Transductive Support Vector Machine for Multi-Spectral Remote-Sensing Images. IEEE Access 2019, 7, 46165–46175. [Google Scholar] [CrossRef]
  27. Almarines, N.R.; Hashimoto, S.; Pulhin, J.M.; Tiburan, C.L.; Magpantay, A.T.; Saito, O. Influence of Image Compositing and Multisource Data Fusion on Multitemporal Land Cover Mapping of Two Philippine Watersheds. Remote Sens. 2024, 16, 2167. [Google Scholar] [CrossRef]
  28. Smets, L.; Van Leekwijck, W.; Tsang, I.J.; Latré, S. Training a Hyperdimensional Computing Classifier Using a Threshold on Its Confidence. Neural Comput. 2023, 35, 2006–2023. [Google Scholar] [CrossRef]
Figure 1. Schematic illustration of study area: (a) location of the Dang River; (bd) three test sites corresponding to A, B, and C in (a).
Remotesensing 16 02716 g001
Figure 2. Flow chart of methodology.
Remotesensing 16 02716 g002
Figure 3. Dang River extraction in three areas of SDGSAT-1 image.
Remotesensing 16 02716 g003
Figure 4. Extraction accuracy of Dang River water body in the three test areas.
Remotesensing 16 02716 g004
Figure 5. River distribution results of four threshold methods on SDGSAT-1 image.
Remotesensing 16 02716 g005
Figure 6. Boxplot of water index value distribution in the three test areas (S2-A represents Area A on Sentinel-2 image, SDG-A represents Area A on SDGSAT-1 image, and so forth).
Remotesensing 16 02716 g006
Figure 7. Extraction results of Dang River water body with different thresholds.
Remotesensing 16 02716 g007
Table 1. The band spectral information of SDGSAT-1 and Sentinel-2 images.
SDGSAT-1 MSISentinel-2 MSI
DescriptionCenter Wavelength (nm)Resolution (m)DescriptionCenter Wavelength (nm)Resolution (m)
B1 (Deep Blue1)400.6310B1 (Coastal)44360
B2 (Deep Blue2)438.4710B2 (Blue)49010
B3 (Blue)495.1010B3 (Green)56010
B4 (Green)553.2310B4 (Red)66510
B5 (Red)656.7510B5/B6/B7 (Red Edge)705/740/78320
B6 (NIR)776.1210B8 (NIR)84210
B7 (SWIR)854.0210B8A (Red Edge)86520
B9 (Water vapor)94560
B10 (SWIR-Cirrus)137560
B11 (SWIR-1)161020
B12 (SWIR-2)219020
Table 2. Three water indices used to extract water bodies.
Name of the FeaturesCalculation Formulas
Normalized Differential Water Body Index [8]
(NDWI)
N D W I = G R E E N N I R G R E E N + N I R
Normalized Difference Water Index [15]
(MNDWI)
M N D W I = G R E E N S W I R G R E E N + S W I R
Shaded Water Body Index [14]
(SWI)
S W I = B L U E + G R E E N N I R
Table 3. River water extraction threshold.
ImageIndexValue
NDWI−0.0513
Sentinel-2MNDWI0.1576
SWI3500.9000
NDWI0.2349
SDGSAT-1MNDWI0.1589
SWI4494.3200
Table 4. Dang River extraction area in three areas of SDGSAT-1 image.
IndexArea AArea BArea C
Actual (km2)9.436928.741822.5541
NDWI (km2)67.7812114.559951.1401
MNDWI (km2)50.692368.450021.6155
SWI (km2)65.970131.640317.4584
Table 5. Dang River extraction area in three areas of Sentinel-2 image.
IndexArea AArea BArea C
Actual (km2)9.436928.741822.5541
NDWI (km2)3.268819.609246.1160
MNDWI (km2)2.253633.537638.1852
SWI (km2)1.396818.950430.1068
Disclaimer/Publisher’s Note: The statements, opinions and data contained in all publications are solely those of the individual author(s) and contributor(s) and not of MDPI and/or the editor(s). MDPI and/or the editor(s) disclaim responsibility for any injury to people or property resulting from any ideas, methods, instructions or products referred to in the content.

