Article

Preliminary Assessment of On-Orbit Radiometric Calibration Challenges in NOAA-21 VIIRS Reflective Solar Bands (RSBs)

by
Taeyoung Choi
1,*,
Changyong Cao
2,
Slawomir Blonski
1,
Xi Shao
3,
Wenhui Wang
3 and
Khalil Ahmad
1
1
Global Science & Technology (GST), College Park, MD 20740, USA
2
NOAA NESDIS/STAR/SMCD, College Park, MD 20740, USA
3
Cooperative Institute for Satellite Earth System Studies (CISESS), University of Maryland, College Park, MD 20740, USA
*
Author to whom correspondence should be addressed.
Remote Sens. 2024, 16(15), 2737; https://doi.org/10.3390/rs16152737
Submission received: 29 May 2024 / Revised: 18 July 2024 / Accepted: 22 July 2024 / Published: 26 July 2024
(This article belongs to the Collection The VIIRS Collection: Calibration, Validation, and Application)

Abstract

:
The National Oceanic and Atmospheric Administration (NOAA) 21 Visible Infrared Imaging Radiometer Suite (VIIRS) was successfully launched on 10 November 2022. To ensure the required instrument performance, a series of Post-Launch Tests (PLTs) were performed and analyzed. The primary calibration source for NOAA-21 VIIRS Reflective Solar Bands (RSBs) is the Solar Diffuser (SD), which retains the prelaunch radiometric calibration standard from prelaunch to on-orbit. Upon reaching orbit, the SD undergoes degradation as a result of ultraviolet solar illumination. The rate of SD degradation (called the H-factor) is monitored by a Solar Diffuser Stability Monitor (SDSM). The initial H-factor’s instability was significantly improved by deriving a new sun transmittance function from the yaw maneuver and one-year SDSM data. The F-factors (normally represent the inverse of instrument gain) thus calculated for the Visible/Near-Infrared (VISNIR) bands were proven to be stable throughout the first year of the on-orbit operations. On the other hand, the Shortwave Infrared (SWIR) bands unexpectedly showed fast degradation, which is possibly due to unknown substance accumulation along the optical path. To mitigate these SWIR band gain changes, the NOAA VIIRS Sensor Data Record (SDR) team used an automated calibration software package called RSBautoCal. In March 2024, the second middle-mission outgassing event to reverse SWIR band degradation was shown to be successful and its effects are closely monitored. Finally, the deep convective cloud trends and lunar collection results validated the operational F-factors. This paper summarizes the preliminary on-orbit radiometric calibration updates and performance for the NOAA-21 VIIRS SDR products in the RSB.

1. Introduction

The third Visible Infrared Imaging Radiometer Suite (VIIRS) instrument in the Joint Polar Satellite System (JPSS) series was successfully launched onboard the National Oceanic and Atmospheric Administration’s (NOAA’s) NOAA-21 satellite on 10 November 2022. It provides continuous Earth observations in the afternoon (local equator crossing time of approximately 1:30 p.m. in the ascending node) sun-synchronous orbit as a part of the JPSS program established in the year 2010 by restructuring the National Polar-orbiting Environmental Satellite System (NPOESS) program [1]. Under the JPSS program, NASA and NOAA teams conducted extensive checks of the instruments and performed extensive engineering evaluations [2,3,4]. During the Post-Launch Test (PLT) period, the teams led by government agencies, the academic sector, and a private company worked together to validate the performance of the instrument by analyzing the on-orbit engineering data from the On-Board Calibrators (OBCs), such as Solar Diffuser (SD), Solar Diffuser Stability Monitor (SDSM), and Blackbody (BB), for the 22 spectral band data covering a spectral range from 0.402 µm to 12.5 µm [5,6,7,8].
As a key Earth-observing instrument, VIIRS was integrated on the S-NPP, NOAA-20, and NOAA-21 satellites to produce Sensor Data Record (SDR) data for 27 Environment Data Records (EDRs) for the bio-geophysical parameters (as of 11 January 2023) [9]. Following a long heritage of legacy sensors, such as NASA’s Terra and Aqua Moderate-resolution Imaging Spectroradiometer (MODIS), and NOAA’s Advanced Very-High Resolution Radiometer (AVHRR), VIIRS was developed and designed to provide observations of the entire globe twice per day with moderate spatial resolutions and accurate on-orbit radiometric calibration capabilities from the on-board calibrators. VIIRS has 14 RSBs, 7 Thermal Emissive Bands (TEBs), and one Day Night Band (DNB). The Relative Spectral Response (RSR) functions as well as spatial and spectral characteristics of the NOAA-21 VIIRS RSBs are shown in Figure 1 and Table 1. The prelaunch measurements of the VIIRS spectral response functions were completed in 2019 using Spectral Measurement Assembly (SpMA) dual monochromators and NASA Goddard Space Flight Center’s (GSFC’s) Goddard Laser for an Absolute Measurement of Radiance (GLAMR) laser system [10]. There are spectral matching bands between Moderate (M) and Imaging (I) bands, such as I2/M7 and I3/M10, shown in Figure 1. The RSR and standard calibration parameters can be found at the NOAA Calibration Center (NCC) website at https://ncc.nesdis.noaa.gov/NOAA-21/index.php (accessed on 21 July 2024).
With the activation of the NOAA-21 VIIRS on 5 December 2022, the NOAA VIIRS team carried out on-orbit calibration and validation tasks with the on-board calibrator data of SD, SDSM, and BB [5,6]. The primary source of calibration of the RSBs are the SD observations once per orbit, whereas the time-dependent degradation of the SD is measured by the SDSM [13,14]. Detector dark offset values are estimated by viewing deep space through the Space View (SV) port as shown in Figure 2. Alternatively, monthly lunar calibration can be performed through the SV port to validate the SD-based calibration [14,15,16]. Due to the exposure to space radiations, such as ultraviolet (UV) and energetic particle radiation from the Sun, the surface reflectance property of SD called the Bidirectional Reflectance Distribution Function (BRDF) changes once the VIIRS instrument is inserted into the desired orbit [17,18,19]. Even though the SD BRDF was carefully measured in prelaunch calibrations, there were discrepancies from prelaunch characterizations when the SDSM sun attenuation screen transmittance function was measured from the post-launch yaw maneuvers for the S-NPP and NOAA-20 VIIRS cases [20,21,22,23].
The required calibration uncertainty in reflectance at the typical radiance should be less than 2 percent [24] and this requirement was met from the prelaunch laboratory testing results except M1 for NOAA-21 VIIRS [4]. The M1 high and low gain states showed slightly higher reflectance uncertainties of 2.36 and 2.30 percent, respectively [4]. Along with this reflectance uncertainty requirement for RSB, the on-orbit radiometric calibration performances and stability should be closely monitored in multiple ways, such as SD, lunar calibration, and vicarious-based methods.
This paper provides comprehensive overviews of the initial findings and decisions for on-orbit NOAA-21 VIIRS radiometric calibration in RSBs. In Section 2, the on-orbit radiometric calibration methodologies are reviewed using the SD and moon along with the Deep Convective Cloud (DCC) as a validation tool. Section 3 reports the initial issues related to SD degradation, comparisons of SD and lunar F-factor results, detailed decision procedures for operational F-factors in production, validation of radiometric stability using DCC trends, and ongoing issues. To resolve SD degradation instability, Appendix A provides corresponding detailed explanations and results combining yaw maneuver data and on-orbit SDSM datasets in Section 3.6. Yaw maneuvers are planned rotations of a spacecraft around its vertical axis, changing the orientation of its instruments. This adjustment allows for the measurement of different responses of SD/SDSM screens to solar illumination. Lastly, Section 4 summarizes the NOAA-21 VIIRS on-orbit radiometric calibration results with concluding remarks.

2. Brief Descriptions of On-Orbit Radiometric Calibrations

2.1. On-Orbit Solar Calibration

As mentioned in the introduction, the reference of on-orbit RSB calibration is based on SD observation and accounts for the SD BRDF to Rotating Telescope Assembly (RTA) view as measured in the prelaunch calibration. To reduce the intensity to a desired level, there is an SD Screen (SDS), as shown in Figure 2. Within the solar angle ranges of the so-called ‘sweet spot’ [16,25,26], which happens 14 or 15 times daily, the light reflected from the SD is observed by the VIIRS instrument through RTA to estimate detector responsivity changes.
Periodically, the SD BRDF degradation, i.e., the so-called H factor, can be measured by taking the ratio between the near-simultaneous observations of the sun and SD views by the SDSM. Initially, the SDSM was operated in every orbit from activation on 21 November 2022 until 8 December 2023. Then, it was reduced to every other orbit until 13 February 2023 followed by once per day until 26 February 2024 when the full year of SDSM measurements was completed. The current frequency of SDSM operations is weekly to save the mechanical movements of the step motor, which switches between the SD and sun views during its operation. The details of SD degradation and on-orbit calibration coefficient (or so-called F-factor) equations were explained in previous publications [14,27,28,29,30,31,32]. One important fact is that the SD BRDF was measured by the prelaunch calibration using a National Institute of Standards and Technology (NIST) tracible radiometric source (called PASCAL), which transfers the prelaunch standard to on-orbit [33].

2.2. On-Orbit Lunar Calibration

As shown in Figure 2, the VIIRS instrument can view the moon through the SV port before the EV scan. A specific spacecraft roll maneuver is required for each scheduled lunar observation to place the moon at the center of the SV port. To predict a possible lunar observation, the NOAA VIIRS team developed software based on NASA’s Jet Propulsion Laboratory’s (JPL’s) Navigation and Ancillary Information Facility (NAIF) SPICE package. The specific spacecraft roll angle and lunar observation time for S-NPP, NOAA-20, and NOAA-21 VIIRS are delivered to the NOAA Satellite Operational Facility (NSOF) to scheduled lunar collections. Once the scheduled lunar collection is performed, the Raw Data Record (RDR) granules around the collection time are visually checked to confirm the presence of the moon in the image for the successful lunar data collection
Apart from the VIIRS lunar observation, the expected lunar irradiance value for all the RSBs can be derived from the GIRO (GSICS Implementation of ROLO) model developed by the European Organization for the Exploitation of Meteorological Satellites (EUMETSAT) in collaboration with international agencies, such as USGS, NASA, JAXA, and NOAA. The GIRO model provides expected irradiance values for all of the VIIRS RSBs at the time of the scheduled lunar collection. By taking the ratio between the GIRO and observed lunar irradiances to account for factors such as lunar phase and sun–Earth distance variations, the long-term SD-based on-orbit calibrations for S-NPP and NOAA-20 VIIRS instruments were compared and the stabilities of VIIRS RSBs were validated [15,16,34,35,36].
Table 2 lists ten scheduled lunar collections with the date, collection center time, and phase angle information. After applying the sector rotation command, the location of the NOAA-21 moon observation in the EV frame was in the no-aggregation zone near frame number 322. The desired phase angle of the moon is around −51 degrees to reduce uncertainties from the illumination of different parts of the lunar surface. However, the lunar collections in March and June were near −60 degrees because of the lack of better observation opportunities. Out of the ten scheduled lunar collections, there was no spacecraft roll maneuver for the three collections in April, May, and June. For these lunar collections, the locations of the moon were slightly far away from the nominal frame number, which may increase the uncertainty of the lunar calibration.

2.3. On-Orbit RSB Stability Monitoring with DCC Trends

As a stable Earth target, DCC has been used to monitor the long-term stability of on-orbit sensors, especially in RSBs [37,38,39,40]. DCC targets are extremely cold clouds over the Inter-Tropical Convergence Zone (ITCZ) with near-Lambertian reflectance properties. Based on statistical filtering, DCC pixel detection criteria are specified [40,41] as shown below.
  • DCC pixels should have latitudes at ±25 degrees.
  • DCC pixels should have brightness temperatures less than 205 K in the VIIRS M15 band with a center wavelength at 10.7 µm.
  • The standard deviation of the temperature (in band M15) of the subject pixel and its eight neighboring pixels should be less than 1 K.
  • The standard deviation of reflectance of the subject pixel and its eight neighboring pixels should be less than 3 percent.
  • The solar zenith angle of the subject pixels should be less than 40 degrees.
  • The viewing zenith angle of the subject pixel should be less than 35 degrees.
Additionally, an Angular Distribution Model (ADM) developed by Hu et al. [37] is applied to correct the anisotropic correction of DCC pixels. The band-averaged mean and mode DCC statistics are calculated and used to evaluate the long-term stability.

3. Results

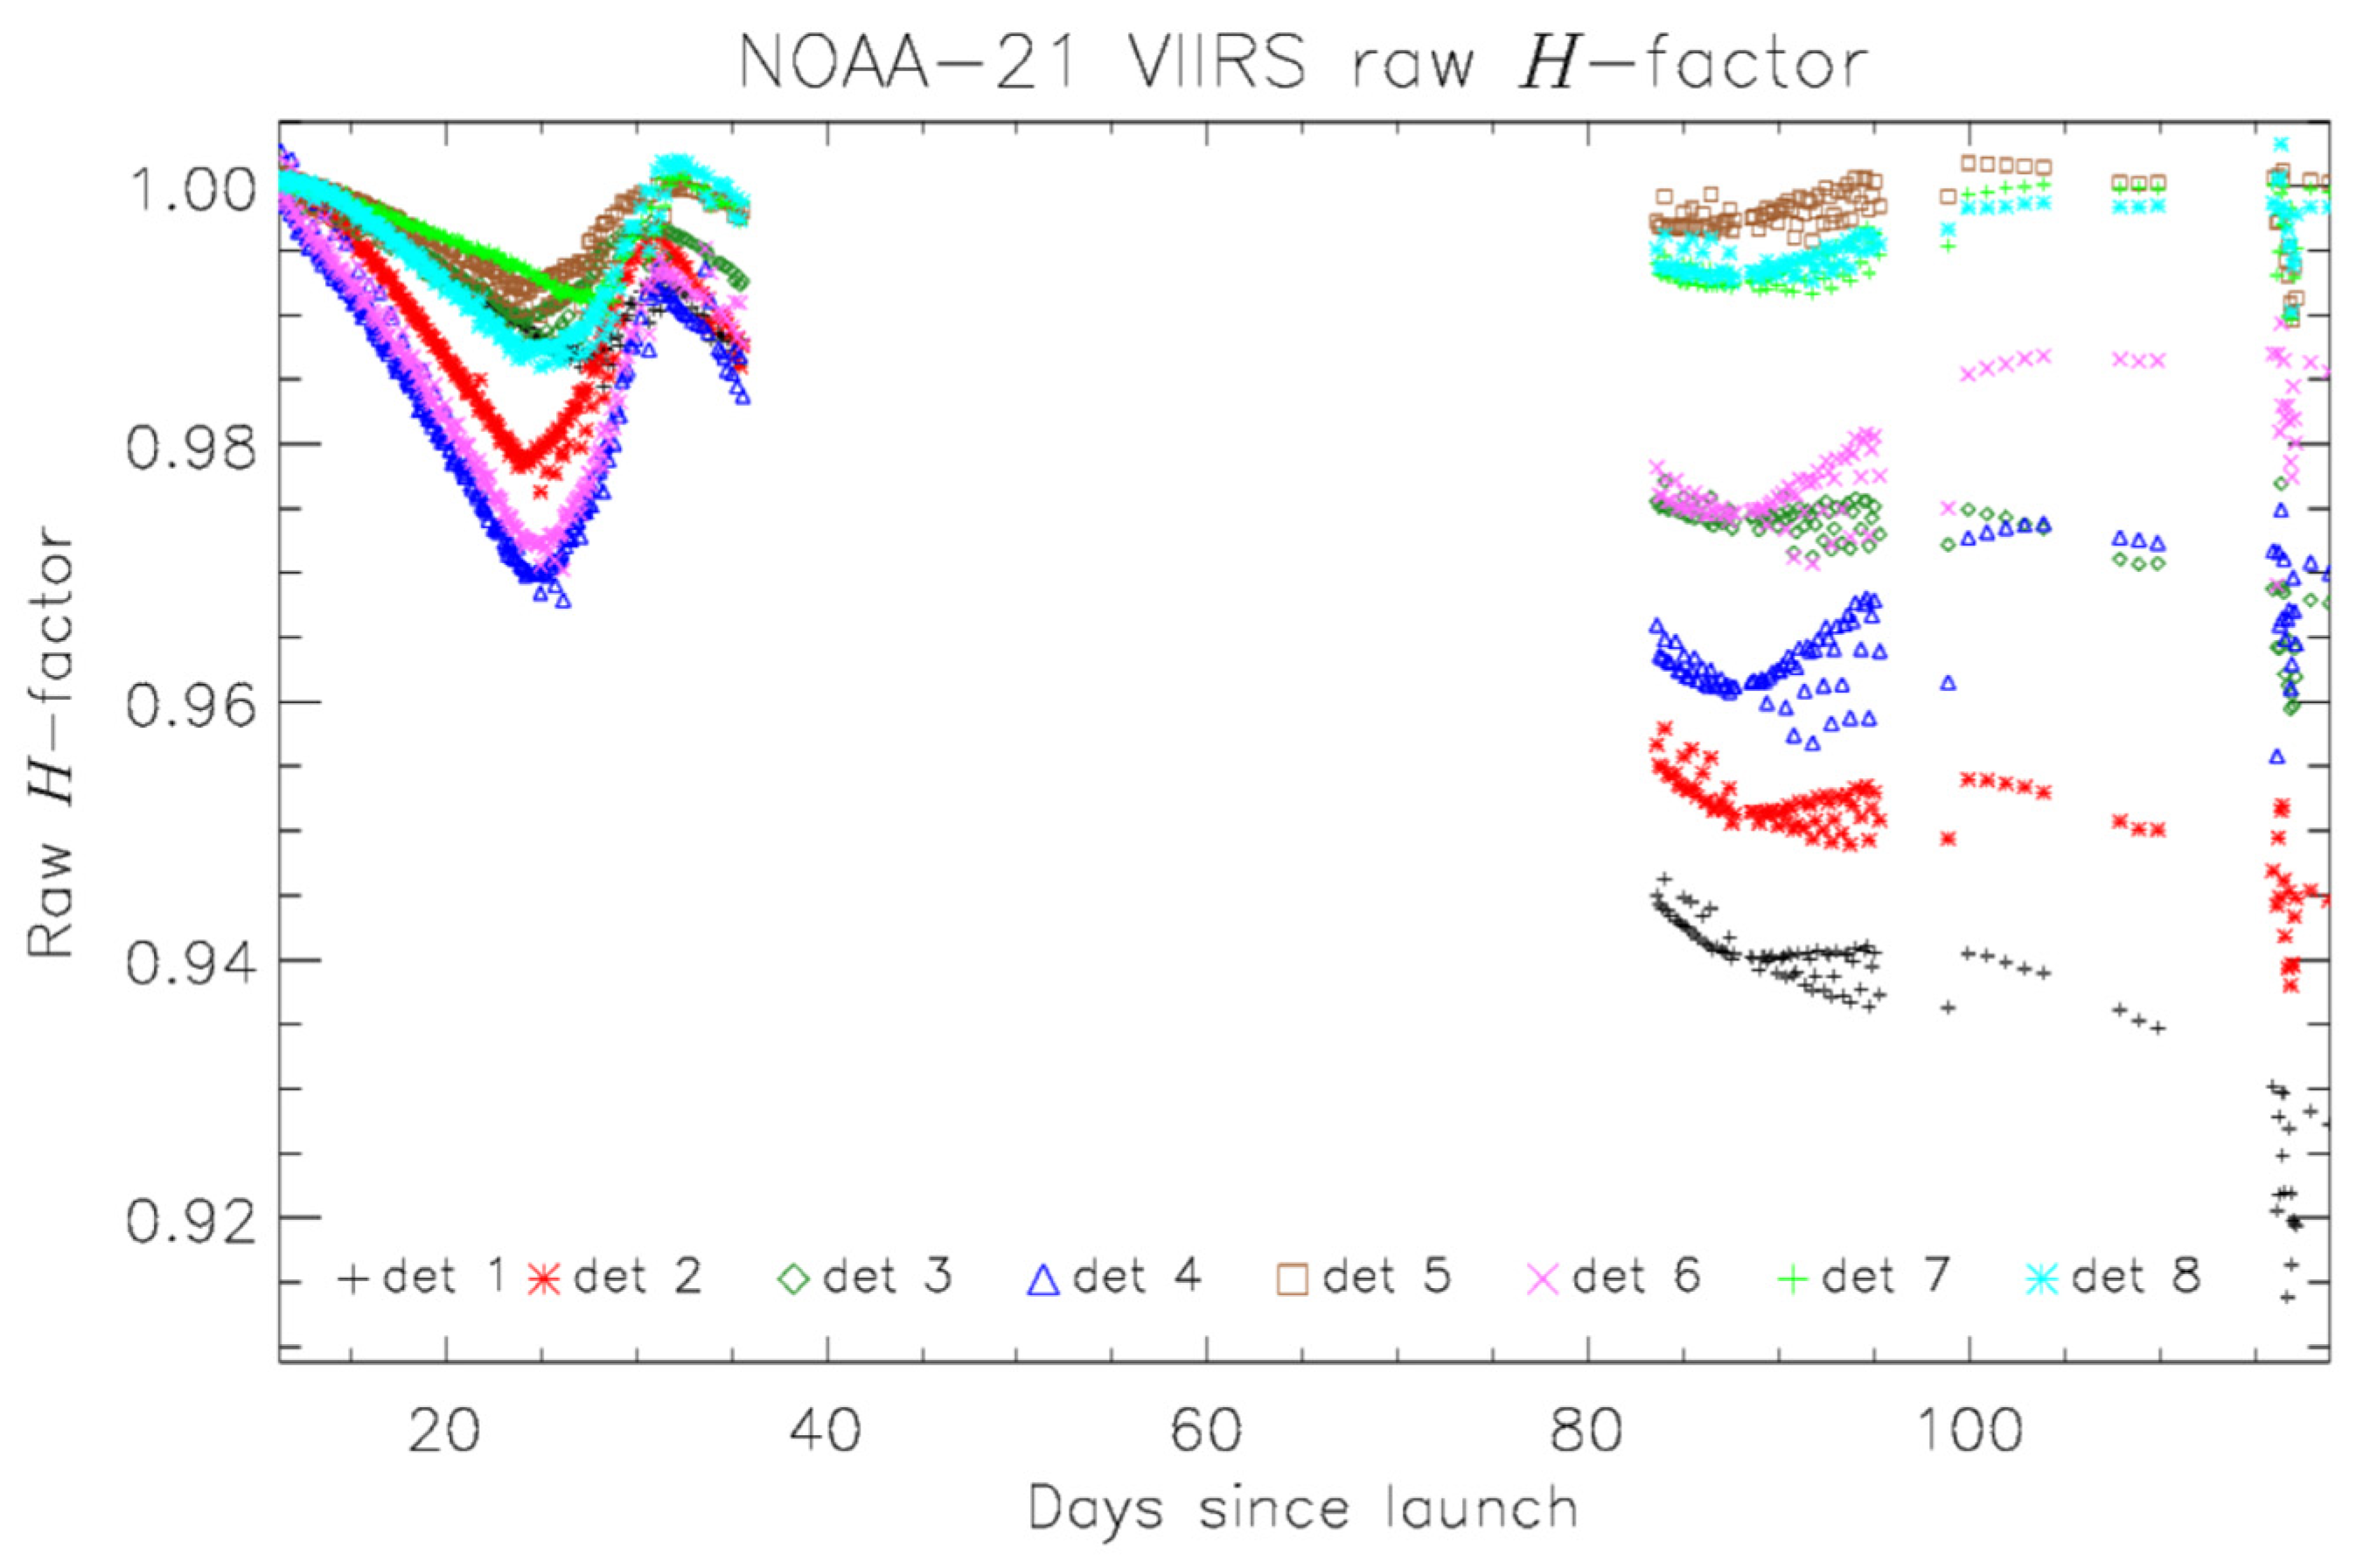
3.1. Initial SD Degradation (H-Factor) Estimates

Before estimating the on-orbit calibration coefficient, i.e., F-factors, the SD degradation needs to be calculated because the VIIRS observations include both detector degradation and SD degradation. The F-factor equation includes the H-factor in the numerator part to compensate for the amount of SD degradation in the observed SD radiance in the denominator part of the equation. An incorrect estimation of the H-factor will proportionally affect the F-factors and the final EV radiance and reflectance values.
The initial H-factors were calculated and shown in Figure 3 based on two Look-Up-Tables (LUTs) that were derived from prelaunch calibrations. There were more than one percent oscillations in the H-factor in all eight SDSM detectors. Similar H-factor instability issues were observed in S-NPP and NOAA-20 (or JPSS-1) VIIRS cases. For the H-factor calculation, the two screen LUT, τSDSM and τSDBRDFSDSM, functions are used. Similar to the S-NPP and NOAA-20 VIIRS cases [20,21], H-factor oscillations were caused by the inaccuracies in the prelaunch τSDSM LUT. The data gap from 16 December 2022 (Day Since Launch (DSL) 36) to 2 February 2023 (DSL 82) was caused by a satellite Ka-band transmitter anomaly and it was resolved by switching to the redundant side of the transmitter. There were no science data from solar calibrations during the transmitter anomaly period. As a result, all the PLTs were postponed until the anomaly was resolved.

3.2. Operational F-Factors for VIIRS SDR Product Generation in VISNIR Bands

During the post-launch calibration of VNIR channels, the operational F-factors (called F-PREDICTED LUTs) were determined to be constant values in all the detectors, Half-Angle Mirror (HAM) sides, gain states, and bands for the VISNIR bands (M1-M7, I1, and I2). The operational F-factors are calculated by the re-analysis of SD F-factors using RSBautoCal software included in the Algorithm Development Library (ADL) distribution of the Interface Data Processing Segment (IDPS) code [42]. RSBautoCal is an automated on-orbit calibration software implemented in the NOAA (National Oceanic and Atmospheric Administration) JPSS (Joint Polar Satellite System) operational data production system. In contrast, the F-PREDICTED LUT involves a series of manual updates as needed. Operational F-Factors were derived from the F-factors in 11–14 December 2022. This limited time span was selected due to the constraints imposed by initial NOAA-21 satellite orbit-raising campaigns and the sudden interruption of data availability after the Ka-band transmitter anomaly on 16 December 2022. Because of the uncertainty in SD reflectance monitoring, the degradation of SD reflectance was at first omitted from the analysis (by setting H = 1), and then approximately accounted for by extrapolating the trends to the launch date, under the assumption that the observed trends are not due to the degradation of the VIIRS radiometric response, but rather they are only due to SD degradation. While the extrapolation-derived corrections were as large as about 2%, for bands M1 and M2, the calculated values were shown to be stable, and there were no further updates of the F factors for VNIR bands, based on the relative stability of the Earth and lunar observations in these bands to date.
The only exception was the update for band M4 in low gain to correct striping that was observed in the NOAA-21 VIIRS band M4 images of convective clouds from tropical cyclones. Initial analysis showed that the scaling of M4 F-factors based on the re-analysis of solar calibrations or DCC observations did not reduce striping, which suggested that it is a non-linear problem in second-order prelaunch calibration coefficients. Further investigations revealed an issue in the analysis of the prelaunch calibration data, and after correction, an updated set of prelaunch delta C coefficients (which convert the SD bias removed digital number to radiance) for band M4 low gain was created together with the accompanying F factors. The striping in M4 images in low gain was largely reduced with the updated calibration coefficients.
Figure 4 shows examples of comparisons between the normalized offline SD F-factors, lunar F-factors, and operational F-factors in the VISNIR bands. While the offline F factors are discussed later in Appendix A, the lunar F-factors show a stable response over the one-year operation. As a result, the static operational F-factors, the red lines in Figure 4, are valid considering the lunar F-factor trends.

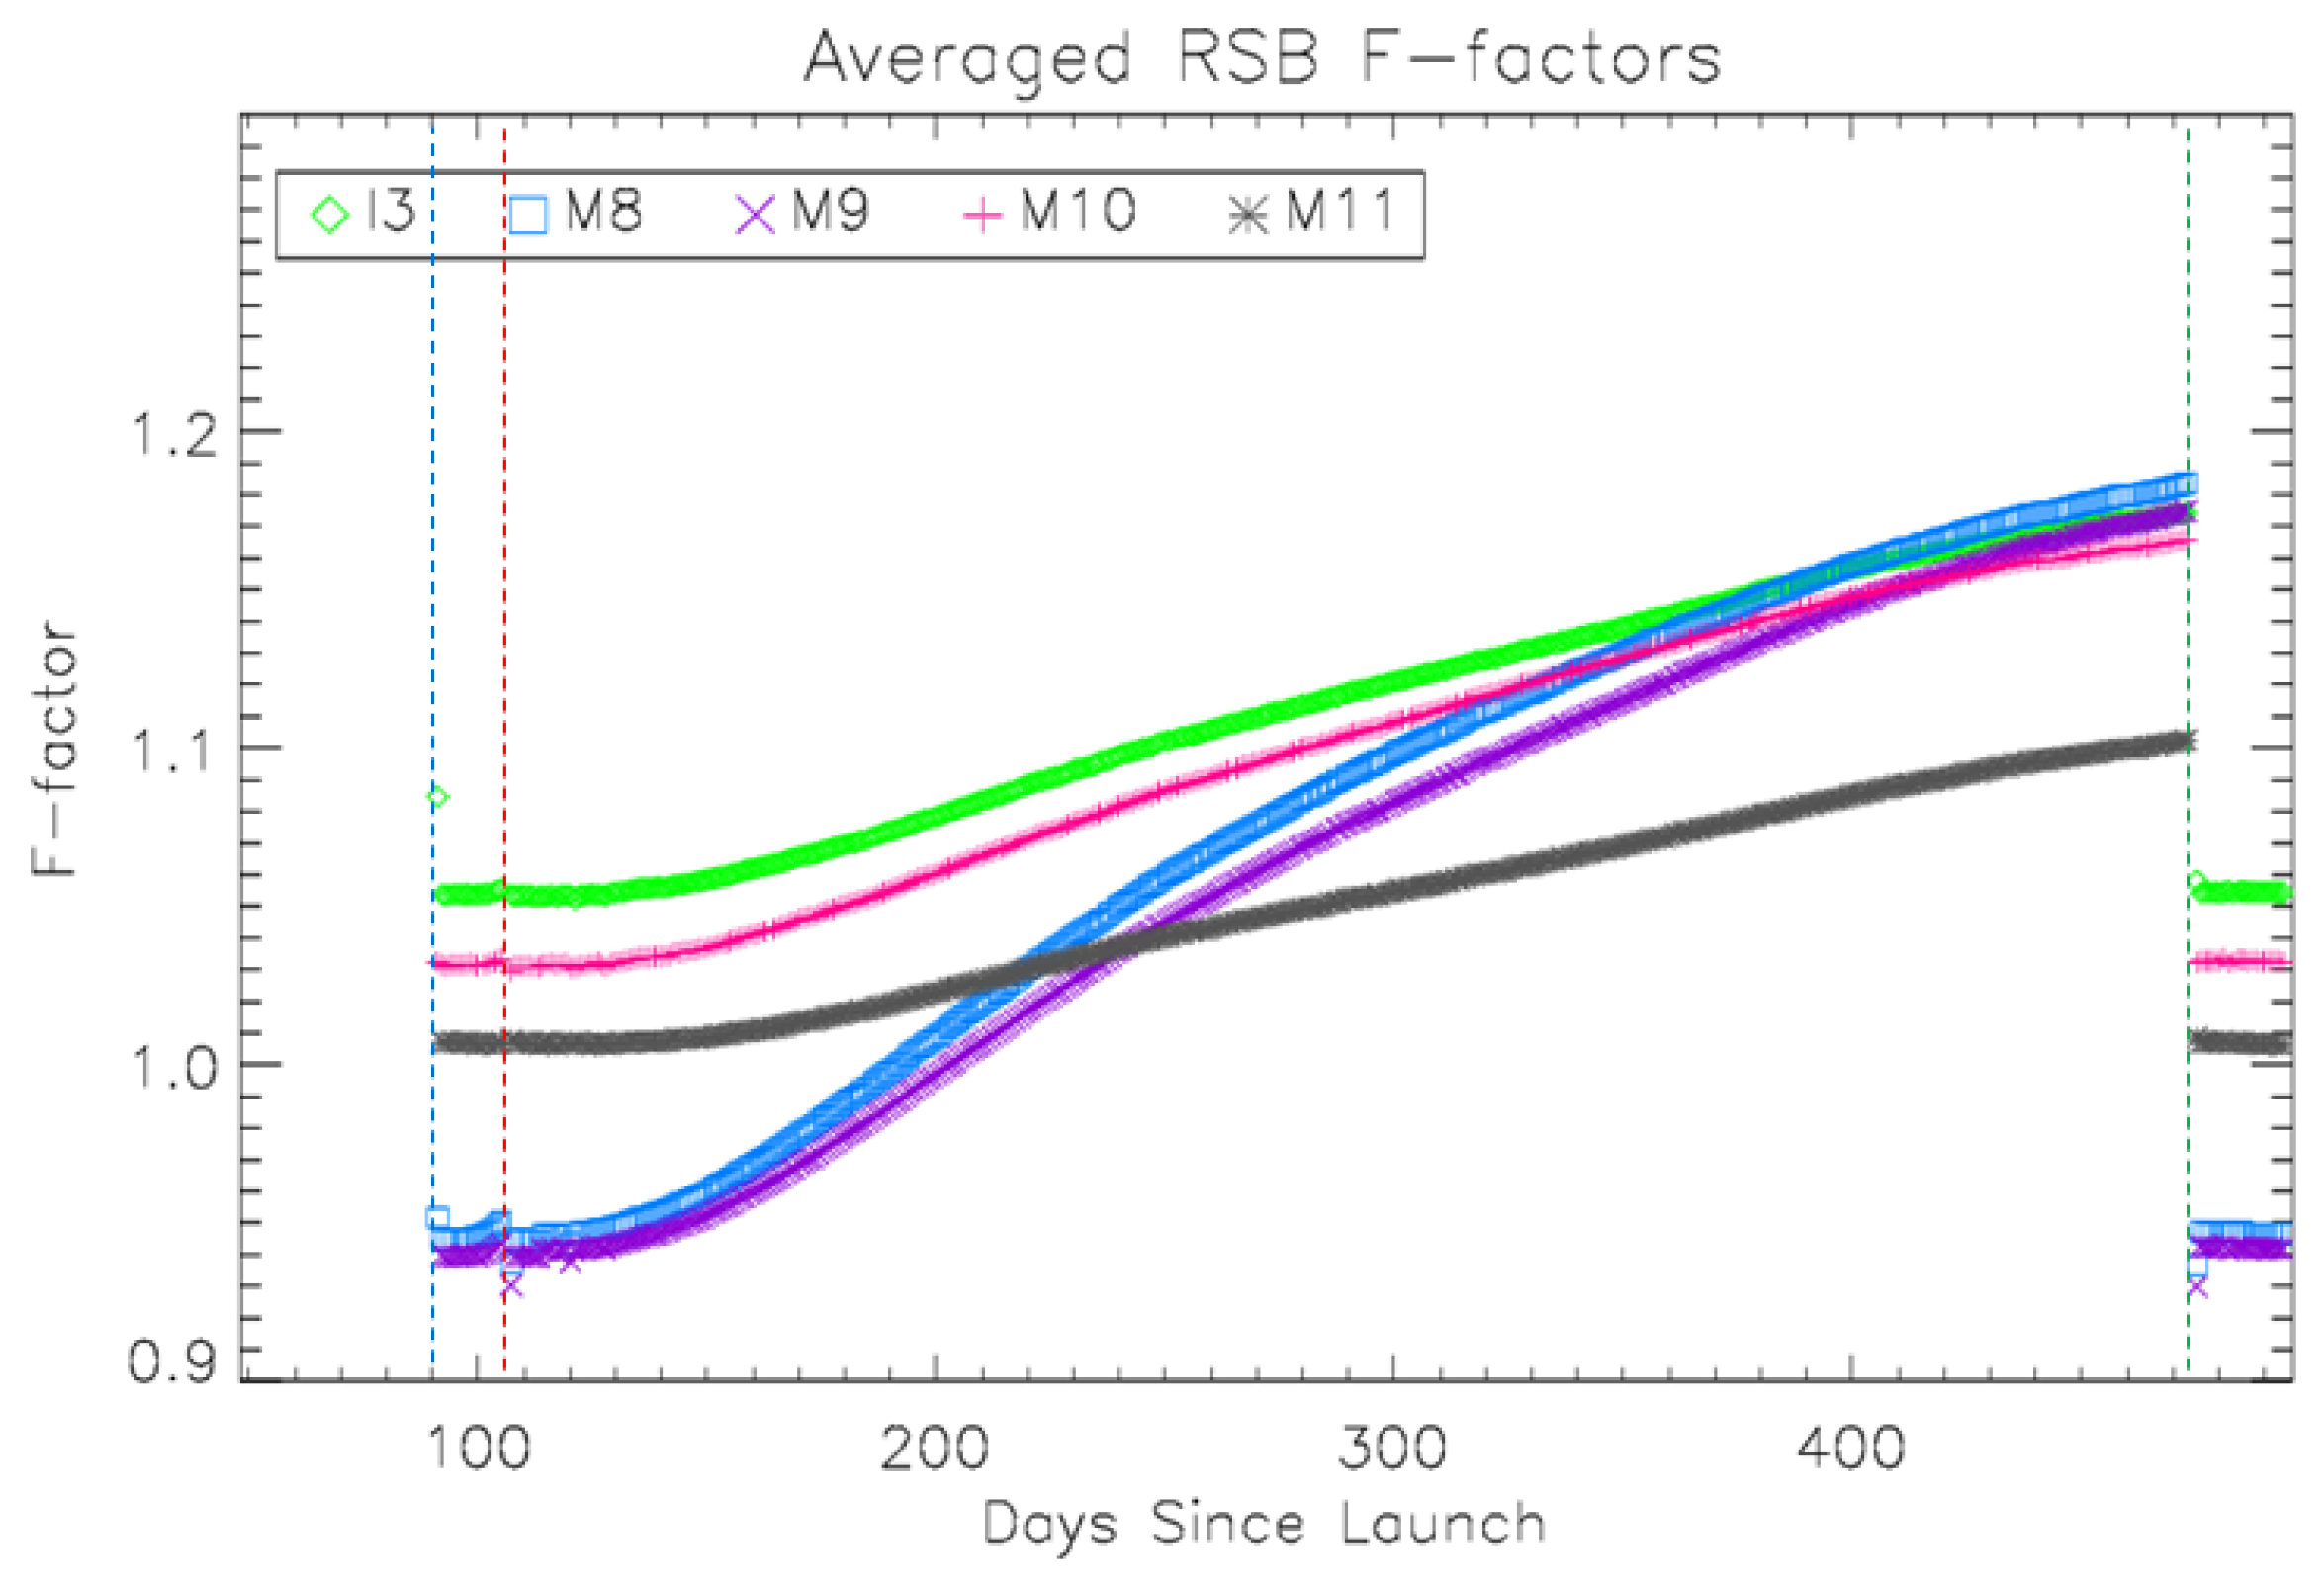
3.3. Operational F-Factors for VIIRS SDR Product Generation in SWIR Bands

When it comes to the SWIR bands, fast degradations were observed, especially in bands M8 and M9. These two bands were located in the Short/Mid-Wave Infrared (S/MWIR) Focal Plane Assembly (FPA), and they are the last two detector arrays at the scan direction edge side, as shown in Figure 5. The cause of these fast degradations in SWIR bands was not determined, but there could be a fast accumulation of residual contaminants with the focal plane temperature set points lowered from 82 K to 80 K on 3 March 2023 at 19:30 UTC.
As shown in Figure 6, the SWIR band offline F-factors were available since the cryo-radiator door open event on 8 February 2023 (DSL 90). The first mid-mission outgassing event was performed between 23 and25 February 2023 (from DSL 105 to 107) to remove possible contaminants near the cold FPAs. In Figure 6, the band-averaged offline F-factors in SWIR bands M8 and M9 show initial F-factor increases right after the cryo-door open event, which were stabilized for a short period after the first outgassing event near DSL 105. Afterwards, the SWIR band F-factors showed large increases (or detector response degradations) starting around DSL 140.
The SWIR band F-factor changes have strong detector dependencies, as shown in Figure 7, for band M8 in HAM side A. The largest change was observed in detector 16, while the changes were reduced in detector 10 and the rates of changes were of similar levels for detectors 1 to 9. It was assumed that these detector-dependent degradations were caused by the different rates of contaminant accumulation on the cold focal plane. To compensate for these detector-dependent changes, a series of initial F-PREDICTED LUT deliveries were made, as shown in Table 3 below.
Figure 7 shows the band M8 operational calibration coefficients (or F-factors) that were used for the VIIRS SDR product. Band M8 detector F-factors showed the largest detector level deviations among the SWIR bands. The lines are from the manually delivered F-PREDICTED LUTs, whereas the symbols represent the RSBautoCal calculated calibration coefficients. The F-PREDICTED LUT was switched to RSBautoCal on 17 August 2023 and restored on 1 March 2024 as explained in Table 3. The detector dependencies for 5 VIIRS SWIR bands were characterized on DSL 470, as shown in Figure 8 (just before the second MMOG event). Large F-factor variations were observed for the near-the-edge detectors 16 (or 15) and the patterns were very consistent over the detector arrays for these SWIR bands. It should be noted that the 32 detectors of band I3 were mapped into 16 detectors in Figure 8 showing similar trends of detector degradation when compared to the M-bands. From this spatial pattern of degradations, it was inferred that more contaminants accumulated toward detector 16 compared to the other side of the detector arrays in the S/MWIR FPA.
It should be noted that the VISNIR band calibration coefficients were updated on 12 January 2023 and kept at a constant level for each gain state, HAM side, and detector. On the other hand, all other F-PREDICTED LUT updates since the first update on 23 March 2023, as shown in Table 3, were applied to address the fast SWIR band changes over time. The VIIRS F-PREDICTED LUT provided parametric future predictions of F-factor changes with cubic polynomial functions, which nevertheless deviated from the real-time on-orbit RSBautoCal measurements over time. Starting from 17 August 2023, an automated on-orbit radiometric calibration was performed with the RSBautoCal routine for the SWIR bands only instead of using the manual updates of the F-PREDICTED LUT.
Table 3 also indicates the application of bias corrections for the SWIR bands. While these corrections are only approximate, they were estimated based on differences observed in lunar and DCC data when the prelaunch calibration was updated based on solar calibration measurements. The main goal was to achieve a better agreement between Earth observations from the NOAA-20 and NOAA-21 VIIRS SWIR bands. The bias corrections are in line with the discrepancies noted in the SD BRDF prelaunch measurements [33].

3.4. Second MMOG Event

Following the opening of the cryo-radiator door on 8 February 2023 (DSL 90), the first MMOG took place at 23–25 February 2023 (DSL 105-107), in response to the LWIR band gain degradation along with the initial gain degradations observed in SWIR bands, particularly in band M8. Initially, the first MMOG appeared successful for about 20 days, after which gradual increases in the degradations of bands M8 and M9 were noted, starting from DSL 110. Offline F-factors, as shown in Figure 6, indicated an approximate 25% averaged increase in the F-factor in band M8. Specifically, detector 16 in band M8 experienced an F-factor increase of up to 60%, as demonstrated in Figure 7. Note that NOAA-21 VIIRS MWIRs also started to degrade again around the same time as the SWIRs, though the rate of MWIR degradation was smaller [44].
In order to address detector responsivity degradation observed over time in S/MWIR bands, a second MMOG was conducted at 26–28 February 2024. During this MMOG, the cold-stage outgas heater was activated at 12/22:37 UTC and maintained at a temperature of 34 degrees Celsius for 10 h. Throughout the MMOG process, VIIRS science data were not available. Following the second MMOG, the SWIR band F-factors were restored to their initial gain levels. As anticipated, there was no significant change in the VISNIR band F-factors. The second MMOG was executed successfully and effectively restored the initial F-factors for the SWIR bands as shown in Figure 6 and Figure 7. In addition to the initial gain restoration, the detector-dependent F-factors were equalized again, as shown in Figure 9. The large detector F-factors toward detector 16 in Figure 8 were reduced and stabilized for more than two weeks after the second MMOG, which confirms the success of the event. Following the successful second MMOG event, the SWIR band on-orbit radiometric calibration (F-PREDICTED LUT) was set back to the initial constant levels as of 1 March 2024, as indicated in Table 3.

3.5. Validation of Operational F-Factors from the Long-Term DCC Trends

The calibration stabilities of NOAA-21 VIIRS RSB SDRs in the operational processing stage were evaluated using daily DCC reflectance time series. The mode of daily DCC reflectance was used for the VISNIRs; the mean of the daily DCC reflectance was used for the SWIRs. A linear regression fit was applied to the daily DCC observations in RSBs to estimate long-term trends [45]. The uncertainties of the trends were estimated using the 95% confidence interval (CI) and the M-K test [45]. The M-K test is specialized for detecting monotonic upward or downward trends in time-series data as a non-parametric statistical method. It is useful to test a linear regression analysis whether there is a non-zero slope in the trend. The DCC observation met the basic assumptions of the M-K test that the measurements were representative of the true condition at sampling times without bias and the measurements were independent and identically distributed.
Figure 10 shows daily DCC reflectance time-series trending results for VISNIR bands, and there are positive slopes. If the ZM-K value is larger than 1.96, then a decision can be made that there is a linear long-term trend with the 95 percent confidence level. Although the ZM-K value is larger than the decision threshold, the NOAA VIIRS team decided to closely monitor the longer-term trends since (1) the DCC time series are still short and (2) there are larger solar activities in recent years, which may increase the uncertainty in the trends. The overall rates of changes were less than 1%/year, which are closely monitored. If these trends are continuously observed in the DCC time series in the coming months, the NOAA VIIRS team will compare the trends with SD and lunar results and update the operational F-factors to compensate for the long-term trends as needed.
The DCC reflectance trending results for NOAA-21 SWIR bands are shown in Figure 11 and the linear regression and M-K test were calculated using data since 23 June 2023, which are, after all, the initial SWIR band F-PREDICTED LUT changes, as shown in Table 3. The DCC trends from the linear regression show negative slopes up to the one percent level in Figure 11. These negative slopes could be a part of annual oscillation cycles of DCC reflectance. The SWIR band slope ranged from −0.76 to −1.57 percent per year; however, a longer period of DCC observations will be needed to confirm the SWIR band trends. It should be noted that the asterisks symbols at the end of the time-series plots in Figure 10 and Figure 11 indicate the recent DCC responses after the second MMOG event. The new DCC observations after the second MMOG also showed consistent trends in the VIS/NIR bands with those before the second MMOG, which validates the operational VIIRS SDR products. Table 4 summarizes DCC trending results from Figure 10 and Figure 11.

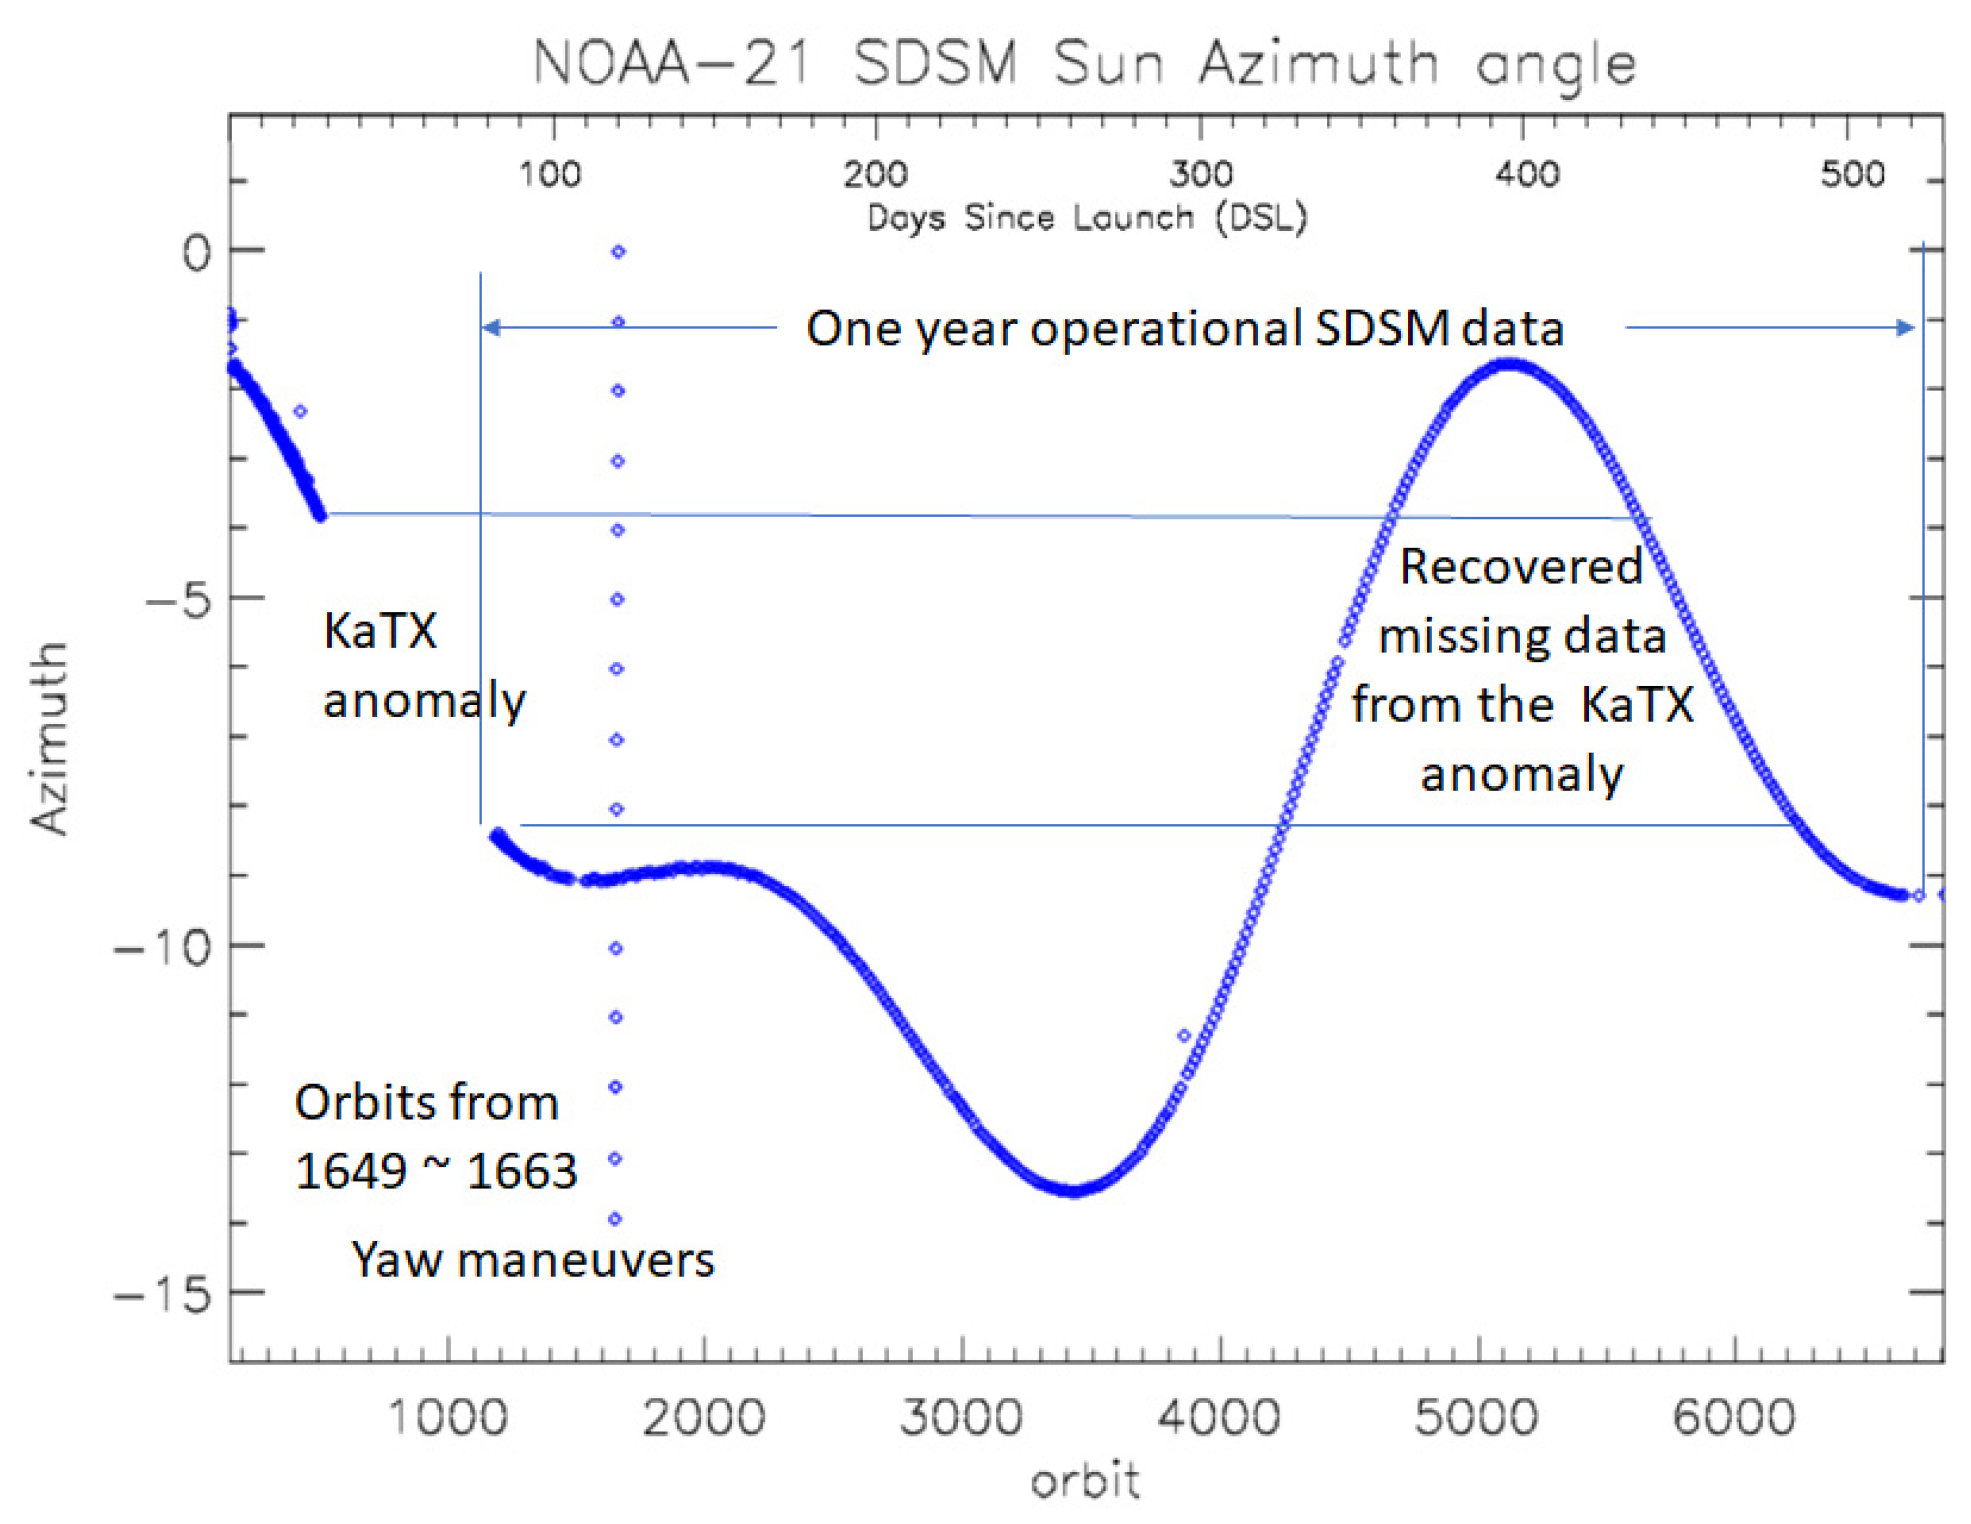
3.6. H-Factor Update Using Yaw and One-Year On-Orbit SDSM Data

A series of 15 spacecraft yaw maneuvers were performed on 6–7 March 2023 to estimate new SDSM screen transmission and BRDF functions. The indication of the poor performance of the prelaunch τSDSM Look Up Table (LUT) can be observed by the spread of yaw maneuver points near DSL 117 in Figure 3. For all eight SDSM detectors, there were approximately 1.5 percent levels of H-factor oscillations. Due to these H-factor oscillation problems, a new version of the τSDSM LUT was derived from the yaw maneuver data and on-orbit SDSM data. The details of deriving the τSDSM LUT are described in Appendix A.
After the yaw maneuvers, the initial H-factors were calculated as shown in Figure A2 in Appendix A. Before deriving the final version of H-factors using a one-year SDSM dataset, the intermediate version of the H-factor was derived using yaw maneuver data and on-orbit data until 23 April 2023 (DSL 155) as shown in Figure 12. The effects of using the limited on-orbit SDSM dataset for the τSDSM function update are shown as unstable oscillations in the raw H-factors, i.e., see symbols in Figure 12. The on-orbit SDSM data until 23 April 2023 did not fill in the gaps between the yaw points below −9 degrees as shown in Figure A4. The newly updated τSDSM function using the data until 20 November 2023 reasonably covered data gaps between the yaw points as shown in Figure A5. Figure 13 shows the updated H-factors using the τSDSM function, which was derived from yaw maneuver points together with the full year of on-orbit SDSM data. The newly updated H-factors using full-year on-orbit SDSMs showed a much more stable response than the previous updates, especially after DSL 155.

3.7. The Offline SD F-Factors

When the H-factors were successfully updated, the offline version of SD F-factors was determined. Figure 14 shows the band-averaged (over all the detectors, HAM sides, and gain states) offline SD F-factors using the updated H-factor from the on-orbit SDSM data up to 6 August 2023 (DSL 269) on the top, whereas the bottom plot shows the SD F-factors using the updated H-factor from the one-year SDSM data up to 25 March 2024. The improvements of adding on-orbit SDSM data to the H-factor can be clearly seen in the bottom plot in Figure 14. The updated offline SD F-factors show more stable profiles, which mitigate the oscillations after DSL 260.

3.8. Comparisons of the Lunar and SD F-Factors

Figure 15 shows the initial SD F-factors (with lines) and lunar F-factor (with symbols), and they are very consistent within the one-percent level in the VISNIR bands over the one-year operation, except bands M1 and M2. Probably, these differences are caused by faster SD degradation in the short wavelength and the Relative Spectral Response (RSR) effects [28]. Between the lunar and SD F-factors, there were several percent static differences because of the solar irradiance model differences between them. The GIRO lunar model is based on the Wehrli solar irradiance model [46], whereas the NOAA-21 VIIRS calibration references the Thuillier solar irradiance model [12]. In the denominator part of the VIIRS calibration equation, the prelaunch c-coefficients were measured from the National Institute of Standards and Technology’s (NIST’s) 100 cm Spherical Integration Source (SIS100) with a linear attenuation assembly (LAA) [4]. There were obvious differences between the shapes of solar irradiance and SIS100, which may cause subtle calibration differences in the VIIRS calibration equations. These static differences between the SD and lunar F-factors were normalized in Figure 15. The lunar F-factors (symbols) are scaled such that the first ones match the SD F-factors (lines) on 14 December 2022 to capture the long-term differences between them. The growing differences are more evident in the short-wavelength bands, and band M1 shows approximately a 1.5 percent difference between lunar and SD F-factors on the last lunar collection point in November 2023. Previously, there were systematic on-orbit SD and lunar F-factor differences for the NOAA-20 VIIRS case. For the NOAA-20 VIIRS case, there were growing differences between the SD and lunar F-factors especially in the short wavelength bands (M1~M4). In the case of the NOAA-21 VIIRS, the mitigation method needs to be investigated based on the ongoing H-factor trends and SDSM detector RSR functions that are different from the NOAA-20 VIIRS case. The details of the RSR effects on SD degradation and on-orbit calibration are beyond the scope of this paper, but the NOAA VIIRS team has an algorithm and plans to apply the correction to the offline on-orbit calibration. On the contrary, the SWIR bands showed consistent trends between SD and lunar F-factors, but they had significant response degradations, as discussed above.

4. Conclusions

Following the successful launch of the NOAA-21 satellite on 10 November 2022, the performance and functionalities of the VIIRS instrument underwent testing and validation through a series of PLTs, meeting the accuracy requirements essential for user needs. As a primary source of radiometric calibration for RSBs, the calculated SD reflectance showed initial instability in its degradation because of using the prelaunch sun transmittance (τSDSM) LUT. To mitigate this problem, the calibration coefficient scaling factors (Fs) were first calculated by assuming no degradation of the RSB radiometric response and then extrapolated to the first post-launch orbit, to remove the diffuser degradation effects.
A new version of τSDSM was later derived from the yaw maneuver data and on-orbit SDSM data covering the one-year solar azimuth angles. The updated τSDSM function showed significant differences of more than one-percent levels when compared to the prelaunch version. With the updated H-factors, an offline version of the VISNIR F-factors was calculated and compared with the operational ones. The on-orbit SD F-factors in the VISNIR bands showed mostly stable responses over time, except for the shortest-wavelength bands M1 and M2. On the other hand, lunar F-factors in the VISNIR bands had very stable trends, including bands M1 and M2. As a result of lunar F-factors, the VISNIR band operational F-factors were set to be at constant levels for the VIIRS SDR products of M1-M7 and I1-I2.
On the other hand, the SWIR bands (M8-M11 and I3) had significant detector responsivity degradations of more than 20 percent in M8 and M9 by the end of year 2023. This phenomenon is likely attributed to the accumulation of residual contaminants on the cold S/MWIR FPA, following a reduction in the temperature set point from 82 K to 80 K. The SWIR band detector responsivity changes were mainly observed near the edge detectors from 10 to 16. These fast gain changes were compensated in near real time by applying the RSBautoCal software package, which was only activated for the SWIR band products. To mitigate these issues, a second MMOG was conducted at 26–28 February 2024. This MMOG successfully restored SWIR band F-factors and stabilized detector-dependent F-factors.
Finally, the radiometric stability of NOAA-21 VIIRS products was evaluated from the long-term DCC trends, which showed small positive trends in the VISNIR bands and negative trends in the SWIR bands. These small trends could be sub-portions of DCC annual oscillations or related to the increased solar activities as approaching the solar maximum of the 25th solar cycle. Longer periods of DCC time series and a comparison with other vicarious monitoring methods will be needed to confirm the trends. The NOAA VIIRS SDR team will continue monitoring the NOAA-21 VIIRS on-orbit radiometric performance with calibration sources, such as SD, moon, DCC, and other natural targets, to provide accurate products for the user community by applying timely corrections for the VIIRS SDRs.

Author Contributions

Conceptualization, T.C., C.C., S.B. and X.S.; methodology, T.C., S.B., X.S., W.W. and C.C.; software, T.C., S.B., X.S. and W.W.; validation, W.W. and K.A.; result analysis, investigation and decisions, T.C., C.C., S.B., X.S. and W.W.; resources, C.C., T.C., W.W., X.S. and S.B.; writing and original draft preparation, T.C. and S.B.; review and editing, T.C., C.C., S.B., X.S., W.W. and K.A.; visualization, T.C., S.B. and W.W.; supervision project administration, C.C. All authors have read and agreed to the published version of the manuscript.

Funding

This research was funded by the PROTECH contract awarded to Global Science & Technology (GST) by NOAA/National Environmental Satellite, Data, and Information Service (NESDIS). This study was partially supported by NOAA grant NA19NES4320002 (Cooperative Institute for Satellite Earth System Studies—CISESS) at the University of Maryland/ESSIC.

Data Availability Statement

The NOAA-21 VIIRS SDR data are available from the Comprehensive Large Array-data Stewardship System (CLASS, www.class.noaa.gov accessed on 21 July 2024).

Disclaimer

The scientific results and conclusions, as well as any views or opinions expressed herein, are those of the author(s) and do not necessarily reflect those of the NOAA or the Department of Commerce.

Conflicts of Interest

The authors declare no conflicts of interest.

Appendix A

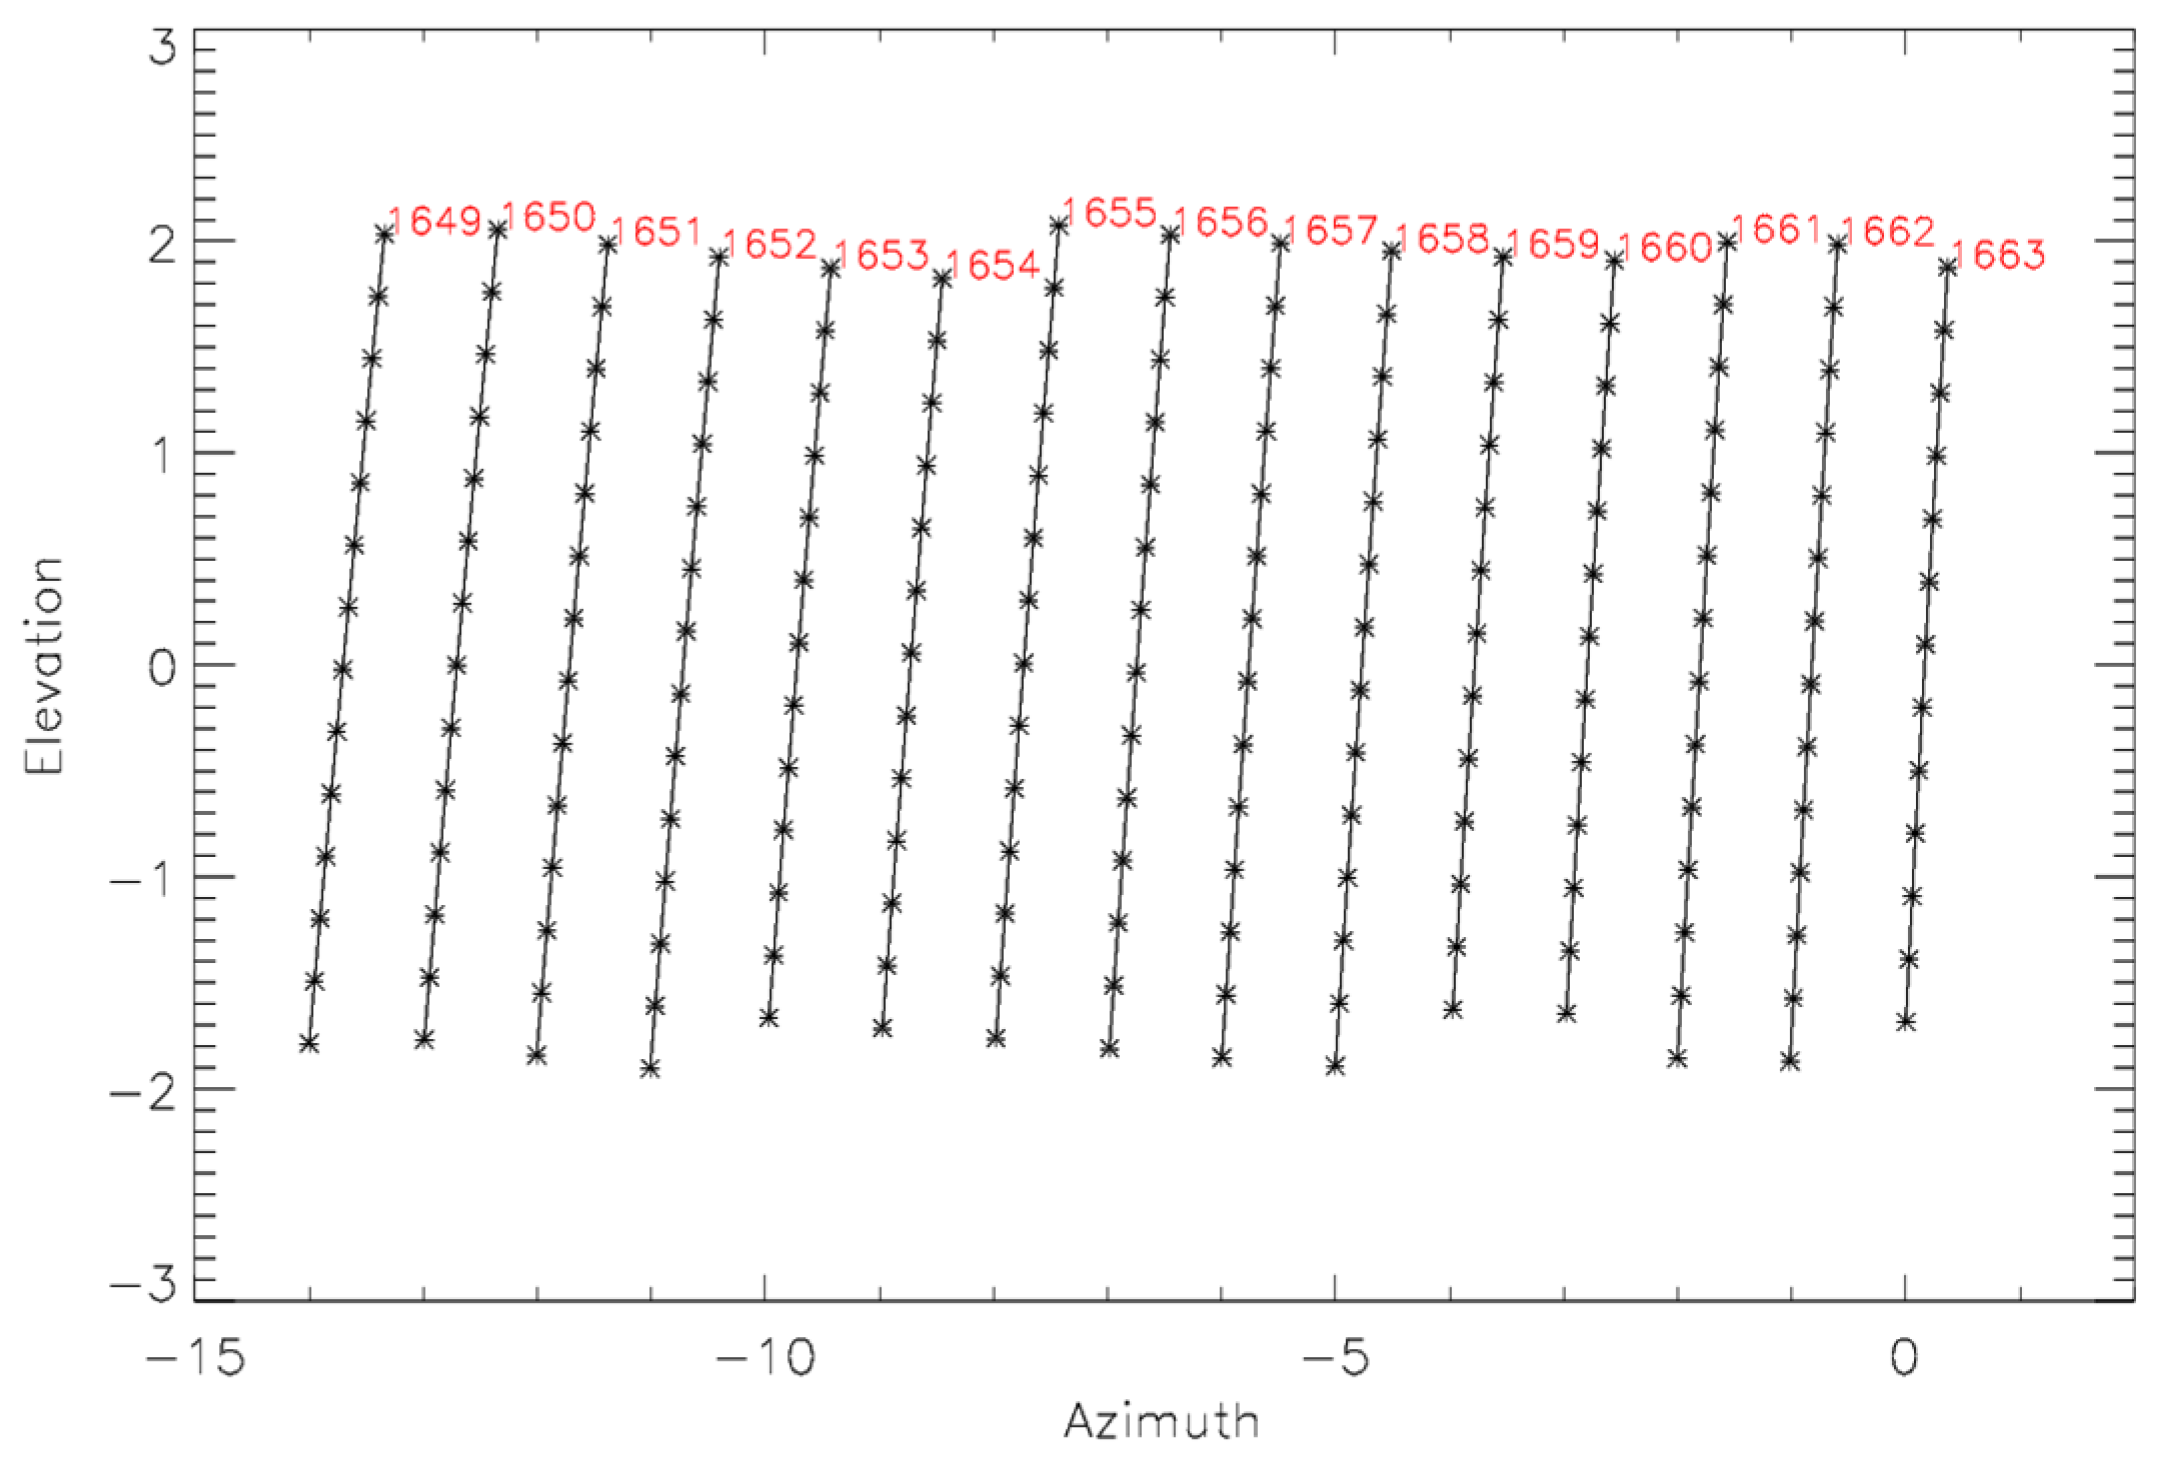
Appendix A.1. Initial H-Factor Update from the Yaw Maneuvers

A series of 15 consecutive post-launch yaw maneuvers for NOAA-21 VIIRS was planned. The NOAA VIIRS team calculated the desired time and satellite yaw angles of the yaw maneuvers approximately 20 days before the start of the satellite maneuvers and notified the mission operation team. As shown in Table A1, there are 14 spacecraft-level yaw maneuvers with normal SDSM data collections at 6–7 March 2023 for NOAA-21 orbit numbers from 1649 to 1663. In each spacecraft yaw maneuver, there was a 5 min SDSM data collection at the center of the yaw maneuver time. To make sure that the SDSM operation covered the desired yaw center angle and time, the SDSM collection started at least 2 min before the desired center time.
Table A1. NOAA-21 VIIRS yaw maneuver plan. The gray row (orbit 1654) indicates a normal SDSM collection without a yaw maneuver.
#DatePredicted Time (UTC)OrbitPredicted Solar Azimuth (deg)Yaw Angle (deg)Simulated Solar Azimuth (deg)
16 March 202313:30:10164919.7421−5.1414.6
26 March 202315:11:41165019.7423−4.1115.63
36 March 202316:53:11165119.743−3.0916.66
46 March 202318:34:41165219.7433−2.0617.69
56 March 202320:16:12165319.7436−1.0318.71
6 March 202321:57:42165419.74430.019.74
66 March 202323:39:12165519.74441.0320.77
77 March 20231:20:43165619.7452.0621.8
87 March 20233:02:13165719.74553.0822.83
97 March 20234:43:43165819.74564.1123.86
107 March 20236:25:14165919.74635.1424.89
117 March 20238:06:44166019.74686.1725.91
127 March 20239:48:15166119.74697.226.94
137 March 202311:29:45166219.74778.2227.97
147 March 202313:11:15166319.7489.2529.0
After the successful yaw maneuvers, a new version of the τSDSM LUT was interpolated from the newly acquired yaw-line data, as shown in Figure A1. Using the yaw maneuver updated τSDSM LUT, the H-factors were reprocessed in Figure A2. The H-factor oscillations were significantly reduced, especially in the early stage of the H-factor from zero to 36 DSL. The spread of H-factors from the yaw maneuvers in Figure 3 near DSL 117 was tightly clustered after applying the new SDSM LUT in Figure A2, as expected. Even though the τSDSM LUT was tied to the lines of the yaw maneuver points in Figure A1, there were additional features in between the yaw maneuver lines. The spread of H-factors between DSL 80 to 100 in Figure A2 indirectly indicates that there are residual non-linear responses between the yaw lines along with the solar azimuth direction.
Figure A1. NOAA-21 VIIRS τSDSM screen function coverage in terms of solar azimuth and elevation angles with the 15 yaw maneuvers at 6–7 March 2023.
Remotesensing 16 02737 g0a1
Figure A2. NOAA-21 VIIRS H-factors rederived using updated τSDSM and τSDBRDFSDSM LUTs.
Remotesensing 16 02737 g0a2

Appendix A.2. SDSM Sun Transmittance Screen (τSDSM) LUT Update Using One-Year On-Orbit SDSM Data

To fill in the missing part of the τSDSM LUT, on-orbit SDSM data from 20 November 2022 to 20 November 2023 were used, as shown in Figure A3. The blue lines in the figure were derived from on-orbit SDSM data collections over a one-year period. Initially, the SDSM collections were performed in each orbit starting from the activation of the VIIRS instrument on 20 November 2022 to 13 February 2023. The frequency of on-orbit SDSM collection changed from each orbit to daily, starting from 14 February 2023 to 20 November 2023, to make sure that there were enough data points between the yaw maneuver lines.
Figure A3. NOAA-21 VIIRS τSDSM screen function coverage with the 15 yaw maneuvers (red) and one-year on-orbit SDSM data (blue).
Remotesensing 16 02737 g0a3
Figure A4 also shows the coverage of yaw maneuvers and on-orbit SDSM datasets. The yaw maneuvers from orbits 1649 to 1663 sample solar azimuth angles, which cover the one-year SDSM operational range. The recent on-orbit SDSM data covered the solar azimuth angles that were missing during the KaTX anomaly and had a range of approximately −4 to −8 degrees as shown in Figure A4. The KaTX anomaly period can also be seen as coarsely populated on-orbit SDSM data lines (blue lines) in Figure A3.
Figure A4. NOAA-21 VIIRS SDSM solar azimuth angle versus orbit numbers and DSL (top x-axis). The on-orbit SDSM solar azimuth angles covered a one-year range, including the Ka transmitter anomaly period.
Remotesensing 16 02737 g0a4
When the one-year range of the on-orbit SDSM data was populated, the final τSDSM LUT was derived by interpolating the yaw and on-orbit data points (asterisks) shown in Figure A3. To prove the needs of on-orbit SDSM data, Figure A5 shows the interpolation results between the yaw maneuver points (green asterisks) and on-orbit SDSM data (red diamonds) at the solar declination angle = 0 degrees over the full solar azimuth angle range for SDSM detector 1. The yaw maneuver points were uniformly sampled and covered the operational range, but there were finer changes between yaw points. Especially, over the solar azimuth angles below −7 degrees, it showed large up and down features when the azimuth angle decreased to −14 degrees.
Figure A5. Derived interpolated τSDSM function at the zero solar declination angle over the operational solar azimuth angles.
Remotesensing 16 02737 g0a5
The prelaunch and updated versions of the τSDSM functions have roughly similar trends, as shown in Figure A6 and Figure A7, respectively. They both show gradually decreasing trends over the azimuth axis in the two figures. The flat plateau near the corner of elevation angle 2 deg. and zero azimuth angle in the new version are caused by the rapid increase in on-orbit SDSM data in this angular region. The data at this corner were not used because of the SD sweet-spot limits.
When comparing the prelaunch and updated τSDSM functions in Figure A6 and Figure A7, there are profile differences between them, especially along the direction of the azimuth axis. The τSDSM function from the prelaunch shown in Figure A6 has more oscillating features between the azimuth angles from −10 to −5 degrees. The differences can be easily seen at the edge of the surface at the −2 degree elevation angle for all the azimuth ranges from both prelaunch and updated function surfaces. Figure A8 shows the ratio between the prelaunch and updated τSDSM functions, which shows approximately ±2 percent differences between them over the operational angular range. For other SDSM detectors, the levels of differences are mostly within similar levels.
Figure A6. Prelaunch version of the τSDSM function shown as a function of solar elevation and azimuth angles for SDSM detector 1.
Remotesensing 16 02737 g0a6
Figure A7. The updated version of the τSDSM function shown as a function of solar elevation and azimuth angles for SDSM detector 1.
Remotesensing 16 02737 g0a7
Figure A8. The ratio between the prelaunch and updated version of the τSDSM function in SDSM detector 1.
Remotesensing 16 02737 g0a8

References

  1. Cao, C.; De Luccia, F.J.; Xiong, X.; Wolfe, R.; Weng, F. Early On-Orbit Performance of the Visible Infrared Imaging Radiometer Suite Onboard the Suomi National Polar-Orbiting Partnership (S-NPP) Satellite. IEEE Trans. Geosci. Remote Sens. 2014, 52, 1142–1156. [Google Scholar] [CrossRef]
  2. Oudrari, H.; McIntire, J.; Xiong, X.; Butler, J.; Lee, S.; Lei, N.; Schwarting, T.; Sun, J. Prelaunch Radiometric Characterization and Calibration of the S-NPP VIIRS Sensor. IEEE Trans. Geosci. Remote Sens. 2015, 53, 2195–2210. [Google Scholar] [CrossRef]
  3. Moyer, D.; Angal, A.; Oudrari, H.; Haas, E.; Ji, Q.; De Luccia, F.; Xiong, X. JPSS-1 VIIRS Prelaunch Reflective Solar Band Testing and Performance. Remote Sens. 2022, 14, 5113. [Google Scholar] [CrossRef]
  4. Moyer, D.; Angal, A.; Ji, Q.; McIntire, J.; Xiong, X. JPSS-2 VIIRS Pre-Launch Reflective Solar Band Testing and Performance. Remote Sens. 2022, 14, 6353. [Google Scholar] [CrossRef]
  5. Choi, T.; Blonski, S.; Shao, X.; Wang, W.; Uprety, S.; Ahmad, K.; Zhang, B.; Bai, Y. On-orbit Post Launch Test (PLT) Plans for the Joint Polar Satellite System (JPSS)-2 Visible Infrared Imaging Radiometer Suite (VIIRS) Sensor Data Record (SDR) Product. In Proceedings of the American Meteorological Society 2023, Denver, CO, USA, 12 January 2023. [Google Scholar]
  6. Choi, T.; Blonski, S.; Shao, X.; Wang, W.; Ahmad, K.; Bai, Y.; Pillai, P. Initial Status of Joint Polar Satellite System (JPSS)-2 Visible Infrared Imaging Radiometer Suite (VIIRS) On-orbit Calibration and Performance. In Proceedings of the Joint Agency Commercial Imagery Evaluation (JACIE) 2023, Reston, VA, USA, 27–30 March 2023. [Google Scholar]
  7. Xiong, X.; Angal, A.; Sun, J.; Lei, N.; Twedt, K.; Chen, H.; Chiang, K.V.; Kimura, T.; Babu, S.R.; Hélière, A. An overview of NOAA-21 VIIRS early on-orbit calibration and performance. Sens. Syst. Next-Gener. XXVII 2023, 12729, 308–317. [Google Scholar]
  8. Xiong, X.; Angal, A.; Sun, J.; Lei, N.; Twedt, K.; Chiang, K.-F. Early results from NOAA-21 (JPSS-2) VIIRS on-orbit calibration. In Proceedings of the IGARSS 2023, Pasadena, CA, USA, 16–21 July 2023. [Google Scholar]
  9. Zhou, L.; Reed, B.E.; Dunlap, L.; Young, A.; Liu, X.; Divakarla, M.G. Updates on Joint Polar Satellite System (JPSS) and Low Earth Orbit (LEO) data products. In Proceedings of the American Meteological Society, Denver, CO, USA, 8–12 January 2023. [Google Scholar]
  10. Moeller, C.; Schwarting, T.; McCorkel, J.; Moyer, D.; Mcintire, J. JPSS-2 VIIRS version 2 at-launch relative spectral response characterization. In Proceedings of the Earth Observing Systems XXIV, 111270D, San Diego, CA, USA, 9 September 2019. [Google Scholar]
  11. Choi, T.; Blonski, S.; Shao, X.; Wang, W. Preliminary assessment of the NOAA-21 VIIRS on-orbit Reflective Solar Band calibration and performance. In Proceedings of the Earth Observing Systems XXVIII, San Diego, CA, USA, 24 August 2023. [Google Scholar]
  12. Thuillier, G.; Hersé, M.; Labs, D.; Foujols, T.; Peetermans, W.; Gillotay, D.; Simon, P.C.; Mandel, H. The Solar Spectral Irradiance from 200 to 2400 nm as Measured by the SOLSPEC Spectrometer from the Atlas and Eureca Missions. Sol. Phys. 2003, 214, 1–22. [Google Scholar] [CrossRef]
  13. Baker, N.; Kilcoyne, H. Joint Polar Satellite System (JPSS) VIIRS Radiometric Calibration Algorithm Theoretical Basis Document (ATBD); Goddard Space Flight Center: Greenbelt, MA, USA, 2013. [Google Scholar]
  14. Choi, T.; Cao, C.; Blonski, S.; Wang, W.; Uprety, S.; Shao, X. NOAA-20 VIIRS Reflective Solar Band Postlaunch Calibration Updates Two Years In-Orbit. IEEE Trans. Geosci. Remote Sens. 2020, 58, 7633–7642. [Google Scholar] [CrossRef]
  15. Choi, T.; Cao, C.; Shao, X.; Wang, W. S-NPP VIIRS Lunar Calibrations over 10 Years in Reflective Solar Bands (RSB). Remote Sens. 2022, 14, 3367. [Google Scholar] [CrossRef]
  16. Choi, T.; Shao, X.; Cao, C. On-orbit radiometric calibration of Suomi NPP VIIRS reflective solar bands using the Moon and solar diffuser. Appl. Opt. 2018, 57, 9533–9542. [Google Scholar] [CrossRef]
  17. Shao, X.; Liu, T.-C.; Xiong, X.; Cao, C.; Choi, T.; Angal, A. Surface Roughness-Induced Spectral Degradation of Multi-Spaceborne Solar Diffusers Due to Space Radiation Exposure. IEEE Trans. Geosci. Remote Sens. 2019, 57, 8658–8671. [Google Scholar] [CrossRef]
  18. Shao, X.; Cao, C.; Liu, T.-C. Spectral Dependent Degradation of the Solar Diffuser on Suomi-NPP VIIRS Due to Surface Roughness-Induced Rayleigh Scattering. Remote Sens. 2016, 8, 254. [Google Scholar] [CrossRef]
  19. Lei, N.; Xiong, X. Suomi NPP VIIRS Solar Diffuser BRDF Degradation Factor at Short-Wave Infrared Band Wavelengths. IEEE Trans. Geosci. Remote Sens. 2016, 54, 6212–6216. [Google Scholar] [CrossRef]
  20. Choi, T.; Cao, C. S-NPP VIIRS On-Orbit Calibration Coefficient Improvements With Yaw Maneuver Reanalysis. IEEE Trans. Geosci. Remote Sens. 2019, 57, 7460–7465. [Google Scholar] [CrossRef]
  21. Choi, T.; Shao, X.; Blonski, S.; Cao, C. On-orbit NOAA-20 VIIRS solar diffuser bidirectional reflectance distribution function and screen transmittance characterization using yaw manoeuvres and regular on-orbit SDSM data. Int. J. Remote Sens. 2020, 41, 6503–6526. [Google Scholar] [CrossRef]
  22. Choi, T.; Blonski, S.; Cao, C. Initial on-orbit radiometric calibration of the NOAA-20 VIIRS Reflective Solar Bands. In Proceedings of the SPIE Optical Engineering + Applications, San Diego, CA, USA, 11–15 August 2019; p. 11. [Google Scholar]
  23. Lei, N.; Chen, X.; Xiong, X. Determination of the SNPP VIIRS SDSM Screen Relative Transmittance From Both Yaw Maneuver and Regular On-Orbit Data. IEEE Trans. Geosci. Remote Sens. 2016, 54, 1390–1398. [Google Scholar] [CrossRef]
  24. JGS Engineering Services. Joint Polar Satellite System (JPSS) Ground Segment Data Product Specification (GSegDPS); No. 474-01543; Goddard Space Flight Center: Greenbelt, MD, USA, 2019. [Google Scholar]
  25. Sun, J.; Wang, M. On-orbit calibration of Visible Infrared Imaging Radiometer Suite reflective solar bands and its challenges using a solar diffuser. Appl. Opt. 2015, 54, 7210–7223. [Google Scholar] [CrossRef]
  26. Sun, J.; Wang, M. Visible Infrared Imaging Radiometer Suite solar diffuser calibration and its challenges using a solar diffuser stability monitor. Appl. Opt. 2014, 53, 8571–8584. [Google Scholar] [CrossRef]
  27. Choi, T.; Cao, C.; Blonski, S.; Shao, X.; Wang, W. NOAA-20 VIIRS On-Orbit Reflective Solar Band Radiometric Calibration Five-Year Update. IEEE Trans. Geosci. Remote Sens. 2024, 62, 1–10. [Google Scholar] [CrossRef]
  28. Choi, T.; Cao, C. NOAA-20 VIIRS Relative Spectral Response Effects on Solar Diffuser Degradation and On-Orbit Radiometric Calibration. IEEE Trans. Geosci. Remote Sens. 2021, 60, 1–7. [Google Scholar] [CrossRef]
  29. Rausch, K.; Houchin, S.; Cardema, J.; Moy, G.; Haas, E.; De Luccia, F.J. Automated calibration of the Suomi National Polar-Orbiting Partnership (S-NPP) Visible Infrared Imaging Radiometer Suite (VIIRS) reflective solar bands. J. Geophys. Res. Atmos. 2013, 118, 13434–413442. [Google Scholar] [CrossRef]
  30. Moy, G.; Rausch, K.; Haas, E.; Wilkinson, T.; Cardema, J.; De Luccia, F. Mission history of reflective solar band calibration performance of VIIRS. In Proceedings of the Earth Observing Systems XX, San Diego, CA, USA, 10–13 August 2015. [Google Scholar]
  31. Lei, N.; Xiong, X.; Wang, Z.; Li, S.; Twedt, K. SNPP VIIRS RSB on-orbit radiometric calibration algorithms Version 2.0 and the performances, part 1: The algorithms. J. Appl. Remote Sens. 2020, 14, 047501. [Google Scholar] [CrossRef]
  32. Lei, N.; Xiong, X. Impacts of the Angular Dependence of the Solar Diffuser BRDF Degradation Factor on the SNPP VIIRS Reflective Solar Band On-Orbit Radiometric Calibration. IEEE Trans. Geosci. Remote Sens. 2017, 55, 1537–1543. [Google Scholar] [CrossRef]
  33. Murgai, V.; Klein, S.N. Spectralon Solar Diffuser BRDF extrapolation to 2.25 microns for JPSS J1, J2, and J3. In Proceedings of the Earth Observing Systems XXIV, San Diego, CA, USA, 11–15 August 2019. [Google Scholar]
  34. Choi, T.; Shao, X.; Cao, C.; Weng, F. Radiometric Stability Monitoring of the Suomi NPP Visible Infrared Imaging Radiometer Suite (VIIRS) Reflective Solar Bands Using the Moon. Remote Sens. 2015, 8, 15. [Google Scholar] [CrossRef]
  35. Wilson, T.; Xiong, X. Planning lunar observations for satellite missions in low-Earth orbit. J. Appl. Remote Sens. 2019, 13, 024513. [Google Scholar] [CrossRef]
  36. Wilson, T.; Xiong, X. Scheduling observations of celestial objects for Earth observing sensor calibration. In Proceedings of the Sensors, Systems, and Next-Generation Satellites XX, Edinburgh, UK, 26–28 September 2016; Volume 10000. [Google Scholar]
  37. Doelling, D.R.; Morstad, D.; Scarino, B.R.; Bhatt, R.; Gopalan, A. The Characterization of Deep Convective Clouds as an Invariant Calibration Target and as a Visible Calibration Technique. IEEE Trans. Geosci. Remote Sens. 2013, 51, 1147–1159. [Google Scholar] [CrossRef]
  38. Bhatt, R.; Doelling, D.; Wu, A.; Xiong, X.; Scarino, B.; Haney, C.; Gopalan, A. Initial Stability Assessment of S-NPP VIIRS Reflective Solar Band Calibration Using Invariant Desert and Deep Convective Cloud Targets. Remote Sens. 2014, 6, 2809–2826. [Google Scholar] [CrossRef]
  39. Wang, W.; Cao, C. DCC Radiometric Sensitivity to Spatial Resolution, Cluster Size, and LWIR Calibration Bias Based on VIIRS Observations. J. Atmos. Ocean. Technol. 2015, 32, 48–60. [Google Scholar] [CrossRef]
  40. Wang, W.; Cao, C. Evaluation of NOAA-20 VIIRS Reflective Solar Bands Early On-Orbit Performance Using Daily Deep Convective Clouds. IEEE J. Sel. Top. Appl. Earth Obs. Remote Sens. 2020, 13, 3975–3985. [Google Scholar] [CrossRef]
  41. Wang, W.; Cao, C. Monitoring the NOAA Operational VIIRS RSB and DNB Calibration Stability Using Monthly and Semi-Monthly Deep Convective Clouds Time Series. Remote Sens. 2016, 8, 32. [Google Scholar] [CrossRef]
  42. Blonski, S.; Cao, C. Suomi NPP VIIRS Reflective Solar Bands Operational Calibration Reprocessing. Remote Sens. 2015, 7, 16131–16149. [Google Scholar] [CrossRef]
  43. NESDIS; NOAA. Joint Polar Satellite System (JPSS) VIIRS Geolocation Algorithm Theoretical Basis Document (ATBD). Available online: https://www.star.nesdis.noaa.gov/jpss/documents/ATBD/D0001-M01-S01-004_JPSS_ATBD_VIIRS-Geolocation_B.pdf (accessed on 15 May 2024).
  44. Wang, W.; Blonski, S.; Choi, T.; Xiong, X.; Gu, X.; Czapla-Myers, J.S. Evaluation of NOAA-21 VIIRS thermal emissive bands early on-orbit calibration performance. In Proceedings of the Earth Observing Systems XXVIII, San Diego, CA, USA, 22–24 August 2023. [Google Scholar]
  45. Gilbert, R.O. Statistical Methods for Environmental Pollution Monitoring; John Wiley & Sons: Hoboken, NJ, USA, 1987. [Google Scholar]
  46. Stone, T.; Kieffer, H.H. Absolute irradiance of the moon for on-orbit calibration. In Proceedings of the SPIE—The International Society for Optical Engineering, Seattle, WA, USA, 24 September 2002; pp. 211–221. [Google Scholar]
Figure 1. The band-averaged RSR functions of NOAA-21 VIIRS in the RSBs. The band names are shown above the RSR profiles using the same color.
Remotesensing 16 02737 g001
Figure 2. A simplified schematic of opto-mechanical modules and On-Board Calibrators (OBCs) of VIIRS [13].
Remotesensing 16 02737 g002
Figure 3. The initial NOAA-21 VIIRS H-factors using prelaunch SDSM LUTs.
Remotesensing 16 02737 g003
Figure 4. NOAA-21 VIIRS normalized operational F-factors (red line) in comparison with lunar and offline SD F-factors in the selected VISNIR bands.
Remotesensing 16 02737 g004
Figure 5. NOAA-21 VIIRS S/MWIR FPA layout [43].
Remotesensing 16 02737 g005
Figure 6. NOAA-21 VIIRS band-averaged offline SD F-factors in the SWIR bands, with the cryo-radiator door open on 8 February 2023 (light-blue dashed line), the first MMOG at 23–25 February 2023 (red dashed line), and the second MMOG at 26–28 February 2024 (green dashed line).
Remotesensing 16 02737 g006
Figure 7. NOAA-21 VIIRS detector-dependent SD F-factor trends over time in band M8. The lines represent delivered F-PREDICTED LUTs and symbols (thick lines) represent daily RSBautoCal derived F-factors. The change from a thin line to a thick line indicates the switch from an F-PREDICTED LUT to an RSBautoCal LUT. RSBautoCal was switched to an F-PREDICTED LUT after the second MMOG.
Remotesensing 16 02737 g007
Figure 8. NOAA-21 VIIRS detector-dependent RSBautoCal SD F-factor trends in SWIR bands on DSL 470. The 32 detectors in band I3 were mapped onto 16 detectors.
Remotesensing 16 02737 g008
Figure 9. NOAA-21 VIIRS detector-dependent RSBautoCal SD F-factors in SWIR bands on DSL 497 after the second MMOG event. Note that the y-scale is the same as Figure 8.
Remotesensing 16 02737 g009
Figure 10. NOAA-21 VIIRS daily DCC reflectance time series and trends in VISNIR bands with the 95% confidence interval (CI) and M-K test results.
Remotesensing 16 02737 g010
Figure 11. NOAA-21 VIIRS daily DCC reflectance time series and calculated trends in SWIR bands with the 95% CI and M-K test results.
Remotesensing 16 02737 g011
Figure 12. The NOAA-21 VIIRS raw and fitted H-factors (lines) using the updated τSDSM function (from yaw and on-orbit SDSM data until 23 April 2023).
Remotesensing 16 02737 g012
Figure 13. The NOAA-21 VIIRS raw and fitted H-factors (lines) using the updated τSDSM function (from yaw and on-orbit SDSM data until 25 March 2024).
Remotesensing 16 02737 g013
Figure 14. The band-averaged offline SD F-factors with the updated H-factors from the on-orbit SDSM data until 6 August 2023 (top) and 25 March 2024 (bottom).
Remotesensing 16 02737 g014
Figure 15. NOAA-21 VIIRS initial SD and lunar F-factor trend comparisons in VISNIR bands.
Remotesensing 16 02737 g015
Table 1. NOAA-21 VIIRS spectral, radiometric, and spatial parameters in the RSBs [11].
BandCenter Wavelength [nm]Full Width at Half Maximum [nm]Thuillier Based Esun [12]
W/[m2 µm sr]
Spatial Resolution at Nadir [m]Gain State
I1641.179.31592.5375Single
I2868.038.6950.2375Single
I31612.963.1245.6375Single
M1411.019.51733.5750High/Low
M2444.917.01940.1750High/Low
M3488.320.11983.9750High/Low
M4555.321.31833.9750High/Low
M5671.421.11502.5750High/Low
M6747.314.81273.4750Single
M7868.338.6949.9750High/Low
M81241.320.6454.7750Single
M91382.015.3362.8750Single
M101613.163.1245.6750Single
M112251.748.078.1750Single
Table 2. NOAA-21 VIIRS scheduled lunar collections (bold font indicates the ones with the preferred sun–satellite–moon angle; asterisk indicates the ones without spacecraft roll maneuvers).
DateTime [UTC]Lunar Phase Angle
2 March 202301:23:47−59.43
1 April 2023 *10:42:07−52.97
1 May 202308:05:33−51.13
31 May 2023 *00:27:01−50.99
28 June 2023 *20:29:43−59.99
23 November 202308:47:57−50.84
22 December 202318:00:20−50.88
21 January 202406:41:33−50.85
19 February 202409:17:30−56.60
20 March 202403:14:31−55.62
Table 3. NOAA-21 VIIRS F-PREDICTED LUT main updates according to dates.
LUT Deployment DateNotes
12 January 2023Initial on-orbit update for VISNIR bands
23 March 2023Initial on-orbit update for SWIR bands
20 April 2023First update for correcting fast changes in SWIR bands
11 May 2023Updated to catch up with fast SWIR band degradation;
added bias correction in band I3 (+1.5%), M8 (+2%), M10 (+2.5%), and M11 (+4%) to better match up with NOAA-20 VIIRS
1 June 2023Updated SWIR band changes
23 June 2023Updated SWIR band changes;
bias correction added in M9 (+2%)
27 July 2023Updated SWIR band changes
17 August 2023Switched to automated RSBautoCal for SWIR band calibration
1 March 2024SWIR F-factors were set to the initial constant levels after the completion of the second MMOG
Table 4. NOAA-21 VIIRS DCC trending results in RSBs.
BandsRefl. AvgSd (%)Max-Min (%)Trd (±95CI, %/yr)Zm-k (M-K Test)Trend Since
M10.9050.95.2450.61 ± 0.31%3.58Upward trend (since 10 February 2023)
M20.9020.95.1210.48 ± 0.31%3.29Upward trend (since 10 February 2023)
M30.90515.8670.88 ± 0.32%5.01Upward trend (since 10 February 2023)
M40.88215.9550.56 ± 0.37%3.04Upward trend (since 10 February 2023)
M50.9020.95.2570.53 ± 0.31%3.01Upward trend (since 10 February 2023)
M70.8780.73.7650.28 ± 0.23%2.43Upward trend (since 10 February 2023)
I10.880.95.4320.70 ± 0.31%4.14Upward trend (since 10 February 2023)
I20.8790.74.1170.31 ± 0.23%2.26Upward trend (since 10 February 2023)
M80.66415.802−0.89 ± 0.64%−2.49Downward trend (since 23 June 2023)
M9 (+0.05)0.5912.111.892−0.76 ± 1.35%−0.37Insignificant (since 23 June 2023)
M10 (+0.35)0.2332.613.694−1.57 ± 1.63%−1.98Downward trend (since 23 June 2023)
M11 (+0.25)0.3562.111.348−1.33 ± 1.30%−2.02Downward trend (since 23 June 2023)
I3 (+0.33)0.2312.613.818−1.49 ± 1.64%−1.93Insignificant (since 23 June 2023)
Disclaimer/Publisher’s Note: The statements, opinions and data contained in all publications are solely those of the individual author(s) and contributor(s) and not of MDPI and/or the editor(s). MDPI and/or the editor(s) disclaim responsibility for any injury to people or property resulting from any ideas, methods, instructions or products referred to in the content.

