Article

BPG-Based Lossy Compression of Three-Channel Remote Sensing Images with Visual Quality Control

by
Fangfang Li
1,
Oleg Ieremeiev
2,
Vladimir Lukin
2 and
Karen Egiazarian
3,*
1
Key Laboratory for Optoelectronic Information Perception and Instrumentation of Jiangxi Province, Nanchang Hangkong University, Nanchang 330063, China
2
Department of Information and Communication Technologies, National Aerospace University, 61070 Kharkiv, Ukraine
3
Department of Computing Sciences, Tampere University, 33720 Tampere, Finland
*
Author to whom correspondence should be addressed.
Remote Sens. 2024, 16(15), 2740; https://doi.org/10.3390/rs16152740
Submission received: 13 May 2024 / Revised: 22 July 2024 / Accepted: 24 July 2024 / Published: 26 July 2024
(This article belongs to the Section Remote Sensing Image Processing)

Abstract

:
A tendency to increase the number of acquired remote sensing images and to make their average size larger has been observed. To manage such data, compression is needed, and lossy compression is often preferable. Since lossy compression introduces distortions, this results in worse classification and object detection. Therefore, lossy compression must be controlled, i.e., the introduced distortions must be under a certain limit. The distortions and the limit can be characterized by different metrics (quantitative criteria). Here, we consider the case of using the HaarPSI metric, which has a very high correlation with visual quality and human attention (saliency map), for three-channel optical band images compressed by the better portable graphics (BPG) encoder, one of the best modern compression techniques. We analyze a two-step procedure of providing a desired visual quality and show its peculiarities for the modes 4:4:4, 4:2:2, and 4:2:0 of image compression. We show how the HaarPSI metric relates to other known metrics of image visual quality and thresholds of distortion visibility. It is demonstrated that the two-step procedure provides about three times better accuracy in providing the desired visual quality compared to the fixed setting of parameter Q that controls compression for the BPG encoder. The provided accuracy is close to the reachable limit determined by the integer value setting of the Q parameter. We also briefly analyze the influence of compression on the classification accuracy of real-life remote sensing data.

Graphical Abstract

1. Introduction

Modern remote sensing (RS) technology generates vast volumes of data, enabling the extraction of valuable information for diverse applications [1,2,3]. This capability arises from its capacity to monitor large territories and estimate various characteristics and parameters. However, the pursuit of enhanced spatial resolution, increased frequency of imaging, and utilization of numerous observation channels (bands) intensifies the challenge of handling big data [4]. Efficiently handling the transmission, processing, and storage of these data becomes increasingly essential considering the advancements in remote sensing technology.
This process involves compressing RS images. As is well known, there are two primary approaches: lossless and lossy compression [5,6]. Lossless compression techniques [5] preserve image fidelity without introducing distortions, but they often yield relatively modest compression ratios (CRs), which may not always be suitable. Conversely, lossy compression methods offer the advantage of achieving substantially higher CR values [6,7,8], presenting an obvious benefit. However, this advantage raises several pertinent questions [9,10]: what is the upper limit for the compression ratio (CR), or how significant can the introduced distortions be? How can distortions be generated at an appropriate level (or below a predetermined threshold) swiftly and precisely enough? What metrics should be used to effectively characterize distortions? Partial answers to these questions have already been provided. Regarding the first question, the achievable compression ratio (CR) depends on several factors, including the acceptable level of distortions, the coding technique employed, the complexity of the image, and the number of image channels (bands). The acceptable level of distortions is primarily dictated by the application and the specific tasks addressed with the acquired RS data. For instance, one common objective might be to achieve visually lossless compression [11,12,13], ensuring that any introduced distortions are imperceptible upon visual inspection. Another crucial task may involve ensuring that the probability of correct classification remains relatively unaffected by lossy compression [10,14,15]. Compared to traditional methods such as JPEG and JPEG2000, many contemporary coding techniques have shown significant performance enhancements [16,17], particularly for images with simpler structures devoid of intricate textures, small details, and sharp edges. However, it is important to note that the degree of introduced distortions typically varies with the complexity of the image [18]. Different parameters serve as the parameter that controls compression (PCC) in various coders, such as the quality factor for JPEG [19] and AVIF [20], bits per pixel (BPP) for JPEG2000 and some other wavelet-based coders [21], a quantization step for coders based on discrete cosine transform [22], and parameter Q for a better portable graphics (BPG) coder [23,24]. Achieving a larger compression ratio (CR) for images with simpler structures and with better coders is often feasible, particularly when considering the inter-channel (cross-band) correlation inherent in multichannel RS images [5,10,22,25,26]. In this study, we focus on the BPG coder, which possesses several features making it appealing for RS image compression [27,28] (elaboration will follow).
The most straightforward answer to the second question is to apply some iterative procedure (see examples in [26]) that presumes multiple compression/decompression of an image with quality control and PCC appropriate change at each iteration. An advantage of such a procedure is that the desired value of a metric that characterizes the compressed image quality can usually be provided with high accuracy. However, its application can be restricted in practice due to the necessity to carry out a priori an unknown number of multiple compressions/decompressions and metric calculations. To partly get around this shortcoming, several approaches have been proposed so far [28,29]. One of them is a two-step approach [29] which presumes that rate/distortion curves for different images are not identical but behave similarly. This makes it possible to obtain an average rate–distortion curve (as the dependence of a given quality metric on a given PCC for a given coder) in advance, to compress a considered image using PCC1 obtained using this average curve to provide a desired quality, to decompress it, to calculate the employed metric, and to adjust PCC2 by linear interpolation. It has been demonstrated [28,29] that this approach often allows providing appropriate accuracy for different metrics and coders. Thus, we concentrate on its applicability in this paper. Regarding the third question, a plethora of metrics serve to characterize the quality of RS images. These range from conventional metrics such as mean square error (MSE) or peak signal-to-noise ratio (PSNR) [10] to visual quality metrics such as SSIM [30], FSIM [31], and more sophisticated metrics leveraging neural networks [32]. The adoption of visual quality metrics in RS imaging has gained popularity for two primary reasons. Firstly, RS images are frequently subjected to visual inspection and interpretation. Secondly, classification tasks, particularly those related to textures and elongated objects (e.g., urban areas, roads, and forests) as well as object detection and recognition performance, strongly correlate with visual quality metrics. These metrics, in the context of lossy compression, assess the preservation of edges, small objects, and textures [33,34,35]. Consequently, a defined set of requirements must be established for the utilization of visual quality metrics. These requirements encompass the following:
-
The metric must rank highly for characterizing image visual quality, demonstrating a strong correlation with mean opinion scores across databases containing various types of distortions resulting from lossy compression.
-
The metric should consider key aspects of the human visual system (HVS), such as saliency [36,37].
-
Understanding its fundamental properties is essential, including the distortion invisibility threshold [38].
-
The metric should be computationally efficient, allowing fast and straightforward calculations [28].
Numerous metrics have been proposed recently, with many partially meeting these criteria. Firstly, it is worth noting that most existing visual quality metrics are primarily designed for characterizing color images. Therefore, our initial focus is on three-channel RS images, which can be treated as color images. Secondly, certain metrics, such as the color version of FSIM (FSIMc), exhibit highly nonlinear behavior in their dependence on the PCC Q for the BPG coder [28], potentially causing complications for the two-step procedure [29]. Thirdly, while some advanced metrics, such as those based on neural networks [32], offer promising capabilities by amalgamating the outputs of multiple elementary metrics, they can be overly complex and computationally demanding. Thus, our attention is directed towards examining the metric HaarPSI [39], renowned for its set of appealing and practical properties, elaborated upon below. The novelty of the paper consists in the following: (1) We evaluate the suitability of HaarPSI for the lossy compression of three-channel RS images, highlighting its advantageous qualities in this context. (2) We illustrate that employing a two-step procedure to achieve a desired HaarPSI value enables achieving satisfactory accuracy across all three compression versions (4:4:4, 4:2:2, and 4:2:0). (3) We outline the distinctive characteristics of the BPG coder tailored for the specific application under consideration. (4) We demonstrate a method for converting the parameters of one effective visual quality metric into practical parameters for another visual quality metric.
The structure of the manuscript is as follows. Section 2 provides a comprehensive examination of the properties of the HaarPSI metric and compares it to other metrics. Section 3 outlines the two-step procedure and presents the findings that assess its accuracy concerning the BPG coder and HaarPSI metric. Further discussion is presented in Section 5. The paper concludes with final remarks and suggestions for future research directions.

2. Advantages and Properties of the Considered Coder and Metric

The BPG coder [23], freely accessible at http://bellard.org/bpg/ (accessed on 7 May 2024), offers several notable advantages. Firstly, it consistently achieves higher compression ratios (CRs) for equivalent qualities compared to well-known counterparts such as JPEG or JPEG2000 [40], especially for images with simpler structures. This is mainly due to the use of a variable block size and adaptation to image content. Secondly, its compatibility with popular web browsers enhances its accessibility. In addition, BPG can be supported in hardware with standard HEVC decoders and encoders. BPG natively supports 8 to 14 bits per channel, providing a higher dynamic range, which is important for cameras, new displays, and in RS applications. Thirdly, BPG supports a wide range of formats, including grayscale; YCbCr 4:2:0, 4:2:2, and 4:4:4; and common color spaces such as RGB, YCgCo, and CMYK. The 4:2:2 (default) and 4:2:0 formats offer significantly higher CRs compared to the 4:4:4 format for the same quality setting (Q), with the greatest relative benefit observed at lower Q values [41]. However, the 4:2:2 and 4:2:0 formats, which involve color component downsampling, result in PSNR values that are not high, even for low Q values (approximately 36–39 dB). Nonetheless, the introduced distortions remain imperceptible. The parameter Q serves as the primary control parameter (PCC) for the BPG coder and is restricted to integer values ranging from 1 to 51. This characteristic can be viewed as both advantageous and limiting. For example, the integer nature of Q, similar to the quality factor in JPEG, simplifies the control of compressed image quality. Particularly for grayscale images, there is a broad range of Q values where the PSNR decreases almost linearly with increasing Q (approximately 1 dB reduction in PSNR for every increment of 1 in Q) [42]. It is worth noting that within the range of Q variation corresponding to visible distortions, a 1 dB difference in PSNR translates to a perceptible change in quality. Consequently, an error in achieving a desired PSNR can be as high as 0.5 dB. Similar effects can be observed with other quality metrics, a topic that will be further elaborated in Section 3.
Introduced in 2018, HaarPSI stands as a novel visual quality metric. Described by its authors as a “Haar wavelet-based perceptual similarity index”, it serves as a measure for evaluating the perceptual similarity between two images from a human viewer’s perspective (https://www.math.uni-bremen.de/cda/HaarPSI/#Experimental%20Results (accessed on 7 May 2024)). The HaarPSI metric uses a comprehensive visual quality assessment, presented in detail in [39]. It unites the FSIM approach to estimate the similarity of reference and distorted images by feature maps derived from the phase congruency measure and local gradients with the advantages of a wavelet transform, such as the significantly higher overall computational performance of the Haar wavelet, and the implementation of the high-frequency wavelet filter as the replacement of the gradient filter, directly computing the phase congruency measure from the output of a multi-scale complex-valued wavelet filterbank. HaarPSI boasts two primary advantages over its counterparts, the best existing elementary metrics: firstly, its significant correlation with mean opinion scores across popular databases (https://www.math.uni-bremen.de/cda/HaarPSI/#Experimental%20Results (accessed on 8 May 2024)), and secondly, its high computational efficiency (https://www.math.uni-bremen.de/cda/HaarPSI/publications/HaarPSI_preprint_v4.pdf (accessed on 8 May 2024)).
These advantages primarily stem from the use of fast Haar wavelets and visual attention mechanisms, particularly saliency. Alongside metrics such as MDSI [37], FSIMc [31], and others, HaarPSI stands out as one of the most effective general-purpose (universal) elementary metrics. By “universal”, we mean metrics capable of adequately assessing image quality across a diverse range of distortion types, as exemplified in databases such as TID2013 [38] or CSIQ (https://qualinet.github.io/databases/image/categorical_image_quality_csiq_database/ (accessed on 8 May 2024)). Furthermore, by “elementary”, we refer to metrics that do not rely on neural networks for feature combination or utilize multiple metrics as inputs [32].
While universality is undoubtedly valuable, there may arise a need for a specialized metric tailored to specific applications or types of distortions. Therefore, we aim to illustrate how HaarPSI can serve this purpose effectively.
In [43], the Spearman rank order correlation coefficient (SROCC) was computed between various high-performance elementary metrics and the mean opinion score (MOS) for the TID2013 database [38], considering several subsets of distortion types, including the Noise&Actual subset, which holds relevance for most applications. HaarPSI exhibited an SROCC of 0.9190 (with the highest observed value for MDSI at 0.9374, and FSIMc and PSNR-HVS-M registering SROCC values of 0.9164 and 0.9188, respectively).
It is worth noting the significant SROCC values observed between these top performing metrics—namely −0.974 for HaarPSI and MDSI (the negative value arose because HaarPSI tends towards the largest possible values while MDSI approaches minimal values for ideal visual quality) and 0.986 for HaarPSI and FSIMc. This suggests that these metrics can be effectively interrelated through pre-established approximations. For further insights, we analyzed a subset of the TID2013 database focusing solely on three types of distortions associated with lossy compression: those resulting from JPEG (#10), JPEG2000 (#11), and lossy compression of noisy images (#21). We then computed the Spearman rank order correlation coefficient (SROCC) between this subset and the MOS.
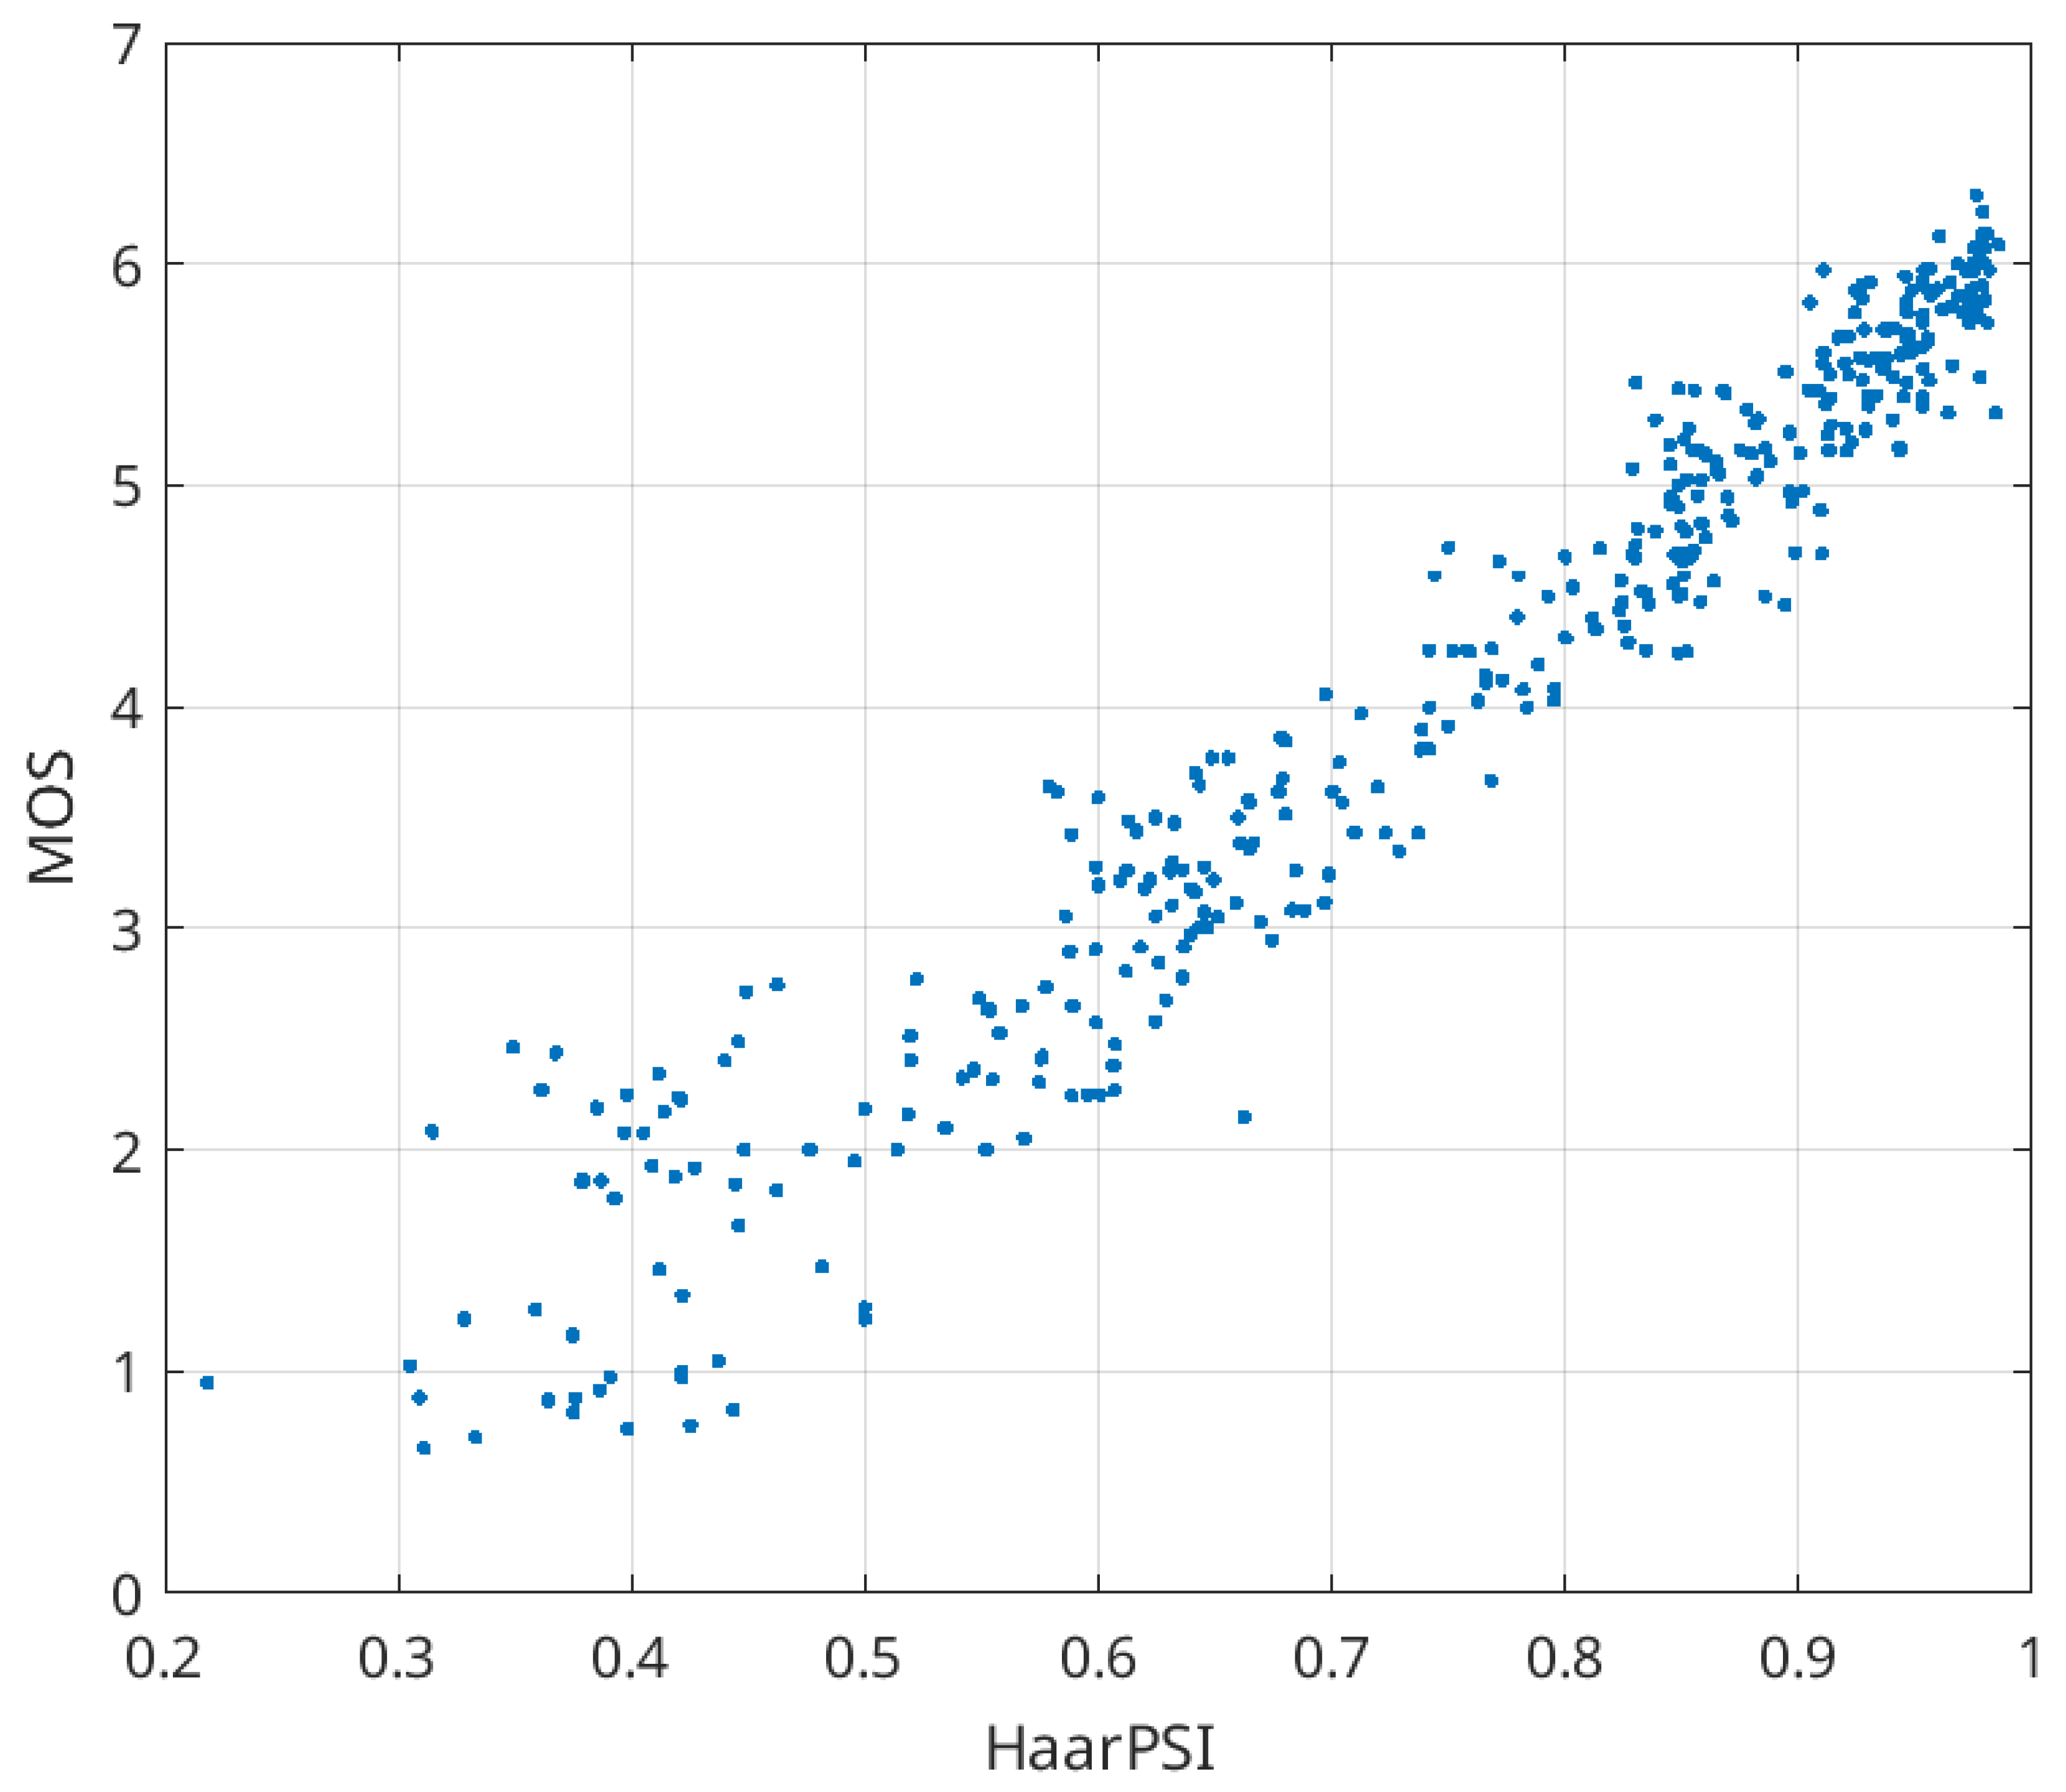
Remarkably, we found that several metrics yielded absolute SROCC values within the range of 0.96 to 0.97. Specifically, PSNR-HVS-M [44] scored 0.961, FSIMc achieved 0.962, MDSI recorded 0.966, and HaarPSI reached 0.968. Note that the SROCC for SSIM (0.893) was lower than that for PSNR (0.914). This indicates that the top performing metrics approach the theoretical limit of correlation with the MOS. A more in-depth examination revealed additional advantageous properties of HaarPSI. In Figure 1, a scatter plot of HaarPSI against MOS values for all distortion types in TID2013 is presented (with higher MOS values indicating better visual quality). The positive aspects observed are as follows: (1) the relationship is nearly linear, facilitating accurate conversion of HaarPSI to MOS with minimal approximation errors when necessary; (2) abnormal points (outliers) are scarce, affirming the universality of the metric under consideration (SROCC = 0.873).
Figure 2 illustrates the scatter plot of HaarPSI versus MOS values for three distortion types related to image lossy compression. Once again, we can observe a practically linear relationship with minimal outliers (SROCC = 0.968). Lastly, in Figure 3, we present the scatter plot illustrating the relationship between HaarPSI and PSNR-HVS-M. While this relationship is not linear, it displays a smooth pattern. The Spearman rank order correlation coefficient (SROCC) equals 0.969, indicating a high correlation between the metrics. Indeed, the metrics can be effectively interrelated. We conducted tests using two Matlab functions: “power2” and “poly2”. As a result of applying the power function, the following approximation was derived:
PSNR-HVS-M = 27.34 × HaarPSI2.839 + 16.61
We obtained goodness-of-fit R2 [45] and root mean square error (RMSE) values equal to 0.975 and 0.983, respectively, showing that the approximation is good. For polynomial approximation, the following expression can be used:
PSNR-HVS-M = 52.37 × HaarPSI2 − 32.16 × HaarPSI + 23.4
Here, R2 = 0.974 and RMSE = 0.988. Thus, both approximations are almost equally good.
It is also possible to recalculate PSNR-HVS-M to HaarPSI. For this purpose, one can use the expression HaarPSI = −0.0005338 × PSNR-HVS-M2 + 0.053923 × PSNR-HVS-M − 0.3612 (R2 = 0.9771, RMSE = 0.0201, i.e., the approximation is good as well).
The scatter plot presented in Figure 3, along with the provided equations, offers insights into estimating the distortion visibility threshold for HaarPSI, especially if a similar analysis has been previously conducted for another metric, such as PSNR-HVS-M. The study by [38] demonstrated that the distortion invisibility threshold averages around 41 dB. Consequently, it approximates to 0.95 for HaarPSI. Further investigation revealed that the first point of just noticeable distortions (JNDP1) for the BPG coder ranges from 35 to 49 dB, indicating that JNDP1 for HaarPSI falls between 0.87 and 0.97. Of course, conducting more detailed research would be necessary to confirm these findings definitively.
In practical terms, lossy compression likely achieves visual losslessness for Q values up to 28 in the 4:4:4 mode, up to 27 for the 4:2:2 option, and up to 26 for the 4:2:0 option. These conclusions are based on data collected from a series of 21 test fragments, each with three channels, as detailed in the following section.

3. Two-Step Procedure for BPG-Based Compression with Providing a Desired HaarPSI

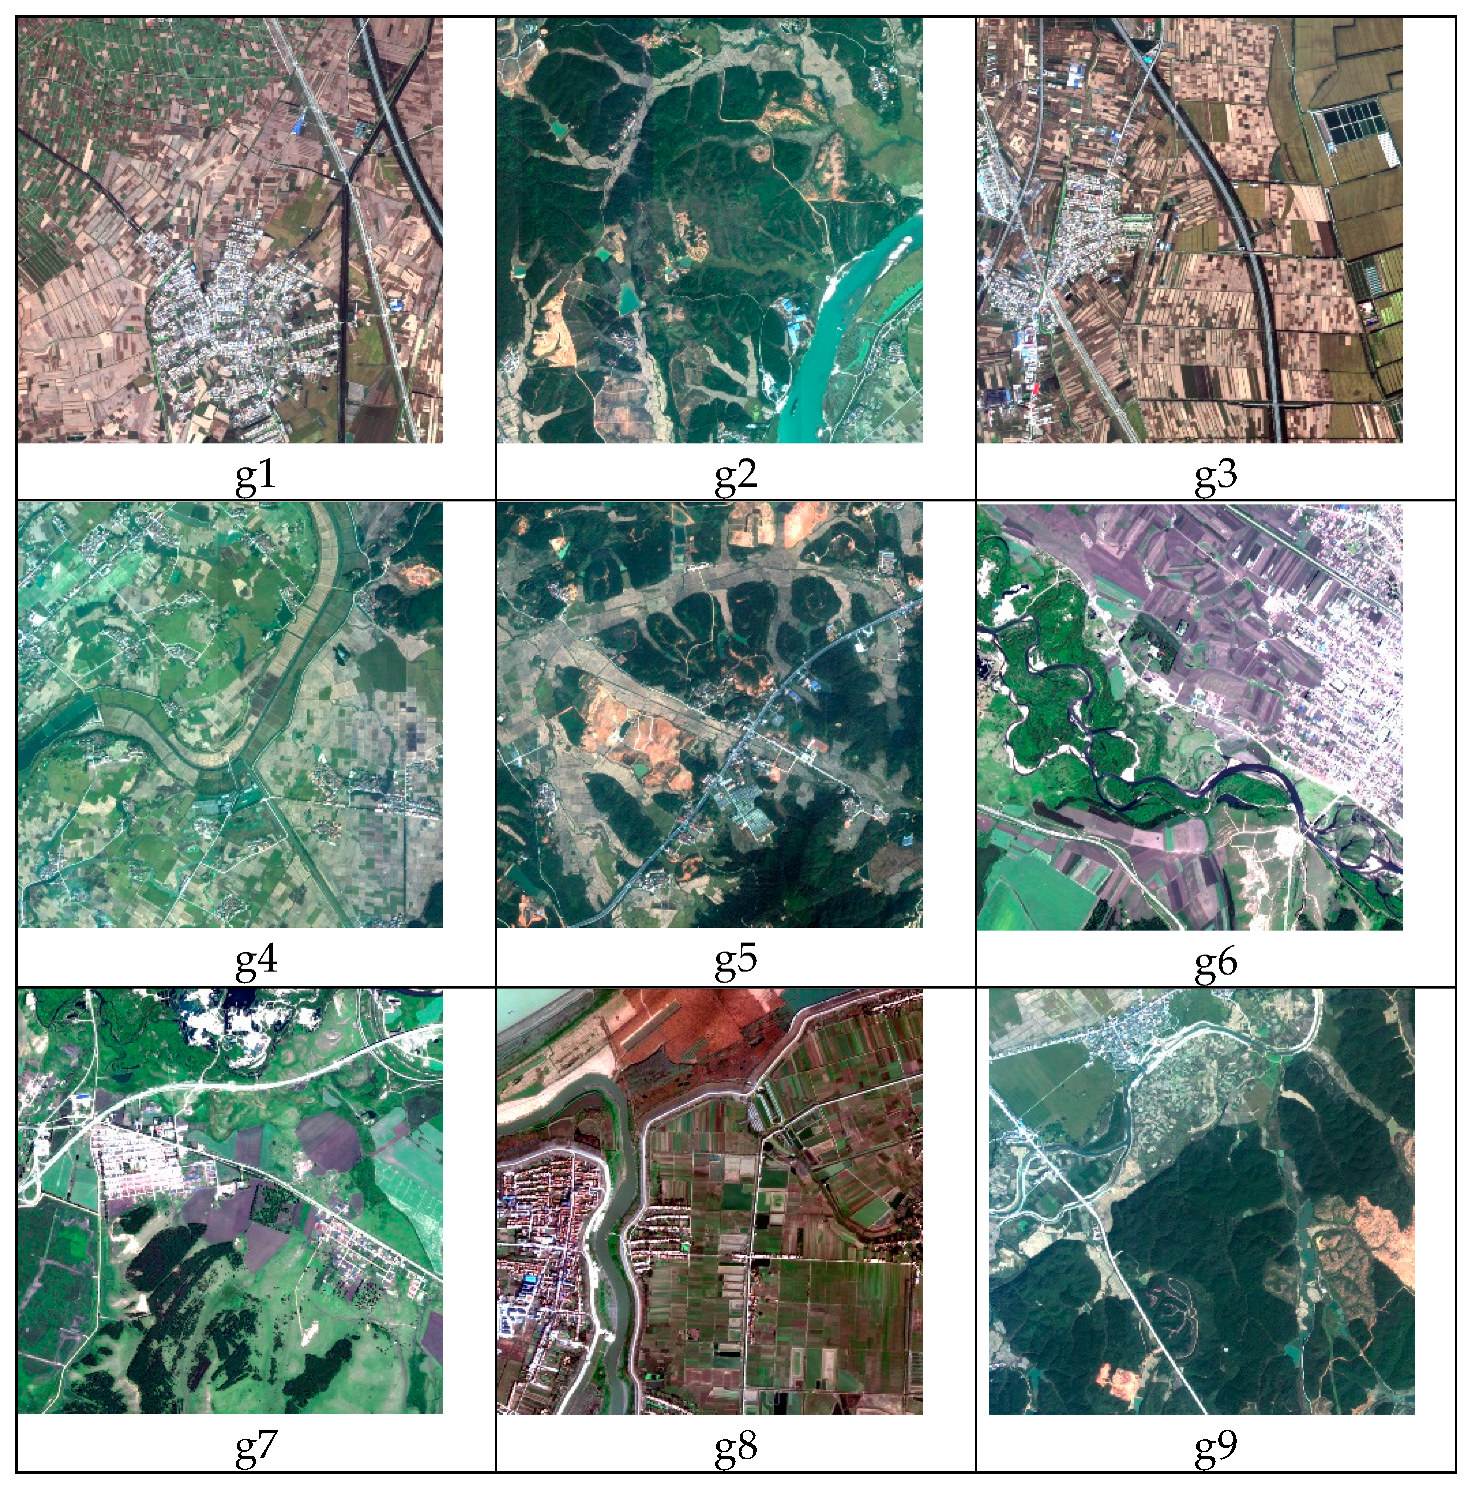
Let us begin by examining a large three-channel image captured by the Gaofen-2 satellite imager [46]. Preliminary analysis was conducted using nine fragments, each sized at 1024 × 1024 pixels, as depicted in Figure 4. These fragments represent typical remote sensing (RS) image segments of approximately equal complexity.
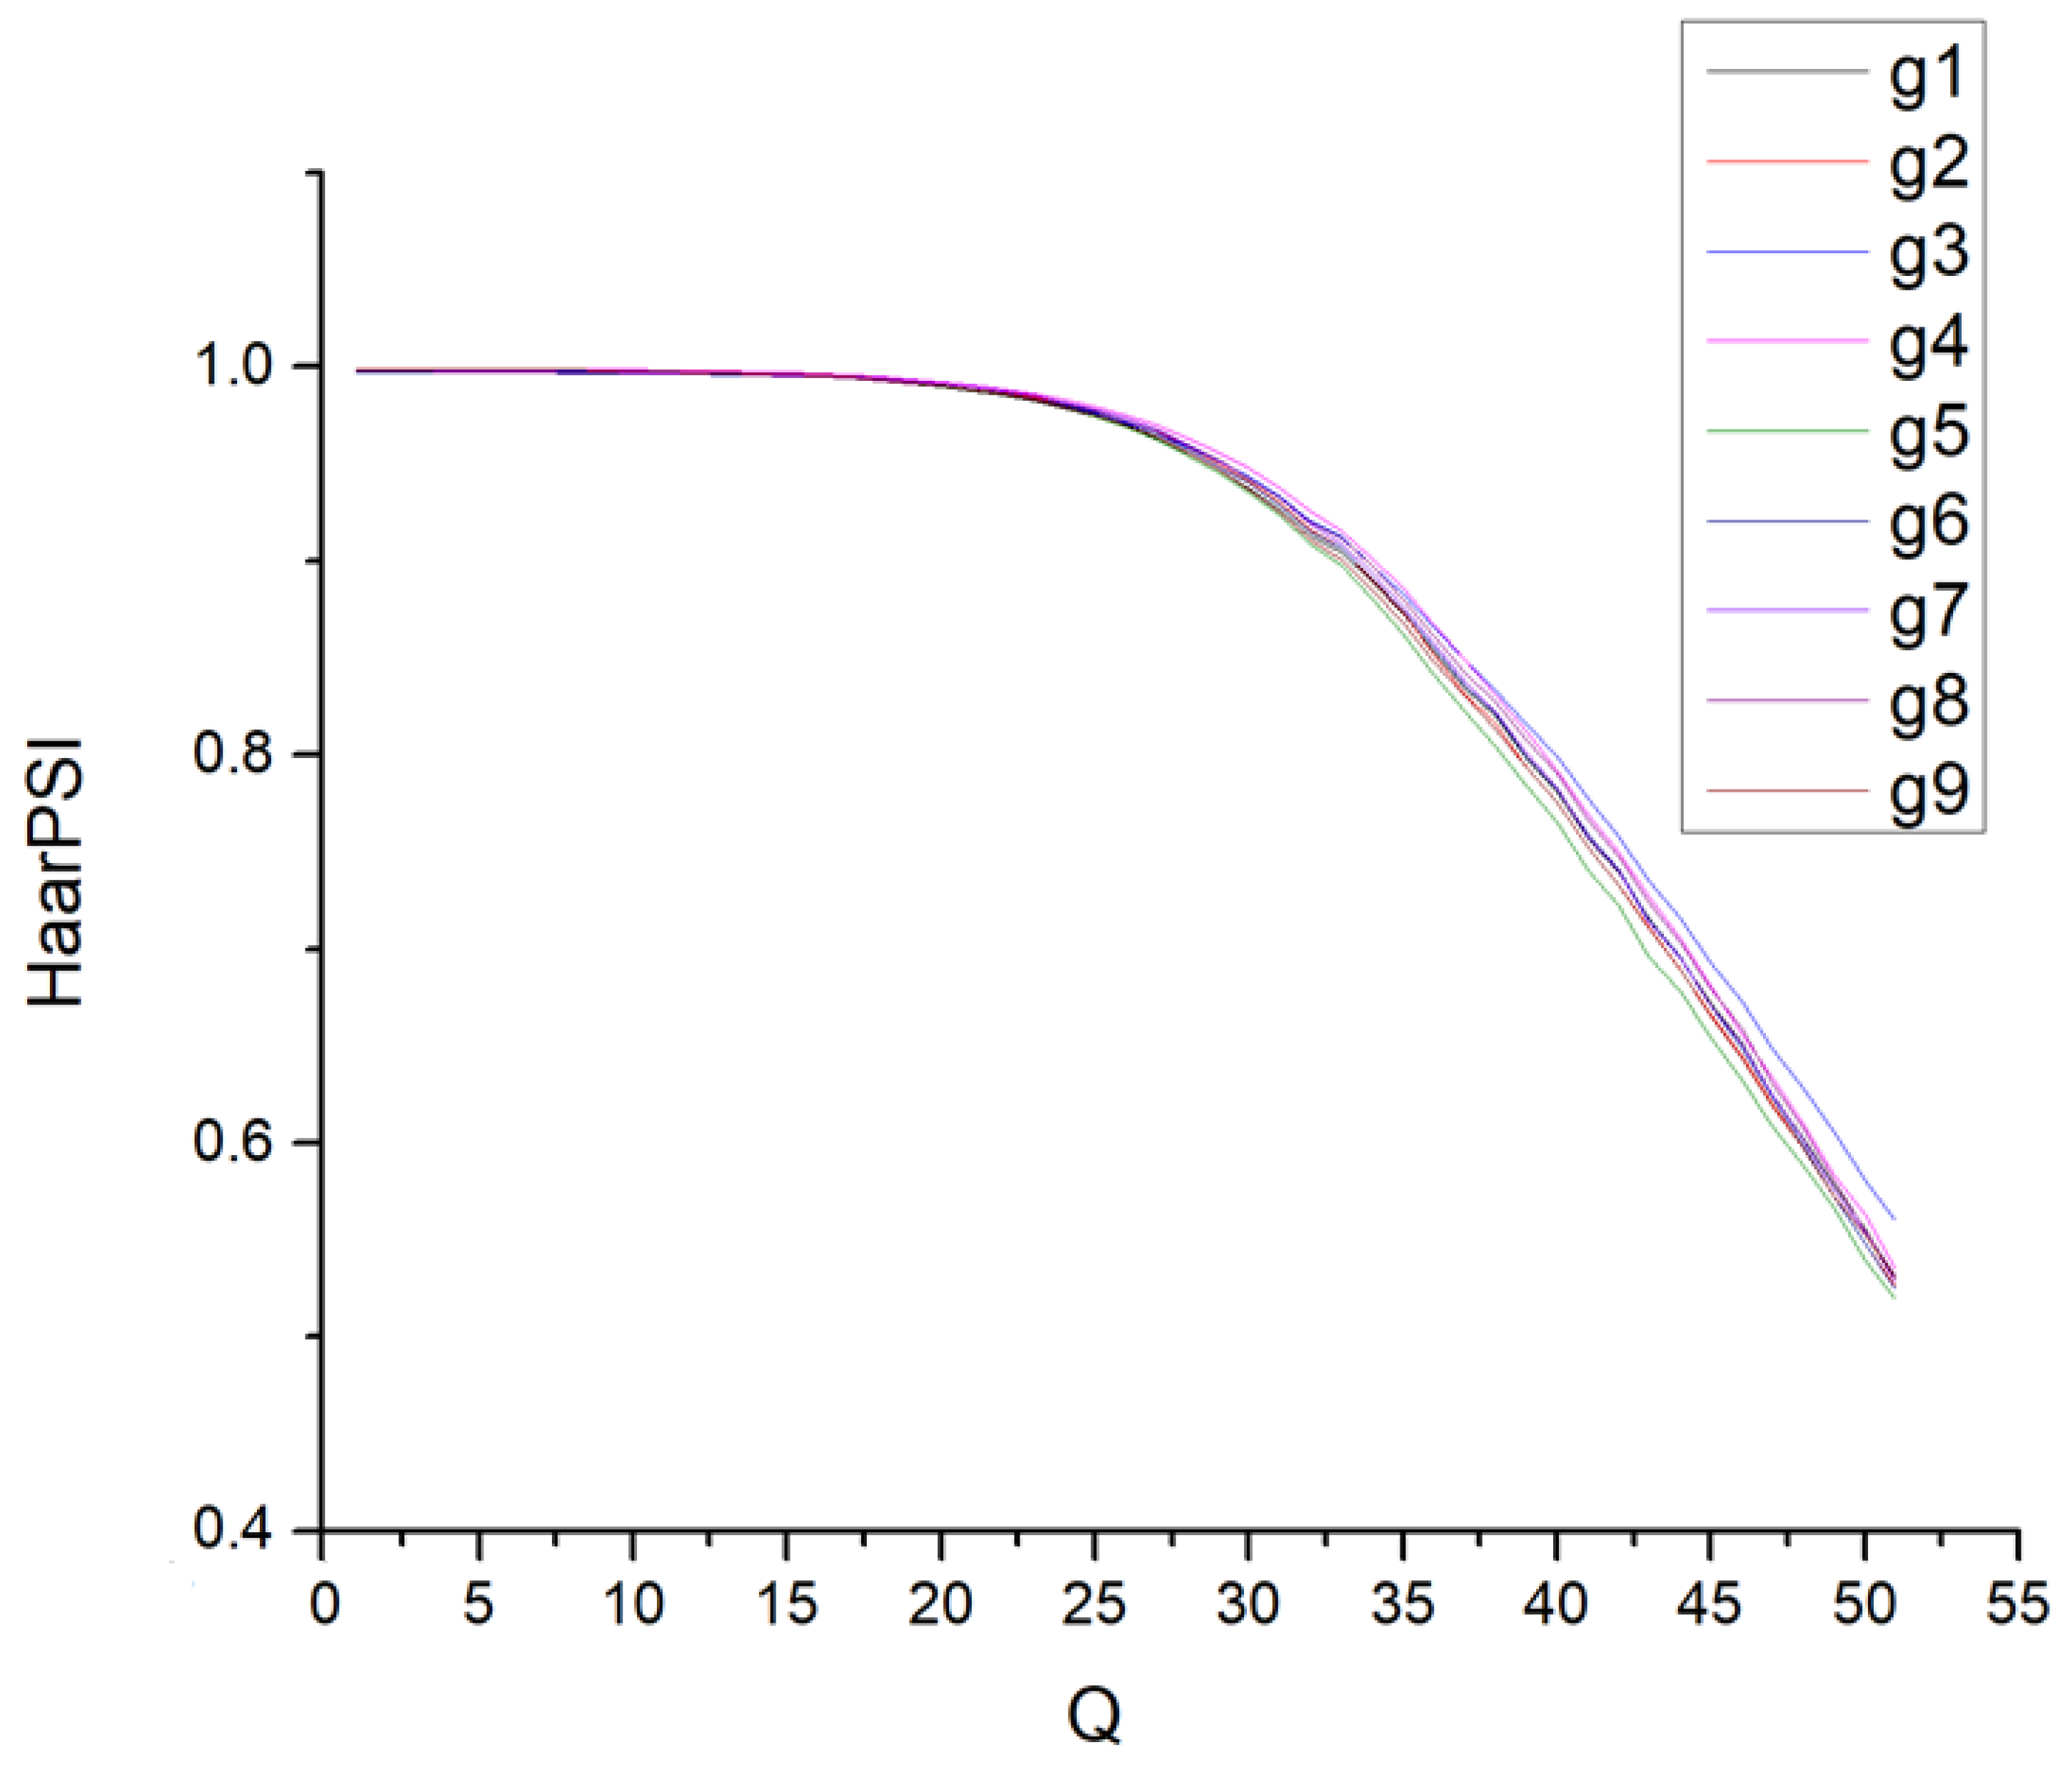
Figure 5 illustrates the dependencies of HaarPSI on Q for these fragments, focusing on the default mode 4:2:2. As seen, the curves nearly overlap for Q values ≤ 30 and remain closely aligned for Q values above 30. Unlike similar dependencies observed for FSIMc, the relationship between HaarPSI and Q is less nonlinear (refer to the plots in Figure 2 in [47]). While it might appear feasible to recommend a fixed Q value to achieve a desired HaarPSI, this is not the case—at least not within the primary range of Q variation from 25 (indicating invisible distortions) to 45 (indicating visible but tolerable distortions).
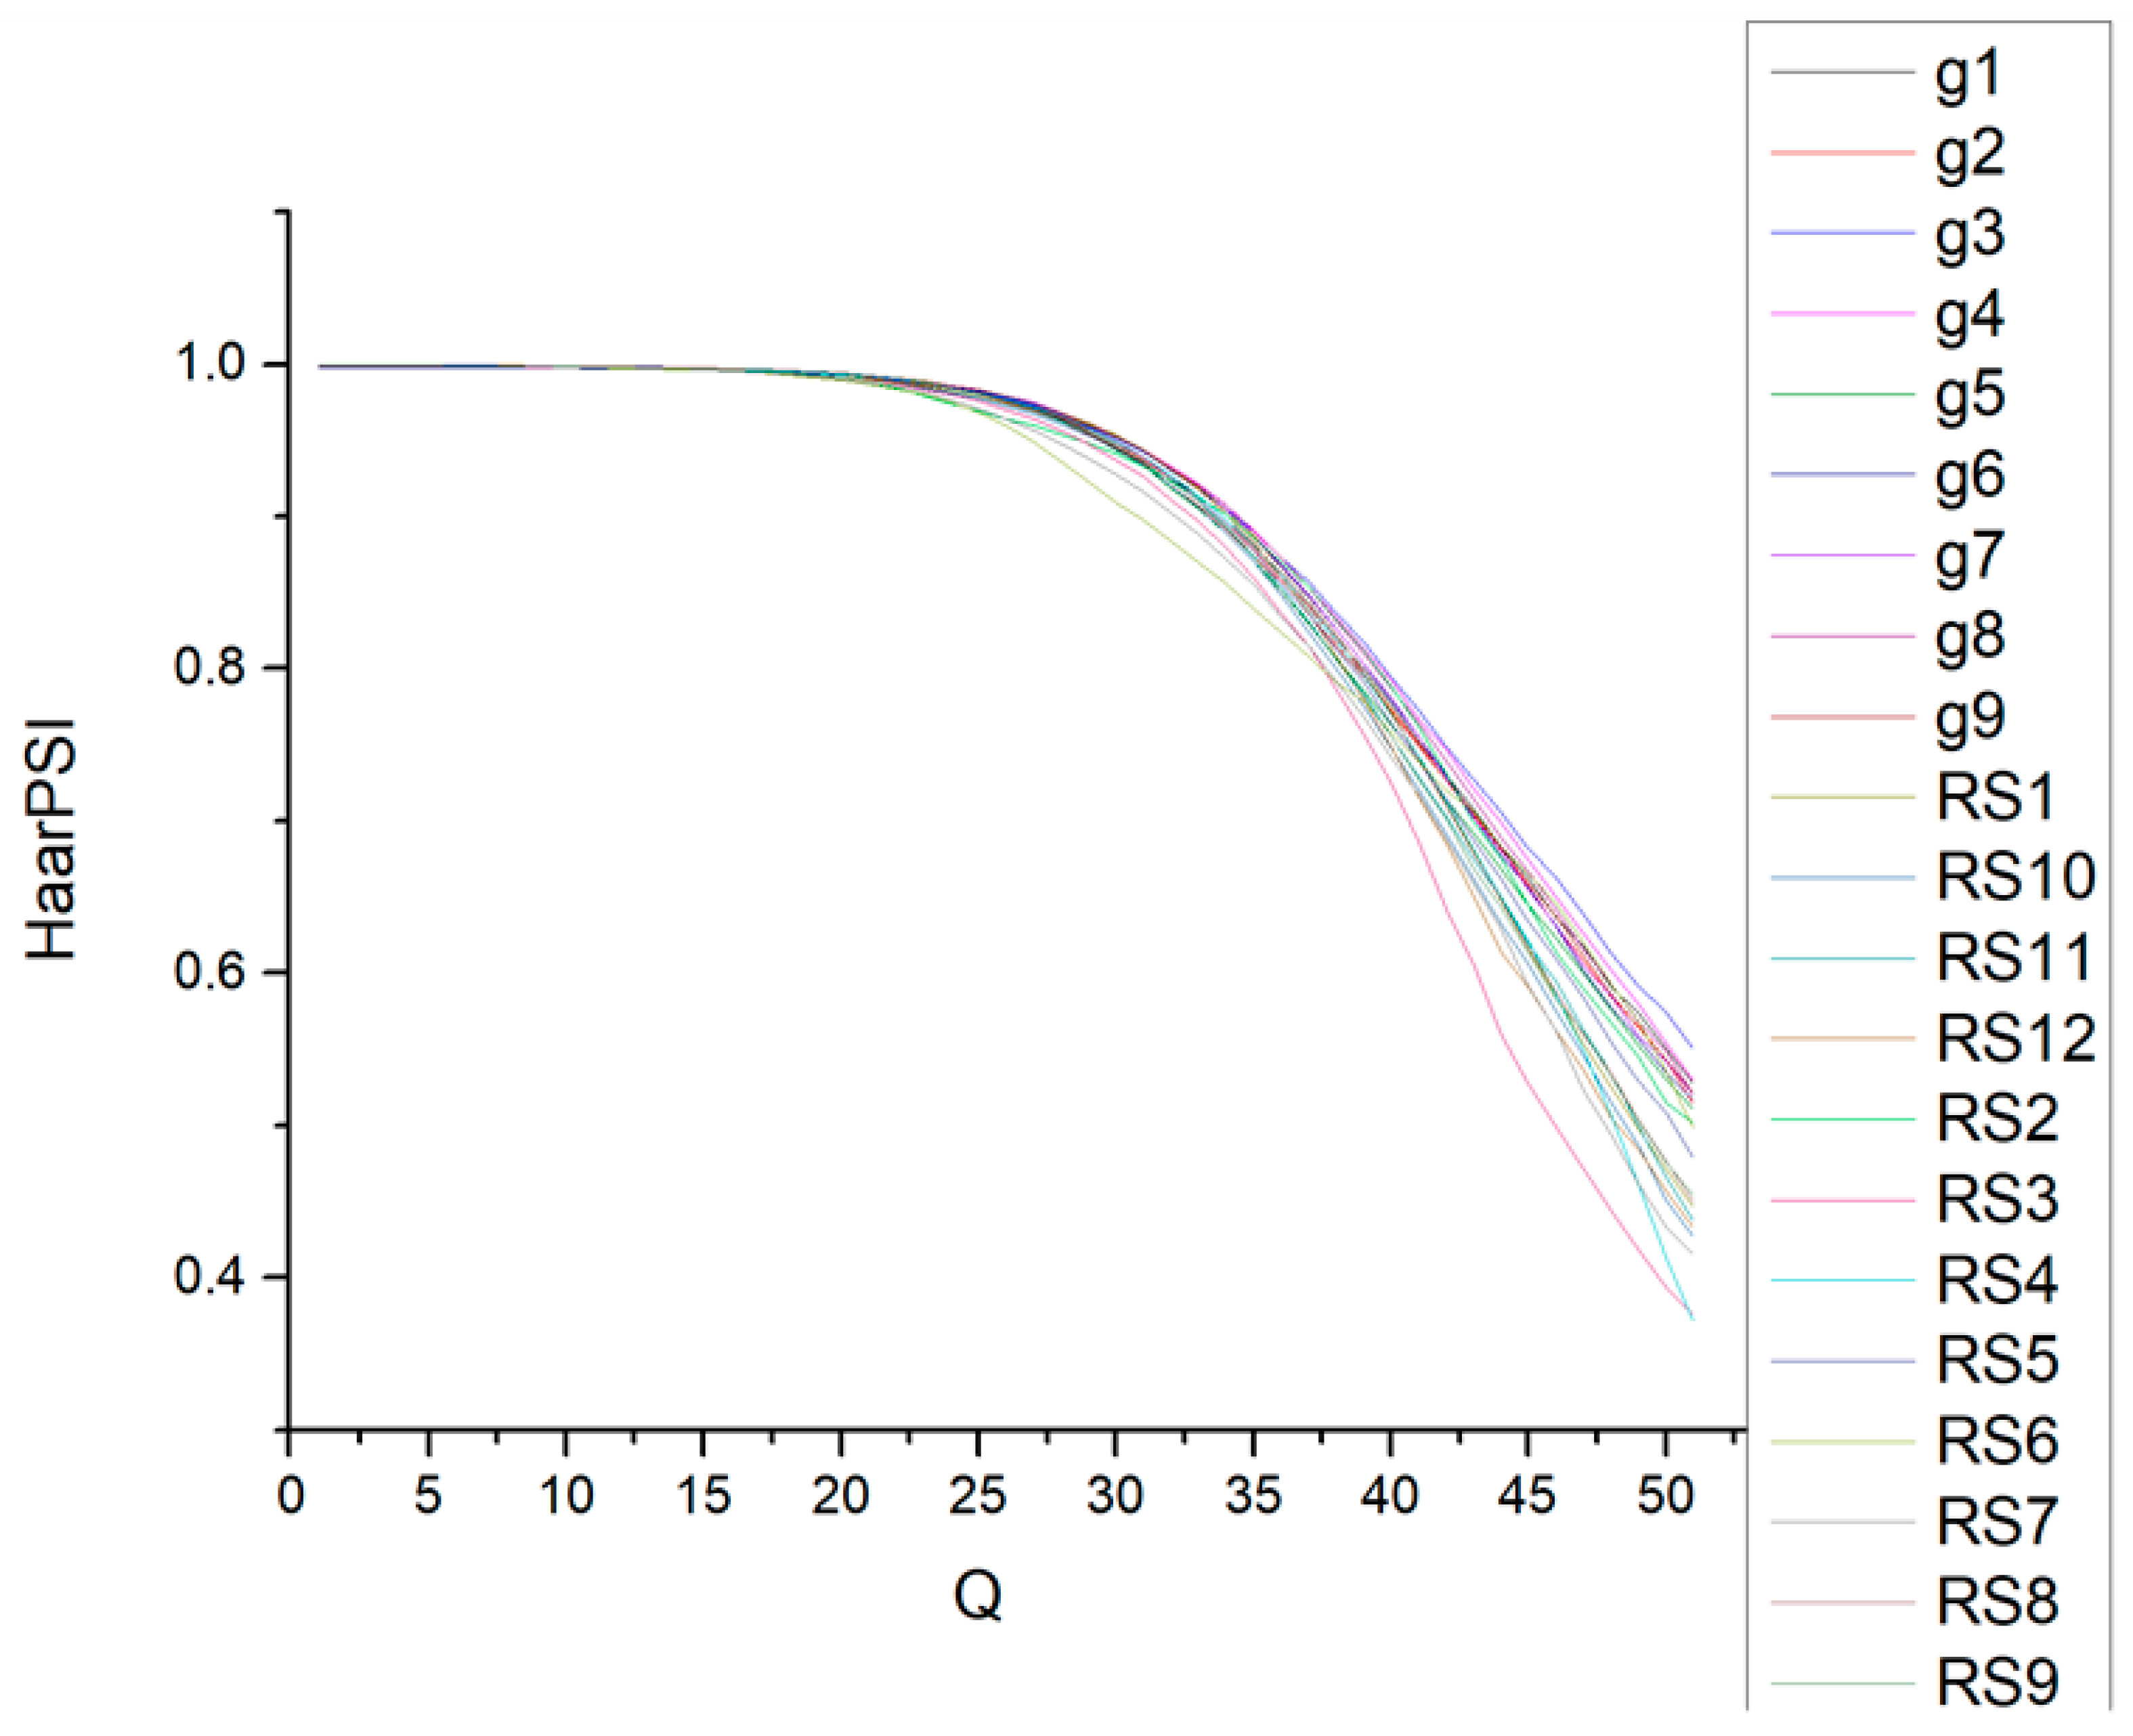
To validate this, we considered 12 three-channel image fragments, each sized at 512 × 512 pixels, with their smaller representations presented in Figure 6. The 12 obtained dependencies, along with the previously depicted curves in Figure 5, are illustrated in Figure 7. Here, a greater diversity in HaarPSI values for the same Q is evident, particularly noticeable for higher Q values (beginning from approximately Q ≈ 25). This variance is attributed to the diverse levels of image complexity present within the dataset. Images with complex structures, such as image RS6 in Figure 6, exhibit different HaarPSI values compared to those with simpler structures, such as images RS2 and RS8 in Figure 6.
This implies that nearly identical HaarPSI values may occur for different Q values depending on the image complexity. For instance, HaarPSI ≈ 0.8 could be observed for Q values ranging from 37 for image RS6 in Figure 6 (HaarPSI = 0.808) to 40 for image g4 in Figure 4 (HaarPSI = 0.792). Consequently, setting a fixed Q value, such as Q = 39, would result in HaarPSI = 0.778 for image RS6 and HaarPSI = 0.813 for image g4. Employing a fixed Q may lead to significant errors in achieving a desired HaarPSI, whereas individually setting Q for each image can enhance the accuracy of attaining the desired HaarPSI.
The average dependencies of HaarPSI on Q for all three modes are summarized in Table 1. For Q values ≤ 20, the average HaarPSI exceeded 0.99 for all three modes, indicating that the introduced distortions are negligible and imperceptible. Subsequently, the rate of average HaarPSI reduction accelerates with increasing Q values.
The average HaarPSI (HaarPSIaver) consistently remained slightly higher in the 4:4:4 mode compared to the other two modes. In the case of the 4:2:2 mode, the average HaarPSI was marginally higher than that of the 4:2:0 mode for Q values up to 39. However, for Q values exceeding 39, the situation reversed. Around the distortion visibility threshold (typically at Q ≈ 27), the average HaarPSI reached its peak for the 4:4:4 mode, indicating that a slightly higher Q value may be used on average to ensure distortion invisibility for this mode. Due to the nonlinear nature of HaarPSIaver(Q), the difference between HaarPSI(Q + 1) and HaarPSI(Q) varies with Q, with its absolute value increasing as Q increases. Assuming a uniform distribution of errors in achieving the desired HaarPSI for images, the variance of these errors is approximately (HaarPSI(Q + 1) − HaarPSI(Q))2/12. For example, this variance is approximately 0.000004 for Q = 28 and 0.00004 for Q = 39. This illustrates that the residual errors in achieving a desired HaarPSIdes increase as HaarPSIdes becomes smaller. However, a quantitative analysis is required to provide a more accurate assessment.
Therefore, we used the two-step procedure for achieving the desired HaarPSI. In the first step, the data from Table 1 were utilized to select an initial Q value, denoted as Q1. For instance, to attain HaarPSIdes = 0.9 in the 4:2:2 mode, Q1 = 34 would be chosen, as it yields the smallest absolute difference ǀHaarPSIdes-HaarPSIaver(Q)ǀ. For the images analyzed in Section 2, this resulted in HaarPSI(Q = 34) ranging from 0.856 to 0.908, indicating a rather broad range. Consequently, adjusting Q based on image properties appears to be a reasonable approach.
The adaptation process is facilitated by the second step of the two-step procedure. Consider compressing the image of interest using Q1, then decompressing it and calculating HaarPSI1. If HaarPSI1 is less than HaarPSIdes, it suggests that a smaller Q could potentially yield a smaller error compared to ǀHaarPSI1 HaarPSIdesǀ, and vice versa. We use “potentially” because there is a chance that ǀHaarPSI1 HaarPSIdesǀ could be smaller than ǀHaarPSI(Q1 + 1) HaarPSI(Q1)ǀ/2, rendering the second step of adjusting to a better Q unnecessary. Conversely, if this is not the case, we need to determine Q2, which improves upon Q1 in terms of bringing HaarPSI2 closer to HaarPSIdes than HaarPSI1. There are various approaches to achieving this. Our proposed method sets Q2 as follows:
Q2 = Q1 + [dHaarPSI(Q1)(HaarPSIdes − HaarPSI(Q1))]ni
where dHaarPSI(Q1) is the derivative of the corresponding average dependence HaarPSIaver(Q) in Q = Q1 and []ni denotes rounding-off to the nearest integer. dHaarPSI(Q1) can be determined in two ways: as HaarPSIaver(Q1 + 1) HaarPSIaver(Q1) or as (HaarPSIaver(Q1 + 1) HaarPSIaver(Q1 − 1))/2 for the corresponding mode using the data in Table 1. Of course, 1 ≤ Q2 ≤ 51.
We conducted tests on the described two-step procedure using a set of nine image fragments as shown in Figure 1. We calculated the following parameters: Mean1 and Mean2, representing the mean values of HaarPSI1 and HaarPSI2 (HaarPSI after the second step), respectively, and Var1 and Var2, indicating the mean squared errors (MSEs) in achieving the desired HaarPSI after the first and second steps, respectively. The data for the 4:4:4 mode are compiled in Table 2 for three values of HaarPSIdes: 0.98 (indicating invisible distortions), 0.9 (visible distortions), and 0.8 (clearly visible distortions). HaarPSI1 for a group of images may exhibit significant bias, but the second step effectively mitigates this bias. Var2 was significantly (several times) smaller than Var1, indicating a considerable enhancement in accuracy. In 19 out of 27 cases, Q2 and Q1 differed, indicating the effectiveness of the procedure in adjusting compression parameters. Meanwhile, in 8 out of 27 cases, the second step was unnecessary, leading to faster compression. Furthermore, Var2 was only marginally larger than (HaarPSI(Q1 + 1) − HaarPSI(Q1))2/12, highlighting that the procedure achieves an accuracy close to the potential limit imposed by the integer nature of Q.
The data for the mode 4:2:2 are presented in Table 3. As one can see, the Q1 values are slightly smaller than the corresponding values in Table 2. The HaarPSI1 values were biased, but after the second step, the bias significantly decreased. The MSE values, in two out of three cases, also decreased. Thus, the accuracy improved due to the second step. The second step was useful in 21 out of 27 cases.
Finally, Table 4 presents the data for the 4:2:0 mode. For HaarPSIdes values of 0.98 and 0.90, both the absolute bias values and MSEs were significantly reduced because of the two-step procedure. In the case of HaarPSIdes equal to 0.8, the MSE significantly decreased (with bias nearly approaching zero for both the first and second steps). The second step was required in 21 out of 27 cases, highlighting the improvement in accuracy due to this additional step. Therefore, it can be reaffirmed that the inclusion of the second step enhanced the accuracy.
In summary, the two-step procedure demonstrated efficacy across all three modes and for the primary range of HaarPSIdes values of interest. In most cases, the second step proved necessary, and when implemented, it consistently yielded HaarPSI2 values closer to HaarPSIdes than HaarPSI1. While this observation is not explicitly stated in Table 2, Table 3 and Table 4, it has been consistently noted through individual image analyses.

4. Discussion and Practical Aspects

4.1. Verification Results

One can argue that we have analyzed the two-step approach performance for images used in obtaining average curves. To show that the approach work for other data as well, we verified it for twelve images, RS13–RS24, taken from the same suite as RS1–RS12. The default 4:2:2 mode [48] has been studied. The obtained data are presented in Table 5. Due to the second step, bias was significantly reduced for HaarPSIdes equal to 0.9 and 0.8. The MSE decreased by several times as well. In 19 out of 36 cases, Q2 differed from Q1.
Thus, it is possible to state that the two-step approach performs well for data not used at the “training stage” when the average curve was obtained.

4.2. Classification Aspects

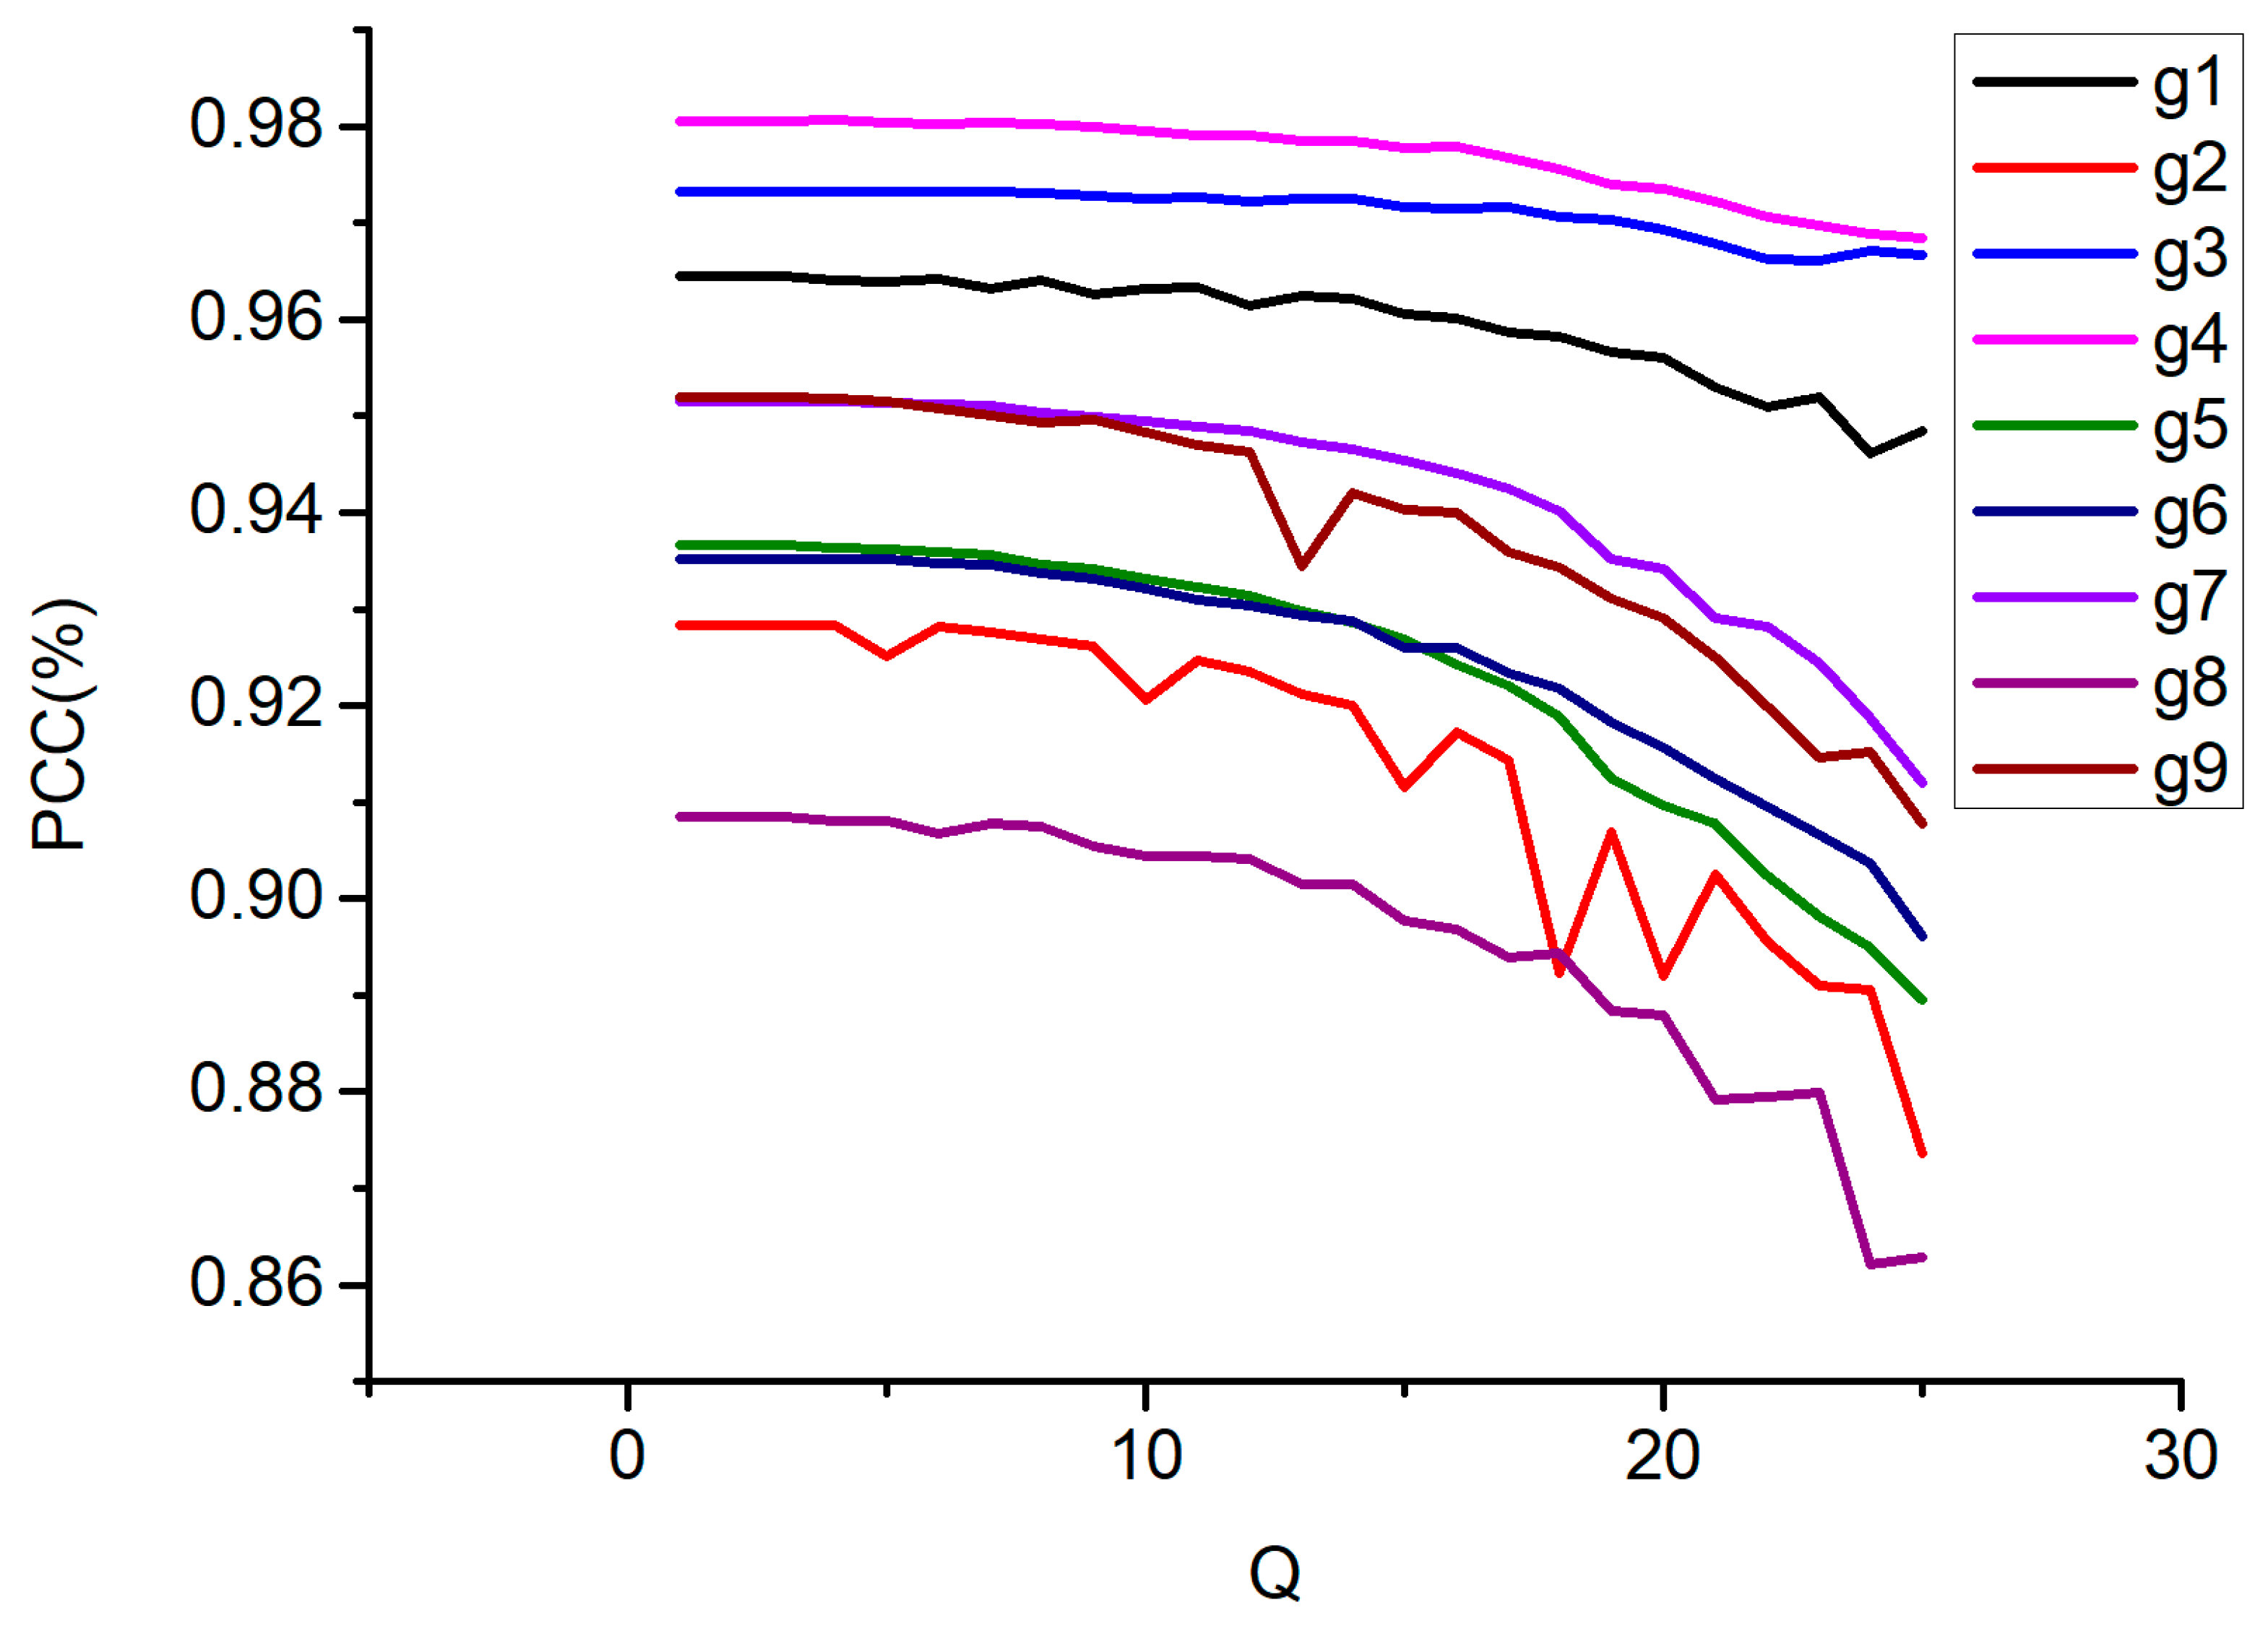
Here, we provide an example where controlling image quality becomes necessary. Lossy compression generally leads to reduced classification of remote sensing (RS) images compared to their original, uncompressed counterparts. Consequently, it becomes important to determine the “cost” of employing lossy compression, i.e., the reduction in RS data size. This cost can be quantified by the reduction in the probability of correct classification, which may vary depending on the specific application or other relevant factors. For instance, a decrease of approximately 0.02–0.04 (2–4%) might be considered acceptable in certain scenarios. A support vector machine (SVM) classifier [49,50], trained and applied pixel-wise, was employed for classifying the images depicted in Figure 4. The classification task encompassed five classes [51]: Built-in, Meadow, Farmland, Forest, and Water. Training was conducted using uncompressed RS data, with the overall probability of correct classification (PCC) serving as the primary quantitative metric. The relationship between the PCC and Q for images compressed using the BPG coder for the image fragments is illustrated in Figure 8. Across all image fragments, a consistent trend emerged: PCC declines with increasing Q, albeit with some fluctuations. Typically, a higher initial PCC value at Q = 1 correlates with a slower rate of reduction. On average, a 3% decrease in PCC can be observed around Q ≈ 24, corresponding to HaarPSI ≈ 0.98, where the incurred losses are, as previously mentioned, imperceptible. Thus, the CR values for the images in Figure 4 range from 6 to 17 depending on the image complexity and format.
One might argue that, in the scenario under consideration, setting the appropriate Q value (24) or achieving the desired quality based on HaarPSI yields the same outcome. While this holds, it is essential to consider two key points. Firstly, our findings indicate that a fixed Q setting results in varying image quality levels based on image complexity. Secondly, aside from BPG, other coding methods can be employed for RS image compression, making recommendations based on HaarPSI thresholds more universally applicable. Certainly, a more comprehensive investigation into classification accuracy is warranted. Nonetheless, our results align with previous findings, such as those outlined in [10], underscoring the importance of ensuring that compression achieves visual losslessness to prevent significant reductions in PCC.

4.3. Other Practical Aspects

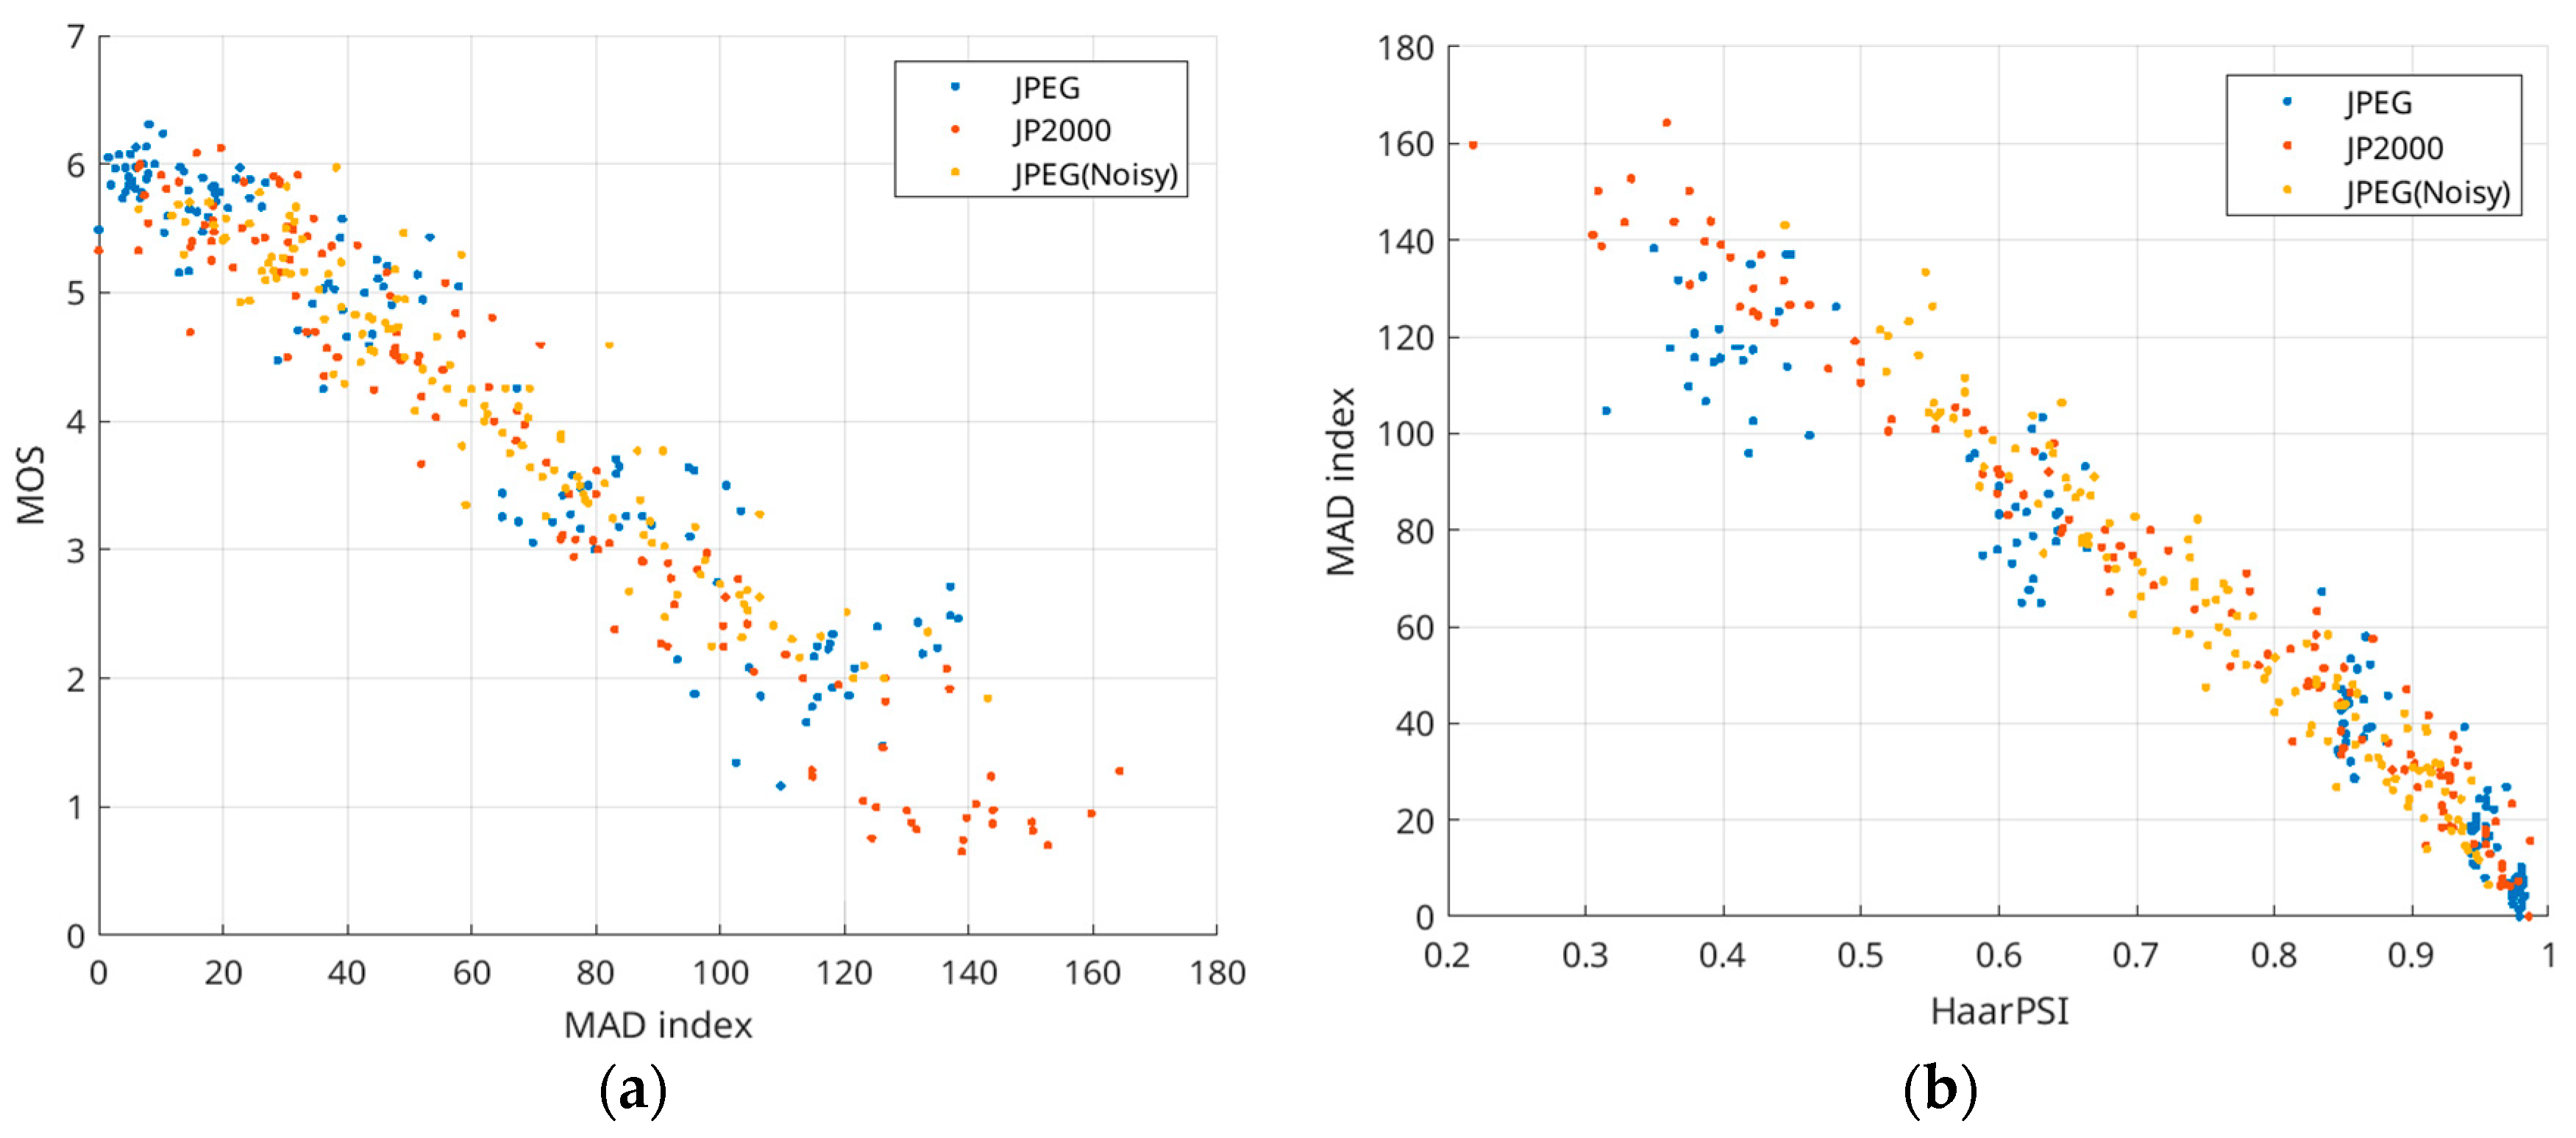
As previously noted, HaarPSI computation is rapid for both grayscale and color (three-channel) images. In contrast, metrics such as MAD [52] require significantly more time for computation, often tens of times longer. Nevertheless, some individuals may prefer MAD due to familiarity or a thorough understanding of its properties. Indeed, MAD is a reliable metric, as evidenced by the scatter plot of MOS vs. MAD for compression-induced distortions (Figure 9a), which exhibits a nearly linear relationship with an SROCC of 0.951. The scatter plot in Figure 9b shows that MAD and HaarPSI are highly correlated (SROCC = 0.9753). Thus, MAD can be approximated as MAD = 34.49 × HaarPSI2 − 284.4 × HaarPSI + 257.2 (R2 = 0.944, RMSE = 7.6). In this way, MAD calculation can be significantly accelerated.
RS images can be represented with more than 8 bits per component. While the BPG encoder can deal with such data, the HaarPSI metric (at least its current implementation) can be calculated for images with 8 bits per channel, whether they have one or three components. Data normalization should be performed prior to compression or HaarPSI calculation, with renormalization applied afterward. This leads to certain additional distortions, which we have estimated. The influence is noticeable for Q < 10, where the PSNR exceeds 55 dB and HaarPSI exceeds 0.997. For Q ≥ 10, the impact of normalization and renormalization is negligible. We considered the cases of Q ≥ 10 (see data in Table 2, Table 3, Table 4 and Table 5). Thus, the impact of normalization and renormalization can be neglected.
Regarding computational efficiency, we can make the following statements. The BPG encoder is used in video compression, where compression efficiency is in high demand. Furthermore, HEVC, which can be used with BPG, is applicable to high-definition videos, where the frame sizes (in pixels) are comparable to those in remote sensing. Thus, it is possible to expect that the computational efficiency of BPG-based compression can be satisfactory, especially for hardware implementations. Meanwhile, we also carried out additional research. To analyze the computational efficiency of the proposed approach, some tests were also performed using a Lenovo computer (Beijing, China) with an Intel® Core™ i7-10700 CPU @ 2.90 GHz and 16.0 GB RAM, controlled by the 64-bit Windows 10 Pro operating system for the x64 processor architecture. For the 1024 × 1024-pixel images presented in Figure 4, the compression time ranged from 0.5 s to 0.9 s depending on the image complexity and the value of the parameter Q (a larger time was needed for more complex structure images). The decompression time was 1.5–2 times smaller. HaarPSI calculation takes about 0.05 s.

5. Conclusions and Future Work

This paper explored the lossy compression of three-channel RS images using the BPG coder with quality control, focusing on the practical application of the HaarPSI metric. Showcasing several advantageous features, HaarPSI demonstrated a high and nearly linear correlation with mean opinion score (MOS) for compression-induced distortions, along with rapid computation speeds. We illustrated a method for determining the distortion invisibility threshold for HaarPSI through experiments conducted with other metrics. Additionally, the effectiveness of a two-step procedure for achieving desired HaarPSI values was evaluated and confirmed across all three BPG compression modes. Furthermore, we delved into other significant properties of HaarPSI, such as its utility in determining acceptable reductions in the probability of correct classification resulting from lossy compression. Moreover, HaarPSI can facilitate the expedited computation of other quality metrics that typically demand extensive computational resources.
In the future, we will focus on establishing a correlation between visual quality metrics and the probability of correct classification for compressed RS data. We will also focus on exploring strategies for compressing multiband images.

Author Contributions

Conceptualization, V.L. and K.E.; methodology, V.L.; software, F.L. and O.I.; validation, F.L. and O.I.; formal analysis, F.L. and K.E.; investigation, O.I.; writing—original draft preparation, V.L.; writing—review and editing, K.E.; visualization, F.L. and O.I.; supervision, V.L. and K.E. All authors have read and agreed to the published version of the manuscript.

Funding

This research received no external funding.

Data Availability Statement

The data presented in this study are openly available in USC-SIPI Image Database at (https://sipi.usc.edu/database/ (accessed on 7 May 2024)) [Volume 2. Aerials].

Conflicts of Interest

The authors declare no conflicts of interest.

References

  1. Mielke, C.; Boshce, N.K.; Rogass, C.; Segl, K.; Gauert, C.; Kaufmann, H. Potential Applications of the Sentinel-2 Multispectral Sensor and the ENMAP hyperspectral Sensor in Mineral Exploration. EARSeL eProc. 2014, 13, 93–102. [Google Scholar] [CrossRef]
  2. Kussul, N.; Lavreniuk, M.; Kolotii, A.; Skakun, S.; Rakoid, O.; Shumilo, L. A workflow for Sustainable Development Goals indicators assessment based on high-resolution satellite data. Int. J. Digit. Earth 2020, 13, 309–321. [Google Scholar] [CrossRef]
  3. Khorram, S.; van der Wiele, C.F.; Koch, F.H.; Nelson, S.A.C.; Potts, M.D. Future Trends in Remote Sensing. In Principles of Applied Remote Sensing; Springer International Publishing: Cham, Switzerland, 2016; pp. 277–285. ISBN 978-3-319-22559-3. [Google Scholar]
  4. Pillai, D.K. New Computational Models for Image Remote Sensing and Big Data. In Big Data Analytics for Satellite Image Processing and Remote Sensing; IGI Global: Hershey, PA, USA, 2018; pp. 1–21. [Google Scholar] [CrossRef]
  5. Blanes, I.; Magli, E.; Serra-Sagrista, J. A Tutorial on Image Compression for Optical Space Imaging Systems. IEEE Geosci. Remote Sens. Mag. 2014, 2, 8–26. [Google Scholar] [CrossRef]
  6. Radosavljevic, M.; Brkljač, B.; Lugonja, P.; Crnojevic, V.; Trpovski, Ž.; Xiong, Z.; Vukobratović, D. Lossy Compression of Multispectral Satellite Images with Application to Crop Thematic Mapping: A HEVC Comparative Study. Remote Sens. 2020, 12, 1590. [Google Scholar] [CrossRef]
  7. Bausys, R.; Kazakeviciute-Januskeviciene, G. Qualitative Rating of Lossy Compression for Aerial Imagery by Neutrosophic WASPAS Method. Symmetry 2021, 13, 273. [Google Scholar] [CrossRef]
  8. Santos, L.; Lopez, S.; Cali, G.M.; Lopez, J.F.; Sarmiento, R. Performance Evaluation of the H.264/AVC Video Coding Standard for Lossy Hyperspectral Image Compression. IEEE J. Sel. Top. Appl. Earth Obs. Remote Sens. 2012, 5, 451–461. [Google Scholar] [CrossRef]
  9. Christophe, E. Hyperspectral Data Compression Tradeoff. In Optical Remote Sensing; Prasad, S., Bruce, L.M., Chanussot, J., Eds.; Springer: Berlin/Heidelberg, Germany, 2011; pp. 9–29. ISBN 978-3-642-14211-6. [Google Scholar]
  10. Vasilyeva, I.; Li, F.; Abramov, S.K.; Lukin, V.V.; Vozel, B.; Chehdi, K. Lossy Compression of Three-Channel Remote Sensing Images with Controllable Quality. In Image and Signal Processing for Remote Sensing XXVII; Bruzzone, L., Bovolo, F., Benediktsson, J.A., Eds.; SPIE: Bellingham, WA, USA, 2021; p. 26. [Google Scholar] [CrossRef]
  11. Ye, N.; Perez-Ortiz, M.; Mantiuk, R.K. Visibility Metric for Visually Lossless Image Compression. In Proceedings of the 2019 Picture Coding Symposium (PCS), Ningbo, China, 12–15 November 2019; pp. 1–5. [Google Scholar] [CrossRef]
  12. Bondžulić, B.; Pavlović, B.; Stojanović, N.; Petrović, V.; Bujaković, D. A Simple and Reliable Approach to Providing a Visually Lossless Image Compression. Vis. Comput. 2024, 40, 3747–3763. [Google Scholar] [CrossRef]
  13. Ponomarenko, N.N.; Lukin, V.V.; Kozhemiakin, R.A.; Egiazarian, K.O.; Chobanu, M.K. Lossy and Visually Lossless Compression of Single-Look SAR Images. Telecommun. Radio Eng. 2013, 72, 711–729. [Google Scholar] [CrossRef]
  14. Ozah, N.; Kolokolova, A. Compression Improves Image Classification Accuracy. In Advances in Artificial Intelligence; Meurs, M.-J., Rudzicz, F., Eds.; Lecture Notes in Computer Science; Springer International Publishing: Cham, Switzerland, 2019; Volume 11489, pp. 525–530. ISBN 978-3-030-18304-2. [Google Scholar]
  15. Chen, Z.; Hu, Y.; Zhang, Y. Effects of Compression on Remote Sensing Image Classification Based on Fractal Analysis. IEEE Trans. Geosci. Remote Sens. 2019, 57, 4577–4590. [Google Scholar] [CrossRef]
  16. Sneyers, J. Contemplating Codec Comparisons. Available online: https://cloudinary.com/blog/contemplating-codec-comparisons (accessed on 10 May 2024).
  17. Cheng, Z.; Sun, H.; Takeuchi, M.; Katto, J. Performance Comparison of Convolutional AutoEncoders, Generative Adversarial Networks and Super-Resolution for Image Compression. In Proceedings of the IEEE Conference on Computer Vision and Pattern Recognition Workshops, Salt Lake City, UT, USA, 18–23 June 2018. [Google Scholar]
  18. Abramova, V.; Lukin, V.; Abramov, S.; Abramov, K.; Bataeva, E. Analysis of Statistical and Spatial Spectral Characteristics of Distortions in Lossy Image Compression. In Proceedings of the 2022 IEEE 2nd Ukrainian Microwave Week (UkrMW), Kharkiv, Ukraine, 14–18 November 2022; pp. 644–649. [Google Scholar] [CrossRef]
  19. Wallace, G. The JPEG Still Picture Compression Standard. Commun. ACM 1991, 34, 30–44. [Google Scholar] [CrossRef]
  20. Chen, Y.; Mukherjee, D.; Han, J.; Grange, A.; Xu, Y.; Parker, S.; Chen, C.; Su, H.; Joshi, U.; Chiang, C.-H.; et al. An Overview of Coding Tools in AV1: The First Video Codec from the Alliance for Open Media. SIP 2020, 9, e6. [Google Scholar] [CrossRef]
  21. Taubman, D.S.; Marcellin, M.W. JPEG2000: Image Compression Fundamentals, Standards, and Practice; Springer: Boston, MA, USA, 2002; ISBN 978-1-4613-5245-7. [Google Scholar]
  22. Zemliachenko, A.; Kozhemiakin, R.; Uss, M.; Abramov, S.; Ponomarenko, N.; Lukin, V.; Vozel, B.; Chehdi, K. Lossy compression of hyperspectral images based on noise parameters estimation and variance stabilizing transform. J. Appl. Remote Sens. 2014, 8, 083571. [Google Scholar] [CrossRef]
  23. Bellard, F. BPG Image Format. Available online: https://bellard.org/bpg/ (accessed on 10 May 2024).
  24. Yee, D.; Soltaninejad, S.; Hazarika, D.; Mbuyi, G.; Barnwal, R.; Basu, A. Medical Image Compression Based on Region of Interest Using Better Portable Graphics (BPG). In Proceedings of the 2017 IEEE International Conference on Systems, Man, and Cybernetics (SMC), Banff, AB, Canada, 5–8 October 2017; pp. 216–221. [Google Scholar]
  25. Du, Q.; Fowler, J.E. Hyperspectral image compression using JPEG2000 and principal component analysis. IEEE Geosci. Remote Sens. Lett. 2007, 4, 201–205. [Google Scholar] [CrossRef]
  26. Zemliachenko, A.; Lukin, V.; Ponomarenko, N.; Egiazarian, K.; Astola, J. Still Image/Video Frame Lossy Compression Providing a Desired Visual Quality. Multidimens. Syst. Signal Process. 2016, 27, 697–718. [Google Scholar] [CrossRef]
  27. Kovalenko, B.; Lukin, V. Analysis of color image compression by BPG coder. In Proceedings of the 2022 IEEE 3rd KhPI Week on Advanced Technology (KhPIWeek), Kharkiv, Ukraine, 3–7 October 2022; pp. 1–6. [Google Scholar] [CrossRef]
  28. Li, F.; Lukin, V.; Ieremeiev, O.; Okarma, K. Quality Control for the BPG Lossy Compression of Three-Channel Remote Sensing Images. Remote Sens. 2022, 14, 1824. [Google Scholar] [CrossRef]
  29. Li, F.; Abramov, S.; Dohtiev, I.; Lukin, V. Advantages and drawbacks of two-step approach to providing desired parameters in lossy image compression. Adv. Inf. Syst. 2024, 8, 57–63. [Google Scholar] [CrossRef]
  30. Yang, K.; Jiang, H. Optimized-SSIM Based Quantization in Optical Remote Sensing Image Compression. In Proceedings of the 2011 Sixth International Conference on Image and Graphics, Hefei, China, 12–15 August 2011; IEEE: New York, NY, USA, 2011; pp. 117–122. [Google Scholar]
  31. Zhang, L.; Zhang, L.; Mou, X.; Zhang, D. FSIM: A Feature Similarity Index for Image Quality Assessment. IEEE Trans. Image Process. 2011, 20, 2378–2386. [Google Scholar] [CrossRef] [PubMed]
  32. Ieremeiev, O.; Lukin, V.; Okarma, K.; Egiazarian, K. Full-Reference Quality Metric Based on Neural Network to Assess the Visual Quality of Remote Sensing Images. Remote Sens. 2020, 12, 2349. [Google Scholar] [CrossRef]
  33. Lukin, V.; Abramov, S.; Krivenko, S.; Kurekin, A.; Pogrebnyak, O. Analysis of Classification Accuracy for Pre-Filtered Multichannel Remote Sensing Data. Expert Syst. Appl. 2013, 40, 6400–6411. [Google Scholar] [CrossRef]
  34. Marsetic, A.; Kokalj, Z.; Ostir, K. The Effect of Lossy Image Compression on Object Based Image Classification—WorldView-2 Case Study. Int. Arch. Photogramm. Remote Sens. Spat. Inf. Sci. 2012, 38, 187–192. [Google Scholar] [CrossRef]
  35. Gandor, T.; Nalepa, J. First Gradually, Then Suddenly: Understanding the Impact of Image Compression on Object Detection Using Deep Learning. Sensors 2022, 22, 1104. [Google Scholar] [CrossRef] [PubMed]
  36. Lukin, V.; Bataeva, E.; Abramov, S. Saliency Map in Image Visual Quality Assessment and Processing. Radioelectron. Comput. Syst. 2023, 1, 112–121. [Google Scholar] [CrossRef]
  37. Nafchi, H.Z.; Shahkolaei, A.; Hedjam, R.; Cheriet, M. Mean Deviation Similarity Index: Efficient and Reliable Full-Reference Image Quality Evaluator. IEEE Access 2016, 4, 5579–5590. [Google Scholar] [CrossRef]
  38. Ponomarenko, N.; Lukin, V.; Astola, J.; Egiazarian, K. Analysis of HVS-metrics’ properties using color image database TID2013. In Advanced Concepts for Intelligent Vision Systems; Battiato, S., Blanc-Talon, J., Gallo, G., Philips, W., Popescu, D., Scheunders, P., Eds.; Lecture Notes in Computer Science; Springer International Publishing: Cham, Switzerland, 2015; Volume 9386, pp. 613–624. ISBN 978-3-319-25902-4. [Google Scholar]
  39. Reisenhofer, R.; Bosse, S.; Kutyniok, G.; Wiegand, T. A Haar Wavelet-Based Perceptual Similarity Index for Image Quality Assessment. Signal Process. Image Commun. 2018, 61, 33–43. [Google Scholar] [CrossRef]
  40. Kryvenko, L.; Krylova, O.; Lukin, V.; Kryvenko, S. Intelligent Visually Lossless Compression of Dental Images. Adv. Opt. Technol. 2024, 13, 1306142. [Google Scholar] [CrossRef]
  41. Lukin, V.; Li, F. Providing a Desired Compression Ratio for Better Portable Graphics Encoder of Color Images. In Advances and Challenges in Science and Technology Vol. 1; Jakóbczak, D.J., Ed.; B P International (a Part of Sciencedomain International): Hongkong, China, 2023; pp. 98–111. ISBN 978-81-19-49190-2. [Google Scholar]
  42. Kovalenko, B.; Lukin, V.; Kryvenko, S.; Naumenko, V.; Vozel, B. Prediction of Parameters in Optimal Operation Point for BPG-Based Lossy Compression of Noisy Images. Ukr. J. Remote Sens. 2022, 9, 4–12. [Google Scholar] [CrossRef]
  43. Ieremeiev, O.; Lukin, V.; Okarma, K.; Egiazarian, K.; Vozel, B. On Properties of Visual Quality Metrics in Remote Sensing Applications. Electron. Imaging 2022, 34, 354-1–354-6. [Google Scholar] [CrossRef]
  44. Ponomarenko, N.; Silvestri, F.; Egiazarian, K.; Carli, M.; Astola, J.; Lukin, V. On Between-Coefficient Contrast Masking of DCT Basis Functions. In Proceedings of the Third International Workshop on Video Processing and Quality Metrics for Consumer Electronics, Scottsdale, AZ, USA, 25–26 January 2007; pp. 1–4. [Google Scholar]
  45. Cameron, C.A.; Windmeijer, F.A.G. An R-Squared Measure of Goodness of Fit for Some Common Nonlinear Regression Models. J. Econom. 1997, 77, 329–342. [Google Scholar] [CrossRef]
  46. Tong, X.-Y.; Lu, Q.; Xia, G.-S.; Zhang, L. Large-Scale Land Cover Classification in Gaofen-2 Satellite Imagery. In Proceedings of the IGARSS 2018—2018 IEEE International Geoscience and Remote Sensing Symposium, Valencia, Spain, 22–27 July 2018; pp. 3599–3602. [Google Scholar]
  47. Li, F.; Lukin, V.; Okarma, K.; Fu, Y. Providing a Desired Quality of BPG Compressed Images for FSIM Metric. In Proceedings of the 2021 IEEE 3rd International Conference on Advanced Trends in Information Theory (ATIT), Kyiv, Ukraine, 15–17 December 2021; pp. 10–14. [Google Scholar]
  48. Kovalenko, B.; Lukin, V. Usage of different Chroma Subsampling Modes in Image Compression by BPG Coder. Ukr. J. Remote Sens. 2022, 9, 11–16. [Google Scholar] [CrossRef]
  49. Proskura, G.; Vasilyeva, I.; Fangfang, L.; Lukin, V. Classification of Compressed Multichannel Images and Its Improvement. In Proceedings of the 2020 30th International Conference Radioelektronika (RADIOELEKTRONIKA), Bratislava, Slovakia, 15–16 April 2020; pp. 1–6. [Google Scholar]
  50. Yang, Q. Research on SVM Remote Sensing Image Classification Based on Parallelization. J. Phys. Conf. Ser. 2021, 1852, 032009. [Google Scholar] [CrossRef]
  51. Lukin, V.; Li, F.; Zhu, J.; Kryvenko, S. Peculiarities of SVM-based classification of BPG compressed three-channel images. In Proceedings of the 8th International Symposium of Space Optical Instrument and Application (ISSOIA), Beijing, China, 15–17 November 2023. in print. [Google Scholar]
  52. Chandler, D.M. Most Apparent Distortion: Full-Reference Image Quality Assessment and the Role of Strategy. J. Electron. Imaging 2010, 19, 011006. [Google Scholar] [CrossRef]
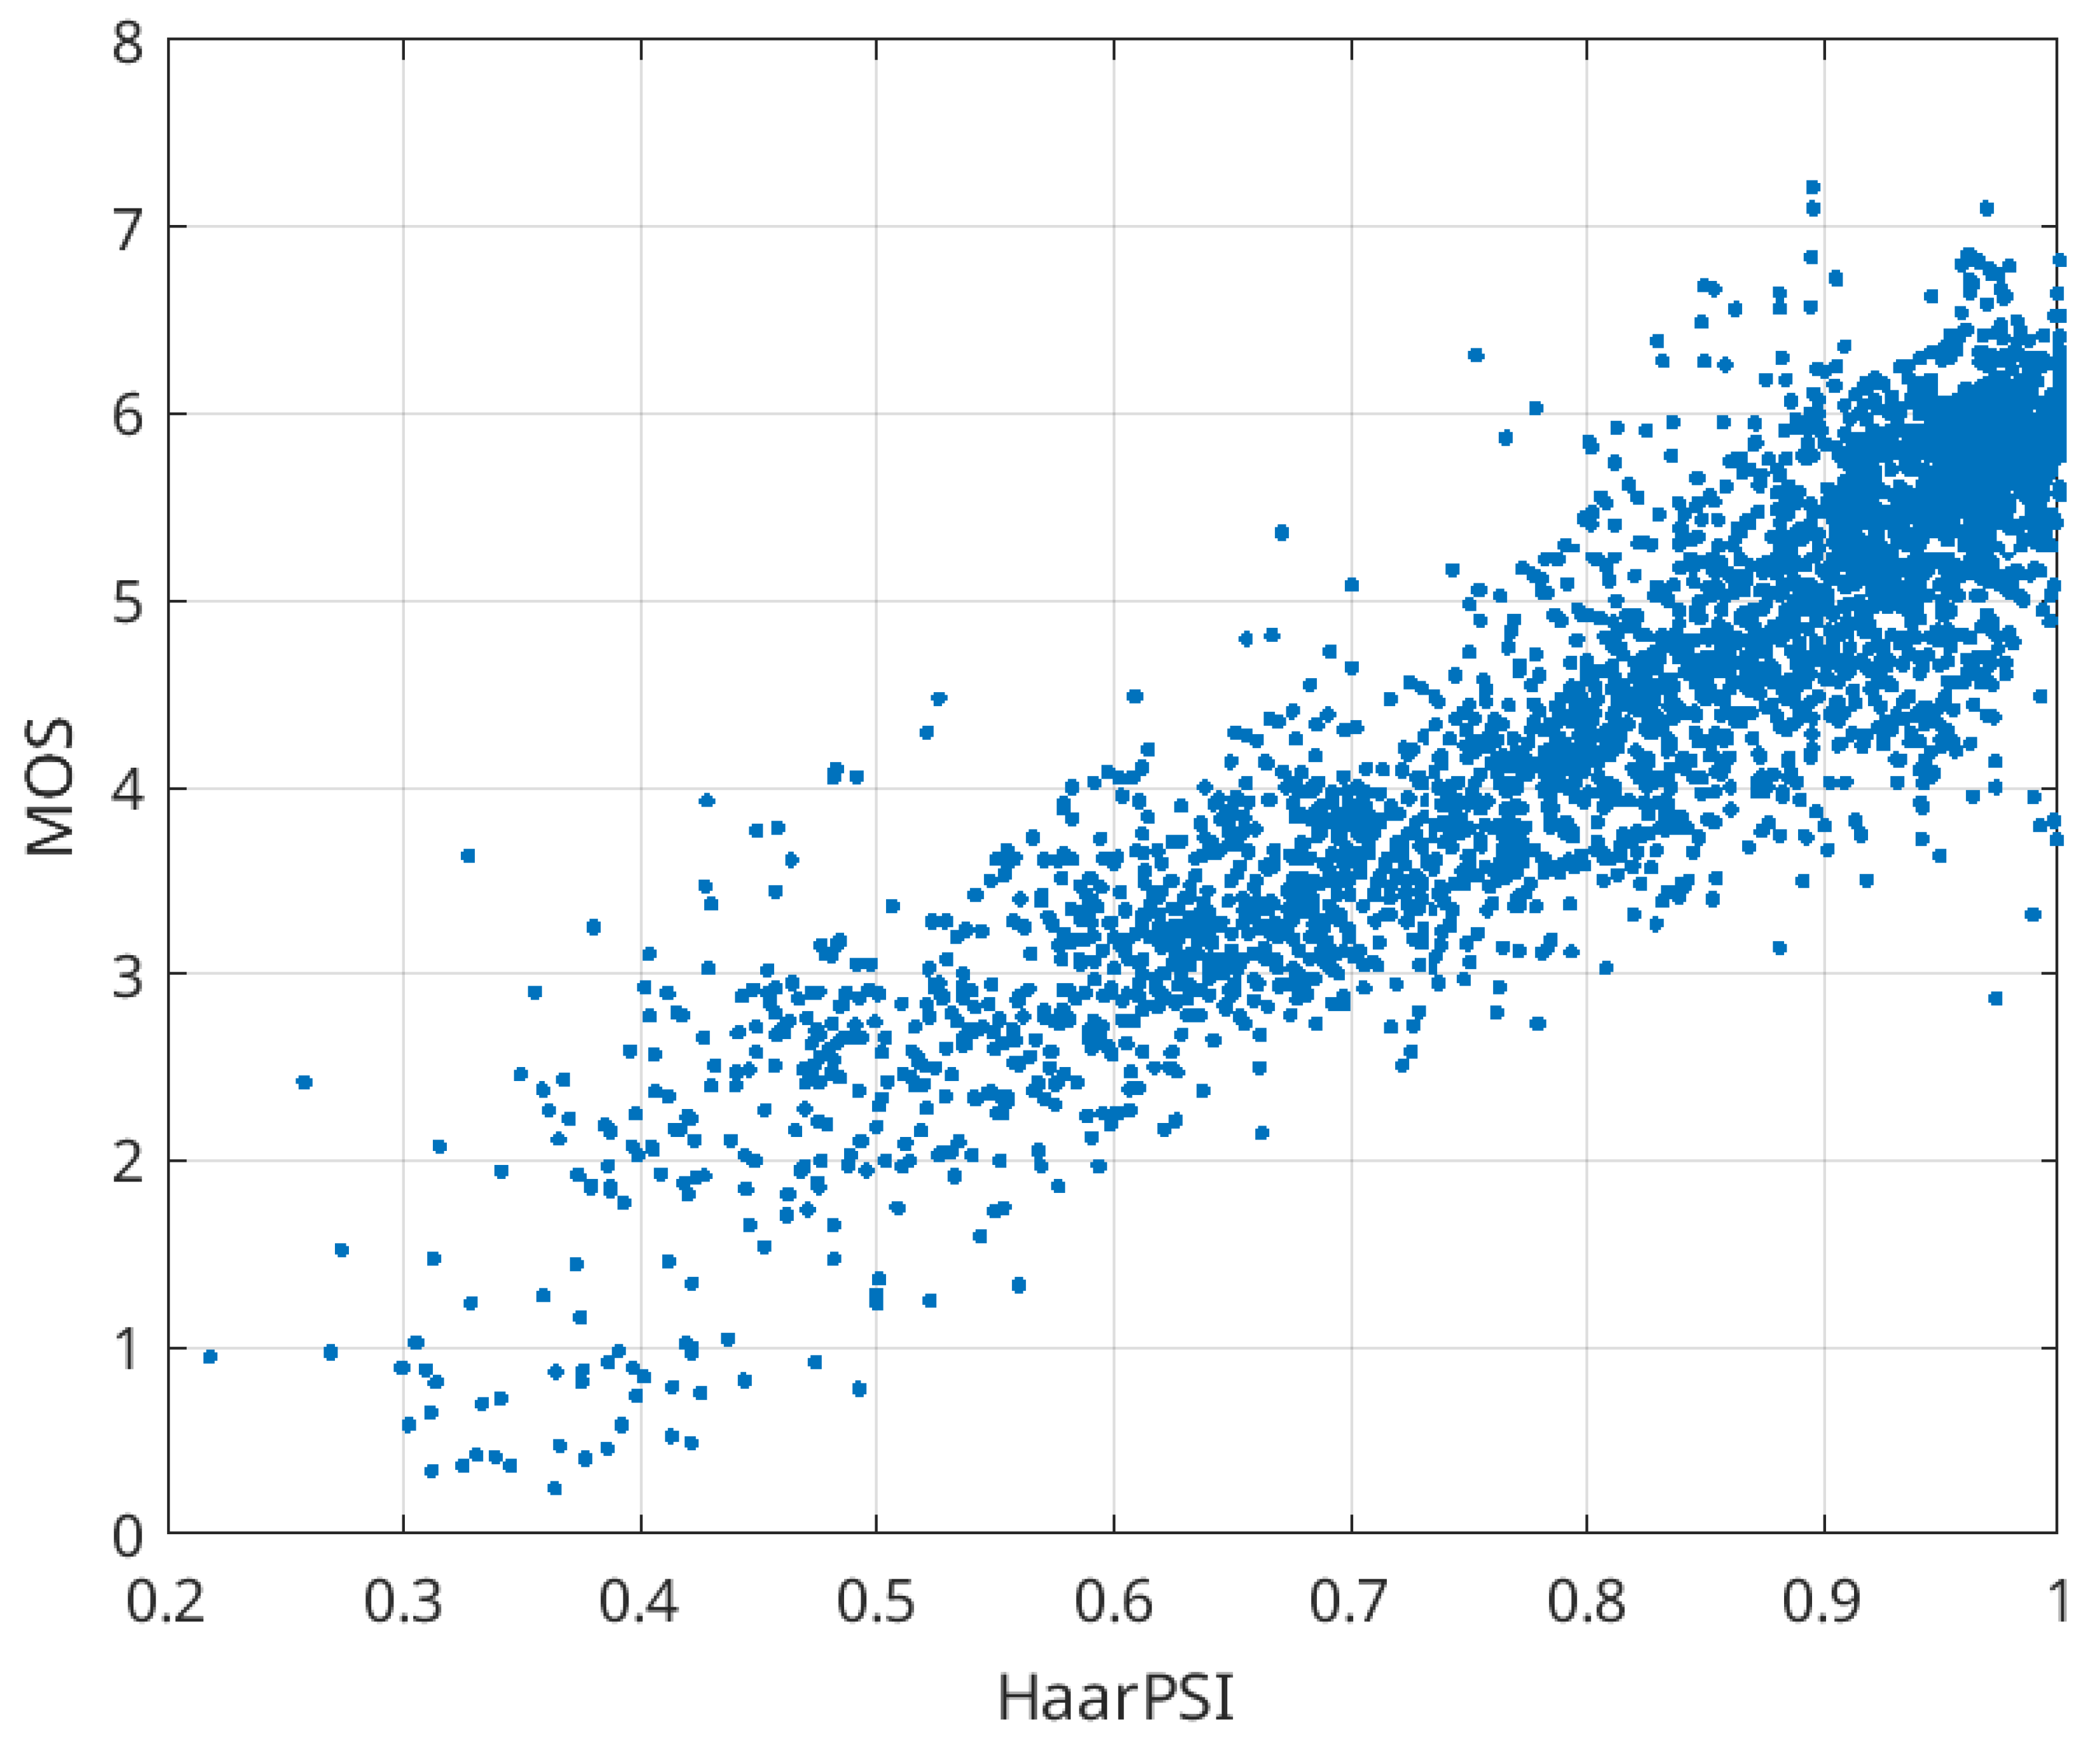
Figure 1. Scatter plot of HaarPSI vs. MOS for all types of distortions in TID2013.
Remotesensing 16 02740 g001
Figure 2. Scatter plot of HaarPSI vs. MOS for three types of distortions dealing with image lossy compression in TID2013.
Remotesensing 16 02740 g002
Figure 3. Scatter plot of HaarPSI vs. PSNR-HVS-M for three types of distortions dealing with image lossy compression in TID2013.
Remotesensing 16 02740 g003
Figure 4. Fragments (g1g9) of 1024 × 1024 pixels used in preliminary experiments.
Remotesensing 16 02740 g004
Figure 5. Dependencies of HaarPSI on Q for the nine fragments in Figure 4 compressed by BPG (4:2:2 mode).
Remotesensing 16 02740 g005
Figure 6. Fragments (RS1RS12) of 512 × 512 pixels used in experiments.
Remotesensing 16 02740 g006
Figure 7. The dependencies of HaarPSI on Q for 21 images for the mode 4:2:2.
Remotesensing 16 02740 g007
Figure 8. Dependences of PCC on Q for nine image fragments.
Remotesensing 16 02740 g008
Figure 9. Scatter plots of MOS vs. MAD (a) and MAD vs. HaarPSI (b) for distortions due to lossy compression.
Remotesensing 16 02740 g009
Table 1. Average HaarPSI values for all Q for three modes.
QAverage HaarPSI for the Mode 4:4:4Average HaarPSI for the Mode 4:2:2Average HaarPSI for the Mode 4:2:0
10.9996180.999110.998718
20.9996180.999110.998718
30.9996180.999110.998718
40.9996090.9990990.998706
50.9995970.9990810.998687
60.9995730.9990530.998652
70.9995250.9989970.998587
80.9993860.9988410.998405
90.9992120.9986510.998175
100.999050.9984690.997949
110.9988460.9982460.997681
120.9986560.998030.997413
130.998420.9977610.997095
140.9981480.9974450.996713
150.9978160.997070.996244
160.9973960.9965760.99565
170.9967930.9958880.994828
180.9960790.9950680.993831
190.9950850.9938840.992431
200.9938730.9925180.990842
210.9924990.9909530.989041
220.9906330.9888350.986647
230.9882580.986230.983686
240.9855150.9831360.980176
250.9819610.9792770.975889
260.9778180.974560.970683
270.9729980.9693440.96491
280.9667930.9624590.957538
290.9593840.9544220.948902
300.9514810.9458260.939824
310.9419720.9355090.92883
320.9302640.9230020.91611
330.9178920.9098050.905264
340.9034690.894880.88984
350.8866850.8772150.872335
360.8679290.8577260.852999
370.8478340.8375240.832716
380.8261080.8150650.813886
390.8034860.7923010.790896
400.7787530.767620.768925
410.7519350.7409150.742817
420.7255230.7144710.718263
430.698020.687810.691514
440.6697790.6599820.66634
450.6428770.6338540.640157
460.6156580.6070320.614656
470.5879550.5805150.587563
480.5607880.5529550.560967
490.5341940.5275140.534221
500.5070820.500650.506903
510.48250.4760950.482055
Table 2. Statistical characteristics of the two-step procedure for the mode 4:4:4.
HaarPSIdesQ1Mean1Mean2Var1Var2Values of Q2
0.98260.98170.98010.0000030.000000726, 27
0.90360.88140.90080.000100.0000334, 35, 36
0.80410.77610.79800.000160.0000639, 40, 41
Table 3. Statistical characteristics of the two-step procedure for the mode 4:2:2.
HaarPSIdesQ1Mean1Mean2Var1Var2Values of Q2
0.98250.98530.98170.00000190.00000326
0.90340.91430.90430.0000680.00000834, 35
0.80390.82310.80550.000150.0000339, 40, 41
Table 4. Statistical characteristics of the two-step procedure for the mode 4:2:0.
HaarPSIdesQ1Mean1Mean2Var1Var2Limits of Q2
0.98260.97170.97910.00000400.000001324, 25
0.90350.87510.89920.000050.0000233, 34
0.80390.80060.79880.000100.0000239, 40
Table 5. Statistical characteristics of the two-step procedure for the mode 4:2:2 for the verification set of images.
HaarPSIdesQ1Mean1Mean2Var1Var2Values of Q2
0.98250.97990.97960.0000100.00000224, 25, 26, 27
0.90340.88880.89720.000240.0000932, 33, 34, 35
0.80390.78280.79670.000460.0001437, 38, 39, 40
Disclaimer/Publisher’s Note: The statements, opinions and data contained in all publications are solely those of the individual author(s) and contributor(s) and not of MDPI and/or the editor(s). MDPI and/or the editor(s) disclaim responsibility for any injury to people or property resulting from any ideas, methods, instructions or products referred to in the content.