Article

System Design of Ocean Temperature Measurement System Using Brillouin Lidar Based on Dual Iodine Cells

1
College of Science, Donghua University, Shanghai 201620, China
2
Avic Shanghai Aviation Electric Co., Ltd., Shanghai 201101, China
3
Nanjing Institute of Advanced Laser Technology, Nanjing 210038, China
4
Key Laboratory of Space Laser Communication and Detection Technology, Shanghai Institute of Optics and Fine Mechanics, Chinese Academy of Sciences, Shanghai 201800, China
*
Author to whom correspondence should be addressed.
Remote Sens. 2024, 16(15), 2748; https://doi.org/10.3390/rs16152748
Submission received: 10 May 2024 / Revised: 19 July 2024 / Accepted: 23 July 2024 / Published: 27 July 2024
(This article belongs to the Special Issue Advancement in Undersea Remote Sensing II)

Abstract

:
Ocean temperature profile information plays a key role in understanding the marine environment. The passive remote-sensing technique can provide sea surface temperature measurements over large areas. However, it is sensitive to the atmospheric environment and cannot provide seawater temperature profile information. The lidar technique is the only way to carry out seawater temperature profile measurements over large areas. However, it is insufficient for measuring speed, the receiving field, stability, spectral integrity, simple system structures, and so on. Therefore, we propose a Brillouin lidar method combining two iodine cells at different temperatures to realize temperature measurements, where one iodine cell is used as a filter to absorb the elastic scattering and the other as an edge detection discriminator to obtain the seawater temperature measurement. The system has a fast measurement speed, a large receiving field, a simple system structure, and high stability. The system feasibility was verified via principle simulation and real iodine absorption curve measurements. For an ocean temperature of [5 °C, 15 °C], a laser wavelength of 532.10495 nm was more appropriate, corresponding to the iodine pool temperature combinations of 50 °C and 78 °C. For an ocean temperature of [15 °C, 32 °C], a laser wavelength of 532.10518 nm was more appropriate, corresponding to the iodine cell temperature combinations of 60 °C and 78 °C. When the laser intensity reached a measurement precision of 1‰, the temperature could be predicted with an accuracy of up to 0.2 K. This work shows promise as a potential solution for seawater temperature profile measurement.

1. Introduction

Seawater temperature plays a crucial role in the survival, habitat, and reproduction of various marine organisms [1,2,3]. The accurate measurement of ocean temperature is essential for the development and sustainability of marine activities and is a critical research need in the marine environment [4,5,6,7].
Traditionally, ocean temperature monitoring has been realized via contact measurements, such as thermometers on buoys. However, this method is limited when monitoring large and densely gridded ocean areas [8,9]. Marine remote sensing, using various active and passive methods, has become an important development direction for monitoring the marine environment [10,11].
Infrared passive remote sensing on current satellite platforms, such as the Moderate-Resolution Imaging Spectroradiometer (MODIS), can measure sea surface temperature with an accuracy of 0.4 K in cloudless conditions [11]. Compared with passive infrared remote sensing, which can only measure the temperature information of surface seawater, active laser remote sensing has the advantage of obtaining the distribution of seawater temperature profiles [10].
Brillouin scattering from laser interaction with seawater molecules enables active temperature profile sensing due to the relation between the Brillouin spectrum frequency shift and spectrum linewidth. The seawater temperature profiling information can be used to calculate ocean Heat Storage Rate (HSR) and Ocean Heat Content (OHC), aiding in weather forecasting and so on. With this technology loaded on ships, the number of temperature and salinity observations in the upper ocean would be greatly increased compared with eXpendable Bathy Thermograph (XBT). With this technology loaded on an aircraft or an Unmanned Airborne Vehicle (UAV), the thermal structure of the sub-mesoscale feature of the target zone can be rapidly determined, and this information cannot be obtained from current slow-moving gliders, floats, and research vessels. With this technology loaded on Low Earth Orbit (LEO) platforms, fast observations of global temperature profiles, especially for high-latitudinal ocean regions, can be achieved. Those regions play a significant role in controlling the Earth’s climate and weather patterns and are the most vulnerable in Earth’s present state of climate change. Besides the high detection efficiency, a rough comparison shows that the cost per profile obtained by spaceborne Brillouin lidar is only 4.5% of the Argo program [12]. Researchers around the world are working on Brillouin lidar due to its tremendous advantage. However, Brillouin lidar remains an engineering challenge. There are two ways to measure the spectrum: directly measuring the Brillouin scattering spectra using detector arrays, such as Photomultiplier Tube (PMT) arrays and CCDs, or indirectly measuring the Brillouin scattering spectra, with the spectral information being transferred into intensity information via edge detection or encoded in some feature parameters, for example.
Brillouin scattering can be used for active seawater temperature measurement by directly measuring Brillouin spectra [13,14,15,16]. The scanning Fabry–Pérot (F-P) interferometer spectral measurement method was used to obtain a full Brillouin spectrum [17,18]. Although the technique has a temperature measurement accuracy of 3 K, the time taken to acquire the spectra (approximately 10 min) limited its use [7]. Shi et al. [19,20] proposed a stimulated Brillouin spectrum measurement method using a Fabry–Pérot (F-P) etalon and intensified charge-coupled device (ICCD). The spectral signals are photoelectrically converted and output via an array ICCD, which speeds up the spectral acquisition time. The frequency shift of Brillouin scattering can be accurately calculated based on the Hessian matrix and the Steger algorithm. The measured frequency shift errors are generally in the order of MHz, and the inversion accuracy of the water temperature can be as low as 0.14 °C. However, stimulated Brillouin scattering requires a very high laser energy threshold, which is difficult to achieve on airborne platforms.
In 2023, Kun et al. [7] proposed a scattering spectrum measurement method based on a Fizeau interferometer and multichannel PMT. This method first expands the scattering spectrum in space, quantifies the scattering spectrum into discrete sparse energy points using a multichannel PMT, and, finally, reconstructs the scattering spectrum. This method has a strong anti-interference capability, an effective detection depth of more than 40.51 m, and a temperature measurement accuracy of 0.5 °C, under a laser pulse energy of 20 mJ, repetitive frequency of 100 Hz, pulse width of 10 ns, and flight height of 100 m. The system is designed for future airborne tests. However, the measurement accuracy is limited by the number of PMT channels and the spectral measurement resolution of 1 GHz, making it challenging to accurately reconstruct the spectrum.
Otherwise, Brillouin scattering spectra can be measured indirectly. The Brillouin spectral information is converted into intensity information or encoded in some feature parameters. Scientists proposed a spectral measurement method based on the edge detection technique to obtain the Brillouin spectrum in real time [21,22,23]. In the edge detection technique, a molecule cell (such as an iodine cell with a steep edge) that matches the Brillouin spectrum is used to distinguish the temperature [24]. Since the absorption curve of the molecule cell is determined by the molecule’s intrinsic properties, the absorption spectra are fixed and stable, and the laser wavelength must match the absorption spectra. Therefore, this places high demands on the laser’s frequency stability [7]. Kun et al. [13,25] proposed a spectral measurement method based on dual-edge etalons combined with PMTs. This method provides a continuous Brillouin scattering spectrum and enables the rapid measurement of temperature and salinity profiles with a vertical resolution of 1 m underwater (with temperature and salinity accuracies of 0.5 °C and 1‰, respectively). Although this method can, theoretically, be used to reconstruct the Brillouin scattering spectrum with high accuracy, the measured energy is susceptible to environmental perturbations and does not make full use of the Brillouin energy, especially the central peak Brillouin spectra energy. This method is unsuitable for applications with higher accuracy requirements (a temperature measurement accuracy of 0.2 °C or higher) [7]. In 2024, Smith et al. conceptualized a lidar receiver employing a Brillouin asymmetric spatial heterodyne (BASH) spectrometer to measure depth-resolved profiles of the near-surface ocean temperature, salinity, and sound velocity from an aircraft [26]. The Brillouin shift and Brillouin linewidth information are encoded in the amplitude “envelope” of this Littrow heterodyne. The concept can achieve an expected daytime (nighttime) random error of 1.1 °C (0.7 °C) in temperature that extends three optical depths with a depth resolution of 1 m and a horizontal resolution of 1 km. The measurement accuracy is very sensitive to visibility factors and solar background.
Current techniques, whether directly measuring spectra or indirectly measuring characteristic parameters to reconstruct the spectra, have technical difficulties that limit their application. With the development of laser technology, stable lasers that match the molecular absorption spectra can be employed. The stable molecular spectra can then be used as edge detection tools to distinguish the temperature.
This paper presents a method to obtain temperature information using Brillouin scattering spectroscopy of seawater by combining two iodine cells at different temperatures, one as an elastic scattering absorption filter and the other as an edge detection discriminator to extract the temperature information. Compared with the above-mentioned active Brillouin lidars, the dual-iodine-cell scheme we propose has a simple and low-cost structure. It only needs two iodine cells, three PMTs, two beam splitters, and some lenses to form the Brillouin spectra detection system. And the iodine cell permits a larger receiving field compared with the F-P interferometer and Fizeau interferometer. In addition, no scanning system is needed. Therefore, the proposed dual-iodine-cell system has the merits of a simple system structure, low cost, large receiving field, and fast measurement speed. This paper simulated the principle, designed the system, and calculated the temperature measurement accuracy combined with the measured iodine absorption curves to verify this technology’s feasibility. For an ocean temperature of [5 °C, 15 °C], a laser wavelength of 532.10495 nm was more appropriate, corresponding to the iodine pool temperature combinations of 50 °C and 78 °C. For an ocean temperature of [15 °C, 32 °C], a laser wavelength of 532.10518 nm was more appropriate, corresponding to the iodine cell temperature combinations of 60 °C and 78 °C. For an ocean temperature of [5 °C, 32 °C], both these combinations of wavelengths and temperatures were available. When the laser intensity reached a measurement precision of 1‰, the temperature was predicted with an accuracy of up to 0.2 K. This system shows promise as a potential solution for the seawater temperature profile measurement.
This paper is arranged as follows: Section 2 focuses on the principle of the dual-iodine-cell temperature measurement mechanism. Section 3 concerns the system design, including the measurement of the real iodine absorption lines, the system parameter design, and the system performance analysis. The conclusion is presented in Section 4.

2. Principle

2.1. Brillouin Scattering Detection Based on Iodine Cells

The interaction of incident light of frequency ν i with ultrasonic waves of frequency ν a produces two scattered lights of frequency ν i ± ν a , which are symmetrically distributed on both sides of the incident light’s frequency. This is called Brillouin scattering, as shown in Figure 1. Brillouin scattering in seawater is related to the water temperature and salinity. The Brillouin scattering spectrum in a water column exhibits a Lorentzian line shape; therefore, the spectrum can be expressed as a function of two parameters—the frequency shift and the linewidth [20]—as shown in Equation (1).
f 1 ( ν , ν B ) = 1 π Γ B { 1 1 + [ 2 ( ν ν B ) / Γ B ] 2 + 1 1 + [ 2 ( ν + ν B ) / Γ B ] 2 }
where ν B is the Brillouin scattering frequency shift and Γ B is the Brillouin scattering spectra linewidth. The typical value of the Brillouin scattering spectra linewidth is approximately 0.5 GHz at a water temperature of 25 °C [22,23]. The relationship between the Brillouin frequency shift ν B and temperature T is shown in Equation (2) [22], which was accurately fitted by Professor Fry. The fitting parameters are given in Table 1.
T ( ν B , Γ B ) = m 1 + m 2 ν B + m 3 Γ B + m 4 ν B 2 + m 5 Γ B 2 + m 6 ν B Γ B + m 7 ν B 3 + m 8 Γ B 3 + m 9 ν B Γ B 2 + m 10 ν B 2 Γ B
Edge detection in the Brillouin scattering spectroscopic detection technique was first proposed by Gelbwachs in 1988 [27]. The key point of this technique is to let the frequency of the Brillouin scattered light lie at the edge of the spectral response function of the high-resolution optical filter. The spectral line profile of the optical filter has a steep slope, causing even a slight change in the frequency of the Brillouin scattered light to cause a significant change in the light intensity after passing through the filter. The iodine molecular absorption cell is a suitable option for engineering applications compared with other edge filters due to its simple system structure, large field of view, and real-time performance. Moreover, a stable laser source that matches the iodine spectrum is available due to the progress of laser technology.
In 1997, J.N. Forkey et al. at Princeton University developed software to calculate the pattern of iodine molecular absorption spectra by inputting the temperature, pressure, and iodine cell length [28]. This model is suitable for simulating iodine molecular absorption spectra between 470 nm and 550 nm [29,30]. Figure 2 illustrates how the iodine cell absorption curve changes with different parameter settings.
Figure 2 demonstrates that the cell temperature, length, and pressure can affect the iodine cell absorption characteristics. The influence of the cell length and pressure is much more significant compared with the cell temperature. The higher the temperature and pressure, and the longer the cell length, the stronger the absorption of the iodine cell.
The length, temperature, and pressure of the iodine cell can be controlled independently in the simulation. In the real experiment, the pressure in the iodine cell is controlled by adjusting the temperature. The temperature of the iodine cell should be set between the iodine sublimation point (approximately 40 °C) and the temperature that achieves the iodine saturation vapor pressure.
Furthermore, the pressure of the iodine cell improves with the increase in temperature until the saturation vapor pressure is achieved. The saturation vapor pressure Ps (torr) in the iodine cell and the iodine cell temperature Tc (°C) conform to the empirical Equation (3).
log 10 P s = 9.75715 2867.028 T c + 254.180
The saturation vapor pressure increases with temperature, but there is a maximum pressure limit at each temperature. It is important to consider the relationship between temperature and pressure when designing the parameters of the iodine cell. This allows for a reasonable parameter setting and maximizes the conformity of the iodine molecule absorption curve to the actual situation.

2.2. Dual Iodine Cells for Temperature Measurement

According to Section 2.1, the iodine cell possesses an excellent performance as an edge detection filter. It is suitable for the temperature measurement system using Brillouin scattering. However, the Brillouin spectral information can only be extracted after the elastic scattering is removed or absorbed.
The principle of the dual-iodine-cell temperature measurement mechanism is shown in Figure 3. Two iodine cells of different temperatures and sizes are applied sequentially. Changes in the temperature and size of the iodine cells affect the absorption curve, as shown in Figure 3.
The first iodine cell was set with a lower temperature and smaller size than the second one. The purpose of the first iodine cell is shown in Figure 3a, and its requirements were as follows:
  • Separate the elastic scattering and Brillouin scattering. The elastic scattering should be absorbed sufficiently completely, while the Brillouin scattering signals pass with high transmittance and are preserved as much as possible.
  • The absorption rate of the elastic scattering should remain relatively stable when the laser frequency has a certain jitter.
The purpose of the second iodine cell is shown in Figure 3b, and its requirements are as follows:
  • According to the principle of edge detection, the Brillouin signal should lie at the steep edge of the iodine cell absorption curve.
  • It should meet several requirements regarding the relationship between the output signal intensity and temperature. First, the monotonicity should be uniform. Second, the slope should be as steep as possible. Third, it should remain relatively stable when the laser frequency has a certain jitter. Fourth, its value, influenced by the ratio of the Mie scattering intensity and Brillouin scattering intensity, should be kept as small as possible.
The schematic of the dual-iodine-cell temperature measurement system is shown in Figure 4.
The backscattering signal is first split into two beams by beam splitter 1, and one small part of the light beam is converged directly on the PMT1 through lens L1. This channel is called the summation channel, which contains both the elastic scattering and inelastic scattering information. This channel can indicate the whole intensity of the received backscattering light. The other part is the major part of the received backscattering light. This part passes through the first iodine cell and then through beam splitter 2. Similar to beam splitter 1, the small part is received by the PMT2 through focusing lens L2, while the major part passes through the second iodine cell and is received by PMT3 through focusing lens L3.
Based on the optical path design described above, the mathematical model of the dual-iodine-cell system can be derived as follows: The total intensity of the received echo scattering signal I 0 consists of the Brillouin scattering intensity I 0 B r and the elastic scattering intensity I 0 E l a s . f 1 ( ν ) is the spectral line function of the Brillouin scattering in water, as shown in Equation (1); f 2 ( ν ) is the spectral line function of the elastic scattering in water; the spectral function of the transmittance of the first iodine cell used for absorbing the elastic scattering is g 1 ( ν ) ; the spectral function of the transmittance of the second iodine cell used for edge detection is g 2 ( ν ) ; T1 is the transmittance of the first beam splitter; and T2 is the transmittance of the second beam splitter. Therefore, the elastic scattering and Brillouin scattering signal intensity detected with PMT1/2/3 can be calculated via Equation (4).
{ I 1 B r ( ν ) = ( 1 T 1 ) I 0 B r I 2 B r ( ν ) = T 1 ( 1 T 2 ) I 0 B r f 1 ( ν ) g 1 ( ν ) d ν I 3 B r ( ν ) = T 1 T 2 I 0 B r f 1 ( ν ) g 1 ( ν ) g 2 ( ν ) d ν I 1 E l a s = ( 1 T 1 ) I 0 E l a s I 2 E l a s = T 1 ( 1 T 2 ) I 0 E l a s f 2 ( ν ) g 1 ( ν ) d ν I 3 E l a s = T 1 T 2 I 0 E l a s f 2 ( ν ) g 1 ( ν ) g 2 ( ν ) d ν
where I 2 B r ( ν B ) and I 2 E l a s are the remaining Brillouin signal and elastic scattering signal after passing through the iodine cell absorbing the elastic scattering. I 3 B r ( ν B ) and I 3 E l a s are the Brillouin signal and elastic scattering signal after passing through the two iodine cells. The elastic scattering absorption degree EX1 of the first iodine cell is expressed via Equation (5). The ratio of the elastic scattering signal intensity to the Brillouin signal intensity is expressed via Equation (6).
E X 1 = I 2 E l a s / ( 1 T 2 ) I 0 E l a s T 1
R = I 0 E l a s I 0 B r
The elastic scattering absorbance EX1 reflects the suppression ability of the first iodine cell, which depends on the characteristics of the iodine cell. The R-value depends on the characteristics of the water body. The total initial received signal intensity and the signal intensity received by the three PMTs are given in Equation (7).
{ I 0 = I 0 B r + I 0 E l a s I 1 = I 1 B r + I 1 E l a s I 2 = I 2 B r + I 2 E l a s I 3 = I 3 B r + I 3 E l a s
where I 0 is the total intensity of the echo signal and I 1 , I 2 , and I 3 are the intensities received by the three PMTs. They represent the total scattering signal received, the signal after the iodine cell 1, and the signal after the iodine cell 2, respectively. Therefore, the transmittance of the spectral signal of the two iodine cells is shown in Equation (8).
{ S 1 = I 2 / ( 1 T 2 ) I 1 T 1 / ( 1 T 1 ) S 2 = I 3 I 2 T 2 / ( 1 T 2 )
S1 reflects the ratio of Brillouin remaining for the temperature measurement. S2 is determined by the Brillouin shift ν B and the absorption spectra of the two iodine cells. The relation between S2 and the temperature can be obtained by monitoring the outputs of PMT2 and PMT3. Then, the temperature can be measured.

2.3. Laser Center Frequency

A perfect match between the laser center frequency and the iodine cell absorption characteristics is the most important aspect of the measurement mechanism. After scanning the iodine cell absorption line characteristics between 532.1 nm and 532.3 nm in the simulation, we found 532.10495 nm was the best choice according to the requirements of the two iodine cells. The iodine cell parameters were set as shown in Table 2 during the simulation.
The simulated normalized iodine cells’ absorption spectra and the received scattering spectra are shown in Figure 5.
In Figure 5, the laser center frequency was set as the origin point in the frequency axis. Firstly, iodine cell 1 exhibits a higher absorption of elastic scattering. Secondly, some energy loss occurs in the Stokes peak as it passes through iodine cell 1, but the anti-Stokes peaks are largely preserved. Thirdly, both the Stokes and anti-Stokes peaks are on the steep edge of the absorption line of iodine cell 2. Fourthly, the monotonicity of the absorption lines corresponding to the Stokes and anti-Stokes peaks are different. The temperature dependence under the above parameters is plotted in Figure 6.
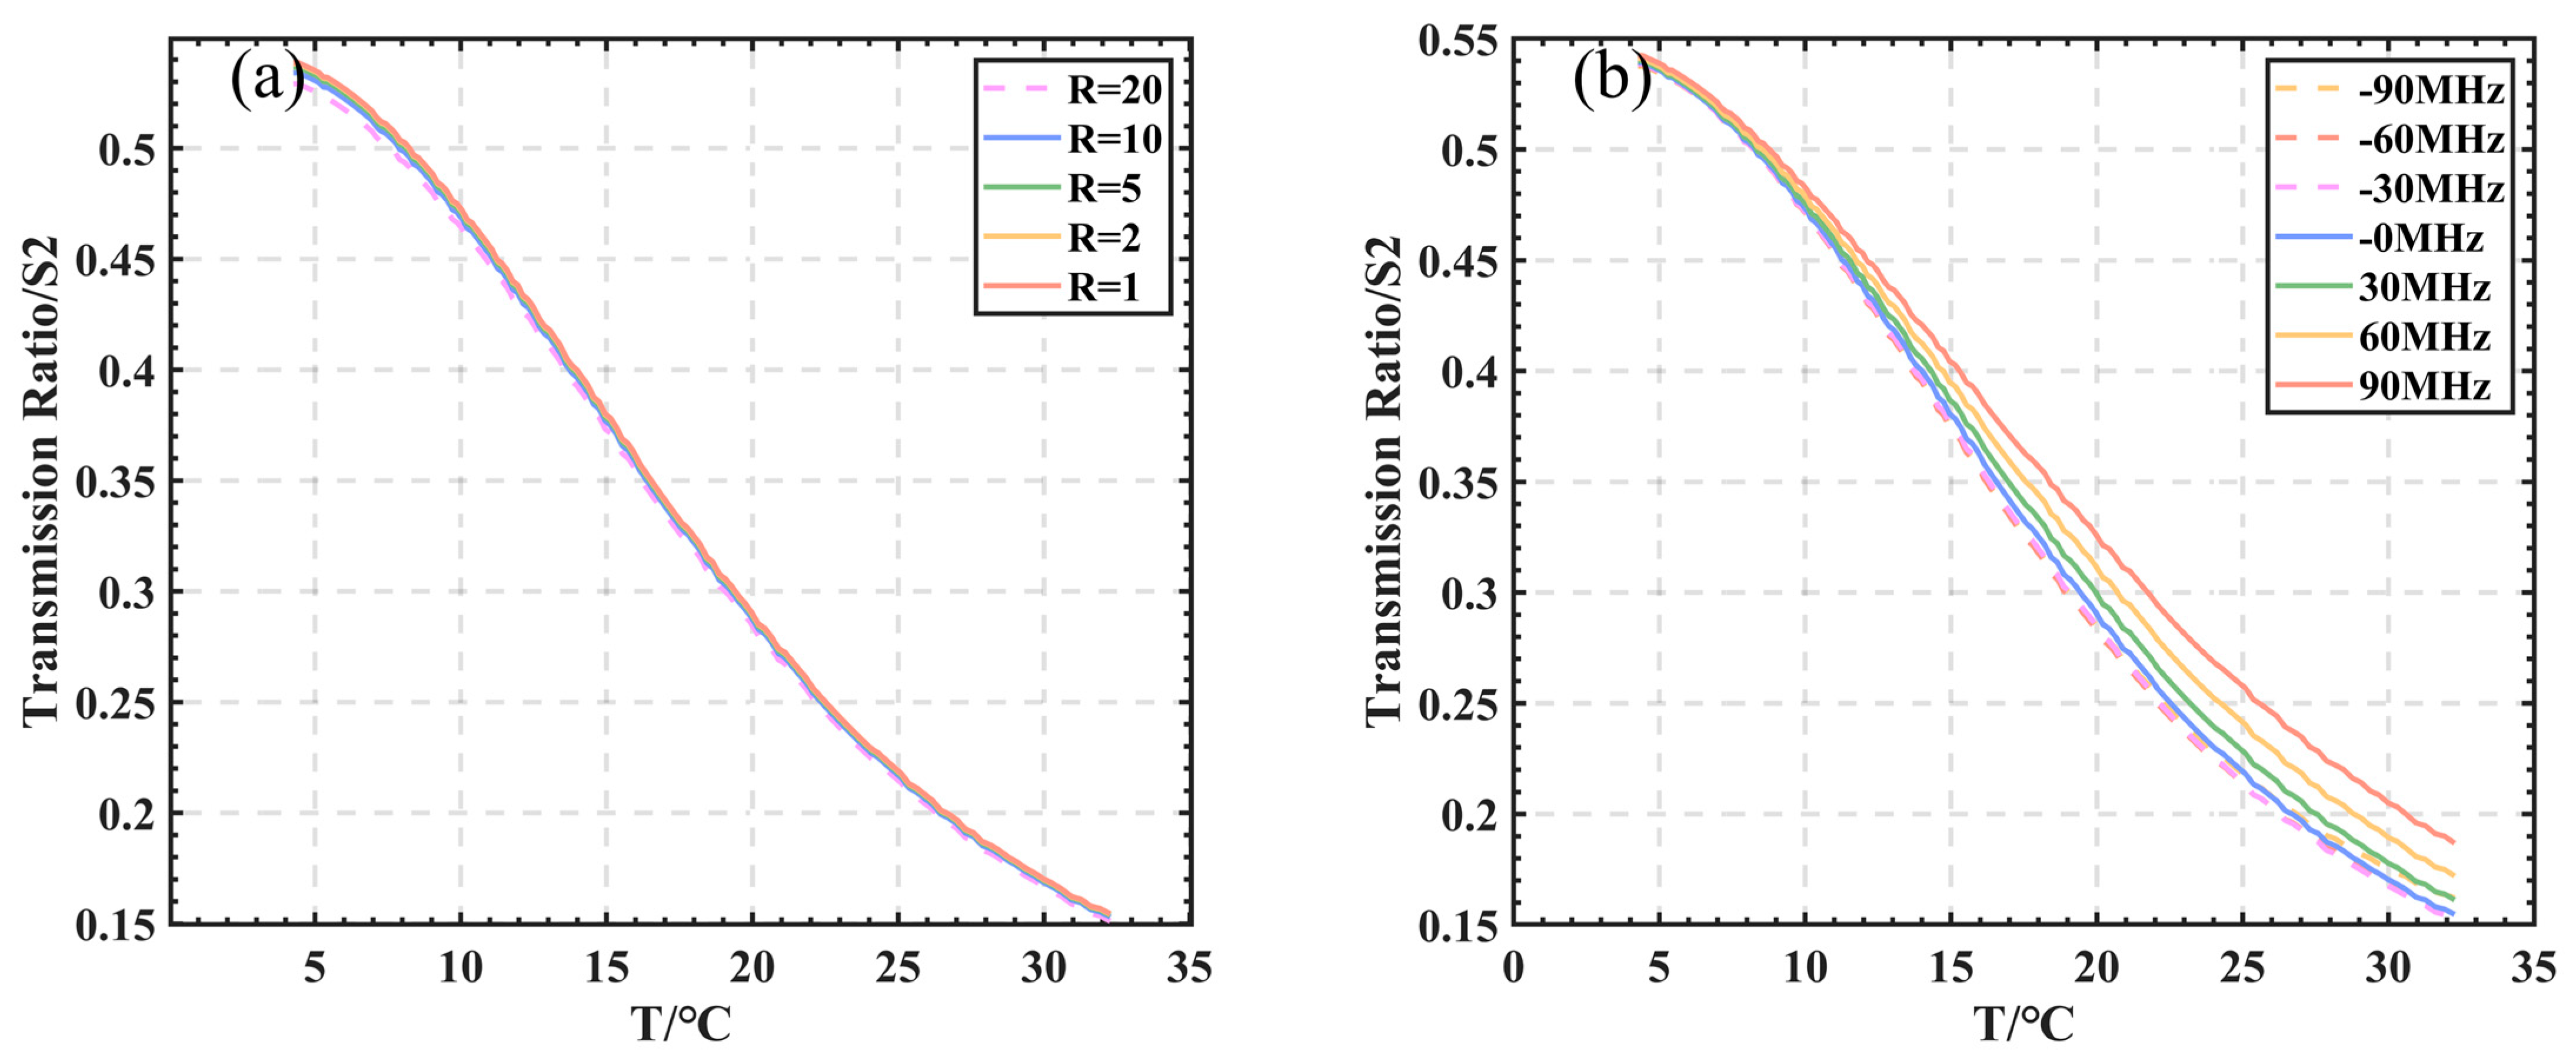
The ratio R of the elastic to Brillouin scattering energy in the seawater echo scattering spectrum affects the S2–temperature curve, where the stronger the elastic scattering energy, the more energy remains after being absorbed by iodine cell 1, resulting in an error. As shown in Figure 6a, the S2–temperature curves were obtained for different R values. The results show that different ratios of the relative energies of elastic and inelastic scattering had a small effect on S2 as the elastic scattering was thoroughly absorbed in the first iodine cell.
According to Equation (5), the extinction ratio EX1 was 27.9 dB under the parameters set in Table 2. Therefore, we considered an extinction ratio of iodine cell 1 of approximately 30 dB to be enough.
Frequency drift can occur during laser operation, as shown in Figure 6b. Jitters within ± 30 MHz had little effect on S2. Therefore, the frequency stability of the laser needs to meet this requirement.

3. System Design

3.1. Real Iodine Cell Absorption Spectrum Testing Device

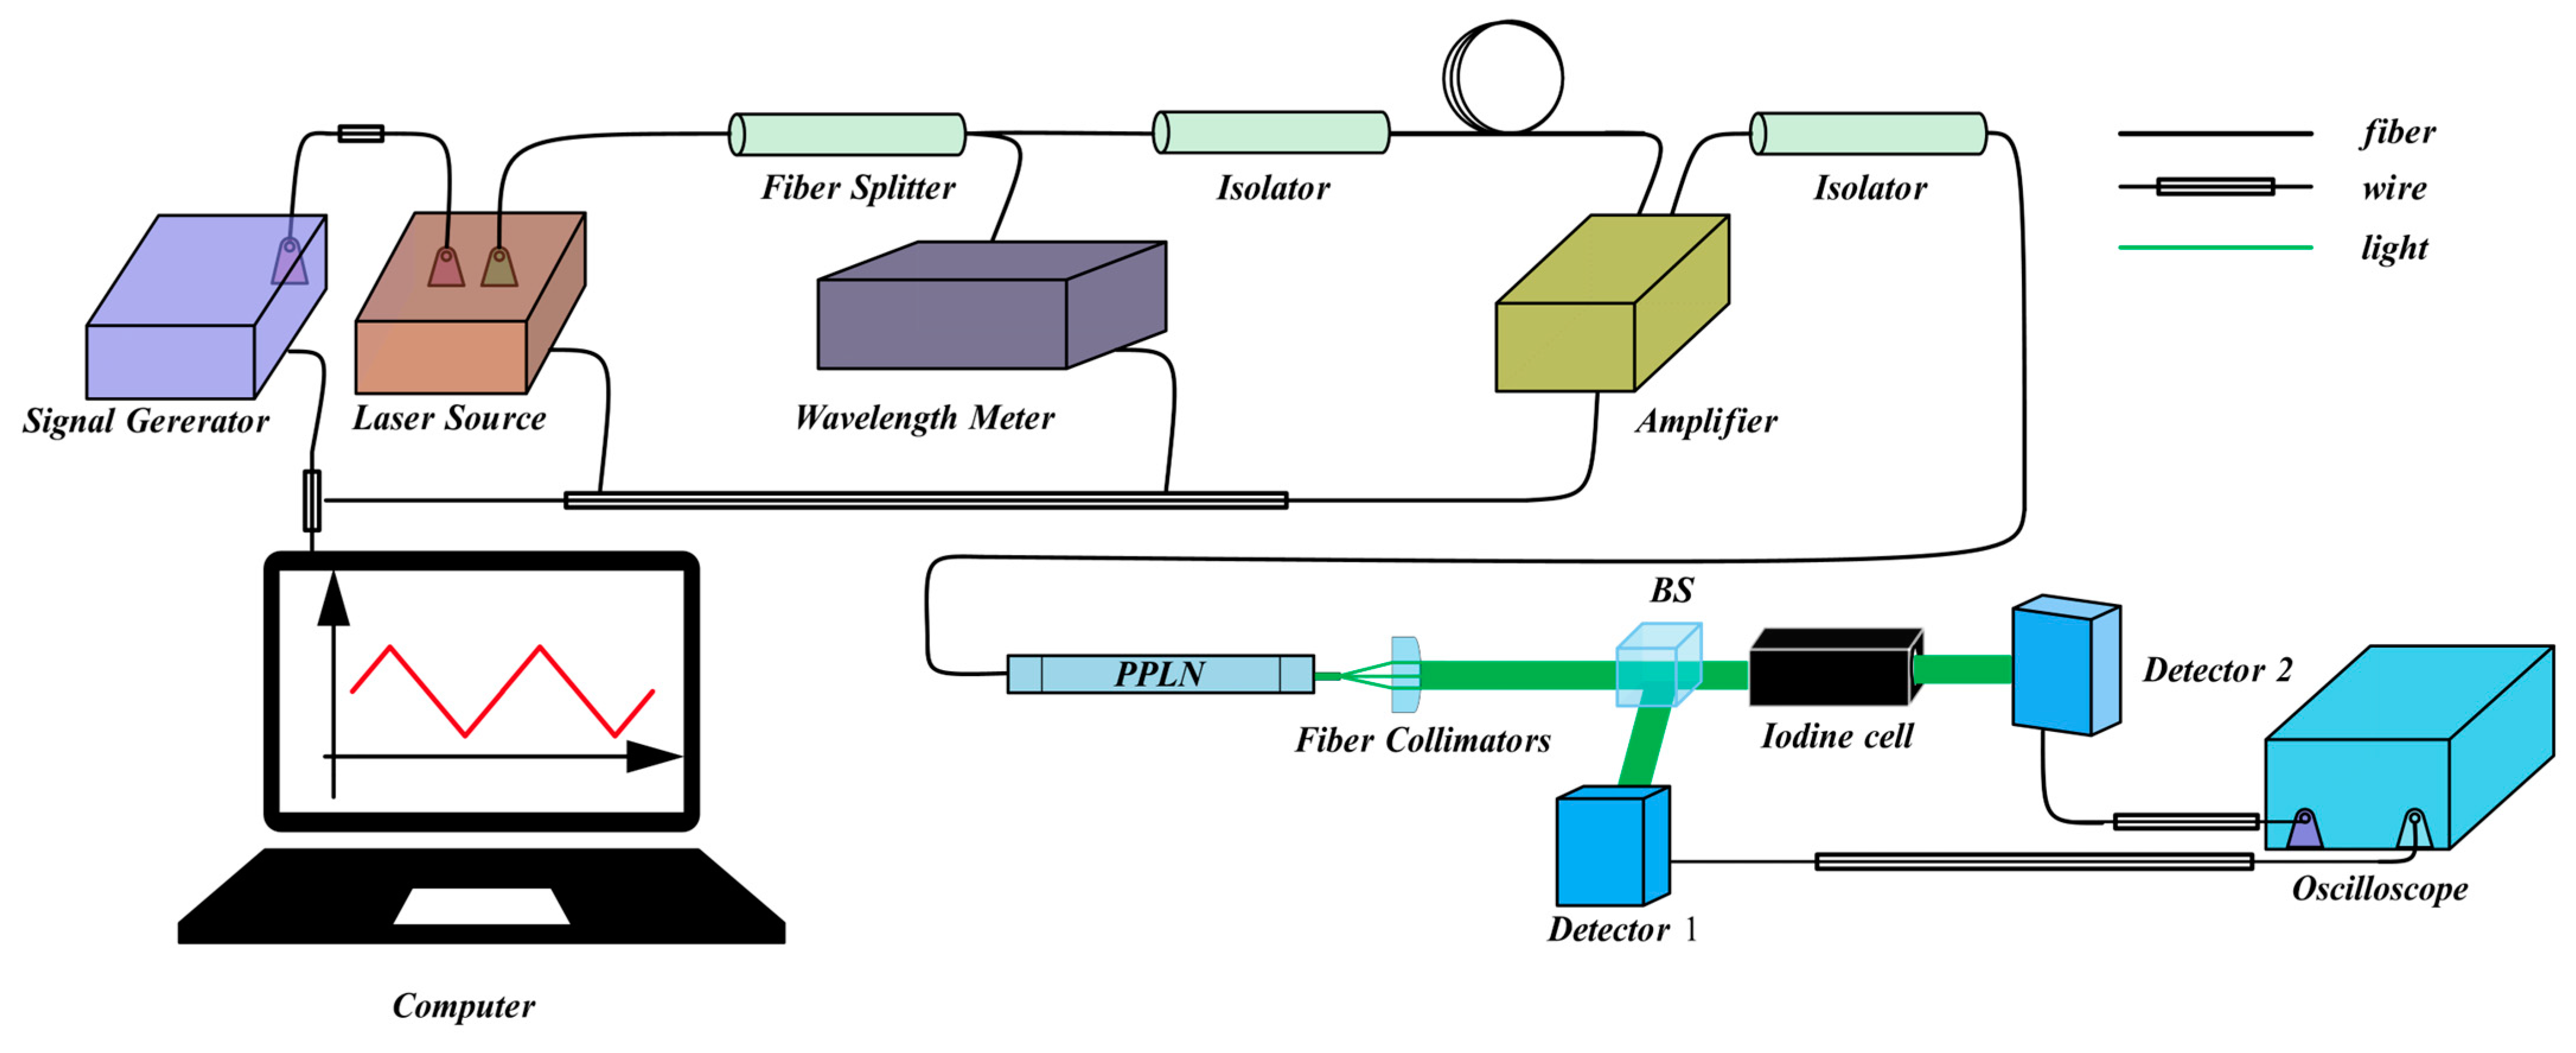
By scanning the simulated iodine absorption spectrum at around 532 nm, 532.10495 nm was chosen as the laser center wavelength. The actual iodine absorption spectrum at around 532.10495 nm must be accurately measured via experimentation to make a better system design. Therefore, a device to measure the iodine absorption spectrum was designed as shown in Figure 7.
A tunable laser was needed to measure the iodine absorption spectrum. The wavelength was tuned by modulating with a signal generator. The laser source was approximately 1064 nm. The laser is continuous with a linewidth of 0.6 MHz. The frequency stability is less than 1 MHz (8 h, lab environment). The laser was divided into two parts via a fiber isolator. The weak part was detected with the wavelength meter, which was connected to a computer for the real-time monitoring of the output laser wavelength. The other strong part was amplified via an amplifier, and an isolator was used to protect the laser and amplifier. The amplified laser light was input into the PPLN for frequency doubling. The frequency doubling efficiency is related to the temperature of the PPLN. After the PPLN module, the double-frequency laser at around 532.10495 nm was transmitted into the free space via a fiber collimator. This light is indicated as a green bold line in Figure 7 and was divided into two parts via a 1:1 beam splitter. One part was detected with detector 1, and the other part passed through the iodine cell and was then detected with detector 2. The detector used was a Thorlab PDA36A2 silicon photodetector made in USA with a gain range of 0–70 dB in 10 dB steps. The signal acquisition oscilloscope had 12-bit quantization and a minimum bandwidth of 20 MHz. The outputs of the detectors were sampled with an oscilloscope.
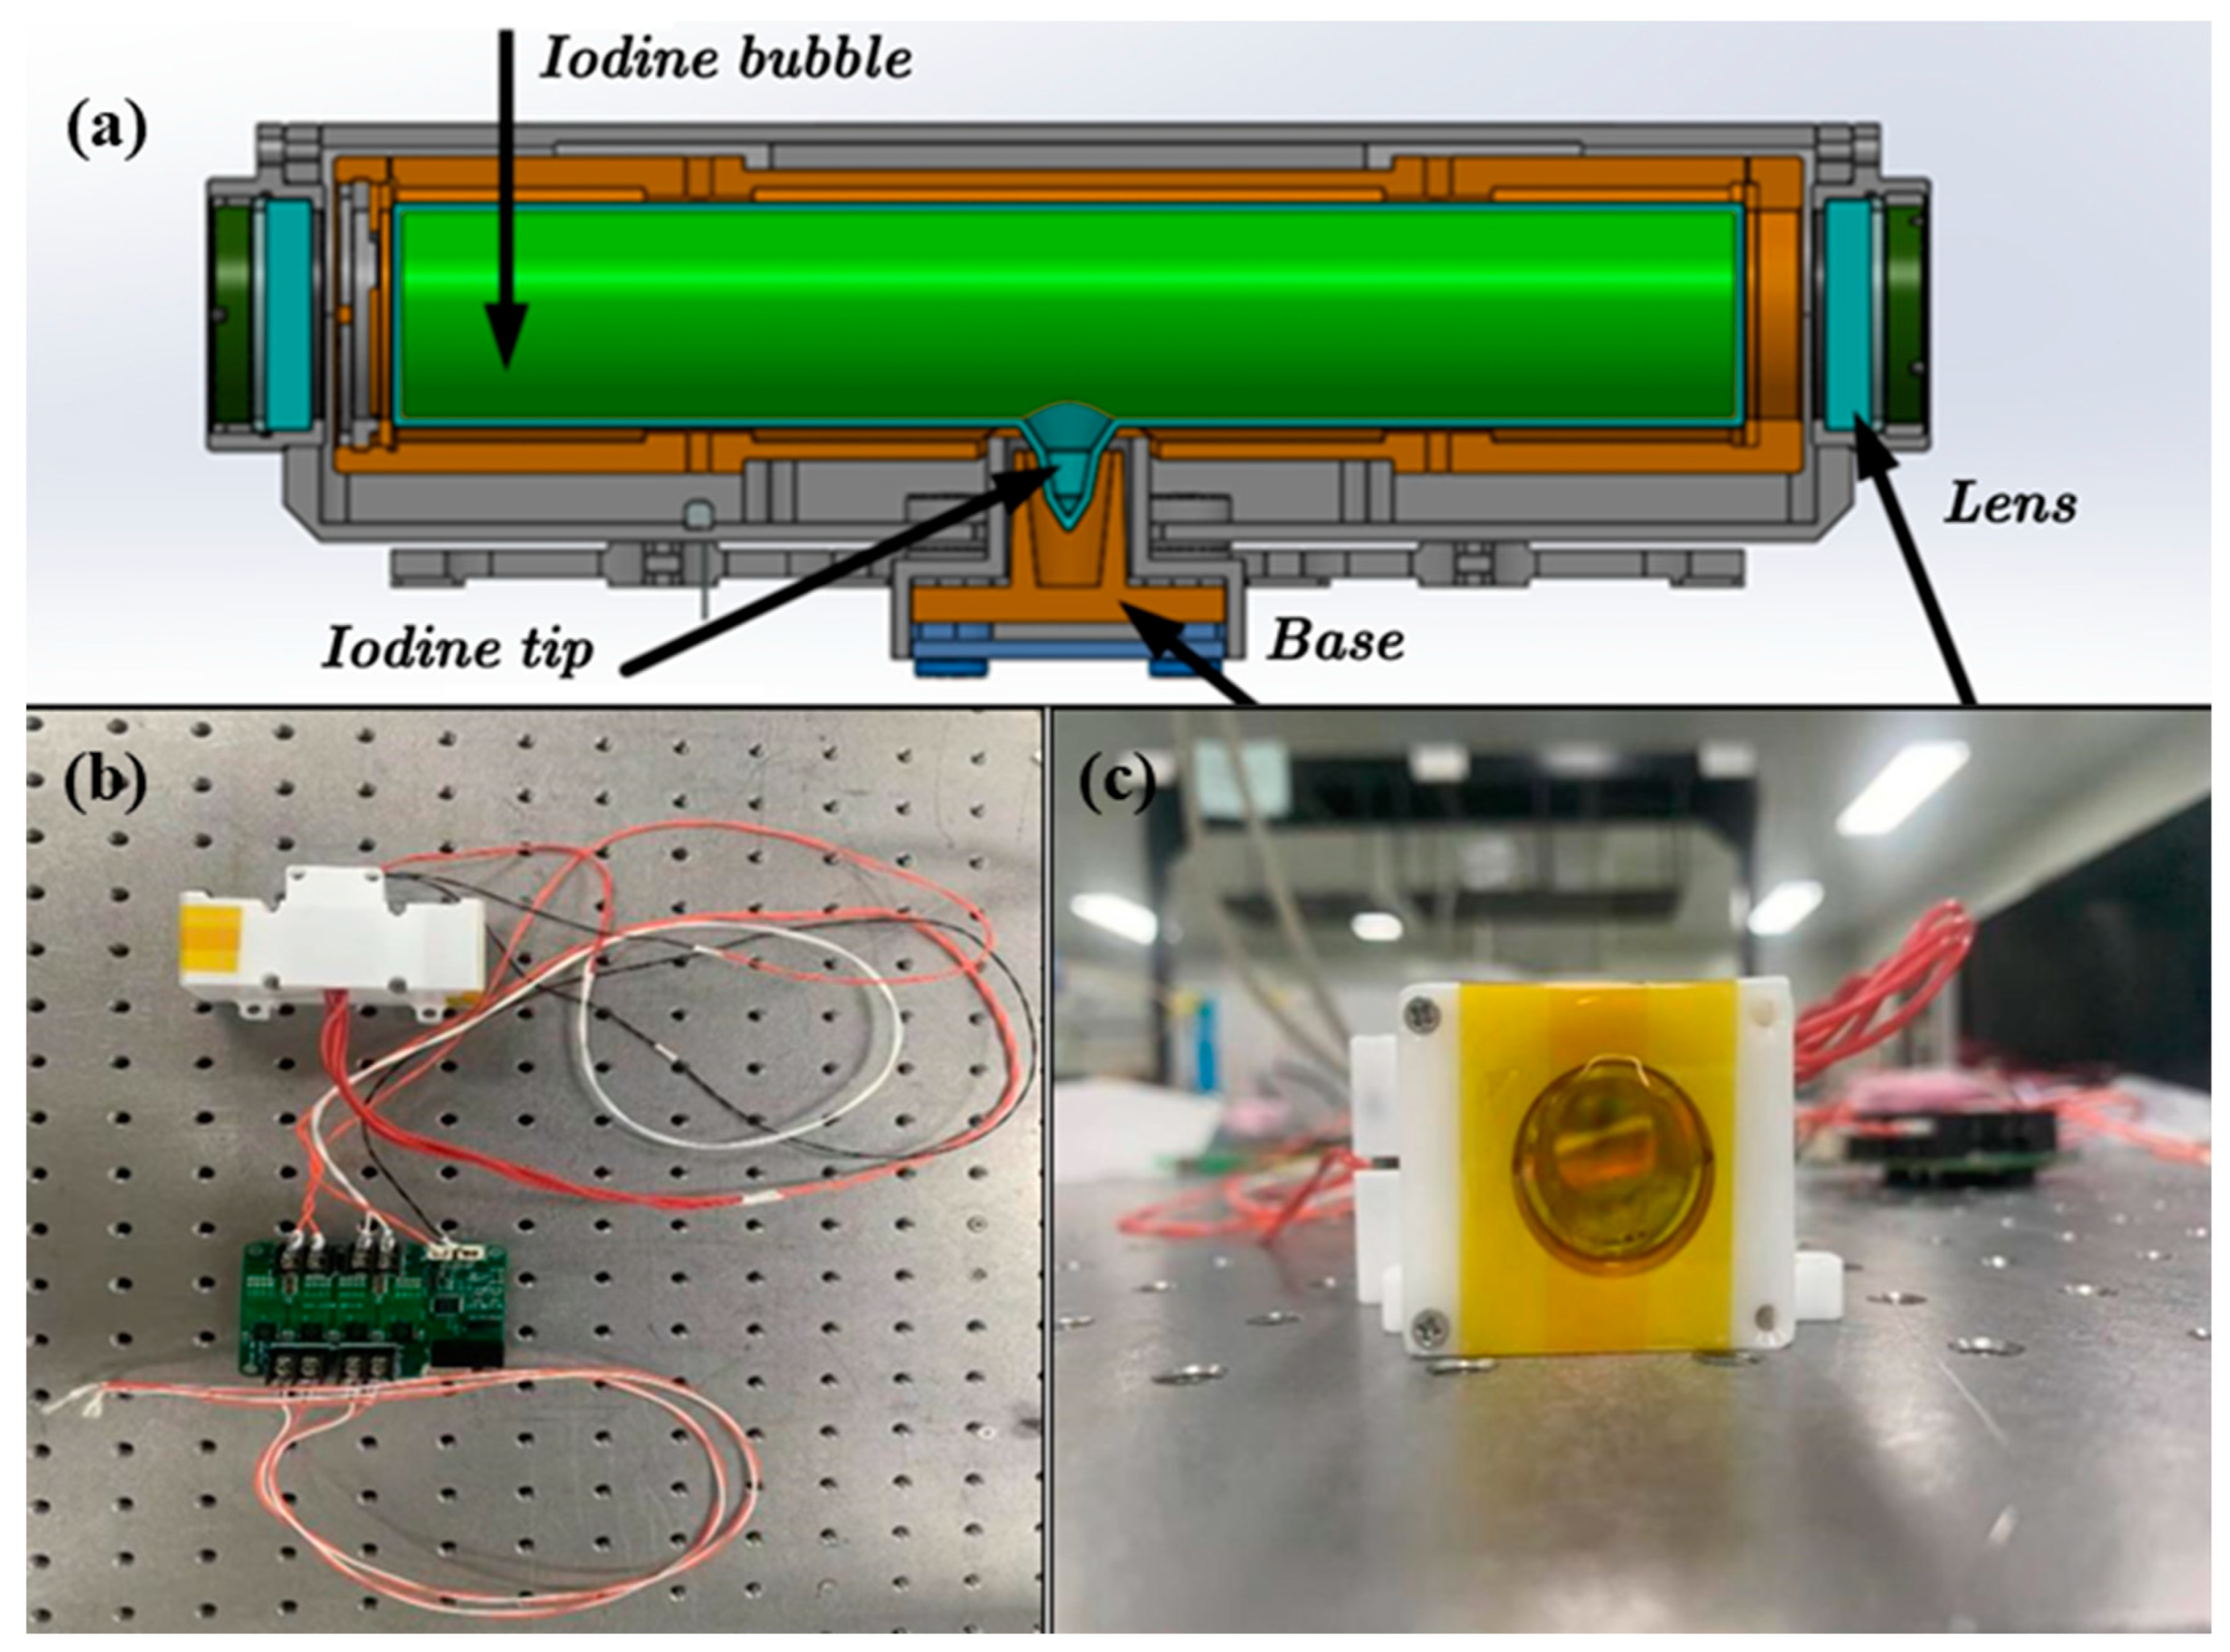
The two iodine cells were made of quartz glass, with lengths of 5 cm and 10 cm, respectively. Figure 8 shows the iodine cell, which contains two parts, the iodine bubble and the iodine tip. The temperature of the iodine cell was controlled via thermal resistance. The highest temperature the iodine cell could achieve was 80 °C.

3.2. Extinction Ratio Test

In this experiment, the iodine cell absorption curve data were tested for different temperature combinations.
The extinction ratio of an iodine cell plays a key role in distinguishing the elastic scattering and Brillouin scattering. The laser wavelength was set at 532.10495 nm to meet the iodine absorption peak to test the performance. As the laser intensity is greatly attenuated due to the iodine absorption, the measurement is susceptible to the noise of the detector and the oscilloscope, which easily submerges the optical signal. Therefore, a photodetector with an adjustable gain is useful to distinguish between the remaining signal and the detector noise.
The optical power in the experimental system was P = 20   mW . The beam splitter ratio should be calibrated. In this experiment, the transmittance ratio TEX of the beam splitter was 0.49. The average noise shown in the oscilloscope was A n o i s e ¯ = 40   mV . The signal amplitude at the iodine absorption peak at different gains from 0 to 70 dB was averaged as A v a l l e y ¯ . Then, the extinction ratio EX2 of the iodine absorption peak was calculated using the incident optical power Pin and the output optical power Pout of the iodine cell, expressed as Equation (9).
{ P i n = P T E X P o u t = A v a l l e y ¯ A n o i s e ¯ Res high E X 2 = P out P i n
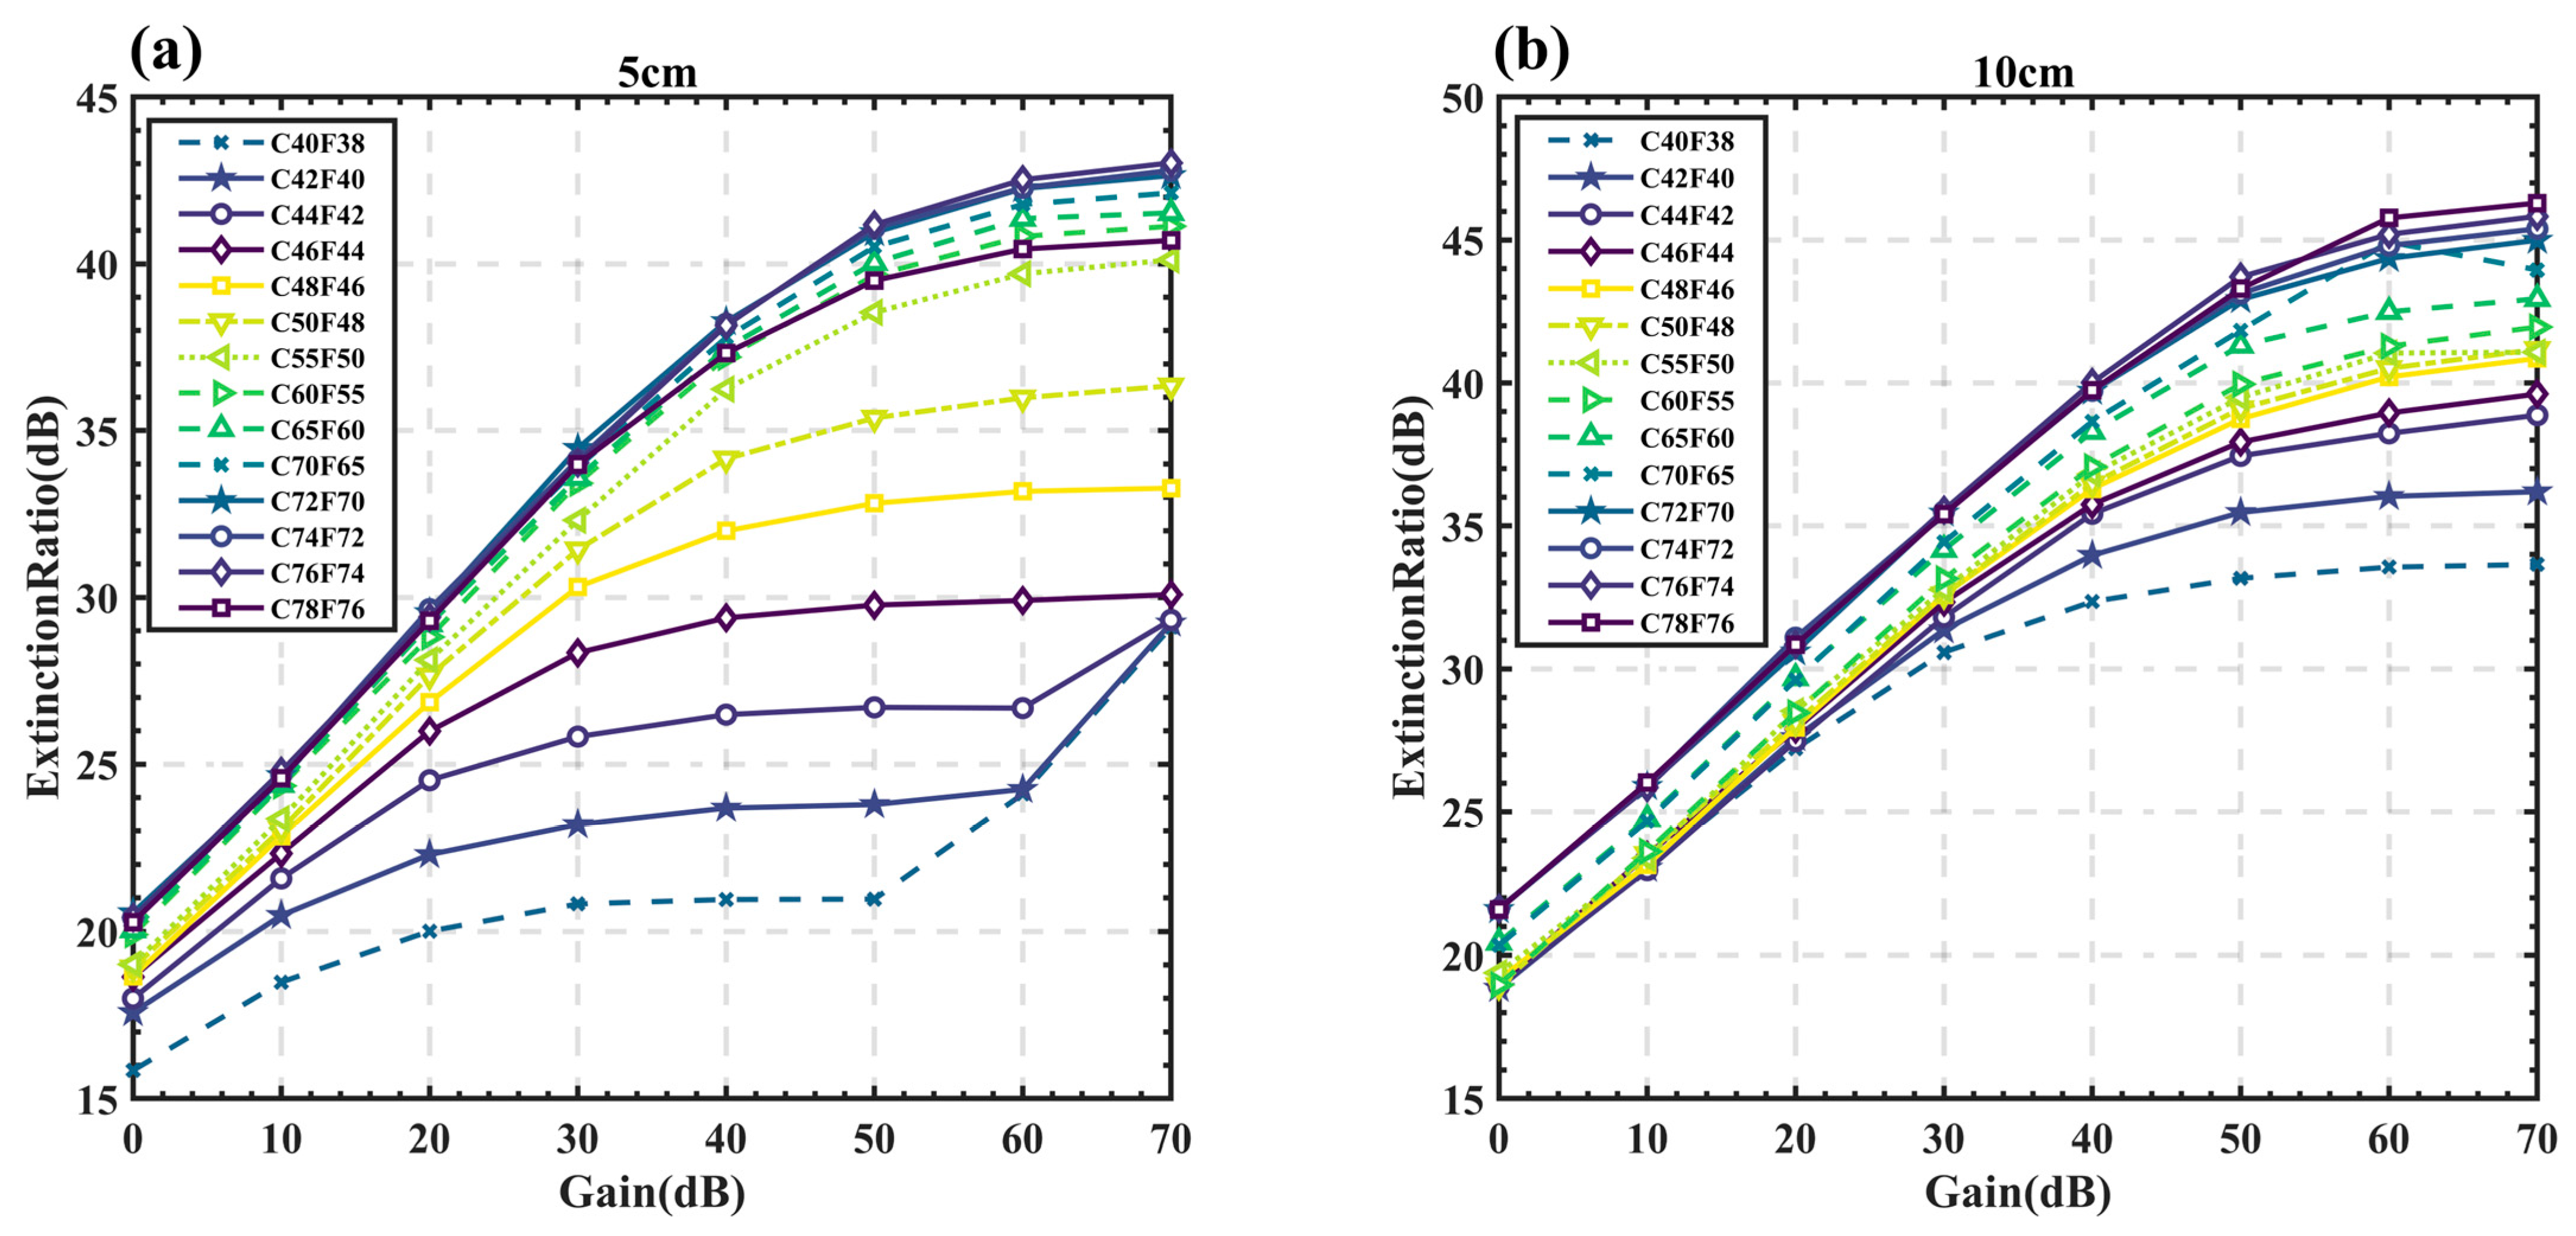
where Reshigh is the photoresponsivity at a high gain and EX2 is the calculated extinction capacity of the iodine cell at 532.10495 nm, which reflects the extinction ability of the elastic scattering. The calculated extinction ratio EX2 of the iodine cell at 532.10495 nm with various temperatures and detector gains is shown in Figure 9.
Logarithmic coordinates are used in Figure 9 to facilitate the observation. Each curve represents a different iodine absorption cell temperature set. Normally, the iodine tip temperature is 2 °C lower than the iodine bubble. The extinction ratio EX2 of the iodine absorption cell gradually increases as the gain of the photodetector improves at first. Thus, the laser intensity after the iodine absorption cell is submerged by the noise. However, the extinction ratio tends to stabilize when the detector gain is large enough. Hence, the remaining laser intensity after the iodine absorption cell is not drowned by the noise. The stable extinction ratios are considered the real extinction ratios. The higher the temperature, the larger the extinction ratio. Moreover, the extinction ratio of the 10 cm iodine absorption cell was stronger than that of the 5 cm iodine absorption cell under the same temperature set because the longer pool resulted in more sufficient absorption.
According to Figure 9 and the recommended extinction ratio of 30 dB described in Section 2.3, the corresponding temperature and detector gain should be set as detailed in Table 3.

3.3. Iodine Absorption Spectra Test

An adjustable gain detector was used to measure the iodine absorption spectra. The laser wavelength was scanned at approximately 532.10495 nm. When the laser wavelength met the iodine cell absorption peak, the detector worked in a high-gain state (30 dB); otherwise, the detector worked in a low-gain state (0 dB) due to the high transmittance of the iodine cell. The laser wavelength was recorded with the wavelength meter. Then, the measured high- and low-gain data were stitched together to form the complete iodine absorption spectra at approximately 532.10495 nm.
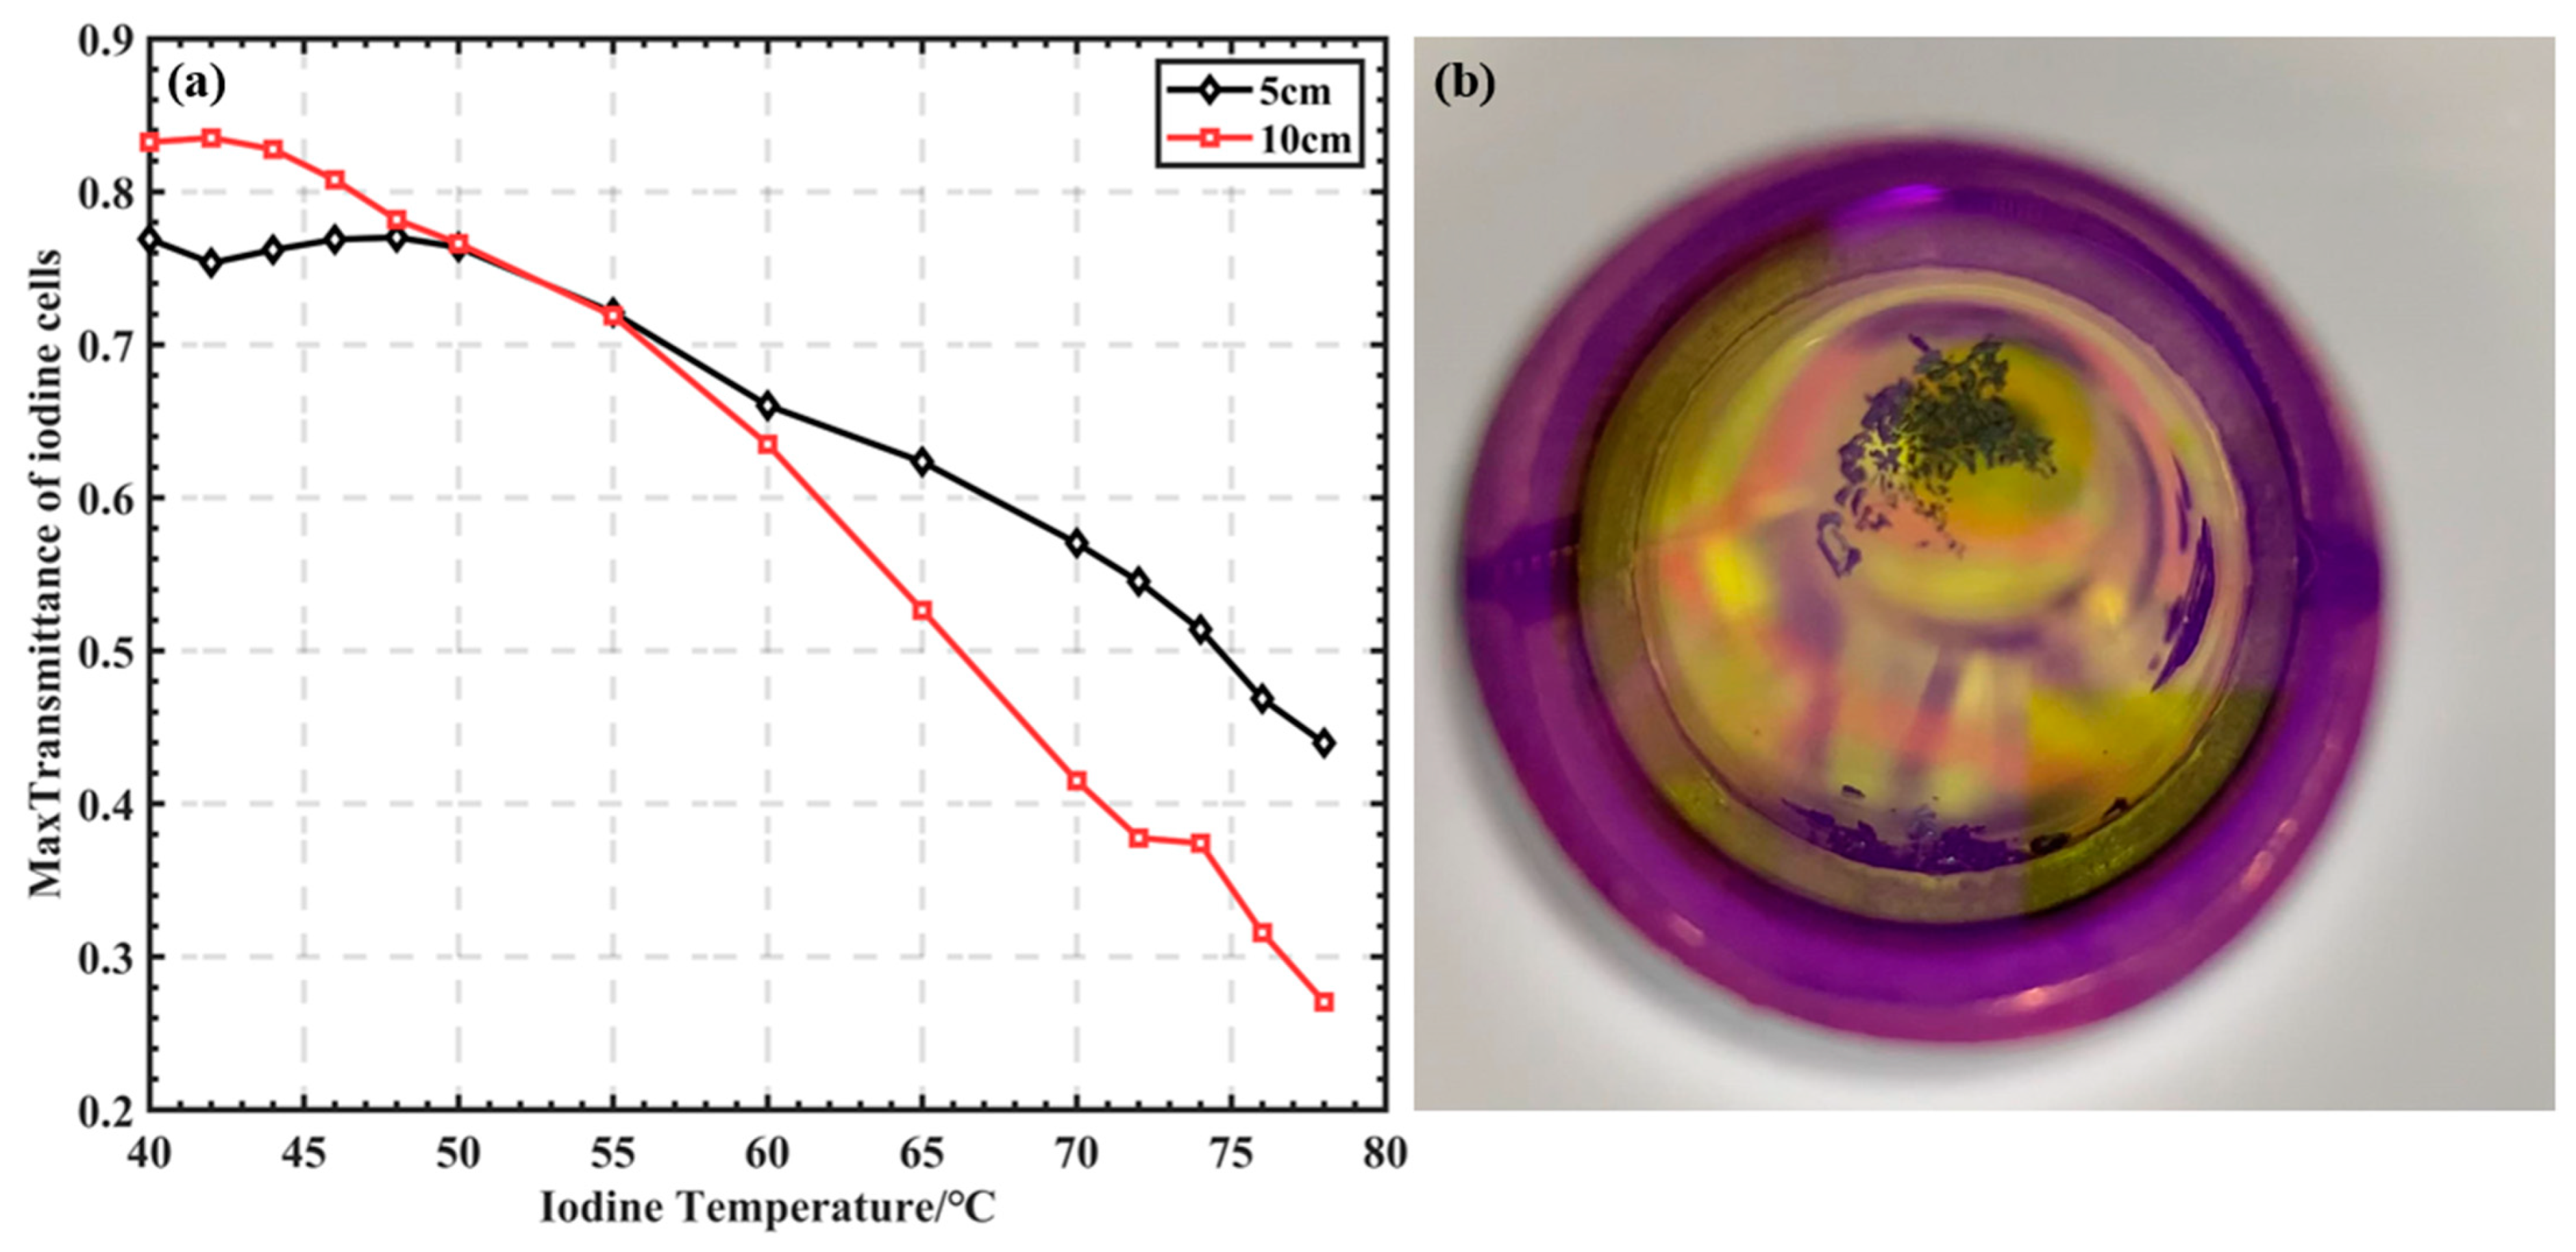
In the actual measurement process, the total transmittance of the absorption curves in the experiment decreased with the increasing temperature, whether the iodine cell was 5 cm or 10 cm, as shown in Figure 10a. In addition, the iodine vapor condensed on the window, as shown in Figure 10b, and the position was random, which may have led to the loss of part of the light.
Therefore, the maximum transmittance of the iodine cell decreased as the temperature increased, which affected the effectiveness of the temperature measurement. In practice, the amount of energy received by PMT2 and PMT3 in Figure 4 could be adjusted by adjusting the beam-splitting ratio of beam splitter 2 to achieve the best temperature measurement effect.
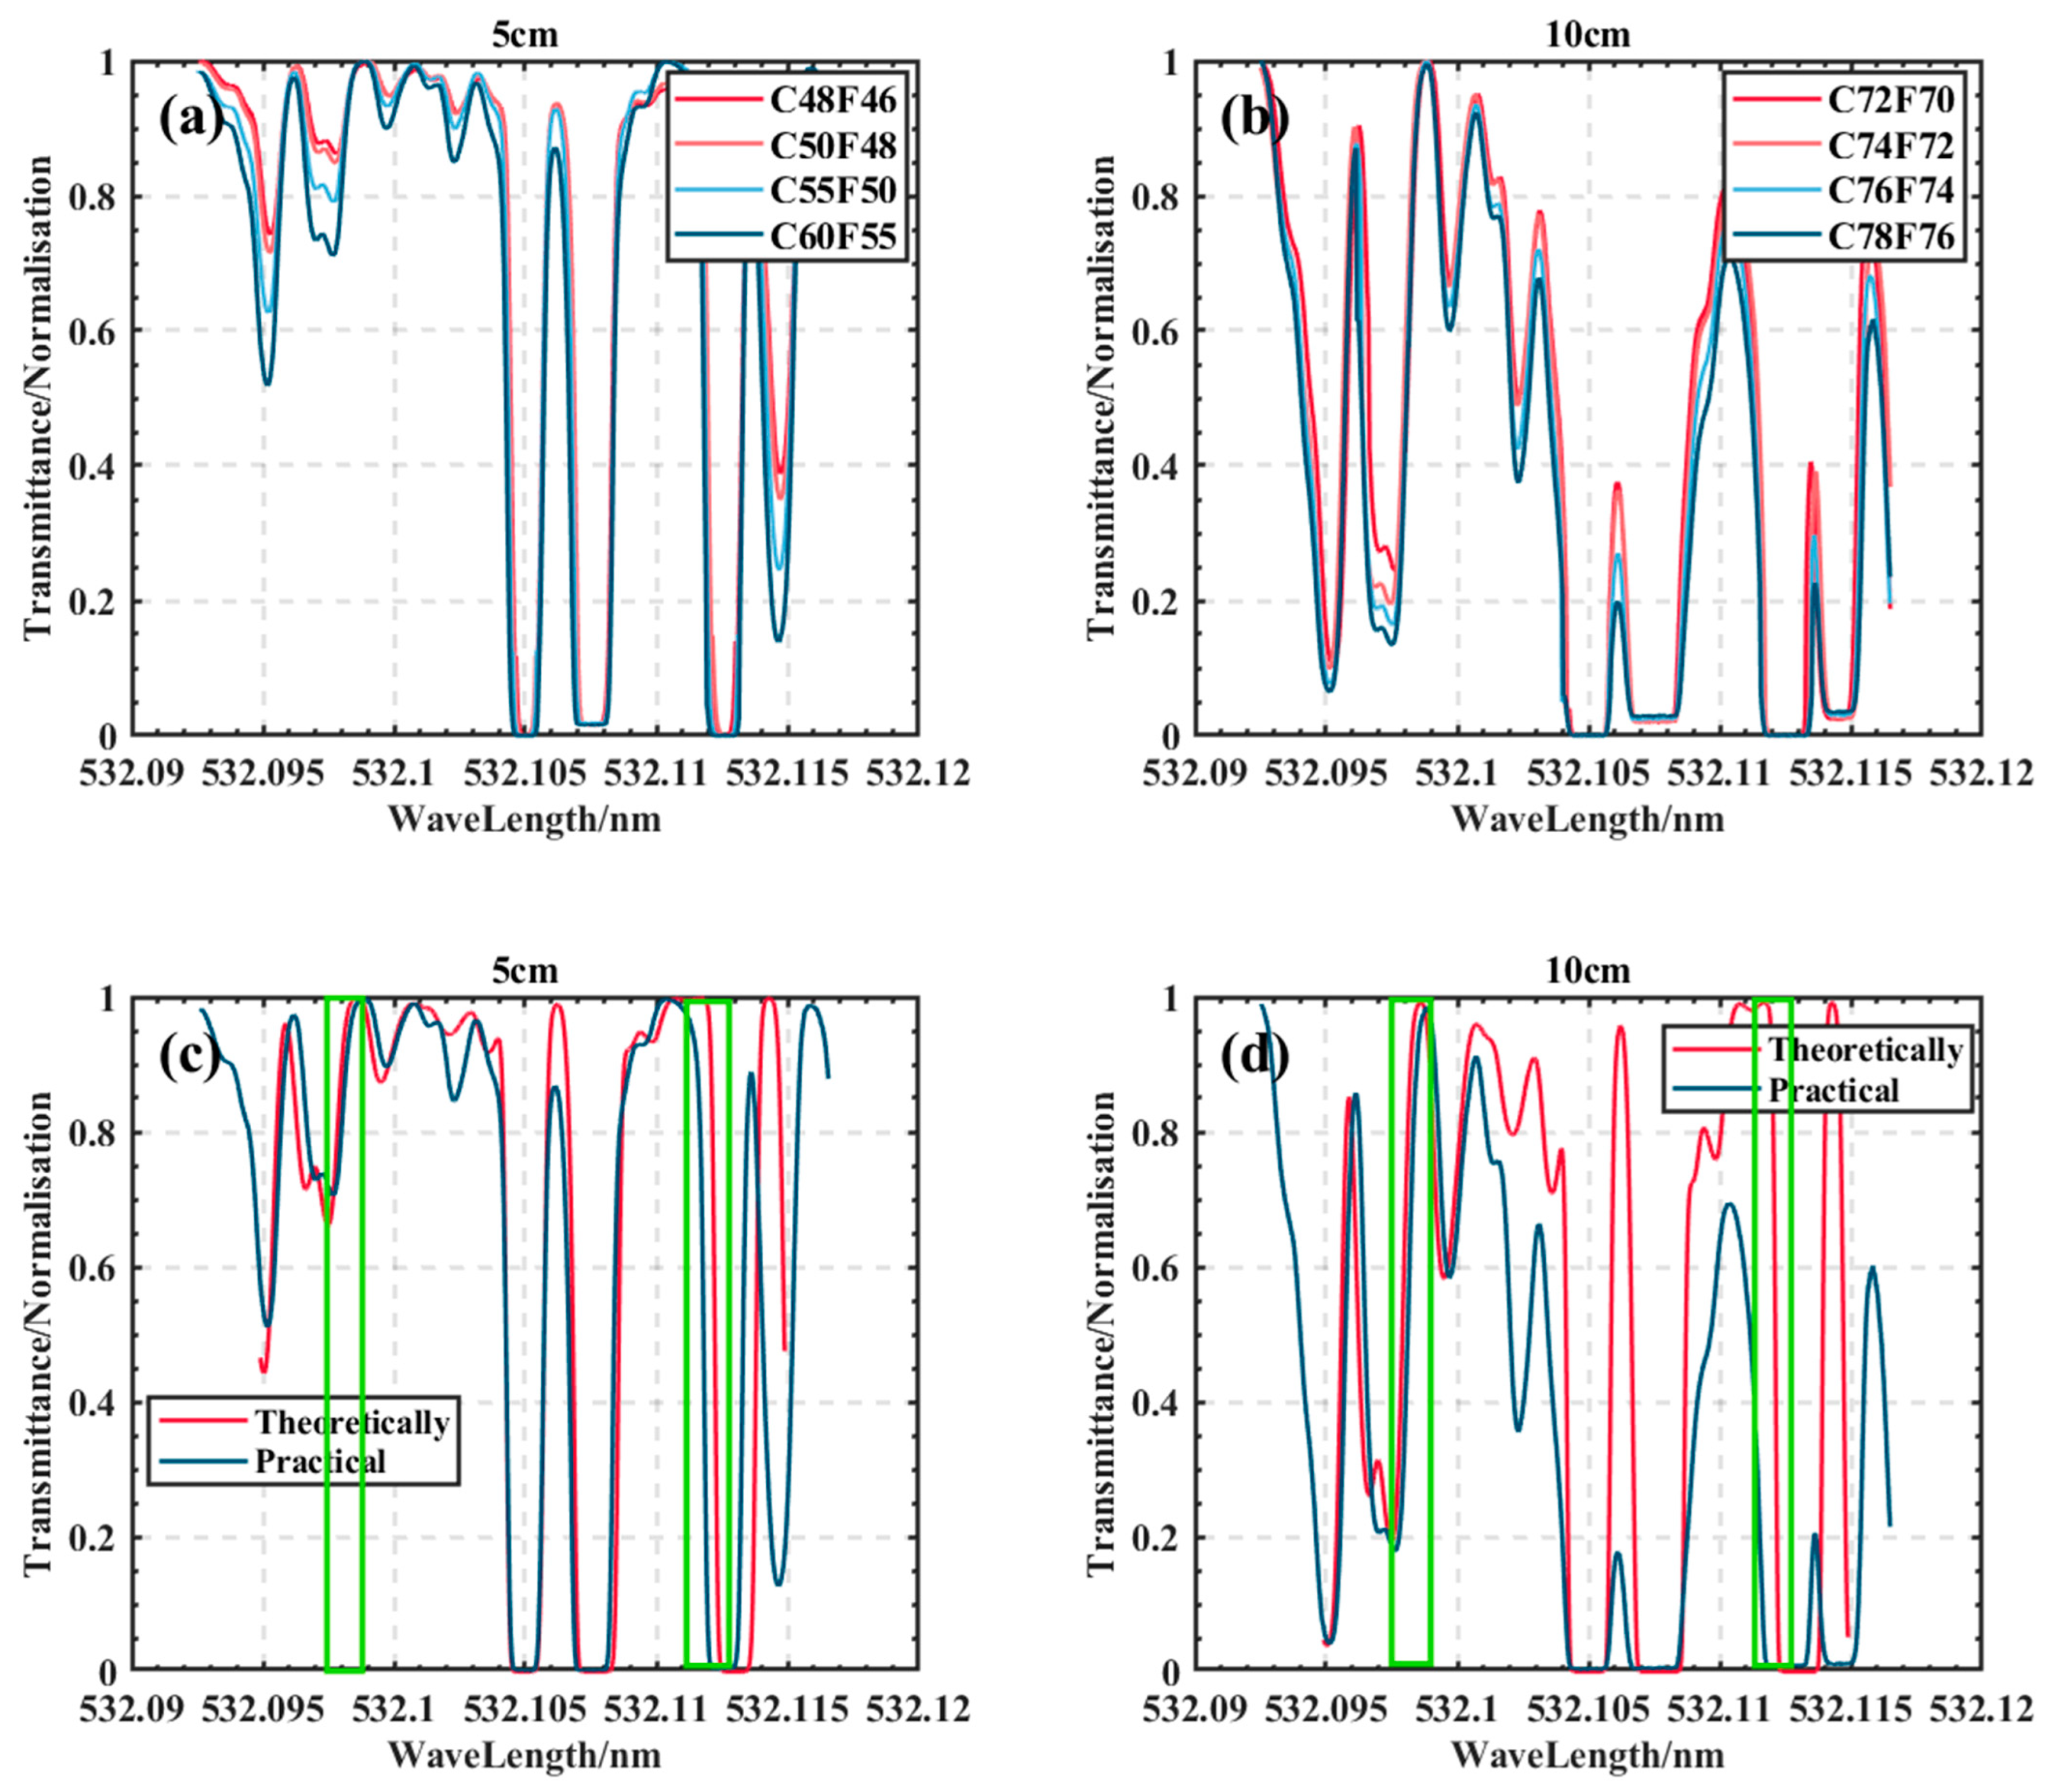
The measured normalized iodine absorption spectra at approximately 532.10495 nm of the 5 cm and 10 cm iodine cells at different temperature sets are shown in Figure 11.
Figure 11a shows the absorption spectra of the 5 cm iodine cell at different temperatures. The absorption gradually increased as the temperature increased because the pressure in the iodine cell increased with the increasing temperature, which, in turn, affected the iodine cell’s absorption spectrum. Figure 11b shows the absorption spectra of 10 cm iodine cells at different temperatures. The absorption lines broaden, and new absorption lines are generated, compared with the absorption spectra of the 5 cm iodine cells at low temperatures.
The results obtained by comparing the absorption spectra of iodine molecules near 532.10495 nm of this measurement with the simulation model are shown in Figure 11c,d. The green rectangles show the positions of the Brillouin scattering in the spectra. The pictures show that the left sides of the measured iodine cell spectra are in good agreement, whereas the right sides differ more. The difference between the simulation and the measurement spectra directly affects the temperature measurement. Therefore, the experimental system parameters should be considered under the real iodine absorption spectra.

3.4. Iodine Cell Temperature Set Analysis

It is necessary to determine the optimum iodine cell temperature setting based on the actual measured iodine cell curves combined with the dual-iodine-cell mathematical model. Since the extinction ratio of the 5 cm iodine cell should be approximately 30 dB, the temperature of the iodine bubbles in the 5 cm iodine cell should be higher than 48 °C. However, the higher the temperature of the iodine cell, the lower the energy transfer efficiency of the Brillouin signal. Therefore, the temperature of the 5 cm iodine cell should be set in the range of 48 °C to 55 °C. For the 10 cm iodine cell, the temperature should be set as high as possible to produce a steep absorption edge, i.e., above 70 °C. The amount of change in S2 was calculated based on these selected temperature ranges.
The laser emission wavelength was at 532.10495 nm. The temperature in the dual-iodine-cell system was judged via the value of S2. The gradient of S2 was expected to be as large as possible. The variation range in S2 with different iodine cell temperature sets is shown in Figure 12.
In Figure 12, the X-axis is the temperature of the 5 cm iodine cell, the Y-axis is the temperature of the 10 cm iodine cell, and the Z-axis is the amount of change in S2. The larger the value, the better the effect of the temperature measurement. Figure 12a–c correspond to different seawater temperature ranges. The temperature range of [5 °C, 15 °C] produced a better measurement effect than [15 °C, 32 °C]. The optimal temperature combinations of the iodine pools for different temperature ranges were obtained from the graphs as shown in Table 4.
In Figure 2, the linewidth of the elastic scattering in seawater is much smaller than that of the absorption line. The central wavelength can be shifted slightly within the absorption line to obtain a better temperature measurement effect, especially in the temperature range of [15 °C, 32 °C].
The optimal measurement effect with the corresponding center frequency shift situation is shown in Figure 13.
The measurement effect within the temperature range of [15 °C, 32 °C] significantly improved when the center frequency shifted. Simultaneously, the measurement effect within the temperature range of [5 °C, 15 °C] was reduced. The change in S2 in the total temperature range of [5 °C, 32 °C] was almost the same as that at 532.10495 nm. The optimal center frequency shift corresponding to the best measurement effect at [15 °C, 32 °C] (shown in Figure 13c) is given in Figure 13d. Figure 13c,d show that the optimal temperature measurement effect at [15 °C, 32 °C] corresponded to the iodine cell temperatures of 60 °C and 78 °C and a center frequency shift of −250 MHz (corresponding to a wavelength of 532.10518 nm).
The optimal temperature combinations of the iodine cell and corresponding wavelengths for different temperature ranges are summarized in Table 5.
Table 5 shows that at the ocean temperature of [5 °C, 15 °C], the laser wavelength of 532.10495 nm was more appropriate, corresponding to the iodine pool temperature combinations of 50 °C and 78 °C. For the ocean temperature of [15 °C, 32 °C], the laser wavelength of 532.10518 nm was more appropriate, corresponding to iodine cell temperature combinations of 60 °C and 78 °C. Both combinations of wavelengths and temperatures were available for the ocean temperature of [5 °C, 32 °C].

3.5. Temperature Measurement Accuracy Analysis

Since the seawater temperature is inversely determined by the change in S2, which is obtained from the ratio of I2 to I3, the direct measurement errors of I2 and I3 affect the accuracy of the temperature inversion. The transfer error of S2 is calculated using Equation (10).
σ s 2 = ( σ I 2 ) 2 + ( σ I 3 ) 2
where σ I 2 and σ I 3 are the measurement accuracies of I2 and I3. The seawater temperature measurement accuracy σ T can be calculated using Equation (11).
σ T = σ S 2 / ( d S 2 / d T )
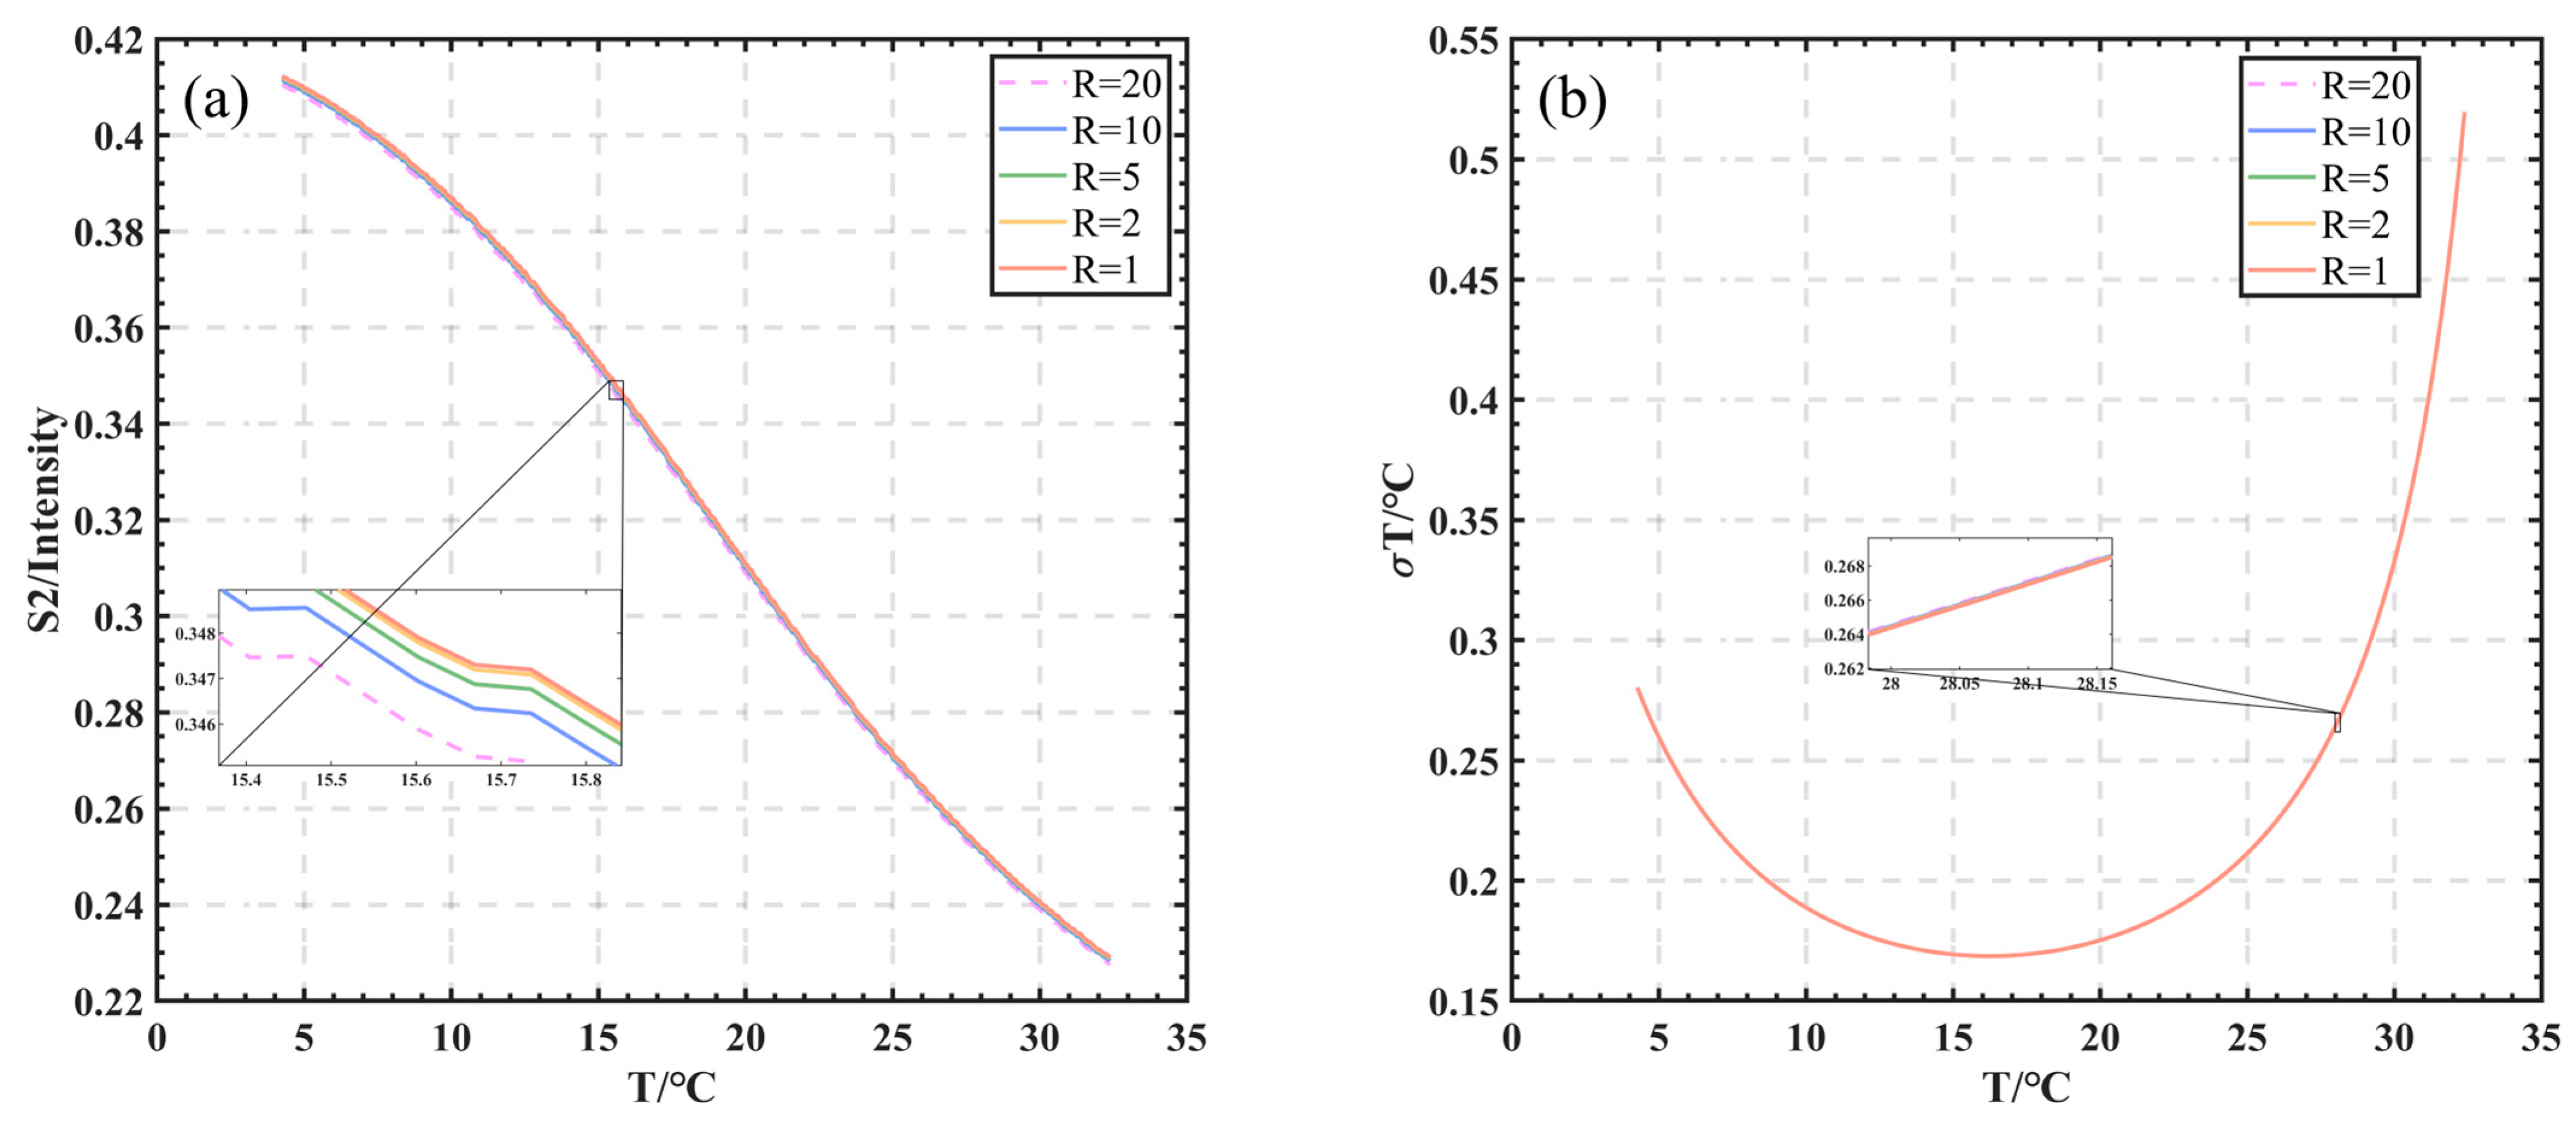
d S 2 / d T is the slope of the S2–temperature curve. If we assume σ I 2 = σ I 3 = 1 and use the 60 °C and 78 °C iodine pool temperature combination, corresponding to the wavelength of 532.10495 nm, the above equation can be used to calculate the S2–temperature curves with the temperature inversion accuracy error, as shown in Figure 14.
Figure 14 shows that when the laser emission wavelength was 532.10495 nm, the lower the seawater temperature, the better the temperature accuracy. When the seawater temperature was lower than 15 °C, the temperature accuracy was better than 0.2 °C. When the temperature was in the scope of 15~32 °C, the temperature accuracy was in the range of 0.2~0.6 °C.
Using the combination of iodine cell temperatures of 60 °C and 78 °C, corresponding to the wavelength of 532.10518 nm, as an example, Figure 15 presents the S2–temperature curves calculated with the above equation and the error of the temperature inversion accuracy.
Figure 15a shows that S2 gradually decreased with temperature when the laser emission wavelength was 532.10518 nm. Figure 15b demonstrates that the temperature inversion accuracy was in the range of 0.15 °C to 0.2 °C when the seawater temperature was in the range of 10 °C to 25 °C, and the temperature inversion accuracy ranged from 0.2 °C to 0.5 °C when the seawater temperature was higher than 25 °C.
The influence of the R-value on the temperature inversion accuracy is almost negligible in the temperature inversion accuracy curves for the above two cases, which is because the R-value directly influences the S2 measurement; therefore, the above calculations do not directly reflect its influence. This paper focused on the measurement error of S2 over time with the R-value to quantitatively analyze the latter’s influence. The calculation formula is shown in Equation (12).
Δ S 2 ¯ = | S 2 R 20 ( T ) | | S 2 R 1 ( T ) | ¯
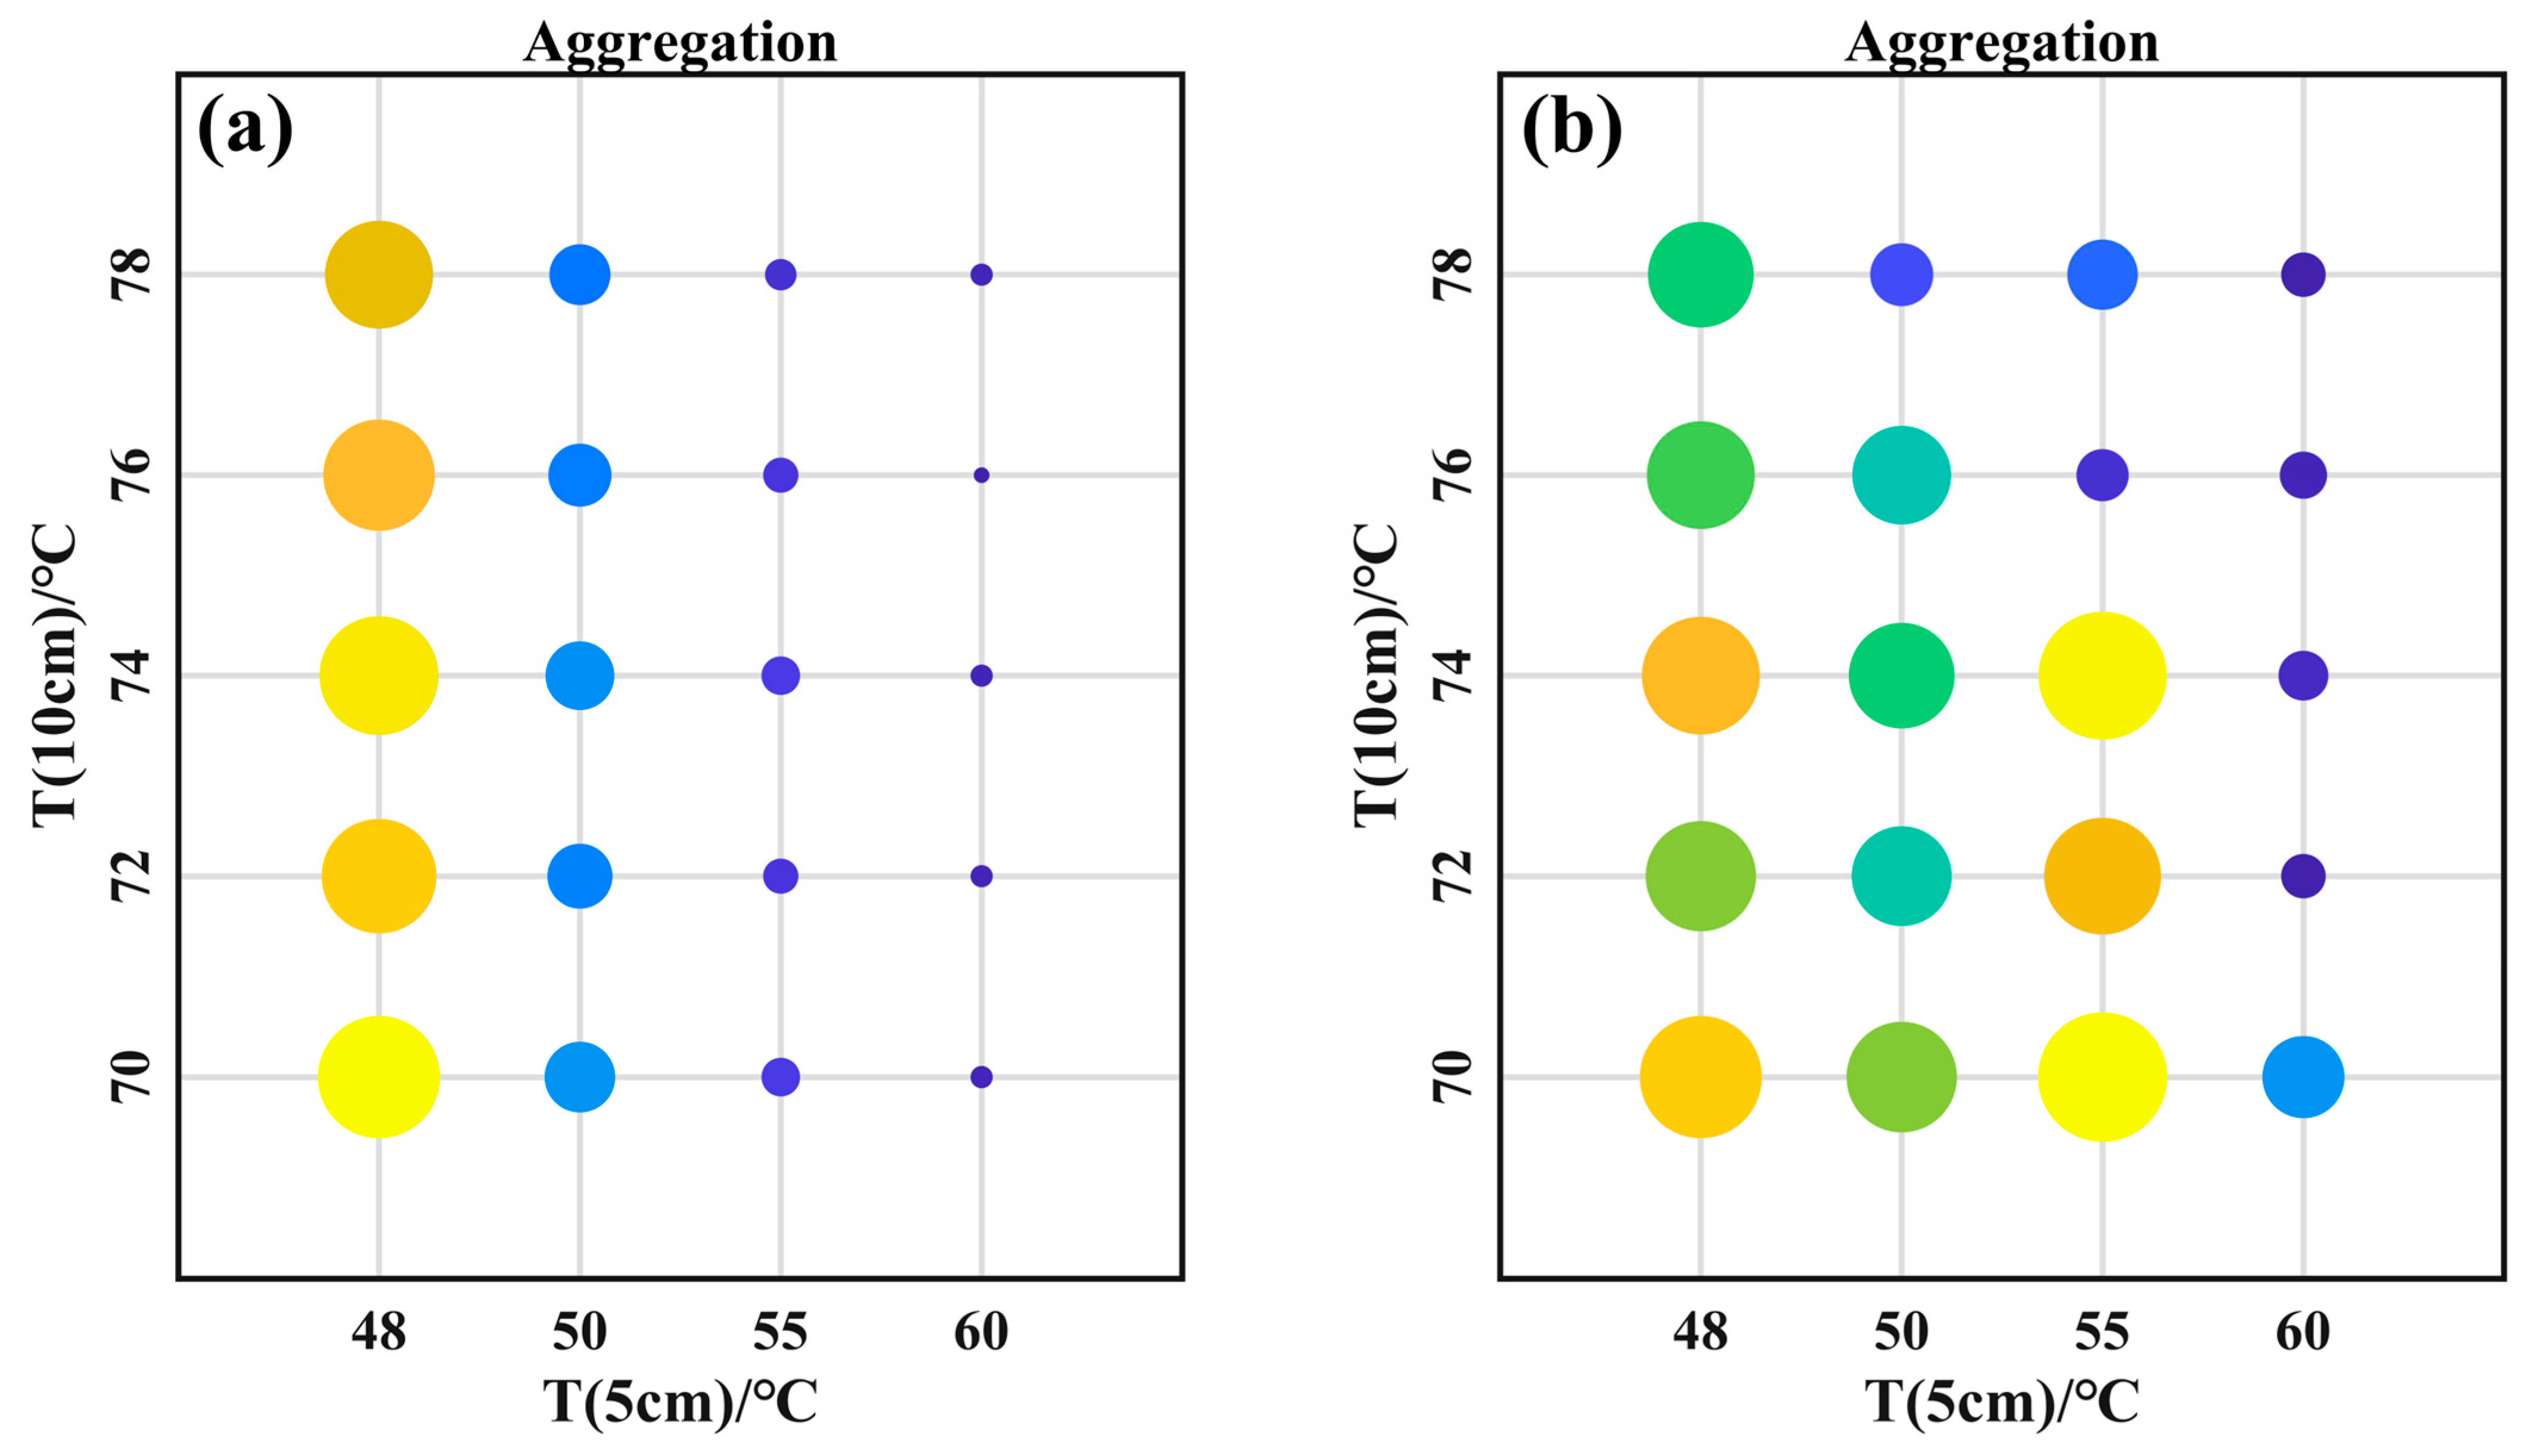
where S2R20 and S2R1 are the S2 values corresponding to the R-values of 20 or 1 at the same temperature, and Δ S 2 ¯ is the average of the difference between S2R20 and S2R1 at all temperatures. Then, Δ S 2 ¯ results in the temperature error based on Equation (11). The R-induced changes for the variable iodine pool temperature combinations are shown in Figure 16.
Figure 16 illustrates that the horizontal and vertical coordinates represent the temperatures of the first and second iodine pools, respectively, and the corresponding scattering point sizes correspond to the numerical magnitudes of Δ S 2 ¯ . The aggregation significantly increased as the temperature of the 5 cm iodine cell increased due to an increase in the iodine pool absorption ability. This led to a larger extinction ratio for elastic scattering. The temperature of the second iodine cell had little effect on the aggregation because this aggregation was directly related to the first iodine cell.
Considering the optimal performance, the Δ S 2 ¯ of 0.0002 corresponds to the iodine pool temperature combination of 60 °C and 78 °C in Figure 16a, while the value of 0.0008 corresponds to that of 60 °C and 78 °C in Figure 16b. Therefore, the uncertainty introduced into Δ S 2 ¯ by the different R-values was much less than the direct intensity measurement accuracy of 1‰. Therefore, the uncertainty introduced by R in this combination can be neglected.

4. Conclusions

This paper proposed an easy scheme for seawater temperature measurement using two iodine cells. A set of high-precision iodine molecular absorption spectrum measurement devices was designed for the system. Detectors with adjustable gain were used to eliminate the system noise effect. Then, the measured iodine molecular absorption spectra were used to design the system parameters and analyze the system performance. For an ocean temperature of [5 °C, 15 °C], a laser wavelength of 532.10495 nm was more appropriate, corresponding to the iodine pool temperature combinations of 50 °C and 78 °C. For the ocean temperature of [15 °C, 32 °C], a laser wavelength of 532.10518 nm was more appropriate, corresponding to the iodine cell temperature combinations of 60 °C and 78 °C. For an ocean temperature of [5 °C, 32 °C], both combinations of wavelengths and temperatures were feasible. The temperature could be predicted with an accuracy of up to 0.2 K when the laser intensity reached a measurement precision of 1‰. When the transmitted laser is a pulsed laser, the signal received by the detectors is continuous. Because the water scatters the laser along the laser transmitting path, the depth information can be determined by the return time. Then the temperature profile measurement is realized. Considering the proposed dual-iodine-cell system has the merits of a simple system structure, low cost, large receiving field, and fast measurement speed, the scheme reported in this paper shows promise as a potential solution for seawater temperature profile measurement.

Author Contributions

Conceptualization, F.Y. and Y.H.; methodology, F.Y.; validation, L.L.; formal analysis, F.Y. and W.C.; investigation, F.Y., W.C. and L.L.; resources, C.F. and Y.H.; data curation, W.C.; writing—original draft, W.C.; writing—review and editing, F.Y. and Y.H.; visualization, W.C.; supervision, C.F.; funding acquisition, F.Y. and Y.H. All authors have read and agreed to the published version of the manuscript.

Funding

The authors acknowledge the financial support of the National Natural Science Foundation (grant number 62375048), Natural Science Foundation of Shanghai (grant number 22ZR1402600), and Shanghai 2021 “Science and Technology Innovation Plan” Social Development Science and Technology Research Project (grant number 21DZ1205402).

Data Availability Statement

Data are contained within the article.

Conflicts of Interest

Author Wenhao Chen was employed by the company Avic Shanghai Aviation Electric Co., Ltd. The remaining authors declare that the research was conducted in the absence of any commercial or financial relationships that could be construed as a potential conflict of interest.

References

  1. Brierley, A.S.; Kingsford, M.J. Impacts of Climate Change on Marine Organisms and Ecosystems. Curr. Biol. 2009, 19, R602–R614. [Google Scholar] [CrossRef] [PubMed]
  2. Harley, C.D.G.; Hughes, A.R.; Hultgren, K.M.; Miner, B.G.; Sorte, C.J.B.; Thornber, C.S.; Rodriguez, L.F.; Tomanek, L.; Williams, S.L. The impacts of climate change in coastal marine systems. Ecol. Lett. 2006, 9, 228–241. [Google Scholar] [CrossRef] [PubMed]
  3. Hiscock, K.; Southward, A.; Tittley, I.; Hawkins, S. Effects of changing temperature on benthic marine life in Britain and Ireland. Aquat. Conserv.-Mar. Freshw. Ecosyst. 2004, 14, 333–362. [Google Scholar] [CrossRef]
  4. Ingleby, B.; Huddleston, M. Quality control of ocean temperature and salinity profiles—Historical and real-time data. J. Mar. Syst. 2007, 65, 158–175. [Google Scholar] [CrossRef]
  5. Cullum, J.; Stevens, D.P.; Joshi, M.M. Importance of ocean salinity for climate and habitability. Proc. Natl. Acad. Sci. USA 2016, 113, 4278–4283. [Google Scholar] [CrossRef] [PubMed]
  6. Wang, L.; Wang, Y.J.; Song, S.; Li, F. Overview of Fibre Optic Sensing Technology in the Field of Physical Ocean Observation. Front. Phys. 2021, 9, 745487. [Google Scholar] [CrossRef]
  7. Wang, Y.; Xu, Y.; Chen, P.; Liang, K. Remote Sensing of Seawater Temperature and Salinity Profiles by the Brillouin Lidar Based on a Fizeau Interferometer and Multichannel Photomultiplier Tube. Sensors 2023, 23, 446. [Google Scholar] [CrossRef] [PubMed]
  8. Abraham, J.P.; Baringer, M.; Bindoff, N.L.; Boyer, T.; Cheng, L.J.; Church, J.A.; Conroy, J.L.; Domingues, C.M.; Fasullo, J.T.; Gilson, J.; et al. A review of global ocean temperature observations: Implications for ocean heat content estimates and climate change. Rev. Geophys. 2013, 51, 450–483. [Google Scholar] [CrossRef]
  9. Merchant, C.J.; Embury, O.; Bulgin, C.E.; Block, T.; Corlett, G.K.; Fiedler, E.; Good, S.A.; Mittaz, J.; Rayner, N.A.; Berry, D.; et al. Satellite-based time-series of sea-surface temperature since 1981 for climate applications. Sci. Data 2019, 6, 223. [Google Scholar] [CrossRef]
  10. Amani, M.; Mohseni, F.; Layegh, N.F.; Nazari, M.E.; Fatolazadeh, F.; Salehi, A.; Ahmadi, S.A.; Ebrahimy, H.; Ghorbanian, A.; Jin, S.; et al. Remote Sensing Systems for Ocean: A Review (Part 2: Active Systems). IEEE J. Sel. Top. Appl. Earth Obs. Remote Sens. 2022, 15, 1421–1453. [Google Scholar] [CrossRef]
  11. Amani, M.; Ghorbanian, A.; Asgarimehr, M.; Yekkehkhany, B.; Moghimi, A.; Jin, S.; Naboureh, A.; Mohseni, F.; Mahdavi, S.; Layegh, N.F. Remote Sensing Systems for Ocean: A Review (Part 1: Passive Systems). IEEE J. Sel. Top. Appl. Earth Obs. Remote Sens. 2022, 15, 210–234. [Google Scholar] [CrossRef]
  12. Moisan, J.R.; Rousseaux, C.S.; Stysley, P.R.; Clarke, G.B.; Poulios, D.P. Ocean Temperature Profiling Lidar: Analysis of Technology and Potential for Rapid Ocean Observations. Remote Sens. 2024, 16, 1236. [Google Scholar] [CrossRef]
  13. Wang, Y.; Zhang, J.; Zheng, Y.; Xu, Y.; Xu, J.; Jiao, J.; Su, Y.; Lu, H.-F.; Liang, K. Brillouin scattering spectrum for liquid detection and applications in oceanography. Opto-Electron. Adv. 2023, 6, 220016. [Google Scholar] [CrossRef]
  14. Schorstein, K.; Popescu, A.; Göbel, M.; Walther, T. Remote Water Temperature Measurements Based on Brillouin Scattering with a Frequency Doubled Pulsed Yb:doped Fiber Amplifier. Sensors 2008, 8, 5820–5831. [Google Scholar] [CrossRef] [PubMed]
  15. Liang, K.; Ma, Y.; Yu, Y.; Huang, J.; Li, H. Research on simultaneous measurement of ocean temperature and salinity using Brillouin shift and linewidth. Opt. Eng. 2012, 51, 066002. [Google Scholar] [CrossRef]
  16. Rudolf, A.; Walther, T. Laboratory demonstration of a Brillouin lidar to remotely measure temperature profiles of the ocean. Opt. Eng. 2014, 53, 051407. [Google Scholar] [CrossRef]
  17. Emery, Y.; Fry, E.S. Laboratory development of a LIDAR for measurement of sound velocity in the ocean using Brillouin scattering. In Proceedings of the Conference on Ocean Optics XIII, Halifax, NS, Canada, 22–25 October 1996; pp. 210–215. [Google Scholar]
  18. Xu, J.F.; Ren, X.B.; Gong, W.P.; Dai, R.; Liu, D.H. Measurement of the bulk viscosity of liquid by Brillouin scattering. Appl. Opt. 2003, 42, 6704–6709. [Google Scholar] [CrossRef] [PubMed]
  19. Shi, J.; Ouyang, M.; Gong, W.; Li, S.; Liu, D. A Brillouin lidar system using F-P etalon and ICCD for remote sensing of the ocean. Appl. Phys. B-Lasers Opt. 2008, 90, 569–571. [Google Scholar] [CrossRef]
  20. Liu, Z.; Sun, J.; Zhang, X.; Zeng, Z.; Xu, Y.; Luo, N.; He, X.; Shi, J. High-Accuracy Spectral Measurement of Stimulated-Brillouin-Scattering Lidar Based on Hessian Matrix and Steger Algorithm. Remote Sens. 2023, 15, 1511. [Google Scholar] [CrossRef]
  21. Dai, R.; Gong, W.; Xu, J.; Ren, X.; Liu, D. The edge technique as used in Brillouin lidar for remote sensing of the ocean. Appl. Phys. B-Lasers Opt. 2004, 79, 245–248. [Google Scholar] [CrossRef]
  22. Edward; Fry, S.; Emery, Y.; Quan, X.; Katz, J.W. Accuracy limitations on Brillouin lidar measurements of temperature and sound speed in the ocean. Appl. Opt. 1997, 36, 6887–6894. [Google Scholar] [CrossRef]
  23. Fry, E.S.; Katz, J.; Liu, D.H.; Walther, T. Temperature dependence of the Brillouin linewidth in water. J. Mod. Opt. 2002, 49, 411–418. [Google Scholar] [CrossRef]
  24. Gong, W.; Shi, J.; Li, G.; Liu, D.; Katz, J.W.; Fry, E.S. Calibration of edge technique considering variation of Brillouin line width at different temperatures of water. Appl. Phys. B-Lasers Opt. 2006, 83, 319–322. [Google Scholar] [CrossRef]
  25. Liang, K.; Zhang, R.; Sun, Q.; Xu, Y.; Wu, H.; Zhang, P.; Zhou, B. Brillouin shift and linewidth measurement based on double-edge detection technology in seawater. Appl. Phys. B 2020, 126, 160. [Google Scholar] [CrossRef]
  26. Smith, J.A.; Hostetler, C. Brillouin Asymmetric Spatial Heterodyne Oceanographic Lidar Receiver for Profiling Temperature, Salinity, and Sound Velocity; NASA: Hampton, VA, USA, 2024.
  27. Gelbwachs, J.A. Atomic Resonance Filters. IEEE J. Quantum Electron. 1988, 24, 1266–1277. [Google Scholar] [CrossRef]
  28. Miles, R.; Lempert, W.; Forkey, J. Instantaneous velocity fields and background suppression by filtered Rayleigh scattering. In Proceedings of the 29th Aerospace Sciences Meeting (AIAA), Reno, NV, USA, 7–10 January 1991. [Google Scholar]
  29. Forkey, J.N.; Lempert, W.R.; Miles, R.B. Corrected and calibrated I2 absorption model at frequency-doubled Nd:YAG laser wavelengths. Appl. Opt. 1997, 36, 6729–6738. [Google Scholar] [CrossRef]
  30. Boguszko, M.; Elliott, G.S. Property measurement utilizing atomic/molecular filter-based diagnostics. Prog. Aerosp. Sci. 2005, 41, 93–142. [Google Scholar] [CrossRef]
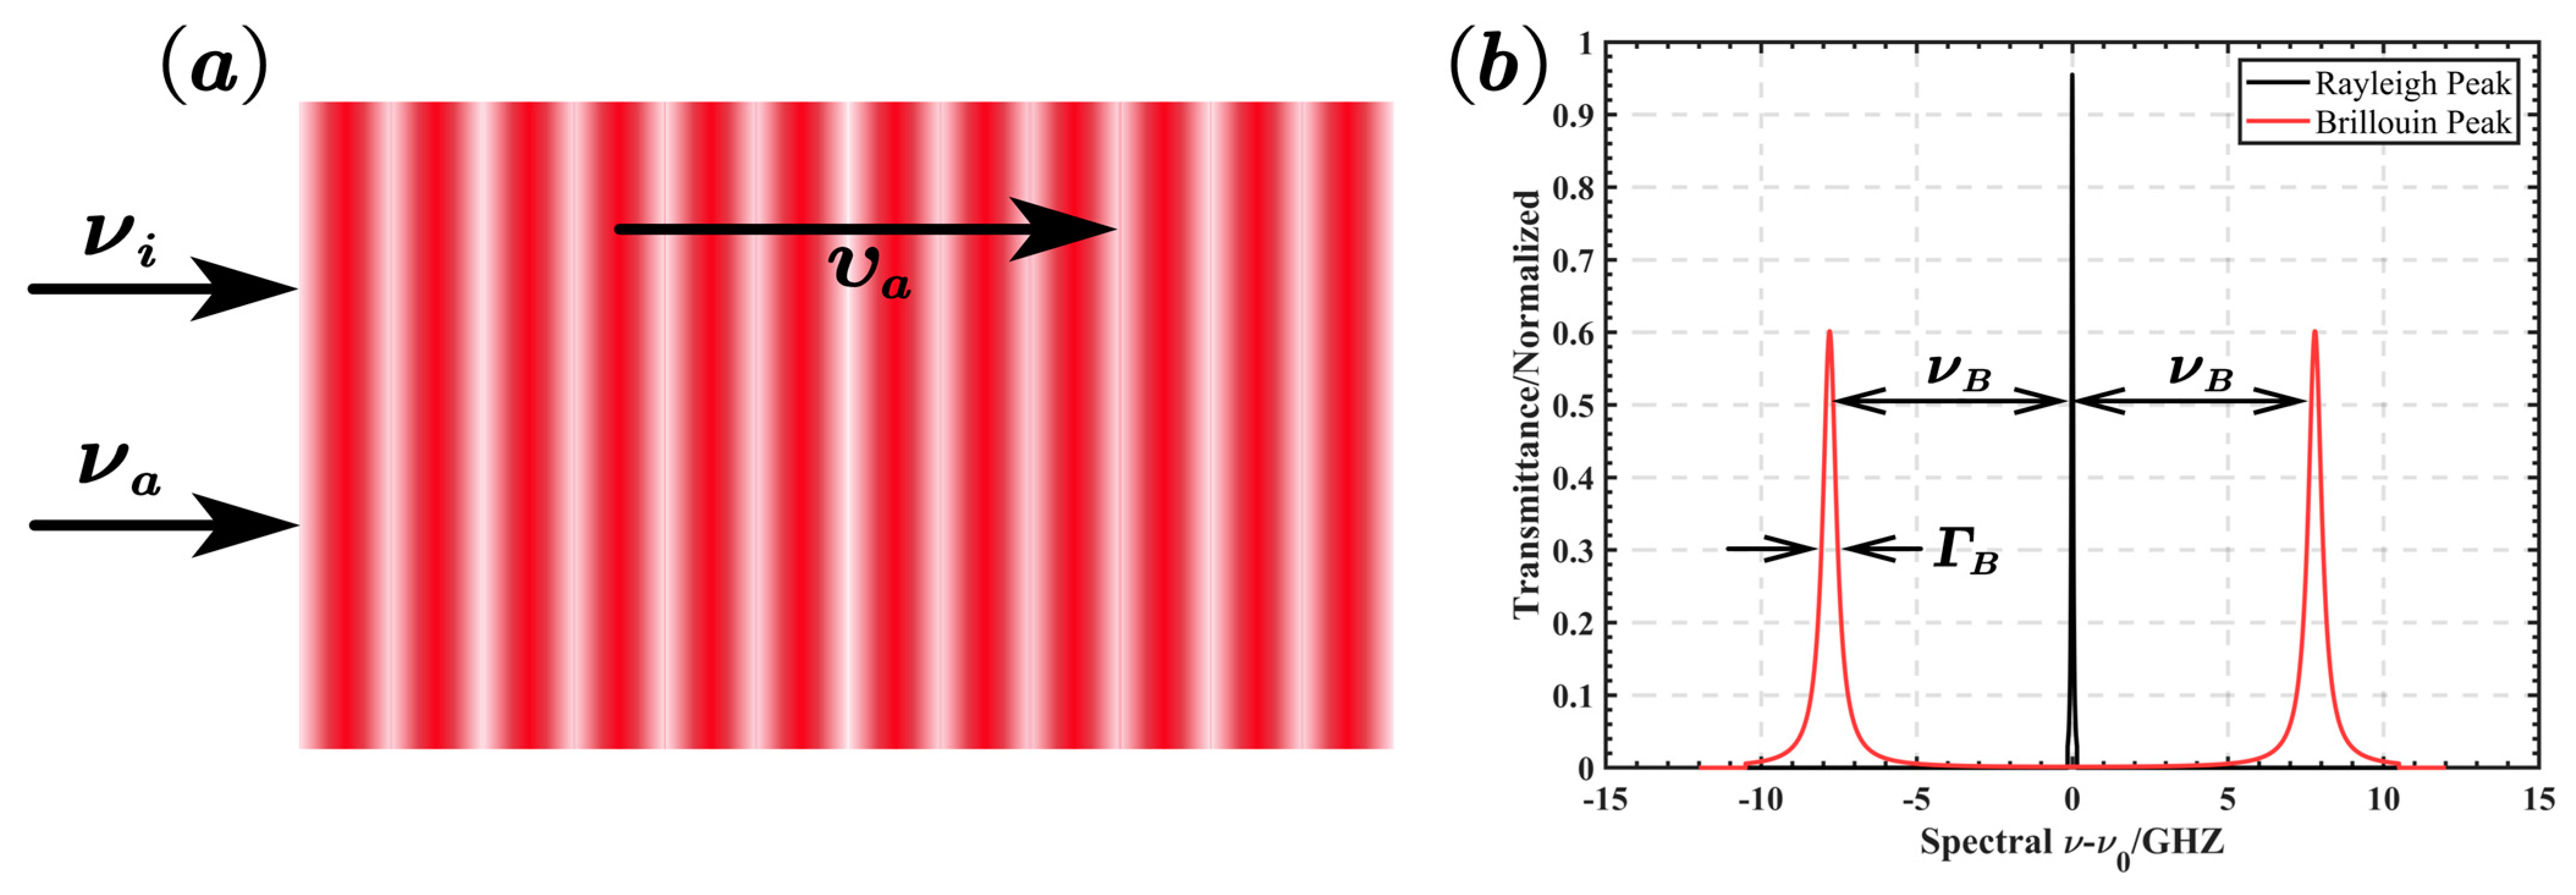
Figure 1. (a) Schematic of Brillouin scattering principle; (b) schematic of Brillouin scattering spectrum in water.
Remotesensing 16 02748 g001
Figure 2. The normalized transmittance of an iodine cell with variable (a) temperature, (b) cell length, and (c) cell pressure.
Remotesensing 16 02748 g002
Figure 3. (a) Illustration of the first iodine cell (lower temperature and smaller size); (b) illustration of the second iodine cell (higher temperature and larger size).
Remotesensing 16 02748 g003
Figure 4. Schematic diagram of the optical circuit for dual-iodine-cell thermometry.
Remotesensing 16 02748 g004
Figure 5. Iodine absorption lines and received scattering spectra: (a) cell 1; (b) cell 2.
Remotesensing 16 02748 g005
Figure 6. The relation between S2 and temperature under (a) variable ratio of the elastic scattering signal intensity to the Brillouin signal intensity R, and (b) variable laser center frequency drift variation in S2 with different influences: (a) different R values; (b) differential frequency drift values.
Remotesensing 16 02748 g006
Figure 7. Schematic of iodine cell absorption spectrum measurement system. PPLN: periodically poled lithium niobate, BS: beam splitter.
Remotesensing 16 02748 g007
Figure 8. (a) Mechanical structure of iodine pool; (b) pictures of the real iodine pool and its temperature control circuit (top view); (c) picture of iodine pool (side view).
Remotesensing 16 02748 g008
Figure 9. The relationship between the iodine cell extinction ratio and detector gain under various temperatures with a laser wavelength of 532.10495 nm: (a) 5 cm iodine pool; (b) 10 cm iodine pool. C and F represent the temperatures of the iodine bubble and the iodine tip, respectively (unit: degrees Celsius).
Remotesensing 16 02748 g009
Figure 10. (a) Maximum transmittance of iodine cells at different temperatures. (b) Iodine vapor condensation on the window.
Remotesensing 16 02748 g010
Figure 11. (a) Measured 5 cm iodine cell spectra at different temperatures; (b) measured 10 cm iodine cell spectra at different temperatures; (c) measured and theoretical absorption spectra of 5 cm iodine cells; (d) measured and theoretical absorption spectra of 10 cm iodine cells.
Remotesensing 16 02748 g011
Figure 12. The change of S2 for different combinations of iodine pool temperatures when the seawater temperature was in the ranges of (a) [5 °C, 32 °C], (b) [5 °C, 15 °C], and (c) [15 °C, 32 °C] at a wavelength of 532.10495 nm.
Remotesensing 16 02748 g012
Figure 13. Change in S2 for different combinations of iodine cell temperatures for seawater temperatures in the ranges (a) [5 °C, 32 °C], (b) [5 °C, 15 °C], and (c) [15 °C, 32 °C] for a certain drift in the center frequency (d) and the optimal center frequency shift corresponding to (c).
Remotesensing 16 02748 g013
Figure 14. (a) S2–temperature curves for different R-values at a laser emission wavelength of 532.10495 nm; (b) temperature measurement accuracy–temperature curves.
Remotesensing 16 02748 g014
Figure 15. (a) S2–temperature curves for different R-values at a laser emission wavelength of 532.10518 nm; (b) temperature measurement accuracy–temperature curves.
Remotesensing 16 02748 g015
Figure 16. Δ S 2 ¯ changes induced by R for different combinations of iodine cell temperatures: (a) 532.10495 nm; (b) 532.10518 nm.
Remotesensing 16 02748 g016
Table 1. Parameters in the Brillouin frequency shift linewidth and temperature fitting equation.
m1 = 120.2m2 = −43.253m3 = 21.215m4 = 3.4079m5 = −60.661
m6 = 13.645m7 = −0.0053m8 = 3.6607m9 = 6.1565m10 = −1.579
Table 2. Initial iodine pool parameter setting in the simulation system.
NumberTemperature/KPressure/TorrLength/CM
Low-temperature iodine cell353110
High-temperature iodine cell3531510
Table 3. Iodine cell parameter setting.
Temperature/°CGain/dB
Iodine cell of 5 cm≥48≥30
Iodine cell of 10 cm≥40≥30
Table 4. Optimal combinations of iodine cell temperatures for different temperature ranges with an emitted laser wavelength of 532.10495 nm.
Temperature Range/°C5 cm Iodine Cell Temperature/°C10 cm Iodine Cell Temperature/°C
5~326078
5~155078
15~326078
Table 5. Optimal temperature combinations of the iodine cell and corresponding wavelengths for different temperature ranges.
Temperature Range/°C5 cm Temperature/°C10 cm Temperature/°CWavelength/nm
5~3250/6078532.10518/532.10495
5~155078532.10495
15~326078532.10518
Disclaimer/Publisher’s Note: The statements, opinions and data contained in all publications are solely those of the individual author(s) and contributor(s) and not of MDPI and/or the editor(s). MDPI and/or the editor(s) disclaim responsibility for any injury to people or property resulting from any ideas, methods, instructions or products referred to in the content.