Article

Characterizing the Macro and Micro Properties of Precipitation during the Landfall of Typhoon Lekima by Using GPM Observations

1
CMA Meteorological Observation Centre, Beijing 100081, China
2
Xinjiang Weather Modification Office, Urumqi 830002, China
3
Collaborative Innovation Center on Forecast and Evaluation of Meteorological Disasters (CIC-FEMD), Key Laboratory for Aerosol Cloud-Precipitation of China Meteorological Administration, Nanjing University of Information Science & Technology, Nanjing 210044, China
4
Key Laboratory of Transportation Meteorology of China Meteorological Administration, Nanjing Joint Institute for Atmospheric Sciences, Nanjing 210044, China
*
Author to whom correspondence should be addressed.
Remote Sens. 2024, 16(15), 2765; https://doi.org/10.3390/rs16152765 (registering DOI)
Submission received: 20 June 2024 / Revised: 18 July 2024 / Accepted: 21 July 2024 / Published: 29 July 2024
(This article belongs to the Section Atmospheric Remote Sensing)

Abstract

:
Understanding the macro and micro characteristics of precipitation in landfall typhoons is crucial to predicting the path and intensity of tropical cyclones by using numerical models. In this study, we use observations from the Global Precipitation Measurement Mission to analyze the microphysics of convection and stratiform precipitation during the landfall of Typhoon Lekima. The statistical results show that the correlation coefficient of the reflectivity factors of the spaceborne and ground-based radars is 0.77 and that the water content detected by the 18.7 GHz low-frequency vertical channel is positively correlated with the intense-precipitation rate. The storm top height is generally consistent with the location of heavy precipitation. The average near-surface precipitation rate and liquid water content of convective precipitation are higher than those of stratiform precipitation. The average mass-weighted raindrop diameter and particle number concentration of convective (stratiform) precipitation at a distance of 2 km above ground level are 1.52 mm (1.29 mm) and 39.52 (36.44, in decibel scale), respectively. Below the melting layer, there is a significant increase in average particle diameter, indicating that the collision aggregation growth process of raindrops is dominant. These results are potentially helpful in validating and improving microphysics parameterization in numerical models.

1. Introduction

As one of the primary disasters affecting the southeastern coastal regions of China, typhoons and torrential rain typically inflict significant economic losses on the areas impacted. Typhoon Lekima (1909) landed in Zhejiang in the early morning of 10 August 2019. It had the characteristics of a long stay time on land, strong wind and rain, significant extreme rainstorm, and serious disaster losses. Typhoon Lekima is the third strongest typhoon to affect Jiangsu and Zhejiang regions since the founding of the People’s Republic of China, causing tremendous damage to local power supply, transportation infrastructure, and buildings.
The macro and micro characteristics of precipitation during landfall represent both a focus and a challenge in typhoon research [1,2,3,4,5]. The scarcity of meteorological observation stations at sea results in limited oceanic observation data, hindering the understanding of the horizontal and vertical structures of the typhoon spiral rainbands, as well as the quantitative analysis of the macro and micro properties of precipitation. At present, studies on the microphysical processes of tropical cyclones landing in coastal areas of China are limited, posing a major challenge to local forecasters. Fortunately, with the continuous advancement of satellite detection technology, satellite remote sensing data characterized by high spatiotemporal resolution and extensive coverage have been widely utilized in the study of the cloud characteristics, precipitation distribution, and intensity of typhoons [6,7,8,9].
The Global Precipitation Measurement (GPM) Mission, launched in February 2014, aims to provide precipitation observations with high spatial resolution. The GPM satellite is equipped with the world’s first spaceborne dual-frequency precipitation radar (DPR) and the GPM multi-channel microwave imager (GMI). Compared with the precipitation radar (PR) of the Tropical Rainfall Measuring Mission (TRMM), GPM/DPR enhances radar sensitivity and provides more detailed macro and micro precipitation information, which offers valuable foundational data for further analysis of precipitation characteristics [10,11,12]. Huang et al. (2019) analyzed the microphysical properties of tropical cyclone precipitation in the western North Pacific by employing various precipitation efficiency indices [13]. Chen et al. (2018) studied the precipitation characteristics, microphysical processes, and their relationship with ice particle scattering in different regions of the spiral rainband for different tropical cyclones that occurred in the western North Pacific from 2014 to 2019 [14]. Zhang (2022) conducted a statistical study on the microphysical processes of precipitation during the landfall of typhoon in northeastern China in 2020, discovering that clouds with high precipitation efficiency exhibit strong collision–convergence characteristics [15]. Yang et al. (2018) utilized the observations of the GMI to reveal that the ice scattering intensity at 85 GHz in different regions of the typhoon displayed diverse characteristics, with the ice particle scattering intensity of stratiform precipitation near the eyewall being more pronounced than that in the convective precipitation within both the inner and outer rainbands [16]. Qi et al. (2021) assessed the capability of the near-real-time precipitation estimation products derived from the GPM Mission under different precipitation intensities of Typhoon Lekima and found that the GPM/IMERG (Integrated Multi-satellite Retrievals for GPM) products can capture the spatial distribution and changing trends of severe storm precipitation [17]. Previous studies have helped to improve our understanding of the macro and micro characteristics of Typhoon Lekima precipitation. However, due to the fact that landing typhoons are rarely observed by ground-based weather radar and spaceborne precipitation radar at the same time and due to the horizontal and vertical structure differences of stratiform and convective precipitation of typhoons landing on the southeast coast of China, there are limited studies focusing on the characteristics of macro and micro parameters of landing typhoon precipitation on different underlying surfaces of ocean and land.
Ground-based weather radar and GPM satellite observation data can be mutually verified and supplemented, providing a more efficient way to study landfalling tropical cyclone precipitation, further enhancing storm disaster prevention and mitigation capabilities. Simultaneous measurement of landfalling typhoons by ground-based weather and GPM satellite are infrequent events. China New Generation Doppler Weather Radar (CINRAD) is employed to provide precise information on the path, intensity, and structure of typhoons during landfalls [18], facilitating research on the relationship between precipitation microphysics and cyclone dynamics. Currently, at least 128 conventional S-band doppler weather radars have been deployed in eastern China for the monitoring of extreme rainfall events and the provision of early warnings for typhoon landfall [19]. The DPR instrument consists of a Ka-band precipitation radar (KaPR) operating at 35.5 GHz and a Ku-band precipitation radar (KuPR) operating at 13.6 GHz. For example, Warren et al. (2018) compared stratiform precipitation above and below the melting layer by using TRMM/PR and GPM/KuPR with data supplied by three S-band ground-based weather radar devices in Australia [20]. Based on GPM/KuPR data, Chu et al. (2018) performed a homogeneity test on the quantitative precipitation estimates obtained from S-band radars in Hefei, Nanjing, and Changzhou [21].
In this paper, we analyze the observations from the GPM/DPR and the GMI, aiming to understand the fine structure of the spiral rainbands and the precipitation microphysics during the landfall of Typhoon Lekima. These findings provide a scientific basis for further understanding the mechanisms of typhoon formation and development and are potentially helpful in improving the prediction and early warning capabilities for the path and intensity of landfalling typhoons. Additionally, by using the radar reflectivity (Ze) product of the GPM/DPR as the standard, this study assesses the uniformity of the S-band weather radar (CINRAD) in Wenzhou, China, during the landfall of Typhoon Lekima. It bears significant implications for improving the stability of weather radar observation data and the availability of monitoring and early warning in severe weather processes.
The rest of the paper is organized as follows: Section 2 describes the instrumentation and data. Section 3 assesses the consistency of the spaceborne radar data and ground-based radar data. Section 4 analyzes the macro and micro properties of precipitation, and the discussion and the conclusions are presented in Section 5.

2. Data and Methodology

The DPR onboard the GPM satellite has a vertical resolution of 250 m and a footprint resolution near 5 km, but it has different scan modes. The scan pattern of KuPR, known as normal scan (NS), has 49 footprints in a scan. In the central 25 normal scan (NS) beams of the KuPR (the inner swath), the KaPR provides the coaligned and simultaneous scans, known as the matched scan (KaMS) mode. When the KuPR scans the outer part of the NS (24 beams), the KaPR operates in a high-sensitivity (KaHS) mode. In this study, the DPR_NS (V6) precipitation data product was employed, along with the 2A-DPR orbital precipitation data provided by NASA including scanning time, geographical location, precipitation type, precipitation rate, the three-dimensional structure of the radar reflectivity factor, and the particle spectrum distributions [22]. The GPM multi-channel microwave imager (GMI) features 13 channels. The brightness temperatures obtained from the vertical polarization channels at lower frequencies of 18.7 GHz and 89 GHz and higher frequencies of 166 GHz and 183.31 ± 3 GHz were utilized. The horizontal resolutions are 11.2 km × 18.3 km and 4.4 km × 7.3 km, respectively [23]. Due to the wide swath of the GMI, which reaches up to 885 km, the detected cloud range is broader than the observation range of the DPR (245 km). This advantage allows for a more in-depth analysis of the macro properties of clouds and precipitation in typhoons.
To ensure the data quality of GPM measurements, we compare them with the ground-based radar data. The ground-based radar data used in this paper are measured by the S-band weather radar at Wenzhou station (27.90°N, 120.74°E; elevation of 734 m). It captured the Typhoon Lekima during the GPM passage on 9 August 2019, at 14:53:43 (UTC). In this paper, the data in the volume scanning period of the ground-based radar are converted from the polar coordinate format to the Cartesian rectangular coordinate format, and a 1.0 km × 1.0 km radar data grid field centered on the latitude and longitude position of the weather radar is constructed. Each volumetric scan of the radar consists of 9 layers, a temporal resolution of 6 min, and a maximum detection distance of 230 km.
In this paper, the precipitation efficiency index (PEI), defined as the ratio of near-surface precipitation to liquid water path, is introduced to represent the precipitation efficiency of the cloud systems [24,25], as shown in the following equation:
P E I = R R L W P
where RR is the near-surface rainfall rate and LWP is the liquid water path. For a given LWP, clouds with more near-surface rainfall have greater precipitation efficiency (larger PEI). This paper mainly focuses on the microphysical characteristics of precipitation in the process of warm rain at low altitudes.

3. Evaluation of Consistency between GPM and Ground-Based Radar Measurements

3.1. Spatiotemporal Matching Methods for Data

Typhoon Lekima, which was formed over the northwest Pacific Ocean on 4 August 2019, predominantly moved towards the northwest. The GPM satellite scan took place from 14:50 to 14:52 (UTC) on 9 August 2019, during which Typhoon Lekima was landing in the vicinity of Taizhou City, Zhejiang Province. During the GPM passage, Typhoon Lekima attained the status of a super typhoon, with its center located near 27.8°N, 121.9°E. The maximum wind speed proximal to the center was 52 m/s, and the minimum central pressure was 935 hPa (Figure 1).
The observational method of the GPM/DPR is not constrained by the surface conditions, enabling its coverage to encompass areas challenging for other detection methods, such as oceans and mountains. The echo intensity data from the GPM/DPR are subjected to strict calibration, effectively exploiting the observational vantage of spaceborne radar, thus facilitating consistency analysis between spaceborne radar data and ground-based radar data. Consequently, utilizing data from the GPM/DPR contributes to the exploration of improving the quality of ground-based radar data. It aids in enhancing the stability of weather radar observation data and their availability in the monitoring, early warning, and forecasting of severe weather processes, while ground-based radar can provide a more complete picture of the entire system. A comparison of the observations from the Wenzhou ground-based Sa-band radar and the GPM/DPR (Figure 2) reveals a high degree of similarity in radar echo distributions and shapes of the typhoon. The distribution range of the intense rainbands, the region of the typhoon eyewall, and the gaps between the eyewall and the spiral rainbands can be well detected.
In this paper, the differences in spatial and temporal resolution and effective irradiation volume between the GPM/DPR and the ground-based weather radar CINRAD are considered. According to the principle of proximity, the adjacent CINRAD volume scan data within ±5 min of the DPR transit time were searched for matching. The geometric matching method is used to match the area where the beams of spaceborne radar and ground-based radar coincide with each other in the unit of effective irradiation volume. The spatial window of the DPR and CINRAD data matching is the overlapping area of DPR and CINRAD beams, the horizontal spatial resolution is about 5 km, and the vertical resolution broadens with the distance from the CINRAD. The frequency correction method is used to establish a Ku-band and S-band radar reflectivity factor lookup table for conversion [26]. The average value is equal to the sum of the echo values divided by the total number of matching grids. The reflectivity factor value dBZ at each grid is converted into Z to obtain the average value, and the average value is then converted into dBZ [27,28,29,30,31].
To facilitate the quantitative comparison and analysis of spaceborne radar data and ground-based radar data, it is necessary to perform the spatiotemporal matching and band correction of both types of radar data [32]. The two main methods for matching ground-based radar data and spaceborne radar data are grid matching and geometric matching. Grid matching refers to the process of normalizing two types of data into the same three-dimensional Cartesian coordinate system, and geometric matching introduces the concept of equivalent irradiation volume [33,34,35]. In this paper, a combination of grid matching and geometric matching is adopted to obtain matching samples, with grid matching being employed in the horizontal direction and geometric matching being utilized in the vertical direction. The evaluation of the spaceborne radar data is conducted by separately calculating the average reflectivity from both the spaceborne radar and the ground-based radar within the matching samples. Compared with grid matching, geometric matching in the vertical direction does not need to interpolate the ground radar beam gap, and the sampling results are closer to the original detection data.

3.2. Comparison of Reflectivity between GPM and Ground-Based Radar

To further eliminate the uncertain factors, all CINRAD and DPR Ze products were processed as follows: (1) we controlled of the quality of the spaceborne radar data products, including superior quality of precipitation-type products and bright-band products; (2) we ensured that the threshold for the matched echo coverage rate between the spaceborne and ground-based radar equaled 100%; (3) we kept the radial distance of ground-based radar within 25–200 km; (4) we ensured that matching samples corresponded to stratus precipitation; (5) we selected matching samples located below the bright band.
Subsequently to the above processing, consistency analysis and evaluation were conducted [36], as depicted in Figure 3. During the GPM pass, Typhoon Lekima was categorized as a super typhoon. The radar reflectivity factors of the CINRAD and DPR simultaneously ranged mainly between 20 and 50 dBZ, with over 50% of the radar reflectivity factors being concentrated within 30–40 dBZ. When the echo intensity is within the range of 10–20 dBZ or the range of 30–40 dBZ, the data observed by the GPM/DPR surpass those of the ground-based radar, while when the echo intensity is distributed within 20–30 dBZ or 40–50 dBZ, the data obtained from the ground-based radar slightly exceed those of the GPM/DPR. The correlation coefficient (R) of the reflectivity factors of the two types of radar was 0.77, with a mean bias of −1.66 dBZ and a standard deviation of 3.61 dB, from a total sample size of 22,378, as shown in Figure 4. The statistical indicators employed were the correlation coefficient (Equation (2)), the mean deviation (Equation (3)), and the standard deviation (Equation (4)):
R = i = 1 N [ d B Z D P R ( i ) d B Z D P R ( i ) ¯ ] [ d B Z C I N R A D ( i ) d B Z C I N R A D ( i ) ¯ ] { i = 1 N [ d B Z D P R ( i ) d B Z D P R ( i ) ¯ ] 2 i = 1 N [ d B Z C I N R A D ( i ) d B Z C I N R A D ( i ) ¯ ] 2 } 1 / 2
B i a s = 1 N N ( d B Z C I N R A D d B Z D P R )
S t d _ b i a s = ( ( x i x ¯ ) N 1 ) 1 / 2 , x = d B Z C I N R A D d B Z D P R
where N is the total number of matched samples and i is the serial number of a particular matched sample. dBZDPR is the matched DPR Ze, with an average value of d B Z D P R ¯ . dBZCINRAD is the matched CINRAD Ze with a mean value of d B Z C I N R A D ¯ . xi is the difference between the DPR and CINRAD Ze, with x ¯ being the average value.

4. Macro and Micro Properties of Precipitation

4.1. Macro Properties of Clouds and Precipitation Types

According to the brightness temperature distribution of the GMI, different vertical polarization channels are selected to analyze the characteristics of microwave radiation brightness temperature of the Typhoon Lekima precipitation cloud system (Figure 4). The scan width of the GMI is broader than that of the DPR, so a more comprehensive precipitation system can be seen. The observation of the low-frequency microwave radiance indicates that the typhoon spiral cloud bands exhibit higher brightness temperature, generally above 280 K. This phenomenon can be attributed to the fact that the typhoon was located on the surface of cold ocean, where a higher abundance of liquid water is related to increased brightness temperature. The quantity of liquid water correlates with the intensity of precipitation; areas with more hydrometeors are often associated with heavier precipitation.
A mid-frequency microwave radiation brightness temperature reflects the information of ice particles within the clouds. A lower brightness temperature indicates more ice particles [37]. For the spiral cloud bands of Typhoon Lekima, the brightness temperature obtained from mid-frequency microwave radiation below 220 K indicates the presence of substantial amounts of ice particles in these areas [38].
A high-frequency radiative brightness temperature characterizes the distribution of small ice particles, and in the spiral cloud band of Typhoon Lekima, this was below 180 K. Moreover, the range of regions with temperatures lower than 250 K significantly exceeds that of the mid-frequency region, indicating that high-frequency observations can detect more information about ice particles than the mid-frequency ones.
To further understand the content of liquid water and ice particles in precipitating clouds, the results from GMI microwave detection were utilized to infer the distribution of LWP and IWP. It is observed that the spiral cloud bands of Typhoon Lekima contained a higher LWP, with the maximum value exceeding 1.5 kg m−2. As depicted in Figure 4, the regions of high brightness temperature at low frequency within the spiral cloud band largely coincide with the areas of high LWP. The IWP reaches up to 18 kg m−2, and areas of high IWP derived from the GMI are consistent with the regions of low brightness temperature.
During the passage of the GPM/DPR, significant portions of the typhoon, including the center, the eyewall region, and the inner and outer rainbands, were detected. Utilizing the DPR precipitation product [39,40], we analyzed the distribution of convective and stratiform precipitation of Typhoon Lekima, as shown in Figure 5. Generally, within a 1° radius of the typhoon center, the areas covered by stratiform precipitation surpass those covered by convective precipitation. Convective and stratiform precipitation are alternately distributed from the center to the edge, with both types of precipitation forming a roughly circular distribution around the center. In the inner rainbands of the typhoon, stratiform precipitation and convective precipitation are distributed on the north or south sides of the center, with convective precipitation adjacent to the inner spiral rainbands and stratiform precipitation predominating further outward. This is mainly related to the downward airflow in the eyewall of the typhoon, the upward air motion in the cloud wall, and its external precipitation belt, along with weaker downdrafts outside the typhoon. The results are consistent with previous studies, indicating that typhoons predominantly feature stratiform precipitation, with convective precipitation mainly being embedded in the eyewall and annular rainband areas.

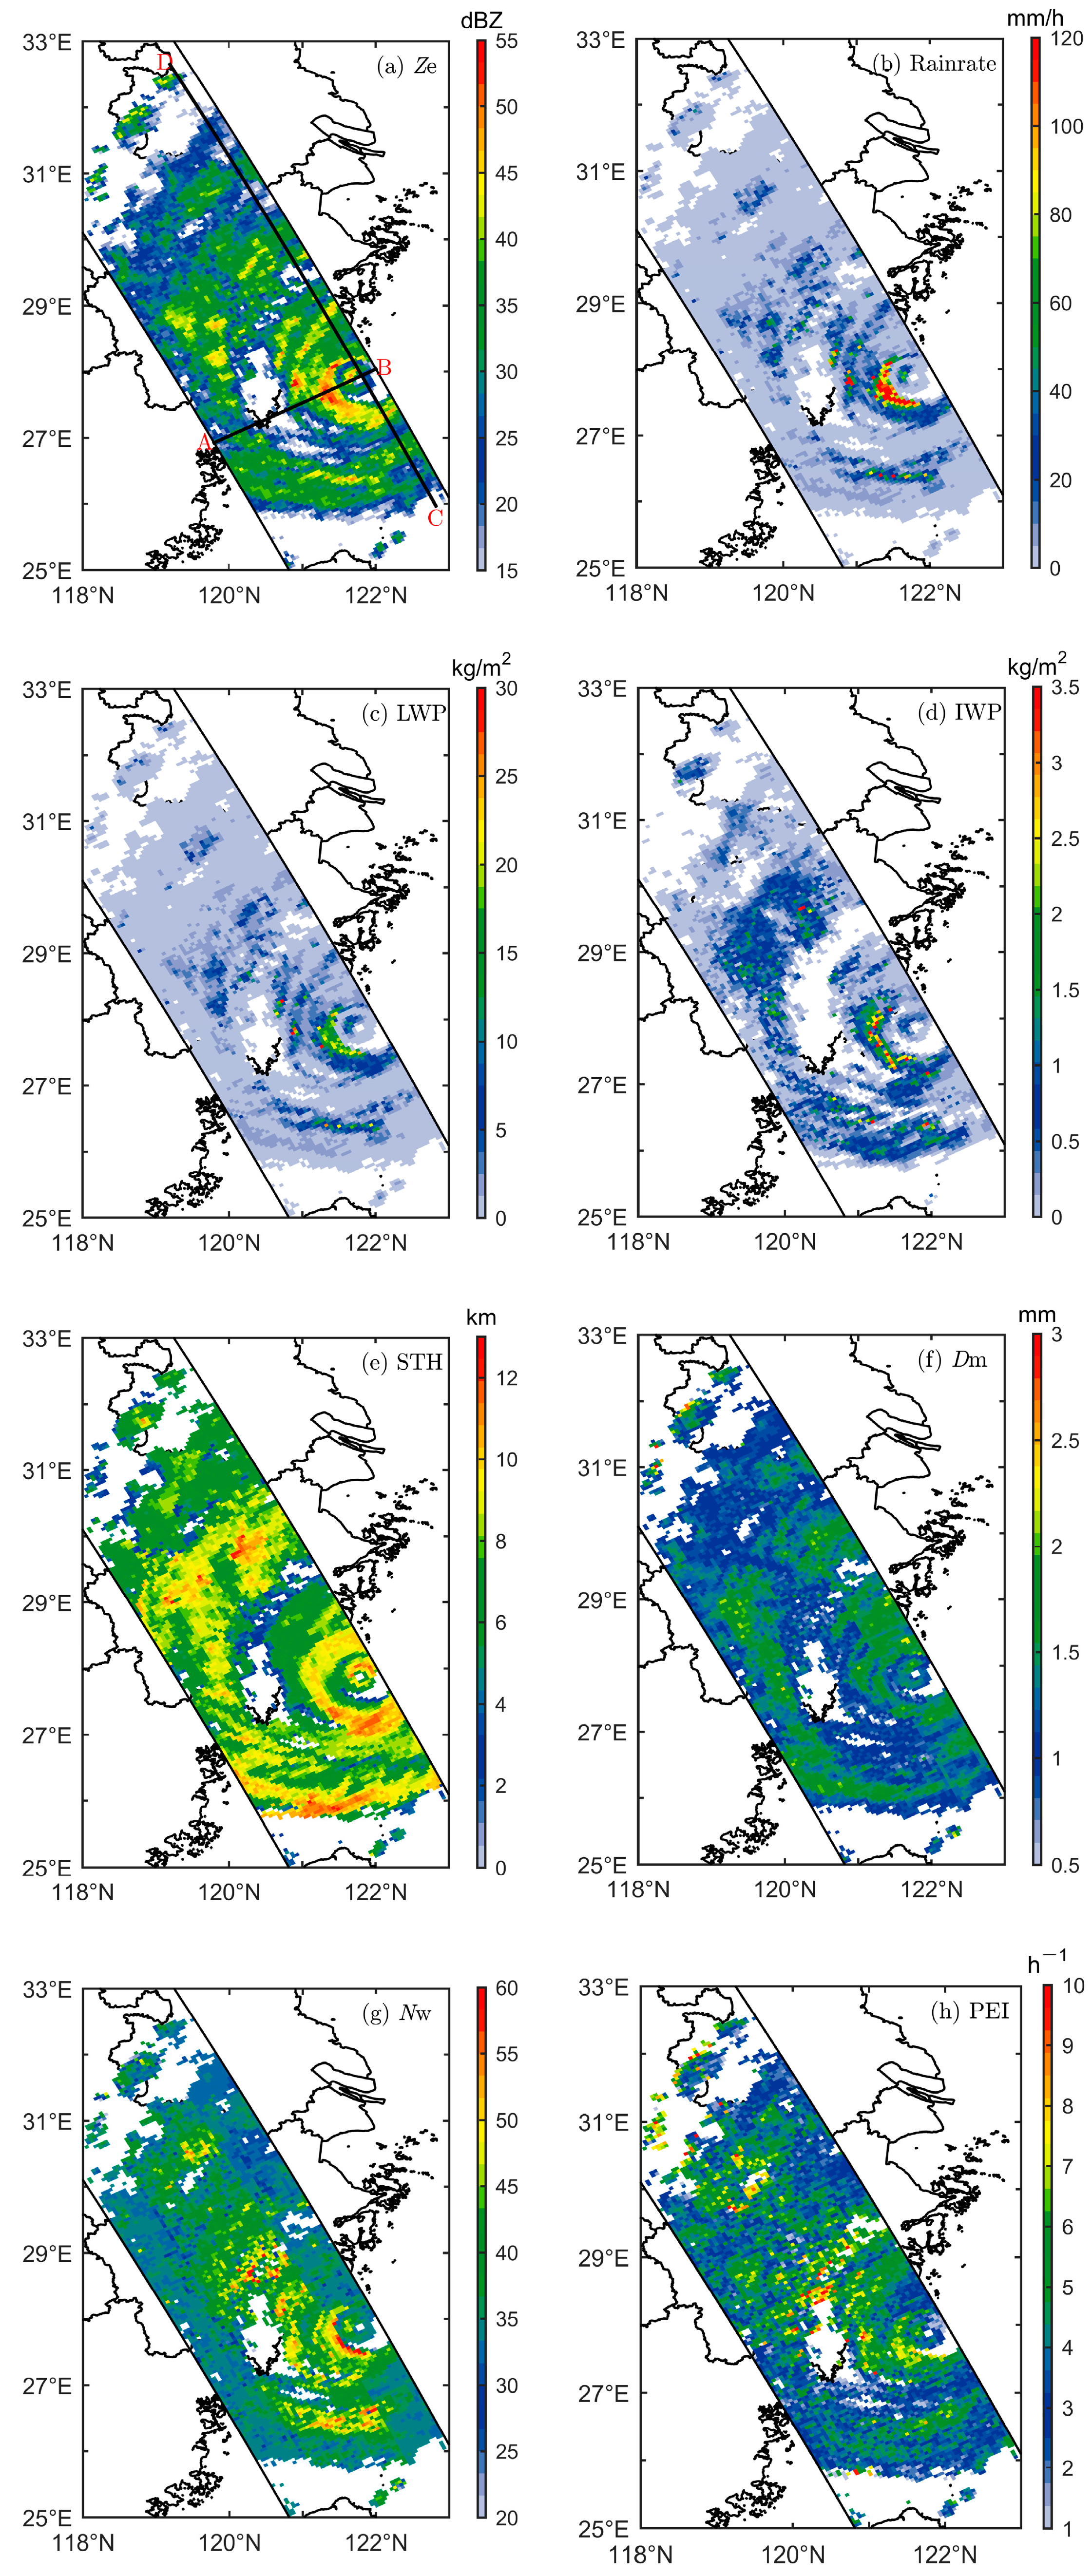
4.2. Horizontal Structure of Precipitation

Statistical analysis of various macro and micro properties of precipitation contributes to a deeper understanding of the development and evolution processes of typhoons. In Figure 6, the horizontal distributions of the Ze, RR, LWP, IWP, storm top height (STH), mass-weighted average diameter (Dm), particle number concentration (Nw; in m−3 mm−1), and PEI from GPM/DPR measurements are presented. Since Nw data typically have very large dynamic ranges, they are shown in the decibel scale (unit: from m−3 mm−1 to dBNw) in this study [13]. Overall, the distribution of RR in Typhoon Lekima is not uniform, with RR demonstrating a small–large–small intensity distribution from the center of the typhoon outwards. Additionally, the rainbands around the typhoon center are spirally distributed, a feature similarly observed in the distribution of STH. This is primarily due to the vertical air motion within the typhoon [41]. There were three regions with intense precipitation exceeding 100 mm h−1 on the western and northwestern sides of the typhoon center, which were distributed across three annular belts. The maximum precipitation zone was located near the coastline, with a maximum precipitation rate of 199.6 mm h−1. The average precipitation rates for convective and stratiform clouds were 14.37 mm h−1 and 5.7 mm h−1, respectively.
Precipitation with RR greater than 20 mm h−1 corresponds to Ze, LWP, and IWP greater than 45 dBZ, 10 kg m−2, and 1.5 kg m−2, respectively. Conversely, precipitation clouds with RR less than 20 mm h−1 are associated with Ze, LWP, and IWP less than 30 dBZ, 5 kg m−2, and 0.5 kg m−2, respectively. As shown in Figure 6c,d, both LWP and IWP reach the maximum value in the eyewall area, i.e., 7 kg m−2 at about 30–70 km away from the typhoon center and approximately 1.5 kg m−2 at 200–280 km from the typhoon center. These differences demonstrate a strong correspondence between the distribution of heavy precipitation and regions of high values for liquid/ice water. According to the LWP, precipitation clouds and non-precipitation clouds can be distinguished [42,43], and the mean LWP and IWP of convective and stratiform precipitation are 2.67 kg m−2 and 1.28 kg m−2 and 0.28 kg m−2 and 0.40 kg m−2, respectively. The STH of the spiral rainband is mainly concentrated between 6 and 12 km, and the high-value regions of the STH align closely with the locations with strong RR (Figure 6e). The statistical analysis reveals that the STH corresponding to stratiform precipitation is mainly between 4.5 and 11 km, and the STH corresponding to convective precipitation is in the range of 2 to 12 km.
The Dm 2 km above the ground is mainly between 1.5 and 2.0 mm (Figure 6f), and the Nw is concentrated between 30 and 50 (Figure 6g). In the convective cloud regions, Dm and Nw are 1.52 mm and 39.52 mm, which are 17.83% and 8.45% higher compared with the stratiform cloud regions, where the values are 1.29 mm and 36.44 mm, respectively. This indicates a higher concentration of large raindrops in the convective precipitation areas. The mechanism involves a strong updraft carrying small water droplets to higher altitudes, where they grow by condensation. Subsequently, these particles undergo falling, collision, and coalescence processes, contributing to increased Dm and Nw in these areas. The presence of larger raindrops is likely attributed to the melting of ice particles with relatively larger Dm, possibly graupel particles [44]. In the inner swath (25 beams) of the NS, the reflectivity values at both Ku- and Ka-bands are utilized in DSD (raindrop size distribution) retrieval (dual-frequency pixels). In contrast, only single-frequency algorithms are used in the outer swath (24 beams) of the NS, where the DSD estimates heavily depend on the relationships of R and Dm assumed in the retrieval. Due to potential differences in scanning strategies and retrieval algorithms [45], there are differences in the officially released GPM/2ADPR-NS (version 6) DSD products in the inner and outer swaths. So, in Figure 6g, there is a clear dividing line along the track. In this article, the DSD inversion data of the inner swath of the DPR are used in the statistical analysis of the microphysical parameters of Typhoon Lekima precipitation.
The areas with higher PEI values (>5 h−1), as shown in Figure 6h, are mainly located in the eyewall and inner rainband areas, where the amount of surface rainfall is larger. In contrast, the stratiform clouds situated in the peripheral areas (the latitudinal band of about 28–29°N) exhibit larger PEI values, yet the near-surface rainfall rates are lower. Clouds of the identical precipitation type (convective or stratiform) have different PEI values, indicating that both warm cloud processes (collision and coalescence) and cold cloud processes (condensation, freezing, and accretion) play a pivotal role in the formation of intense-precipitation events in the typhoon [46,47].
The statistical characteristics and probability density distributions of convective and stratiform precipitation in terms of RR, PEI, LWP, IWP, Dm (2 km), and Nw (2 km) in typhoons are analyzed, as shown in Table 1 and Figure 7a–f. There are a total of 1146 (4966) convective (stratiform) precipitation grid points in the observed typhoon, of which less than 20% are convective precipitation. The mean RR (14.37 mm h−1) and LWP (2.67 kg m−2) for convective precipitation are 2.5 times and 2.1 times larger, respectively, compared with the average RR (5.7 mm h−1) and LWP (1.28 kg m−2) of stratiform precipitation. Therefore, convective clouds exhibit greater precipitation intensity with more abundant liquid water [48]. The IWP of convective clouds (0.28 kg m−2) is about 30% lower than that of stratiform clouds (0.40 kg m−2). The average PEI of convective clouds is 5.2 h−1, which exceeds that of stratiform precipitation (3.9 h−1) by 33.33%. At the height of 2 km, the average Dm values of convective and stratiform precipitation are 1.52 mm and 1.29 mm, respectively. Wang et al. (2016) found that the Dm for convective precipitation in the rainband of a landfalling typhoon was about 1.41 mm, which is consistent with the results of this study. The PEI, Dm, and Nw of convective and stratiform precipitation all follow a quasi-Gaussian distribution (Figure 7d–f). In comparison with stratiform precipitation, convective precipitation displays a wider distribution range and higher mean values. The values of the PEI for convective and stratiform precipitation peaked at 6 h−1 and 4 h−1, respectively. According to Figure 7e and Table 1, the average value of Dm of convective precipitation is 17.83% larger than that of stratiform precipitation. The distribution range of Nw of convective precipitation (25–55) is greater than that of stratiform precipitation (primarily between 28 and 45), with the average value of Nw for convective precipitation exceeding that of stratiform precipitation by 8.45%.

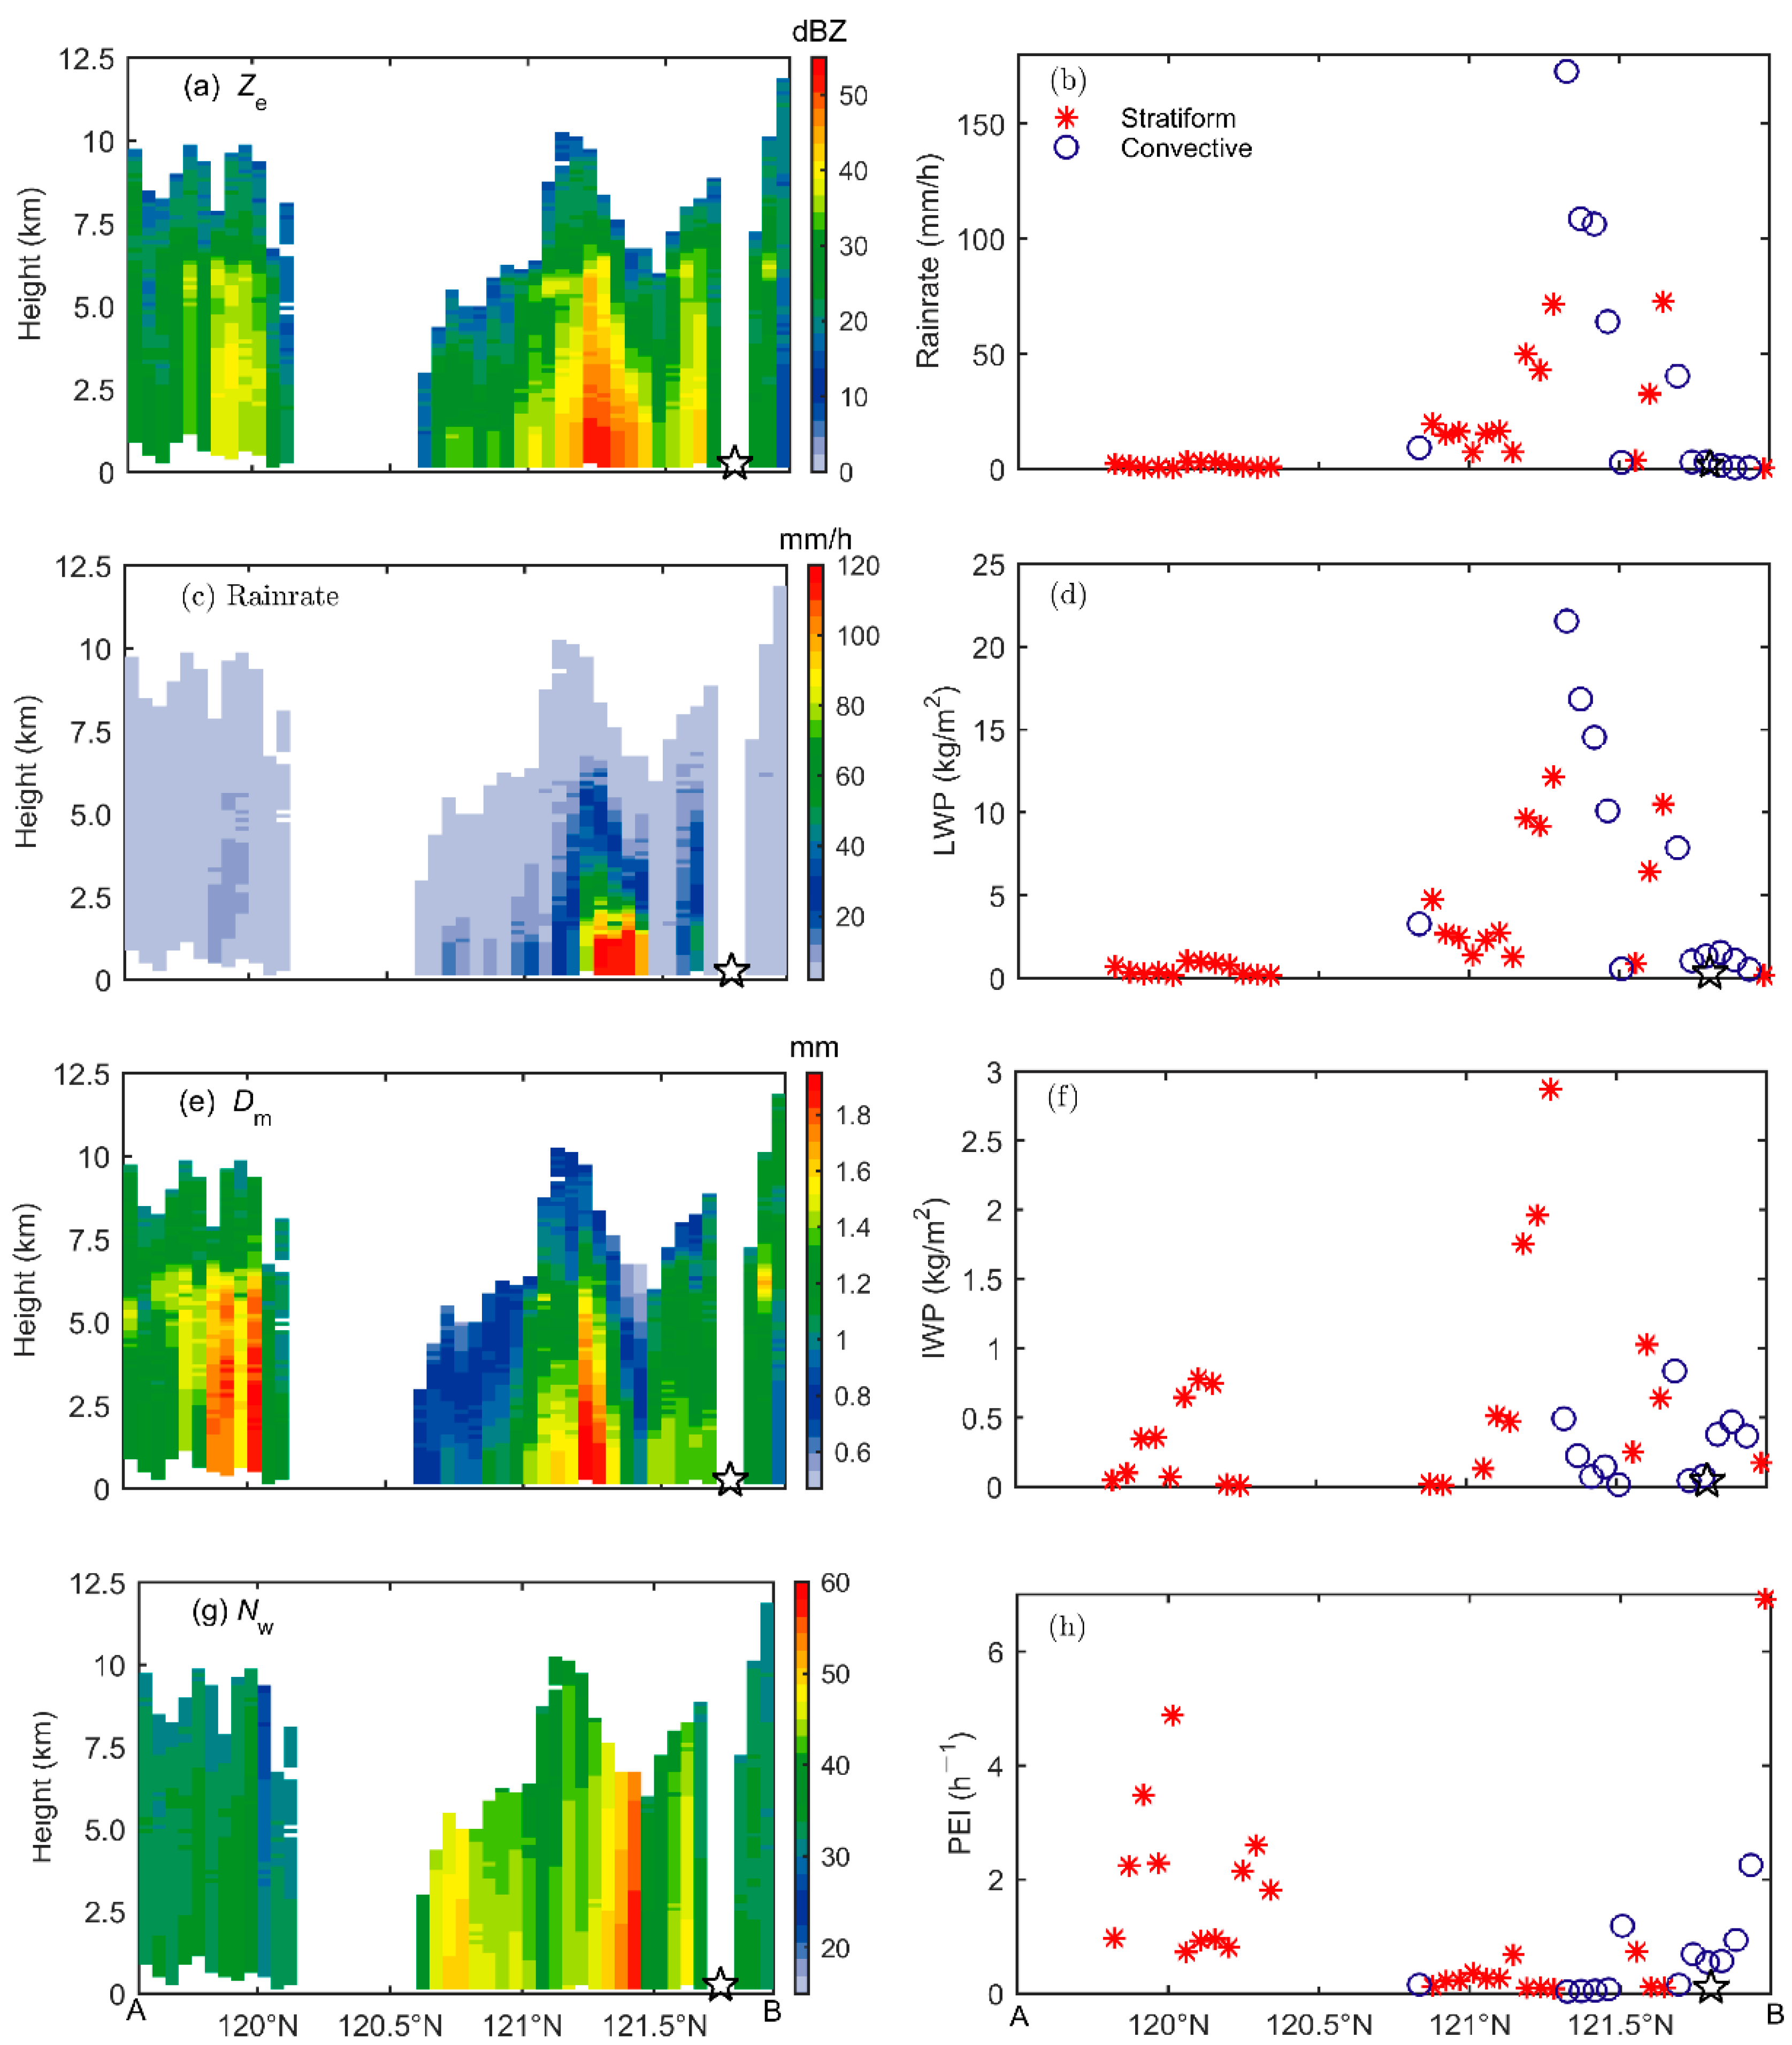
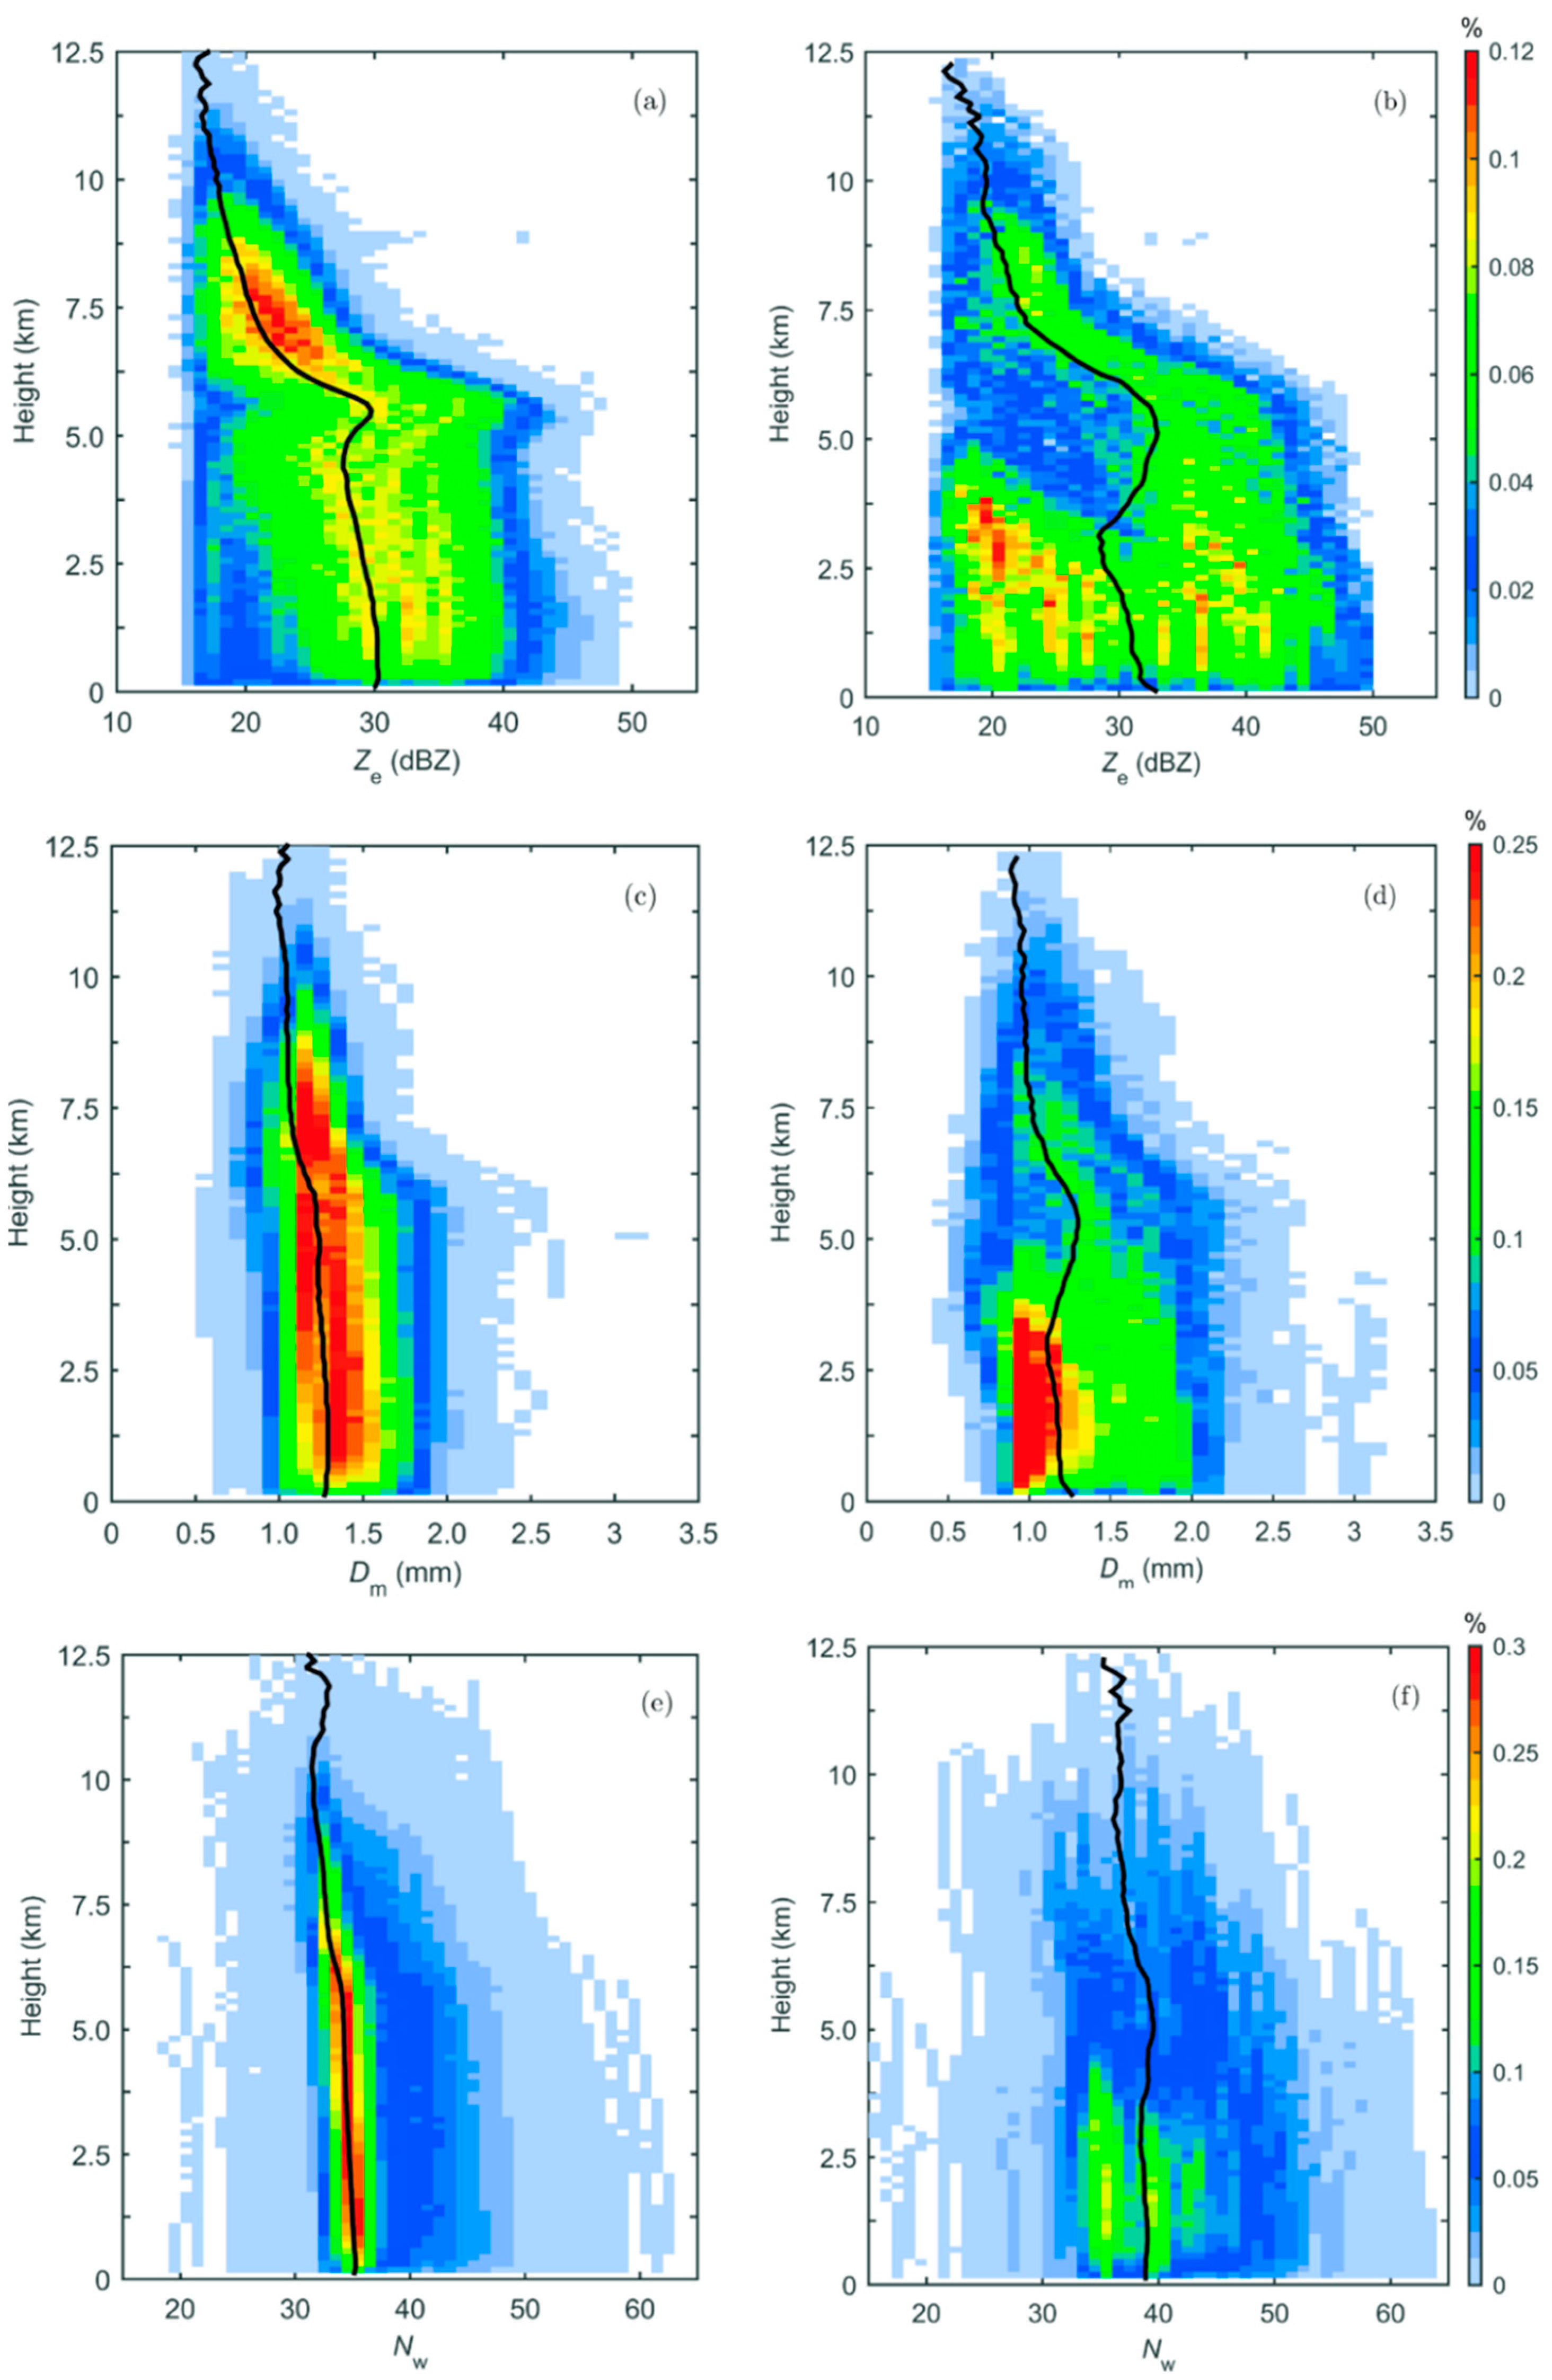
4.3. Vertical Structure of Precipitation

To study the vertical structure characteristics of typhoon precipitation, Figure 8 depicts the cross-sections of GPM/DPR Ze, rainfall rate (R), Dm, and Nw, and the latitudinal variations in R, LWP, IWP, and PEI along the A–B line (Figure 6a) across the eyewall region. Due to the different environmental conditions and dynamic processes, precipitation in different regions of the typhoon presents various characteristics. Within a radius of 20 km near the center of the typhoon, both Ze(R) and Dm(Nw) are low, which was mainly influenced by the warm core structure and the subsiding air in the eye of the typhoon [49]. In the vicinity of the typhoon center (20–80 km), the average Ze (RR) and Dm (Nw) below the melting layer (5.5 km) exhibit an increasing trend with the decrease in height (Figure 6a–e), with Ze exceeding 40 dBZ, RR exceeding 30 mm h−1, and Dm and Nw exceeding 1.6 mm and 45, respectively, indicating a concentration of large raindrops in the region. The latent heat released by the low-level water vapor condensation process is greater than that released by the upper-level ice-phase process, signifying the dominance of warm cloud processes [50]. At greater distance from the center of the typhoon, the value of Dm increases while Nw decreases. The proportion of convective precipitation in the outer rainbands (inner rainbands) is the highest (the lowest). RR is directly proportional to the values of LWP and IWP (Figure 6d,f) and inversely proportional to the values of the PEI (Figure 6h). In the middle region outside the eye of the typhoon (80–180 km), Ze exceeds 40 dBZ, RR exceeds 30 mm h−1, and the value of Dm is approximately 1.3 mm. There are a substantial number of small- and medium-sized raindrops in this area, and the latent heat released during the condensation of water vapor at low levels is almost balanced with the latent heat released during the ice phase at high altitudes. Furthermore, in this area, the intensity of warm and cold cloud processes is comparable. In the outer region (180–500 km from the center), Ze is predominantly below 40 dBZ, with the average Dm and Nw being 1.7 mm and 35, respectively. The concentration of larger raindrops in this region is relatively low, where cold cloud processes predominate [51]. Although there are large values of Dm at both the 20–80 km and 200–300 km radii, the maximum value of Dm for typhoon precipitation (about 2.5 mm) is not located near the typhoon center but in the periphery of the 200–300 km radius. This is mainly due to the combination of the secondary circulation of the cyclone and embedded buoyancy convection, which enhances the raindrop collision–aggregation process [52].
Figure 9 shows the cross-section views of Ze, R, Dm, and Nw, and the variation in RR, LWP, IWP, and PEI along the CD line in Figure 6a, which indicates the landfall path of the typhoon. The STH in Figure 9 is higher than that in Figure 8, with notably lower values of Ze, R, Dm, and Nw. The values of R, LWP, IWP, and PEI in the region near the center of the typhoon exceed those within the peripheral area. The average values of Dm and PEI along the CD segment are higher compared with the corresponding values along the A-B cross-section. The average Ze extended further inland is 30 dBZ, with Dm and Nw being mainly concentrated below 1.6 mm and 30, respectively. Stratiform precipitation dominates in this region, with precipitation intensity being mainly around 5 mm h−1. This phenomenon is likely attributed to the lifting effect of the terrain underlying land surfaces, facilitating the efficiency of precipitation conversion. Concurrently, the updraft forced by the topography is conducive to the collision and aggregation of raindrops into large ones while also promoting the fragmentation of precipitation particles into small raindrops. Consequently, the probability of large raindrops (Dm ≥ 1.8 mm) increases, widening the distribution range [53].

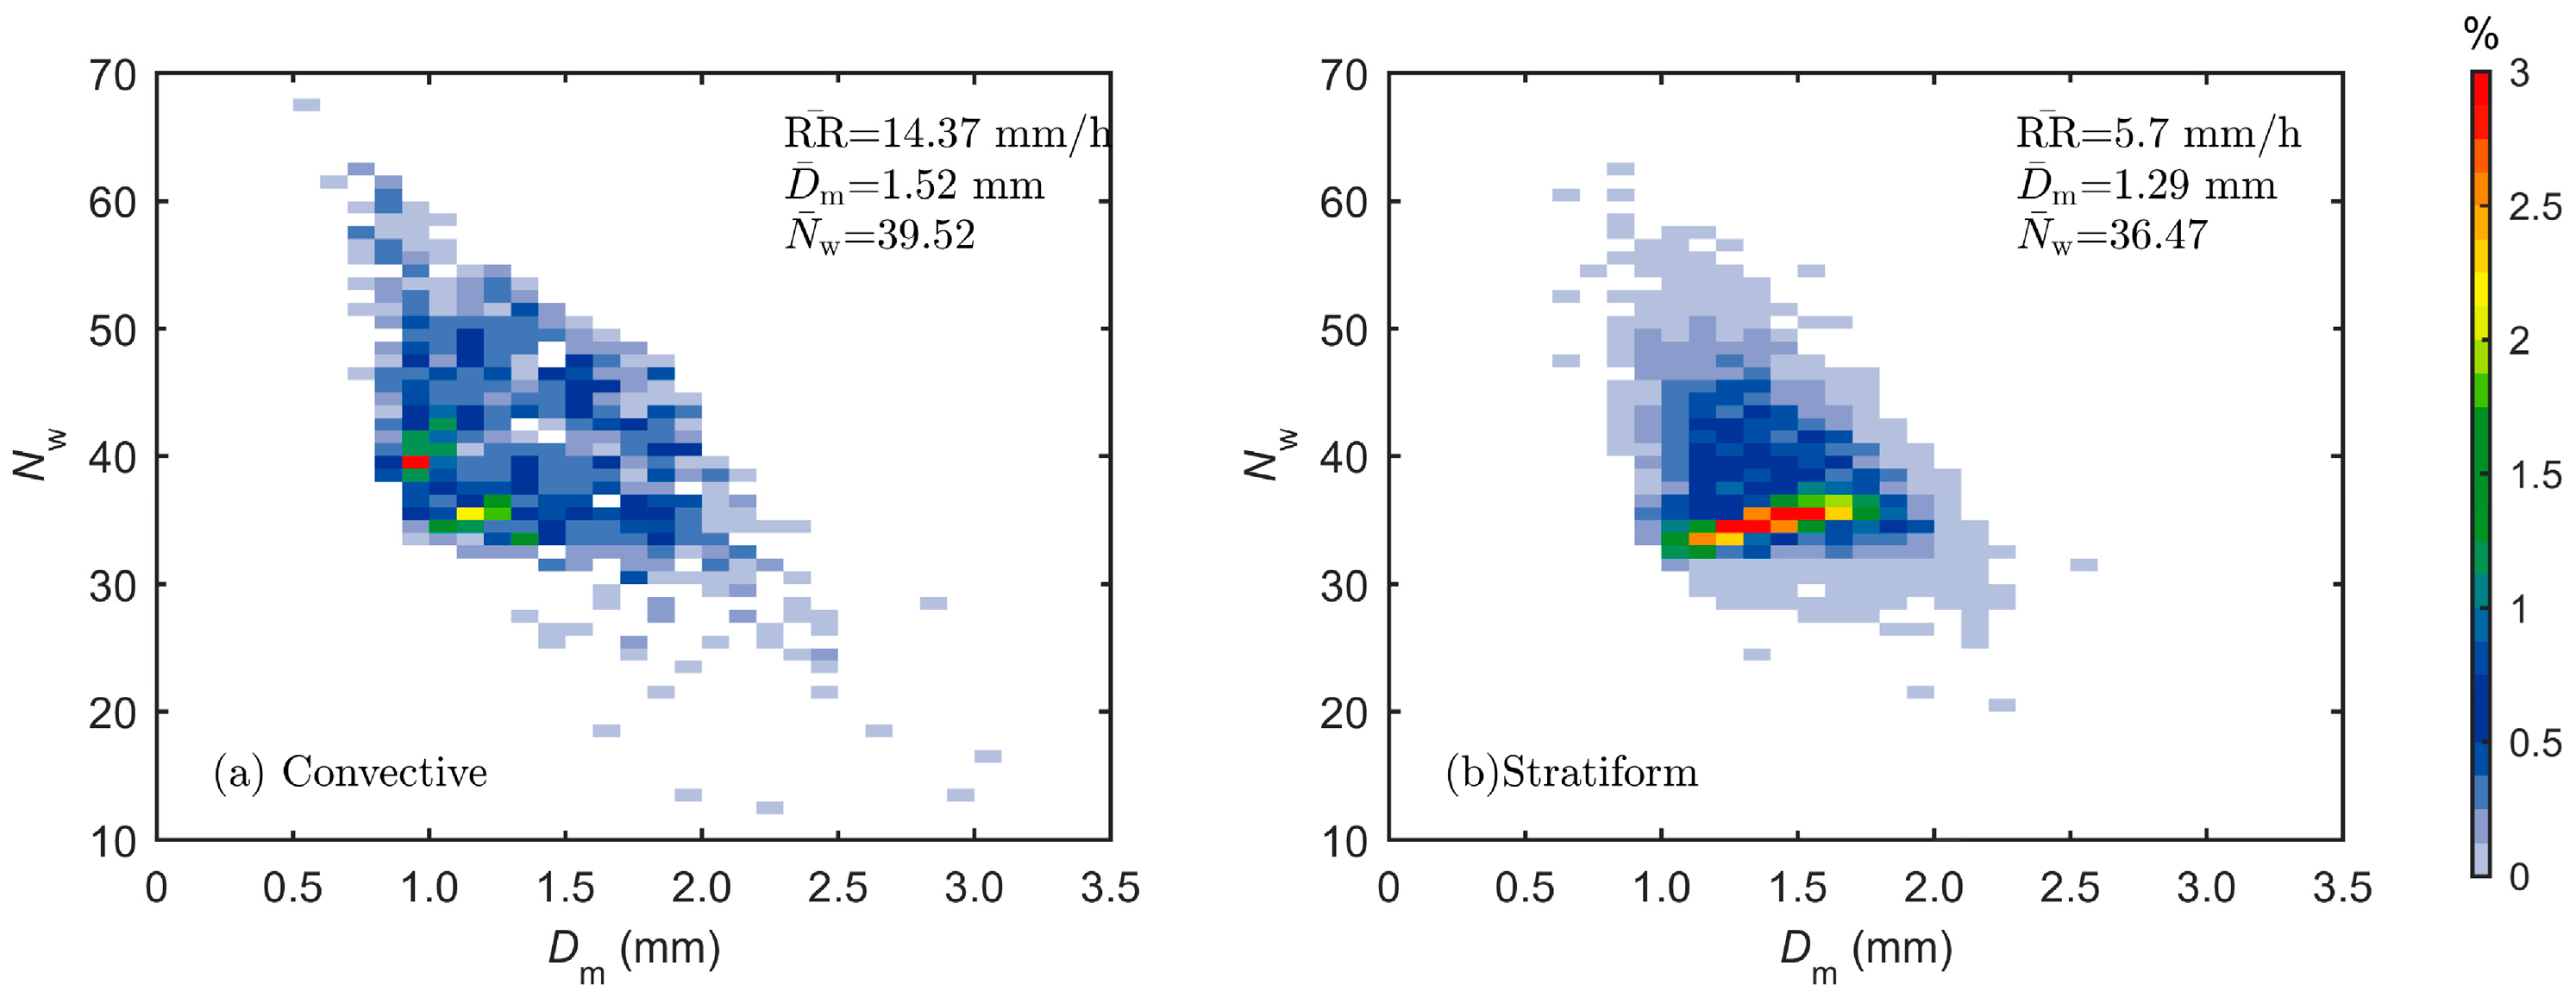
4.4. Micro Properties of Precipitation

To study the characteristics of the particle spectrum of precipitation near the surface, the two-dimensional spatial frequency distribution of the particles at an altitude of 2 km is presented in Figure 10. In comparison with stratiform precipitation, convective precipitation exhibits larger average Dm and Nw, characterized by a high concentration of small particles and a low concentration of large raindrops. The peak frequency of convective precipitation mainly occurs when the value of Nw is between 30 and 60 and the value of Dm is between 1.0 and 2.5 mm. The presence of larger raindrops is most likely attributed to the melting of ice particles (or possibly graupel particles) with relatively large Dm [54]. The Dm-Nw pairs of convective precipitation have a wider distribution, with Dm > 2.5 mm and Nw < 20 for a few samples. For convective clouds, the Dm-Nw pair exhibits two peaks (with a frequency exceeding 2%), with one peak falling within the range of 1.0–1.2 mm for Dm and 38–42 for Nw and the other peak falling within the range of 1.2–1.5 mm (Dm) and 32–35 (Nw). Compared with convective precipitation, the concentration of raindrops in stratiform precipitation is lower, with Dm predominantly ranging from 1.0 to 1.8 mm and Nw ranging from 35 to 50. The average values of Dm and Nw are 1.29 mm and 36.47, respectively. For stratiform precipitation, the peak frequency (more than 2.5%) is observed when Dm ranges from 1 to 1.7 mm and Nw falls between 32 and 38. These findings suggest that for convective and stratiform precipitation, the variation in particle size and number concentration of raindrops serves as a crucial microphysical mechanism governing the production of effective precipitation [55].
CFAD (Contoured Frequency by Altitude Diagrams) was employed to characterize the contour frequencies and median lines (black lines) of Ze, Dm, and Nw for convective clouds (Figure 11a) and stratiform clouds (Figure 11b). Enhanced values of Ze are observed near the melting layer (5.5 km), primarily due to the masking of partially melted ice particles by the liquid surface, which enhances Ze. Below the melting layer, the median line gradually increases towards the surface of the earth. For convective precipitation (Figure 8a), the values of Ze, Dm, and Nw gradually increase below the melting layer as the height decreases. At a height of 5.5 km, the values of Ze, Dm, and Nw mainly vary in the ranges of 28–50 dBZ, 1.0–1.8 mm, and 30–48, while the distributions closer to the surface are in the ranges of 34–53 dBZ, 1.2–2.0 mm, and 30–55. The values of Dm and Nw within convective cloud precipitation regions are broader compared with those of stratiform precipitation regions and exhibit a significant increasing trend with the decrease in altitude. Below 5 km, the Dm of stratiform precipitation is significantly larger than that of convective precipitation. In the vicinity of the melting layer, the bright-band characteristics of Ze in both convective and stratiform precipitation are obvious, with both Ze and Dm increasing. When the temperature of the raindrops rises during the falling process, the solid particles melt and coalesce to form larger raindrops through a collision–coalescence growth process, forming larger precipitation particles. This process, coupled with the original higher concentration of precipitation particles at low levels, results in a further increase in the values of Nw at these altitudes. At altitudes between 5 and 8 km, the values of Ze and Dm decrease significantly with the increase in height. At heights above 8 km, where ice particles predominantly exist, the distributions of Ze and Dm in stratiform clouds are wider than in convective clouds [55].

5. Conclusions

Both GPM satellites and ground-based radars captured the landfall of Typhoon Lekima (2019) in eastern China, which provides a good opportunity to describe the macro and micro characteristics of typhoon precipitation at the time of landfall. Through the comprehensive analysis of the observed data, the following conclusions are drawn.
In comparison with the typhoon precipitation process in the northern Pacific from 2014 to 2019, it is found that the warm cloud development process of Typhoon Lekima precipitation is stronger, corresponding to larger RR and LWP. The average Dm and Nw of Typhoon Lekima (a typhoon in the Pacific region from 2014 to 2019) are 1.41 (1.28) mm and 37.98 (33.0), respectively [13], which are larger than those of typhoons that landed in other parts of China. Dm increases relatively rapidly with the decrease in STH, with collision–coalescence being the dominant liquid-phase microphysical process, and its proportion is significantly higher compared with typhoon precipitation in other regions [56,57]. Therefore, the horizontal and vertical structure characteristics of macro and micro parameters of convection and stratiform precipitation of Typhoon Lekima were compared and analyzed in detail.
(1) The observations from spaceborne and ground-based radars exhibit good consistency when Ze is in the ranges 10–20 dBZ and 30–40 dBZ. The correlation coefficient of the two types of Ze is 0.77, with a mean bias of −1.66 dBZ and a standard deviation of 3.61 dB. These findings inspire us to better utilize combined observations from ground-based Doppler weather radar and GPM satellite for analyzing the precipitation process during typhoon landfall.
(2) Low-frequency microwave radiation brightness temperatures are generally concentrated above 280 K. Within cloud bands, abundant liquid water is present, with the maximum value exceeding 1.5 kg m−2. The brightness temperature increases with the quantity of water droplets, which is related to the intensity of precipitation. The brightness temperature of cloud bands is concentrated between 180 and 220 K, with high-frequency observations revealing more ice particles than mid-frequency ones. The IWP reaches up to 18 kg m−2, where the low brightness temperature region of the high frequency channel corresponds to the high IWP region.
(3) Stratiform precipitation is more widespread in typhoons. Apart from a circular and continuous distribution near the cloud wall, convective precipitation in other locations is sporadically embedded within the stratiform precipitation areas. The average LWP and IWP of convective clouds are 2.67 kg m−2 and 0.28 kg m−2, respectively. While for stratiform clouds, the corresponding values are 1.28 kg m−2 and 0.40 kg m−2, respectively. The STH of stratiform and convective precipitation is mainly distributed in the ranges 2–5 km and 6–11 km. In convective cloud precipitation, Dm and Nw are 1.52 mm and 39.52 at 2 km near the surface, which are 17.83% and 8.45% larger than those at 1.29 mm and 36.44 in the stratiform regions.
(4) The Ze, Dm, and Nw of convective precipitation gradually increase with the decrease in height below the melting layer, and the Dm of stratiform precipitation is significantly larger than that of convective precipitation. In the vicinity of the melting layer, both convective and stratiform precipitation display pronounced bright-band features in Ze, with both Ze and Dm experiencing an increase. Above the height of the melting layer, ice-phase particles dominate. The values of Ze and Dm decrease significantly with the increase in height, with distributions of Ze and Dm in stratiform clouds being wider than those in the convective cloud region.
Our work clarifies the differences in the three-dimensional characteristics of stratiform and convective clouds during the landfall of typhoons based on the currently available datasets of different types of precipitation measured by the GPM/DPR and preliminarily analyzes the micro properties that relate to these differences. These statistical results are helpful in verifying and improving the parameterization of microphysics in numerical models for simulating precipitation in a typhoon event. However, there are some limitations that cannot be ignored. For example, the accuracy of the microphysics parameters retrieved by using the GPM/DPR data are affected by the measurement errors and assumptions made in the algorithms. Though the radar reflectivity factor of the GPM and ground-based radars is consistent and the analysis is carefully designed in this study, it is still difficult to quantify the uncertainties in the retrieved microphysics. In addition, more detailed microphysics, especially the properties of small particles, cannot be obtained by using GPM/DPR measurements. Airborne in situ measurements could be helpful in providing more detailed microphysical properties, but the sample size is relatively small [58,59,60,61]. A combination of airborne measurement and remote sensing can be useful to evaluate the retrieval algorithm and to provide a more complete study of the microphysics of a landing typhoon.

Author Contributions

Z.W. and J.Y. conceived the idea and proposed this study. F.C., Y.L. and L.S. discussed the concepts and edited the manuscript. All authors have read and agreed to the published version of the manuscript.

Funding

This work was funded by National Key R&D Program of China (grant number 2021YFC3090201), Natural Science Foundation of Xinjiang Uygur Autonomous Region (grant number 2022D01B182), Open Project of the High Impact Weather Key Laboratory of CMA, and Science and Technology Innovation and Development Fund Project of Xinjiang Meteorological Bureau (grant number MS202412).

Institutional Review Board Statement

Not applicable.

Informed Consent Statement

Not applicable.

Data Availability Statement

The GPM 2ADPR GMI dataset used in this study was collected from the Precipitation Measurement Mission website: https://pmm.nasa.gov (accessed on 2 March 2022).

Conflicts of Interest

The authors declare no conflicts of interest.

References

  1. Didlake, A.C.; Kumjian, M.R. Examining storm asymmetries in Hurricane Irma (2017) using polarimetric radar observations. Geophys. Res. Lett. 2018, 45, 13513–13522. [Google Scholar] [CrossRef]
  2. Wu, D.; Zhao, K.; Kumjian, M.R.; Chen, X.; Huang, H.; Wang, M. Kinematics and microphysics of convection in the outer rainband of typhoon Nida (2016) revealed by polarimetric radar. Mon. Wea. Rev. 2018, 146, 2147–2159. [Google Scholar] [CrossRef]
  3. Laurencin, C.N.; Didlake, A.C.; Loeffler, S.D.; Kumjian, M.R.; Heymsfield, G.M. Hydrometeor size sorting in the asymmetric eyewall of Hurricane Matthew (2016). J. Geophys. Res. Atmos. 2020, 125, e2020JD032671. [Google Scholar] [CrossRef]
  4. Wang, M.; Zhao, K.; Pan, Y.; Xue, M. Evaluation of simulated drop size distributions and microphysical processes using polarimetric radar observations for landfalling typhoon matmo (2014). J. Geophys. Res. Atmos. 2020, 125, e2019JD031527. [Google Scholar] [CrossRef]
  5. Elsberry, R.L. Advances in research and forecasting of tropical cyclones from 1963–2013. Asia-Pac. J. Atmos. Sci. 2014, 50, 3–16. [Google Scholar] [CrossRef]
  6. Jiang, H.; Ramirez, E.M.; Cecil, D.J. Convective and rainfall properties of tropical cyclone inner cores and rainbands from 11 years of TRMM data. Mon. Wea. Rev. 2013, 141, 431–450. [Google Scholar] [CrossRef]
  7. Jing, Y.S.; Li, J.; Weng, Y.; Weng, Y.Y.; Wang, J. The assessment of drought relief by Typhoon Saomai based on MODIS remote sensing data in Shanghai, China. Nat. Hazards 2014, 71, 1215–1225. [Google Scholar] [CrossRef]
  8. Kitabatake, N.; Hoshino, S.; Sakuragi, T. Estimation of Tropical Cyclone Intensity using TRMM/TMI Brightness Temperature Data with Asymmetric Components. Pap. Meteor. Geophys. 2014, 65, 57–74. [Google Scholar] [CrossRef]
  9. Hou, A.Y.; Kakar, R.K.; Neeck, S.; Azarbarzin, A.A.; Kummerow, C.D.; Kojima, M.; Oki, R.; Nakamura, K.; Iguchi, T. The Global Precipitation Measurement Mission. Bull. Amer. Meteor. Soc. 2014, 95, 701–722. [Google Scholar] [CrossRef]
  10. Gail, S.J.; Dalia, K.; Walter, P.; George, H.; Chris, K.; Erich, S.; Ramesh, K. The Global Precipitation Measurement (GPM) Mission for Science and Society. Bull. Amer. Meteor. Soc. 2017, 98, 1679–1695. [Google Scholar]
  11. Gail, S.J.; Dalia, K.; Walter, P.; George, H.; Chris, K.; Erich, S.; Ramesh, K. The Global Precipitation Measurement (GPM) mission’s scientific achievements and societal contributions: Reviewing four years of advanced rain and snow observations. Quart. J. Roy. Meteor. Soc. 2018, 144 (Suppl. S1), 27–48. [Google Scholar]
  12. Liu, C.; Zipser, E.J. The global distribution of largest, deepest, and most intense precipitation systems. Geophys. Res. Lett. 2015, 42, 3591–3595. [Google Scholar] [CrossRef]
  13. Huang, H.; Chen, F.J. Precipitation Microphysics of Tropical Cyclones Over the western North Pacific Based on GPM DPR Observations: A Preliminary Analysis. J. Geophys. Res. Atmos. 2019, 124, 3124–3142. [Google Scholar] [CrossRef]
  14. Chen, F.; Sheng, S.; Bao, Z.; Wen, H.; Hua, L.; Paul, N.J.; Fu, Y. Precipitation Clouds Delineation Scheme in Tropical Cyclones and Its Validation Using Precipitation and Cloud Parameter Datasets from TRMM. J. Appl. Meteor. Climatol. 2018, 57, 821–836. [Google Scholar] [CrossRef]
  15. Zhang, A.Q.; Chen, Y.; Pan, X.; Hu, Y.; Chen, S.; Li, W. Precipitation Microphysics of Tropical Cyclones over Northeast China in 2020. Remote Sens. 2022, 14, 2188. [Google Scholar] [CrossRef]
  16. Yang, Z.; Yuan, T.; Jiang, H.; Zhang, L.; Zhang, C. Stratiform and Convective Precipitation Properties of Tropical Cyclones in the Northwest Pacific. J. Geophys. Res. Atmos. 2018, 123, 3513–3529. [Google Scholar] [CrossRef]
  17. Qi, W.Q.; Yong, B.; Gourley, J.J. Monitoring the super typhoon Lekima by GPM-based near-real-time satellite precipitation estimates. J. Hydrol. 2021, 603, 126968. [Google Scholar] [CrossRef]
  18. Klemas, V.V. The role of remote sensing in predicting and determining coastal storm impacts. J. Coast. Res. 2009, 25, 1264–1275. [Google Scholar] [CrossRef]
  19. Min, C.; Chen, S.; Gourley, J.J.; Chen, H.; Huang, C. Coverage of China new generation weather radar network. Adv. Meteorol. 2019, 2019, 5789358. [Google Scholar] [CrossRef]
  20. Warren, R.A.; Protat, A.; Siems, S.T.; Ramsay, H.A.; Louf, V.; Manton, M.J.; Kane, T.A. Calibrating Ground-Based Radars against TRMM and GPM. J. Atmos. Oceanic. Technol. 2018, 35, 323–346. [Google Scholar] [CrossRef]
  21. Chu, Z.G.; Ma, Y.Z.; Zhang, G.F.; Wang, Z.H.; Han, J. Mitigating spatial discontinuity of multi-radar QPE based on GPM/KuPR. Hydrology 2018, 5, 48. [Google Scholar] [CrossRef]
  22. Hamada, A.; Takayabu, Y.N. Improvements in Detection of Light Precipitation with the Global Precipitation Measurement Dual-Frequency Precipitation Radar (GPM DPR). J. Atmos. Oceanic. Technol. 2016, 33, 653–667. [Google Scholar] [CrossRef]
  23. Iguchi, T.; Oki, R.; Smith, E.; Furuhama, Y. Global precipitation measurement program and the development of dual-frequency precipitation radar. J.-Commun. Res. Lab. 2002, 49, 37–46. [Google Scholar]
  24. Sui, C.H.; Li, X.F.; Yang, M.J. On the definition of precipitation efficiency. J. Atmos. Sci. 2010, 64, 4506. [Google Scholar] [CrossRef]
  25. Wang, M.; Zhao, K.; Xue, M.; Zhang, G.; Liu, S.; Wen, L.; Chen, G. Precipitation microphysics characteristics of a typhoon Matmo (2014) rainband after landfall over eastern China based on polarimetric radar observations. J. Geophys. Res. Atmos. 2016, 121, 12415–12433. [Google Scholar] [CrossRef]
  26. Liang, L.; Robert, M. Changes in the TRMM Version-5 and Version-6 Precipitation Radar Products Due to Orbit Boost. J. Meteorol. Soc. Japan 2009, 87A, 93–107. [Google Scholar]
  27. Bolen, S.M.; Chandrasekar, V. Quantitative Cross Validation of Space-Based and Ground-Based Radar Observations. J. Appl. Meteor. Climatol. 2000, 39, 2071–2079. [Google Scholar] [CrossRef]
  28. Biswas, S.K.; Chandrasekar, V. Cross-Validation of Observations between the GPM Dual-Frequency Precipitation Radar and Ground Based Dual-Polarization Radars. Remote Sens. 2018, 10, 1773. [Google Scholar] [CrossRef]
  29. Huang, H.; Zhao, K.; Fu, P.L.; Chen, H.N.; Chen, G.; Zhang, Y. Validation of Precipitation Measurements from the Dual-Frequency Precipitation Radar Onboard the GPM Core Observatory Using a Polarimetric Radar in South China. IEEE. Trans. Geosci. Remote. Sens. 2022, 60, 4104216. [Google Scholar] [CrossRef]
  30. Li, Z.; Wen, Y.X.; Liao, L.; Wolff, D.; Meneghini, R.; Schuur, T. Joint Collaboration on Comparing NOAA’s Ground-Based Weather Radar and NASA–JAXA’s Spaceborne Radar. Bull. Amer. Meteor. Soc. 2023, 104, 1435–1451. [Google Scholar] [CrossRef]
  31. Zhong, L.Z.; Yang, R.F.; Wen, Y.X.; Chen, L.; Gou, Y.B.; Li, R.Y.; Zhou, Q.; Hong, Y. Cross-evaluation of reflectivity from the space-borne precipitation radar and multi-type ground-based weather radar network in China. Atmos. Res. 2017, 196, 200–210. [Google Scholar] [CrossRef]
  32. Le, M.; Chandrasekar, V.; Biswas, S. Evaluation and Validation of GPM Dual-Frequency Classification Module after Launch. J. Atmos. Oceanic Technol. 2016, 33, 2699–2716. [Google Scholar] [CrossRef]
  33. Anagnostou, E.N.; Morales, C.A.; Dinku, T. The Use of TRMM Precipitation Radar Observations in Determining Ground Radar Calibration Biases. J. Atmos. Oceanic. Technol. 2001, 18, 616–628. [Google Scholar] [CrossRef]
  34. Wang, J.; Wolff, D.B. Comparisons of Reflectivities from the TRMM Precipitation Radar and Ground-Based Radars. J. Atmos. Oceanic. Technol. 2009, 26, 857–875. [Google Scholar] [CrossRef]
  35. Liao, L.; Meneghini, R. Validation of TRMM Precipitation Radar through Comparison of Its Multiyear Measurements with Ground-Based Radar. J. Appl. Meteor. Climatol. 2009, 48, 804–817. [Google Scholar] [CrossRef]
  36. Schwaller, M.R.; Morris, K.R. A Ground Validation Network for the Global Precipitation Measurement Mission. J. Atmos. Oceanic. Technol. 2011, 28, 301–319. [Google Scholar] [CrossRef]
  37. Acosta-Coll, M.; Morales, A.; Zamora-Musa, R.; Butt, S.A. Cross-Evaluation of Reflectivity from NEXRAD and Global Precipitation Mission during Extreme Weather Events. Sensors 2022, 22, 5773. [Google Scholar] [CrossRef] [PubMed]
  38. Chen, F.; Fu, Y.; Yang, Y. Regional variability of precipitation in tropical cyclones over the western North Pacific revealed by the GPM dual-frequency precipitation radar and microwave imager. J. Geophys. Res. Atmos. 2019, 124, 11281–11296. [Google Scholar] [CrossRef]
  39. Hoshino, S.; Nakazawa, T. Estimation of tropical cyclone’s intensity using TRMM/TMI brightness temperature data. J. Meteor. Soc. Jpn. 2007, 85, 437–454. [Google Scholar] [CrossRef]
  40. Liao, L.; Meneghini, R. GPM DPR Retrievals: Algorithm, Evaluation, and Validation. Remote Sens. 2022, 14, 843. [Google Scholar] [CrossRef]
  41. Awaka, J.; Le, M.; Chandrasekar, V.; Yoshida, N.; Higashiuwatoko, T.; Kubota, T.; Iguchi, T. Rain Type Classification Algorithm Module for GPM Dual-Frequency Precipitation Radar. J. Atmos. Oceanic. Technol. 2016, 33, 1887–1898. [Google Scholar] [CrossRef]
  42. Cecil, D.J.; Zipser, E.J.; Nesbitt, S.W. Reflectivity, ice scattering, and lightning characteristics of hurricane eyewalls and rainbands. Part I: Quantitative description. Mon. Wea. Rev. 2002, 130, 769–784. [Google Scholar] [CrossRef]
  43. Chen, R.; Li, Z.; Kuligowski, R.J.; Ferraro, R.; Weng, F. A study of warm rain detection using A-Train satellite data. Geophys. Res. Lett. 2011, 38, L04804. [Google Scholar] [CrossRef]
  44. Suzuki, K.; Stephens, G.L.; Heever, S.C.; Nakajima, T.Y. Diagnosis of the warm rain process in cloud-resolving models using joint CloudSat and MODIS observations. J. Atmos. Sci. 2011, 68, 2655–2670. [Google Scholar] [CrossRef]
  45. Narayana Rao, T.; Radhakrishna, B.; Nakamura, K.; Prabhakara Rao, N. Differences in raindrop size distribution from southwest monsoon to northeast monsoon at Gadanki. Quart. J. Roy. Meteor. Soc. 2009, 135, 1630–1637. [Google Scholar] [CrossRef]
  46. Iguchi, T.; Seto, S.; Meneghini, R.; Yoshida, N.; Awaka, J.; Kubota, T. GPM/DPR Level-2 Algorithm Theoretical Basis Document; NASA Goddard Space Flight Center: Greenbelt, MD, USA, 2020; Available online: https://www.eorc.jaxa.jp/GPM/doc/algorithm/ATBD_DPR_202006_with_Appendix_a.pdf (accessed on 1 June 2020).
  47. Bringi, V.N.; Chandrasekar, V.; Hubbert, J. Raindrop size distribution in different climatic regimes from disdrometer and dual-polarized radar analysis. J. Atmos. Sci. 2003, 60, 354–365. [Google Scholar] [CrossRef]
  48. Wen, L.; Zhao, K.; Zhang, G.; Xue, M.; Zhang, G.; Liu, S.; Chen, G. Statistical characteristics of raindrop size distributions observed in East China during the Asian summer monsoon season using 2-D video disdrometer and Micro Rain Radar data. J. Geophys. Res. Atmos. 2016, 121, 2265–2282. [Google Scholar] [CrossRef]
  49. Yang, J.; Zhang, Y.; Wang, Z.; Zhang, D. Cloud Type and Life Stage Dependency of Liquid–Ice Mass Partitioning in Mixed-Phase Clouds. Remote Sens. 2022, 14, 1431. [Google Scholar] [CrossRef]
  50. Williams, C.R.; White, A.B.; Gage, K.S.; Ralph, F.M. Vertical structure of precipitation and related microphysics observed by NOAA profilers and TRMM during NAME 2004. J. Clim. 2007, 20, 1693–1712. [Google Scholar] [CrossRef]
  51. Carr, N.; Kirstetter, P.E.; Gourley, J.J.; Hong, Y. Polarimetric Signatures of Midlatitude Warm-Rain Precipitation Events. J. Appl. Meteor. Clim. 2017, 56, 697–711. [Google Scholar] [CrossRef]
  52. Maki, M.; Keenan, T.D.; Sasaki, Y.; Nakamura, K. Characteristics of the raindrop size distribution in tropical continental squall lines observed in Darwin, Australia. J. Appl. Meteor. 2001, 40, 1393–1412. [Google Scholar] [CrossRef]
  53. Houze, R.A. Clouds in tropical cyclones. Mon. Wea. Rev. 2010, 138, 293–344. [Google Scholar] [CrossRef]
  54. Kumjian, M.R.; Prat, O.P. The impact of raindrop collisional processes on the polarimetric radar variables. J. Atmos. Sci. 2014, 71, 3052–3067. [Google Scholar] [CrossRef]
  55. Hence, D.A.; Houze, R.A. Vertical Structure of Hurricane Eyewalls as Seen by the TRMM Precipitation Radar. J. Atmos. Sci. 2011, 68, 1637–1652. [Google Scholar] [CrossRef]
  56. Houze, R.A. Orographic effects on precipitating clouds. Rev. Geophys. 2012, 50, RG1001. [Google Scholar] [CrossRef]
  57. Houze, R.A. Cloud Dynamics; Academic Press: New York, NY, USA, 2014; Volume 104. [Google Scholar]
  58. Yang, J.; Wang, Z.; Heymsfield, A.J.; DeMott, P.J.; Twohy, C.H.; Suski, K.J.; Toohey, D.W. High ice concentration observed in tropical maritime stratiform mixed-phase clouds with top temperatures warmer than −8 °C. Atmos. Res. 2020, 233, 104719. [Google Scholar] [CrossRef]
  59. Yang, J.; Wang, Z.; Heymsfield, A.; Luo, T. Liquid-Ice Mass Partition in Tropical Maritime Convective Clouds. J. Atmos. Sci. 2016, 73, 4959–4978. [Google Scholar] [CrossRef]
  60. Deng, Y.; Yang, J.; Yin, Y.; Cui, S.; Zhang, B.; Bao, X.; Gao, W.; Chen, B.; Li, J.; Gao, W.; et al. Quantifying the spatial inhomogeneity of ice concentration in mixed-phase stratiform cloud using airborne observation. Atmos. Res. 2024, 298, 107153. [Google Scholar] [CrossRef]
  61. Yang, J.; Qin, Z.; Deng, Y.; Chen, M.; Jing, X.; Yin, Y.; Lu, C.; Chen, B.; Zhang, B.; Bao, X. On the cluster scales of hydrometeors in mixed-phase stratiform clouds. Geophys. Res. Lett. 2024, 51, e2024GL108166. [Google Scholar] [CrossRef]
Figure 1. GPM passing track and typhoon path. The blue line represents the typhoon path, the black line indicates the GPM track width, and * marks the position of the ground-based radar.
Remotesensing 16 02765 g001
Figure 2. Radar reflectivity of (a) the GPM dual-frequency precipitation radar (DPR) and (b) the S-band ground-based weather radar (CINRAD) at 1453 UTC.
Remotesensing 16 02765 g002
Figure 3. Consistency assessment of DPR and CINRAD data. (a) Frequency distribution of Ze measured by DPR and CINRAD. (b) Scatter plot of Ze measured by DPR and CINRAD. The blue line (y = x) is 1:1 line; the red line (y = 0.88x + 1.96) represents linear regression.
Remotesensing 16 02765 g003
Figure 4. The brightness temperature of typhoon rainbands with different vertically polarized channels: (a) 18.7 GHz; (b) 89 GHz; (c) 166 GHz; (d) 183.31 ± 7 GHz.
Remotesensing 16 02765 g004
Figure 5. Distribution of different precipitation types.
Remotesensing 16 02765 g005
Figure 6. Spatial patterns of (a) Ze, (b) RR, (c) LWP, (d) IWP, (e) STH, (f) Dm, (g) Nw, and (h) PEI. The black line segment A-B and C-D in (a) crosses through the eyewall region of the typhoon.
Remotesensing 16 02765 g006
Figure 7. PDFs of near-surface (a) RR, (b) LWP, (c) IWP, (d) PEI, (e) Dm, and (f) Nw.
Remotesensing 16 02765 g007
Figure 8. Vertical profiles of (a) Ze, (c) RR, (e) Dm, and (g) Nw and scatter diagrams of (b) RR, (d) LWP, (f) IWP, and (h) PEI along the line A-B in Figure 6a. The black star denotes the tropical cyclone center.
Remotesensing 16 02765 g008
Figure 9. Vertical profiles of (a) Ze, (c) RR, (e) Dm, and (g) Nw and scatter diagrams of (b) RR, (d) LWP, (f) IWP, and (h) PEI along the line C–D in Figure 6a. The black star denotes the tropical cyclone center.
Remotesensing 16 02765 g009
Figure 10. Two-dimensional spatial frequency distribution of RR, near-surface Dm and Nw for (a) convective and (b) stratiform precipitation. ( R R ¯ , D ¯ m , and N ¯ w are the average values of RR, D m , and N w in the figure).
Remotesensing 16 02765 g010
Figure 11. CFAD of Ze, Dm, and Nw for (a,c,e) stratiform and (b,d,f) convective precipitation. The black line represents the average curve.
Remotesensing 16 02765 g011
Table 1. The sample number, mean near-surface RR, LWP, IWP, PEI, Dm, and Nw at 2 km.
SamplesRain Rate
(mm h−1)
LWP
(kg m−2)
IWP
(kg m−2)
PEI
(h−1)
Dm
(mm)
Nw
Convective114614.372.670.285.21.5239.52
Stratiform49665.71.280.403.91.2936.44
Disclaimer/Publisher’s Note: The statements, opinions and data contained in all publications are solely those of the individual author(s) and contributor(s) and not of MDPI and/or the editor(s). MDPI and/or the editor(s) disclaim responsibility for any injury to people or property resulting from any ideas, methods, instructions or products referred to in the content.

