Article

Remote Sensing Integration to Geohazard Management at the Castle-Monastery of Panagia Spiliani, Nisyros Island, Greece

by
Marinos Vassilis
1,*,
Farmakis Ioannis
1,
Chatzitheodosiou Themistoklis
1,
Papouli Dimitra
1,
Stoumpos Georgios
1,
Prountzopoulos Georgios
1 and
Karantanellis Efstratios
2
1
Department of Civil Engineering, Geotechnical Division, National Technical University of Athens, 15780 Zografou, Greece
2
Department of Earth and Environmental Sciences, University of Michigan, Ann Arbor, MI 54124, USA
*
Author to whom correspondence should be addressed.
Remote Sens. 2024, 16(15), 2768; https://doi.org/10.3390/rs16152768 (registering DOI)
Submission received: 27 May 2024 / Revised: 15 July 2024 / Accepted: 23 July 2024 / Published: 29 July 2024
(This article belongs to the Special Issue Application of Remote Sensing in Cultural Heritage Research II)

Abstract

:
The Holy Monastery of Panagia Spiliani is an important religious monument of the Aegean islands. The monastery is built on a steep rocky hill in the Castle of Mandraki on Nisyros island. On the slopes of the foundation area of the monastery, landslides have occurred in the past, mainly rockfalls and slides, while the risk of new similar phenomena in the future is high. To assist the geohazard assessment and mitigation design works, a combined survey using Terrestrial Laser Scanning (TLS) and Unmanned Aerial Vehicle (UAV) photogrammetry was implemented. Besides capturing the detailed morphology within high-resolution 3D point clouds, the main engineering geological units were identified on the slopes, while critical structural ground elements and unstable blocks were mapped in detail. These were quantified in terms of geotechnical parameters, and the engineering geological model of the hill was finalised and presented in an engineering geological map and cross sections. The mitigation measures are targeted towards the stabilisation of the wider area of the upper slope, hence the stability of the monastery and its surroundings risk elements, as well as the support of specific, large- to small-scale unstable rock blocks on the whole slope area, securing accessibility to the main beach of the village.

1. Introduction

1.1. Panagia Spiliani as Cultural Heritage

In previous centuries, Greek monks tried to build monasteries in places that were hidden or difficult to access, in order to protect them from robbers, invaders and conquerors. Examples of monasteries built on steep slopes and cliffs include the monasteries of Meteora in Thessaly, Chozoviotissa in Amorgos, Mega Spileo at Kalavryta, several monasteries of Mount Athos, etc. On the islands, monasteries faced increased threats from pirates, so they had to be well fortified.
Panagia Spiliani is one of the most important religious monuments of the Aegean islands and one of the biggest attractions for visitors to Nisyros volcanic island. The monastery is built on a steep rocky hill in the Castle of Mandraki on Nisyros island of the Dodecanese archipelago, called “Oxos tis Panagias” (literally, the mistletoe of the Virgin Mary, see Figure 1).
According to tradition, in 1400 AD, a farmer discovered a small icon of the Virgin Mary in a cave at the top of the rock, which was taken to the temple of the Virgin Mary of Potamitissa, and it disappeared only to be found again in the sacred cave. Inside this cavity, the church of the monastery was built, and for this reason it was called “Spiliani” (of the cave). Climbing 130 steps, the visitor reaches the holy cave and sees the remarkable wood-carved iconostasis of 1725 AD. The rock was itself a natural fortress, since the Knights of the Order of St. John (Knights Hospitaller) had already chosen the same spot for the Castle of Mandraki.
The hill of Oxos is structured by underwater lava outflows, as well as pyroclastic rocks. More specifically, pillow lavas, pillow lava fragments and hyaloclastites prevail. At the base of the slopes, basaltic/andesitic pillow-like lavas predominate, while pyroclastic rocks predominate in the upper layers.
The hill exhibits near vertical slopes, with heights approaching and locally exceeding 30 m. The location was, as such, favourable for the construction of both the castle and the monastery. Rockfalls of small to significant size have always been an issue for the hill, thus constituting a source of concern for the integrity of the structures on the hill and the safety of passersby at the toes of the slopes.

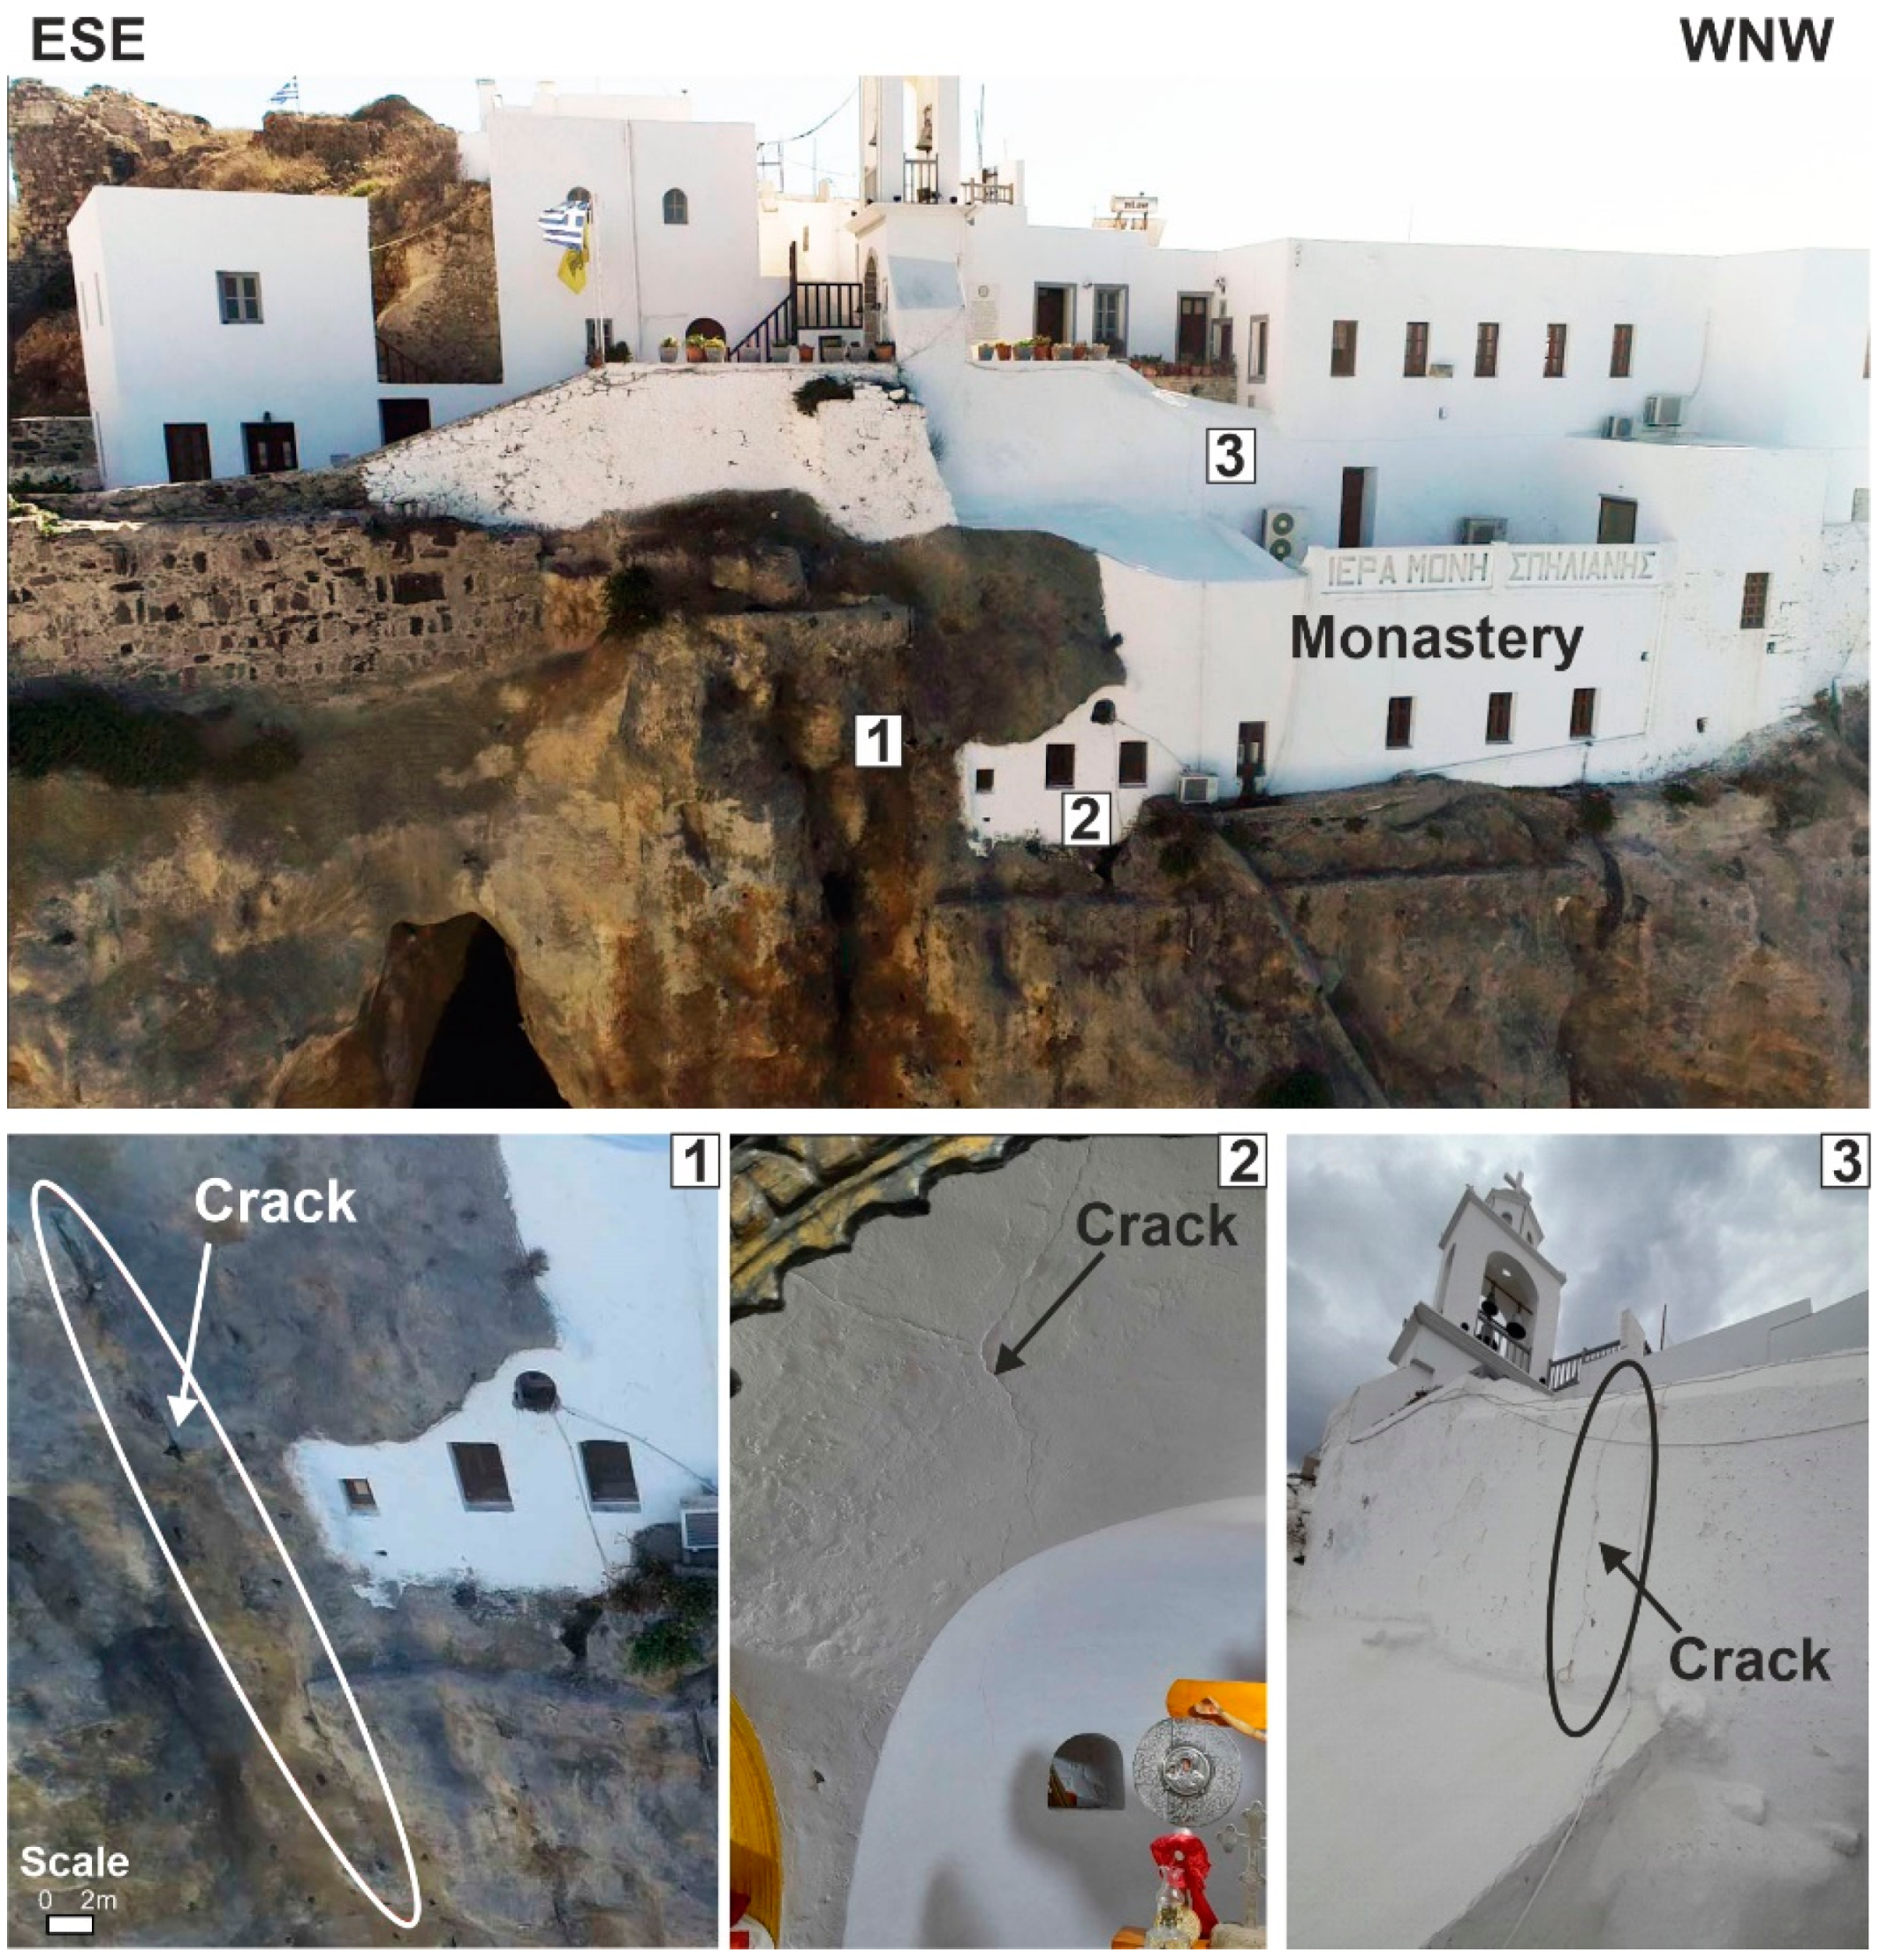
1.2. Problem Statement

On the slopes below the foundation area of the Holy Monastery of Panagia Spiliani (Oxos), ground instabilities have occurred in the past, mainly rockfalls and slides, while the risk of new similar phenomena in the future is high.
Stability problems have been reported and manifested for many decades around the rocky outcrop of Oxos below the buildings of the monastery and around the hill (Figure 2 and Figure 3), along the path leading to the adjacent beach of Chochlaki (Figure 4), at the back of the Monastery and in the existing walls of the old castle. The existing steep to negative-angle slopes, with heights approaching and locally exceeding 30 m, occasionally manifest small to large size rockfalls, constituting an area that has always been a source of concern for the residents of Mandraki and the municipal authorities of the island.
In the context of these challenges, the Holy Monastery of Panagia Spiliani exemplifies a site at risk due to its geomorphological setting. The monastery, situated on a steep rocky hill, faces continuous threats from rockfalls and landslides, exacerbated by the island’s volcanic nature. These hazards have necessitated a thorough geotechnical and engineering geological assessment, to ensure the stability and preservation of this cultural heritage site. The choice of Nisyros island for this study was influenced by its unique geological features and the historical significance of the Panagia Spiliani Monastery, which demands tailored mitigation approaches.
In recent decades, the documentation and mitigation of natural hazards threatening cultural heritage sites have become crucial. Similar studies, such as those conducted on the Red Beach cliffs of Santorini island and the Perissa area [1,2], underscore the importance of integrating advanced remote sensing technologies like LiDAR scanning and UAV photogrammetry into geohazard assessment and mitigation. Nevertheless, such remote sensing platforms have also been used in studies dealing with the protection of cultural heritage not only from rockfalls but also other geologic hazards. For instance, ref. [3] used UAV photogrammetry to identify the main geomorphic processes and design a protection plan for an archaeological site in Afghanistan suffering from erosion; ref. [4] utilised repeated LiDAR scanning to quantify erosion in two archaeological sites over an 18 month period; and ref. [5] conducted a thorough evaluation of the coastal erosion threats faced by Artic cultural heritage, relying on shoreline change mapping via UAV images and LiDAR scanning. The provided (and associated) literature details the threats and their impacts, highlighting the necessity for comprehensive studies and targeted mitigation strategies.
In the context of rockfall hazard, the above remote sensing technologies facilitate a detailed morphological mapping and structural analysis, which are crucial for designing effective stabilisation measures. For example, the application of LiDAR and UAV photogrammetry in the Panagia Spiliani project enabled the identification of unstable rock blocks and the development of targeted interventions to prevent rockfalls and slides.
The approach to the solution for mitigating the risks associated with the slopes around the monastery imposed a remarkable challenge, due to several critical factors. Particularities that characterise the specific case study had contradictory effects on the type of appropriate risk mitigation measures. The geological–geotechnical, spatial, aesthetic, accessibility and constructability restrictions listed below had to be co-evaluated.
  • Target of the safety measures. Active measures were essential, at least at the upper part of the slopes, to avoid effects on the structures of the monastery. Passive measures were only sufficient for small-scale instabilities at the lower part of the slopes, where the main target was to protect the public walking around the hill for access to the nearby beach of Chochlaki. Active measures required improved access to the slopes for observation and evaluation of the in situ conditions, as well as for the implementation of measures. Previous recent attempts (in the 2010s) to mitigate the risks were mainly limited to passive measures that did not contribute to the protection of the monastery.
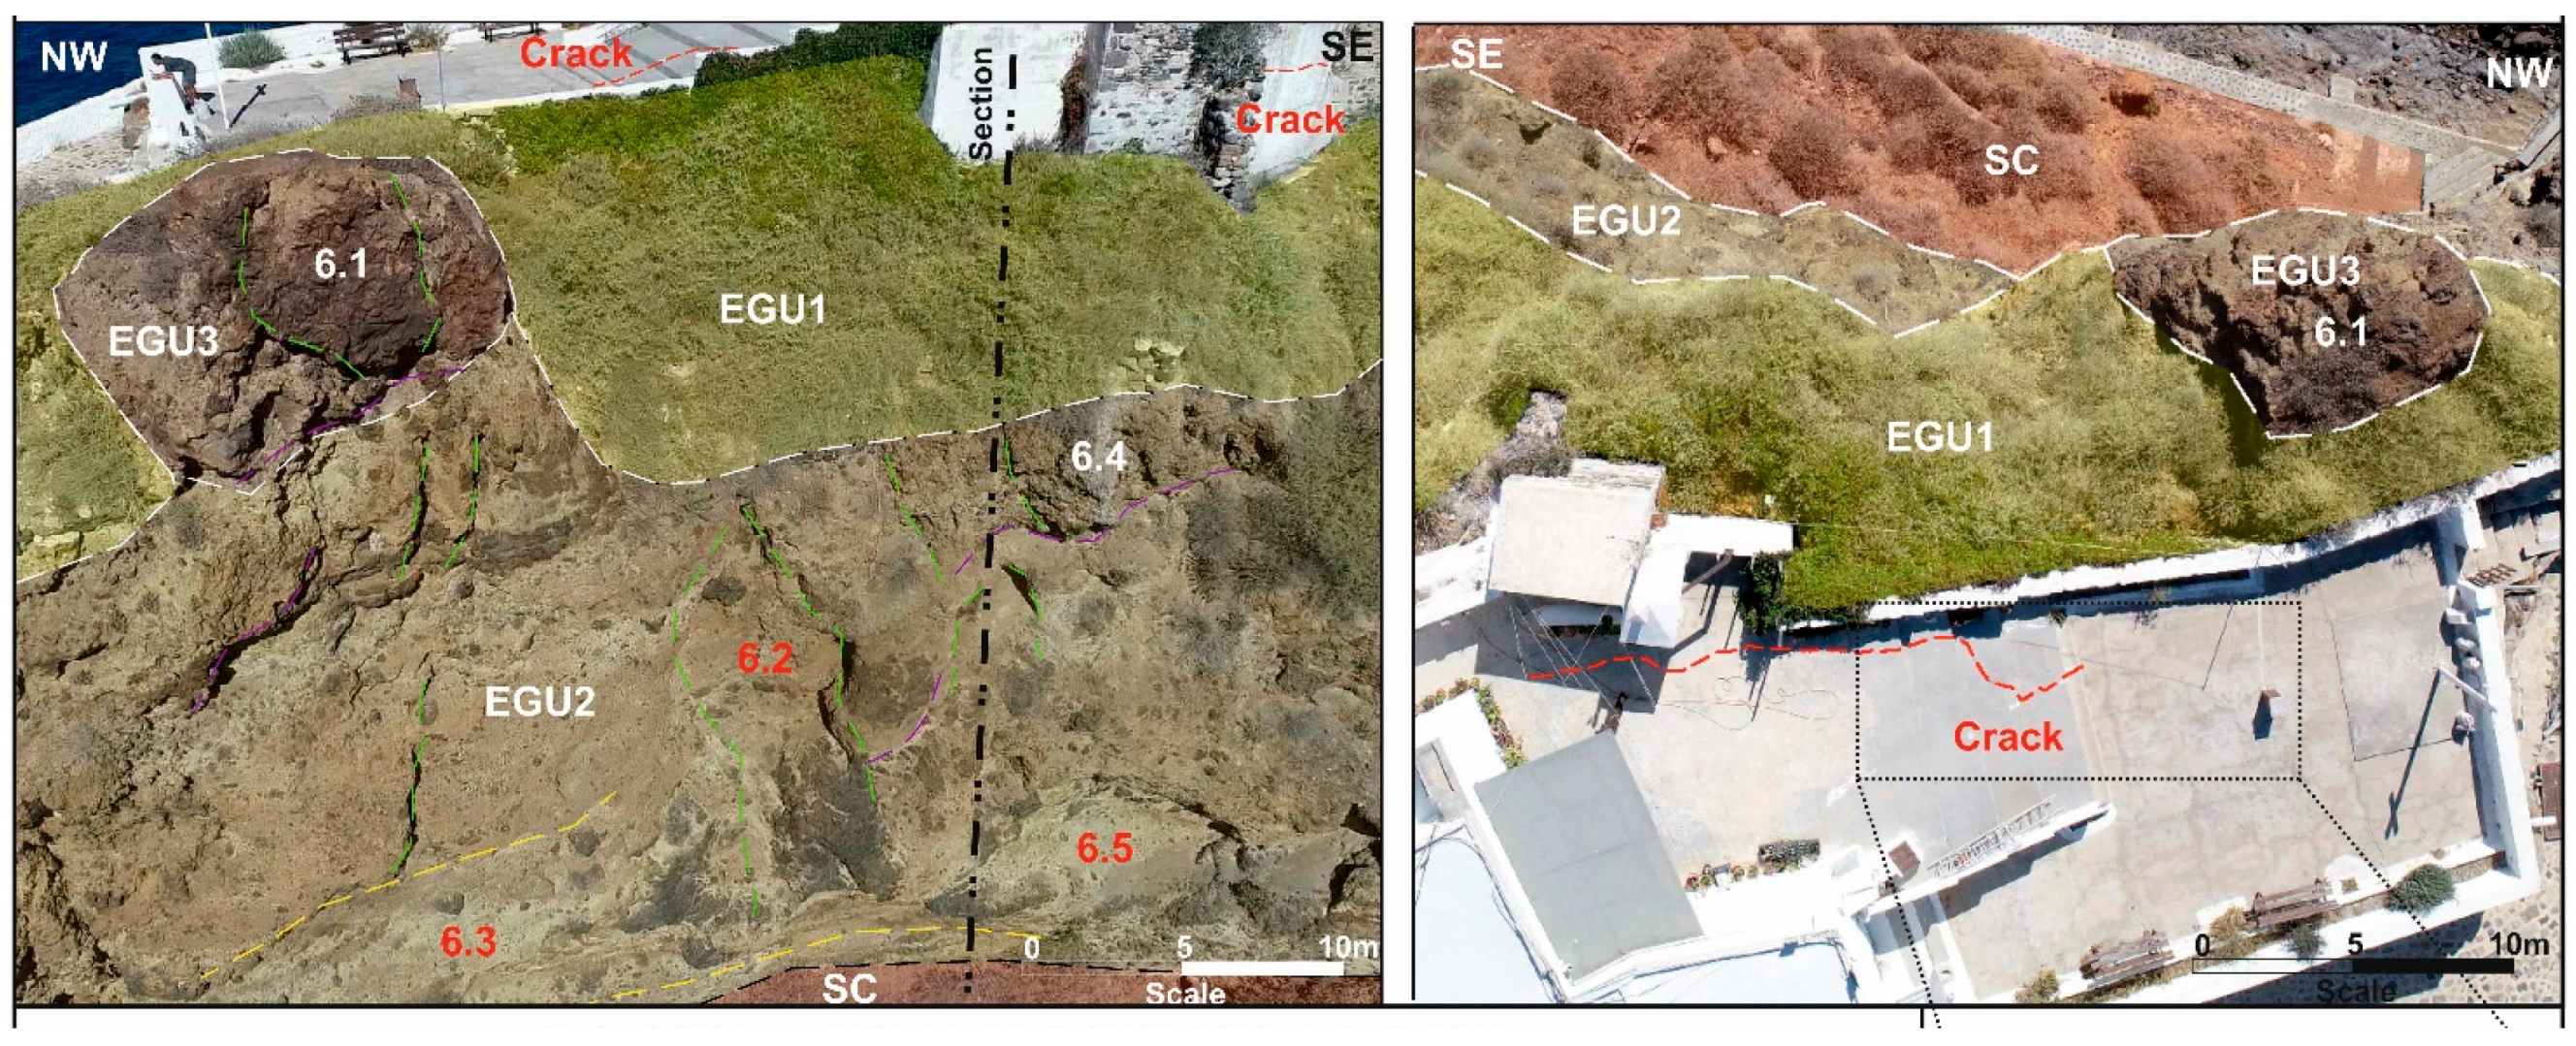
  • Geomaterials on the slopes. The nature, condition and structure of the geomaterials on the slopes were such that a wide range of response and failure types were observed, due to the range of weathering degree, erodibility, jointing and hardness. Failure types ranged from the detachment of small blocks from a small to moderate height, to the sliding and detachment of large hanging rock volumes from the crest of the slopes, with effects on the monastery and its surrounding space. The sliding of soil-like materials on the crest of the slope was also a risk.
  • Aesthetics. Obvious restrictions existed relating to the effect of the measures on the alteration of the natural and man-made landscape. Technical solutions applied on part of the slopes during the 1980s (covering the slopes with shotcrete), albeit effective from a safety point of view, could of course no longer be applied.
  • Geometry of the slopes and accessibility. The height of the slopes (20–35 m) and their inclination (often sub-vertical to locally negative), together with the existence of the monastery and the very limited access to the top for even small equipment and machinery, either for investigation or for construction, imposed restrictions to the proper geological and geotechnical mapping of the slopes and excluded solutions involving a reduction of the slope angle and/or slope height or measures that could not be installed manually or using hand-operated machinery. Sampling boreholes, which would be an option for a more detailed investigation of the conditions, were extremely difficult to execute due to these accessibility problems, and that was also the issue for the engineering geological mapping of the slopes. Remote sensing methods compensated for these problems and—in a manner of speaking—replaced the commonly applied techniques.
The restrictions called for tailor-made, very specific and targeted interventions to the slopes. Generalised solutions, with applications on the total or even on large parts of the slopes’ surface, were an obviously improper approach. Remote sensing was a key element for the successful co-evaluation of all the particularities and specific, local geotechnical features of the slopes and their incorporation into the final technical solution.

1.3. The Role of Remote Sensing

Over the last decades, an abrupt turn towards the exploitation of three-dimensional (3D) geographic data has been observed in rock slope modelling. Specifically, the rock slope management domain has been recently dominated by the use of 3D modelling approaches for visual identification and reporting [1,2,6], as well as simulation [7,8] and monitoring purposes [9,10,11,12,13,14,15]. It is proven that traditional 2D mapping and modelling approaches are no longer sufficient for the detailed design, analysis, and visualisation of the involved elements. As a result, without a comprehensive modelling of 3D elements, the full potential of the geotechnical information may be compromised. Visual obstacles imposed by natural entities and/or the geometric dependencies among divergent geo-spaces can potentially lead to difficulties in representation and interpretation over 2D drawings. Various remote sensing methods can be employed for the collection of 3D geographic data, such as both photogrammetry [16] and laser scanning [17] in either terrestrial or aerial fashion. Combinations of the above techniques have proven beneficial in supporting comprehensive geotechnical site investigations, where the collection of geometric properties is crucial.
In the past, in geotechnical analyses and design, 3D terrains used to be described solely via 2.5D digital models. Although such a practice has satisfactorily served the geotechnical sector, challenges and limitations are introduced to the analysis of steep and even negatively dipping rock slopes [18]. On the contrary, 3D remote sensing data are geometrically expressed as an assembly of XYZ points, also known as a point cloud. Such a fully 3D representation of the terrain provides additional flexibility in extracting geotechnical properties, interpreting geologic and engineering structures, designing and simulating solutions and also communicating results. To take advantage of the aforementioned benefits, this works incorporates remote sensing methods into the mitigation of geotechnical risks threatening cultural heritage. In specific, 3D point clouds are employed to support (a) engineering geological assessment and characterisation of the Oxos rock cliffs of the Panagia Spiliani Holy Monastery in Nisyros island, (b) geotechnical simulations and (c) mitigation solution’s design and presentation.

2. Materials and Methods

2.1. UAV Photogrammetry

In order to accurately capture the detailed morphology of Oxos hill, which is essential for geomorphological and engineering geological assessments and stability analysis, a combined survey using Terrestrial Laser Scanning (TLS) and Unmanned Aerial Vehicle (UAV) photogrammetry was implemented. This integrated approach was deemed necessary due to the hill’s complex terrain features. The TLS was limited to the lower lateral portions of the rock mass due to the sea’s presence, which restricted data collection at the front of the slope, and the steepness of the slope, which limited higher-elevation data collection. Consequently, UAV photogrammetry played a crucial role in obtaining comprehensive coverage of the area. The survey was conducted using a DJI Phantom 4 Pro v2 drone, equipped with a 20-megapixel digital camera that includes a 1-inch sensor
The UAV captured images in two modes: nadiral, where photos are taken perpendicular to the ground, and frontal, where photos are taken at a slight oblique angle to the rock faces. The UAV operations were controlled through an Application Programming Interface (API), which enabled automated flight paths and an efficient data exchange, maximizing the effectiveness of the photogrammetric survey. The drone operated at an altitude of 40 m and a speed of approximately 5 m/s, making two passes over the terrain with a 15-degree angle difference between each pass, to increase the image coverage and detail.
In total, 809 high-resolution photographs were taken, facilitating the creation of a highly precise digital model with a resolution of up to 2 cm. The accuracy of the model was ensured by strategically placing and measuring twelve ground control points (GCPs) for the photogrammetry survey, as well as eight vantage LiDAR scanner points (SPs) across the area (Figure 5), with their coordinates precisely recorded to achieve an overall positioning error of just 0.023 m. The flight pattern was designed to achieve 80% overlap both longitudinally and laterally, compensating for the steep and complex terrain. This overlap was crucial for maintaining consistent coverage across the surveyed area.
Following the UAV surveys, the gathered images were processed with Pix4D software, which is adept at determining the camera’s interior and exterior orientation parameters. The initial phase of the software workflow involved using the Structure from Motion (SfM) algorithm to orient the images and generate a sparse 3D point cloud. Subsequently, multi-view stereo (MVS) photogrammetry was employed to reconstruct a dense 3D point cloud. This detailed point cloud, comprising 12,485,758 georeferenced points at a density of 668 points per cubic meter, was the most instrumental output of the process. With this high-density point cloud, it was feasible to construct the topographic map and an orthomosaic used as a reference (see Figure 5 and Figure 6). These products provided a comprehensive visual and data-rich depiction of Oxos hill’s geomorphological features, serving as critical resources for detailed analysis and reporting.

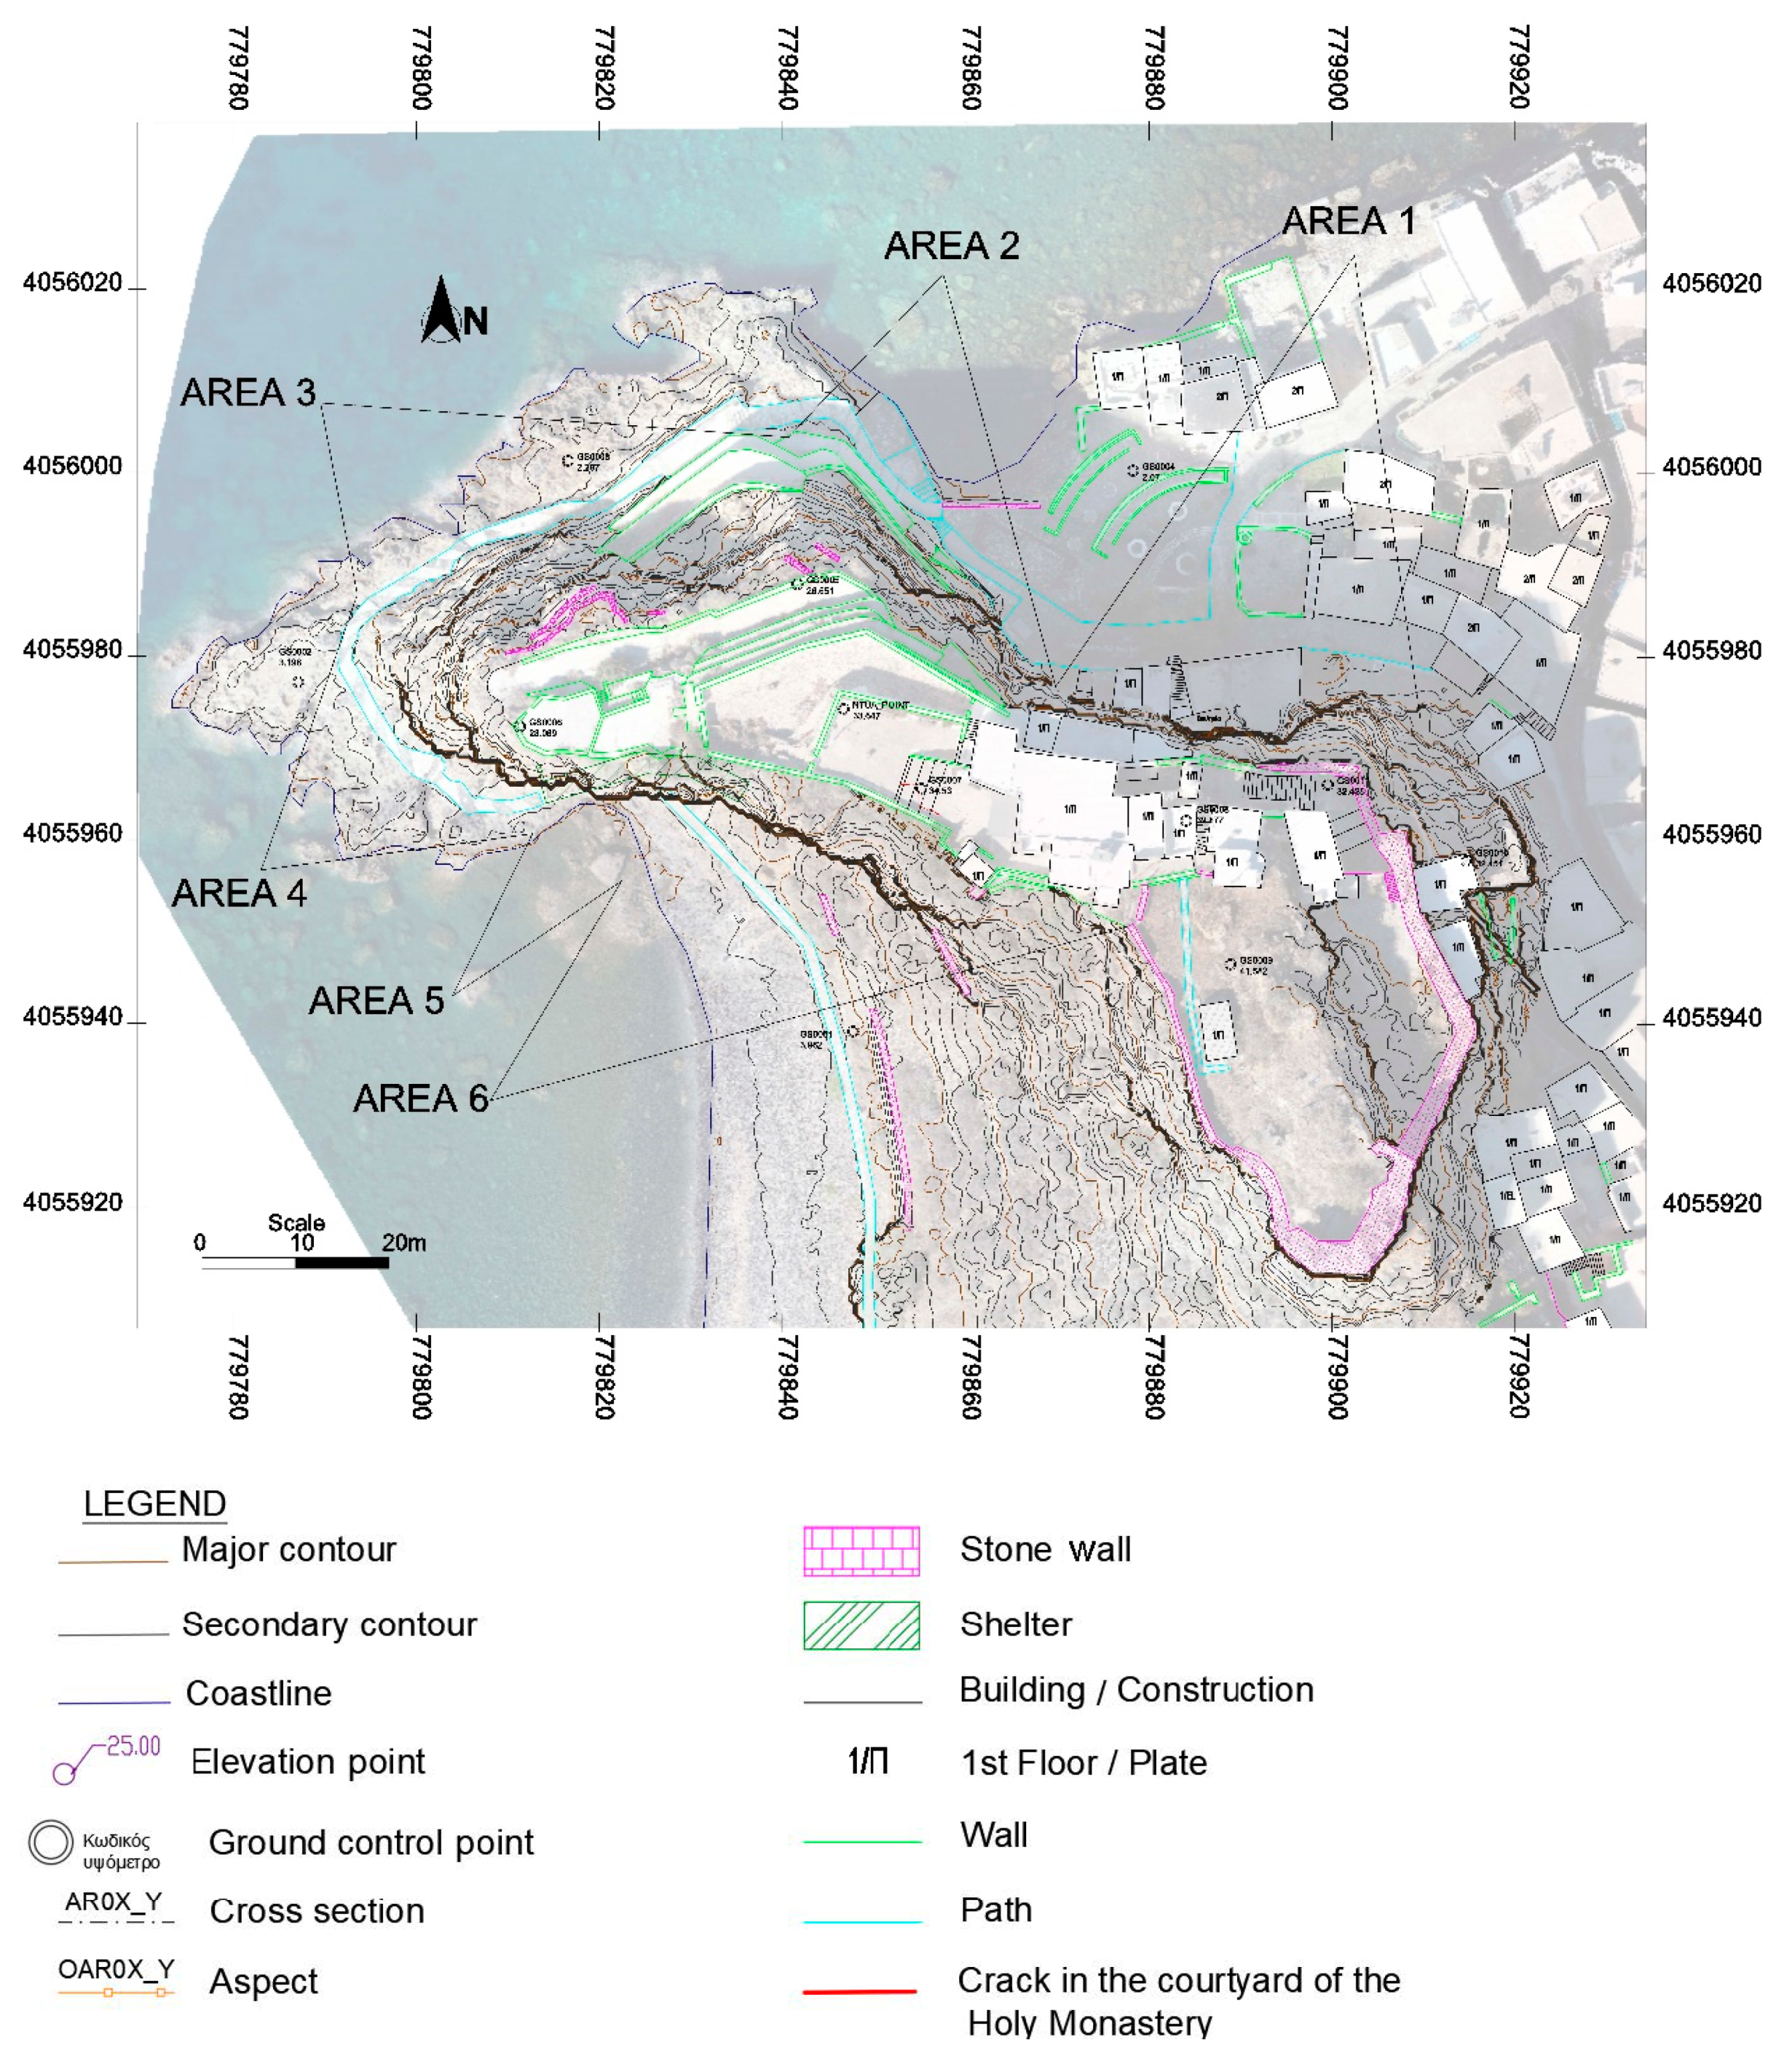
2.1.1. Topographic Survey

The topographic survey conducted on Oxos hill served as a fundamental initial step in the comprehensive geological and structural analysis of the area. This survey aimed to deliver a thorough understanding of both the natural terrain and the extant anthropogenic structures, which is crucial for the Panagia Spiliani Monastery, a key cultural heritage site. Detailed data from UAV photogrammetry was employed to segment the terrain into six distinct geomorphological zones (Figure 6).
Each zone was categorised based on specific geomorphological characteristics, orientation and historical stabilisation interventions. This categorisation encompassed an in-depth examination of slope gradients, rock formations, fracture patterns, erosion levels and vegetation density. These elements are vital for deciphering the dynamics shaping the terrain and for devising effective conservation strategies.
The creation of a 3D point cloud from the area enabled the development of a Digital Surface Model (DSM), which facilitated the production of precise topographic maps for each zoned area with elevation intervals set at half-meter increments. Additionally, cross-sections derived from the 3D point cloud addressed the shortcomings typically associated with traditional 2.5D contour-based methods, proving particularly beneficial in areas with inward-sloping terrains. The topographic maps and cross-sections generated are essential for conducting stability analyses and for informing geological engineering efforts, thus supporting focused risk management and mitigation planning.
Furthermore, the survey catalogued existing infrastructure, such as the historical monastery complex, pathways, and retaining walls, noting their proximity to cliff edges and potential implications for slope stability. This dataset offers valuable insights into the anthropogenic effects on the landscape and is instrumental in guiding future conservation initiatives, ensuring that new stabilisation strategies are congruent with the site’s historical significance and current utilisations.

2.1.2. Digital Geological Field Mapping

In order to identify areas of increased risk, the results of the 3D mapping of the slopes of Oxos with a terrestrial LiDAR scanner were used in combination with on-site observations in the context of site visits.
An ideal reference level was created for each subsection of the hill of Oxos, computed as the best-fit plane to the points comprising the individual point clouds. Based on this level, the horizontal distances of each point on the slope were recorded. These distances were compared on the corresponding extracted drawings in such a way that the protruding areas (blue colour), the “smooth” areas (green colour) and the depressions (recessions) of the slope (red colour) can be clearly seen (Figure 7).
Thus, in a particularly comprehensive way, the areas of increased risk arise as a result of the loss of support of areas of the slope. It is noted that, in addition to the obvious cases of adjacent protrusions and recessions (blue–red areas), loss of support is also indicated in some cases of smaller protrusions that are captured in the LiDAR point clouds as adjacent blue–green or red–green areas.
As far as slope protrusions are concerned, these were always identified as areas of possible failures. On the other hand, the depressions are not in themselves areas of possible failures but create the conditions for the occurrence of failures around them, laterally and above, as they create “free surfaces”, i.e., a loss of support of the rock mass with which they are adjacent, and therefore affect the stability of the slope more widely. The outcome of this process was the creation of an inventory of increased risk areas around the slopes of Oxos.

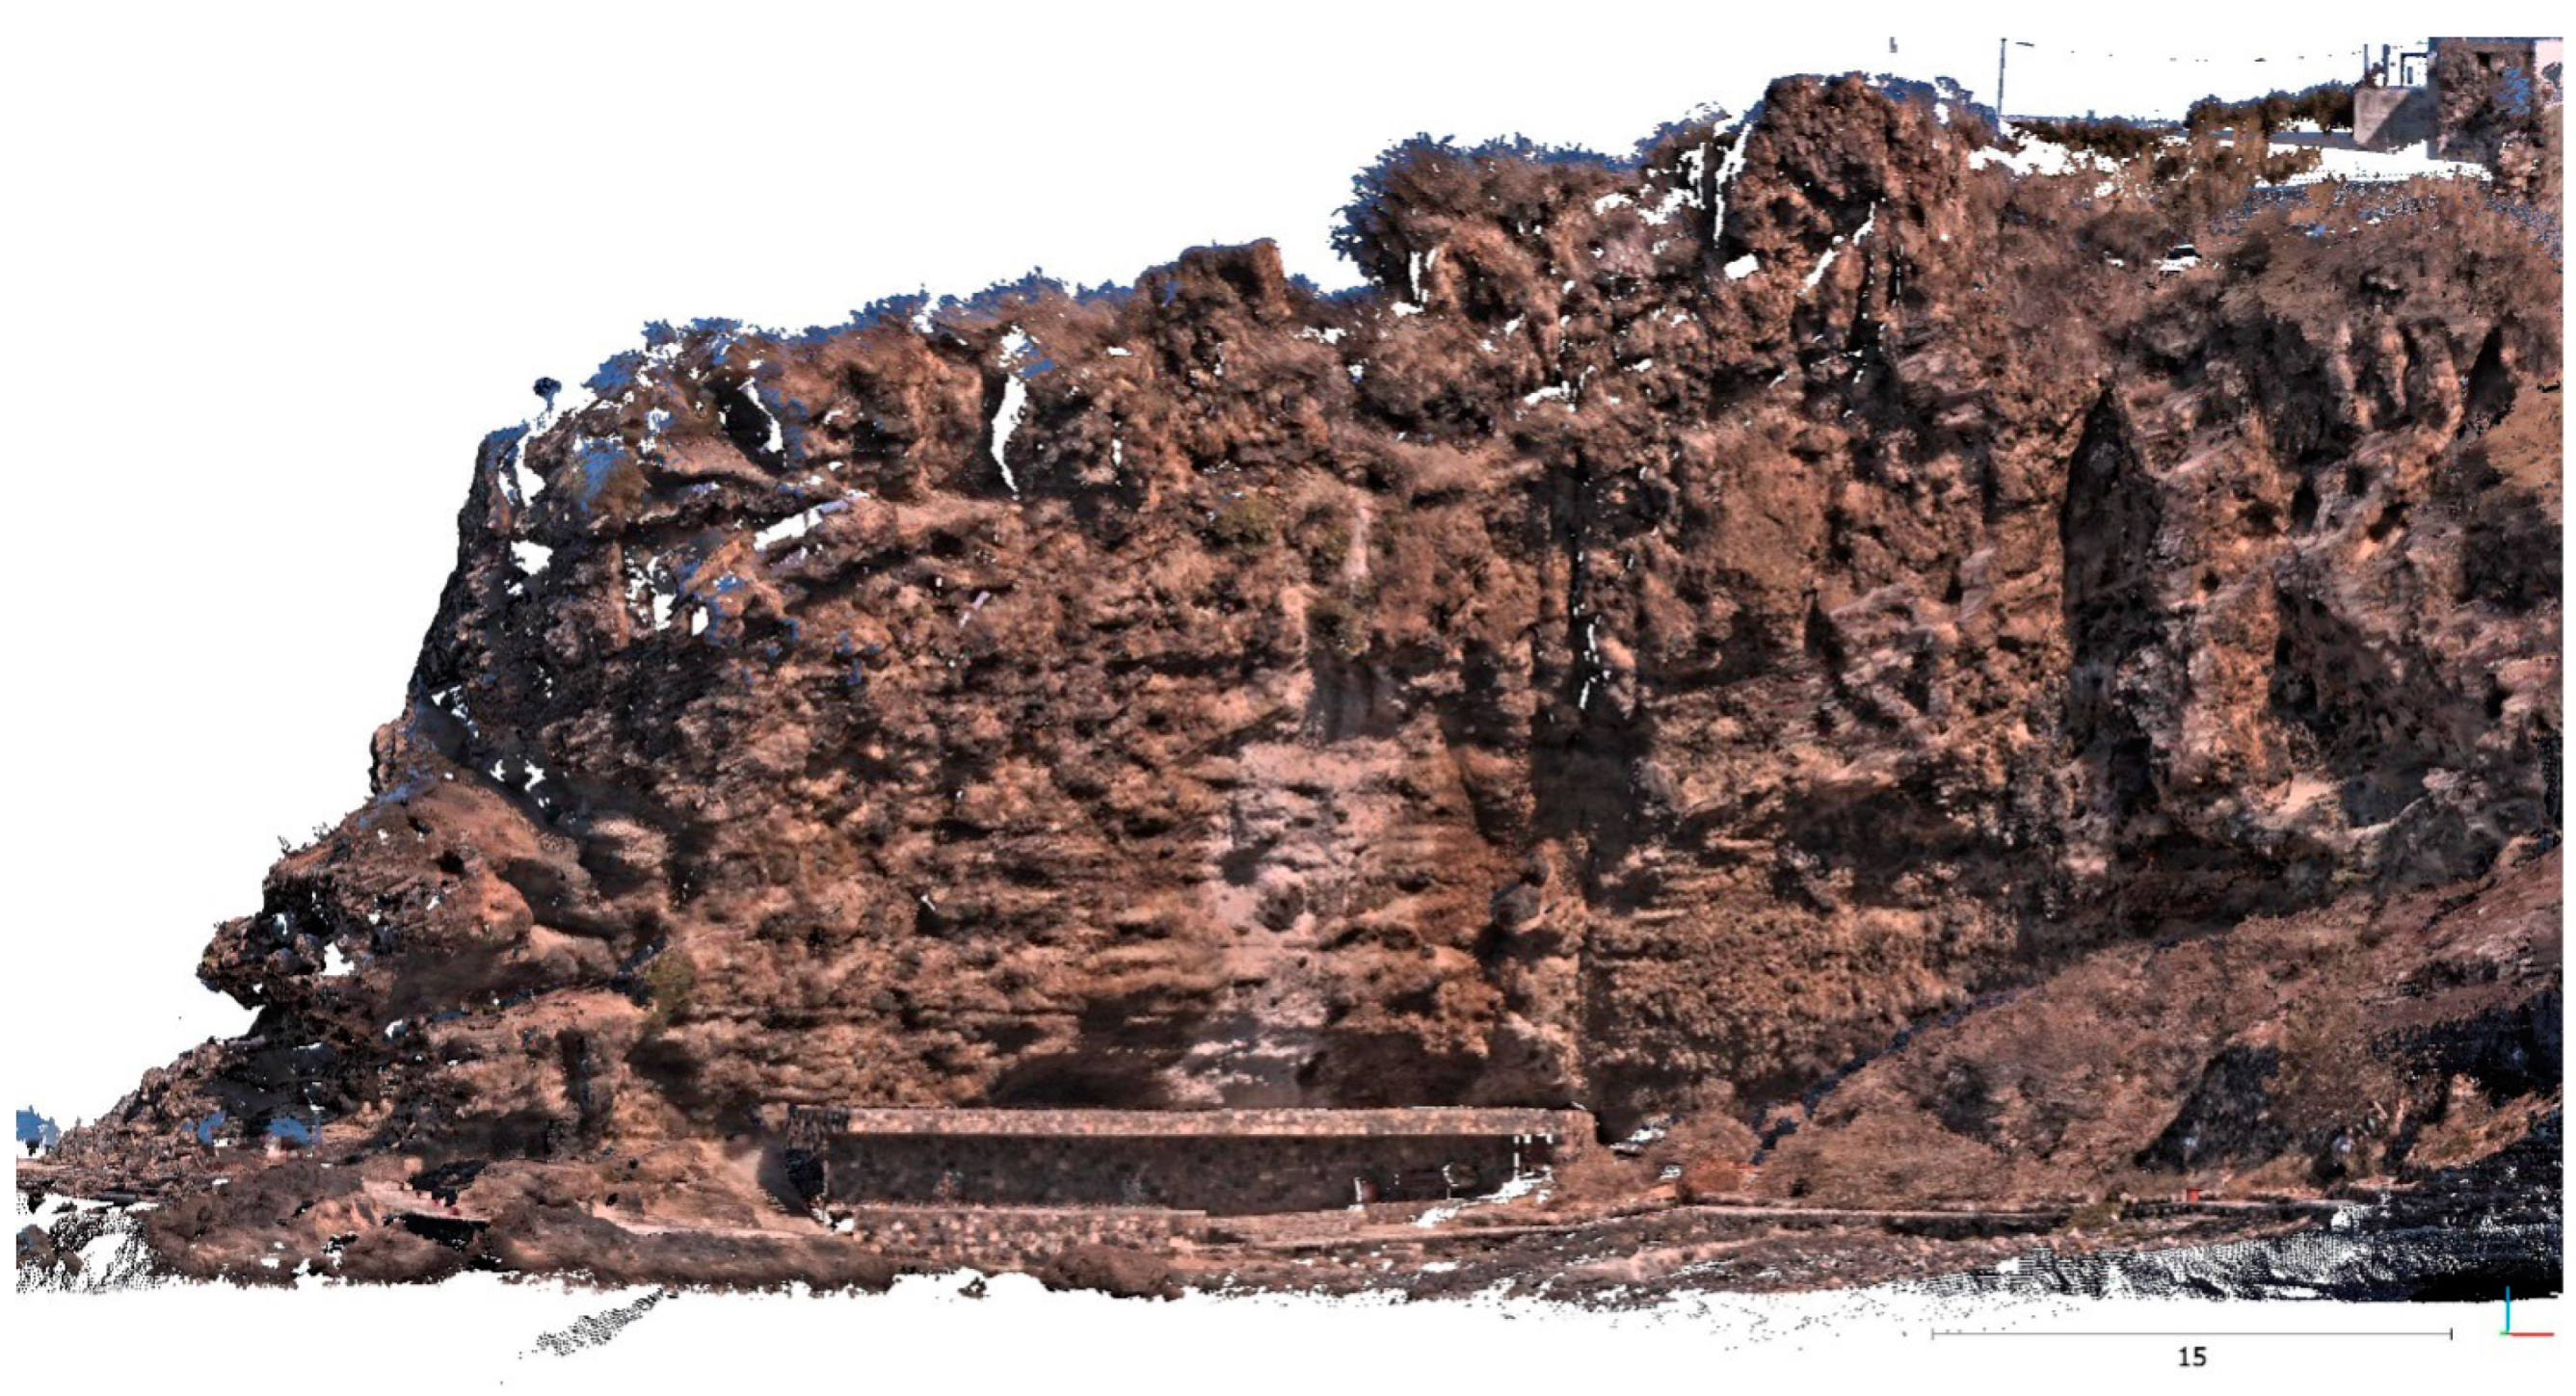
2.2. Terrestrial Laser Scanning

Light Detection And Ranging (LiDAR) technology has enabled efficient topographic measurements in a high resolution and precision from a distance. Such technology was used for the detailed reconstruction of the steep Oxos cliffs. As an active sensing method, LiDAR scanning determines the target (reflective surface) distance to the sensor as a function of light beam travel time (emission and return). In engineering geological applications, LiDAR scans allow for the detailed representation and quantitative assessments of rock structures in even inaccessible areas along cliffs, making a plethora of additional data available to researchers. Particularly critical is the contribution of LiDAR-based terrain reconstruction in vegetated areas, where the laser beam can often provide second-pulse returns allowing for the removal of light vegetation (first-pulse).
The survey plan that was conducted in the current work included the terrestrial laser scanner Leica P40. The Oxos cliffs were scanned from six different vantage points around the hill where the Holy Monastery was founded. The registration of the LiDAR point clouds was based on the aerial photogrammetry survey, and the root mean squared error (RMSE) between the LiDAR and photogrammetry point clouds was measured as 0.03 m after iterative closest point (ICP) alignment [19] (Figure 8). The plan was designed in respect to the orientation of the individual sub-slopes formed along the perimeter of the hill. Data acquisition was performed for a maximum range of 270 m and a spatial resolution of 1.6 mm at 10 m distance. Consequently, the maximum point spacing achieved within the produced 3D point clouds is 1.5 cm, since no vantage points is more than 100 m distant to the slope (Figure 9). In addition, a codirectional image was taken for each sub-slope scan to provide colour information for each point of the point cloud.

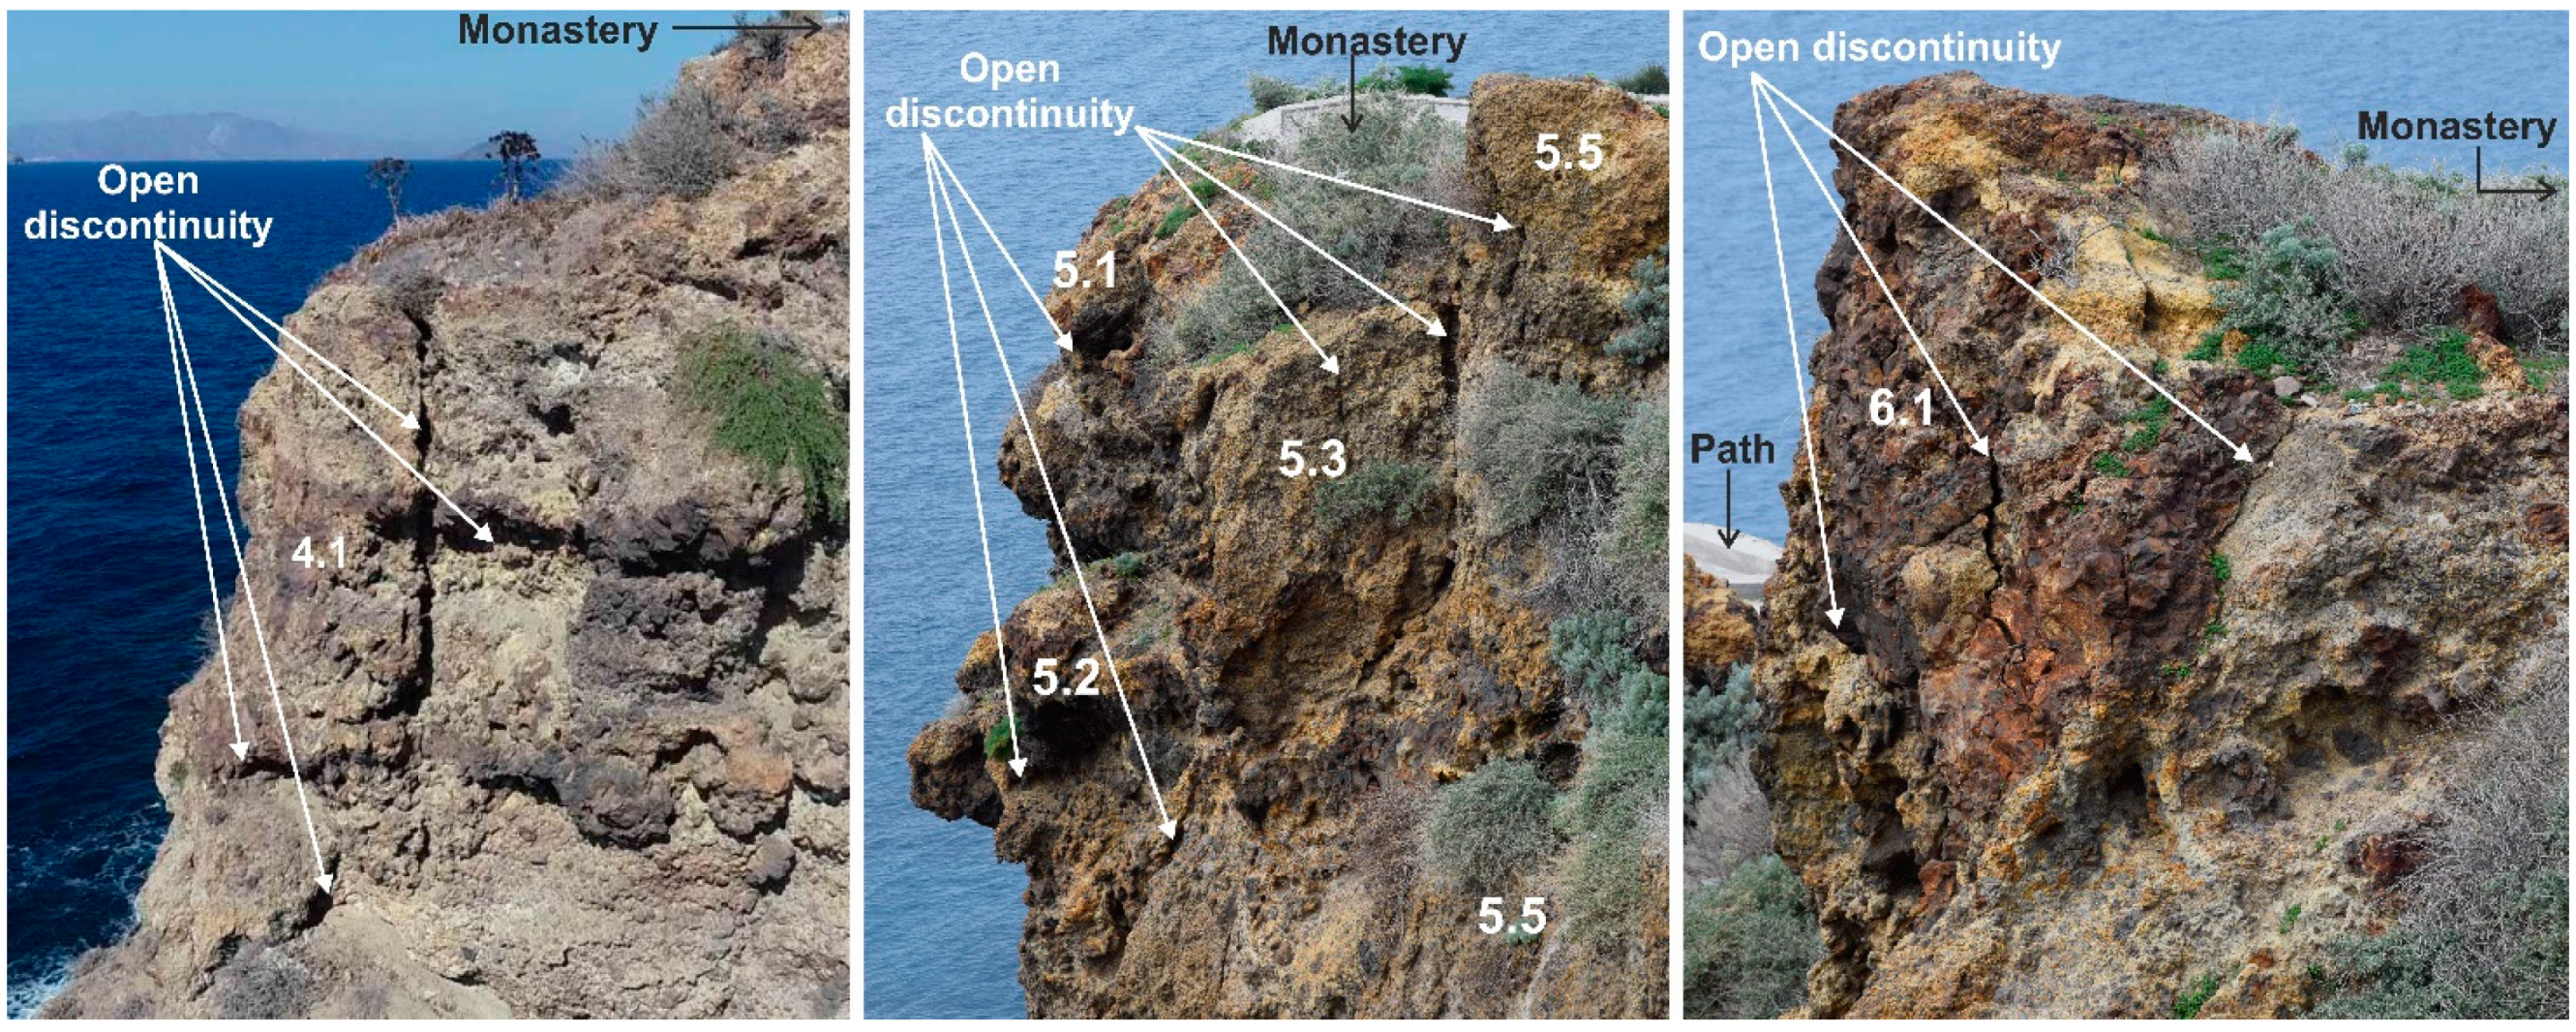
2.2.1. Rock Mass Structural Mapping

The LiDAR point cloud was leveraged for the extraction of rock discontinuity orientation parameters (dip angle/dip direction) along the Oxos cliffs. Structural mapping is a critical operation in geotechnical analyses, because it provides all the required geometric data to develop the simulation environments for a further stability analysis [2]. Structural mapping using remote sensing provides access to inaccessible areas, an increased amount of data for statistical analysis, and the ability to measure the entire extent of large-discontinuity surfaces, yet safely for the investigator in the field. The methodology includes two distinct phases:
(A)
A detailed inspection of the 3D model and delineation of the critical tectonic discontinuities. Each extracted discontinuity comprises an individual subset of XYZ points.
(B)
Principle components analysis (PCA) on the XYZ feature space of each subset, to determine the normal vector which corresponds to the orientation of the surface it represents. The normal vector is calculated as the eigenvector corresponding to the lowers eigenvalue and its normal to the measured surface.

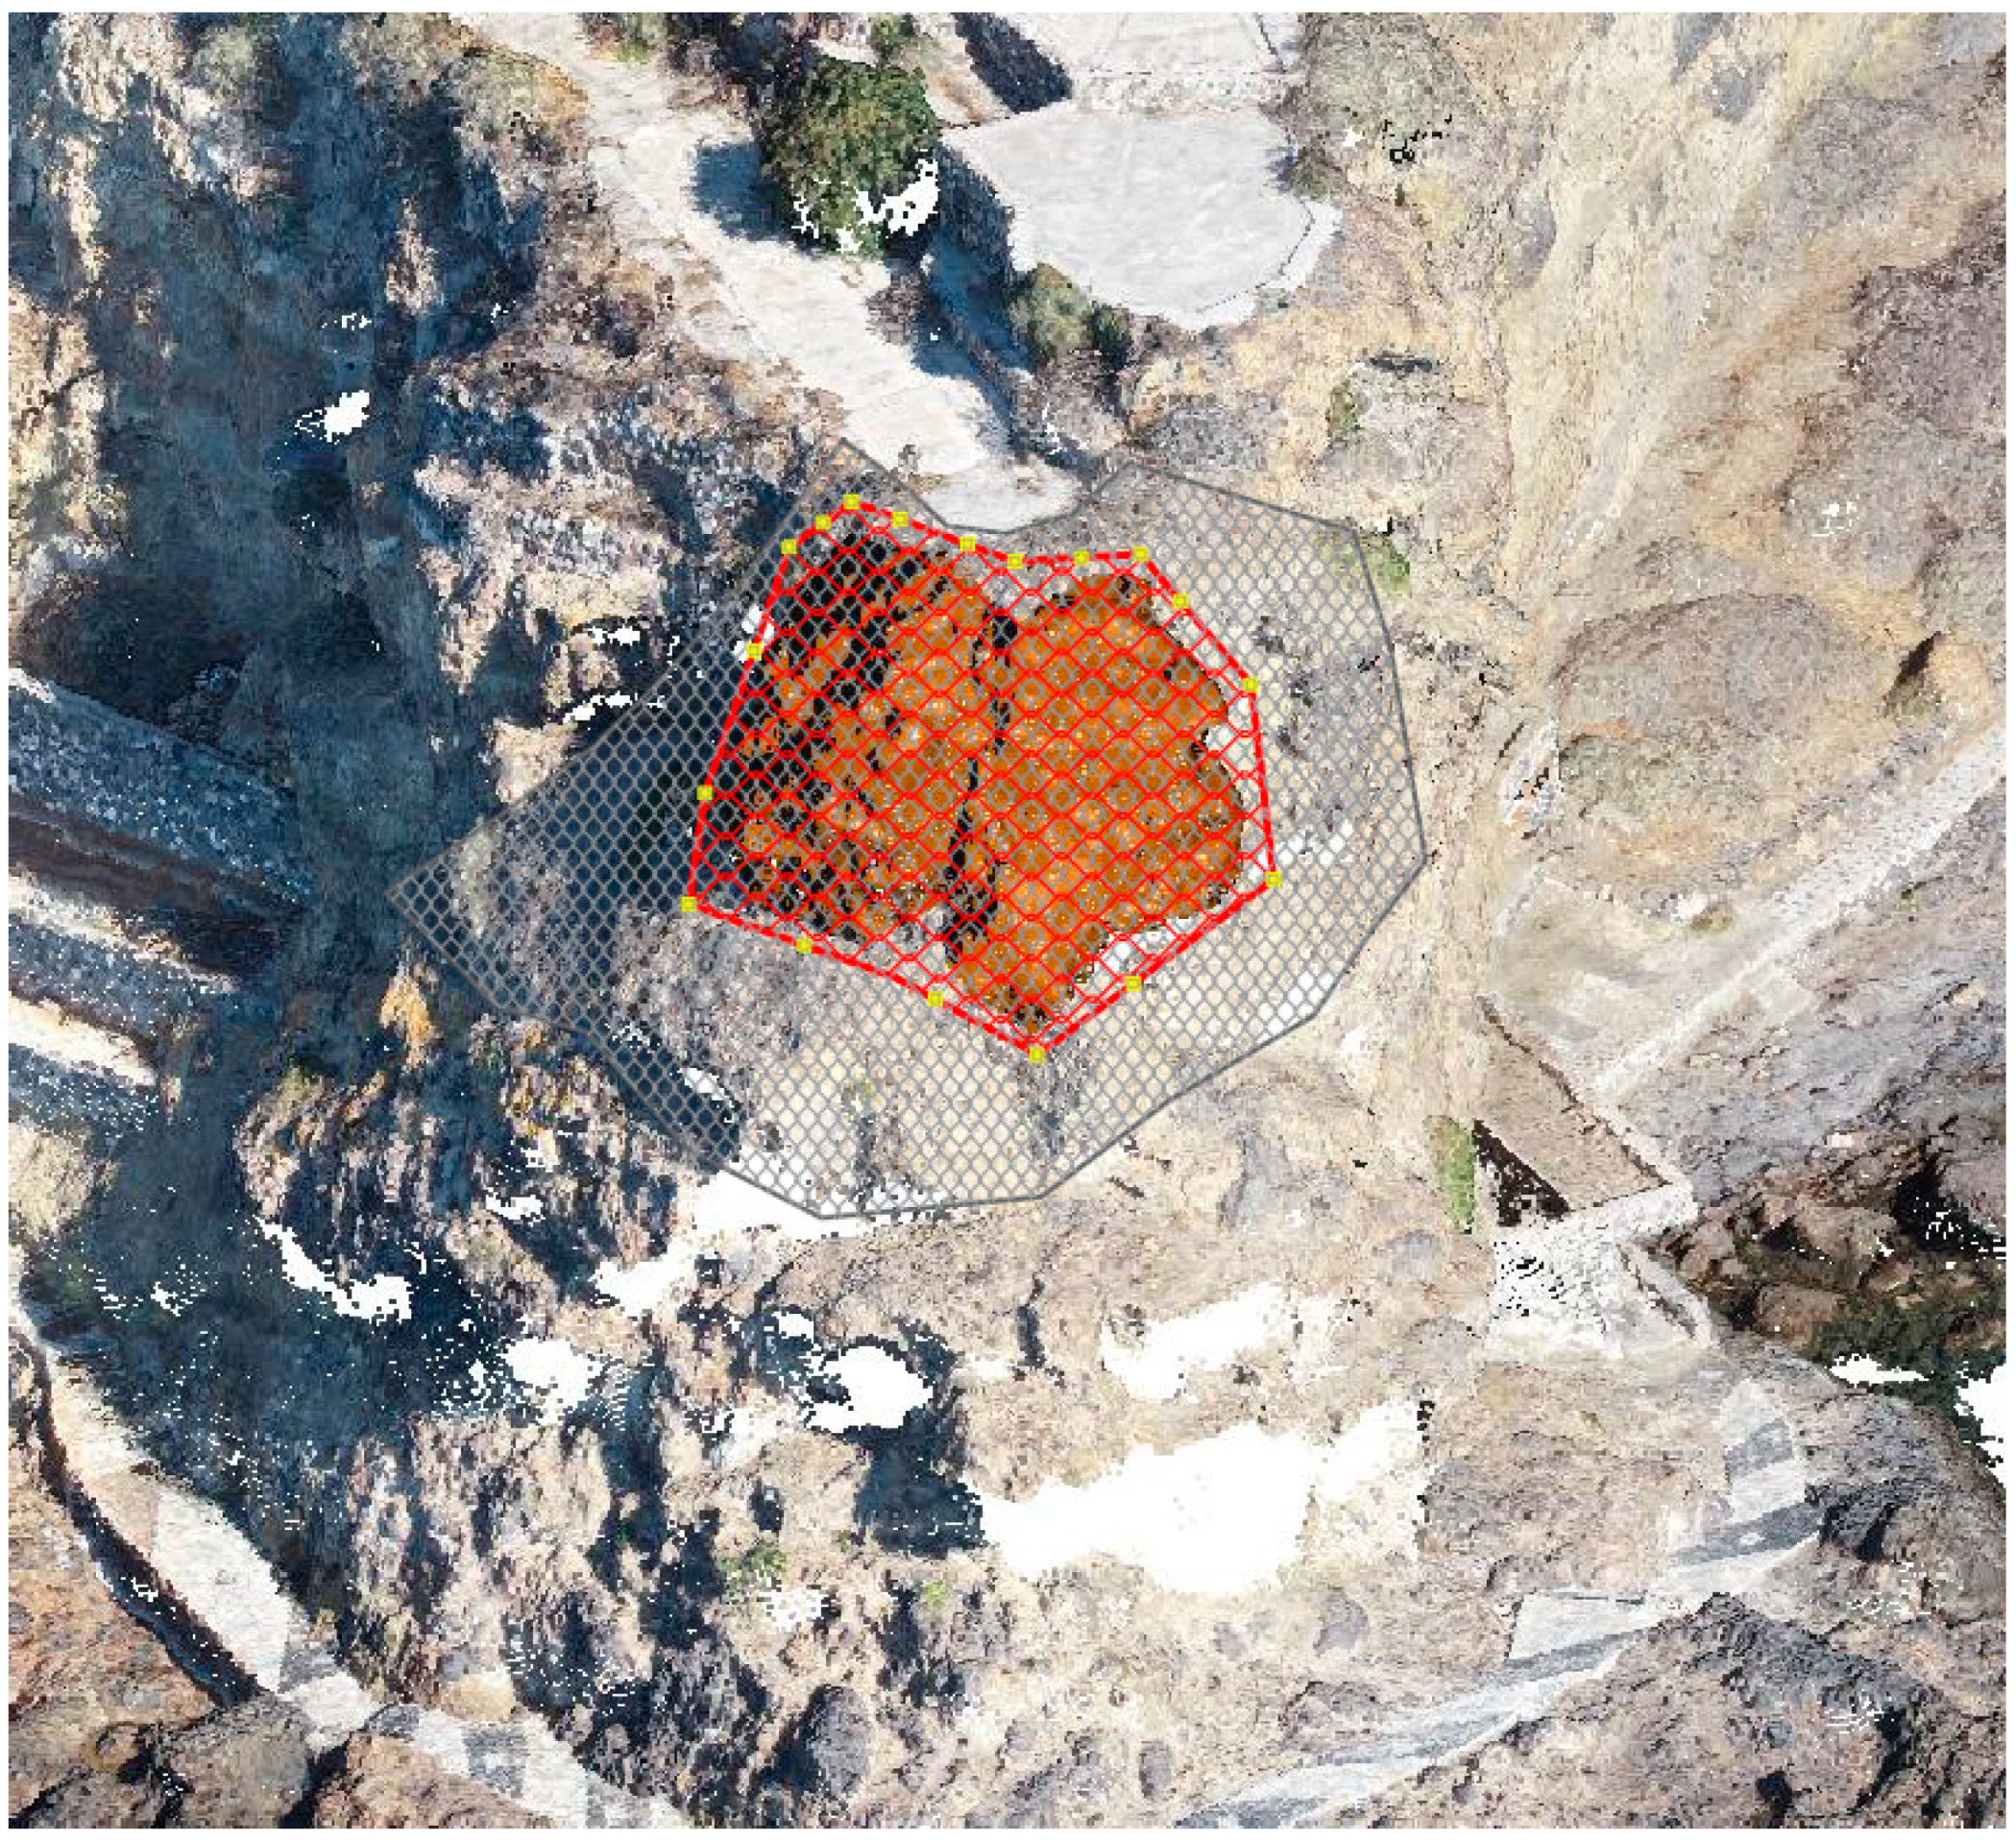
2.2.2. Support to Mitigation Design

Of particular importance to the design of mitigation measures is the identification and characterisation of critical areas such as overhanging blocks. The geometric characterisation of those blocks in relation to the rock mass’ and discontinuities’ physical and engineering properties (i.e., strength, deformability) is essential input to the simulation models. For this purpose, LiDAR point clouds were leveraged in support of the conventional field survey by highlighting those areas as presented in Section 2.1.2.
The detailed geomorphologic digital representation of the terrain also allowed for the generation of surface geometry inputs in the numerical simulations in the form of 3D surface models and cross-sections. Those models facilitate the base ground to the design of the proposed mitigation measures.
An indicative example of the recognition of risks and determination of rock volumes on the slopes, which would not be possible without remote sensing techniques, is presented in Figure 10.
Apart from the geometric characteristics (delineation, identification of the shape, volume and geometry) of the areas that were finally supported, the estimation of the dimensions of the required support elements also relied significantly upon the results of the LiDAR point clouds. This subject is further discussed in Section 3.3.

3. Results

3.1. Topographic Survey—Construction of Cross-Sections

In the context of the present research, for each of the six areas of interest that were distinguished on the slopes, a number of topographic cross-sections were constructed. The construction of topographic cross-sections is particularly useful in the engineering geological modelisation of the slopes, as well as in the analysis, selection and design of slope stabilisation proposals, and their construction was a particularly critical process, during which the capabilities provided to the research team by modern digital technologies for the collection and utilisation of three-dimensional field data using UAVs and LiDaR were fully exploited.
If the cross-sections were constructed using the classical procedure that uses as a basis the two-dimensional mapping of curves of a topographic map, there would be “blind” spots on the slopes due to their vertical and often negative slopes (Figure 11), resulting in unrealistic imprinting.
On the contrary, the design of the cross-section with the application of modern digital technologies, i.e., from a 3D point cloud, as this emerged from the combination of LiDAR ground scans and aerial photogrammetry from UAVs, leads to the absolutely accurate mapping of the slope.

3.2. Engineering Geological Assessment

The materials of the hill of Oxos, which comprise volcanic rocks (pillow lavas and pyroclastic rocks, mainly) were evaluated with respect to their engineering geological conditions, and this process led to the identification of three main engineering geological units (EGUs).
EGU1. Intensely weathered rock mass of pyroclastic materials, consisting of friable fine-grained blocks. The interlocking is loose, with poor cohesion. This unit is located at the surface zone of the pyroclastic geomaterials down to ~2 m depth. It is also located at other places on the slopes where there is a significant water presence.
EGU2. Well-cemented rock mass of pyroclastic materials, consisting mainly of low to moderately coarse-grained blocks. Interlayers with fine-grained phases can also be found. Within the pyroclastic rock masses, compact pillow lavas are also located in places. The presence of cavities is possible, due to the effect of water on the weathering and erosion of the rock mass. Located on the greater part of the slopes.
EGU3. A rock mass of pillow lavas consisting of compact blocks separated by cooling cracks. This unit is of limited extent on the slopes and is located mainly at their base, in the northwestern and western part of the slopes.
Materials that are not associated with rock block instabilities on the slopes but are found in the area include coastal deposits (CDs) consisting mainly of loose cobbles of pyroclastic materials, which exhibit a limited thickness and surface extent, and scree (SC) of variable lithological composition (mixed-phase angular pyroclastic rock mass blocks mixed with fine-grained geomaterials), which are located mainly at the base of the southern slopes and are of limited thickness (Figure 12).
An engineering geological mapping of the Oxos hill was carried out. The mapping of the EGUs on the topographic base and the orthophoto map that were compiled in the framework of the research program are presented in the following figure (Figure 12).
EGUs that do not concern weathered geomaterials and are found on the slopes of Oxos, i.e., EGU2 and EGU3, were reclassified with the Geological Strength Index (GSI) rock mass classification system [20]. Both units were classified, in accordance with the provisions of the GSI, as blocky rock masses with good and locally fair discontinuities status. Thus, the value of the Geological Strength Index ranges from 60 to 70 and locally 55–70 for EGU3, while for EGU2 the GSI values are limited between 52 and 67.
For the design of the necessary support measures, the EGUs had to be quantified in terms of engineering geological/geotechnical parameters. Toward this goal, bibliographic references regarding similar materials to the pyroclastic rocks of the area were consulted. Additionally, during remediation works that had been carried out in November 1987 and February 1988, laboratory tests were carried out on drilling cores, and these were also taken into account. Finally, in the context of the field works of the present research, large-volume samples were taken for the performance of laboratory tests. These samples concerned the geomaterial of EGU2, i.e., the engineering geological unit that mainly structures the slopes of Oxos. By evaluating all the above available data, the research team concluded the following parameter ranges for the engineering geological units (Table 1).
For each of the six areas of interest that were distinguished on the slopes, an engineering geological mapping of the slope views as well as engineering geological cross-sections were compiled (see Figure 13, Figure 14 and Figure 15). The construction of both the views and the cross-sections was particularly useful in the analysis, selection and design of slope stabilisation proposals. Regarding the cross-sections, it is noted that their construction was a particularly critical process, during which the capabilities provided to the research team by modern digital technologies for the collection and utilisation of three-dimensional field data using UAVs and LiDAR were fully exploited.
Due to the massive nature of the rock mass of pyroclastic rocks and pillow lavas, the rocky slopes do not exhibit a systematic geometry of tectonic elements such as discontinuities. However, long joints of selective orientation, as well as contact surfaces of formations (pseudolayers), were observed and measured by utilizing the very high spatial resolution and accuracy three-dimensional digital models from the LiDAR scanner point cloud. The overall blockiness of the engineering geological units, their intact rock strength and the existence of these joints of selective orientation denote that failure initiation is controlled by structural elements.
The tensile cracks and main tectonic structures were graphically presented in Schmidt stereo diagrams. It is noted that the geological–engineering geological views, cross-sections and images indicatively present the tensile cracks and main tectonic structures, whose colouration corresponds to that of their projection in the Schmidt stereo diagram (Figure 15).

3.3. Mitigation Measures

The mitigation measures were chosen and dimensioned based on the framework of restrictions presented in Section 1.2. These measures are mainly active in nature and aim to prevent the occurrence of failures by containing the unstable rock blocks on the slope. This is necessary due to the existence of the Holy Monastery on the top of the hill, the protection of which is a key purpose. The measures generally consisted of the following solutions to the stated problems, individually or in combinations around the slopes:
  • Avoidance of the further evolution of rock falls (rock blocks of small to moderate size) on the upper parts of the slopes, close to the foundation level of the monastery (1 of 2):
Stabilisation of the upper slope part with galvanised wire mesh, reinforced with wire ropes and kept in situ with Ø25 mm and Ø28 mm permanent rock bolts at various grids and lengths. This active measure was applied on the slope surfaces with numerous unstable rock blocks of small to moderate size. The role of remote sensing and mapping of the rock mass structure, distribution of discontinuities and representative magnitude of the unstable blocks was crucial for the estimation of the length and grid/pattern of rock bolts.
2.
Avoidance of the further evolution of rock falls (rock blocks of large size) on the upper parts of the slopes, close to the foundation level of the monastery (2 of 2):
Stabilisation of local, large scale unstable rock blocks on the upper part of slopes with enhanced galvanised wire rope mesh, bolted around each unstable block with Ø28 mm permanent rock bolts of various patterns and lengths. The basic input parameters for the dimensioning of the wire ropes and the rock bolts (shape, volume and geometry of the unstable rock block per case) resulted from the evaluation of data received from the structural mapping of the rock mass through remote sensing.
3.
Protection of the foundation level of the monastery against sliding and erosion:
Local application of shotcrete on the upper part of the slopes, only where the material was soil or soil-like. Shotcrete was foreseen to be painted similar to the colour of the in situ materials. The role of slope mapping through remote sensing was important in setting the boundaries between soil or soil-like materials and materials with a rocky structure, especially since the application of shotcrete should be minimised for aesthetic reasons.
4.
Erosion protection at the toes of the slopes:
Application of a transparent anti-corrosion coating consisting of acrylic polymer in a water suspension on the lower part of the slopes, where small lava blocks were often detached due to erosion of the surrounding material.
5.
Small-scale rock fall control:
Local application of free protective galvanised wire mesh (not bolted) on the lower part of the slopes and away from the foundation of the monastery towards the slope base.
6.
Further protection of the public walking around the hill:
Passive measures such as the rerouting of paths away from the slope (where possible) and the extension of an existing shelter structure.
An indicative presentation of the proposed stabilisation measures, for which data from remote sensing was critical, is shown in the following figures (Figure 16 and Figure 17). The project is in the tender stage for construction.

3.4. Remote Sensing Monitoring

To ensure the long-term effectiveness of the implemented geohazard mitigation measures at the Castle-Monastery of Panagia Spiliani, a comprehensive post-intervention monitoring plan is proposed. This plan incorporates advanced remote sensing techniques and low-cost monitoring systems to continuously assess the stability and structural integrity of the site. Recent advancements in cost-effective, image-based 3D geomorphic monitoring systems, such as those described by [21,22], offer valuable methodologies for this purpose.
Implementing such a system involves deploying fixed camera units around the site to capture images at regular intervals, which are then processed to create 3D models for change detection analysis. Additionally, smart monitoring approaches, including real-time data transmission and automated alerts are integrated to enable prompt responses to any detected hazards. This continuous monitoring not only ensures the effectiveness of the mitigation measures over time but also enhances our ability to anticipate and address emerging geohazards, thereby safeguarding the historic site and its surroundings.
The continuous monitoring provided by such a system offers several critical benefits. The early detection of structural changes is made possible by capturing high-resolution images and constructing 3D models, allowing for even minute changes in the structure to be identified early. This early detection is crucial for preventing small issues from becoming significant hazards, thereby ensuring the site’s integrity. The integration of smart monitoring systems with real-time data transmission allows for the immediate analysis of data. Automated alerts are triggered when specific thresholds of movement or deformation are exceeded, allowing for rapid intervention and mitigation measures. Continuous data collection and analysis over extended periods provide invaluable insights into the dynamics of geohazards. Understanding how and why changes occur at the site can improve predictive models and enhance future mitigation strategies.
Utilizing low-cost monitoring systems ensures that the monitoring plan is economically feasible and scalable. This approach allows for extensive coverage of the site without the prohibitive costs associated with traditional high-end monitoring systems. With detailed, ongoing assessments of the site’s condition, risk management becomes more effective. Decision-makers can rely on accurate and up-to-date information to make informed choices regarding maintenance, conservation, and public safety measures. By maintaining a proactive stance on monitoring and mitigation, the long-term preservation of the Castle-Monastery of Panagia Spiliani will be achieved. Protecting such historical sites ensures that they remain intact for future generations to study and enjoy.

4. Discussion

Slope stabilisation in cultural heritage sites poses a significant global challenge in the geotechnical domain. Many monuments suffer from stability issues in both their foundations and structural integrity due to various factors, particularly in regions with unique geological and climatic conditions. The Castle-Monastery of Panagia Spiliani on Nisyros island exemplifies these challenges, experiencing frequent rockfalls and landslides. Traditional geotechnical approaches, which rely heavily on direct observations, sampling boreholes and physical mapping, were considered insufficient for this project due to the complex and hazardous terrain. The site’s near vertical to negative slope angles, coupled with the inaccessibility of the steep slopes and the presence of non-systematic discontinuities, necessitated the adoption of advanced remote sensing techniques. The inability to safely access critical areas underscored the need for non-intrusive methods.
In this context, remote sensing technologies, specifically, Terrestrial Laser Scanning and Unmanned Aerial Vehicle photogrammetry, became indispensable. These technologies enabled a comprehensive 3D mapping and detailed visualisation of the slopes, overcoming the limitations posed by traditional methods. The application of TLS and UAV photogrammetry in this study is noteworthy for several reasons, leading to the development of effective mitigation designs. Detailed 3D models generated from the remote sensing data were pivotal in identifying areas of increased geohazard risk. By analysing the topography and geological structures captured in the point clouds, specific locations prone to rockfalls and landslides could be pinpointed. This level of detail was unattainable with conventional methods and highlighted the significant advantages of using advanced remote sensing technologies in complex terrains.
Additionally, remote sensing data support continuous monitoring and maintenance planning. By establishing a baseline model, any future changes in the slope’s stability can be detected early, allowing for proactive management and maintenance. This continuous monitoring capability is essential for the long-term preservation of the site, ensuring that emerging risks are promptly addressed before they escalate into significant hazards.

5. Conclusions

The implementation of remote sensing technologies has enabled the development of targeted mitigation strategies for the Panagia Spiliani Monastery. Leveraging high-resolution data, stabilisation measures that effectively address potential rockfalls and landslides, while preserving the site’s cultural and historical integrity, were meticulously designed. Specific interventions, such as rock bolting, netting, and extending existing shelter structures, were precisely positioned based on geospatial data. Importantly, these measures were intentionally non-intrusive to maintain the monastery’s aesthetic and historical value.
A significant advantage of the applied methodology lies in the ability to provide actionable data directly for mitigation designs. The precision and comprehensiveness of remote sensing data allow one to precisely target critical areas identified through advanced analysis. This approach enhanced the overall efficiency and effectiveness of the mitigation efforts, from the initial assessment to practical intervention.
The Holy Monastery of Panagia Spiliani serves as an example of the successful application of remote sensing technologies to enhance geohazard assessment and mitigation. This approach provided an in-depth understanding of the site’s geotechnical complexities, enabling the precise design and implementation of targeted, non-invasive mitigation measures. The successful application of these technologies serves as a model for future endeavours in preserving cultural heritage sites located in challenging environments, underscoring their immense potential in geotechnical engineering and cultural heritage preservation.

Author Contributions

Conceptualization, F.I. and M.V.; methodology, F.I., C.T. and M.V.; software, F.I., C.T., M.V. and P.G.; validation, P.D.; formal analysis, I.F, C.T., P.D. and P.G.; investigation, F.I., M.V., P.D., S.G., P.G. and K.E.; resources, M.V.; data curation, F.I., C.T., P.D. and K.E.; writing—original draft preparation, F.I., C.T., P.D., S.G. and P.G.; writing—review and editing, M.V. and S.G.; visualization, F.I., C.T. and D.P; supervision, S.G.; project administration, M.V. and S.G. All authors have read and agreed to the published version of the manuscript.

Funding

This research was funded by the Municipality of Nisyros.

Data Availability Statement

Data is unavailable due to privacy.

Acknowledgments

The authors would like to extend their heartfelt gratitude to the Municipality of Nisyros for their generous financial support, which made this research project possible. Their commitment to preserving the cultural and historical heritage of the Holy Monastery of Panagia Spiliani has been instrumental in facilitating the comprehensive geotechnical and engineering geological investigations undertaken in this study. The collaboration between the Municipality of Nisyros and the National Technical University of Athens exemplifies the essential role that local government can play in supporting scientific endeavours aimed at safeguarding historical sites.

Conflicts of Interest

The authors declare no conflicts of interest.

References

  1. Marinos, V.; Prountzopoulos, G.; Asteriou, P.; Papathanassiou, G.; Kaklis, T.; Pantazis, G.; Lambrou, E.; Grendas, N.; Karantanellis, E.; Pavlides, S. Beyond the Boundaries of Feasible Engineering Geological Solutions: Stability Considerations of the Spectacular Red Beach Cliffs on Santorini Island, Greece. Environ. Earth Sci. 2017, 76, 513. [Google Scholar] [CrossRef]
  2. Farmakis, I.; Marinos, V.; Papathanassiou, G.; Karantanellis, E. Automated 3D Jointed Rock Mass Structural Analysis and Characterization Using LiDAR Terrestrial Laser Scanner for Rockfall Susceptibility Assessment: Perissa Area Case (Santorini). Geotech. Geol. Eng. 2020, 38, 3007–3024. [Google Scholar] [CrossRef]
  3. Margottini, C.; Fidolini, F.; Iadanza, C.; Trigila, A.; Ubelmann, Y. The conservation of the Shahr-e-Zohak archaeological site (central Afghanistan): Geomorphological processes and ecosystem-based mitigation. Geomorphology 2015, 239, 73–90. [Google Scholar] [CrossRef]
  4. Kincey, M.; Gerrard, C.; Warburton, J. Quantifying erosion of ‘at risk’ archaeological sites using repeat terrestrial laser scanning. J. Archaeol. Sci. Rep. 2017, 12, 405–424. [Google Scholar] [CrossRef]
  5. Nicu, I.C.; Rubensdotter, L.; Stalsberg, K.; Nau, E. Coastal Erosion of Arctic Cultural Heritage in Danger: A Case Study from Svalbard, Norway. Water 2021, 13, 784. [Google Scholar] [CrossRef]
  6. Wichmann, V.; Strauhal, T.; Fey, C.; Perzlmaier, S. Derivation of Space-Resolved Normal Joint Spacing and in Situ Block Size Distribution Data from Terrestrial LIDAR Point Clouds in a Rugged Alpine Relief (Kühtai, Austria). Bull. Eng. Geol. Environ. 2019, 78, 4465–4478. [Google Scholar] [CrossRef]
  7. Harrap, R.M.; Hutchinson, D.J.; Sala, Z.; Ondercin, M.; Difrancesco, P.M. Our GIS Is a Game Engine: Bringing Unity to Spatial Simulation of Rockfalls. GeoComputation 2019, 2019, 11–14. [Google Scholar]
  8. Sala, Z.; Jean Hutchinson, D.; Harrap, R. Simulation of Fragmental Rockfalls Detected Using Terrestrial Laser Scans from Rock Slopes in South-Central British Columbia, Canada. Nat. Hazards Earth Syst. Sci. 2019, 19, 2385–2404. [Google Scholar] [CrossRef]
  9. Abellán, A.; Jaboyedoff, M.; Oppikofer, T.; Vilaplana, J.M. Detection of Millimetric Deformation Using a Terrestrial Laser Scanner: Experiment and Application to a Rockfall Event. Nat. Hazards Earth Syst. Sci. 2009, 9, 365–372. [Google Scholar] [CrossRef]
  10. Farmakis, I.; Hutchinson, D.J.; Vlachopoulos, N.; Westoby, M.; Lim, M. Slope-Scale Rockfall Susceptibility Modeling as a 3D Computer Vision Problem. Remote Sens. 2023, 15, 2712. [Google Scholar] [CrossRef]
  11. Farmakis, I.; DiFrancesco, P.-M.; Hutchinson, D.J.; Vlachopoulos, N. Rockfall Detection Using LiDAR and Deep Learning. Eng. Geol. 2022, 309, 106836. [Google Scholar] [CrossRef]
  12. Williams, J.G.; Rosser, N.J.; Hardy, R.J.; Brain, M.J. The Importance of Monitoring Interval for Rockfall Magnitude-Frequency Estimation. J. Geophys. Res. Earth Surf. 2019, 124, 2841–2853. [Google Scholar] [CrossRef]
  13. Kromer, R.A.; Hutchinson, D.J.; Lato, M.J.; Gauthier, D.; Edwards, T. Identifying Rock Slope Failure Precursors Using LiDAR for Transportation Corridor Hazard Management. Eng. Geol. 2015, 195, 93–103. [Google Scholar] [CrossRef]
  14. Bonneau, D.A.; Hutchinson, D.J.; Mcdougall, S. Characterizing Debris Transfer Patterns in the White Canyon, British Columbia with Terrestrial Laser Scanning. In Proceedings of the 7th International Conference on Debris-Flow Hazards Mitigation, Golden, CO, USA, 10–13 June 2019. [Google Scholar]
  15. DiFrancesco, P.M.; Bonneau, D.; Hutchinson, D.J. The Implications of M3C2 Projection Diameter on 3D Semi-Automated Rockfall Extraction from Sequential Terrestrial Laser Scanning Point Clouds. Remote Sens. 2020, 12, 1885. [Google Scholar] [CrossRef]
  16. Westoby, M.J.; Brasington, J.; Glasser, N.F.; Hambrey, M.J.; Reynolds, J.M. “Structure-from-Motion” Photogrammetry: A Low-Cost, Effective Tool for Geoscience Applications. Geomorphology 2012, 179, 300–314. [Google Scholar] [CrossRef]
  17. Abellán, A.; Oppikofer, T.; Jaboyedoff, M.; Rosser, N.J.; Lim, M.; Lato, M.J. Terrestrial Laser Scanning of Rock Slope Instabilities. Earth Surf. Process. Landf. 2014, 39, 80–97. [Google Scholar] [CrossRef]
  18. Farmakis, I.; Karantanellis, E.; Hutchinson, D.J.; Vlachopoulos, N.; Marinos, V. Superpixel and Supervoxel Segmentation Assessment of Landslides Using UAV-Derived Models. Remote Sens. 2022, 14, 5668. [Google Scholar] [CrossRef]
  19. Besl, P.J.; McKay, N.D. A Method for Registration of 3-D Shapes. IEEE Trans. Pattern Anal. Mach. Intell. 1992, 14, 239–256. [Google Scholar] [CrossRef]
  20. Marinos, P.; Hoek, E. GSI: A geologically friendly tool for rock mass strength estimation. Paper Presented at the ISRM International Symposium, Melbourne, Australia, 19 November 2000. [Google Scholar]
  21. Blanch, X.; Guinau, M.; Eltner, A.; Abellan, A. A cost-effective image-based system for 3D geomorphic monitoring: An application to rockfalls. Geomorphology 2024, 449, 109065. [Google Scholar] [CrossRef]
  22. Fang, K.; Zhu, H.; Zhang, X.; Zhang, W.; Zhou, J. Smart monitoring of rock slopes: Combining laser scanning, photogrammetry and IoT. Int. J. Rock Mech. Min. Sci. 2024, 147, 105655. [Google Scholar] [CrossRef]
Figure 1. View of the castle-monastery from NW. On the left of the volcanic cliff lies the capital of Nisyros, Mandraki, and on the right, Chochlaki beach. The unstable slopes threaten the integrity of the monastery on top of the cliff and accessibility to the main beach of the village via the path that runs along the bottom perimeter.
Remotesensing 16 02768 g001
Figure 2. Cracks on the structures of the monastery and slopes. View of the north side.
Remotesensing 16 02768 g002
Figure 3. Cracks on the structures of the monastery and slopes. View of the south side.
Remotesensing 16 02768 g003
Figure 4. Walking path around the hill and shelter with fallen blocks of variable sizes.
Remotesensing 16 02768 g004
Figure 5. Ground control point (GCP) and LiDAR scanner point (SP) spatial distribution along Oxos hill (orthomosaic map in background).
Remotesensing 16 02768 g005
Figure 6. Topographic map of the study area divided into six distinct geomorphological areas.
Remotesensing 16 02768 g006
Figure 7. Slope relief model of area 5 (left) and drone view (right). The codes on the slope are areas of increased risk that were identified. Automated delineation of critical overhanging blocks based on 3D point cloud processing.
Remotesensing 16 02768 g007
Figure 8. The complete georeferenced 3D point cloud resulting from the combination of the 6 terrestrial LiDAR scans around the Oxos hill.
Remotesensing 16 02768 g008
Figure 9. An indicative LiDAR point cloud from the south Oxos sub-slope showing the detailed digital representation of the geologic structure.
Remotesensing 16 02768 g009
Figure 10. Recognition and evaluation of unstable blocks on the slopes. The geometry and the volume of blocks prone to detachment is the basic input to a solution for stabilisation in situ (when scaling is not an option).
Remotesensing 16 02768 g010
Figure 11. Indicative cross-section AR05_F. Explanation of the advantage of using three-dimensional surveys for the construction of cross-sections compared to the “conventional” method of drawing based on two-dimensional topographic mapping (elevation map).
Remotesensing 16 02768 g011
Figure 12. Engineering geological map. Yellow: EGU1, light brown: EGU2, brown: EGU3, orange: SC, beige: CD, blue: gunite and magenta: castle old wall.
Remotesensing 16 02768 g012
Figure 13. Engineering geological cross-section at area 5. Note the codes of the identified areas of increased risk. Light brown colour: engineering geological unit 2 (EGU2), brown colour: engineering geological unit 3 (EGU3). Question marks suggest indicative voids.
Remotesensing 16 02768 g013
Figure 14. Engineering geological mapping of the view of area 6. View from below (left) and above (right). Green: EGU1, light brown: EGU2, brown: EGU3, orange: SC.
Remotesensing 16 02768 g014
Figure 15. Engineering geological mapping of the view of area 5. The GSI classification ranges of the EGUs is also shown in the inset image (middle top). The corresponding Schmidt stereo diagram is shown in the inset figure to the left. The corresponding colour of each family of discontinuities is common on the photo and on the diagram.
Remotesensing 16 02768 g015
Figure 16. Area 4. Presentation of stabilisation measures (stabilisation of specific rock blocks with wire rope mesh) for two specific unstable blocks with a total volume of 120 m3. The mesh of wire rope is marked with a red colour, whereas the perimeter rock bolts are marked in yellow around the mesh.
Remotesensing 16 02768 g016
Figure 17. Area 5. Typical section of proposed mitigation measures. Question marks suggest indicative voids.
Remotesensing 16 02768 g017
Table 1. Table of proposed parameters per engineering geological unit.
Engineering Geological UnitUnit Weight (kN/m3)Hoek–Brown ParametersMohr–Coulomb Parameters
σci
(MPa)
GSIEi
(GPa)
miφ
(°)
c
(kPa)
EGU115–17----22–2440–60
EGU218–199–1152–671.7–1.812–18--
EGU319–2010–1255–701.8–2.015–20--
Disclaimer/Publisher’s Note: The statements, opinions and data contained in all publications are solely those of the individual author(s) and contributor(s) and not of MDPI and/or the editor(s). MDPI and/or the editor(s) disclaim responsibility for any injury to people or property resulting from any ideas, methods, instructions or products referred to in the content.

